Embed Size (px)
Citation preview

HAL Id: hal-01475923https://hal-unilim.archives-ouvertes.fr/hal-01475923v2
Preprint submitted on 27 Sep 2018
HAL is a multi-disciplinary open accessarchive for the deposit and dissemination of sci-entific research documents, whether they are pub-lished or not. The documents may come fromteaching and research institutions in France orabroad, or from public or private research centers.
L’archive ouverte pluridisciplinaire HAL, estdestinée au dépôt et à la diffusion de documentsscientifiques de niveau recherche, publiés ou non,émanant des établissements d’enseignement et derecherche français ou étrangers, des laboratoirespublics ou privés.
Institutional Environment and Bank Capital RatiosTammuz Alraheb Ab, Christina Nicolas, Amine Tarazi
To cite this version:Tammuz Alraheb Ab, Christina Nicolas, Amine Tarazi. Institutional Environment and Bank CapitalRatios. 2018. �hal-01475923v2�

1
Institutional Environment and Bank Capital Ratios
Tammuz H. ALRAHEBab, Christina NICOLAS ac, Amine TARAZIad
a Université de Limoges, LAPE, 5 rue Félix Eboué, 87031 Limoges Cedex, France.
This draft: 20 September 2018
Please do not quote without the permission of the authors.
Abstract
We investigate the influence of the institutional environment on bank capital ratios.
Using a sample of 149 banks operating in the Middle East and North Africa region for the
period 2004 to 2014, we find that, when stock markets have little presence, institutional
variables significantly affect risk-weighted regulatory capital ratios but not leverage
ratios. Conversely, when stock markets are more developed, only leverage ratios are
influenced by institutional factors. Our results also indicate that institutional variables
affect non-weighted equity-to-asset ratios of banks that are listed on a stock exchange.
Our findings contribute to the bank capital structure literature and have important policy
implications for developing countries.
JEL classification: G21, G28, G32
Keywords: Bank Capital Structure, Institutions, Bank Regulation
b Email: [email protected] (T. H. Alraheb). c Corresponding author. Email: [email protected] , Phone: +33686179618, (C. Nicolas) d Email: [email protected] (A. Tarazi)

2
Institutional Environment and Bank Capital Ratios
Abstract
We investigate the influence of the institutional environment on bank capital ratios.
Using a sample of 149 banks operating in the Middle East and North Africa region for the
period 2004 to 2014, we find that, when stock markets have little presence, institutional
variables significantly affect risk-weighted regulatory capital ratios but not leverage
ratios. Conversely, when stock markets are more developed, only leverage ratios are
influenced by institutional factors. Our results also indicate that institutional variables
affect non-weighted equity-to-asset ratios of banks listed on a stock exchange. Our
findings contribute to the bank capital structure literature and have important policy
implications for developing countries.
JEL classification: G21, G28, G32
Keywords: Bank Capital, Institutions, Bank Regulation

3
1. Introduction
Research on bank capital structure has mostly focused on bank specific factors
and market related fundamentals (Diamond & Rajan 2000; Berger et al. 2008; Gropp &
Heider 2010; Harding et al. 2013). Another strand of the literature pioneered by
Demirgüç-Kunt & Maksimovic (1999) has stressed the importance of considering the
legal and institutional framework affecting firms' capital structure decisions. In their
paper, Demirgüç-Kunt & Maksimovic (1999) posit that a significant part of long term
debt variation can be explained by countries' institutional foundations. Nevertheless, the
existing literature on the role played by institutions in explaining capital structure
variation mainly includes studies of non-financial firms rather than financial ones (Booth
et al. 2001; de Jong et al. 2008; Cho et al. 2014; Belkhir et al. 2016). In this paper, we
build on these two strands of the literature to investigate whether institutional factors
affect capital ratios of banking firms. We address the issue of whether the institutional
environment plays a different role in enhancing either regulatory discipline or market
discipline depending on the extent of the presence of stock markets. Regulatory and
market discipline might not operate simultaneously as shown by Distinguin et al. (2013).
We hence consider both regulatory capital ratios (imposed by regulators) and simple non-
risk weighted leverage ratios (internally set by the bank management)1. Our research is
particularly relevant for developing countries and we focus on a world region whose
underdeveloped institutions can be considered as a major obstacle to its economic and
financial development: The Middle East and North Africa (MENA) region2. It is also a
region where stock markets are either strongly present or almost inexistent. To our
knowledge, our paper is the first attempt to specifically focus on the influence of
1 Over our sample period (pre-Basel III) leverage ratios were not part of the regulatory framework.
2 The MENA region refers to the Middle East and North Africa region and consists of the following 21
countries: Algeria, Bahrain, Djibouti, Egypt, Iraq, Iran, Israel, Jordan, Kuwait, Lebanon, Libya, Malta,
Morocco, Oman, Palestine, Qatar, Saudi Arabia, Syria, Tunisia, United Arab Emirates (UAE) and Yemen.

4
institutional foundations on bank capital ratios, both regulatory and internally set by the
bank management.
The MENA region is a fast-growing area which remains understudied when it
comes to capital ratios of its financial institutions. This region suffers from ongoing
political instability and lags behind the rest of the world in many dimensions.
Particularly, institutions in the MENA region exhibit many deficiencies: widespread
corruption, weak governance, limited creditors’ rights, and a skeletal rule of law (World
Bank 2014). The financial system is highly bank-based in most countries with banks
assets reaching on average 130% of GDP (Saadaoui 2015). The region is characterized by
underdeveloped financial markets (if existing) in most countries. In fact, high disparity in
stock market development exists between countries of this region (for example, market
development to GDP ratio was as high as 102% in Qatar versus only 10% in Egypt in end
of 2016). The banking sector is highly concentrated in most countries of the region (with
the three largest banks holding more than 65% of total banking assets on average) and
barriers to entry are still high (Turk-Ariss 2009; Anzoategui et al. 2010). Thus, the
MENA banking sector is far from being adequately developed, with the exception of
Lebanon, Jordan, and the GCC3 countries (Creane et al. 2004). At the same time, most
MENA banks showed resiliency during the global financial crisis of 2007-2008. In fact,
this region was less affected by the financial turmoil compared to other parts of the
world. Some researchers attributed this partial resiliency to a number of factors including
the presence of a stable funding basis, prudent lending, and sound bank capitalization.
Banks in the MENA region hold total regulatory capital ratios and tier 1 capital ratios
significantly above international standards and Basel requirements4. This should, in
principle, make them safer and more resilient to economic shocks. However, this might
3 Gulf Cooperation Council - Bahrain, Kuwait, Oman, Qatar, Saudi Arabia, and United Arab Emirates. 4MENA Total capital adequacy ratio and Tier 1 capital ratio fluctuated on average between 18.5% and
21.7% and, 15% and 18.2%, respectively, during the period 2004 to 2014. (Source: BankScope - Bureau
van Dijk database)

5
also make them too cautious in their intermediation role and their contribution to
economic growth and development.
Throughout the last decade, the MENA region has experienced profound changes.
What is prevalent however, is the fact that it still has underdeveloped institutions. A
fragile rule of law and government ineffectiveness still prevail coupled with a weak and
under-developed civil society. According to a recent World Bank survey (World Bank
(2016)), the most important obstacles to development in the MENA region are the
ongoing political instability and the high levels of corruption. Also, in an earlier World
Bank report (World Bank (2014)), improving the rule of law, fighting corruption,
improving accountability, stimulating government transparency and filling the gap
between regulation and implementation are essential reforms that need to be conducted to
improve the quality of institutions in the region.
The aim of this paper is to investigate the role played by institutional factors in
determining capital ratios set by regulators and banks themselves. Fonseca & González
(2010) analyze the determinants of bank capital buffers while controlling for the role of
institutions across a selection of world countries. They find that on the one hand,
institutions improve market discipline and therefore increase bank capital ratios. On the
other hand, good institutional quality reduces bank market power thus reducing bank
incentives to hold high capital buffers. We extend the work of Fonseca and Gonzales
(2010) by using various measures of formal institutional variables to specifically focus on
whether the institutional environment affects bank capital ratios of banks operating in the
MENA region. We go further by trying to test under what specific conditions institutional
variables are significant determinants of bank capital ratios. We specifically focus on
whether the effect of the institutional environment on bank capital ratios is conditional to
the degree of development of stock markets.
We thus aim to contribute to the literature in the following ways. First, we focus
on capital ratios of banking institutions whose capital decisions might substantially differ
from non-financial firms. Since the literature has already documented the effect of

6
institutional variables on non- financial firm capital holdings, we believe that bank capital
ratios might be affected as well by the institutional framework prevailing in a country.
We thus attempt to fill this gap in the literature by focusing on various aspects of the
banking sector. In other words, we aim to find out in what specific conditions
institutional variables might affect more or less capital ratios of banks. In our opinion,
this is an important research area which might have important bank policy implications
especially that the banking industry, unlike other sectors, is a heavily-regulated industry.
We aim to provide evidence to regulators and policy-makers on whether bank capital
ratios (regulatory and non-regulatory) are affected by formal institutions prevailing in a
country and whether complying with more stringent regulatory requirements is easier to
achieve in countries with a better institutional environment. To our knowledge, no other
study has explicitly focused on the link between institutions and bank capital ratios.
Second, we perform our study on the MENA region, which unlike other Western regions,
remains understudied when it comes to bank capital and solvency ratios. Third, we
consider both weighted regulatory capital ratios and un-weighted leverage ratios to
investigate whether the quality of institutions affects banks' internal capital decisions
regardless of regulation or more specifically to comply with regulatory constraints.
Fourth, we focus on unravelling whether the degree of development of the stock market
in a country affects the relationship between institutional variables and each of the capital
adequacy ratio and the leverage ratio. We expect the effect of the institutional variables
on capital ratios to be conditional to the stock market development since banks in
countries with more developed stock markets might behave differently as they are
exposed to higher market discipline. Capital market development could indeed be
dependent on the institutional environment. Nevertheless, it is very uncommon to
distinguish bank-based and market-based financial systems on these grounds. In market-
based systems, monitoring is expected to be achieved by the market, but this does not
mean that bank-based systems are the result of a poorer institutional environment.
Moreover, we focus in this paper on two different capital ratios: a regulatory one and a
non-regulatory ratio. Market participants are known to monitor non-regulatory ratios
more closely as such ratios are less prone to manipulation. Hence, market discipline

7
might play a different role depending on the degree of stock market development and we
expect the effect to be stronger for non-regulatory ratios.
We consider a sample of 149 banks from 14 MENA region countries covering the
2004–2014 period. Our findings indicate that institutional variables are significant in
explaining risk-based capital adequacy ratios imposed by regulators. However,
institutional variables (except for corruption) affect non-weighted equity-to-asset ratios
(internally set capital) only for countries with developed stock markets. This effect is also
more pronounced for banks listed on a stock exchange. We provide evidence that higher
corruption and political instability levels are associated with lower capital adequacy
ratios. Creditor’ rights, however, negatively influence capital adequacy ratios. As for
economic freedom and financial openness measures, the effect is positive.
The paper unfolds as follows. Section (2) presents an overview of the existing
literature. Description of the sample, the variables used, and the empirical model are
presented in section (3). Section (4) discusses the regression results and presents
robustness tests. Finally, section (5) concludes.

8
2. Related Literature
There is a substantive literature dedicated to the determinants of bank capital
ratios. Brewer et al. (2008) argue that bank capital is significantly dependent on capital
regulations. Moreover, the existence of deposit insurance creates moral hazard incentives
which lead banks to choose high levels of leverage, thus maintaining low capital ratios
while complying with regulation (Keeley 1990). However, this justification of bank
capital levels does not explain the prevalence of bank capital buffers, i.e. higher levels
than those required by regulations. In fact, many researchers emphasize that capital
regulations are not binding and might not be significant determinants of bank capital
levels (Flannery, 1994, and Diamond & Rajan, 2000).
Perhaps one of the most important justifications behind holding high capital ratios
is the fear of shocks which might drive a bank below capital requirements accompanied
by high costs of adjusting back to the minimum threshold, leading to regulatory
interference and eventually loss of reputation (Milne & Whalley, 2001). Moreover,
according to Brewer et al. (2008) and Harding et al. (2013), bank capital ratios seem high
in countries where regulators have prompt sanction powers in dissolving financial
institutions that fall below regulatory minimum. The latter authors also point out the
importance of the franchise value in the choice of the optimal capital structure. From
another perspective, Berger et al (1995) argue that banks’ capital buffers are used to meet
unexpected investment opportunities. Fonseca & Gonzales (2007) analyze the
determinants of bank capital buffers across a selection of world countries. They conclude
that market discipline and market power positively and largely influence the level of
capital buffers held by banks. Consequently, banks accumulate regulatory capital buffers
mainly because of fear of adverse shocks, regulatory intervention, and market discipline.
Recently, a growing body of literature has focused on the role that institutions
might play in determining firm capital structure. However, the findings regarding the
influence of legal and institutional frameworks in explaining firms’ funding choices are
mixed. On the one hand, many studies find that firms operating in a better institutional

9
environment have easier access to external funding associated with more favorable
conditions (La Porta et al. 1997; Demirgüç-Kunt & Maksimovic 1999; Booth et al. 2001;
Giannetti 2003; Djankov et al. 2007; Qian & Strahan 2007; González & González 2008;
Fan et al. 2012). A strong legal framework can help mitigate agency problems by
reducing information asymmetries and when information is more readily available to
investors, firms might start relying more on external rather internal funding. Hence, firms
might hold less capital and more debt in countries with more developed institutions when
considering the investors’ or the supply point of view. On the other hand, supporters of
the demand side view argue that lower debt prevails in markets with higher creditor
rights. Cho et al. (2014) explain this finding using a large sample of 48 countries. They
argue that managers in countries with high creditor protection prefer to limit debt usage
to avoid losing control should financial distress prevail. This view is also supported by
Rajan & Zingales (1995) who argue that whenever manager rights are limited during
bankruptcy and creditor rights are strong, managers tend to prefer equity over debt. Thus,
no consensus has been reached in the literature regarding the effect of institutional quality
on capital funding choices of non-financial firms5. In their paper, Flannery & Oztekin
(2012) go further by studying the role that institutions might play in capital structure
adjustment speeds. They find that firms operating in countries with better institutions
benefit from lower transaction costs which makes them adjust faster to their target capital
structure.
Unlike studies on non-financial firms, we find no existing studies in the literature
that specifically explore the link between institutional variables and bank capital
holdings. Fonseca & González (2010) analyze the determinants of bank capital buffers
while controlling for the role of institutions across a selection of world countries. The
5 For further studies covering corporate capital decisions, see: Deesomsak et al. (2004); Bancel & Mittoo
(2004); Gungoraydinoglu & Öztekin (2011); de Jong et al. (2008); An et al. (2016).

10
authors examine how institutions might alter the effect of market power and market
discipline on capital holdings. For this purpose, they use the simple average of six
institutional indicators as per Kaufman et al. (2001): control of corruption, government
effectiveness, voice and accountability, regulatory quality, political stability, and the rule
of law. They find that on the one hand, institutions improve market discipline and
therefore increase bank capital ratios. On the other hand, good institutional quality
reduces bank market power thus reducing bank incentives to hold high capital buffers.
A recent study by Haq et al. (2017) focused on studying the effect of informal
institutions on bank capital structure. Using a large sample of banks in 79 countries, they
employ the Hofstede cultural framework to show that national culture6 significantly
affects capital structure of banks. More specifically, higher individualism, lower power
distance, long-term orientation and indulgence positively affects bank capital ratios. They
also show that this effect is much lower for large banks. They explain this by the fact that
higher external monitoring and corporate governance in large banks opposes the effect of
national culture.
In the MENA region, studies on bank capital have focused on bank-specific
factors rather on the way in which banks interact with their macroeconomic and
institutional environment. Murinde & Yaseen (2006) investigate the dynamic capital-risk
adjustment structure among MENA banks. They conclude that capital regulations are
significant determinants of capital ratios. However, the authors point out that they do not
affect capital levels, but they increase risk taking behaviors. Bougatef & Mgadmi (2016)
examine the role of prudential regulation on bank risk taking and capital holding in a
selection of MENA banks. They find that regulatory pressure does not significantly affect
neither risk nor capital ratios of MENA banks. The authors link this finding to
6 National culture data is only available for 5 countries of our sample. Hence, data availability is once again
an obstacle to the inclusion of data on informal institutions for the case of the MENA region.

11
weaknesses in the institutions of those countries. This finding contradicts many studies
on developing economies and more specifically the conclusion of Klomp & Haan (2013)
which stipulates that regulatory stringency reduces bank risk taking among banks in
emerging countries.
Belkhir et al. (2016) study the role of institutions in determining corporate
structure decisions of firms in the MENA region. Using data on 444 firms operating in
the MENA region, they conclude that countries endowed with a better institutional
framework (regulatory effectiveness and rule of law) rely relatively more on debt than
equity. Corruption, on the contrary, has the opposite effect. Arwatani et al (2016) perform
a study on corporate debt maturity of MENA banks. Their findings confirm a positive
relationship between the use of long-term debt and the quality of institutions in each
country. Since Gropp & Heider (2010) have shown that the drivers of banks' capital
structure are close to those of non-financial firms, institutional factors could also play an
important role in explaining bank capital ratios in the MENA region. Hence, bank
regulations might be playing a less important role in determining bank capital ratios
(Flannery 1994; Diamond & Rajan 2000; Allen et al. 2011) and institutional factors need
to be taken into consideration.

12
3. Data, variables, and econometric specification
In this section, before presenting our econometric approach and our variables, we
describe our sample.
3.1 Sample
Our sample period ranges from 2004 to 2014. We eliminate outliers at 1% and
99% of all variables7. After filtering, the sample includes 1307 bank-year observations,
representing 149 banks (116 conventional and 33 Islamic banks) from 14 MENA region
countries8. The average number of observations per bank is 8. The countries we consider
are the following: Algeria, Bahrain, Egypt, Israel, Jordan, Kuwait, Lebanon, Malta,
Morocco, Oman, Qatar, Tunisia, United Arab Emirates and Yemen. The sample includes
state-owned and privately-owned banks and both listed and unlisted banks. For each
bank, we use consolidated statements if data is available. Otherwise, we use
unconsolidated data.
As for data sources, Yearly bank level data are extracted from the BankScope -
Bureau van Dijk database. Macroeconomic data is gathered from the Global Financial
Development Database and the World Development Indicators of the World Bank. As for
institutional data, we use different databases; the World Governance Indicators, the
Doing Business Creditor Rights (World Bank), the Transparency International
Organization and the World Heritage Foundation.
7 We have cleaned all the variables including size by dropping all values lower than the 1st and higher than
the 99th percentiles in order to ensure that the sample we are working with is outlier-free. Size is also a
variable for which incidental misreporting could occur.
8 We begin by extracting from BankScope a sample of 305 commercial and Islamic banks operating in 21
MENA region countries. We eliminate 7 countries for which capital ratios or institutional data are not
reported. We also drop Iran as it only includes Islamic banks and not both (Conventional and Islamic).
After balancing our sample to obtain the same number of observations for all dependent variables
(regulatory capital ratio is less reported compared to the simple equity to total assets ratio), we end up with
149 banks.

13
Table (1) shows the distribution of banks in our sample by country and by type.
Five countries in our sample do not have Islamic banks, while Algeria and Yemen do not
have any listed banks, compared to Kuwait where all banks are listed. Egypt, Lebanon
and UAE have the highest total number of banks. The final sample of banks represents
65% of the total bank assets of all the sample countries9.
[[insert table 1 here]]
3.2 Econometric specification
We adopt the following econometric model:
CRijt= β0+ β1 INSTjt+ β2 BANKijt + β3 OTHERjt + β4 SPECSijt +Cj+ Ct + εijt
[1]
where CRijt stands for the capital ratio which represents either the total capital adequacy
ratio (TCR) or the equity to total assets ratio (EQTA) of bank i in country j at time t.
INSTjt is a set of variables accounting for the country's institutional framework. BANKijt
represents a vector of variables used to control for bank specific characteristics. OTHERjt
is a vector of variables containing country level variables, other than institutional ones.
SPECSijt includes a set of dummy variables specifying whether a bank is conventional or
Islamic, Government owned or privately owned, and listed or unlisted. Cj and Ct control
for country and time specific effects respectively to account for country level unobserved
9 With respect to BankScope – Bureau van Dijk available data. The representativeness of our sample based
on total assets is the following: Algeria (22%), Bahrain (92%), Egypt (98%), Israel (42%), Jordan (99%),
Kuwait (70%), Lebanon (94%), Malta (92%), Morocco (57%), Oman (93%), Qatar (52%), Tunisia (16%),
United Arab Emirates (62%) and Yemen (69%).

14
heterogeneity or some other global trend in banking behavior. εijt are the error terms
which we cluster at the bank level.”
To go further in our analysis, we add to model [1] an interaction term between
institutional variables and the type of the bank (INST*Type). The variables Type is then
replaced with a dummy accounting for bank size (Large), a dummy which controls for
whether the bank is government-owned (Gov) or not, a dummy for Islamic banks
(Islamic), or a dummy to proxy for whether the bank is listed on a stock exchange or not
(Listed). Model [1] becomes:
CRijt= β0+ β1 INSTjt+ β2 BANKijt + β3 OTHERjt + β4 SPECSijt + β5 INST*Typeijt +
Cj+ Ct + εijt [2]
Regarding the estimation method, although the fixed effects within estimator
would resolve the issue of correlation between the unobserved individual effects and the
explanatory variables, by subtracting individuals means from variables, all time-invariant
variables would be dropped. To deal with this issue, we use the Hausman Taylor (1981)
instrumental variable estimator approach by which some of the regressors are allowed to
correlate with the individual effects (HT). We adopt the HT methodology because our
main variables, the institutional variables, are almost time-invariant. Furthermore, HT
deals with possible endogeneity induced by individual bank specific effects and allows us
to control for cross country variations while at the same time allowing for the
incorporation of time-invariant variables. We use the Hausman test to verify that using
the HT model is the most appropriate in the case of our data. The Hausman test does not
reject the null that the HT estimator is equivalent to the fixed effects estimator. The fixed
effects estimator is thus consistent but less efficient, suggesting the use of HT as
consistent and more efficient estimator.
The Hausman-Taylor estimator deals with the correlation issue between some
regressors and the individual effects. However, using lagged variables, addresses the

15
issue of endogeneity, that is, the correlation between the regressor and the time-varying
idiosyncratic error term. To mitigate possible endogeneity issues, we use the first lag of
all bank level independent variables. Thus, size, return on assets, and risk measures are
included in the regression at their lagged values.
3.3 Definition of variables
3.3.1 Dependent variables
The MENA region has underdeveloped capital markets in some countries, and
even no capital markets in others. For this reason, we focus in this study on book capital
ratios. Our main dependent variable is the total regulatory capital ratio (TCR). This total
capital adequacy ratio as per Basel rules is the ratio of Tier 1 and Tier 2 capital (hybrid
capital, subordinated debt, reserves for loan losses, and valuation reserves) to total risk
weighted assets and off-balance sheet weighted risks. We also consider the equity to total
assets ratio (EQTA) which is non-risk weighted and therefore reflects the internal bank
capital holding decisions while TCR reflects the regulatory influenced capital.
3.3.2 Independent variables
3.3.2.1 Main variables
First, we use an indicator of political stability (PS) from the World Governance
Indicators of the World Bank10. Political instability is one of the major obstacles facing
countries in the MENA region and the region’s average is one of the lowest in the world.
This indicator is scaled from -2.5 to +2.5 with higher values indicating higher political
stability. On the one hand, banks in politically unstable regions might boost their capital
ratios as a mean of gaining trust of investors/clients. Hence, attracting depositors might
10 Our study includes a country-level indicator of political stability. For other insights on political patronage
and the role of political connections in banking, see studies such as the ones by Fraser et al. (2006) and
Bliss and Gul (2012).

16
be a major explanation of high capital holdings by banks in fragile political
environments. On the other hand, banks operating in fragile environments might be
reluctant to raise equity and might prefer to maintain low capital ratios to prevent any
potential loss of control should the country’s political situation get worse. Considering
the prevalence of high levels of political instability in the region we consider, we expect a
positive association between political stability and bank capital ratios.
We use two indicators of creditors' rights form the Doing Business database;
resolving insolvency and getting credit. The Resolving Insolvency (RI) variable includes
the time, costs, outcome of insolvency, liquidation, and reorganization proceedings. The
Getting Credit (GC) indicator measures the ease of obtaining credit as well as the ease of
accessing credit information (existence of credit bureaus and credit registries for
example). These two indicators are scaled from 0 to 100 with higher scores indicating
higher levels of creditors’ rights. Results concerning the effect of creditors’ rights on
capital ratios have been mixed in the literature. As mentioned previously, high creditor
rights might lead managers to limit debt usage to avoid losing control should financial
distress prevail (Rajan & Zingales 1995; Cho et. al 2014). At the same time, higher
creditor rights results in less information asymmetry and easier access to external
funding. Thus, credit would be available at more favorable conditions. Hence, firms in
this case might prefer holding more debt than equity (La Porta et al. 1997; González &
González 2008). On the basis of the above, we expect measures of creditors’ rights to
have negative influence on capital ratios of banks operating in the MENA region.
We also use indicators of economic freedom from the World Heritage
Foundation. The aggregate index, the Economics Freedom (EF) index11, measures the
extent to which individuals can control freely their property or labor. In other words, this
11 The Economic Freedom Index is computed as the simple average of the following ten sub-indicators:
Property rights, Freedom from corruption, Fiscal Freedom, Government Spending, Business Freedom,
Labor Freedom, Monetary Freedom, Trade Freedom, Investment Freedom, and Financial Freedom.
17
indicator assesses to what extent capital, labor, and goods can move freely in a given
economy. We build an indicator that we call Financial Openness (FO) to focus closer on
the potential role that can be attributed to trade and financial freedom. Trade freedom
measures the ease of importing and exporting goods and services. Financial freedom
captures the independence of the financial sector from government control as well as
bank efficiency. This indicator is also scaled from 0 (lowest freedom) to 100 (highest
freedom). We expect a positive effect of EF and FO indexes on bank capital ratios.
Broader exposure to international markets as well as more financial freedom and thus
higher competition pushes banks to hold higher capital ratios possibly to signal stronger
financial conditions aiming at attracting more funds.
We include the corruption perception index (CPI) which represents the perceived
level of corruption in a country’s public sector12. CPI is calculated on a scale of 0
(severely corrupt) to 100 (no corruption). Corruption is a widespread phenomenon which
is much more prevalent in underdeveloped and developing economies. It’s effect on
economic growth has been widely studied. Many studies confirm the detrimental role of
corruption on growth. Other studies, however, such as Shleifer & Vishny (1993); Mo
(2001); Wei (2000), find that it can have a beneficial effect on economic growth by
promoting a better allocation of resources. One way is paying bribes to evade inefficient
rules for example (Huntington 1970; Acemoglu & Verdier 2000). In the MENA region, a
large part of bank capital is held by government officials and political parties. Hence,
corruption might lead banks to abide less by capital regulations as political power and
bribery can be used to circumvent such regulations. Hence, we expect a positive sign of
the CPI on bank capital ratios.
12 We concentrate on country-level corruption levels to be coherent with other institutional variables. For
bank-level corruption studies, such as corruption in lending, see studies such as Houston et al. (2011),
Barry et al. (2016), inter alia.

18
In addition, we perform a principle component analysis and use the first factor to
produce a broader index of our institutional factors (IFI) excluding measures of creditors’
rights for which we construct a separate index (CRT). IFI is thus the first principal
component of: Political stability (PS), financial openness (FO), economic freedom (EF),
and corruption (CPI). Factor loadings are as follows: 0.68 for PS, 0.92 for EF, 0.67 for
FO, 0.89 for CPI. CRT is the principal component of two indexes: getting credit
(GCREDIT) and resolving insolvency (RI). Factor loadings are 0.67 for both sub-
indexes.
3.3.2.2 Control variables
We include several bank specific variables widely used in studies on capital
ratios. We proxy bank size by introducing the logarithm of total bank total assets (SIZE).
SIZE is expected to negatively influence capital ratios as larger banks tend to hold less
capital consistent with the “too big to fail hypothesis” (Brewer et al. 2008; Kleff &
Weber 2008; Fonseca & González 2010). These banks might also benefit from
economies of scale, broader asset diversification, and an ease of obtaining equity on a
short notice which makes them subject to lower financial distress costs (Rime 2001;
Berger et al. 2008). Larger banks are thus less motivated to hold higher capital ratios,
consistent with the capital trade-off theory in which deadweight bankruptcy (which are
lower for larger banks) is traded off against tax saving incentives of holding more debt.
The Return on Assets (ROA) ratio is used to proxy bank profitability. It is
calculated as the ratio of a bank’s net income to its average assets. Profitability is
expected to boost capital ratios as more profitable banks tend to have higher capital to
assets ratio by injecting their retained earnings into capital, consistent with the pecking
order theory (Gropp and Heider 2010; Brewer et al 2008). This would especially be
expected in the case of the equity to assets non-risk-weighted ratio. This view is
especially expected to hold in a region with underdeveloped financial markets such as the
MENA region. At the same time, we can also expect more profitable banks to hold lower
capital ratios because higher profitability is in line with a reduction in funding costs

19
(Berger et al., 2017). More profitable banks are expected to face lower financial distress
and interest tax shields appear to them more valuable. Hence, according to the tax-
bankruptcy trade-off theory of capital, more profitable banks will hold lower capital
ratios. Moreover, the agency-trade-off theory of capital stipulates that in such firms
where cash flow is higher, debt will have a higher disciplinary effect (on managers).
Hence, to mitigate agency problems, banks are the motivated to hold more leverage
(Jensen 1986). All in all, the impact of profitability measured by the ROA on capital
holdings is uncertain.
To account for bank risk, we use the logarithm of the ZSCORE. The ZSCORE is
widely used as a proxy for bank risk in the literature (Boyd et al. 2007; Laeven & Levine;
2009, Fu, et al.; 2014). It measures the probability of bank failure. It is calculated as
follows:
ZSCORE= (ROA + TCR)/ σ(ROA)
where ROA is the return on assets ratio, TCR is the total capital adequacy ratio, and
σ(ROA) is the standard deviation of the ROA. We use a moving mean and standard
deviation estimates with a three-year rolling window. Higher levels of the ZSCORE are
associated with higher levels of stability since this ratio is the inverse of the probability of
insolvency. We use the logarithm of the ZSCORE. Findings on the effect of risk on
capital ratios have been mixed in the literature. Many studies found a positive effect of
risk on capital as the latter serves as a cushion for potential losses hence banks tend to
hold more capital when they are riskier (Shrieves & Dahl 1992; Nier & Baumann 2006;
Gropp & Heider 2010; Berger et al. 2008). However, from an opposite perspective, the
relationship between capital and risk might be negative since banks who are risk-takers
also prefer a riskier capital position (hence lower capital ratios) (Fonseca & González
2010).
To account for a country’s regulatory framework, we include an indicator of
regulatory capital stringency (REG). This indicator is manually constructed based on the

20
Barth et al. World Bank Regulation and Supervisory Database13 (Barth et al. 2004, Barth
et al 2008, and Barth et al. 2013). This indicator ranges from 0 to 3 with one point given
to every risk type covered by the country’s regulatory jurisdiction (credit risk, market
risk, and operational risk). The higher the indicator, the stricter the capital regulations.
The sign of this variable is expected to be positive since banks will be more constrained
to hold higher capital ratios in countries where regulations on capital are tighter and cover
more aspects of banking risk. At the same time, countries in the region we consider hold
capital ratios much higher than what Basel agreements stipulate. Hence, regulation
stringency might not be a significant determinant of capital ratios.
We also control for whether the country has an implicit or explicit deposit
insurance (DEP_INS) scheme. We use a dummy variable which takes the value of 1 for
an explicit deposit insurance system and 0 for an implicit deposit insurance scheme. We
expect banks operating in countries with explicit deposit insurance to be more leveraged.
Deposit insurance creates moral hazard incentives which lead banks to choose high levels
of leverage, thus maintaining low capital ratios (Keeley 1990). Alternatively, implicit
deposit insurance could also mean that depositors would not suffer from any losses if
banks are most likely to be bailed out. Hence, banks could also have incentives to hold
less capital in the absence of explicit insurance. Also, in the presence of explicit deposit
insurance, if banks can actually fail and if depositors are effectively not reimbursed above
the limit (credibility of non-insurance above the limit) banks will have incentives to take
less risk than under implicit insurance. Hence the coefficient of this variable could also
be significantly negative.
13 We use the three versions available of this database (2003, 2007, and 2012). We consider the variables
constant between the 3 versions. In other words, years 2004 to 2006 take the values of the 2003 survey,
years 2008 to 2011 take the values of the 2007 survey, and years 2013 and 2014 takes the values of the
2012 most recent survey.

21
To proxy for bank concentration, we use the Herfindhal-Hirschman index (HHI).
The HHI is widely used in the literature to proxy for concentration. We base our HHI on
total assets. Our indicator (CONC) is thus calculated as the sum of the squared weights of
banks assets for every country and in each year. The higher the index, the higher the
concentration. In countries with high bank concentration, banks with higher market
power would hold more capital to preserve their charter value. At the same time, a higher
franchise value might be considered as a source of extra income, which reduces the need
to hold higher capital ratios to hedge against unexpected losses (Fonseca & Gonzales
2010).
We consider GDP Growth (GDP) to examine the possible impact of the business
cycle on capital ratios. Many studies document a negative relationship between
regulatory capital ratios and the business cycle (Ayuso et al. 2004; Shim 2013). As per
these authors, banks tend to decrease (increase) their capital holding during economic
upturns (downturns). At the same time, banks might prefer to increase capital ratios
during economic booms to benefit from potential investment opportunities (Berger 1995).
Finally, we include three dummy variables (Islamic, Gov, and Listed) to capture
whether a bank is conventional or Islamic, Government-owned or privately-owned, and
listed or unlisted on a stock exchange respectively. We aim to test how a bank’s
internally-set (leverage ratio) and externally-set capital ratios (regulatory ratio) are
influenced by these different characteristics.

22
4. Results
4.1 Descriptive statistics
Table (2) presents the descriptive statistics of the sample used in this study. Mean
TCR and EQTA are respectively at 18.6% and 13.1%. MENA TCR average is actually
much higher than international standards and Basel requirements. EQTA exhibits large
cross-country variations with a minimum of 3% in Malta and a maximum of 72.7% in
UAE. The banking sector is also on average highly concentrated with a sample mean
value of 0.17 on the Herfindahl index. Most concentrated banking sectors are in Qatar
and Bahrain. Bahrain also has the largest banks by bank size among all countries in our
sample. The ZSCORE averages at 1.9 for the region with the highest score recorded in
Lebanon at 4.3. As for profitability, the mean ROA in our sample is at 1.38% which is
much higher than a global world average of 0.89%. Based on these descriptive statistics,
banks in the MENA region can be characterized as highly capitalized, highly
concentrated and relatively profitable.
[[insert table 2 here]]
Table (3) shows the evolution of TCR and EQTA averages by country and
through time. TCR fluctuated between 17.9% and 21.5% during our sample period (2004
to 2014). On the region level, EQTA was as low as 11.6% in 2004 reaching a high of
14.3% in 2011. In 2014, TCR is the highest in Algeria at 36% and the lowest in Morocco
at 13.6%. For EQTA, in 2014, Israel has the lowest level (5.9%). Algeria exhibited the
highest EQTA in 2014 (32.2%), followed by Bahrain (25.6%). It is also worth pointing
out the fact that all countries in the MENA region maintained capital ratios much higher
than what Basel agreements stipulate.

23
[[insert table 3 here]]
Table (4) presents the distribution of our institutional variables by country.
Institutional quality varies greatly between countries in our sample. On a scale of -2.5 to
+2.5, PS ranges between -2.5 and 1.39 and averages as low as -0.44. The mean for the
region is at -0.44 which shows high political instability for the region as a whole. FO and
EF indicators both average at 64/100 approximately. Corruption levels have high
disparity between countries, attaining as low as 15/100 to as high as 77/100 with a total
sample average of 45/100.
[[insert table 4 here]]
Table (5) displays the correlation matrix between all variables employed. No
major correlation issues exist between our variables except for institutional variables
which exhibit high correlation coefficients. To further test whether including all
institutional variables simultaneously in the regression is viable, we run the VIF
(Variance Inflation Factor) test following Besley et. al (1980). We obtain values higher
than 5 which suggests that including all institutional variables at the same time is not
viable and associated with multicollinearity issues that might lead to misleading results.
Hence, we include one institutional variable at a time when running our regressions.
Moreover, we use the principal component indicators (IFI and CRT) that we have
computed to assess the global impact of all institutional variables simultaneously.
[[insert table 5 here]]

24
4.2 Mean tests
Before running our model, we run mean tests on our sample. We perform mean tests
on TCR to check whether we obtain significant mean TCR differences between countries
with high institutional development compared to countries with low institutional
development. Table (6) shows the results. Findings indicate that TCR has significantly
higher average values in environments endowed with higher Political stability (PS),
economic freedom (EF), and corruption (CPI)). On the contrary, in countries where
higher creditors’ rights prevail (GC and RI), total capital adequacy ratios seem to be
significantly lower.
[[insert table 6 here]]
4.3 Regressions results
4.3.1 Main regression results
Table (7) reports the main regression results. Each institutional variable is
separately introduced in the regressions due to high correlation among these variables.
Panel A (columns 1 to 7) reports the results for TCR while Panel B (columns 8 to 14)
represents the results for EQTA. All institutional variables reported are significant in
explaining the total capital ratio (TCR). TCR is positively affected by political stability.
Banks in politically stable countries tend to hold higher risk-weighted capital ratios.
Consistent with (González & González 2008) who show that stronger creditor rights
cause firms to be more leveraged, we find that creditor rights (higher GC and RI) have a
significant negative effect on TCR. When a client defaults on his debt, if the bank can
more easily retrieve the amount of the loan, it will hold less capital as a cushion. Hence,
banks hold less capital in countries where resolving insolvency is easier. Moreover,
creditor rights also measure the ease of liquidation and reorganization. A bank might

25
prefer holding lower capital ratios when stricter liquidation rules apply. La Porta et al.,
(1997) argue that firms are likely to be more leveraged in the presence of more favorable
creditor rights because in such a context credit would be available in more favorable
conditions. Higher economic and financial freedom indexes are significantly associated
with higher values of TCR. Broader exposure to international markets and thus higher
competition to attract funds pushes banks to hold higher capital levels possibly to signal
stronger financial conditions. CPI is positively significant at the 1% level. Less
corruption leads banks to hold more capital, a result which is consistent with the findings
of Belkhir et al., (2016) regarding MENA non-financial firms whose leverage levels are
found to be positively linked with corruption. Results using principal component analysis
are presented in columns 7 and 14 of Table (7). IFI exhibits a positive significant sign on
TCR. Banks operating in countries endowed with better institutional environments
(higher political stability, higher economic freedom and financial openness and lower
corruption) tend to hold higher regulatory capital ratios. Consistent with its sub-indexes,
CRT negatively affects TCR as well and is significant at the 1% level.
Among control variables, we find that size and profitability are negatively
significant for both capital ratios. Large banks tend to hold less capital, consistent with
the view that they can raise capital more quickly should an adverse situation occur. This
is also in line with Berger et al. (2008), Fonseca and Gonzales (2010) and Demirgüç-
Kunt, Kane, & Laeven, (2014) who posit that large banks benefit from government
bailouts and other guarantees, have higher economies of scale and better risk
management and therefore can hold less capital than smaller banks. More profitable
banks seem to hold lower TCR consistent with the tax-bankruptcy trade-off theory and
the agency trade off theory of capital. Risk and concentration are however insignificant in
explaining both capital ratios. Capital ratios of banks in the MENA region do not seem be
affected neither by the risk of default of the bank nor by its market power. In the
literature, findings on the effect of risk on capital ratios have been mixed. Many studies
found a positive effect of risk on capital as the latter serves as a cushion for potential
losses hence banks tend to hold more capital when they are riskier (Shrieves & Dahl
1992; Nier & Baumann 2006; Gropp & Heider 2010; Berger et al. 2008). However, from

26
opposite perspective, the relationship between capital and risk might be negative since
banks who are risk-takers also prefer a riskier capital position (hence lower capital ratios)
(Fonseca & González 2010). We observe no significance of risk in the case of our data
suggesting that both opposing hypothesis on risk might be affecting capital ratios
whereby the net effect is neutral. GDP exhibits an insignificant coefficient as well
meaning that there seems to be no cyclical or counter cyclical behavior of capital ratios
for banks in the MENA region. Capital adequacy ratio coverage (REG), which measures
the stringency of capital regulations is also insignificant. Banks do not seem to be
affected by the country’s regulatory framework when choosing their capital ratios which
are already much higher than minimal requirements. This is in line with (Bougatef &
Mgadmi 2016; Awdeh et al. 2011) who show that regulations do not affect capital
holdings of banks operating in the MENA region. This is especially relevant considering
the fact that TCR values for all countries in the region are much higher than what Basel
agreements impose.
Furthermore, the dummy variables we include provide evidence that government
owned banks as well as listed banks hold higher TCR than privately owned banks and
unlisted banks, respectively. Listed banks are indeed expected to hold more capital
because of easier access but also because they are subject to market discipline and hence
"pushed" by the market to hold higher capital ratios. Governments of underdeveloped
and emerging countries such as the ones in the MENA region might have high pre-set
levels of capital ratios and lower levels of flexibility when it comes to going below these
set levels (regulatory and simple equity ratios). In addition, those banks might worry less
about the opportunity cost of capital (unlike private banks), the fact which can also
explain the positive sign of the government ownership dummy variable.
Unlike TCR, EQTA is not affected by institutional variables (except for CPI and
GC which have a marginal positive significance). Institutional factors hence appear to
affect the regulatory constraint related to capital without playing a major role in
determining the capital targets that banks set internally regardless of regulation.
Concerning control variables, we find that profitability is positively significant at the 1%

27
level. Banks with higher retained earnings are expected to hold higher equity to total
assets ratio. As for TCR, size shows a significant negative sign on EQTA, implying that
large banks maintain lower EQTA levels. The dummy variable Gov is also positively
significant with a higher significance compared to results for TCR. In the MENA region,
government-owned banks maintain higher capital ratios compared to privately-owned
banks.
[[insert table 7 here]]
4.3.2 Further investigations
4.3.2.1 Stock market development
To go further in our investigation, we divide our sample into two sub-samples of
developed stock markets (above the median) versus less developed stock markets (below
the median) using the market capitalization to GDP indicator (MK_GDP) of the World
Bank. For our sample, the MK_GDP median is at 48.3%. We split our sample according
to the degree of development of the stock market because we expect market discipline to
play a stronger role in influencing leverage ratios where stock markets have a deeper
presence. In other words, we expect the effect of institutional variables on capital ratios
to be conditional on the degree of stock market development since banks in countries
with more developed stock markets might behave differently as they are exposed to
higher market discipline. The effect might also be different depending on whether we
consider regulatory (risk-weighted) or non-regulatory capital ratios (non-risk-weighted).
Market participants are known to monitor non-weighted capital ratios more closely as
such ratios are less prone to manipulation than risk-weighted ratios
The results of stock market development sub-samples are presented in tables (8)
and (9). Table (8) shows the results for countries where stock markets are less developed
while table (9) includes countries with more developed stock markets. For countries
endowed with lower levels of stock market development, all institutional variables with

28
the exception of political stability are significant for regulatory capital. Our results
confirm our expectations that institutional variables significantly influence TCR for less
developed stock markets whereas EQTA is not affected for most variables. Conversely,
when markets are more developed, institutional variables are only significant in
explaining leverage ratios (EQTA). In other words, when the stock market is developed,
a better institutional environment positively affects banks' internally set capital possibly
because this capital serves as a signal of better soundness to the market. More
specifically, market-based fundamentals in this case care much more about simple
leverage ratio rather than risk weighted ratio. While when the market is weakly present, a
well-developed institutional environment seems essential to ensure the effectiveness of
bank capital regulations.
We perform further analysis to study whether the effect of the institutional
environment in developed versus underdeveloped stock markets differs with the type of
bank considered, that is, large or small, listed or non-listed, and conventional or Islamic
(Tables 10a,10b, and 10c). Our results show that when the stock market is relatively more
developed, such results are robust for large banks, listed banks, and Islamic banks. For
countries with weaker presence of stock markets, institutional variables are more
effective for large and conventional banks. While for Islamic banks, the institutional
environment (except for PS) does not seem to affect their internally set capital (EQTA)
nor the regulatory capital (TCR). In fact, Islamic banks have their own agendas and
capital regulations are not much relevant for such banks. Leverage ratios of listed banks
also seem to be more influenced by the institutional environment since market discipline
is also much more relevant in the case of listed banks compared to non-listed banks. In
the following sub section, we introduce interaction terms in order to further examine
whether the type of bank influences the relationship between institutional variables and
bank capital ratios.

29
[[insert table 8here]]
[[insert table 9 here]]
[[insert table 10a here]]
[[insert table 10b here]]
[[insert table 10c here]]
4.3.2.2 Bank characteristics
For deeper insights on whether the effect of the institutional environment is
conditional to the type of the bank, we proceed in estimating model [2]. First, we interact
institutional indicators with a dummy that accounts for size (INST*Large). Large takes
the value of 1 if the bank is large and zero if the bank considered is small to test whether
large banks are affected differently. We consider a bank as large if its total assets are
above one billion USD and/or if it belongs to the top 5 banks in each of our countries.
Tables 11 shows the results for bank size. Our results show that the effect of all the
institutional variables (except PS) on TCR is much more pronounced for Large banks
compared to smaller ones.
[[insert table 11 here]]
Second, to assess whether the effect of institutional variables is conditional to
whether the bank is government-owned or not, we interact institutional indicators with a
dummy that accounts for Government ownership (INST*Gov). We consider a bank
government-owned if more than 25% of its shares are held by the government. Results
are displayed in table 12. Results in Table [12] indicate that no difference exists between

30
the effect of institutional variables on government-owned and non-government owned
banks except for the indicator of corruption. The higher the corruption in a given
economy, the lower capital ratios of banks are, especially for non-government-owned
banks.
[[insert table 12 here]]
Third, we replace Type by Islamic to test whether Islamic versus conventional
banks are affected differently. Islamic takes the value of 1 for an Islamic bank and 0 for a
conventional bank. Table 13 reports the results. Results show that the negative effect of
creditors’ rights on TCR is more pronounced for conventional banks. Measures of
creditors’ rights are less likely to affect capital ratios of Islamic banks possibly because
using capital to hedge against risk is less relevant for such banks.
[[insert table 13 here]]
Finally, we test whether the behavior of listed and unlisted banks differ in this
scope. INST*Type becomes INST*Listed in this regression. Listed takes the value of 1
for a bank listed on a stock exchange and zero if the bank is not listed on any stock
exchange. Results in table 14 indicate that institutional variables affect TCRs of non-
listed banks without having any effect on listed banks’ TCRs. However, and as expected,
institutional variables (except for political stability) influence EQTA of listed banks only.
It seems that institutional variables increase market discipline which is much more
relevant for banks listed on a stock exchange compared to non-listed ones. Moreover,
market participants care more about the leverage ratios than regulatory ratios, one major

31
explanation behind which our results are more pronounced for EQTA of listed banks
specifically.
[[insert table 14 here]]
4.3 Robustness tests
We run several tests to check for the robustness of our results. We start by using
different measures of capital ratios as dependent variables. First, we use the Tier1 capital
ratio as dependent variable. Tier1 is defined as the core equity capital of a bank to its
risk-weighted assets, it is thus the “pure” version of capital and may reflect better the
financial strength of a bank from the regulator’s point of view. Our regression results
confirm our findings for TCR whereby all institutional variables are positively significant
in explaining Tier1 ratio except for creditor’s rights which affect Tier1 negatively
(Appendix, Table 1). Second, we replace TCR by capital buffers (KBUFF). Capital
buffer is defined as the difference between the total regulatory capital ratio and the
minimum required by capital regulation in each country. Although some differences exist
between countries of our sample in terms of regulatory minima levels, the results of our
main variables of interest, the institutional variables, are very similar to of the ones
obtained with TCR (Appendix, Table 2). Third, we estimate our model in a dynamic
setting using the generalized method of moments (GMM) developed by Arellano and
Bond (1991). We control for the endogeneity of bank-level and institutional variables by
using two to four lags of the variables themselves as instruments in our model. Results
are presented in Table (3) of the Appendix. Findings confirm the robustness of the results
obtained with the Hausman-Taylor methodology in our main regression. Finally, to make
sure our results are not driven by specific countries, we exclude the Gulf Cooperation
Council (GCC) countries (Bahrain, Kuwait, Oman, Qatar, and the UAE), Malta and Israel
from the regressions as these countries are endowed with better financial and institutional

32
foundations compared to others in the sample. We also observe no major changes
compared to our main regression results. We can thus conclude that our results are not
driven by these excluded countries (Appendix, Table 4).

33
5. Summary and concluding remarks
This paper studies the influence of institutional factors on bank capital structure using
panel data on 149 banks operating in the MENA region for the period 2004 to 2014. We
contribute to the increasing number of studies pioneered by Demirguc-Kunt and
Maksimovic (1999) on the importance of accounting for country level institutional
characteristics when studying different aspects of the financial sector.
For this purpose, we use two measures of bank capital structure; the risk-weighted
capital ratio imposed by regulators, which accounts for the level of risk in banks' asset
portfolios, and a measure of leverage which is a non-risk weighted simple equity-to-asset
ratio set by bank managers internally. Our results indicate that banks in countries with
higher political stability, more pronounced economic and financial freedom, as well as
lower levels of corruption hold more regulatory capital. Creditors’ rights, on the contrary,
have the opposite effect. A closer look shows that such effects only hold in countries
where stock markets are weakly developed. Furthermore, the influence of institutional
factors in less developed stock markets is more pronounced for large and conventional
banks compared to smaller and Islamic banks respectively.
Conversely, when stock markets are more present only non-weighted capital ratios
are affected by institutional factors. Likewise, our results also indicate that institutional
variables influence EQTA of listed banks only. Hence, institutional factors appear to play
a stronger role regarding market discipline than regulatory discipline in countries with
developed stock markets but when stock markets are weakly present they are effective in
enhancing regulatory discipline.
Our results have several policy implications. Institutional quality must not be assessed
independently of the degree of presence of stock markets when studying capital structures
of banks operating in developing countries and in the MENA region more specifically.
The region suffers from several institutional deficiencies which seem to have
implications on many sectors including the financial and banking sector. According to
our results banks operating in countries with better institutional environments hold higher

34
bank capital ratios and are therefore expected to be safer than banks in countries with less
developed institutions. However, the degree of development of stock markets also plays
an important role by influencing the channel through which banks are monitored. Our
results show that the quality of the institutional environment differently affects risk-
weighted regulatory capital and non-weighted equity ratios depending on whether the
stock market is more or less developed. According to our findings, institutional
foundations seem to play a significant role in determining regulatory capital ratios in
countries with less developed stock markets. Thus, institutional quality should not be
disregarded especially in countries where the stock market is relatively underdeveloped.
Such quality appears to be an important value to ensure better and more effective
compliance to regulation when stock markets are weakly present. However, when stock
markets are more developed institutional quality adds less in terms of regulatory scrutiny
and compliance possibly because the market has already imposed some discipline.
Moreover, from a financial markets’ perspective, leverage is much more relevant as a
signal of soundness to the market rather than the regulatory risk-weighted capital ratio.
This might also be a major reason why institutional variables affect leverage ratios much
more in countries with relatively developed stock markets.
Hence, promoting institutional development can be considered of vital importance not
only to a country’s economic and social development but also to ensure financial stability
and resilience to local or global shocks. Finally, our results indicate that complying with
more stringent international regulatory standards is possibly easier to achieve in countries
with a better institutional environment. Also, in weaker institutional environments,
regulators and supervisors need to monitor banks more closely and make more efforts in
that direction.

35
References
Acemoglu, D. & Verdier, T., 2000. The choice between market failures and corruption.
American Economic Review, 90(1), pp.194–211.
Aggarwal, R. & Jacques, K.T., 2001. The impact of FDICIA and prompt corrective
action on bank capital and risk: Estimates using a simultaneous equations model.
Journal of Banking & Finance, 25(6), pp.1139–1160.
Al-tamimi, H.A.H. & Jellali, N., 2013. The effects of ownership structure and
competition on risk-taking behavior: Evidence from UAE coneventional and Islamic
banks. The International Journal of Business and Finance Research, 7(2), pp.115–
124.
Allen, F., Carletti, E. & Marquez, R., 2011. Credit market competition and capital
regulation. Review of Financial Studies, 24(4), pp.983–1018.
An, Z., Li, D. & Yu, J., 2016. Earnings management, capital structure, and the role of
institutional environments. Journal of Banking & Finance, 68, pp.131–152.
Available at: http://dx.doi.org/10.1016/j.jbankfin.2016.02.007.
Anzoategui, D., Martinez Peria, M.S. & Rocha, R.R., 2010. Bank Competition in the
Middle East and Northern Africa Region. Review of Middle East Economics and
Finance, 6(2).
Arellano, M. & Bond, S., 1991. Some Tests of Specification for Panel Data: Monte
Carlo Evidence and an Application to Employment Equations. The Review of
economic Studies, 58, 277-297.
Awdeh, A., El-Moussawi, C. & Machrouh, F., 2011. The Effect of Capital Requirements
on Banking Risk. International Research journal of Finance and Economics,
66(66), pp.133–146.
Ayuso, J., Pérez, D. & Saurina, J., 2004. Are capital buffers pro-cyclical? Evidence from
Spanish panel data. Journal of Financial Intermediation, 13(2), pp.249–264.
Bancel, F. & Mittoo, U.R., 2004. The Determinants of Capital Structure Choice : A
Survey of European Firms. Financial Management, 33(4), pp.103–132. Available at:
http://www.jstor.org/stable/3666330.
Barth, J.R., Caprio, G. & Levine, R., 2004. Bank regulation and supervision: What works
best? Journal of Financial Intermediation, 13(2), pp.205–248.
Barth, J.R., Caprio, G. & Levine, R., 2008. Bank Regulations are Changing: For Better or
Worse?” Comparative Economic Studies, December, 50(4), pp.537-563.

36
Barth, J.R., Caprio, G. & Levine, R., 2013. "Bank regulation and supervision in 180
countries from 1999 to 2011," Journal of Financial Economic Policy, 5(2), pp.111-
219
Belkhir, M., Maghyereh, A. & Awartani, B., 2016. Institutions and corporate capital
structure in the MENA region. Emerging Markets Review, 26, pp.99–129. Available
at: http://dx.doi.org/10.1016/j.ememar.2016.01.001.
Berger, A., 1995. The relationship between capital and earnings on banking. Journal of
Money, Credit & Banking, v27(n2), p.p432. Available at:
http://find.galegroup.com/itx/infomark.do?&contentSet=IAC-
Documents&type=retrieve&tabID=T002&prodId=ITOF&docId=A16967801&sourc
e=gale&srcprod=ITOF&userGroupName=lom_umichanna&version=1.0.
Berger, A. & Sedunov, J., 2017 Bank Liquidity Creation and Real Economic Output.
Journal of Banking & Finance, 81, pp.1-19.
Berger, A. et al., 2008. How Do Large Banking Organizations Manage Their Capital
Ratios ? Journal of Financial Services Research, 34, pp. 123-149
Booth, L., Aivazian, V. & Demirguc-kunt, A., 2001. Capital Structures in Developing
Countries. Journal of Finance, 56(1), pp.87–130.
Bougatef, K. & Mgadmi, N., 2016. The impact of prudential regulation on bank capital
and risk-taking: The case of MENA countries. Spanish Review of Financial
Economics. Available at: http://dx.doi.org/10.1016/j.srfe.2015.11.001.
Boyd, J. H., De Nicolò, G. & Jalal, A. M., 2007. Bank Risk-Taking and Competition
Revisited: New Theory and New Evidence, s.l.: IMF Working Paper WP/06/297.
Brewer, E., Kaufman, G.G. & Wall, L.D., 2008. Bank capital ratios across countries:
Why do they vary? Journal of Financial Services Research, 34(2–3), pp.177–201.
Chen, M. et al., 2015. Corruption and bank risk-taking: Evidence from emerging
economies. Emerging Markets Review, 24, pp.122–148.
Cho, S.-S. et al., 2014. Creditor rights and capital structure: Evidence from international
data. Journal of Corporate Finance, 25, pp.40–60.
Creane, S. et al., 2004. Financial Sector Development in the Middle East and North
Africa. IMF Working Papers.

37
De Jong, A., Kabir, R. & Nguyen, T.T., 2008. Capital structure around the world: The
roles of firm- and country-specific determinants. Journal of Banking and Finance,
32(9), pp.1954–1969.
Deesomsak, R., Paudyal, K. & Pescetto, G., 2004. The determinants of capital structure:
Evidence from the Asia Pacific region. Journal of Multinational Financial
Management, 14(4–5), pp.387–405.
Demirgüç-Kunt, A., Kane, E. & Laeven, L., 2014. Deposit Insurance Database. Working
Paper of the International monetary Fund, 14(June), pp.1–43.
Demirgüç-Kunt, A. & Maksimovic, V., 1999. Institutions, financial markets, and firm
debt maturity. Journal of Financial Economics, 54(3), pp.295–336. Available at:
http://www.sciencedirect.com/science/article/pii/S0304405X99000392.
Diamond, D. & Rajan, R., 2000. A Theory of Bank Capital. Journal of Finance, 55(6),
pp.2431–2465. Available at: http://www.jstor.org.
Distinguin, I., Roulet, C. & Tarazi, A., 2013. Bank regulatory capital and liquidity:
Evidence from US and European publicly traded banks. Journal of Banking and
Finance, 37(9), pp.3295–3317.
Distinguin, I., Kouassi, T., Tarazi, A., 2013. Interbank deposits and market discipline:
Evidence from Central and Eastern Europe. Journal of Comparative Economics, 41,
pp.544-560
Djankov, S., McLiesh, C. & Shleifer, A., 2007. Private credit in 129 countries. Journal of
Financial Economics, 84(2), pp.299–329.
Fan, J., Titman, S. & Twite, G., 2012. An International Comparison of Capital Structure
and Debt Maturity Choices. Journal of Financial and Quantitative Analysis, 47(1),
pp.23–56.
Farazi, S., Feyen, E. & Rocha, R.D.R., 2011. Bank ownership and performance in the
Middle East and North Africa Region. World Bank Policy Research Working Paper
Series, Vol, (April).
Fiordelisi, F., Marques-Ibanez, D. & Molyneux, P., 2011. Efficiency and risk in
European banking. Journal of Banking and Finance, 35(5), pp.1315–1326.
Available at: http://dx.doi.org/10.1016/j.jbankfin.2010.10.005.
Flannery, M.J., 1994. Debt Maturity and the Deadweight Cost of Leverage : Optimally
Financing Banking Firms. The American Economic Review, 84(1), pp.320–331.
Flannery, M.J., & Oztekin, O., 2012. Institutional determinants of capital structure

38
adjustment speeds. Journal of Financial Economics, 103, pp.88-112.
Fonseca, A.R. & González, F., 2010. How bank capital buffers vary across countries: The
influence of cost of deposits, market power and bank regulation. Journal of Banking
and Finance, 34(4), pp.892–902.
Fu, X., Lin, Y. & Molyneux, P., 2014. Bank competition and financial stability in Asia
Pacific. Journal of Banking & Finance, Volume 38, p. 64–77.
Gazdar, K. & Cherif, M., 2015. Institutions and the finance-growth nexus: Empirical
evidence from MENA countries. Borsa Istanbul Review, 15(3), pp.137–160.
Available at: http://dx.doi.org/10.1016/j.bir.2015.06.001.
Giannetti, M., 2003. Do Better Institutions Mitigate Agency Problems ? Evidence from
Corporate Finance Choices. The Journal of Financial and Quantitative Analysis,
38(1), pp.185–212.
González, V. & González, F., 2008. Influence of bank concentration and institutions on
capital structure: New international evidence. Journal of Corporate Finance, 14,
pp.363–375.
Gropp, R. & Heider, F., 2010. The Determinants of Bank Capital Sturcture. Review of
Finance, 14, pp.587-622
Gungoraydinoglu, A. & Öztekin, Ö., 2011. Firm- and country-level determinants of
corporate leverage: Some new international evidence. Journal of Corporate
Finance, 17(5), pp.1457–1474.
Harding, J.P., Liang, X. & Ross, S.L., 2013. Bank Capital Requirements, Capital
Structure and Regulation. Journal of Financial Services Research, 43(2), pp.127–
148.
Hausman, J. & Taylor, W., 1981. Panel Data and Unobservable Individual Effects
Author. Econometrica, 49(6), pp.1377–1398.
Haq, M., Hu. D., Faff. R., Pathan. S., 2017. New evidence on national culture and bank
capital structure. Pacific-Basin Finance Journal
Huntington, S.P., 1970. Political Order in Changing Societies.Comparative Education
Review, 14(3)
Jensen, M.C., 1986. Agency Costs of Free Cash Flow, Corporate Finance, and Takeovers.
The American Economic Review, 76, pp.323-329.

39
Kaufman, D., Kraay, A., Zoido-Lobaton, P., 2001. Governance matters II: Update
indicators for 2001. World Bank.
Keeley, M., 1990. Deposit Insurance, Risk, and Market Power in Banking. The American
Economic Review, 80(5), pp.1183–1200.
Kleff, V. & Weber, M., 2008. How Do Banks Determine Capital ? Evidence from
Germany. German Economic Review, 9(3), pp.354-372
Klomp, J. & Haan, J. De, 2013. Bank regulation, the quality of institutions and banking
risk in emerging and developing countries : An empirical analysis. Mimeo, pp.1–57.
Maraghni, H. & Bouheni, F. Ben, 2015. Bank Capital Ratio, Prudential Regulation and
Liquidity Risk Taking: Behavior of Tunisian Banks in a Simultaneous Approach.
International Journal of Economics and Finance, 7(6), pp.263–278. Available at:
http://www.ccsenet.org/journal/index.php/ijef/article/view/46074.
Mo, P.H., 2001. Corruption and Economic Growth. Journal of Comparative Economics,
29(1), pp.66–79.
Nabi, M. & Suliman, M., 2008. The Institutional Environment and the Banking - Growth
Nexus: Theory and Investigation for MENA. Economic Reserach Forum Working
Paper, (392).
Naceur, S. Ben & Omran, M., 2011. The effects of bank regulations, competition, and
financial reforms on banks’ performance. Emerging Markets Review, 12(1), pp.1–
20.
Nier, E. & Baumann, U., 2006. Market discipline, disclosure and moral hazard in
banking. Journal of Financial Intermediation, 15(3), pp.332–361.
La Porta, R. et al., 1997. Legal Determinants of External Finance. The Journal of
Finance, 52(3).
Laeven, L. & Levine, R., 2009. Bank governance, regulation and risk taking. Journal of
Financial Economics, 93(2), p. 259–275.
Qian, J. & Strahan, P.E., 2007. How Laws and Institutions Shape Financial Contracts :
The Case of Bank Loans. The Journal of Finance, 62(6), pp.2803–2834.
Rime, B., 2001. Capital requirements and bank behavior: Empirical evidence for
Switzerland. Journal of Banking & Finance, 25, pp.789–805.
40
Saadaoui, Z., 2015. The Cyclical Behaviour of Bank Capital Buffers: An Empirical
Evidence for MENA Banking Systems. Review of Middle East Economics and
Finance, 11(2), pp.145–182. Available at:
http://www.degruyter.com/view/j/rmeef.2015.11.issue-2/rmeef-2013-0067/rmeef-
2013-0067.xml.
Sassi, H., 2013. The Impact of Bank Regulations and Institutions on Efficiency in
Selected MENA Banks. International Journal of Economics and Finance, 5(8),
pp.84–100.
Shim, J., 2013. Bank capital buffer and portfolio risk: The influence of business cycle and
revenue diversification. Journal of Banking and Finance, 37(3), pp.761–772.
Available at: http://dx.doi.org/10.1016/j.jbankfin.2012.10.002.
Shleifer, A. & Vishny, R., 1993. Corruption. The Quarterly Journal of Economics,
108(3), pp.599–617.
Shrieves, R. & Dahl, D., 1992. The relationship between risk and capital in commercial
banks. Journal of Banking & Finance, 16. Available at:
http://www.sciencedirect.com/science/article/pii/037842669290024T.
Srairi, S.A., 2010. Cost and profit efficiency of conventional and Islamic banks in GCC
countries. Journal of Productivity Analysis, 34(1), pp.45–62.
Turk-Ariss, R., 2009. Competitive behavior in Middle East and North Africa banking
systems. Quarterly Review of Economics and Finance, 49(2), pp.693–710.
Wei, S.-J., 2000. How Taxing is Corruption on International Investors? The Review of
Economics and Statistics, 82(1), pp.1–11.
World Bank. 2014. Strengthening governance and Institutions in MENA: Issues and
priorities. MENA World Knowledge and Learning, Issue 114
World Bank. 2016. What’s holding back the private sector in MENA. Lessons from The
Enterprise Survey.
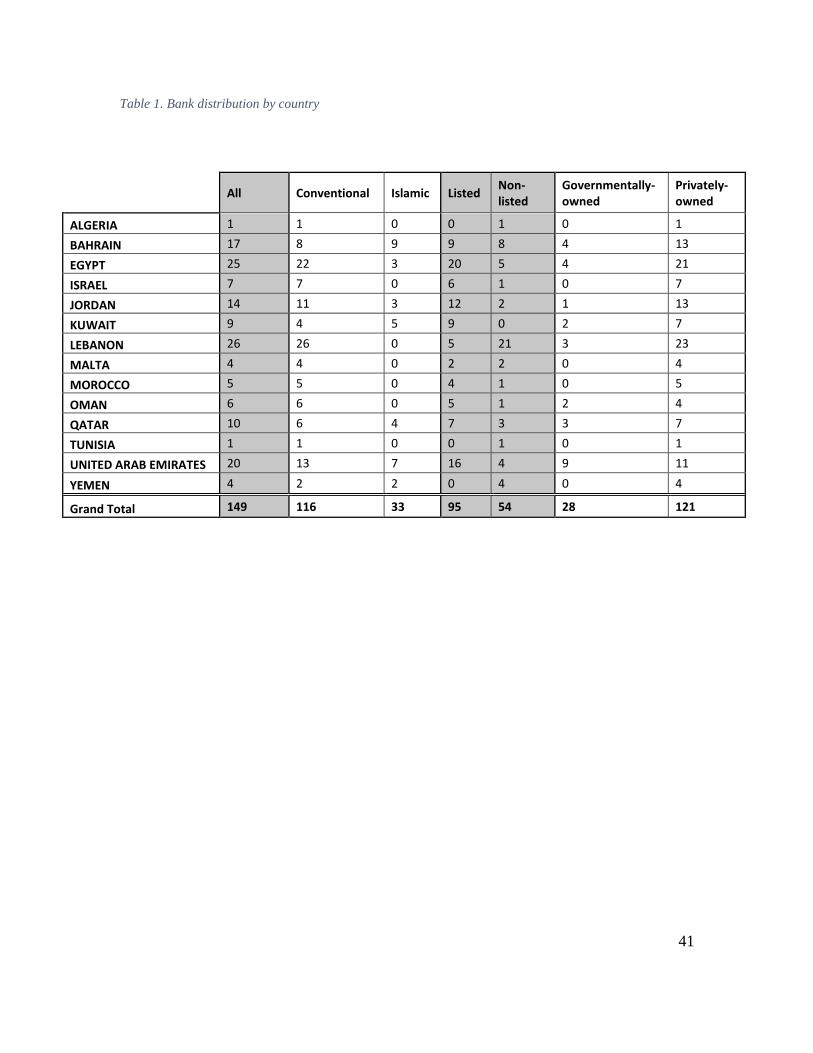
41
Table 1. Bank distribution by country
All Conventional Islamic Listed
Non-listed
Governmentally-owned
Privately-owned
ALGERIA 1 1 0 0 1 0 1
BAHRAIN 17 8 9 9 8 4 13
EGYPT 25 22 3 20 5 4 21
ISRAEL 7 7 0 6 1 0 7
JORDAN 14 11 3 12 2 1 13
KUWAIT 9 4 5 9 0 2 7
LEBANON 26 26 0 5 21 3 23
MALTA 4 4 0 2 2 0 4
MOROCCO 5 5 0 4 1 0 5
OMAN 6 6 0 5 1 2 4
QATAR 10 6 4 7 3 3 7
TUNISIA 1 1 0 0 1 0 1
UNITED ARAB EMIRATES 20 13 7 16 4 9 11
YEMEN 4 2 2 0 4 0 4
Grand Total 149 116 33 95 54 28 121

42
Table 2. Descriptive statistics
Variable Obs Mean Std.
Dev. Min Max Median Sources
Dependent Variables
TCR Total capital adequacy ratio 1307 18.665 7.334 5.95 49.660 16.7
BankScope and
authors'
calculations
EQTA Equity to total assets ratio 1307 13.160 8.544 2.808 73 11.22
BankScope and
authors'
calculations
Institutional Variables
PS Political stability 1307 -0.423 1060 -2.527 1.393 -1 World Governance
Indicators, World Bank
GC Getting credit 1150 40397 19860 12.500 87.5 43.75
Doing Business
Creditors' Rights
Database
RI Resolving Insolvency 1212 35074 10322 17.130 65.240 31.8
Doing Business
Creditors' Rights
Database
EF Economic freedom 1262 64197 6124 49.600 77.7 64.4 World Heritage
Foundation
FO Financial openness 1262 66557 8773 29.300 85.400 66.3
World Heritage
Foundation and
authors'
calculations
CPI Corruption perception index 1307 46578 14760 18 77 48 Transparency
International
Bank-Level Variables
ROA Return on assets ratio 1272 1.381 1.373 -5.761 8.501 1.230
BankScope and
authors'
calculations
ZSCORE Probability of Insolvency 1036 1.903 1 0 4.285 1.87
BankScope and
authors'
calculations
CONC Bank concentration 1307 0.173 0.074 0.082 0.429 0.139
BankScope and
authors'
calculations
SIZE Logarithm of total assets 1307 15.24 1394 10.494 18.050 15.270
BankScope and
authors'
calculations
Islamic Dummy variable for Islamic banks 1307 0.17 0.383 0 1 0 Authors’ Calculations
Gov
Dummy variable for Government-owned banks
1307 0.207 0.405 0 1 0 Authors’ Calculations
Listed Dummy variable for Large banks 1307 0.647 0.477 0 1 1 Authors’ Calculations
Other Country-Level Variables
GDP GDP growth rate 1283 4741 4201 -15.088 26.170 4.330 World Development
Indicators
REG Regulatory stringency 1307 1407 1400 0 3 1
World Bank
Regulation and
Supervisory Database;
(Barth et al. 2004,
2008, 2013).
DEP_INS Deposit insurance 1307 0.545 0.498 0 1 1
World Bank Database;
Barth
et al. (2003)
This table reports the descriptive statistics of our sample which extends from 2004 to 2014. All the ratios are expressed in percentages. Size is the natural logarithm of total assets which
is in thousand U.S Dollars.

43
Table 3: Average values of Capital ratios by country over the sample period 2004-2014
2004 2005 2006 2007 2008 2009 2010 2011 2012 2013 2014
Algeria TCR 21.1 21.8 17.1 19.7 18.6 20.0 18.4 20.0 49.0 36.0
EQTA 10.1 11.0 8.8 9.9 8.7 10.6 10.8 11.9 0.0 33.5 32.2
Bahrain TCR 23.0 23.2 21.1 25.2 21.5 20.9 21.1 21.9 20.6 21.6 22.6
EQTA 13.7 18.7 15.9 22.8 21.9 19.8 15.9 18.5 21.0 25.8 25.6
Egypt TCR 12.7 15.7 14.0 12.8 12.6 20.5 19.0 18.2 16.3 16.4 16.7
EQTA 7.4 7.9 8.7 7.9 7.9 10.8 10.1 9.5 10.0 10.1 10.3
Israel TCR 11.8 11.9 12.1 11.7 12.8 14.5 14.4 14.4 15.2 15.2 15.1
EQTA 5.8 5.5 6.0 5.9 5.7 6.3 6.1 5.8 6.1 5.9 5.9
Jordan TCR 17.5 18.1 20.4 18.9 20.3 19.1 19.8 17.9 20.4 20.0 20.1
EQTA 11.1 12.5 14.3 13.4 15.7 13.8 13.2 13.3 14.8 14.5 14.0
Kuwait TCR 16.5 19.3 18.7 18.9 17.1 16.1 20.4 19.9 19.9 22.6 19.6
EQTA 12.6 13.6 13.2 13.7 12.6 11.3 13.7 12.8 12.5 13.7 12.8
Lebanon TCR 23.1 24.6 24.9 22.9 22.1 16.6 15.1 12.3 13.5 14.7 15.1
EQTA 6.6 7.7 8.0 7.7 8.5 8.9 11.8 9.8 10.2 10.4 10.6
Malta TCR 16.1 16.7 14.2 14.2 22.6 16.8 15.9 15.4 13.2 13.8 14.1
EQTA 7.2 7.7 7.1 6.7 17.4 17.8 17.0 16.7 7.0 7.4 8.3
Morocco TCR 8.5 12.6 10.8 8.9 11.2 11.2 12.2 11.9 13.1 13.6 13.6
EQTA 8.7 8.8 8.4 7.8 7.6 8.7 9.8 9.4 10.0 9.9 10.6
Oman TCR 18.1 19.7 16.5 15.0 14.0 14.7 15.0 14.7 15.4 15.9 19.6
EQTA 12.9 15.2 13.7 13.7 13.6 13.5 13.6 12.0 11.9 12.4 17.6
Qatar TCR 28.2 21.8 18.0 20.0 18.4 18.1 20.9 21.1 17.3 17.2 17.1
EQTA 18.1 19.7 17.2 19.5 19.0 18.1 19.1 18.2 16.5 15.4 17.6
Tunisia TCR 24.0 27.2 24.9 28.6 28.7 26.5 22.2 31.5
EQTA 7.4 9.2 7.9 7.2 7.1 9.2 3.7 8.3
UAE TCR 22.5 27.1 19.7 18.1 16.7 21.4 21.8 22.4 22.3 20.8 18.9
EQTA 23.0 21.8 16.7 14.9 14.6 15.7 15.6 16.6 17.1 16.5 15.6
Yemen TCR 46.0 11.6 29.3 26.5 16.3 17.3 17.7 22.1 28.6 25.2 29.5
EQTA 8.0 8.0 10.2 13.8 15.6 11.8 11.2 12.9 11.0 9.6 9.2
MENA Average
TCR 20.0 20.5 19.3 19.6 18.6 18.3 18.4 17.9 17.9 18.4 18.3
EQTA 11.6 12.7 12.0 13.3 14.0 13.2 13.2 12.8 13.0 13.7 14.3
MENA Count
TCR 77 81 95 101 107 129 135 141 149 149 143
EQTA 77 81 95 101 107 129 135 141 149 149 143
TCR is the total capital adequacy ratio calculated as the sum of Tier 1 and Tier 2 capital to total risk weighted assets.
EQTA is the equity to total unweighted assets ratio.

44
Table 4: Average values of institutional variables by country over the sample period 2004-2014
PS GC RI EF FO CPI
Algeria -1.37 21.25 54.72 55.34 48.73 30.50
Bahrain -0.36 38.39 42.91 74.94 77.94 53.08
Egypt -0.80 37.50 20.92 54.89 49.36 31.50
Israel -1.27 86.25 55.92 65.51 69.73 61.50
Jordan -0.35 13.75 29.21 66.18 66.22 49.25
Kuwait 0.28 47.50 32.80 65.89 64.29 44.92
Lebanon -1.29 37.50 32.28 59.20 66.38 28.67
Malta 1.27 18.75 42.16 58.73
Morocco -0.37 34.38 34.42 59.38 52.40 34.42
Oman 0.78 40.00 37.88 66.42 63.16 53.17
Qatar 1.00 27.68 57.72 65.52 61.28 64.67
Tunisia -0.08 37.50 55.89 59.82 44.27 43.67
United Arab Emirates 0.86 43.75 29.98 69.19 62.19 63.00
Yemen -1.82 13.75 25.07 51.10 48.03 22.92
PS is the measure of political stability. GC is the first component of creditors’ rights and measures the ease of getting
credit. RI is the other component of the creditors’ rights index and it accounts for the ease of resolving insolvency, as
well as liquidation. EF is the economic freedom index. FO is a measure of financial openness and includes financial
and trade freedom. CPI is a corruption perception index accounting for the level of perceived corruption in each
country.

45
Table 5: Correlation matrix
ROA ZSCORE CONC GDP SIZE REG DEP_INS PS GC RI EF FO CPI
ROA 1
ZSCORE 0.1059 1
CONC 0.0805 -0.0913 1
GDP 0.233 0.0533 0.1309 1
SIZE -0.0197 0.1566 -0.015 0.0172 1
REG -0.025 0.1069 -0.0549 -0.2232 0.199 1
DEP_INS -0.087 0.1058 0.2036 -0.1176 -0.3024 -0.1863 1
PS 0.2324 0.0181 0.1695 0.2027 0.1975 0.0896 -0.399 1
GC -0.1264 0.0533 -0.2512 -0.1967 0.2857 0.322 -0.3715 0.0153 1
RI 0.0267 0.0261 0.1451 0.0463 0.0247 0.1401 0.0344 0.0672 0.1536 1
EF 0.0618 0.0738 -0.0044 0.1039 0.0949 0.2051 0.0059 0.4547 0.2788 0.1267 1
FO -0.0439 0.1161 -0.113 0.0612 0.0522 0.1502 0.3196 -0.0268 0.3479 -0.0651 1 1
CPI 0.1995 0.0151 0.1505 0.183 0.2505 0.2528 -0.3655 0.7766 0.2528 0.2653 0.7132 0.305 1

46
Table 6: Mean tests – TCR: High versus low institutional development
TCR
PS
Low (N=990) 19
High (N=946) 19.29
t-stat -2.15**
GC
Low (N=649) 20.41
High (N=758) 17.16
t-stat 8.36***
RI
Low (N=765) 19.46
High (N=596) 17.63
t-stat 4.51***
EF
Low (N=724) 18.38
High (N=1361) 19.06
t-stat -1.91***
FO
Low (N=573) 19.1
High (N=1500) 18.77
t-stat 0.85
CPI
Low (N=629) 18.19
High (N=1040) 19.32
t-stat -2.93***
This table represents a two group T-test on TCR between countries with high institutional development compared to countries with low institutional development.

47
Table 7: The impact of institutional variables on bank capital - Main Regression
(1) (2) (3) (4) (5) (6) (7) (8) (9) (10) (11) (12) (13) (14)
Panel A: TCR Panel B: EQTA
PS 0.883* -0.348
(1.91) (-1.35)
GC -0.0867*** 0.0091
(-5.02) (1.24)
RI
-0.232*** -0.0483*
(-3.47) (-1.72)
EF 0.465*** 0.0307
(6.24) (0.90)
FO 0.430*** 0.00291
(10.07) (0.14)
CPI 0.143*** 0.0328*
(3.82) (1.93)
IFI 6.196*** 0.440
(8.50) (1.35)
CRT -2.407*** 0.265
(-5.63) (1.47)
CONC 0.829 0.315 7.794 9.131 -8.486 2.866 9.032 -3.136 -3.296 -3.650 -2.096 -2.726 -2.750 -3.723
(0.13) (0.04) (0.93) (1.41) (-1.37) (0.46) (1.10) (-1.09) (-0.93) (-1.04) (-0.70) (-0.93) (-0.96) (-1.04)
GDP 0.0141 0.0306 0.0269 0.0114 0.0226 0.00779 0.0105 -0.00788 0.000221 -0.00255 -0.00405 -0.00389 -0.00842 -0.00138
(0.31) (0.62) (0.54) (0.25) (0.51) (0.17) (0.22) (-0.38) (0.01) (-0.12) (-0.19) (-0.19) (-0.41) (-0.07)
REG 0.00824 -0.138 -0.347 0.175 0.176 -0.0203 -0.127 0.119 0.259*** 0.143 0.137 0.126 0.114 0.306***
(0.04) (-0.66) (-1.50) (0.86) (0.90) (-0.10) (-0.61) (1.32) (3.01) (1.46) (1.48) (1.37) (1.27) (3.42)
SIZE -4.869*** -4.517***
-3.667***
-4.584***
-4.529***
-5.249*** -4.385***
-3.927***
-5.066***
-4.365***
-4.118***
-4.134***
-4.120***
-4.992***
(-8.22) (-6.71) (-5.94) (-7.89) (-8.05) (-8.91) (-6.76) (-13.32) (-15.13) (-14.05) (-13.98) (-14.03) (-14.12) (-14.93)

48
ROA -0.558** -0.602** -0.535** -0.436** -0.328 -0.469** -0.245 1.058*** 1.304*** 1.393*** 1.066*** 1.058*** 1.080*** 1.337***
(-2.52) (-2.40) (-2.12) (-1.96) (-1.53) (-2.13) (-1.01) (10.62) (12.61) (13.22) (10.53) (10.44) (10.80) (12.73)
ZSCORE 0.0923 0.171 0.0886 0.0573 0.0916 0.0706 0.0802 0.0233 0.0551 -0.0156 0.0136 0.0162 0.0106 0.0451
(0.51) (0.92) (0.48) (0.32) (0.53) (0.40) (0.45) (0.29) (0.72) (-0.20) (0.17) (0.20) (0.13) (0.59)
DEP_INS 7.946 5.169 15.11*** 8.101 11.96** 7.477 9.876* 4.694 3.309 5.156 4.380 4.396 4.494 2.698
(1.30) (0.86) (2.60) (1.35) (2.04) (1.18) (1.67) (1.07) (0.62) (1.06) (0.96) (0.96) (1.00) (0.51)
Islamic -0.975 -1.391 -1.321 -0.975 -0.862 -1.099 -1.321 -0.177 -0.553 -0.465 -0.243 -0.243 -0.226 -0.547
(-0.51) (-0.74) (-0.77) (-0.52) (-0.47) (-0.55) (-0.72) (-0.13) (-0.33) (-0.31) (-0.17) (-0.17) (-0.16) (-0.33)
Gov 4.341** 3.748** 3.419** 4.045** 4.277** 4.665** 3.652** 3.935*** 4.433*** 4.029*** 4.063*** 4.082*** 4.089*** 4.371***
(2.40) (2.11) (2.09) (2.27) (2.47) (2.48) (2.09) (3.07) (2.86) (2.87) (3.05) (3.06) (3.10) (2.84)
Listed 4.772*** 3.846** 3.458** 4.592** 4.364** 5.108*** 3.860** 2.595** 2.939* 2.447* 2.610* 2.618* 2.776** 2.818*
(2.63) (2.15) (2.10) (2.55) (2.49) (2.72) (2.17) (2.03) (1.89) (1.73) (1.93) (1.93) (2.11) (1.80)
Constant 88.30*** 89.09*** 76.53*** 56.25*** 59.84*** 88.75*** 86.39*** 66.41*** 82.54*** 74.74*** 67.90*** 69.82*** 68.56*** 83.04***
(9.44) (8.65) (7.95) (5.45) (6.53) (9.76) (8.63) (13.85) (15.39) (14.85) (12.88) (14.18) (14.77) (15.39)
Observations 1015 894 943 985 985 1015 888 1015 894 943 985 985 1015 888
Groups 149 147 148 146 146 149 144 149 147 148 146 146 149 144
Time fixed effects YES YES YES YES YES YES YES YES YES YES YES YES YES YES
Country fixed effects YES YES YES YES YES YES YES YES YES YES YES YES YES YES
This table reports the main regression results of bank capital determinants and the effect of institutional variables using the Hausman-Taylor model for the period 2004-2014. The
dependent variables are TCR; the total capital adequacy ratio (column 1 to 7) and EQTA; equity to total assets ratio (column 8 to 14). The independent variables are the following:
PS is the measure of political stability. GC is a component of creditor’s rights and measures the ease of getting credit. RI is another component of creditor’s rights and it accounts
for the ease of resolving insolvency, as well as liquidation. EF is the economic freedom index. FO is a measure of financial openness and includes financial and trade freedom. CPI
is a corruption perception index. IFI is the institutional index we compute, it is the first principal component of PS, FO, EF, CPI. CRT is the creditor’s rights index which is the
principal component of two indexes: GC and RI. CONC is a measure of bank concentration calculated using the Herfindahl-Hirschman index on total assets. GDP measures the
annual GDP Growth rate. REG is a score which measures the stringency of a country’s capital regulatory jurisdiction. SIZE is calculated by the log of the total assets held by a
bank. ROA is the return on average assets. ZSCORE is a measure of the risk of default. DEP_INS is a dummy which takes the value of 1 for an explicit deposit insurance system
and 0 for an implicit deposit insurance scheme. Islamic, Gov, and Listed are dummy variables for Islamic banks, government-owned banks, and listed banks respectively. All the
ratios are expressed in percentages. Size is the natural logarithm of total assets which is in thousand U.S Dollars. Reported beneath each coefficient estimate is the t-statistic
adjusted for clustering at the bank level. *, ** and *** indicate statistical significance at the 10%, 5% and 1% levels, respectively.

49
Table 8: The impact of institutional variables on bank capital – Underdeveloped Stock Markets
(1) (2) (3) (4) (5) (6) (7) (8) (9) (10) (11) (12)
Panel A: TCR Panel B: EQTA
PS -0.290 -0.470
(-0.22) (-0.97)
GC -0.258*** 0.0327
(-3.12) (1.22)
RI -0.532*** -0.0440
(-4.03) (-0.91)
EF 1.054*** 0.140**
(5.81) (2.07)
FO 0.763*** 0.084
(8.04) (0.81)
CPI 0.468*** 0.0765**
(5.58) (2.45)
Constant 9.691 17.88 21.52 -46.68*** -30.37** 4.781 28.78*** 52.46*** 36.88*** 27.43*** 29.63*** 31.28***
(0.60) (0.99) (1.35) (-2.65) (-1.98) (0.32) (3.72) (5.86) (4.75) (3.26) (3.79) (4.29)
Controls YES YES YES YES YES YES YES YES YES YES YES YES
Time fixed effects YES YES YES YES YES YES YES YES YES YES YES YES
Country fixed effects YES YES YES YES YES YES YES YES YES YES YES YES
Observations 367 332 358 352 352 367 367 332 358 352 352 367
Groups 75 75 75 72 72 75 75 75 75 72 72 75
This table reports the main regression results of bank capital determinants and the effect of institutional variables for a sub-sample of underdeveloped stock market. Model
estimated using the Hausman-Taylor methodology for the period 2004-2014. The dependent variables are TCR; the total capital ratio (column 1 to 6) and EQTA; equity to total
assets ratio (column 7 to 12). PS is the measure of political stability. GCREDIT is the first component of creditors’ rights and measures the ease of getting credit. RI is the other
component of the creditors’ rights index and it accounts for the ease of resolving insolvency, as well as liquidation. EF is the economic freedom index. FO is a measure of financial
openness and includes financial and trade freedom. CPI is a corruption perception index. Reported beneath each coefficient estimate is the t-statistic adjusted for clustering at the
bank level. *, ** and *** indicate statistical significance at the 10%, 5% and 1% levels, respectively.

50
Table 9: The impact of institutional variables on bank capital – Developed Stock Markets
(1) (2) (3) (4) (5) (6) (7) (8) (9) (10) (11) (12)
Panel A: TCR Panel B: EQTA
PS -0.885 1.177**
(-0.85) (1.99)
GC 0.0737* 0.0756***
(1.91) (3.97)
RI -0.103 -0.0686
(-0.92) (-1.21)
EF 0.0480 0.0472
(0.36) (0.62)
FO -0.00738 -0.0357
(-0.09) (-0.78)
CPI 0.0506 0.0348***
(0.77) (2.74)
Constant 68.66*** 50.19*** 55.33*** 67.63*** 70.89*** 69.59*** 79.31*** 103.8*** 106.9*** 80.32*** 83.54*** 82.39***
(5.57) (3.66) (4.14) (4.51) (5.53) (5.63) (8.93) (10.51) (10.83) (7.97) (9.19) (9.28)
Controls YES YES YES YES YES YES YES YES YES YES YES YES Time fixed effects YES YES YES YES YES YES YES YES YES YES YES YES Country fixed effects YES YES YES YES YES YES YES YES YES YES YES YES
Observations 409 353 364 394 394 409 409 353 364 394 394 409
Groups 98 94 94 95 95 98 98 94 94 95 95 98
This table reports the main regression results of bank capital determinants and the effect of institutional variables for a sub-sample of developed stock market. Model estimated
using the Hausman-Taylor methodology for the period 2004-2014. The dependent variables are TCR; the total capital ratio (column 1 to 6) and EQTA; equity to total assets ratio
(column 7 to 12). PS is the measure of political stability. GCREDIT is the first component of creditors’ rights and measures the ease of getting credit. RI is the other component of
the creditors’ rights index and it accounts for the ease of resolving insolvency, as well as liquidation. EF is the economic freedom index. FO is a measure of financial openness and
includes financial and trade freedom. CPI is a corruption perception index. Reported beneath each coefficient estimate is the t-statistic adjusted for clustering at the bank level. *,
** and *** indicate statistical significance at the 10%, 5% and 1% levels, respectively.

51
Table 10a: The impact of institutional variables on bank capital – - Stock Market Development further sub-sampling: Small versus large banks
High MKGDP Low MKGDP High MKGDP Low MKGDP
Small Banks Large Banks
TCR EQTA TCR EQTA TCR EQTA TCR EQTA
PS -1.558 -9.757*** -3.766 1.031 -0.295 -0.0448 1.238 0.0615
(-0.30) (-3.90) (-0.96) (1.28) (-0.31) (-0.09) (1.00) (0.11)
GC 1.069 0.0371
0.451
-0.431*
0.0828** 0.0746***
-0.145** 0.0215
(1.48) (0.10) (0.34) (-1.90) (2.44) (4.24) (-1.98) (0.69)
RI -0.0206 -1.118* 6.736 0.578 -0.0965 -0.0669 -0.414*** -0.00349
(-0.02) (-1.91) (0.70) (0.27) (-0.99) (-1.31) (-3.59) (-0.07)
EF 1.168 -0.113 1.631 -0.238 0.0633 0.119* 0.705*** 0.0323
(1.24) (-0.24) (0.62) (-0.43) (0.53) (1.88) (4.32) (0.43)
FO -0.275 -0.483** 0.201 -0.141 0.128* 0.0897** 0.654*** 0.0918**
(-0.62) (-2.32) (0.31) (-1.06) (1.74) (2.31) (7.27) (2.10)
CPI 0.314 -0.0246 0.625 -0.160 0.145** 0.134*** 0.437*** 0.137***
(0.86) (-0.13) (0.93) (-1.16) (2.17) (3.84) (5.62) (3.85)
This Table shows whether small versus large banks behave differently when markets are developed or underdeveloped. Model
estimated using the Hausman-Taylor methodology for the period 2004-2014. Controls as well as year and country dummy variables
are included for all the estimations but are not reported. The dependent variables are TCR; the total capital ratio (column 1 to 6) and
EQTA; equity to total assets ratio (column 7 to 12). MKGDP is the market capital to GDP indicator of stock market development.
PS is the measure of political stability. GC is the first component of creditors’ rights and measures the ease of getting credit. RI is
the other component of the creditors’ rights index and it accounts for the ease of resolving insolvency, as well as liquidation. EF is
the economic freedom index. FO is a measure of financial openness and includes financial and trade freedom. CPI is a corruption
perception index accounting for the level of perceived corruption in each country. Year and country dummy variables are included
for all the estimations but are not reported. Reported beneath each coefficient estimate is the t-statistic adjusted for clustering at the
bank level. *, ** and *** indicate statistical significance at the 10%, 5% and 1% levels, respectively.

52
Table 10b: The impact of institutional variables on bank capital – - Stock Market Development further sub-sampling: Non-listed versus listed banks
High MKGDP Low MKGDP High MKGDP Low MKGDP
Non-Listed Banks Listed Banks
TCR EQTA TCR EQTA TCR EQTA TCR EQTA
PS -4.316* -3.767** -5.970* -0.500 0.00202 -0.291 2.424 -0.175
(-1.77) (-2.44) (-1.79) (-0.65) (0.00) (-0.46) (1.64) (-0.25)
GC -0.237** 0.0347
-0.429*
-0.0131
0.112*** 0.0668***
-0.0877 0.0546
(-2.14) (0.54) (-1.87) (-0.25) (2.74) (3.22) (-0.96) (1.50)
RI -0.144 -0.110 -2.889** -0.276 -0.0650 -0.0244 -0.539*** -0.0572
(-0.58) (-0.79) (-2.35) (-0.96) (-0.52) (-0.39) (-4.48) (-0.97)
EF -0.418 -0.181 1.722*** 0.161 0.183 0.115 0.914*** 0.155*
(-1.26) (-0.81) (2.65) (1.06) (1.26) (1.51) (5.05) (1.71)
FO -0.604*** -0.295** 0.803*** 0.0580 0.255*** 0.114** 0.832*** 0.133**
(-3.22) (-2.27) (2.85) (0.87) (2.82) (2.36) (8.68) (2.51)
CPI -0.249 -0.0704 0.598 0.0239 0.164** 0.130*** 0.448*** 0.114***
(-1.51) (-0.64) (1.52) (0.26) (2.16) (3.25) (5.51) (2.82)
This Table shows whether non-listed versus listed banks behave differently when markets are developed or underdeveloped. Model
estimated using the Hausman-Taylor methodology for the period 2004-2014. Controls as well as year and country dummy variables are
included for all the estimations but are not reported. The dependent variables are TCR; the total capital ratio (column 1 to 6) and EQTA;
equity to total assets ratio (column 7 to 12). MKGDP is the market capital to GDP indicator of stock market development. PS is the
measure of political stability. GC is the first component of creditors’ rights and measures the ease of getting credit. RI is the other
component of the creditors’ rights index and it accounts for the ease of resolving insolvency, as well as liquidation. EF is the economic
freedom index. FO is a measure of financial openness and includes financial and trade freedom. CPI is a corruption perception index
accounting for the level of perceived corruption in each country. Year and country dummy variables are included for all the estimations
but are not reported. Reported beneath each coefficient estimate is the t-statistic adjusted for clustering at the bank level. *, ** and ***
indicate statistical significance at the 10%, 5% and 1% levels, respectively.

53
Table 10c: The impact of institutional variables on bank capital – Stock Market Development further sub- sampling: Conventional versus Islamic banks
High MKGDP Low MKGDP High MKGDP Low MKGDP
Conventional Banks Islamic Banks
TCR EQTA TCR EQTA TCR EQTA TCR EQTA
PS -0.738 -1.162** -0.119 -0.414 23.87*** -1.129 -21.29 -9.772
(-0.66) (-2.09) (-0.09) (-0.86) (4.76) (-0.24) (-1.17) (-0.51)
GC 0.0831* 0.0576*** -0.267*** 0.0268 -0.0711 0.0435 -0.466 -0.162
(1.95) (2.79) (-3.10) (1.02) (-0.62) (0.50) (-0.92) (-0.32)
RI -0.0779 -0.0802
-0.568*** -0.0328
1.556
-0.0618
-2.228 -1.023
(-0.70) (-1.47) (-3.82) (-0.63) (0.78) (-0.04) (-1.17) (-0.51)
EF 0.150 0.0973 1.101*** 0.166** -0.958 0.0671 -0.641 -0.294
(1.12) (1.44) (5.51) (2.33) (-1.21) (0.11) (-1.17) (-0.51)
FO -0.00175 0.0222 0.761*** 0.111*** 0.511 0.0222 -28.56 -13.11
(-0.02) (0.08) (7.51) (2.95) (1.46) (0.08) (-1.17) (-0.51)
CPI 0.0876 -0.0519
0.472*** 0.0858***
0.00433
-0.0519
-8.777 -4.028
(1.25) (-0.15) (5.13) (2.62) (0.01) (-0.15) (-1.17) (-0.51)
This Table shows whether conventional versus Islamic banks behave differently when markets are developed or underdeveloped.
Model estimated using the Hausman-Taylor methodology for the period 2004-2014. Controls as well as year and country dummy
variables are included for all the estimations but are not reported. The dependent variables are TCR; the total capital ratio (column 1
to 6) and EQTA; equity to total assets ratio (column 7 to 12). MKGDP is the market capital to GDP indicator of stock market
development. PS is the measure of political stability. GC is the first component of creditors’ rights and measures the ease of getting
credit. RI is the other component of the creditors’ rights index and it accounts for the ease of resolving insolvency, as well as
liquidation. EF is the economic freedom index. FO is a measure of financial openness and includes financial and trade freedom. CPI
is a corruption perception index accounting for the level of perceived corruption in each country. Year and country dummy variables
are included for all the estimations but are not reported. Reported beneath each coefficient estimate is the t-statistic adjusted for
clustering at the bank level. *, ** and *** indicate statistical significance at the 10%, 5% and 1% levels, respectively

54
Table 11: The impact of institutional variables on bank capital – Large/Small
(1) (2) (3) (4) (5) (6) (7) (8) (9) (10) (11) (12)
Panel A: TCR Panel B: EQTA
Large (β1) -3.471*** -5.491*** -14.53*** 3.497 -12.36 -7.505*** -1.357*** -1.495** -2.286 -7.272** -2.237 -0.335
(-3.87) (-4.31) (-4.45) (0.62) (-1.47) (-3.27) (-3.11) (-2.49) (-1.46) (-2.52) (-0.53) (-0.29)
PS (β2) -1.020 -0.418
(-1.22) (-1.04)
PS*Large (β3) 0.296 -0.742**
(0.44) (-2.25)
GC (β2) 0.0444 0.0180
(1.14) (0.96)
GC*Large (β3) -0.143*** -0.0146
(-3.51) (-0.76)
RI (β2) 0.327*** 0.0394
(3.22) (0.81)
RI*Large (β3) -0.535*** -0.0759
(-4.47) (-1.34)
FO (β2) -0.100 0.0962**
(-1.18) (2.21)
FO*Large (β3) 0.522*** -0.0790*
(5.70) (-1.69)
EF (β2) 0.142 0.0214
(1.05) (0.32)
EF*Large (β3) 0.322** 0.0305
(2.09) (0.40)

55
CPI (β2) 0.0948* -0.0132
(1.80) (-0.50)
CPI*Large (β3) -0.000401 0.00604
(-0.01) (0.20)
Constant 17.31*** 27.54*** 35.39*** -11.80* -0.543 18.75*** 7.742*** 9.183*** 11.61*** 14.28*** 7.026 8.498***
(7.31) (9.81) (8.57) (-1.86) (-0.06) (5.72) (5.38) (5.69) (5.40) (4.27) (1.43) (4.64)
Controls YES YES YES YES YES YES YES YES YES YES YES YES
Time fixed effects YES YES YES YES YES YES YES YES YES YES YES YES
Country fixed effects YES YES YES YES YES YES YES YES YES YES YES YES
Observations 1015 894 943 985 985 1015 1015 894 943 985 985 1015
Groups 149 147 148 146 146 149 149 147 148 146 146 149
Wald P-value 0.23 0.00 0.00 0.00 0.00 0.07 0.00 0.69 0.26 0.46 0.18 0.62
(β2) + (β3) -0.72 -0.10 -0.21 0.42 0.46 0.19 -1.159 0.00 -0.04 0.02 0.05 -0.03
This Table shows whether institutional variables influence differently capital ratios of large banks versus small banks. Model estimated using the Hausman-Taylor methodology
for the period 2004-2014. The dependent variables are TCR; the total capital ratio (column 1 to 6) and EQTA; equity to total assets ratio (column 7 to 12). Large is a dummy which
takes the value of 1 for a large bank and zero for a small one. PS is the measure of political stability. GC is the first component of creditors’ rights and measures the ease of getting
credit. RI is the other component of the creditors’ rights index and it accounts for the ease of resolving insolvency, as well as liquidation. EF is the economic freedom index. FO is
a measure of financial openness and includes financial and trade freedom. CPI is a corruption perception index accounting for the level of perceived corruption in each country.
Reported beneath each coefficient estimate is the t-statistic adjusted for clustering at the bank level. *, ** and *** indicate statistical significance at the 10%, 5% and 1% levels,
respectively.

56
Table 12: The impact of institutional variables on bank capital – Government-owned/Non- Government-Owned
(1) (2) (3) (4) (5) (6) (7) (8) (9) (10) (11) (12)
Panel A: TCR Panel B: EQTA
Gov (β1) 4.205** 1.828 7.585* 5.713 -2.040 6.702* 3.925*** 4.383*** 2.597 3.939 7.014* 5.856***
(2.35) (0.87) (1.86) (1.16) (-0.26) (1.76) (3.05) (2.70) (1.11) (1.51) (1.80) (2.79)
PS (β2) 0.361 -0.313
(0.59) (-1.12)
PS*Gov (β3) -1.480 -0.154
(-1.56) (-0.32)
GC (β2) -0.0966*** 0.0182**
(-5.26) (2.39)
GC*Gov (β3) 0.0418 -0.000575
(1.51) (-0.05)
RI (β2) -0.220*** -0.0524*
(-3.23) (-1.83)
RI*Gov (β3) -0.117 0.0370
(-1.13) (0.71)
FO (β2) 0.434*** 0.00217
(9.50) (0.10)
FO*Gov (β3) -0.0209 0.00232
(-0.30) (0.07)
EF (β2) 0.439*** 0.0420
(5.46) (1.14)
EF*Gov (β3) 0.0943 -0.0443
(0.81) (-0.79)
CPI (β2) 0.154*** 0.0424**

57
(3.70) (2.20)
CPI*Gov (β3) -0.0403 -0.0350
(-0.61) (-1.07)
Constant 86.93*** 86.31*** 76.75*** 60.56*** 58.38*** 87.99*** 66.19*** 82.19*** 74.68*** 70.02*** 67.40*** 67.87***
(9.33) (8.45) (7.97) (6.59) (5.58) (9.64) (13.73) (15.34) (14.83) (14.19) (12.65) (14.53)
Controls YES YES YES YES YES YES YES YES YES YES YES YES
Time fixed effects YES YES YES YES YES YES YES YES YES YES YES YES
Country fixed effects YES YES YES YES YES YES YES YES YES YES YES YES
Observations 1015 894 943 985 985 1015 1015 894 943 985 985 1015
Groups 149 147 148 146 146 149 149 147 148 146 146 149
Wald P-value 0.23 0.05 0.00 0.00 0.00 0.54 0.30 0.12 0.78 0.89 0.97 0.28
(β2) + (β3) -1.12 -0.05 -0.34 0.41 0.53 -0.08 -0.47 0.02 -0.02 0.00 0.00 -0.07
This Table shows whether institutional variables influence differently government-owned banks versus non-government-owned banks. Model estimated using the Hausman-Taylor
methodology for the period 2004-2014. The dependent variables are TCR; the total capital ratio (column 1 to 6) and EQTA; equity to total assets ratio (column 7 to 12). Gov is a
dummy which takes the value of 1 for a government-owned bank and zero otherwise. PS is the measure of political stability. GC is the first component of creditors’ rights and
measures the ease of getting credit. RI is the other component of the creditors’ rights index and it accounts for the ease of resolving insolvency, as well as liquidation. EF is the
economic freedom index. FO is a measure of financial openness and includes financial and trade freedom. CPI is a corruption perception index accounting for the level of
perceived corruption in each country. Reported beneath each coefficient estimate is the t-statistic adjusted for clustering at the bank level. *, ** and *** indicate statistical
significance at the 10%, 5% and 1% levels, respectively.

58
Table 13: The impact of institutional variables on bank capital – Islamic/Conventional
(1) (2) (3) (4) (5) (6) (7) (8) (9) (10) (11) (12)
Panel A: TCR Panel B: EQTA
Islamic (β1) -1.036 -5.657** -3.977 -25.70*** -7.318 -1.810 -0.129 -0.595 2.798 -11.03*** -2.674 -4.364*
(-0.55) (-2.30) (-0.86) (-3.23) (-0.79) (-0.38) (-0.09) (-0.33) (0.98) (-2.61) (-0.58) (-1.66)
PS (β2) -0.205 -0.426
(-0.35) (-1.60)
PS*Islamic (β3) 2.371* 0.794
(1.85) (1.16)
GC (β2) -0.0964*** 0.0180**
(-5.50) (2.47)
GC*Islamic (β3) 0.111*** 0.00140
(2.79) (0.08)
RI (β2) -0.237*** -0.0442
(-3.52) (-1.57)
RI*Islamic (β3) 0.0757 -0.0880
(0.63) (-1.32)
FO (β2) 0.409*** -0.00643
(9.49) (-0.32)
FO*Islamic (β3) 0.373*** 0.162***
(3.19) (2.69)
EF (β2) 0.449*** 0.0243
(5.69) (0.67)
EF*Islamic (β3) 0.0937 0.0356
(0.69) (0.54)
CPI (β2) 0.142*** 0.0224
(3.64) (1.25)
CPI*Islamic (β3) 0.0109 0.0785*

59
(0.13) (1.87)
Constant 86.98*** 92.83*** 77.27*** 62.91*** 57.52*** 88.09*** 66.15*** 82.56*** 74.32*** 71.25*** 68.55*** 69.39***
(9.34) (8.93) (7.98) (6.87) (5.42) (9.64) (13.79) (15.33) (14.65) (14.43) (12.60) (14.89)
Controls YES YES YES YES YES YES YES YES YES YES YES YES
Time fixed effects YES YES YES YES YES YES YES YES YES YES YES YES
Country fixed effects YES YES YES YES YES YES YES YES YES YES YES YES
Observations 1015 894 943 985 985 1015 1015 894 943 985 985 1015
Groups 149 147 148 146 146 149 149 147 148 146 146 149
Wald P-value 0.09 0.72 0.22 0.00 0.00 0.90 0.58 0.26 0.06 0.01 0.34 0.06
(β2) + (β3) 2.166 0.01 -0.16 0.78 0.54 0.02 0.37 0.02 -0.13 0.16 0.06 0.16
This Table shows whether institutional variables influence differently Islamic versus conventional banks. Model estimated using the Hausman-Taylor methodology for the period
2004-2014. The dependent variables are TCR; the total capital ratio (column 1 to 6) and EQTA; equity to total assets ratio (column 7 to 12). Gov is a dummy which takes the value
of 1 for a government-owned bank and zero otherwise. PS is the measure of political stability. GC is the first component of creditors’ rights and measures the ease of getting credit.
RI is the other component of the creditors’ rights index and it accounts for the ease of resolving insolvency, as well as liquidation. EF is the economic freedom index. FO is a
measure of financial openness and includes financial and trade freedom. CPI is a corruption perception index accounting for the level of perceived corruption in each country.
Reported beneath each coefficient estimate is the t-statistic adjusted for clustering at the bank level. *, ** and *** indicate statistical significance at the 10%, 5% and 1% levels,
respectively.

60
Table 14: The impact of institutional variables on bank capital – Listed/Non-listed
(1) (2) (3) (4) (5) (6) (7) (8) (9) (10) (11) (12)
Panel A: TCR Panel B: EQTA
Listed (β1) 4.852*** -4.734** -2.891 -8.941* -11.49 12.35*** 2.959** 2.717* 6.274*** -0.657 3.905 -0.398
(2.64) (-2.34) (-0.77) (-1.72) (-1.32) (3.35) (2.32) (1.68) (2.95) (-0.24) (0.89) (-0.19)
PS (β2) -0.159 -0.996***
(-0.21) (-2.79)
PS*Listed (β3) 0.317 1.094***
(0.37) (2.62)
GC (β2) -0.224*** 0.0146
(-9.81) (1.47)
GC*Listed (β3) 0.211*** 0.00535
(8.71) (0.51)
RI (β2) -0.371*** 0.0343
(-3.77) (0.77)
RI*Listed (β3) 0.179* -0.106**
(1.93) (-2.40)
FO (β2) 0.280*** -0.0339
(4.05) (-1.02)
FO*Listed (β3) 0.200*** 0.0493
(2.75) (1.39)
EF (β2) 0.252* 0.0477
(1.88) (0.74)
EF*Listed (β3) 0.248* -0.0205
(1.89) (-0.32)
CPI (β2) 0.260*** -0.0182
(4.10) (-0.59)
CPI*Listed (β3) -0.155** 0.0671**

61
(-2.30) (1.97)
Constant 87.91*** 95.67*** 86.12*** 75.53*** 70.96*** 82.12*** 64.93*** 82.63*** 70.14*** 73.57*** 66.75*** 71.52***
(9.35) (9.57) (8.16) (7.13) (5.58) (8.67) (13.52) (15.39) (13.09) (13.24) (10.47) (14.74)
Controls YES YES YES YES YES YES YES YES YES YES YES YES
Time fixed effects YES YES YES YES YES YES YES YES YES YES YES YES
Country fixed effects YES YES YES YES YES YES YES YES YES YES YES YES
Observations 1015 894 943 985 985 1015 1015 894 943 985 985 1015
Groups 149 147 148 146 146 149 149 147 148 146 146 149
Wald P-value 0.81 0.46 0.01 0.00 0.00 0.01 0.75 0.01 0.02 0.49 0.44 0.01
(β2) + (β3) 0.16 -0.01 -0.19 0.48 0.50 0.10 0.10 0.02 -0.07 0.02 0.03 0.05
This Table shows whether institutional variables influence differently listed versus non-listed banks. Model estimated using the Hausman-Taylor methodology for the period 2004-
2014. The dependent variables are TCR; the total capital ratio (column 1 to 6) and EQTA; equity to total assets ratio (column 7 to 12). Listed is a dummy which takes the value of
1 if the bank is listed on a stock exchange and zero otherwise. PS is the measure of political stability. GC is the first component of creditors’ rights and measures the ease of getting
credit. RI is the other component of the creditors’ rights index and it accounts for the ease of resolving insolvency, as well as liquidation. EF is the economic freedom index. FO is
a measure of financial openness and includes financial and trade freedom. CPI is a corruption perception index accounting for the level of perceived corruption in each country.
Reported beneath each coefficient estimate is the t-statistic adjusted for clustering at the bank level. *, ** and *** indicate statistical significance at the 10%, 5% and 1% levels,
respectively.

62
Appendix
Table 1: The impact of institutional variables on bank capital – Robustness Check: Tier1
(1) (2) (3) (4) (5) (6) (7)
TIER1
PS 1.017* (1.77) GC -0.0370** (-2.36) RI -0.0867 (-1.28) EF 0.250*** (3.25) FO 0.144*** (3.35) CPI 0.0581* (1.71) II 3.127***
(4.18)
CRT -1.485***
(-3.43)
CONC -2.464 1.821 2.579 2.182 -6.601 -1.812 5.098
(-0.44) (0.24) (0.35) (0.38) (-1.14) (-0.32) (0.69)
GDP -0.0452 -0.0208 -0.0214 -0.0323 -0.0389 -0.0520 -0.0253
(-1.10) (-0.45) (-0.47) (-0.78) (-0.94) (-1.25) (-0.55)
REG -0.309* -0.187 -0.289 -0.116 -0.166 -0.295 -0.117
(-1.71) (-0.97) (-1.41) (-0.62) (-0.91) (-1.64) (-0.60)
SIZE -5.107*** -4.010*** -4.001*** -5.340*** -5.566*** -5.535*** -3.814***
(-9.00) (-6.24) (-6.50) (-9.38) (-9.73) (-9.60) (-6.02)

63
ROA 0.123 0.207 0.287 0.135 0.163 0.184 0.248
(0.57) (0.84) (1.21) (0.63) (0.76) (0.85) (1.02)
ZSCORE 0.169 0.217 0.165 0.119 0.165 0.138 0.172
(1.06) (1.30) (1.02) (0.74) (1.04) (0.87) (1.04)
DEP_INS 1.538 0.341 4.212 1.540 3.162 1.593 3.812
(0.20) (0.05) (0.59) (0.19) (0.39) (0.20) (0.58)
Islamic 1.544 1.477 1.408 1.388 1.342 1.352 1.401
(0.79) (0.86) (0.80) (0.68) (0.64) (0.65) (0.83)
Gov 4.175** 3.143* 3.180* 4.405** 4.712** 4.617** 3.043*
(2.19) (1.85) (1.84) (2.23) (2.33) (2.30) (1.84)
Listed 3.618* 2.430 2.445 3.826** 3.939** 3.985** 2.353
(1.94) (1.46) (1.44) (1.98) (1.99) (2.03) (1.45)
Constant 91.69*** 77.42*** 77.32*** 80.38*** 91.48*** 97.22*** 73.59***
(10.07) (7.70) (7.97) (7.68) (9.83) (10.75) (7.40)
Time fixed effects YES YES YES YES YES YES YES
Country fixed effects YES YES YES YES YES YES YES
Observations 767 679 709 753 753 767 675
Groups 127 126 126 125 125 127 124
This table reports the main regression results of bank capital determinants and the effect of institutional variables using the
Hausman-Taylor model for the period 2004-2014. The dependent variable is the Tier1 capital ratio. The independent variables are
the following: PS is the measure of political stability. GC is a component of creditor’s rights and measures the ease of getting credit.
RI is another component of creditor’s rights and it accounts for the ease of resolving insolvency, as well as liquidation. EF is the
economic freedom index. FO is a measure of financial openness and includes financial and trade freedom. CPI is a corruption
perception index. IFI is the institutional index we compute, it is the first principal component of PS, FO, EF, CPI. CRT is the
creditor’s rights index which is the principal component of two indexes: GC and RI. CONC is a measure of bank concentration
calculated using the Herfindahl-Hirschman index on total assets. GDP measures the annual GDP Growth rate. REG is a score which
measures the stringency of a country’s capital regulatory jurisdiction. SIZE is calculated by the log of the total assets held by a
bank. ROA is the return on average assets. ZSCORE is a measure of the risk of default. DEP_INS is a dummy which takes the value
of 1 for an explicit deposit insurance system and 0 for an implicit deposit insurance scheme. Islamic, Gov, and Listed are dummy
variables for Islamic banks, government-owned banks, and listed banks respectively. All the ratios are expressed in percentages.
Size is the natural logarithm of total assets which is in thousand U.S Dollars. Reported beneath each coefficient estimate is the t-
statistic adjusted for clustering at the bank level. *, ** and *** indicate statistical significance at the 10%, 5% and 1% levels,
respectively.

64
Table 2: The impact of institutional variables on bank capital – Robustness Check: Capital Buffer
(1) (2) (3) (4) (5) (6) (7)
KBUFF
PS 0.474
(0.72)
GC -0.0928***
(-4.48)
RI -0.255***
(-3.37)
EF 0.319***
(6.43)
FO 0.349***
(4.08)
CPI 0.0411
(0.98)
II 4.407***
(5.41)
CRT -3.054***
(-5.76)
CONC -2.065 -19.49** -6.164 -9.477 3.827 -1.202 -11.66
(-0.29) (-2.01) (-0.67) (-1.33) (0.52) (-0.17) (-1.24)
GDP 0.228*** 0.382*** 0.349*** 0.238*** 0.235*** 0.223*** 0.367***
(4.48) (7.08) (6.37) (4.67) (4.53) (4.37) (6.97)
REG -0.757*** -0.854*** -1.021*** -0.624*** -0.624*** -0.774*** -0.911***
(-3.44) (-3.82) (-4.10) (-2.80) (-2.73) (-3.51) (-4.01)
SIZE -4.395*** -4.602*** -3.704*** -4.222*** -4.159*** -4.398*** -4.460***

65
(-6.86) (-6.21) (-5.56) (-6.78) (-6.60) (-6.93) (-6.18)
ROA -0.756*** -1.092*** -0.946*** -0.630** -0.689** -0.734*** -0.842***
(-2.86) (-3.70) (-3.21) (-2.39) (-2.57) (-2.76) (-2.89)
ZSCORE 0.255 0.310 0.238 0.257 0.254 0.257 0.271
(1.26) (1.54) (1.17) (1.28) (1.24) (1.28) (1.38)
DEP_INS 8.619 7.963 17.63*** 11.93** 8.352 8.644 12.96**
(1.45) (1.32) (2.96) (2.03) (1.42) (1.45) (2.19)
Islamic 0.147 -0.324 -0.165 0.157 0.125 0.130 -0.226
(0.08) (-0.18) (-0.10) (0.09) (0.07) (0.07) (-0.13)
Gov 4.004** 3.864** 3.497** 4.068** 3.787** 4.024** 3.728**
(2.36) (2.25) (2.20) (2.44) (2.27) (2.37) (2.21)
Listed 4.233** 3.858** 3.396** 4.036** 4.081** 4.225** 3.835**
(2.49) (2.22) (2.11) (2.39) (2.42) (2.48) (2.23)
Constant 73.37*** 84.72*** 70.82*** 52.85*** 48.54*** 71.23*** 80.66***
(7.28) (7.53) (6.83) (5.26) (4.33) (7.36) (7.28)
Time fixed effects YES YES YES YES YES YES YES
Country fixed effects YES YES YES YES YES YES YES
Observations 955 838 885 925 925 955 832
Groups 146 144 145 143 143 146 141 This table reports the main regression results of bank capital determinants and the effect of institutional variables using the Hausman-Taylor model for the
period 2004-2014. The dependent variable is KBUFF, the capital buffer ratio. The independent variables are the following: PS is the measure of political
stability. GC is a component of creditor’s rights and measures the ease of getting credit. RI is another component of creditor’s rights and it accounts for the
ease of resolving insolvency, as well as liquidation. EF is the economic freedom index. FO is a measure of financial openness and includes financial and
trade freedom. CPI is a corruption perception index. IFI is the institutional index we compute, it is the first principal component of PS, FO, EF, CPI. CRT
is the creditor’s rights index which is the principal component of two indexes: GC and RI. CONC is a measure of bank concentration calculated using the
Herfindahl-Hirschman index on total assets. GDP measures the annual GDP Growth rate. REG is a score which measures the stringency of a country’s
capital regulatory jurisdiction. SIZE is calculated by the log of the total assets held by a bank. ROA is the return on average assets. ZSCORE is a measure
of the risk of default. DEP_INS is a dummy which takes the value of 1 for an explicit deposit insurance system and 0 for an implicit deposit insurance
scheme. Islamic, Gov, and Listed are dummy variables for Islamic banks, government-owned banks, and listed banks respectively. All the ratios are
expressed in percentages. Size is the natural logarithm of total assets which is in thousand U.S Dollars. Reported beneath each coefficient estimate is the t-
statistic adjusted for clustering at the bank level. *, ** and *** indicate statistical significance at the 10%, 5% and 1% levels, respectively.

66
Table 3: The impact of institutional variables on bank capital – Robustness Check: General Method of Moments
(1) (2) (3) (4) (5) (6) (7)
TCR Lag_TCR 0.860*** 0.771*** 0.757*** 0.829*** 0.956*** 0.838*** 0.863*** (9.71) (9.52) (4.83) (9.05) (10.24) (10.13) (7.77) Lag_EQTA PS 0.502 (0.77) GC -0.111** (-2.31) RI -0.463* (-1.86) EF 0.0650 (0.51) FO 0.231* (1.70) CPI 0.827* (1.88) II 1.780*** (2.95) CRT -1.102* (-1.79)
ROA 0.303 0.103 0.686** 0.547** 0.741** 0.611** 0.339 (0.93) (0.28) (1.97) (2.55) (2.36) (2.18) (0.76) ZSCORE -0.331** -0.237 -0.321 -0.365** -0.434** -0.420*** -0.274 (-2.25) (-1.44) (-1.31) (-2.34) (-2.55) (-2.83) (-1.31) SIZE -0.122 -0.163 -0.520* -0.319 -0.200 -0.256 -0.302 (-0.55) (-0.67) (-1.78) (-1.10) (-0.76) (-1.05) (-1.04) CONC 0.287 -1.191 4.263 0.822 4.055* 2.041 -1.184 (0.10) (-0.34) (0.43) (0.25) (1.71) (0.33) (-0.28) GDP -0.207*** -0.333*** -0.220 -0.225*** -0.259*** -0.205*** -0.319***

67
(-4.38) (-6.38) (-1.28) (-4.55) (-4.20) (-4.29) (-5.36) REG 0.278*** 0.385*** 0.434 0.278* 0.244** 0.407* 0.00211 (2.59) (3.22) (0.96) (1.69) (2.15) (1.69) (0.01) DEP_INS 0.445 -2.255** -0.0543 0.234 -1.285 0.261 0.535 (1.41) (-1.97) (-0.04) (0.57) (-1.22) (0.32) (0.29) Islamic -0.573 -1.139* -0.351 -0.621 -0.943** -0.440 -1.126* (-0.97) (-1.88) (-0.64) (-1.62) (-2.20) (-0.91) (-1.67) Gov -0.213 -0.452 0.341 -0.00541 -0.201 0.195 -0.523 (-0.37) (-0.84) (0.71) (-0.01) (-0.54) (0.37) (-0.73) Listed -0.0349 -0.115 0.0722 0.00563 -0.447 0.260 -0.668 (-0.08) (-0.26) (0.09) (0.01) (-0.99) (0.53) (-1.12) Constant 4.798 13.83** 13.62 3.855 -10.98 7.100 8.379 (1.05) (2.38) (1.16) (0.72) (-1.10) (1.33) (1.45)
Observations 895 838 838 868 868 895 832 Groups 145 144 144 142 142 145 141 AR1 p-stat 0.0002 0.0004 0.0022 0.0006 0.0002 0.0006 0.0004 AR2 p-stat 0.989 0.3943 0.2432 0.1123 0.0793 0.1109 0.2461 Hansen p-stat 0.7405 0.4135 0.251 0.4482 0.780 0.8426 0.6299

68
Table 3: The impact of institutional variables on bank capital – Robustness Check: General Method of Moments (Continued)
(8) (9) (10) (11) (12) (13) (14)
EQTA Lag_TCR Lag_EQTA 0.348** 0.782*** 0.828*** 0.544*** 0.635*** 0.618*** 0.497** (2.25) (2.77) (3.86) (3.45) (3.20) (3.13) (2.51) PS 0.231 (0.58) GC 0.000415 (0.02) RI 0.0510 (0.50) EF 0.219** (2.39) FO 0.138* (1.87) CPI 0.0459 (0.96) II 0.854 (1.34) CRT 0.203 (0.49)
ROA 1.426*** 0.852 0.845** 1.240*** 1.279*** 1.091*** 1.269*** (3.78) (1.58) (2.17) (3.94) (3.40) (3.14) (3.01) ZSCORE -0.300** -0.154 -0.130 -0.154 -0.187 -0.162 -0.173 (-2.21) (-1.05) (-0.85) (-1.31) (-1.41) (-1.25) (-1.40) SIZE -0.697*** -0.157 -0.205 -0.521** -0.453* -0.276 -0.627* (-2.68) (-0.46) (-0.62) (-2.28) (-1.90) (-1.22) (-1.84) CONC -3.247 0.501 -2.072 -3.374 0.164 -3.309 -5.158 (-1.19) (0.24) (-0.46) (-1.21) (0.07) (-0.95) (-1.42) GDP -0.0483* -0.0722** -0.0991* -0.0910*** -0.103*** -0.0975*** -0.0871*** (-1.69) (-2.48) (-1.76) (-3.69) (-3.25) (-3.61) (-3.21) REG 0.312*** 0.152 0.00687 0.0525 0.124 0.0795 0.0276 (3.28) (0.90) (0.03) (0.47) (0.95) (0.52) (0.21) DEP_INS 0.601 0.444 0.518 -0.146 -0.576 0.771 0.816 (1.43) (0.97) (1.24) (-0.31) (-0.69) (1.46) (1.39)
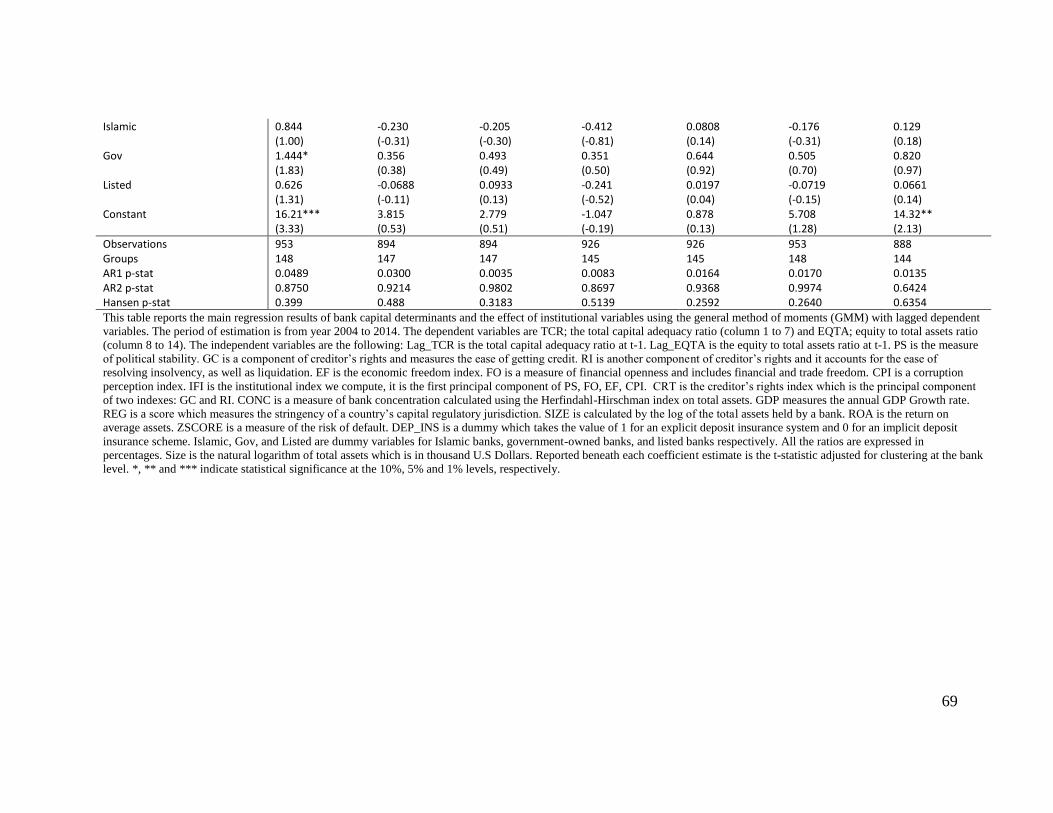
69
Islamic 0.844 -0.230 -0.205 -0.412 0.0808 -0.176 0.129 (1.00) (-0.31) (-0.30) (-0.81) (0.14) (-0.31) (0.18) Gov 1.444* 0.356 0.493 0.351 0.644 0.505 0.820 (1.83) (0.38) (0.49) (0.50) (0.92) (0.70) (0.97) Listed 0.626 -0.0688 0.0933 -0.241 0.0197 -0.0719 0.0661 (1.31) (-0.11) (0.13) (-0.52) (0.04) (-0.15) (0.14) Constant 16.21*** 3.815 2.779 -1.047 0.878 5.708 14.32** (3.33) (0.53) (0.51) (-0.19) (0.13) (1.28) (2.13)
Observations 953 894 894 926 926 953 888 Groups 148 147 147 145 145 148 144 AR1 p-stat 0.0489 0.0300 0.0035 0.0083 0.0164 0.0170 0.0135 AR2 p-stat 0.8750 0.9214 0.9802 0.8697 0.9368 0.9974 0.6424 Hansen p-stat 0.399 0.488 0.3183 0.5139 0.2592 0.2640 0.6354
This table reports the main regression results of bank capital determinants and the effect of institutional variables using the general method of moments (GMM) with lagged dependent
variables. The period of estimation is from year 2004 to 2014. The dependent variables are TCR; the total capital adequacy ratio (column 1 to 7) and EQTA; equity to total assets ratio
(column 8 to 14). The independent variables are the following: Lag_TCR is the total capital adequacy ratio at t-1. Lag_EQTA is the equity to total assets ratio at t-1. PS is the measure
of political stability. GC is a component of creditor’s rights and measures the ease of getting credit. RI is another component of creditor’s rights and it accounts for the ease of
resolving insolvency, as well as liquidation. EF is the economic freedom index. FO is a measure of financial openness and includes financial and trade freedom. CPI is a corruption
perception index. IFI is the institutional index we compute, it is the first principal component of PS, FO, EF, CPI. CRT is the creditor’s rights index which is the principal component
of two indexes: GC and RI. CONC is a measure of bank concentration calculated using the Herfindahl-Hirschman index on total assets. GDP measures the annual GDP Growth rate.
REG is a score which measures the stringency of a country’s capital regulatory jurisdiction. SIZE is calculated by the log of the total assets held by a bank. ROA is the return on
average assets. ZSCORE is a measure of the risk of default. DEP_INS is a dummy which takes the value of 1 for an explicit deposit insurance system and 0 for an implicit deposit
insurance scheme. Islamic, Gov, and Listed are dummy variables for Islamic banks, government-owned banks, and listed banks respectively. All the ratios are expressed in
percentages. Size is the natural logarithm of total assets which is in thousand U.S Dollars. Reported beneath each coefficient estimate is the t-statistic adjusted for clustering at the bank
level. *, ** and *** indicate statistical significance at the 10%, 5% and 1% levels, respectively.

70
Table 4: The impact of institutional variables on bank capital – Robustness Check: Countries excluding Malta, GCC, and Israel
(1) (2) (3) (4) (5) (6) (7) (8) (9) (10) (11) (12) (13) (14)
TCR EQTA
PS 1.399* 0.668 (1.88) (1.53)
GC
-0.115*** 0.00725
(-3.71) (0.66)
RI
-0.608*** -0.00100
(-4.84) (-0.02)
EF 0.532***
-0.192***
(3.27) (-3.30) FO 0.416*** -0.0195 (6.54) (-0.82) CPI 0.313*** -0.0607 (2.94) (-1.57) II 7.015*** -0.829
(4.03) (-1.31)
CRT
-3.329*** 0.142
(-4.34) (0.51)
CONC -140.3*** -53.71*
-84.07***
-103.5***
-103.1***
-133.1*** -29.16 9.408 26.52** 5.378 1.775 4.882 9.249 25.33**
(-6.26) (-1.77) (-3.84) (-4.82) (-4.98) (-5.98) (-0.99) (1.16) (2.47) (0.67) (0.23) (0.63) (1.15) (2.37)
GDP -0.389*** -0.0358
-0.434***
-0.321***
-0.305*** -0.198* -0.0486 -0.0310 -0.0607 -0.0530 -0.0261 -0.0502 -0.0627 -0.0593
(-3.12) (-0.27) (-3.51) (-2.65) (-2.63) (-1.65) (-0.40) (-0.69) (-1.29) (-1.17) (-0.61) (-1.16) (-1.45) (-1.34)
REG 0.763 0.164 -2.852*** -1.126* -0.359 0.277
-1.843*** 0.273 0.556*** 0.374 0.809*** 0.401** 0.335** 0.726***
(1.53) (0.35) (-3.83) (-1.95) (-0.80) (0.60) (-3.35) (1.50) (3.32) (1.34) (3.86) (2.37) (1.97) (3.57)
SIZE -3.422***
-4.335***
-3.055***
-3.351***
-2.930***
-3.697***
-3.621***
-4.025***
-4.203***
-3.928***
-4.195***
-3.999***
-3.940***
-4.292***
(-4.29) (-5.04) (-3.90) (-4.20) (-3.87) (-4.53) (-4.48) (-10.53) (-10.85) (-10.22) (-10.96) (-10.38) (-10.42) (-10.94)
ROA -1.225** -1.153** -0.861* -1.207** -1.144** - -0.883* 1.071*** 1.280*** 1.098*** 1.029*** 1.086*** 1.122*** 1.277***

71
1.534***
(-2.50) (-2.22) (-1.74) (-2.45) (-2.40) (-3.13) (-1.72) (5.98) (6.90) (6.00) (5.80) (6.07) (6.27) (6.82)
ZSCORE 0.306 0.198 0.246 0.283 0.366 0.319 0.294 -0.0303 0.0446 -0.0221 -0.0335 -0.0276 -0.0363 0.0296
(1.10) (0.69) (0.89) (1.01) (1.34) (1.14) (1.05) (-0.30) (0.44) (-0.22) (-0.34) (-0.27) (-0.36) (0.29)
Islamic 2.440 2.329 2.700 2.440 2.576 2.260 2.682 -3.433 -3.296 -3.380 -3.507 -3.412 -3.380 -3.337
(0.69) (0.60) (0.79) (0.70) (0.79) (0.61) (0.78) (-1.14) (-1.09) (-1.14) (-1.13) (-1.14) (-1.14) (-1.08)
Gov 6.040* 6.882* 5.426 5.875* 5.641* 6.464* 6.082* 8.779*** 8.723*** 8.691*** 9.006*** 8.744*** 8.701*** 8.864***
(1.73) (1.81) (1.62) (1.70) (1.76) (1.76) (1.79) (3.05) (3.03) (3.06) (3.03) (3.05) (3.07) (3.01)
Listed 5.687** 6.515** 5.319** 5.573** 5.050** 6.083** 5.757** 4.107* 3.955* 4.049* 4.274* 4.089* 4.066* 4.088*
(2.15) (2.26) (2.10) (2.13) (2.08) (2.19) (2.24) (1.85) (1.78) (1.85) (1.87) (1.85) (1.86) (1.80)
Constant 78.66*** 90.57*** 92.99*** 49.51*** 54.63*** 77.78*** 82.70*** 55.59*** 54.71*** 64.39*** 68.20*** 55.96*** 66.14*** 65.40***
(6.19) (6.61) (7.59) (3.05) (4.35) (5.94) (6.38) (7.10) (6.97) (10.47) (7.65) (6.97) (10.62) (10.20)
Time fixed effects YES YES YES YES YES YES YES YES YES YES YES YES YES YES Country fixed effects YES YES YES YES YES YES YES YES YES YES YES YES YES YES
Observations 483 459 483 483 483 483 459 483 459 483 483 483 483 459
Groups 73 72 73 73 73 73 72 73 72 73 73 73 73 72
This table reports the main regression results of bank capital determinants and the effect of institutional variables using the Hausman-Taylor model using a sample of countries excluding
Malta, Israel and the GCC countries (Bahrain, Kuwait, Oman, Qatar, and the UAE). The period of estimation is from year 2004 to 2014. The dependent variables are TCR; the total capital
adequacy ratio (column 1 to 7) and EQTA; equity to total assets ratio (column 8 to 14). The independent variables are the following: PS is the measure of political stability. GC is a
component of creditor’s rights and measures the ease of getting credit. RI is another component of creditor’s rights and it accounts for the ease of resolving insolvency, as well as
liquidation. EF is the economic freedom index. FO is a measure of financial openness and includes financial and trade freedom. CPI is a corruption perception index. IFI is the institutional
index we compute, it is the first principal component of PS, FO, EF, CPI. CRT is the creditor’s rights index which is the principal component of two indexes: GC and RI. CONC is a
measure of bank concentration calculated using the Herfindahl-Hirschman index on total assets. GDP measures the annual GDP Growth rate. REG is a score which measures the stringency
of a country’s capital regulatory jurisdiction. SIZE is calculated by the log of the total assets held by a bank. ROA is the return on average assets. ZSCORE is a measure of the risk of
default. DEP_INS is a dummy which takes the value of 1 for an explicit deposit insurance system and 0 for an implicit deposit insurance scheme. Islamic, Gov, and Listed are dummy
variables for Islamic banks, government-owned banks, and listed banks respectively. All the ratios are expressed in percentages. Size is the natural logarithm of total assets which is in
thousand U.S Dollars. Reported beneath each coefficient estimate is the t-statistic adjusted for clustering at the bank level. *, ** and *** indicate statistical significance at the 10%, 5% and
1% levels, respectively.
.