Embed Size (px)
Citation preview
INSTITUTIONAL EQUITY RESEARCH
Bajaj Auto
Will the export juggernaut roll?
Page | 1 | PHILLIPCAPITAL INDIA RESEARCH
INDIA | AUTOMOBILES | Company Update
17 August 2016
Read this report to find out: • Reasons for a major improvement expected in Bajaj Auto’s 2W exports • Why its exports markets provide structural opportunities for Bajaj Auto • Competitive scenario in various export markets A subdued exports outlook saw Bajaj Auto underperform its peers over the last year. We expect this trend to reverse with improving exports visibility due to stability in oil prices and currency depreciation in its key exports markets. We expect it to be a big beneficiary of a recovery in demand in LatAm and African markets due to its strong market share and better product quality vs. Chinese competitors. Historical analysis suggests a strong upside risk to our FY18 export volume growth of 17%. While we increase our EPS estimates marginally (by 3%) for FY18, we up our target multiple by 10% from 16x based on improved exports business outlook and a revival in the 2W (two‐wheeler) industry in India. We retain our Buy rating with a revised target price of Rs 3,300 (Rs 2,950 earlier). 2W exports: Recovering from the oil cyclicality Most of India’s 2W exports are to oil‐dependent countries; hence, the cyclical downturn in oil significantly impacted India’s 2W exports. Since Bajaj is the most dominant player in this segment, it was the most impacted. We see exports gradually recovering with: (1) oil prices stabilising after the recent jump from bottom, (2) currencies of major markets depreciating, and (3) dollar availability issues receding (as a result). Bajaj should report a 17% jump in export volumes in FY18 (after a 6% expected fall in FY17 and 4% fall in FY16). Exports are likely to benefit from a positive base from October 2016. Structurally, Bajaj’s exports markets are still lucrative African/Latin American countries contribute over 60% of Bajaj Auto’s exports volumes; our analysis of these markets suggests that they are in their initial growth stages, with average 2W penetration at just 3%/5%. Bajaj is a leading player in over 20 countries with strong brand presence; hence, it has first‐mover advantage. Given strong product portfolio, brand dominance, and better quality vs. Chinese manufacturers, Bajaj’s market share in these markets is likely to grow (we estimate market size at +5mn units p.a). With an impending improvement in retail demand and fundamentals, we see sequential improvement in volumes and Bajaj’s exports now posting a 17% growth in FY18 (vs. 14% seen earlier). Domestic: Holding strong Strong new launches helped Bajaj Auto report 17% yoy growth in domestic volumes in YTD FY17. While the new launch momentum will continue – with a new launch planned every quarter in FY17 – we expect it to benefit from the industry‐wide revival after a strong monsoon and a consumption boost with the seventh‐pay commission. We see 23%/14% growth in domestic volumes in FY17/18. Outlook and valuation: We increase our FY18 export volume growth estimate to 17% based on improving demand, and raise our target PE multiple by 10% from 16x earlier. We retain BUY with a revised TP of Rs3,300. Key drivers – vastly improved export outlook from H2FY17 and new launches in domestic markets.
BUY (Maintain) CMP RS 2876 TARGET RS 3300(+15%) COMPANY DATA O/S SHARES (MN) : 289MARKET CAP (RSBN) : 832MARKET CAP (USDBN) : 12.552 ‐ WK HI/LO (RS) : 2917 / 2133LIQUIDITY 3M (USDMN) : 11.9PAR VALUE (RS) : 10 SHARE HOLDING PATTERN, % Jun 16 Mar 16 Dec 15PROMOTERS : 49.3 49.3 49.3FII / NRI : 17.1 17.3 18.1FI / MF : 8.8 8.7 7.9NON PRO : 11.7 11.8 18.6PUBLIC & OTHERS : 13.1 13.0 6.0 PRICE PERFORMANCE, %
1MTH 3MTH 1YRABS 7.0 14.8 12.7REL TO BSE 6.1 4.7 12.7 PRICE VS. SENSEX
80
90
100
110
120
130
140
Apr‐14 Apr‐15 Apr‐16
Bajaj Auto BSE Sensex
Source: Phillip Capital India Research KEY FINANCIALS Rs mn FY16 FY17E FY18ENet Sales 222,528 258,853 304,322EBIDTA 47,796 54,704 64,812Net Profit 36,525 43,934 52,043EPS, Rs 126.2 151.8 179.8PER, x 22.8 18.9 16.0EV/EBIDTA, x 17.3 14.7 11.9P/BV, x 6.8 5.6 4.5ROE, % 29.7 29.4 28.3Debt/Equity (%) 1.3 1.1 0.9
Source: PhillipCapital India Research Est. Dhawal Doshi (+ 9122 6667 9769) [email protected] Nitesh Sharma, CFA (+ 9122 6667 9965) [email protected]
BAJAJ AUTO COMPANY UPDATE
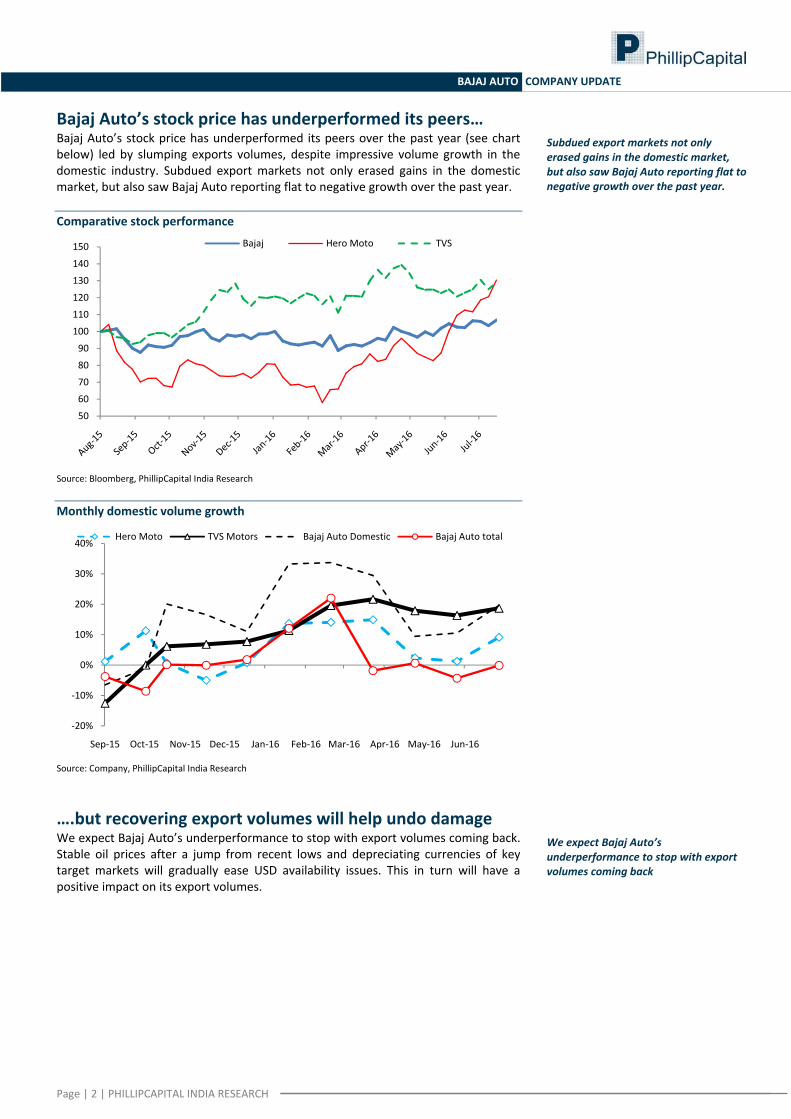
Bajaj Auto’s stock price has underperformed its peers… Bajaj Auto’s stock price has underperformed its peers over the past year (see chart below) led by slumping exports volumes, despite impressive volume growth in the domestic industry. Subdued export markets not only erased gains in the domestic market, but also saw Bajaj Auto reporting flat to negative growth over the past year.
Subdued export markets not only erased gains in the domestic market, but also saw Bajaj Auto reporting flat to negative growth over the past year.
Comparative stock performance
50
60
70
80
90
100
110
120
130
140
150 Bajaj Hero Moto TVS
Source: Bloomberg, PhillipCapital India Research Monthly domestic volume growth
‐20%
‐10%
0%
10%
20%
30%
40%
Sep‐15 Oct‐15 Nov‐15 Dec‐15 Jan‐16 Feb‐16 Mar‐16 Apr‐16 May‐16 Jun‐16
Hero Moto TVS Motors Bajaj Auto Domestic Bajaj Auto total
Source: Company, PhillipCapital India Research
….but recovering export volumes will help undo damage We expect Bajaj Auto’s underperformance to stop with export volumes coming back. Stable oil prices after a jump from recent lows and depreciating currencies of key target markets will gradually ease USD availability issues. This in turn will have a positive impact on its export volumes.
We expect Bajaj Auto’s underperformance to stop with export volumes coming back
Page | 2 | PHILLIPCAPITAL INDIA RESEARCH
BAJAJ AUTO COMPANY UPDATE
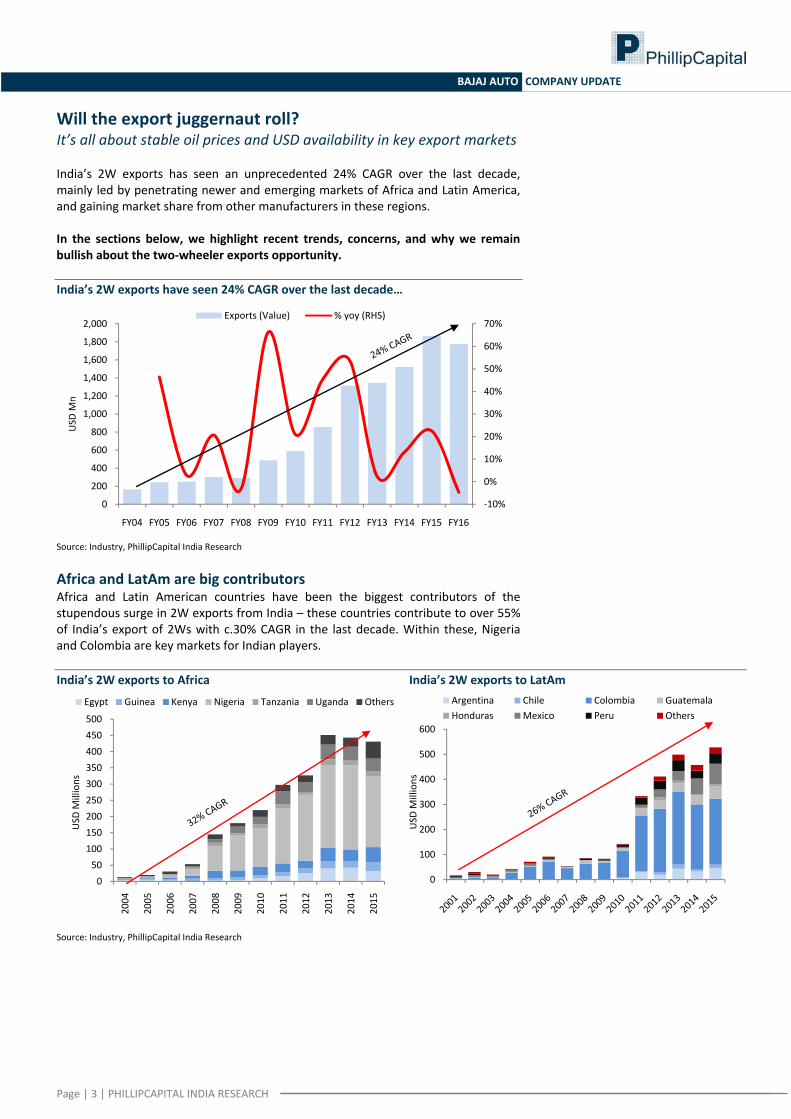
Will the export juggernaut roll? It’s all about stable oil prices and USD availability in key export markets India’s 2W exports has seen an unprecedented 24% CAGR over the last decade, mainly led by penetrating newer and emerging markets of Africa and Latin America, and gaining market share from other manufacturers in these regions. In the sections below, we highlight recent trends, concerns, and why we remain bullish about the two‐wheeler exports opportunity. India’s 2W exports have seen 24% CAGR over the last decade…
‐10%
0%
10%
20%
30%
40%
50%
60%
70%
0
200
400
600
800
1,000
1,200
1,400
1,600
1,800
2,000
FY04 FY05 FY06 FY07 FY08 FY09 FY10 FY11 FY12 FY13 FY14 FY15 FY16
USD
Mn
Exports (Value) % yoy (RHS)
Source: Industry, PhillipCapital India Research Africa and LatAm are big contributors Africa and Latin American countries have been the biggest contributors of the stupendous surge in 2W exports from India – these countries contribute to over 55% of India’s export of 2Ws with c.30% CAGR in the last decade. Within these, Nigeria and Colombia are key markets for Indian players. India’s 2W exports to Africa India’s 2W exports to LatAm
050100150200250300350400450500
2004
2005
2006
2007
2008
2009
2010
2011
2012
2013
2014
2015
USD
Millions
Egypt Guinea Kenya Nigeria Tanzania Uganda Others
0
100
200
300
400
500
600
USD
Millions
Argentina Chile Colombia GuatemalaHonduras Mexico Peru Others
Source: Industry, PhillipCapital India Research
Page | 3 | PHILLIPCAPITAL INDIA RESEARCH
BAJAJ AUTO COMPANY UPDATE
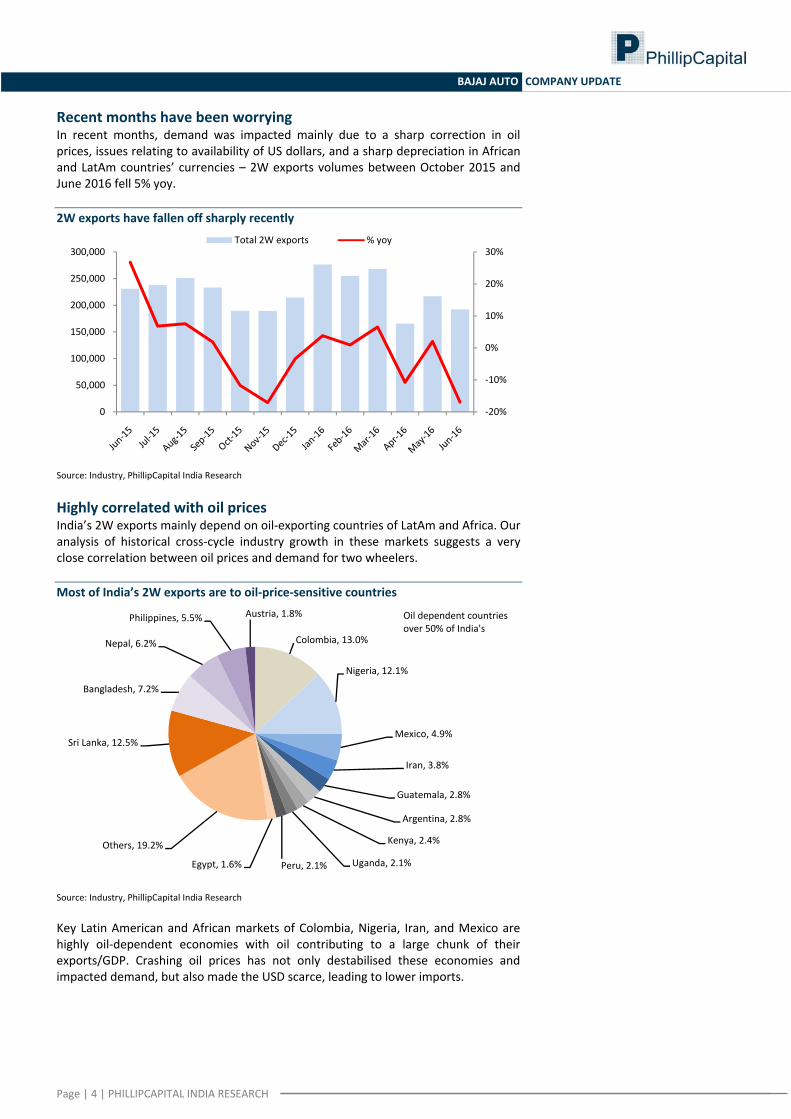
Recent months have been worrying In recent months, demand was impacted mainly due to a sharp correction in oil prices, issues relating to availability of US dollars, and a sharp depreciation in African and LatAm countries’ currencies – 2W exports volumes between October 2015 and June 2016 fell 5% yoy. 2W exports have fallen off sharply recently
‐20%
‐10%
0%
10%
20%
30%
0
50,000
100,000
150,000
200,000
250,000
300,000Total 2W exports % yoy
Source: Industry, PhillipCapital India Research Highly correlated with oil prices India’s 2W exports mainly depend on oil‐exporting countries of LatAm and Africa. Our analysis of historical cross‐cycle industry growth in these markets suggests a very close correlation between oil prices and demand for two wheelers. Most of India’s 2W exports are to oil‐price‐sensitive countries
Colombia, 13.0%
Nigeria, 12.1%
Mexico, 4.9%
Iran, 3.8%
Guatemala, 2.8%
Argentina, 2.8%
Kenya, 2.4%
Uganda, 2.1%Peru, 2.1%Egypt, 1.6%
Others, 19.2%
Sri Lanka, 12.5%
Bangladesh, 7.2%
Nepal, 6.2%
Philippines, 5.5% Austria, 1.8% Oil dependent countries over 50% of India's
Source: Industry, PhillipCapital India Research Key Latin American and African markets of Colombia, Nigeria, Iran, and Mexico are highly oil‐dependent economies with oil contributing to a large chunk of their exports/GDP. Crashing oil prices has not only destabilised these economies and impacted demand, but also made the USD scarce, leading to lower imports.
Page | 4 | PHILLIPCAPITAL INDIA RESEARCH
BAJAJ AUTO COMPANY UPDATE
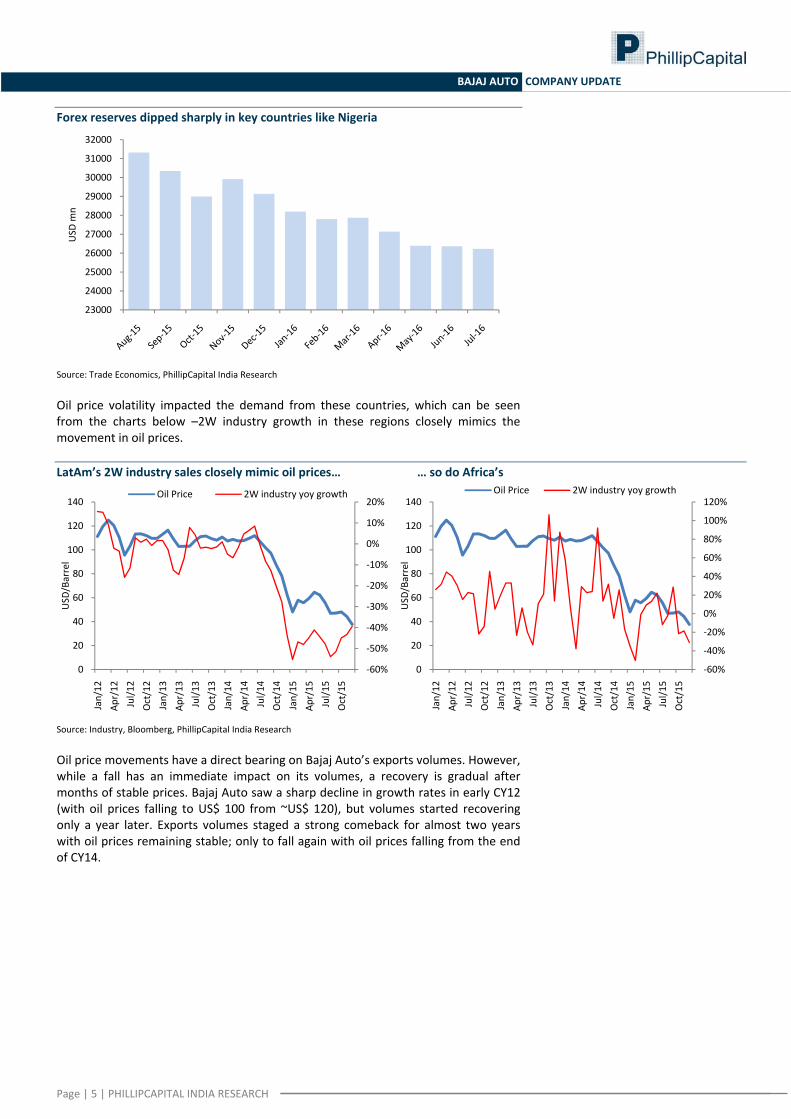
Forex reserves dipped sharply in key countries like Nigeria
23000
24000
25000
26000
27000
28000
29000
30000
31000
32000
USD
mn
Source: Trade Economics, PhillipCapital India Research Oil price volatility impacted the demand from these countries, which can be seen from the charts below –2W industry growth in these regions closely mimics the movement in oil prices. LatAm’s 2W industry sales closely mimic oil prices… … so do Africa’s
‐60%
‐50%
‐40%
‐30%
‐20%
‐10%
0%
10%
20%
0
20
40
60
80
100
120
140
Jan/12
Apr/12
Jul/1
2Oct/12
Jan/13
Apr/13
Jul/1
3Oct/13
Jan/14
Apr/14
Jul/1
4Oct/14
Jan/15
Apr/15
Jul/1
5Oct/15
USD
/Barrel
Oil Price 2W industry yoy growth
‐60%
‐40%
‐20%
0%
20%
40%
60%
80%
100%
120%
0
20
40
60
80
100
120
140
Jan/12
Apr/12
Jul/1
2Oct/12
Jan/13
Apr/13
Jul/1
3Oct/13
Jan/14
Apr/14
Jul/1
4Oct/14
Jan/15
Apr/15
Jul/1
5Oct/15
USD
/Barrel
Oil Price 2W industry yoy growth
Source: Industry, Bloomberg, PhillipCapital India Research Oil price movements have a direct bearing on Bajaj Auto’s exports volumes. However, while a fall has an immediate impact on its volumes, a recovery is gradual after months of stable prices. Bajaj Auto saw a sharp decline in growth rates in early CY12 (with oil prices falling to US$ 100 from ~US$ 120), but volumes started recovering only a year later. Exports volumes staged a strong comeback for almost two years with oil prices remaining stable; only to fall again with oil prices falling from the end of CY14.
Page | 5 | PHILLIPCAPITAL INDIA RESEARCH
BAJAJ AUTO COMPANY UPDATE
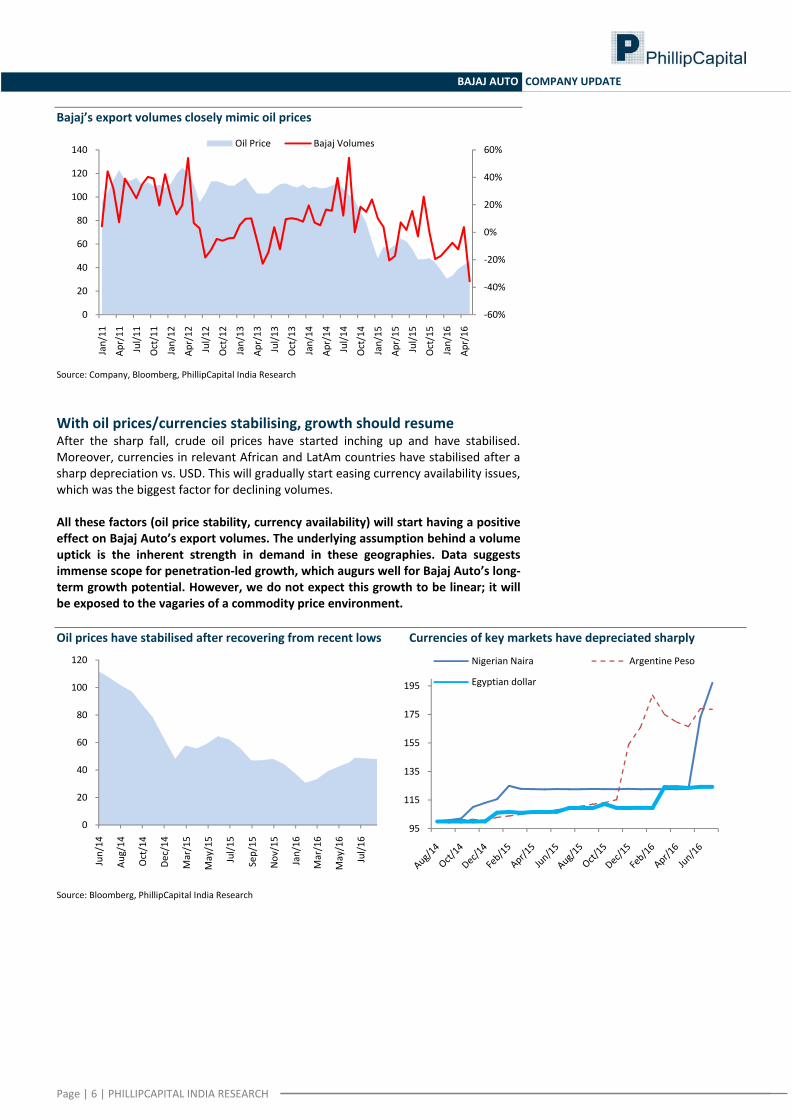
Bajaj’s export volumes closely mimic oil prices
‐60%
‐40%
‐20%
0%
20%
40%
60%
0
20
40
60
80
100
120
140
Jan/11
Apr/11
Jul/1
1
Oct/11
Jan/12
Apr/12
Jul/1
2
Oct/12
Jan/13
Apr/13
Jul/1
3
Oct/13
Jan/14
Apr/14
Jul/1
4
Oct/14
Jan/15
Apr/15
Jul/1
5
Oct/15
Jan/16
Apr/16
Oil Price Bajaj Volumes
Source: Company, Bloomberg, PhillipCapital India Research With oil prices/currencies stabilising, growth should resume After the sharp fall, crude oil prices have started inching up and have stabilised. Moreover, currencies in relevant African and LatAm countries have stabilised after a sharp depreciation vs. USD. This will gradually start easing currency availability issues, which was the biggest factor for declining volumes. All these factors (oil price stability, currency availability) will start having a positive effect on Bajaj Auto’s export volumes. The underlying assumption behind a volume uptick is the inherent strength in demand in these geographies. Data suggests immense scope for penetration‐led growth, which augurs well for Bajaj Auto’s long‐term growth potential. However, we do not expect this growth to be linear; it will be exposed to the vagaries of a commodity price environment. Oil prices have stabilised after recovering from recent lows Currencies of key markets have depreciated sharply
0
20
40
60
80
100
120
Jun/14
Aug/14
Oct/14
Dec/14
Mar/15
May/15
Jul/1
5
Sep/15
Nov/15
Jan/16
Mar/16
May/16
Jul/1
6
95
115
135
155
175
195
Nigerian Naira Argentine Peso
Egyptian dollar
Source: Bloomberg, PhillipCapital India Research
Page | 6 | PHILLIPCAPITAL INDIA RESEARCH
BAJAJ AUTO COMPANY UPDATE
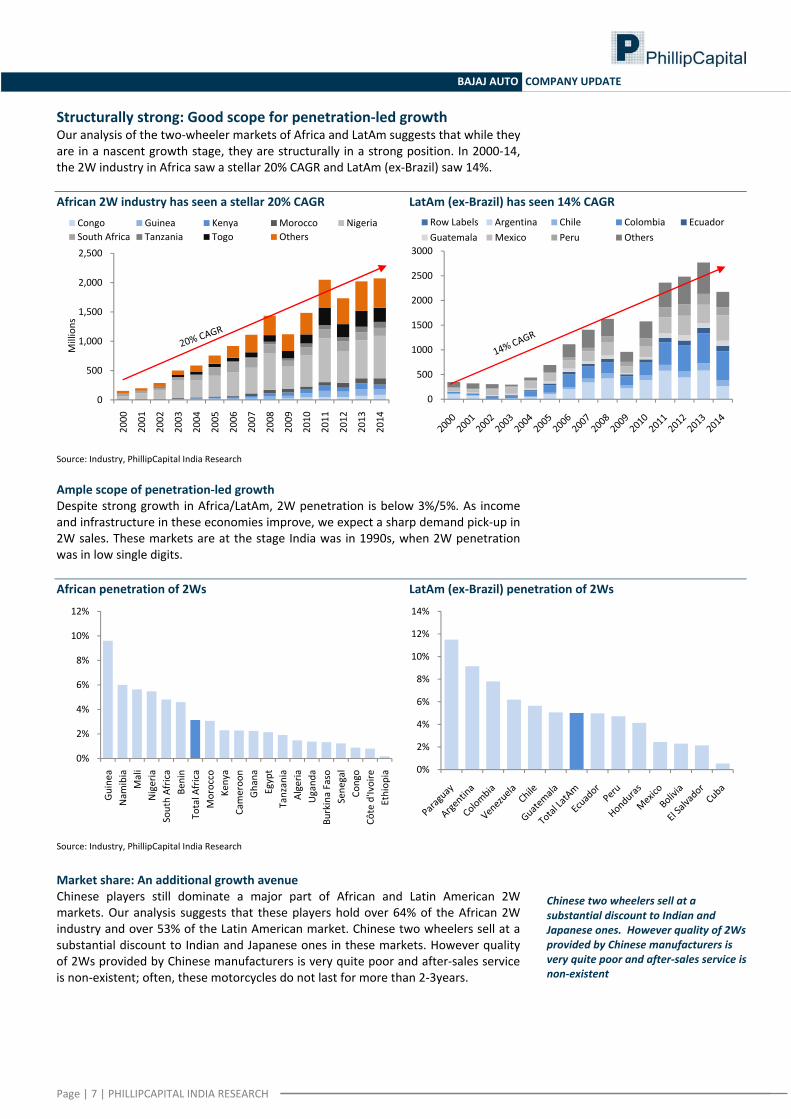
Structurally strong: Good scope for penetration‐led growth Our analysis of the two‐wheeler markets of Africa and LatAm suggests that while they are in a nascent growth stage, they are structurally in a strong position. In 2000‐14, the 2W industry in Africa saw a stellar 20% CAGR and LatAm (ex‐Brazil) saw 14%. African 2W industry has seen a stellar 20% CAGR LatAm (ex‐Brazil) has seen 14% CAGR
0
500
1,000
1,500
2,000
2,500
2000
2001
2002
2003
2004
2005
2006
2007
2008
2009
2010
2011
2012
2013
2014
Millions
Congo Guinea Kenya Morocco NigeriaSouth Africa Tanzania Togo Others
0
500
1000
1500
2000
2500
3000
Row Labels Argentina Chile Colombia EcuadorGuatemala Mexico Peru Others
Source: Industry, PhillipCapital India Research Ample scope of penetration‐led growth Despite strong growth in Africa/LatAm, 2W penetration is below 3%/5%. As income and infrastructure in these economies improve, we expect a sharp demand pick‐up in 2W sales. These markets are at the stage India was in 1990s, when 2W penetration was in low single digits. African penetration of 2Ws LatAm (ex‐Brazil) penetration of 2Ws
0%
2%
4%
6%
8%
10%
12%
Guine
aNam
ibia
Mali
Nigeria
South Africa
Benin
Total A
frica
Morocco
Kenya
Cameroo
nGhana
Egypt
Tanzania
Algeria
Ugand
aBu
rkina Faso
Sene
gal
Congo
Côte d'Ivoire
Ethiop
ia 0%
2%
4%
6%
8%
10%
12%
14%
Source: Industry, PhillipCapital India Research
Market share: An additional growth avenue Chinese players still dominate a major part of African and Latin American 2W markets. Our analysis suggests that these players hold over 64% of the African 2W industry and over 53% of the Latin American market. Chinese two wheelers sell at a substantial discount to Indian and Japanese ones in these markets. However quality of 2Ws provided by Chinese manufacturers is very quite poor and after‐sales service is non‐existent; often, these motorcycles do not last for more than 2‐3years.
Chinese two wheelers sell at a substantial discount to Indian and Japanese ones. However quality of 2Ws provided by Chinese manufacturers is very quite poor and after‐sales service is non‐existent
Page | 7 | PHILLIPCAPITAL INDIA RESEARCH
BAJAJ AUTO COMPANY UPDATE
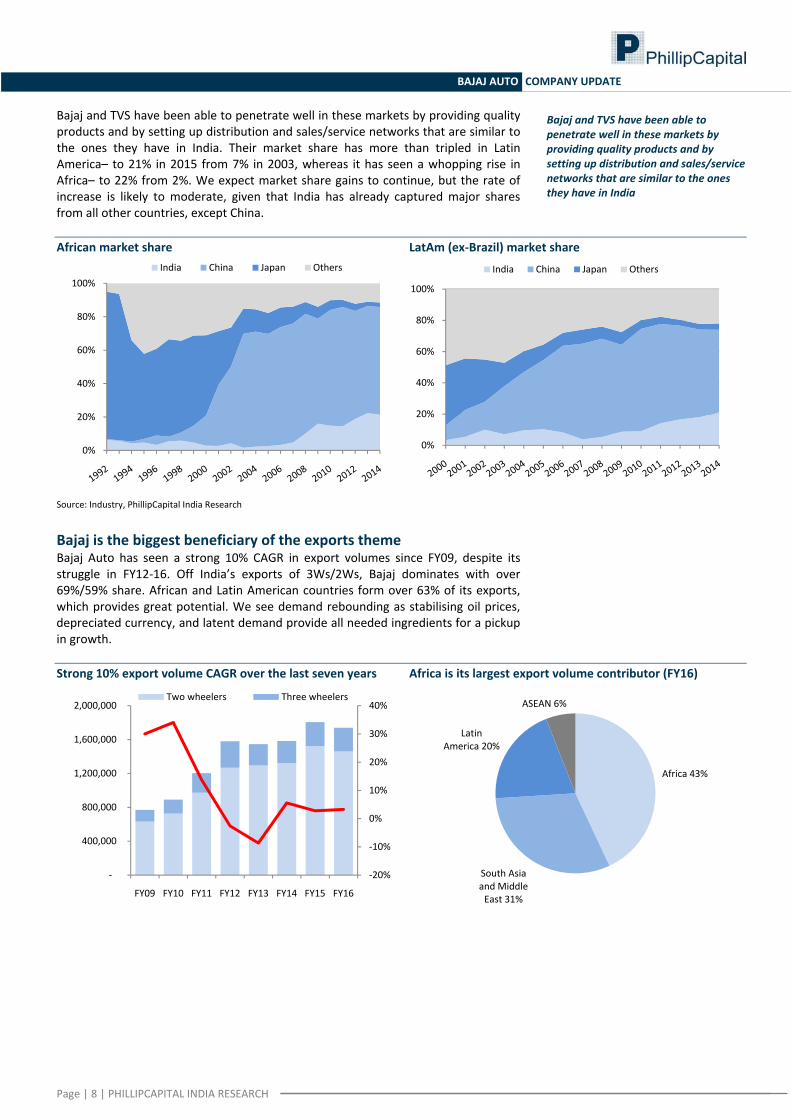
Bajaj and TVS have been able to penetrate well in these markets by providing quality products and by setting up distribution and sales/service networks that are similar to the ones they have in India. Their market share has more than tripled in Latin America– to 21% in 2015 from 7% in 2003, whereas it has seen a whopping rise in Africa– to 22% from 2%. We expect market share gains to continue, but the rate of increase is likely to moderate, given that India has already captured major shares from all other countries, except China.
Bajaj and TVS have been able to penetrate well in these markets by providing quality products and by setting up distribution and sales/service networks that are similar to the ones they have in India
African market share LatAm (ex‐Brazil) market share
0%
20%
40%
60%
80%
100%India China Japan Others
0%
20%
40%
60%
80%
100%
India China Japan Others
Source: Industry, PhillipCapital India Research
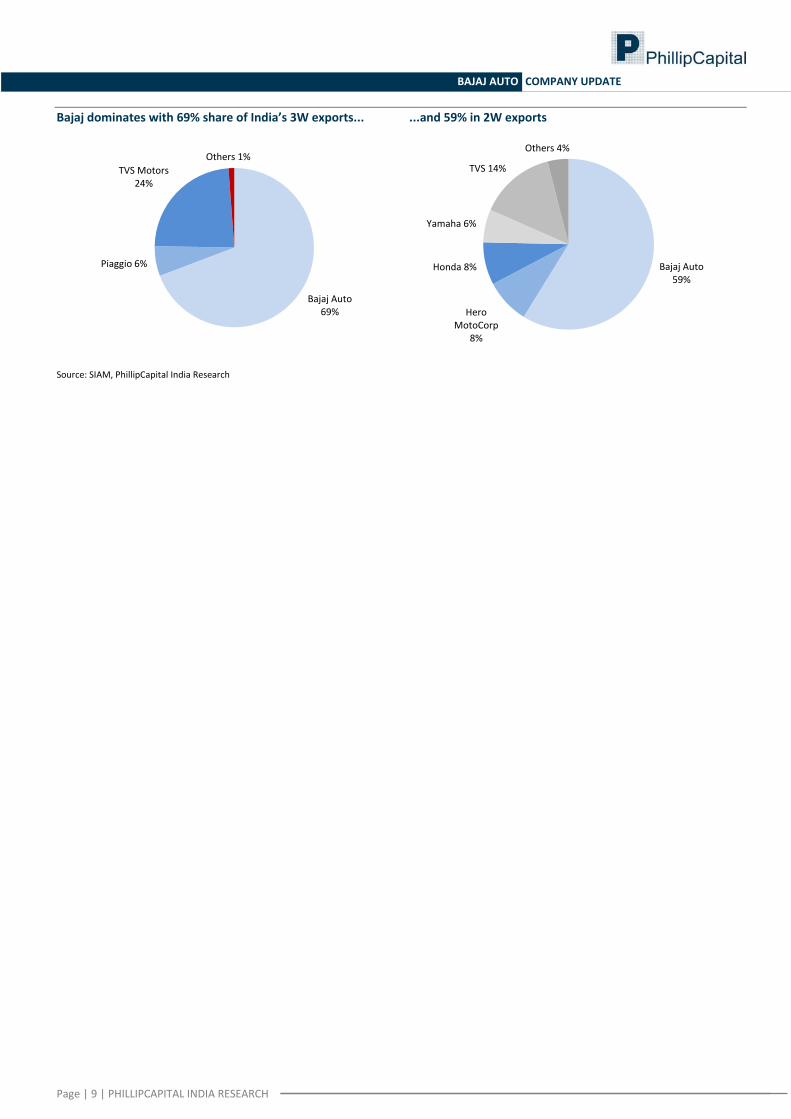
Bajaj is the biggest beneficiary of the exports theme Bajaj Auto has seen a strong 10% CAGR in export volumes since FY09, despite its struggle in FY12‐16. Off India’s exports of 3Ws/2Ws, Bajaj dominates with over 69%/59% share. African and Latin American countries form over 63% of its exports, which provides great potential. We see demand rebounding as stabilising oil prices, depreciated currency, and latent demand provide all needed ingredients for a pickup in growth. Strong 10% export volume CAGR over the last seven years Africa is its largest export volume contributor (FY16)
‐20%
‐10%
0%
10%
20%
30%
40%
‐
400,000
800,000
1,200,000
1,600,000
2,000,000
FY09 FY10 FY11 FY12 FY13 FY14 FY15 FY16
Two wheelers Three wheelers
Africa 43%
South Asia and Middle East 31%
Latin America 20%
ASEAN 6%
Page | 8 | PHILLIPCAPITAL INDIA RESEARCH
BAJAJ AUTO COMPANY UPDATE
Bajaj dominates with 69% share of India’s 3W exports... ...and 59% in 2W exports
Bajaj Auto 69%
Piaggio 6%
TVS Motors 24%
Others 1%
Bajaj Auto 59%
Hero MotoCorp
8%
Honda 8%
Yamaha 6%
TVS 14%
Others 4%
Source: SIAM, PhillipCapital India Research
Page | 9 | PHILLIPCAPITAL INDIA RESEARCH
BAJAJ AUTO COMPANY UPDATE
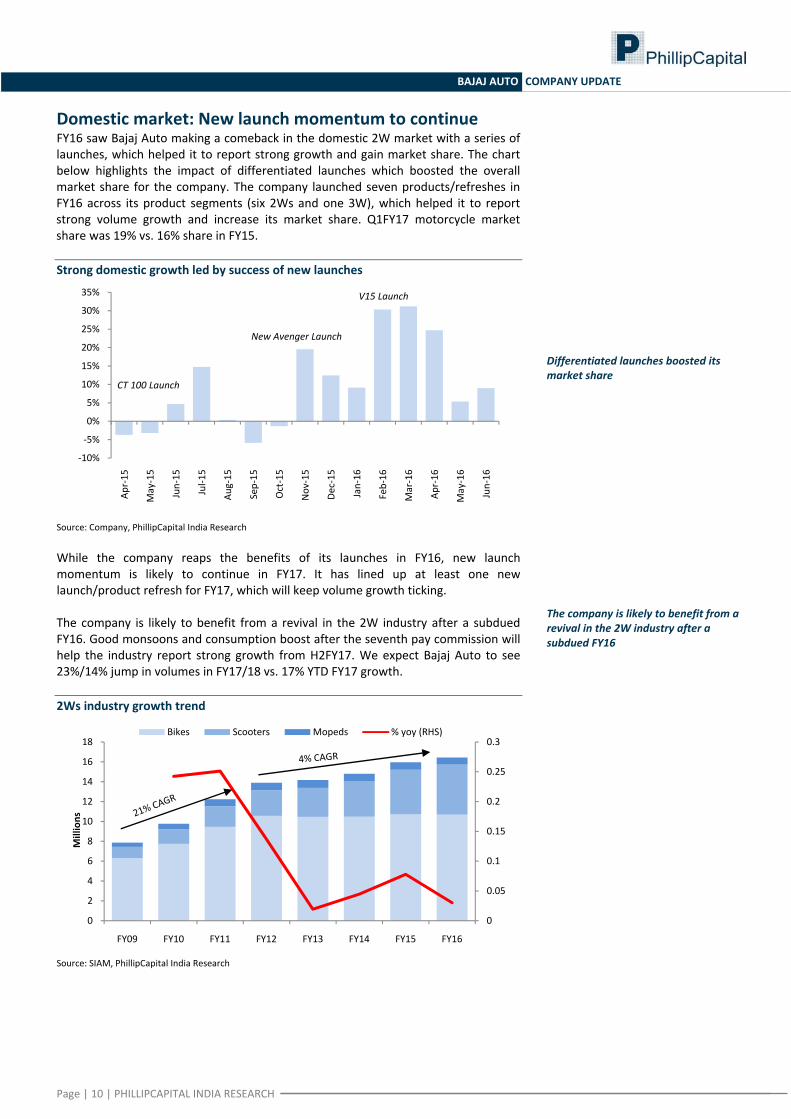
Domestic market: New launch momentum to continue FY16 saw Bajaj Auto making a comeback in the domestic 2W market with a series of launches, which helped it to report strong growth and gain market share. The chart below highlights the impact of differentiated launches which boosted the overall market share for the company. The company launched seven products/refreshes in FY16 across its product segments (six 2Ws and one 3W), which helped it to report strong volume growth and increase its market share. Q1FY17 motorcycle market share was 19% vs. 16% share in FY15. Strong domestic growth led by success of new launches
‐10%
‐5%
0%
5%
10%
15%
20%
25%
30%
35%
Apr‐15
May‐15
Jun‐15
Jul‐1
5
Aug‐15
Sep‐15
Oct‐15
Nov
‐15
Dec‐15
Jan‐16
Feb‐16
Mar‐16
Apr‐16
May‐16
Jun‐16
New Avenger Launch
V15 Launch
CT 100 Launch
Differentiated launches boosted its market share
Source: Company, PhillipCapital India Research While the company reaps the benefits of its launches in FY16, new launch momentum is likely to continue in FY17. It has lined up at least one new launch/product refresh for FY17, which will keep volume growth ticking. The company is likely to benefit from a
revival in the 2W industry after a subdued FY16
The company is likely to benefit from a revival in the 2W industry after a subdued FY16. Good monsoons and consumption boost after the seventh pay commission will help the industry report strong growth from H2FY17. We expect Bajaj Auto to see 23%/14% jump in volumes in FY17/18 vs. 17% YTD FY17 growth. 2Ws industry growth trend
0
0.05
0.1
0.15
0.2
0.25
0.3
0
2
4
6
8
10
12
14
16
18
FY09 FY10 FY11 FY12 FY13 FY14 FY15 FY16
Millions
Bikes Scooters Mopeds % yoy (RHS)
Source: SIAM, PhillipCapital India Research
Page | 10 | PHILLIPCAPITAL INDIA RESEARCH
Page | 11 | PHILLIPCAPITAL INDIA RESEARCH
BAJAJ AUTO COMPANY UPDATE
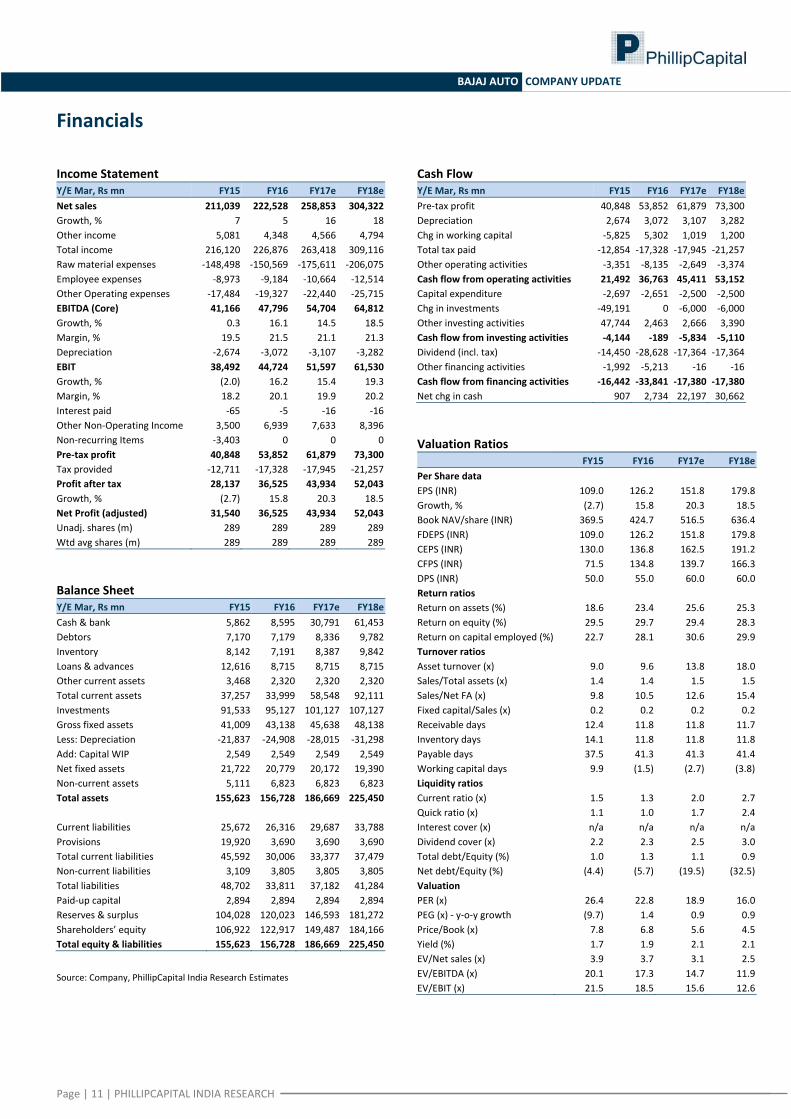
Financials
Income Statement Y/E Mar, Rs mn FY15 FY16 FY17e FY18eNet sales 211,039 222,528 258,853 304,322Growth, % 7 5 16 18Other income 5,081 4,348 4,566 4,794Total income 216,120 226,876 263,418 309,116Raw material expenses ‐148,498 ‐150,569 ‐175,611 ‐206,075Employee expenses ‐8,973 ‐9,184 ‐10,664 ‐12,514Other Operating expenses ‐17,484 ‐19,327 ‐22,440 ‐25,715EBITDA (Core) 41,166 47,796 54,704 64,812Growth, % 0.3 16.1 14.5 18.5 Margin, % 19.5 21.5 21.1 21.3 Depreciation ‐2,674 ‐3,072 ‐3,107 ‐3,282EBIT 38,492 44,724 51,597 61,530Growth, % (2.0) 16.2 15.4 19.3 Margin, % 18.2 20.1 19.9 20.2 Interest paid ‐65 ‐5 ‐16 ‐16Other Non‐Operating Income 3,500 6,939 7,633 8,396Non‐recurring Items ‐3,403 0 0 0Pre‐tax profit 40,848 53,852 61,879 73,300Tax provided ‐12,711 ‐17,328 ‐17,945 ‐21,257Profit after tax 28,137 36,525 43,934 52,043Growth, % (2.7) 15.8 20.3 18.5 Net Profit (adjusted) 31,540 36,525 43,934 52,043 Unadj. shares (m) 289 289 289 289 Wtd avg shares (m) 289 289 289 289 Balance Sheet Y/E Mar, Rs mn FY15 FY16 FY17e FY18eCash & bank 5,862 8,595 30,791 61,453Debtors 7,170 7,179 8,336 9,782Inventory 8,142 7,191 8,387 9,842Loans & advances 12,616 8,715 8,715 8,715Other current assets 3,468 2,320 2,320 2,320Total current assets 37,257 33,999 58,548 92,111Investments 91,533 95,127 101,127 107,127Gross fixed assets 41,009 43,138 45,638 48,138Less: Depreciation ‐21,837 ‐24,908 ‐28,015 ‐31,298Add: Capital WIP 2,549 2,549 2,549 2,549Net fixed assets 21,722 20,779 20,172 19,390Non‐current assets 5,111 6,823 6,823 6,823Total assets 155,623 156,728 186,669 225,450
Current liabilities 25,672 26,316 29,687 33,788Provisions 19,920 3,690 3,690 3,690Total current liabilities 45,592 30,006 33,377 37,479Non‐current liabilities 3,109 3,805 3,805 3,805Total liabilities 48,702 33,811 37,182 41,284Paid‐up capital 2,894 2,894 2,894 2,894Reserves & surplus 104,028 120,023 146,593 181,272Shareholders’ equity 106,922 122,917 149,487 184,166Total equity & liabilities 155,623 156,728 186,669 225,450 Source: Company, PhillipCapital India Research Estimates
Cash Flow Y/E Mar, Rs mn FY15 FY16 FY17e FY18ePre‐tax profit 40,848 53,852 61,879 73,300Depreciation 2,674 3,072 3,107 3,282Chg in working capital ‐5,825 5,302 1,019 1,200Total tax paid ‐12,854 ‐17,328 ‐17,945 ‐21,257Other operating activities ‐3,351 ‐8,135 ‐2,649 ‐3,374Cash flow from operating activities 21,492 36,763 45,411 53,152Capital expenditure ‐2,697 ‐2,651 ‐2,500 ‐2,500Chg in investments ‐49,191 0 ‐6,000 ‐6,000Other investing activities 47,744 2,463 2,666 3,390Cash flow from investing activities ‐4,144 ‐189 ‐5,834 ‐5,110Dividend (incl. tax) ‐14,450 ‐28,628 ‐17,364 ‐17,364Other financing activities ‐1,992 ‐5,213 ‐16 ‐16Cash flow from financing activities ‐16,442 ‐33,841 ‐17,380 ‐17,380Net chg in cash 907 2,734 22,197 30,662 Valuation Ratios
FY15 FY16 FY17e FY18ePer Share data EPS (INR) 109.0 126.2 151.8 179.8 Growth, % (2.7) 15.8 20.3 18.5 Book NAV/share (INR) 369.5 424.7 516.5 636.4 FDEPS (INR) 109.0 126.2 151.8 179.8 CEPS (INR) 130.0 136.8 162.5 191.2 CFPS (INR) 71.5 134.8 139.7 166.3 DPS (INR) 50.0 55.0 60.0 60.0 Return ratios Return on assets (%) 18.6 23.4 25.6 25.3 Return on equity (%) 29.5 29.7 29.4 28.3 Return on capital employed (%) 22.7 28.1 30.6 29.9 Turnover ratios Asset turnover (x) 9.0 9.6 13.8 18.0 Sales/Total assets (x) 1.4 1.4 1.5 1.5 Sales/Net FA (x) 9.8 10.5 12.6 15.4 Fixed capital/Sales (x) 0.2 0.2 0.2 0.2 Receivable days 12.4 11.8 11.8 11.7 Inventory days 14.1 11.8 11.8 11.8 Payable days 37.5 41.3 41.3 41.4 Working capital days 9.9 (1.5) (2.7) (3.8)Liquidity ratios Current ratio (x) 1.5 1.3 2.0 2.7 Quick ratio (x) 1.1 1.0 1.7 2.4 Interest cover (x) n/a n/a n/a n/a Dividend cover (x) 2.2 2.3 2.5 3.0 Total debt/Equity (%) 1.0 1.3 1.1 0.9 Net debt/Equity (%) (4.4) (5.7) (19.5) (32.5)Valuation PER (x) 26.4 22.8 18.9 16.0 PEG (x) ‐ y‐o‐y growth (9.7) 1.4 0.9 0.9 Price/Book (x) 7.8 6.8 5.6 4.5 Yield (%) 1.7 1.9 2.1 2.1 EV/Net sales (x) 3.9 3.7 3.1 2.5 EV/EBITDA (x) 20.1 17.3 14.7 11.9 EV/EBIT (x) 21.5 18.5 15.6 12.6
BAJAJ AUTO COMPANY UPDATE
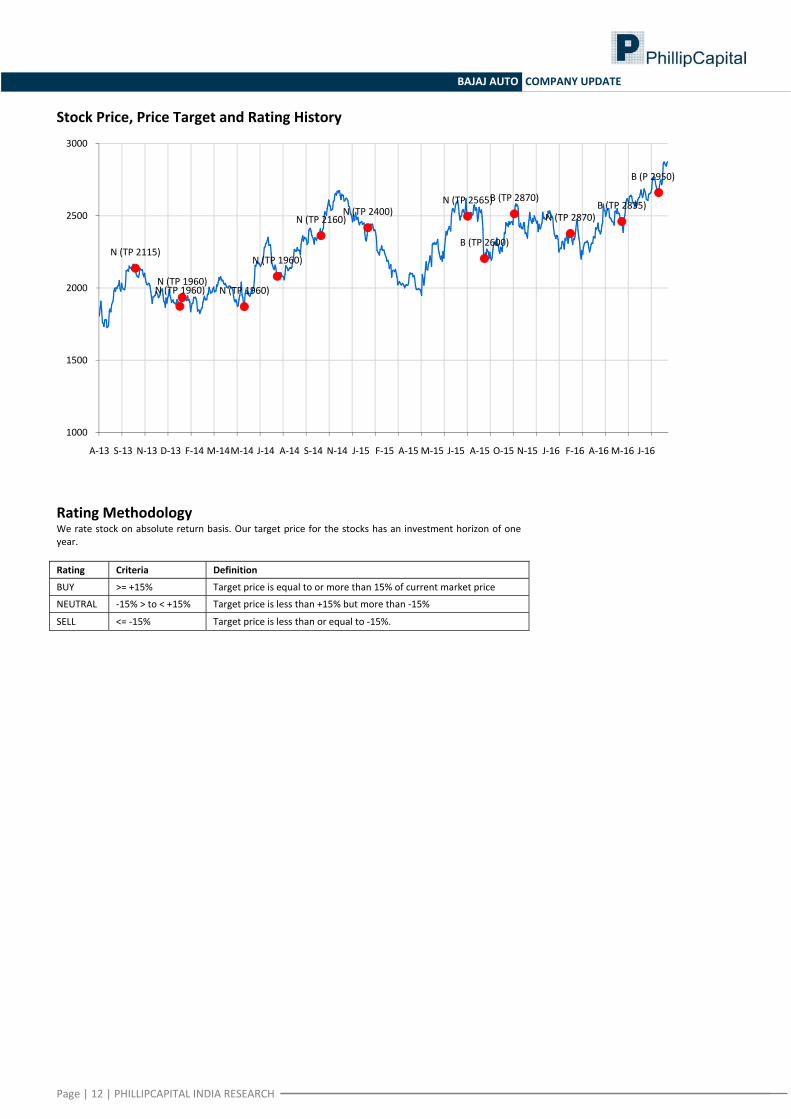
Stock Price, Price Target and Rating History
N (TP 2115)
N (TP 1960)N (TP 1960)
N (TP 1960)
N (TP 1960)
N (TP 2160)N (TP 2400)
N (TP 2565)
B (TP 2600)
B (TP 2870)
N (TP 2870)B (TP 2835)
B (P 2950)
1000
1500
2000
2500
3000
A‐13 S‐13 N‐13 D‐13 F‐14 M‐14M‐14 J‐14 A‐14 S‐14 N‐14 J‐15 F‐15 A‐15 M‐15 J‐15 A‐15 O‐15 N‐15 J‐16 F‐16 A‐16 M‐16 J‐16
Rating Methodology We rate stock on absolute return basis. Our target price for the stocks has an investment horizon of one year. Rating Criteria Definition
BUY >= +15% Target price is equal to or more than 15% of current market price
NEUTRAL ‐15% > to < +15% Target price is less than +15% but more than ‐15%
SELL <= ‐15% Target price is less than or equal to ‐15%.
Page | 12 | PHILLIPCAPITAL INDIA RESEARCH
BAJAJ AUTO COMPANY UPDATE
Page | 13 | PHILLIPCAPITAL INDIA RESEARCH
Contact Information (Regional Member Companies)
SINGAPORE: Phillip Securities Pte Ltd 250 North Bridge Road, #06‐00 Raffles City Tower,
Singapore 179101 Tel : (65) 6533 6001 Fax: (65) 6535 3834
www.phillip.com.sg
MALAYSIA: Phillip Capital Management Sdn Bhd B‐3‐6 Block B Level 3, Megan Avenue II,
No. 12, Jalan Yap Kwan Seng, 50450 Kuala Lumpur Tel (60) 3 2162 8841 Fax (60) 3 2166 5099
www.poems.com.my
HONG KONG: Phillip Securities (HK) Ltd 11/F United Centre 95 Queensway Hong Kong Tel (852) 2277 6600 Fax: (852) 2868 5307
www.phillip.com.hk
JAPAN: Phillip Securities Japan, Ltd 4‐2 Nihonbashi Kabutocho, Chuo‐ku
Tokyo 103‐0026 Tel: (81) 3 3666 2101 Fax: (81) 3 3664 0141
www.phillip.co.jp
INDONESIA: PT Phillip Securities Indonesia ANZ Tower Level 23B, Jl Jend Sudirman Kav 33A,
Jakarta 10220, Indonesia Tel (62) 21 5790 0800 Fax: (62) 21 5790 0809
www.phillip.co.id
CHINA: Phillip Financial Advisory (Shanghai) Co. Ltd. No 550 Yan An East Road, Ocean Tower Unit 2318
Shanghai 200 001 Tel (86) 21 5169 9200 Fax: (86) 21 6351 2940
www.phillip.com.cn
THAILAND: Phillip Securities (Thailand) Public Co. Ltd. 15th Floor, Vorawat Building, 849 Silom Road,
Silom, Bangrak, Bangkok 10500 Thailand Tel (66) 2 2268 0999 Fax: (66) 2 2268 0921
www.phillip.co.th
FRANCE: King & Shaxson Capital Ltd. 3rd Floor, 35 Rue de la Bienfaisance
75008 Paris France Tel (33) 1 4563 3100 Fax : (33) 1 4563 6017
www.kingandshaxson.com
UNITED KINGDOM: King & Shaxson Ltd. 6th Floor, Candlewick House, 120 Cannon Street
London, EC4N 6AS Tel (44) 20 7929 5300 Fax: (44) 20 7283 6835
www.kingandshaxson.com
UNITED STATES: Phillip Futures Inc. 141 W Jackson Blvd Ste 3050
The Chicago Board of Trade Building Chicago, IL 60604 USA
Tel (1) 312 356 9000 Fax: (1) 312 356 9005
AUSTRALIA: PhillipCapital Australia Level 37, 530 Collins Street
Melbourne, Victoria 3000, Australia Tel: (61) 3 9629 8380 Fax: (61) 3 9614 8309
www.phillipcapital.com.au
SRI LANKA: Asha Phillip Securities Limited Level 4, Millennium House, 46/58 Navam Mawatha,
Colombo 2, Sri Lanka Tel: (94) 11 2429 100 Fax: (94) 11 2429 199
www.ashaphillip.net/home.htm
INDIA: PhillipCapital (India) Private Limited No. 1, 18th Floor, Urmi Estate, 95 Ganpatrao Kadam Marg, Lower Parel West, Mumbai 400013
Tel: (9122) 2300 2999 Fax: (9122) 6667 9955 www.phillipcapital.in
Management(91 22) 2483 1919
Kinshuk Bharti Tiwari (Head – Institutional Equity) (91 22) 6667 9946(91 22) 6667 9735
Research IT Services Pharma & Speciality Chem
Dhawal Doshi (9122) 6667 9769 Vibhor Singhal (9122) 6667 9949 Surya Patra (9122) 6667 9768Nitesh Sharma, CFA (9122) 6667 9965 Shyamal Dhruve (9122) 6667 9992 Mehul Sheth (9122) 6667 9996Banking, NBFCs Infrastructure StrategyManish Agarwalla (9122) 6667 9962 Vibhor Singhal (9122) 6667 9949 Naveen Kulkarni, CFA, FRM (9122) 6667 9947Pradeep Agrawal (9122) 6667 9953 Deepak Agarwal (9122) 6667 9944 Anindya Bhowmik (9122) 6667 9764Paresh Jain (9122) 6667 9948 Logistics, Transportation & Midcap TelecomConsumer & Retail Vikram Suryavanshi (9122) 6667 9951 Naveen Kulkarni, CFA, FRM (9122) 6667 9947Naveen Kulkarni, CFA, FRM (9122) 6667 9947 Media Manoj Behera (9122) 6667 9973Jubil Jain (9122) 6667 9766 Manoj Behera (9122) 6667 9973 TechnicalsPreeyam Tolia (9122) 6667 9950 Metals Subodh Gupta, CMT (9122) 6667 9762Cement Dhawal Doshi (9122) 6667 9769 Production ManagerVaibhav Agarwal (9122) 6667 9967 Yash Doshi (9122) 6667 9987 Ganesh Deorukhkar (9122) 6667 9966Economics Midcap EditorAnjali Verma (9122) 6667 9969 Amol Rao (9122) 6667 9952 Roshan Sony 98199 72726Engineering, Capital Goods Mid‐Caps & Database Manager Sr. Manager – Equities SupportJonas Bhutta (9122) 6667 9759 Deepak Agarwal (9122) 6667 9944 Rosie Ferns (9122) 6667 9971
Oil & GasSabri Hazarika (9122) 6667 9756
Sales & Distribution Ashvin Patil (9122) 6667 9991 Sales Trader Zarine Damania (9122) 6667 9976Shubhangi Agrawal (9122) 6667 9964 Dilesh Doshi (9122) 6667 9747 Kishor Binwal (9122) 6667 9989 Suniil Pandit (9122) 6667 9745Bhavin Shah (9122) 6667 9974Ashka Mehta Gulati (9122) 6667 9934 ExecutionArchan Vyas (9122) 6667 9785 Mayur Shah (9122) 6667 9945
Corporate Communications
Vineet Bhatnagar (Managing Director)
Jignesh Shah (Head – Equity Derivatives)
Automobiles
BAJAJ AUTO COMPANY UPDATE
Disclosures and Disclaimers PhillipCapital (India) Pvt. Ltd. has three independent equity research groups: Institutional Equities, Institutional Equity Derivatives, and Private Client Group. This report has been prepared by Institutional Equities Group. The views and opinions expressed in this document may, may not match, or may be contrary at times with the views, estimates, rating, and target price of the other equity research groups of PhillipCapital (India) Pvt. Ltd.
This report is issued by PhillipCapital (India) Pvt. Ltd., which is regulated by the SEBI. PhillipCapital (India) Pvt. Ltd. is a subsidiary of Phillip (Mauritius) Pvt. Ltd. References to "PCIPL" in this report shall mean PhillipCapital (India) Pvt. Ltd unless otherwise stated. This report is prepared and distributed by PCIPL for information purposes only, and neither the information contained herein, nor any opinion expressed should be construed or deemed to be construed as solicitation or as offering advice for the purposes of the purchase or sale of any security, investment, or derivatives. The information and opinions contained in the report were considered by PCIPL to be valid when published. The report also contains information provided to PCIPL by third parties. The source of such information will usually be disclosed in the report. Whilst PCIPL has taken all reasonable steps to ensure that this information is correct, PCIPL does not offer any warranty as to the accuracy or completeness of such information. Any person placing reliance on the report to undertake trading does so entirely at his or her own risk and PCIPL does not accept any liability as a result. Securities and Derivatives markets may be subject to rapid and unexpected price movements and past performance is not necessarily an indication of future performance.
This report does not regard the specific investment objectives, financial situation, and the particular needs of any specific person who may receive this report. Investors must undertake independent analysis with their own legal, tax, and financial advisors and reach their own conclusions regarding the appropriateness of investing in any securities or investment strategies discussed or recommended in this report and should understand that statements regarding future prospects may not be realised. Under no circumstances can it be used or considered as an offer to sell or as a solicitation of any offer to buy or sell the securities mentioned within it. The information contained in the research reports may have been taken from trade and statistical services and other sources, which PCIL believe is reliable. PhillipCapital (India) Pvt. Ltd. or any of its group/associate/affiliate companies do not guarantee that such information is accurate or complete and it should not be relied upon as such. Any opinions expressed reflect judgments at this date and are subject to change without notice.
Important: These disclosures and disclaimers must be read in conjunction with the research report of which it forms part. Receipt and use of the research report is subject to all aspects of these disclosures and disclaimers. Additional information about the issuers and securities discussed in this research report is available on request.
Certifications: The research analyst(s) who prepared this research report hereby certifies that the views expressed in this research report accurately reflect the research analyst’s personal views about all of the subject issuers and/or securities, that the analyst(s) have no known conflict of interest and no part of the research analyst’s compensation was, is, or will be, directly or indirectly, related to the specific views or recommendations contained in this research report.
Additional Disclosures of Interest: Unless specifically mentioned in Point No. 9 below: 1. The Research Analyst(s), PCIL, or its associates or relatives of the Research Analyst does not have any financial interest in the company(ies) covered in
this report. 2. The Research Analyst, PCIL or its associates or relatives of the Research Analyst affiliates collectively do not hold more than 1% of the securities of the
company (ies)covered in this report as of the end of the month immediately preceding the distribution of the research report. 3. The Research Analyst, his/her associate, his/her relative, and PCIL, do not have any other material conflict of interest at the time of publication of this
research report. 4. The Research Analyst, PCIL, and its associates have not received compensation for investment banking or merchant banking or brokerage services or for
any other products or services from the company(ies) covered in this report, in the past twelve months. 5. The Research Analyst, PCIL or its associates have not managed or co‐managed in the previous twelve months, a private or public offering of securities for
the company (ies) covered in this report. 6. PCIL or its associates have not received compensation or other benefits from the company(ies) covered in this report or from any third party, in
connection with the research report. 7. The Research Analyst has not served as an Officer, Director, or employee of the company (ies) covered in the Research report. 8. The Research Analyst and PCIL has not been engaged in market making activity for the company(ies) covered in the Research report. 9. Details of PCIL, Research Analyst and its associates pertaining to the companies covered in the Research report: Sr. no. Particulars Yes/No
1 Whether compensation has been received from the company(ies) covered in the Research report in the past 12 months for investment banking transaction by PCIL
No
2 Whether Research Analyst, PCIL or its associates or relatives of the Research Analyst affiliates collectively hold more than 1% of thecompany(ies) covered in the Research report
No
3 Whether compensation has been received by PCIL or its associates from the company(ies) covered in the Research report No4 PCIL or its affiliates have managed or co‐managed in the previous twelve months a private or public offering of securities for the
company(ies) covered in the Research report No
5 Research Analyst, his associate, PCIL or its associates have received compensation for investment banking or merchant banking or brokerage services or for any other products or services from the company(ies) covered in the Research report, in the last twelve months
No
Independence: PhillipCapital (India) Pvt. Ltd. has not had an investment banking relationship with, and has not received any compensation for investment banking services from, the subject issuers in the past twelve (12) months, and PhillipCapital (India) Pvt. Ltd does not anticipate receiving or intend to seek compensation for investment banking services from the subject issuers in the next three (3) months. PhillipCapital (India) Pvt. Ltd is not a market maker in the securities mentioned in this research report, although it, or its affiliates/employees, may have positions in, purchase or sell, or be materially interested in any of the securities covered in the report.
Suitability and Risks: This research report is for informational purposes only and is not tailored to the specific investment objectives, financial situation or particular requirements of any individual recipient hereof. Certain securities may give rise to substantial risks and may not be suitable for certain investors. Each investor must make its own determination as to the appropriateness of any securities referred to in this research report based upon the legal, tax and accounting considerations applicable to such investor and its own investment objectives or strategy, its financial situation and its investing experience. The value of any security may be positively or adversely affected by changes in foreign exchange or interest rates, as well as by other financial, economic, or political factors. Past performance is not necessarily indicative of future performance or results.
Page | 14 | PHILLIPCAPITAL INDIA RESEARCH
Page | 15 | PHILLIPCAPITAL INDIA RESEARCH
BAJAJ AUTO COMPANY UPDATE
Sources, Completeness and Accuracy: The material herein is based upon information obtained from sources that PCIPL and the research analyst believe to be reliable, but neither PCIPL nor the research analyst represents or guarantees that the information contained herein is accurate or complete and it should not be relied upon as such. Opinions expressed herein are current opinions as of the date appearing on this material, and are subject to change without notice. Furthermore, PCIPL is under no obligation to update or keep the information current.Without limiting any of the foregoing, in no event shall PCIL, any of its affiliates/employees or any third party involved in, or related to computing or compiling the information have any liability for any damages of any kind including but not limited to any direct or consequential loss or damage, however arising, from the use of this document.
Copyright: The copyright in this research report belongs exclusively to PCIPL. All rights are reserved. Any unauthorised use or disclosure is prohibited. No reprinting or reproduction, in whole or in part, is permitted without the PCIPL’s prior consent, except that a recipient may reprint it for internal circulation only and only if it is reprinted in its entirety.
Caution: Risk of loss in trading/investment can be substantial and even more than the amount / margin given by you. The recipient should carefully consider whether trading/investment is appropriate for the recipient in light of the recipient’s experience, objectives, financial resources and other relevant circumstances. PCIPL and any of its employees, directors, associates, group entities, or affiliates shall not be liable for losses, if any, incurred by the recipient. The recipient is further cautioned that trading/investments in financial markets are subject to market risks and are advised to seek trading/investment advice before investing. There is no guarantee/assurance as to returns or profits or capital protection or appreciation. PCIPL and any of its employees, directors, associates, group entities, affiliates are not inducing the recipient for trading/investing in the financial market(s). Trading/Investment decision is the sole responsibility of the recipient.
For U.S. persons only: This research report is a product of PhillipCapital (India) Pvt Ltd., which is the employer of the research analyst(s) who has prepared the research report. The research analyst(s) preparing the research report is/are resident outside the United States (U.S.) and are not associated persons of any U.S.‐regulated broker‐dealer and therefore the analyst(s) is/are not subject to supervision by a U.S. broker‐dealer, and is/are not required to satisfy the regulatory licensing requirements of FINRA or required to otherwise comply with U.S. rules or regulations regarding, among other things, communications with a subject company, public appearances, and trading securities held by a research analyst account.
This report is intended for distribution by PhillipCapital (India) Pvt Ltd. only to "Major Institutional Investors" as defined by Rule 15a‐6(b)(4) of the U.S. Securities and Exchange Act, 1934 (the Exchange Act) and interpretations thereof by the U.S. Securities and Exchange Commission (SEC) in reliance on Rule 15a 6(a)(2). If the recipient of this report is not a Major Institutional Investor as specified above, then it should not act upon this report and return the same to the sender. Further, this report may not be copied, duplicated, and/or transmitted onward to any U.S. person, which is not a Major Institutional Investor.
In reliance on the exemption from registration provided by Rule 15a‐6 of the Exchange Act and interpretations thereof by the SEC in order to conduct certain business with Major Institutional Investors, PhillipCapital (India) Pvt Ltd. has entered into an agreement with a U.S. registered broker‐dealer, Decker & Co, LLC. Transactions in securities discussed in this research report should be effected through Decker & Co, LLC or another U.S. registered broker dealer PhillipCapital (India) Pvt. Ltd. Registered office: No. 1, 18th Floor, Urmi Estate, 95 Ganpatrao Kadam Marg, Lower Parel West, Mumbai 400013