Embed Size (px)
Citation preview
Institutional Quality, Trade Costs and Trade in Intermediate
Goods
June 15, 2017
Hea-Jung Hyun
Kyung Hee University
Abstract
Recently published studies stress the importance of trade in intermediate goods. The literature on
determinants of trade, however, have largely focused on the sources of comparative advantage in
determining aggregate trade flows rather than trade in intermediate goods. Therefore, in this paper the
role of institutional quality and trade costs to explain the determinants of trade in intermediates is
examined. Our simple model is based on the model of comparative advantage in the gravity
framework used by Eaton and Kortum (2002) and Chor (2010) to relate trade flows of intermediate
goods to institutional parameters, factor endowments and geography. Our empirical tests using a data
set containing 172 countries and 17 industries spanning 10 years confirm the theoretical prediction
that a country with higher institutional quality has a comparative advantage in institution-intensive
goods and trade costs have a negative effect on trade. We further find that these effects are stronger in
share of trade in intermediate goods vis-à-vis final goods.
Keywords: Trade in intermediate goods, Institutions, Trade costs
JEL Classification: F12, D23
1. Introduction
In the past few decades, the world has witnessed trade in intermediate goods as the most rapidly
growing component of trade. Hummels et al. (2001) showed that growth in vertical specialization can
account for 30% of the growth in exports of 10 Organization for Economic Co-Operation and
Development (OECD) countries and 4 emerging market countries between 1970 and 1990. Between
1992 and 2006, intermediate input trade reportedly grew approximately 11.9% a year (Yi, 2003;
Hummels et al., 2001, Feenstra, 1998, UNCTAD, 2008). This resulted in an increase in studies
examining the importance of trade in intermediate goods. Following the earlier works (Ethier, 1982;
Sanyal and Jones, 1982; Jones and Kierzkowski, 1990; Deardorff, 1998), recent studies attempted to
rediscover the significant role of trade in intermediate goods to explain the nature of globalization
(Hummels et al., 2001; Yi, 2003; Antras et al., 2006; Grossman and Rossi-Hansberg, 2008; Bergstrand
and Egger, 2010; Johnson and Noguera, 2012a, 2012b, Baldwin and Taglioni, 2014).
There are two distinct features of trade in intermediate goods. First, intermediate goods might cross
borders several times for additional value before turning into final goods. Each time these goods cross
a border, trade costs are incurred. Consequently, global reductions in tariffs and transport costs lead to
a significant reduction in the cost of producing these goods (Yi, 2003). Accordingly, trade in
intermediate goods may be more sensitive to factor costs and geographic barriers compared with trade
in final goods. Thus, location, through its effect on input costs is important when determining the
pattern of specialization in intermediate goods (Eaton and Kortum, 2002). Second, trade in
intermediate goods is responsive to contract environment as transaction occurs between upstream
supplier and downstream buyer. Facing incomplete contracts, the upstream firm producing an
intermediate input with highly relationship-specific investment has an incentive to underinvest to
avoid risk of appropriation by the downstream firm. This hold-up problem and related transaction
costs may be low in a country with high institutional quality, that is, the relationship-specific goods
can be produced with higher productivity in countries with better contract enforcement (Nunn, 2007;
Levchenko, 2007). This effect can be more pronounced with trade in intermediate goods as the hold-
up problem may be more significant in the production of intermediates rather than final goods (Lanz,
2010). Thus, institutional quality may be an important factor for trade in intermediate goods with high
intensity of contract.
The importance of institutions has long been discussed in the trade literature. Institutional variables
such as legal and political systems provide the incentive structure for exchange determining the
transaction and transformation costs in an economy (North, 1990). The quality of institutions is
important not only for economic development (La Porta et al., 1997, 1998; Acemoglu et al.,
2001,2002) and capital flows (McLaren, 2000; Wei, 2000; Ornelas and Turner 2005; Alfaro et al.,
1
2005; Hyun and Kim, 2010), but also for international trade (Anderson and Marcouiller, 2002;
Costinot, 2005; Nunn, 2007; Levchenko, 2007; Chor, 2010). These recent studies showed that
countries with better institutions export relatively more in sectors for which relationship-specificity is
important; institutions can be a source of comparative advantage determining the pattern of trade.
Given the potential direct effects of contract incompleteness on the profitability of firms, the hold-up
problem of underinvestment in the production of intermediates can incur higher costs for the
downstream firm than the final good consumer. Accordingly, trade in intermediate goods compared
with trade in final goods is more likely to be responsive to quality of institutions. The literature,
however, is largely focused on the relationship between institutions and aggregate trade, while studies
investigating the role of institutions on trade in disaggregated sectors, especially on intermediate
goods are limited both theoretically and empirically.
Therefore, in the present study the role of institutional quality and trade costs to explain the
determinants of trade in intermediate goods is examined. Our work is based on recent models of
international trade that incorporate both the Ricardian and Heckscher-Ohlin models in the structures
which resembles the gravity equations. We present an extension of the Eaton and Kortum (2002)
model and Chor (2010) to explore the sources of comparative advantage when determining trade flow
driven by the interaction between industry and country attributes in one hand and adopt the model of
trade in intermediates from Caliendo and Parro (2015) in another. In an attempt to quantify the
importance of different determinants of trade flows, Chor (2010) extended the Eaton-Kortum model,
in which comparative advantage is determined by the interaction between country and industry
characteristics. He showed that factor endowments, financial development, legal institutions and labor
market regimes are important sources of comparative advantage.
For empirical analysis, we use country-industry pair data encompassing 172 countries, 17
manufacturing industries and 10-year time series panels from 2000-2009 to test the validity of
conventional trade theory of comparative advantage in the gravity framework. Using our country-
industry level time series data we investigate whether the institutional quality and trade costs play a
significant role in determining a pattern of trade; more specifically, whether the country with high
institutional quality has comparative advantage in producing institution-intensive goods (which
requires favorable environment for contract enforcement), whether country-industry specific trade
costs function as barriers to trade in intermediate goods and how important these effects are.
To highlight the distinct nature of trade in intermediate goods, we separate industry trade flows as
intermediate input trade and final goods (consumption goods) trade to compare the importance of
different sources of comparative advantage among different type of trade flows. Unlike Eaton and
Kortum (2002) and Chor (2010) who used cross-sectional data for final goods trade, our 10-year 2
industry level panel data is used to compare the relative importance of institutions and geography as
determinants in trade in intermediate goods compared to final goods trade and capture the
macroeconomic time variant factors as well as industry-country pair characteristics. A significant
caveat in gravity regression is that an empirical finding may often be driven by omitted variables.
Inclusion of a set of country variables such as GDP, production costs and institutional level may still
allow omitted variables to bias the estimation. To avoid this problem, we include a fixed effect of
exporter and importer as well as industry and year, instead of a set of country characteristics.
The results of our study are in agreement with the theoretical prediction in that both institutions and
trade costs are significant factors in explaining trade patterns and are more important in trade in
intermediate goods than trade in final goods.
The remainder of this paper is organized as follows: In section 2 we develop a simple theoretical
framework that captures the forces of institutional quality and trade costs. In section 3 we provide
empirical specifications to test theoretical hypotheses and describe the data. In section 4 the empirical
results of the main regression and robustness checks are presented. Section 5 is the conclusion.
2. Model
There are three theoretical arguments on the determinants of intermediate goods trade. First,
differences in factor intensity across production stages combined with factor abundances across
regions are sources of comparative advantages and determinants of trade in intermediate inputs
(Jones, 2000; Jones and Kierzkowski, 2003). Second, vertical specialization surges due to increased
productivity through reduction in trade costs. Third, recent studies have emphasized the role of
interaction between institutional quality at the country-level and relationship-specificity at the
industry level (Levchenko, 2007; Nunn, 2007). Nunn (2007) showed that countries with better
institutional quality provided better contract enforcement and tended to have a comparative advantage
in industries with high intensity of relationship-specificity. This is due to the hold-up problem that
may emerge for highly relationship-specific products rather than standardized products. The contract
theory, originally pioneered by Williamson (1975, 1986), suggests that when contracts are incomplete,
the contracting parties have incentive to underinvest to reduce the risk of appropriation. Subsequently,
countries with a better environment for contract enforcement have a comparative advantage in
producing goods intensively and use relationship-specific inputs where contract enforcement is
important. Further questions may arise as to whether this effect is stronger in which component of
trade.
3
Based on the above arguments, our model builds on the model of comparative advantage proposed
by Eaton and Kortum (2002) and Chor (2010) in the gravity framework incorporating the model of
trade in intermediate goods by Caliendo and Parro (2015). The first, the neoclassical model, reaffirms
the difference in technology and factor abundance as determinants of comparative advantage. Eaton
and Kortum (2002) developed and quantified a Ricardian model of international trade that
incorporates a role of geography, in which the competing forces of comparative advantage facilitating
trade and geographical barriers exist in a multi-country setting1. In a similar context, Chor (2010)
extended Eaton and Kortum’s (2002) model to explain industry level trade flows. The set of
geographical variables are embodied in trade costs that are negatively related with productivity.
Second, we explicitly model trade in intermediate goods employing Caliendo and Parro (2015) which
develops a model with trade in intermediate goods and sectoral linkages.
2.1 Production
In our model, production technology of intermediates is constant returns to scale and markets are
perfectly competitive. On the demand side, consumers are the final good producers in the importing
country. We first solve for the final good sector in country n’s demand for intermediate goods and then
each intermediate input supplier’s supply and pricing decisions in country i for the given demand
schedule. The constant elasticity of substitution (CES) objective function of producers of the final
composite intermediate good in country n buying traded intermediate inputs is given by:
Qnk=[ ∫k∈K
❑
qnk (ωk)(σ−1)/σ d ωk ]
σ /(σ−1)
, (1)
where a continuum of varieties of intermediate goods ω∈[0,1] is produced in each sector k∈K , the
qnk (ωk) denotes the quantity demanded for intermediate input ω of sector k consumed in country n
and σ> 1 is elasticity of substitution across products. Then, the production technology of
intermediate good ωk is
qnk ( ωk )=Zn
k (ωk )mnk (ωk )∏
f =0
F
[V nfk (ωk )]γ f
k
(2)
where Znk ( ωk )is the Ricardian efficiency of producing intermediate good ωk in country n, mn
k (ωk)is a
composite intermediate good used to produce intermediate good ωk and V nfk (ωk ) is factor f ∈ [0 , F ]
1 Romalis (2004) integrated Dornbusch et al.’s (1980) model with a continuum of goods and Krugman’s (1980) model of monopolistic competition confirming the validity of a factor proportions model in a multi-country setting. Similar to the latter model, gravity forces are also included in our model.
4
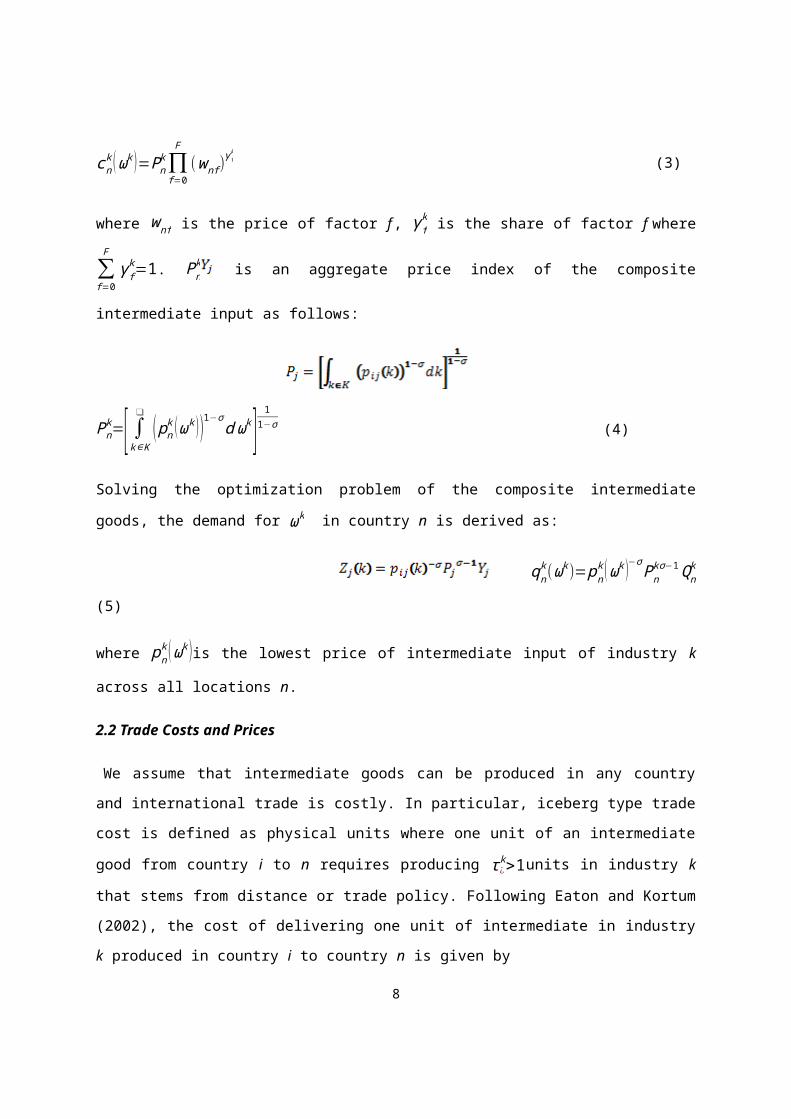
to produce intermediate ωk. The unit production cost, cnk (ωk ) is specified as Cobb-Douglas aggregate
over factor prices and the prices of composite intermediate goods as follows.
cnk (ωk )=Pn
k ∏f =0
F
(wnf )γf
k
(3)
where wnf is the price of factor f , γfk is the share of factor f where ∑
f=0
F
γ fk=1. Pn
k is an aggregate price
index of the composite intermediate input as follows:
Pnk=[ ∫k∈K
❑
( pnk (ωk ))1−σ
d ωk ]1
1−σ (4)
Solving the optimization problem of the composite intermediate goods, the demand for ωk in country
n is derived as:
qnk (ωk)=pn
k ( ωk )−σ Pnkσ−1Qn
k (5)
where pnk (ωk )is the lowest price of intermediate input of industry k across all locations n.
2.2 Trade Costs and Prices
We assume that intermediate goods can be produced in any country and international trade is costly.
In particular, iceberg type trade cost is defined as physical units where one unit of an intermediate
good from country i to n requires producing τ ¿k>1units in industry k that stems from distance or trade
policy. Following Eaton and Kortum (2002), the cost of delivering one unit of intermediate in industry
k produced in country i to country n is given by
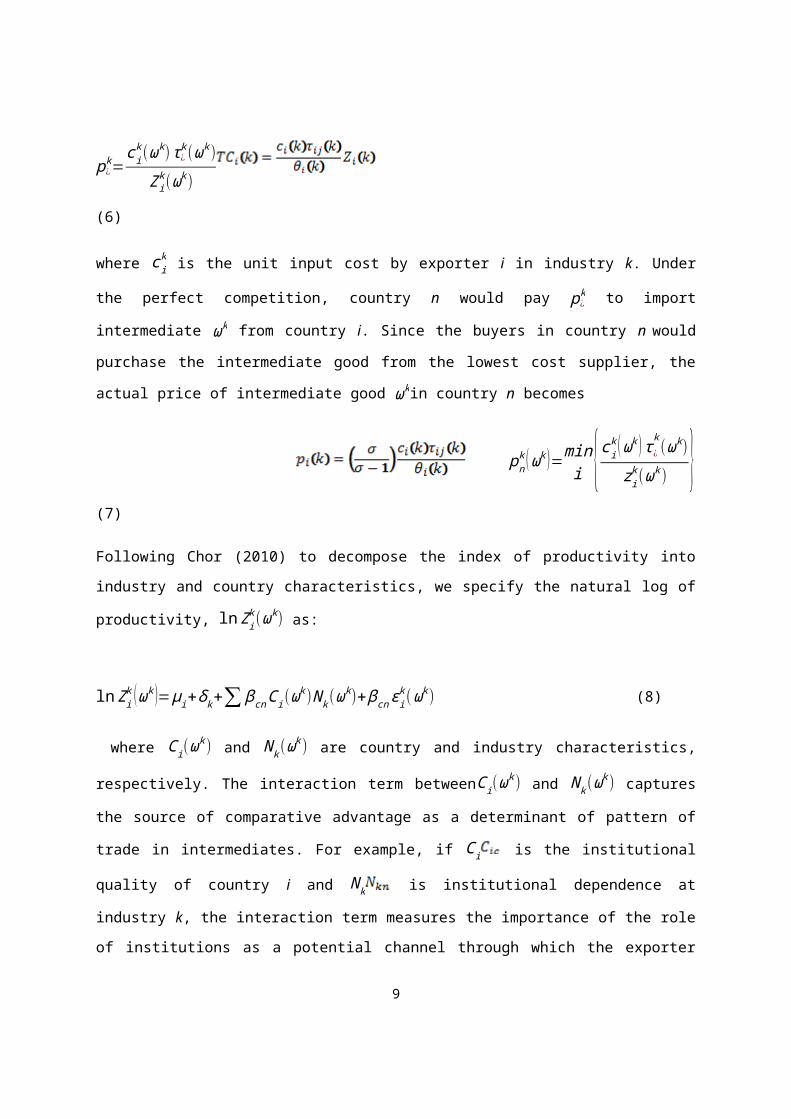
p¿k=
c ik (ωk )τ¿
k (ωk)Z i
k (ωk )
(6)
where c ik is the unit input cost by exporter i in industry k. Under the perfect competition, country n
would pay p¿k to import intermediate ωk from country i. Since the buyers in country n would purchase
the intermediate good from the lowest cost supplier, the actual price of intermediate good ωkin
country n becomes
5
pnk (ωk )=min
i {cik (ωk ) τ ¿
k(ωk )
z ik (ωk) } (7)
Following Chor (2010) to decompose the index of productivity into industry and country
characteristics, we specify the natural log of productivity, ln Z ik (ωk) as:
ln Z ik ( ωk )=μ i+δ k+∑ βcnC i(ω
k) N k (ωk)+βcn ϵ i
k (ωk ) (8)
where C i(ωk ) and N k (ωk ) are country and industry characteristics, respectively. The interaction
term betweenC i(ωk ) and N k (ωk ) captures the source of comparative advantage as a determinant of
pattern of trade in intermediates. For example, if C i is the institutional quality of country i and N k is
institutional dependence at industry k, the interaction term measures the importance of the role of
institutions as a potential channel through which the exporter can produce institution-intensive
intermediate good ωk at a certain productivity level. If countries with better institutions produce more
highly relationship-specific intermediate inputs compared to countries with weak contract
enforcement, then the quality of institutions are assumed to play a role as a source of comparative
advantage in intermediate input trade. μi and δ k are the exporter and industry-specific effects,
respectively. ϵ ik, stochastic term of productivity is independent draw from the type I extreme value
distribution.
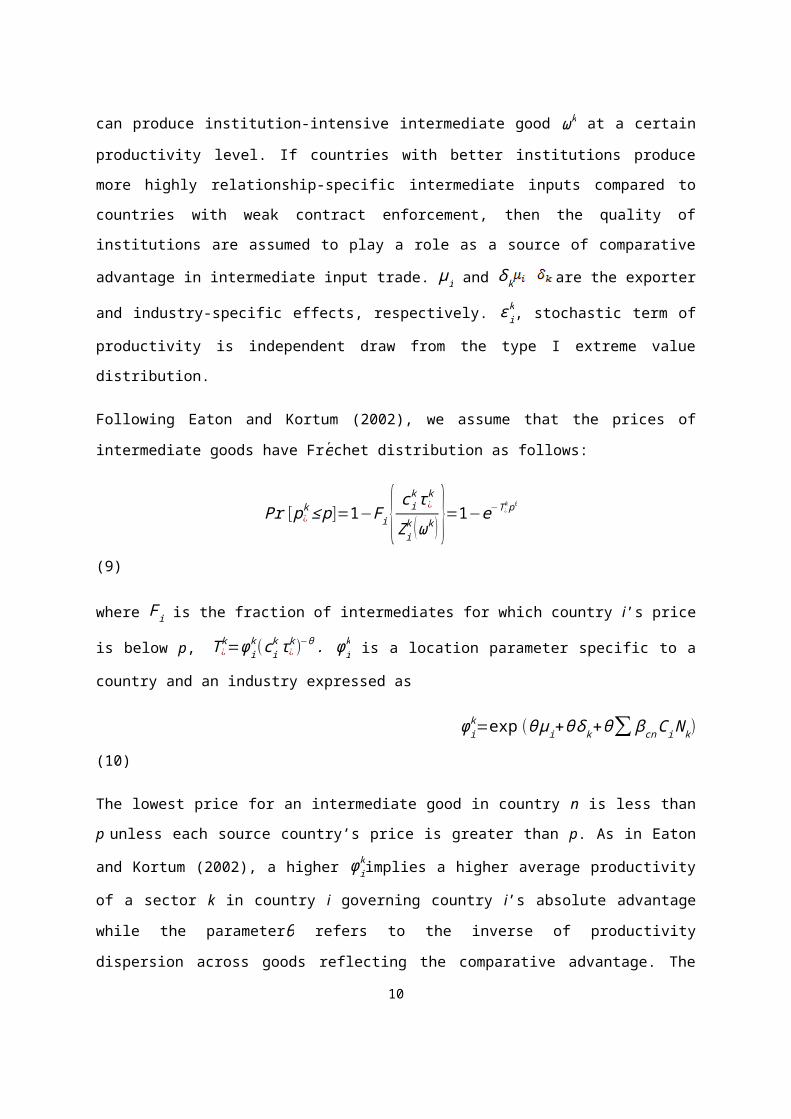
Following Eaton and Kortum (2002), we assume that the prices of intermediate goods have Frechet
distribution as follows:
Pr [ p¿k ≤ p]=1−F i{ c i
k τ¿k
Z ik ( ωk ) }=1−e−T¿
k pθ
(9)
where F i is the fraction of intermediates for which country i’s price is below p, T ¿k=φ i
k (c ik τ¿
k )−θ . φ ik
is a location parameter specific to a country and an industry expressed as
φ ik=exp (θ μi+θ δ k+θ∑ βcn C i N k ) (10)
The lowest price for an intermediate good in country n is less than p unless each source country’s
price is greater than p. As in Eaton and Kortum (2002), a higher φ ikimplies a higher average
productivity of a sector k in country i governing country i’s absolute advantage while the parameterθ
refers to the inverse of productivity dispersion across goods reflecting the comparative advantage. The
6
larger is θ, the smaller the dispersion of productivity and the higher the probability that country n
buys intermediate good in industry k from the country with relatively low costs.
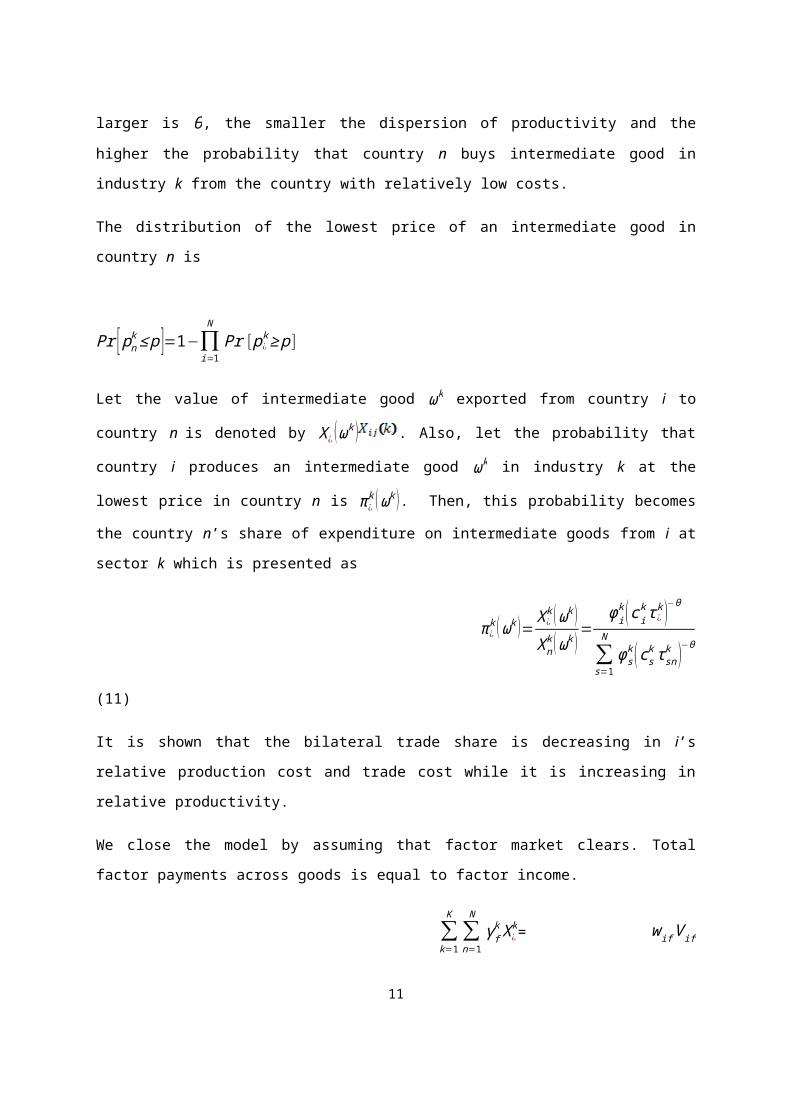
The distribution of the lowest price of an intermediate good in country n is
Pr [ pnk ≤ p ]=1−∏
i=1
N
Pr [ p¿k ≥ p]
Let the value of intermediate good ωk exported from country i to country n is denoted by X ¿ ( ωk ).
Also, let the probability that country i produces an intermediate good ωk in industry k at the lowest
price in country n is π¿k (ωk ). Then, this probability becomes the country n’s share of expenditure on
intermediate goods from i at sector k which is presented as
π¿k (ωk )= X ¿
k (ωk )Xn
k (ωk )=
φik (ci
k τ ¿k )−θ
∑s=1
N
φsk (cs
k τ snk )−θ (11)
It is shown that the bilateral trade share is decreasing in i’s relative production cost and trade cost
while it is increasing in relative productivity.
We close the model by assuming that factor market clears. Total factor payments across goods is equal
to factor income.
∑k =1
K
∑n=1
N
γ fk X¿
k= w if V if (12)
3. Empirical Specification
3.1. Empirical Model
3.1.1. The Determinants of Trade in Intermediate Goods
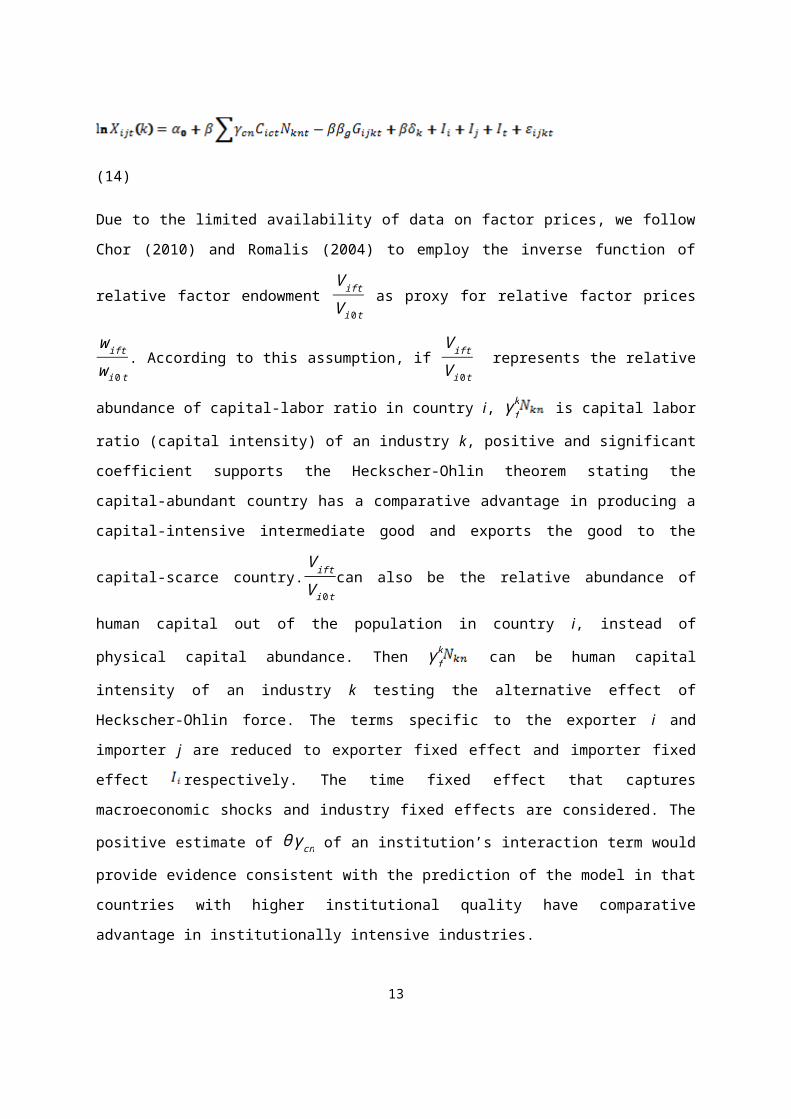
Using the truncated OLS estimation method, our empirical analysis tests the prediction of the roles
of trade cost and institutional quality as sources of comparative advantage in intermediate input trade.
To analyze the impact of trade costs on industry trade flows in the gravity model framework, we
specify the natural log of trade cost as follows:
ln τ ¿k=β gG¿
k+∂k+ε ¿+v¿k (13)
7
where G¿k is a set of geographical variables that can affect trade cost such as physical distance (or
FOB shipping costs at the country-industry level) and trade policy as tariff barriers, colonial ties,
common language, sharing a border, and Regional Trade Agreements (RTA). The natural log of trade
cost may be industry specific by ∂k, country-pair specific by ε ¿, or country-pair-industry specific by
v¿k. Substituting equation (10) and (13) using ∑
f=0
F
γ fk=1 into (11) at time t and taking natural log can
yield the estimating equation for export of intermediate good ωk from country i to n:
ln X∫¿k ( ωk)=−θ ¿ ¿¿ (14)
Due to the limited availability of data on factor prices, we follow Chor (2010) and Romalis (2004) to
employ the inverse function of relative factor endowment V ift
V i 0 t as proxy for relative factor prices
w ift
wi 0 t
. According to this assumption, if V ift
V i 0 t represents the relative abundance of capital-labor ratio in
country i, γfk is capital labor ratio (capital intensity) of an industry k, positive and significant
coefficient supports the Heckscher-Ohlin theorem stating the capital-abundant country has a
comparative advantage in producing a capital-intensive intermediate good and exports the good to the
capital-scarce country.V ift
V i 0 tcan also be the relative abundance of human capital out of the population
in country i, instead of physical capital abundance. Then γfk can be human capital intensity of an
industry k testing the alternative effect of Heckscher-Ohlin force. The terms specific to the exporter i
and importer j are reduced to exporter fixed effect and importer fixed effect respectively. The time
fixed effect that captures macroeconomic shocks and industry fixed effects are considered. The
positive estimate of θ γ cn of an institution’s interaction term would provide evidence consistent with
the prediction of the model in that countries with higher institutional quality have comparative
advantage in institutionally intensive industries.
Measurement of Institutional Variables
We follow Nunn (2007), Rauch (1999) and Chor (2010) to construct the proxy for institutional
intensity. Nunn (2007) tested the hypothesis whether countries with better contract enforcement
export relatively more in industries with relationship-specific investments. The relationship specificity
RSk at industry k is constructed as below:
RSk=∑l
k
φl z lrs2
8
z lrs 2=∑
ms lm (Rm
no+ Rmref price ) (11)
whereRmno is the share of input m for which it is neither reference priced nor sold at organized
exchange, Rmref price is the share of input m which is not sold on an organized exchange but is reference
priced and slm is the proportion of value of input m out of the total value of all inputs used in industry
l. To aggregate the 4-digit U.S. input-output (IO-87) classification used in Nunn (2007) to the UN
BEC 2-digit industry classification used in this paper, we construct RSk , the weighted average of z lrs 2
using φ l, the share (value) of industry l out of the total input value of industries based on Rauch
(1999) and Chor (2010). The country level institutional quality in country i at time t is measured as
law and order (Law¿), property rights (Pro¿), or contract enforcement (Contract ¿¿. Thus, the
interaction term between the log taken institutional quality in country i and the relationship specificity
of an industry k at year t is indicated asLaw¿× RSkt,Pro¿ × RSkt, and Contract ¿× RS kt.
3.1.2. Determinants of Trade in Intermediate Goods vs. Final Goods
To examine the role of determinants on trade in intermediates compared to final goods, we need to
test whether the difference in coefficients are statistically significant. We decompose the trade into
intermediates and final goods and take the natural logarithm of the ratio between trade value of
intermediate goods and that of final goods as dependent variable instead of the level of trade value.
Since the ratio of trade in intermediate goods is the inverse of the ratio of trade in final goods, our
estimations on the ratio of intermediates trade can account for the relative responsiveness of trade in
intermediates and final goods to set of determinants.
3.1.3. The Extensive and Intensive Margins of Trade in Intermediate Goods
Since the share of trade in intermediate goods has many zeros, we further employ the 2- stage
Heckman selection estimation method to control for zero trade flows and sample selection bias. Table
1 shows that approximately 41% of exports in intermediate goods and 50% of exports in final goods
are zero flows in our industry level data set2. Linders and Groot (2006) show that the conventional
log-linear gravity model cannot directly account for the occurrence of zero flows between countries.
2 Using aggregate trade data, Helpman et al. (2008) also reported that approximately half of the bilateral trade matrix is filled with zeros.
9
Since we use the log-linearized trade value in table 3 and the ratio of trade value of intermediates in
table 4 as the dependent variable, zero values are automatically dropped. These dropped zero flows
may be the outcome of the binary decision to export or not and the procedures without considering
zero flows may lead to sample selection bias when the zeros in the sample are not random and the
probability of trading depends on trade costs. This is a violation of the first OLS assumption, which
can lead to biased and inconsistent parameter estimates because the sample selection problem creates
bias if the error terms in the selection and outcome equations are correlated. An alternative solution
proposed in the literature is to use a Heckman sample selection model. While other methods treat zero
flows as nonexistent, Heckman considers them unobserved. The problem associated with the zeros in
trade data can be cured with a two stage Heckman sample selection model3. Since our interest lies in
the relative importance of the determinants of trade in intermediates vis-à-vis trade in final goods, we
examine the effects on the ratio of intermediates trade value over the final goods trade value. The first
step probit model of Heckman selection procedure to explore the extensive margins of the ratio of the
intermediates trade on the binomial decision variable takes 1 if the ratio of trade in intermediate goods
over the trade value of final goods is positive and zero otherwise. The second stage model for
intensive margins take the ratio of trade in intermediate goods as dependent variable of the outcome
equation.
3.2. Data
The data source of bilateral trade is the United Nations Broad Economic Categories (UN BEC)
database. Our data consist of 172 countries and 17 industries spanning a 10-year period (2000-2009).
The same dataset is used to construct the intermediate input trade ((Lanz (2010), Türkcan (2005),
Choi (2005), Choi and Han (2008), Gamberoni et. al. (2010), European Commission (2010)). For
industry-country pair analyses, these works utilize the International Standard Industrial Classification
(ISIC), Standard International Trade Classification (SITC), Harmonized Commodity Description and
Coding System (HS) and BEC code. In this paper we employ the 4-digit ISIC Rev. 3 (except services
sectors), 6-digit HS 1992 and BEC code. The harmonizing code is obtained from the World Integrated
Trade Solution (WITS). See Appendix 1 and 2 for details regarding how we construct the data.
To capture the institutional quality of host countries, we use annual data from the International
Country Risk Guide and Freedom House, which reports the quality of various institutions. We first
select law and order because it is one of the most relevant variables for economic performances
reported in the literature (Rigobon and Rodrik, 2005). The score on the law and order variable 3 In the survey paper, Gomez-Herrera showed the Heckman, truncated OLS and panel random effect model are closest to the real distribution and perform better than Tobit and OLS estimation with modified dependent variable (OLS(1+x)).
10
provides an assessment of the strength of the legal system and observance of the law. The score is
measured on a scale ranging from 0 to a bounded random number 6. We use the normalized
components as a proxy for the institutional quality4. A score of zero indicates the presence of
institutions of very low quality and a maximum score denotes the presence of institutions of very high
quality for any given country. The data on property rights is from Freedom House. Other institutional
data such as the number of contract procedures (indicated as Contract) are collected from the World
Development Indicator (WDI). For simplicity and consistency in interpretation of the role of
institutions with property rights and law and order, where the large size of the variables imply higher
institutional quality, we take the negative sign of the natural log of the number of contract procedures
because the greater the number of contract procedures, the lower the institutional quality. The fixed
entry costs is measured as the number of procedures and the number of days to start a business in
exporting and importing countries and are collected from the WDI.
The tariff data is from the United Nations Conference on Trade and Development Trade Analysis and
Information Systems (UNCTAD TRAINS). We use the weighted average of applied Most Favored
Nation Treatment (MFN) tariff for each industry within a country over time. Transport costs are
computed as cost, insurance and freight (CIF) transport costs divided by FOB transport costs. CIF and
FOB transportation costs are collected from the UN Commodity Trade Statistics (COMTRADE)
database. The sets of geographical variables such as physical distance, colonial ties, common
language and common borders are from Centre d’Etudes Prospectives et d’Informations
Internationales (CEPII). We use the greatest circle distance between capital cities of countries for
distance. The country level capital stock measured as gross fixed capital formation is from the World
Bank World Development Indicator (WDI). The RTA dummies are from the World Trade
Organization (WTO) RTA database. Industry level capital stock (tangible fixed capital) and the
number of employees of the exporting country5 at the industry level is based on the United Nations
Industrial Development Organization Industrial Commodity Statistical Database (UNIDO INDSTAT).
Data on non-production worker and secondary enrollment ratio are from NBER-CES database and
World Development Indicator respectively. The summary statistics for each variable is reported in
Table 1.
Insert [Table 1] Here
4 We normalized each component by dividing the difference between the value and the minimum value by the difference between the maximum value and minimum value.5 The industry level capital and number of employees were country-industry specific in our data, meaning the capital intensity differs across countries and industries considering the heterogeneous industry characteristics across countries. This is in contrast to Chor (2010) in which U.S. capital intensity was used to measure industry characteristics of all countries in the data set. However, we used the U.S. contract intensity to measure contract intensity due to limited data availability on sales of intermediate inputs in organized exchange.
11
Our analysis focuses on the interaction between country level institutional quality and industry level
relationship specificity in determining the trade patterns because whether the institutions as a source
of comparative advantage in trade in intermediate goods as well as final goods are important is
unknown. Figure1 shows the relationship between the country level institutional quality and the
weighted average of relationship specificity of industries in each country. The institutional quality is
measured as the law and order. The relationship specificity is weighed by the share of intermediate
goods exported from each industry out of the total exported from the reporter country within each
year. This index is averaged over the time span. The fitted line of the scatter plot shows the positive
correlations between the institutional quality and the relationship specificity for a given country.
Insert [Figure 1] Here
The additional control variables are the conventional Heckscher-Ohlin source of comparative
advantage, the physical capital endowment and human capital endowment. The physical capital
endowment is measured as the gross fixed capital formation per employee while the human capital
endowment is measured as the secondary enrolment ratio. To detect the Heckscher-Ohlin forces, both
physical and human capital endowment ratios at country level are multiplied by physical capital
intensity and human capital intensity at industry level respectively. Physical capital intensity is
measured as the log of fixed capital formation per employee at industry level. Human capital intensity
is measured as the log of the ratio of non-production labor to total employment. For empirical
analysis, raw variables for property rights, law and order, number of contract procedures, physical
capital per employment and human capital per employment are mean-centered to avoid potential
multicollinearity. Table 2 shows the average industry attributes including relationship specificity and
physical capital intensity. The petroleum products industry is the least relationship-specific industry
while the auto industry is the most relationship-specific. In contrast, the petroleum product is the most
capital intensive while the miscellaneous products use capital the least.
Insert [Table 2] Here
4. Empirical Results
4.1. The Determinants of Trade in Intermediate Goods: Truncated OLS
The baseline model is estimated using the truncated OLS regression method. Since zero trade flows
are dropped by taking the natural log of trade, truncated OLS estimates show the effects of the
determinants on the positive values of trade volume upon trade occurring between trading partners.
Table 3 shows the results of the estimating equation (10) under various specifications from
12
truncated OLS models. Columns (1), (3), and (5) show estimates of the determinants of trade in
intermediate goods while columns (2), (4), and (6) present values for trade in final goods. All
regressions include fixed effects of industries, years, exporting and importing countries. All six
columns show robust standard errors clustered by exporter-importer pair.
Insert [Table 3] Here
Institutional Quality
The columns (1) through (6) support the hypotheses on the role of institutional quality as a source of
comparative advantage. The interaction term between the measure of law and order of the exporting
country collected from ICRG and relationship specificity at the industry level derived from Nunn
(2007) shows the positive effects on trade volume. This indicates that a country in which a law is well
observed tends to specialize in producing goods intensively and used relationship-specific inputs
which are dependent upon contract enforcement. This confirms the results from Nunn (2007),
Levchenko (2007) and Chor (2010). As an alternative country measure of law and order, property
rights, collected from Freedom House is interacted with industry measures of relationship specificity.
We also obtain a positive and highly significant coefficient on this interaction term. Lastly, the
efficiency of making a contract measured as the natural log of the inverse of number of contract
procedures has more positive effects on trade in relationship specific industries. This confirms that a
country with high quality of rule of law, property rights and good quality of contract environment
tends to export more intermediate goods with high intensity of relationship-specificity. The effect of
institutional quality as a source of comparative advantage in exporting institutional intensive goods
are greater for trade in intermediate goods than final goods. The coefficients of the interaction terms
in intermediate goods trade in columns (1), (3) and (5) are larger than those in final goods trade
presented in columns (2), (4) and (6) and these differences were statistically significant.
Industry Level Trade Costs
Table 3 also shows the estimation results when the natural log of the weighted tariff and
transportation costs between trading partners, are used as proxies for trade costs. The columns (1), (3),
and (5) show that the weighted average of tariffs by the share of each industry have negative impact
on trade in intermediate goods. However, from the results reported in columns (2), (4), and (6), the
effects of tariff on trade in final goods are statistically insignificant. Thus, the negative impact of tariff
is stronger and more significant on intermediate goods trade than on final goods trade. The transport
cost is measured as CIF divided by FOB. The natural log of transportation cost is negatively
associated with trade in both intermediate and final goods and the effects are larger for trade in
13
intermediates.
Geography
The estimates of log of distance across columns (1) through (6) show that the distance between
trading partners has a negative and highly significant effect on trade in intermediate inputs,
confirming the importance of proximity as a determinant of trade patterns. The magnitudes of the
coefficients on the effect of distance on trade in intermediate goods are approximately 1.6, which is
slightly larger than trade in final goods (1.4). The gravity variables have positive effects on trade in
both intermediate and final goods. The colonial tie between exporter and importer in the past has a
positive impact on trade and all coefficients are statistically significant. Additionally, when trading
partners used the same language, the volume of trade increased more. The sharing of common borders
also has a positive effect on trade in intermediate and final goods. Trade integration through regional
trade agreement contributed to both types of trade.
Factor Endowments
When examining the effects of interaction between the country-level abundance of the capital-labor
ratio and industry-level capital intensity, a positive effect on trade in both intermediate and final goods
is observed. The coefficient of the interaction between the human capital endowment and human
capital intensity is also significantly positive. This result demonstrates the validity of Heckscher-Ohlin
theorem; a country with more capital per worker tends to export more in capital intensive industries.
The magnitude of the effect of physical capital is slightly larger for trade in final goods than
intermediate goods while the effect of human capital is stronger in intermediate goods trade.
Insert [Table 4] Here
4.2. The Determinants of Trade in Intermediate Goods vs. Final Goods
To examine the relative importance of the trade in intermediates to final good trade, we use the
ratio of trade in intermediate goods to final goods in natural logarithm as dependent variable. Table 4
reports OLS estimation results with this ratio of trade in intermediates. It shows that the coefficients
of interaction term between institutional quality and relationship specificity are consistently positive
and statistically significant across model specifications. This implies that a country with high quality
14

of rule of law, property rights and good quality of contract environment tends to export higher share
of intermediate goods with high intensity of relationship-specificity than final goods. The magnitudes
of coefficients are much larger than that of other determinants of share of trade in intermediates. This
result shows that the size of the positive effect of institutional quality on trade in intermediate goods is
significantly larger than that on final goods trade as reported in Table 3. Column (1) through (3) in
Table 4 also show that the trade share of intermediates is significant and negatively related with both
tariff and transport cost. This result confirms the result in Table 3 in that the effect of tariff is
insignificant and the impact of transport cost is smaller in final goods trade compared to intermediates
trade. The size of the effect of distance on trade in intermediate goods is statistically larger than that
on trade in final goods. All other geographical factors, except colonial tie, show the significant and
negative linkage with the ratio of trade in intermediate goods. This is also in line with the result in
Table 3, where the positive coefficients of RTA, common language and sharing border on trade in
intermediates are less than those on final goods. We find a positive coefficient of the interaction term
between country-level physical capital abundance and industry-level capital intensity but the
statistical significance disappear according to model specification. The human capital abundance
seems play more important role than physical capital abundance as a source of comparative advantage
in determining share of trade in intermediate goods.
4.3. Extensive and Intensive Margins of Share of Trade in Intermediate Goods
To correct for the selection bias due to possible unobserved firm-level heterogeneity from many
zero values of share of trade in intermediate goods, a two-stage sample selection model is estimated as
a robustness check. In the first stage, the probit selection equation yields a predicted extensive margin,
the probability of export ratio. In the second stage, the log linear equation produces the estimation of
the intensive margin, the volume of export ratio between two countries at the industry level. The
selection equation includes additional proxy for fixed entry costs as the valid excluded variable in the
second stage to control for unobserved heterogeneity. To satisfy this exclusion restriction, this proxy
should affect fixed trade costs or export decisions but not variable costs or export volume. Following
Helpman et al. (2008) and Yadav (2014), the fixed entry cost, (Entry cost) is measured as a binary
indicator of 1 if the sum of the number of days and number of procedures to start up a business in
both exporting and importing countries is above the median of country pairs during the same time
span, and 0 otherwise.
Table 5 shows the maximum likelihood estimation of Heckman’s selection for the share of
intermediate trade over the total trade. Columns (1a), (2a) and (3a) show the selection equations 15
according to the model specification for the share of intermediate goods trade and column (1b), (2b)
and (3b) report the estimated coefficients and robust standard errors clustered by exporter-importer
pairs for the outcome equation. The results of both selection and outcome equations confirm the
relatively more significant role of institutional quality as a source of comparative advantage in trade in
intermediate goods compared to final goods trade. The country with high quality of rule of law,
property rights and contract environment is more likely to enter host country by exporting and sell
more share of intermediate goods with higher intensity in relationship specificity. Both extensive
margin from entry decision and intensive margin from outcome are positive and significant. Thus
institutional quality may play relatively more important role as reducing fixed cost of starting
exporting and raising volume of trade in intermediate goods than final goods. Heckscher-Ohlin forces
measured as physical and human capital abundance also have positive effects on the share of trade in
intermediate goods. Trade costs and distance between exporter and importer have negative extensive
and intensive margins and the magnitude of these effects. For RTA, common language and sharing the
same border has positive impact on selection, but switch to negative effects once the intermediate
good is exported. The inverse Mills ratios computed to produce the consistent estimation of the first
step equation of all six specifications are statistically significant and positive. The fixed entry cost of
bilateral trade, which is included only in the selection equation, is negatively associated with the
extensive margin of trade flows although the effect is not significant. Potentially, part of the effects of
entry costs already captured in the import country fixed effects may have caused this result.
Insert [Table 5] Here
5. Conclusion
In this study we assess the importance of institutional quality and trade costs as determinants of
trade in intermediate goods. Based on the model of comparative advantage in a gravity framework,
our simple model of intermediate goods hypothesizes the impacts of institutions and a set of
geographical characteristics on trade. The main empirical test using bilateral trade flows confirms the
presence of positive impact of institutions and inhibiting role of trade costs in determining patterns of
trade. From the estimation results on the ratio of intermediate goods trade to final goods trade to
compare the relative importance of the determinants between trade components, we further find that
these effects are greater in intermediate goods trade. This implies that a country with higher
institutional quality has a comparative advantage in producing institutionally intensive goods and
trade costs measured as both trade policy and transport cost are negatively associated with trade and
intermediate goods trade vis-à-vis final goods trade is relatively more sensitive to institutions and
trade costs. Thus, previous findings on the role of comparative advantage and geography on aggregate
16
trade volume may be more driven by trade in intermediate goods.
Existing theories do not explain why the trade in intermediate goods compared to final goods are
more responsive to institutional quality. However, we can conjecture that given the thicker input
market of downstream firm than upstream firm, the hold-up problem of underinvestment in the
production of intermediates can incur higher costs for the upstream firm than the downstream firm.
This may lead to larger sensitivity of trade in intermediate goods producers rather than final goods
producers to the sources of comparative advantage and geography. Further studies may be necessary
to understand the mechanisms through which these effects are stronger in intermediate goods trade.
17
References
Acemoglu, D., S. Johnson and J. Robinson, 2001. “The Colonial Origins of Comparative
Development: An Empirical Investigation,” American Economic Review, 91(5), 1369-1401.
2002. “Reversal of Fortune: Geography and Institutions in the Making of the Modern
World Income Distribution,” Quarterly Journal of Economics, 117(4), 1231-1294.
Anderson, J., 1979, “The Theoretical Foundation for the Gravity Equation”, American Economic
Review, 69, 106–116.
Anderson, J. and D. Marcouiller, 2002. “Insecurity and the Pattern of Trade: An Empirical
Investigation”, Review of Economics and Statistics, 84 (2), 342-352.
Anderson, J. and E. van Wincoop, 2003. “Gravity with Gravitas: A Solution to the Border Puzzle”,
American Economic Review, 93(1), 170–192.
Antràs, P., L. Garicano and E. Rossi-Hansberg, 2006. “Offshoring in a Knowledge Economy,” The
Quarterly Journal of Economics, 121(1), 31-77.
Baldwin, R. and D. Taglioni, 2014. “Gravity Chains: Estimating Bilateral Trade Flows when Parts and
Components Trade is Important”, Journal of Banking and Financial Economics, 2 (2), 61-82.
Bergstrand, J. and P. Egger, 2010. “A General Equilibrium Theory for Estimating Gravity Equations
of Bilateral FDI, Final Goods Trade and Intermediate Goods Trade”, in S. Brakman and P. Van
Bergeijk (eds) The Gravity Model in International Trade: Advances and Applications Cambridge
University Press, New York.
Caliendo, L. and F. Parro, 2015. “Estimates of Trade and Welfare Effects of NAFTA”, Review of
Economic Studies, 82, 1-44.
Costinot, A., 2009. “On the origins of comparative advantage,” Journal of International Economics,
77(2), 255-264
18
De Simone, G., 2008. “Trade in Parts and Components and the Industrial Geography of Central and
Eastern European Countries”, Review of World Economics, 144 (3), 428-457.
Deardorff, A., 1998. “Technology, Trade, and Increasing Inequality: Does the Cause Matter for the
Cure?” Journal of International Economic Law, Oxford University Press, 1(3), 353-376.
Dornbusch, R., Fischer, S. and Samuelson, P., 1977. “Comparative Advantage, Trade, and Payments
in a Ricardian Model with a Continuum of Goods,” American Economic Review, 67(5), 823-839.
1980. “Heckscher-Ohlin Trade Theory with a Continuum of Goods.” Quarterly Journal of
Economics, 95(2), 203-224.
Eaton, J. and S. Kortum, 2002. “Technology, Geography, and Trade”, Econometrica, 70(5), 1741-
1779.
Ethier, W., 1982, “National and International Returns to Scale in the Modern Theory of International
Trade”, American Economic Review, 72, June, 389–405.
Feenstra, R., 1998. “Integration of Trade and Disintegration of Production in the Global Economy”,
Journal of Economic Perspectives, 12(4), 31-50.
French, S., 2016. “The Composition of Trade Flows and the Aggregate Effects of Trade Barriers”,
Journal of International Economics, 98, 114-137.
Gomez-Herrera, E., 2013. “Comparing Alternative Methods to Estimate Gravity Models of Bilateral
Trade”, Empirical Economics, 44, 1087-1111.
Grossman, G. and E. Rossi-Hansberg, 2008. “Trading Tasks: A Simple Theory of Offshoring,”
American Economic Review, 98(5), 1978–1997.
Helpman E., Melitz, M. and Rubinstein, Y., 2008. “Estimating Trade Flows: Trading Partners and
Trading Volumes”, Quarterly Journal of Economics, 123 (2), 442-287.
Hummels, D., Ishii, J. and Yi, K-M., 2001. “The nature and growth of vertical specialization in world
trade”, Journal of International Economics, 54(1), 75-96.
Hyun, H.-J. and Kim, H.-H., 2010. “The determinants of cross-border M&As: the role of institutions
and financial development in the gravity model”, The World Economy, 3(2), 292–310.
Johnson, R. and G. Noguera, 2012a. “Accounting for intermediates: Production sharing and trade in
value added,” Journal of International Economics, 86(2), 224-236.
19
2012b. “Proximity and Production Fragmentation,” American Economic Review,
102(3), 407-411.
Jones, R., 2000. Globalization and the Theory of Input Trade, The MIT Press, Cambridge, MA,
Jones, R. and H. Kierzkowski, 1990. “The Role of Services in Production and International Trade: A
Theoretical Framework”, in Jones, R. and A. Krueger (eds.): The Political Economy of
International. Trade (Blackwells).
Lanz, R., 2010. “Services trade liberalization and patterns of trade in intermediates: determinants,
comparative advantage and intra-firm trade”, Munich Dissertations in Economics 13962,
University of Munich, Department of Economics.
La Porta, R., F. Lopez-de-Silanes, A. Shleifer and R. Vishny, 1997. “Legal Determinants of External
Finance,” Journal of Finance, 52(3), 1131-1150.
1998. “Law and Finance,” Journal of Political Economy, 106(6), 1113-1155.
Levchenko, A., 2007. “Institutional Quality and International Trade”, Review of Economic Studies,
74(3), 791-819.
Linders, G. and H. Groot (2006), ‘Estimation of the Gravity Equation in the Presence of Zero
Flows’, Tinbergen Institute Discussion Paper TI 2006-072 ⁄ 3 (Amsterdam: TI).
McLaren, J. 2000. “Globalization and vertical structure”, American Economic Review, 90(5), 1239-
1254.
North, D., 1990. Institutions, Institutional Change and Economic Performance, Cambridge University
Press, Cambridge.
Nunn, N., 2007. “Relationship-Specificity, Incomplete Contracts, and the Pattern of Trade”, Quarterly
Journal of Economics, 122, 569-600.
Ornelas, E. and J. Turner, 2008. “Trade liberalization, outsourcing and the hold-up problem”, Journal
of International Economics, 74(1), 225-241.
Ottaviano, G., and T. Tabuchi, J.-F. Thisse, 2002. “Agglomeration and trade revisited”, International
Economic Review, 43, 409-436.
Rauch, J., 1999. “Networks versus Markets in International Trade”, Journal of International 20
Economics, 48, 7–35.
Redding, D. and A. Venables, 2004. “Economic Geography and International Inequality”, Journal of
International Economics, 62, 53-82.
Rigobon, R. and Rodrik, D. 2005. “Rule of law, democracy, openness, and income”, The Economics
of Transition, The European Bank for Reconstruction and Development, 13(3), 533-564.
Romalis, J., 2004. “Factor Proportions and the Structure of Commodity Trade,” American Economic
Review, 94(1), 67-97.
Rose, A. and E. van Wincoop, 2001. “National Money as a barrier to international trade: the real case
for currency union”, American Economic Review, 91, 386-390.
Santos Silva, J., and S. Tenreyro, 2006. “The Log of Gravity”, Review of Economics and Statistics,
88(4): 641–658.
Sanyal, K. and R. Jones, 1982. “The Theory of Trade in Middle Products”, American Economic
Review. 72, 16–31.
Wei, S-J., 2000. “How Taxing is Corruption on International Investors?” Review of Economics and
Statistics, 82, 1–11.
Williamson, O. 1975. Markets and hierarchies: analysis and antitrust implications. Free Press, New
York.
1986. Vertical integration and related variations on a transaction-cost theme. in: Stiglitz, J.
and Mathewson, G. (eds) New developments in the analysis of market structure. MIT Press,
Cambridge.
Yadav, N. 2014. “Impact of Trade Facilitation on Parts and Components Trade”, The International
Trade Journal, 28, 287-310.
Yi, K-M, 2003. “Can Vertical Specialization Explain the Growth of World Trade?”, Journal of
Political Economy, 111, 52–102.
21
[Table 1] Summary statistics
Variable Obs Mean Std. Dev. Min MaxlnExport_intermediates 1235764 12.363 3.671 0 25.229lnExport_final 1039672 11.648 3.601 0 24.530Export_intermediates dummy 2093056 0.590 0.492 0 1Export_final dummy 2093056 0.497 0.500 0 1lnDistance 2081482 8.527 0.908 0.632 9.899lnwtariff 1076424 1.894 1.136 -4.605 5.762lntcost 1730110 0.184 1.537 -16.200 16.207Colony 2081482 0.081 0.272 0 1Language 2081482 0.160 0.366 0 1Border 2062875 0.034 0.180 0 1RTA 2093056 0.225 0.418 0 1lnCapital_endowment 1900937 7.859 1.569 2.431 10.886lnHuman capital_endowment 1728959 4.373 0.459 1.8 5.079Property rights 1951933 0.574 0.270 0 1Law and order 1679076 0.690 0.219 0.083 1Contract procedure 1408965 35.968 6.264 21 55lnCapital_intensity 2093056 9.599 0.762 8.300 11.772lnHuman capital_intensity 2093056 4.661 0.673 3.476 6.921Relationship specificity 2093056 0.532 0.217 0.036 0.874
Note: Units of values are millions of US dollars.
22
[Table 2] Industry characteristics
Industry Percentage share
Relationship specificity
Capital intensity
Fabricated metals 6.45 0.423 8933.8Machinery equipment 6.99 0.717 10458.8Textiles and apparel 7.26 0.505 4942.3Electronic products 7.15 0.810 27853.2Rubber and plastics 6.61 0.407 12554.6Timber and wooden products 5.98 0.484 9581.0Food, beverages and tobacco 7.17 0.373 12656.7Autos and trailers 5.79 0.874 21915.2Paper products and publishing 6.42 0.457 11420.3Chemical products 7.16 0.332 37084.5Petroleum products 3.73 0.036 129514.3Basic non-ferrous metals 5.23 0.203 41465.8Non-metallic products 5.85 0.476 19729.4Medical appliances, precision and optical instruments 5.96 0.799 9344.4Ships 2.19 0.794 18988.0Miscellaneous transportation equipment 4.21 0.867 19016.5Miscellaneous products 5.85 0.548 4023.9
Note: Relationship specificity is measured as the weighted average of the share of input for which it is neither reference priced nor sold at organized exchange and the share of input for which it is not sold at organized exchange but reference priced. Capital intensity is the natural log of fixed capital formation per employee.
23
[Table 3] The determinants of trade in intermediate goods and final goods: Truncated OLS
(1) (2) (3) (4) (5) (6)
Dependent variableIntermediat
e Final Intermediate Final Intermediate FinalTrade cost
Tariff -0.0734*** -0.001 -0.0757*** -0.002 -0.064*** 0.006(0.0104) (0.009) (0.009) (0.009) (0.0107) (0.010)
Transport cost -0.225*** -0.183*** -0.215*** -0.181*** -0.217*** -0.175***(0.012) (0.012) (0.012) (0.012) (0.012) (0.012)
GeographyDistance -1.607*** -1.412*** -1.630*** -1.418*** -1.631*** -1.420***
(0.0299) (0.0283) (0.0294) (0.0278) (0.0318) (0.0301)RTA 0.436*** 0.516*** 0.442*** 0.528*** 0.515*** 0.561***
(0.0440) (0.0434) (0.0424) (0.0423) (0.0454) (0.0452)Colony 0.910*** 0.833*** 0.988*** 0.903*** 0.999*** 0.870***
(0.0968) (0.0898) (0.0966) (0.0906) (0.0998) (0.0946)Language 0.598*** 0.857*** 0.613*** 0.879*** 0.672*** 0.918***
(0.0546) (0.0539) (0.0544) (0.0534) (0.0569) (0.0562)Border 0.487*** 0.628*** 0.442*** 0.583*** 0.449*** 0.605***
(0.118) (0.115) (0.115) (0.112) (0.128) (0.124)Heckscher-Ohlin
(K / L)i×(K / L)k 0.013*** 0.037*** 0.024*** 0.038*** 0.014*** 0.054***
(0.0033) (0.0035) (0.003) (0.0033) (0.0042) (0.0045) (H / L)i×(H / L)k 1.868*** 1.800*** 1.691*** 1.678*** 2.226*** 1.856***
(0.082) (0.087) (0.079) (0.082) (0.099) (0.096)Institutions Law × RS 4.091*** 0.08
(0.153) (0.155) Pro× RS 4.336*** 0.396***
(0.128) (0.146) Contract × RS 5.077*** 1.589***
(0.250) (0.330)Industry FE Yes Yes Yes Yes Yes YesYear FE Yes Yes Yes Yes Yes YesExporter FE Yes Yes Yes Yes Yes YesImporter FE Yes Yes Yes Yes Yes YesObservations 405,573 336,773 467,669 390,176 341,814 287,380R-squared 0.546 0.561 0.556 0.566 0.556 0.571
Note: The dependent variable Intermediate (Final) represents export value of intermediate goods (final goods) in industry k from country i to country n in year t. OLS estimation method was employed conditional on observing a positive trade flow. Robust standard errors clustered by exporter-importer pair are in parentheses. . ***, ** and * indicate statistical significance at 1%, 5% and 10%, respectively. Institutional quality indices are normalized and mean-centered to avoid multicollinearity in interaction term.
24
[Table 4] The determinants of the ratio of trade in intermediate goods: Truncated OLS
Note: The dependent variable Ratio is the natural logarithm of the ratio of export value of intermediate goods tofinal goods export value in industry k from country i to country n in year t. Truncated OLS estimation methodwas employed conditional on observing a positive trade flow. Robust standard errors clustered by exporter-importerpair are in parentheses. . ***, ** and * indicate statistical significance at 1%, 5% and 10%, respectively.
25
(1) (2) (3)VARIABLES Ratio Ratio RatioTrade cost
Tariff -0.0847*** -0.0855*** -0.0814***(0.0120) (0.0114) (0.0126)
Transport cost -0.0271** -0.0205** -0.0347***(0.0107) (0.0102) (0.0112)
GeographyDistance -0.157*** -0.165*** -0.154***
(0.0169) (0.0165) (0.0178)RTA -0.0766*** -0.0749*** -0.0412
(0.0264) (0.0249) (0.0272)Colony 0.135** 0.157*** 0.145***
(0.0555) (0.0551) (0.0554)Language -0.228*** -0.248*** -0.243***
(0.0290) (0.0288) (0.0299)Border -0.153*** -0.129*** -0.137**
(0.0502) (0.0497) (0.0535)Heckscher-Ohlin (K / L)i×(K / L)k 0.00715** 0.00872*** 0.00604
(0.00354) (0.00313) (0.00436)(H / L)i×(H / L)k 0.196* 0.269** 0.459***
(0.116) (0.112) (0.140)Insitutions Law × RS 2.713***
(0.180) Pro× RS 2.272***
(0.165) Contract × RS 1.847***
(0.388)Industry FE Yes Yes YesYear FE Yes Yes YesExporter FE Yes Yes YesImporter FE Yes Yes YesObservations 275,789 319,694 236,328R-squared 0.302 0.305 0.310
[Table 5] The determinants of share of trade in intermediate goods: Heckman Selection Model
Note: Dependent variable ~Ratio in the first stage of the Heckman procedure is 1 if the ratio of intermediates trade to final goods trade is positive and 0 otherwise. The dependent variable Ratio in the second stage is the positive values of the ratio of trade in intermediate goods including the inverse Mills ratio from the first stage. The entry cost was excluded at the second stage estimation. ***, ** and * indicate statistical significance at 1%, 5% and 10%, respectively. Robust standard errors clustered by exporter-importer pair are in parentheses.
(1a) (1b) (2a) (2b) (3a) (3b)Selection Outcome Selection Outcome Selection Outcome
VARIABLES~Ratio Ratio
~Ratio Ratio~Ratio Ratio
Trade Cost Tariff -0.0225*** -0.066*** -0.019*** -0.067*** -0.019*** -0.067***
(0.00389) (0.006) (0.0035) (0.0054) (0.003) (0.005)Transport cost -0.0626*** -0.040*** -0.0619*** -0.038*** -0.061*** -0.037***
(0.002) (0.0049) (0.0018) (0.0045) (0.0017) (0.0044)Geography Distance -0.782*** -0.305*** -0.783*** -0.296*** -0.772*** -0.291***
(0.0059) (0.0098) (0.0054) (0.0089) (0.0053) (0.0089)RTA 0.169*** -0.0148 0.200*** -0.0164 0.200*** -0.0079
(0.009) (0.013) (0.0082) (0.0124) (0.008) (0.012) Colony 0.492*** 0.275*** 0.488*** 0.277*** 0.481*** 0.273***
(0.0145) (0.0267) (0.013) (0.0247) (0.0129) (0.0241) Language 0.377*** -0.048*** 0.377*** -0.055*** 0.377*** -0.057***
(0.0101) (0.0156) (0.00921) (0.0143) (0.00906) (0.0142) Border 0.348*** -0.106*** 0.327*** -0.075*** 0.317*** -0.073***
(0.0242) (0.0273) (0.0212) (0.0247) (0.0206) (0.0246)Heckscher-Ohlin(K / L)i×(K / L)k 0.038*** 0.0213*** 0.0337*** 0.0174*** 0.0311*** 0.0086***
(0.00168) (0.00289) (0.0014) (0.00244) (0.00138) (0.0023)(H / L)i×(H / L)k 0.817*** 0.345*** 0.771*** 0.372*** 0.806*** 0.556***
(0.0249) (0.0536) (0.023) (0.0503) (0.0223) (0.049)Institutions Law × RS 0.942*** 2.276***
(0.0569) (0.0948)Pro× RS 1.097*** 2.165***
(0.0452) (0.0683)Contract × RS 1.400*** 1.566***
(0.0714) (0.114)Entry cost -0.0049 -0.0048 -0.0055
(0.00838) (0.00758) (0.00746)SelectionInverse Mill’s Ratio 0.634*** 0.608*** 0.594***
(0.0260) (0.0234) (0.0233)Industry FE Yes Yes Yes Yes Yes YesYear FE Yes Yes Yes Yes Yes YesExporter FE Yes Yes Yes Yes Yes YesImporter FE Yes Yes Yes Yes Yes YesObservations 382,054 266,664 459,277 319,927 469,975 323,442
26
Appendix 1. Industry classification
ISIC Rev.3 Code This paper
151 Production, processing and preservation of meat, fish, fruit, vegetables, oils and fats
03 Food, beverages and tobacco
152 Manufacture of dairy products
153 Manufacture of grain mill products, starches and starch products and prepared animal feeds
154 Manufacture of other food products155 Manufacture of beverages16 Manufacture of tobacco products17 Manufacture of textiles
04 Textiles and apparel
18 Manufacture of wearing apparel; dressing and dyeing of fur
1911 Tanning and dressing of leather
1912 Manufacture of luggage, handbags and similar items, saddlery and harness
192 Manufacture of footwear201 Sawmilling and planning of wood
05 Timber and wooden products
202 Manufacture of products of wood, cork, straw and plaiting materials
361 Manufacture of furniture21 Manufacture of paper and paper products
06 Paper products and publishing22 Publishing, printing and reproduction of recorded media
231 Manufacture of coke oven products
07 Chemical products
233 Processing of nuclear fuel241 Manufacture of basic chemicals242 Manufacture of other chemical products243 Manufacture of man-made fibers232 Manufacture of refined petroleum products 08 Petroleum products
2511 Manufacture of rubber tires and tubes; retreading and rebuilding of rubber tires
09 Rubber and plastics2519 Manufacture of other rubber products252 Manufacture of plastics products261 Manufacture of glass and glass products 10 Non-metallic
products2691 Manufacture of non-structural non-refractory ceramic ware
27
2692 Manufacture of refractory ceramic products
2693 Manufacture of structural non-refractory clay and ceramic products
2694 Manufacture of cement, lime and plaster2695 Manufacture of articles of concrete, cement and plaster2696 Cutting, shaping and finishing of stone2699 Manufacture of other non-metallic mineral products n.e.c.271 Manufacture of basic iron and steel
11 Basic non-ferrous metals
272 Manufacture of basic precious and non-ferrous metals273 Casting of metals
28 Manufacture of fabricated metal products, except machinery and equipment 12 Fabricated metals
2911 Manufacture of engines and turbines, except aircraft, vehicle and cycle engines
13 Machinery equipment
2912 Manufacture of pumps, compressors, taps and valves
2913 Manufacture of bearings, gears, gearing and driving elements
2914 Manufacture of ovens, furnaces and furnace burners2915 Manufacture of lifting and handling equipment2919 Manufacture of other general purpose machinery292 Manufacture of special purpose machinery293 Manufacture of domestic appliances n.e.c.
30 Manufacture of office, accounting and computing machinery
14 Electronic products31 Manufacture of electrical machinery and apparatus n.e.c.
32 Manufacture of radio, television and communication equipment and apparatus
34 Manufacture of motor vehicles, trailers and semi-trailers 15 Autos and trailers
351 Manufacture of ships and boats 16 Ships and boats
352 Manufacture of railway and tramway locomotives and rolling stock
17Miscellaneous transportationequipment
353 Manufacture of aircraft and spacecraft359 Manufacture of transport equipment n.e.c.
33 Manufacture of medical, precision and optical instruments, watches and clocks 18
Medical appliances, precision and optical instruments
28
369 Manufacturing n.e.c. 19 Miscellaneous products
The majority of world trade data are classified by SITC or HS code. However, since these classifications are at the product level rather than industry level, we harmonized the 4-digit ISIC Rev.3 and 6- digit HS 1992 classification to convert them to 17 industries, which is similar to 2-digit ISIC Rev.3. To construct intermediate input trade data from the BEC code, we used the methodology suggested by Miroudot et al. (2009) and reclassified the data into parts and components, processed goods, capital and consumption goods. Intermediate inputs are the sum of parts and components and processed goods (See Appendix 2).
Appendix 2. Industry reclassification
BEC Industry Miroudot This paper
111 Food and beverages mainly for industries Intermediate Processed
112 Food and beverages mainly for households Consumption Consumption
121Processed food and beverages mainly for industries
Intermediate Processed
122Processed food and beverages mainly for households
Consumption Consumption
21 Primary industrial supplies Intermediate Processed
22 Processed industrial supplies Intermediate Processed
31 Primary fuels and lubricants Intermediate Processed
321 Motor spirit Not classified Processed
322 Other fuels and lubricants Intermediate Processed
41 Capital goods except transport equipment Capital Capital
42 Capital goods: parts and accessories Intermediate Parts and components
51 Passenger motor cars Not classified Consumption
521 Industrial transport equipment Capital Capital
522 Non-industrial transport equipment Consumption Consumption
53 Transport equipment: parts and accessories Intermediate Parts and components
61Consumer goods not elsewhere specified: durables
Consumption Consumption
62Consumer goods not elsewhere specified: semi-durables
Consumption Consumption
63 Consumer goods not elsewhere specified: Consumption Consumption
29
non-durables
7 Goods not elsewhere specified Not classified Not specified
Appendix 3. List of countries
Anguilla Dominica Kiribati ParaguayAlbania Denmark Rep. of Korea Occ. Palestinian Terr.Andorra Dominican Rep. Kuwait French PolynesiaUnited Arab Emirates Algeria Lebanon QatarArgentina Ecuador Sri Lanka RomaniaArmenia Egypt Lesotho Russian FederationAntigua and Barbuda Eritrea Lithuania RwandaAustralia Spain Luxembourg Saudi ArabiaAustria Estonia Latvia SudanAzerbaijan Ethiopia China, Macao SAR SenegalBurundi Finland Morocco SingaporeBelgium Fiji Rep. of Moldova Sierra LeoneBenin France Madagascar El SalvadorBurkina Faso Gabon Maldives SurinameBangladesh United Kingdom Mexico SlovakiaBulgaria Georgia TFYR of Macedonia SloveniaBahrain Ghana Mali SwedenBahamas Guinea Myanmar SwazilandBosnia Herzegovina Gambia Montenegro SeychellesBelarus Guinea-Bissau Mongolia SyriaBelize Greece Mozambique Turks and Caicos IsdsBolivia Grenada Mauritania TogoBrazil Greenland Montserrat ThailandBarbados Guatemala Mauritius TurkmenistanBrunei Darussalam Guyana Malawi Timor-LesteBhutan Hong Kong Malaysia TongaBotswana Honduras Namibia Trinidad and TobagoCentral African Rep. Croatia New Caledonia TunisiaCanada Hungary Niger TurkeySwitzerland Indonesia Nigeria TuvaluChile India Nicaragua TanzaniaChina Ireland Netherlands UgandaCote d'Ivoire Iran Norway UkraineCameroon Iceland Nepal UruguayColombia Israel New Zealand USAComoros Italy Oman VenezuelaCape Verde Jamaica Pakistan Viet NamCosta Rica Jordan Panama VanuatuCuba Japan Peru SamoaCyprus Kazakhstan Philippines YemenCzech Rep. Kenya Papua New Guinea South AfricaGermany Kyrgyzstan Poland ZambiaDjibouti Cambodia Portugal Zimbabwe
30
31