Embed Size (px)
Citation preview
The Choice of Trading Venue and Relative Price Impact of
Institutional Trading: ADRs versus the Underlying Securities in their Local Markets
Sugato Chakravarty Purdue University
Chiraphol N. Chiyachantana
Singapore Management University
Christine Jiang University of Memphis
This Version: July 2007
__________________________________
Acknowledgements: We thank Paul Bennett, Pam Moulton, George Sofianos, Jeremy Goh, Sandy Lai, Choong Tze Chua, and Bill Hu and seminar participants at Purdue University, Singapore Management University, University of New South Wales, University of Sydney, Fordham University, University of Texas, Worcester Polytechnic Institute, Financial Management Association Meetings, Eastern Finance Association Meetings for valuable comments. Chakravarty acknowledges financial support from the Purdue Research Foundation. Chiyachantana is grateful to Singapore Management University for financial support. Jiang thanks the Fogelman College of Business and Economics at the University of Memphis for financial support. The usual disclaimer applies.
The Choice of Trading Venue and Relative Price Impact of Institutional Trading:
ADRs versus the Underlying Securities in their Local Markets
Abstract
We address two important themes associated with institutions’ trading in foreign markets: (1) the choice of trading venues (between a company’s listing in its home market and that in the U.S. as an ADR); and (2) the comparison of trading costs across the two venues. To do so, we identify institutional trading in the United States in non-U.S. stocks (i.e., ADRs) from 35 foreign countries and in their respective home markets, using proprietary institutional trading data. Overall, our research underscores the intuition that the choice of institutional trading in a stock’s local market or as an ADR in the U.S. market, is a complex process that embodies, among other things, variables that measure the relative adverse selection and liquidity at order, stock, and country levels. We also find that institutional trading costs are generally lower for trading cross-listed stocks on home exchanges although this differs on a country by country basis. Such findings have important regulatory implications.
1
1. Introduction Investment is rapidly becoming a cross-border exercise with the past decade witnessing a
significant globalization of financial markets. Consequently, the number of foreign companies
cross-listing their shares in a U.S. exchange has also increased substantially.1 And institutional
investors appear to have been the prime beneficiaries of such increased trading opportunities,
since they have the added luxury (by virtue of their size of transactions and relatively flexible
capital constraints) of determining which venue to trade in when they decide to invest
internationally. By contrast, smaller, or retail, investors in the U.S. settle for investing in foreign
stocks indirectly through mutual funds or through transacting a given foreign firm’s securities in
the United States through American Depository Receipts (ADR).2 However, even though the
United States is considered to be the largest and the most liquid market in the world, it is not
clear if institutions would always prefer to trade a cross-listed foreign stock as an ADR in the
U.S. market rather than trading the underlying stock in its respective home exchange. This is an
important issue because institutions are widely reported to be informed, or smart, traders (see, for
example, Chakravarty (2001), Badrinath and Wahal (2002), and Sias and Starks (1997)) and
tracking institutional trades across the globe provides valuable clues about the relative liquidity
and adverse selection of various foreign markets vis-à-vis the U.S. markets.
The importance of our investigation is further underscored by a recent qualitative survey
by Thompson Financial and JP Morgan of 100 buy-side analysts and investors, on institutions’
preferences for transacting the ADRs versus local shares. This survey reveals that 37 percent of
the respondents preferred to transact in local shares due to the generally greater liquidity in local
markets; about 30 percent indicated they preferred ADRs due to their transaction efficiency and
lower holding and custody costs.3 Such responses inevitably trigger questions like: What are the
1 According to Baruch, Karolyi and Lemmon (2003), while in 1990 there were 352 non-U.S. stocks listed on the NYSE and Nasdaq, the number at the end of 2002 stood at around 850. 2 An ADR is, for all practical purposes, a stock representing a specified number of shares in a foreign corporation. ADRs are bought and sold in the American markets just like regular stocks. An ADR is issued by a U.S. Bank (such as the Bank of New York or Chase Manhattan), consisting of a bundle of shares of a foreign corporation that are being held in custody overseas. The foreign entity must provide financial information to the sponsor bank. The ADRs are also registered with the U.S. SEC and the companies are required to conform to GAAP in terms of their accounting practices. 3 The remaining 24 percent of the investors stated that the choice between ADRs and local shares is a case-by-case decision depending on liquidity and market accessibility.
2
factors driving an institution’s decision on the trading location of a cross-listed security? What
types of orders, in what types of stocks, and from what kind of world markets are more likely to
be routed to the ADR market? What are the relative costs of trading a foreign stock in the U.S
versus trading the same company's stock in its home country? And what are the determinants of
such trading cost differentials?4 Trying to answer these questions forms the basis of the current
paper.5
In order to conduct our study, we obtain a large sample of foreign stocks cross-listed as
ADRs on a country-by-country basis, for 35 foreign countries, using proprietary institutional
trading data from the Plexus Group over a period of three quarters in 2001. To the best of our
knowledge, the current study is the first one using institutional trading data to study the choice of
trading venue and relative transaction costs between ADRs trading in the U.S. and the underlying
stocks in local exchanges. The Plexus data is unique because it provides information on the
direction of trade (purchase versus sale), date of release of orders, and other details about the
actual orders and trades. This structure facilitates analysis of trading intention (vis-à-vis choice
of trading venue, for example) and transaction costs directly associated with an indicated desire
to trade, which is not available in other publicly available datasets at either transaction, or
aggregated, levels.
We develop an empirical framework by including variables that measure relative
liquidity and information environment of the two alternative trading venues at order, stock, and
country levels. Our empirical results show that, for the underlying securities traded both as
ADRs and in their respective local exchanges, institutions prefer to trade the ADRs for less
complex decisions. In addition, trading in ADRs is more likely for stocks with deeper ADR
markets, lower price impact, overlapping trading hours, and from emerging markets. Observing
that a large number of cross-listed stocks are exclusively traded in one venue (ADRs only, or
local markets only), we also employ a multinomial logistic model to examine the factors that
influence institutions’ decision among (1) trading the security in both markets, (2) trading a
4 Note that we use the term “stock” loosely to refer to both a firm’s traded stock on its home exchange as well as to its equivalent security traded in the U.S. as an ADR. 5 The Thompson-Morgan survey also raises other interesting questions on an individual client level such as: How do institutions split their orders across the markets? Do institutions trade in both markets simultaneously? Unfortunately, our data are available at the individual broker level and not at the client level. Therefore, we are unable to shed light on these issues.
3
cross-listed stock solely in the ADR market, and (3) trading the stock solely in its home
exchange. We conclude that, relative to being traded in both venues, the probability of
exclusively trading in the ADR market increases for stocks with lower relative local volume, a
higher correlation with U.S. market, overlapping trading hours, and for those originating from
markets with designated markets makers. Correspondingly, the probability of stocks trading
solely in their home exchanges increases for larger cap stocks, more complex orders, stocks with
deeper market (higher fraction of local volume), and higher price impact. By contrast, the
probability of trading exclusively in local markets is lower for stocks originating from emerging
markets, with higher correlation with the U.S. market, having Level II and Level III cross-listed
stocks, and with overlapping trading hours.
We also find that ADRs appear to be more expensive to trade (in terms of total trading
costs) relative to trading the equivalent securities in their respective home exchanges. On a
country-by-country basis, the overall (implicit plus explicit) costs of trading the ADR are greater
for twenty countries in our sample. For the remaining fifteen countries, the overall costs of
trading the ADR are either smaller, or statistically similar, relative to trading the equivalent
securities in their home exchanges.
We, however, go further in attempting to delineate the drivers of the difference in total
trading costs between the ADR and its matched underlying security in its home country. Upon
performing a multivariate analysis, by controlling for the relevant determinants of the differences
in trading costs between the ADR and its matched security in the respective home exchanges, we
conclude that the difference in costs between trading in the securities’ home country and in its
ADR is smaller for (1) stocks with lower percentage of purchase orders; (2) stocks with
relatively lower local trading volume, (3) stocks with Level II and Level III ADRs;6 (4) and
stocks with overlapping trading hours. The complexity of the orders, emerging markets,
correlation with the U.S. market, and the liberalization of the local markets have marginally
significant impact on the relative cost of trading in the alternative venues.
In related research, Baruch, Karolyi and Lemmon (2003) develop, and test, a model of
multi market trading to explain the variation in the U.S. share of global trading volume across 6 Level II and Level III sponsored ADRs must register with the SEC, and financial statements must be reconciled to generally accepted accounting principles. A Level III sponsorship is required, if the ADR is a primary offering and is used to raise capital for the company. Only Level II and Level III sponsored ADRs can be listed on the New York Stock Exchange, the American Stock Exchange, or NASDAQ.
4
non-U.S. stocks cross-listed on U.S. exchanges. Their key intuition is that the distribution of
trading volume across exchanges competing for order flow is related to the correlation of the
cross-listed asset returns with the returns of other assets traded in the respective markets. Thus,
the higher the correlation in returns of the cross-listed asset with the domestic asset, the more
informative is the domestic asset’s order flow which leads both liquidity and informed traders to
submit a larger proportion of their orders in the cross-listed asset to that exchange. While such
intuition is important in understanding what drives relative volume in the two markets in a macro
sense, it sheds little light on what may be driving institutional trading decisions across the two
markets – addressed in the current study.
The remainder of our paper is organized as follows. Section 2 provides the background
for the current analysis. Section 3 describes the data and provides relevant sample
characteristics. Section 4 provides results on institutional choice of trading venue. Section 5
provides results on institutional trading cost differences. Section 6 concludes.
2. Background Our research addresses two important themes associated with institutions’ choice of
trading in foreign markets: (1) the choice of trading venues (between a company’s home
exchange and its ADR in the U.S.); and (2) the comparison of trading costs across these two
venues. The extant research on both these themes is relatively sparse. In this section, we discuss
the main research in both areas, especially the theoretical models which, although very stylized,
still broadly guide our analysis.
2.1. Choice of trading venues
Institutional traders often trade in significantly larger quantities than do smaller retail
investors. And trade size alone allows institutional traders a degree of monopoly power and the
ability to choose which market out of all trading venues available to route their orders. Our focus
is their choice between the ADR trading in the U.S. and the stock’s home exchange. For cross-
listed stocks, positive trading externalities might lead to a concentration of trading in a single
market, unless some market/trade-driven frictions prevent the orders and volume to gravitate
towards the dominant market. Therefore, there is a natural incentive for traders to converge to
the more liquid market rather than split their trades across markets. But while in actual markets
5
consolidation is often observed, it is also true that multiple markets coexist to trade the same
essential security with superficial differences as in cross-listed securities. In many cases, both
markets are active and viable. This duality suggests that the relationship between liquidity and
investor behavior is unlikely to be a simple one. Market frictions in the form of informational
asymmetries, regulatory obstacles, and differences in market structures may preclude orders
from gravitating to a single market.
Positive trading externalities, in the form of the presence of other traders, are important
since it reduces the adverse price impact of one's orders, as seen in models with either
imperfectly competitive and risk-averse investors or with asymmetric information. The
theoretical underpinnings of positive trading externalities lie in the models of Pagano (1989),
Admati and Pfleiderer (1988), and Chowdry and Nanda (1991). In particular, and relevant to the
current research, Chowdry and Nanda (1991) use the Admati and Pfleiderer (1988) framework
and investigate how the ability to choose where (among N possible markets) to trade might affect
the functioning and liquidity of a market when some traders have superior information. In
particular, Chowdry and Nanda consider a market with informed traders, large discretionary
liquidity traders and small non-discretionary liquidity traders. Trading is allowed to occur
simultaneously in multiple markets, and all traders except the small liquidity traders are
permitted to trade in more than one market. Under the assumption that the small traders do not
have the luxury of deciding where to trade (as with our case where the small investors do not
enjoy the luxury of trading directly in the foreign markets), the trades of these small traders are
not perfectly correlated across markets, which enables informed traders to trade aggressively in
all markets.
The collective empirical evidence from extant research suggests that when a security is
traded in more than one market, the volume of trading is not evenly distributed among the
markets. In many cases, most of the order flows and trading volume may still reside in the home
market. In the Baruch, Karolyi and Lemmon (2003) model, for example, the source of volume
differentials across the two markets is the correlation of the cross-listed asset with (the returns of
the) other assets trading in the respective markets. From a practitioner’s vantage point,
Kurokawa (1988) argues: “ …large institutional investors tend to trade foreign stocks in each
mother country, where there is greater liquidity. A major portion of the orders from non-
residents is directed to each stock’s home market.” Additionally, Barclay, Litzenberger, and
6
Warner (1990) find that for the NYSE stocks listed in Tokyo, Tokyo captured less than one
percent of the market volume; while for Tokyo stocks listed on the NYSE, NYSE captured only
about 8% of the volume. More recently, Pulatkonak and Sofianos (1999) study the distribution
of global trading volume in NYSE listed non-U.S. stocks, and find a large variability in the U.S.
share of global trading, ranging from less than one percent in some stocks to more than 90% in
others.7 Overall, U.S. trading volume appears to be higher for stocks from countries in similar
time zones, in emerging markets, and with higher home market commission rates.
However, the above studies draw inferences on trading behavior by focusing on the total
volume of cross-listed stocks. By contrast, the unique features of our dataset, including a
transactional glimpse on a stock-by-stock basis, allow us to examine how institutions trade when
multiple markets exist on a stock. In addition, by using a multinomial logistic regression model,
we are able to estimate which factors -- including liquidity, asymmetric information, and
regulatory obstacles at order, stock, and country levels -- affect the probability of an institution’s
decision to trade exclusively in one of the two trading venues.
2.2. Comparison of institutional trading costs
The extant literature on the comparison of trading costs across international markets can
be broadly classified into two major streams. One stream of research examines the costs of
trading in foreign securities in the United States. Bacidore and Sofianos (2002), for example,
compare the liquidity of U.S. versus non-U.S. stocks (ADRs) traded on the same exchange
(NYSE), and find that ADRs have wider spreads, less depth and larger intraday volatility than
comparable U.S. stocks. Eleswarapu and Venkataraman (2003) examine the effect of legal and
political institutions on trading costs of the ADRs. They report that the average trading costs are
significantly higher for stocks from French-civil law countries than for stocks from common law
countries. In addition, ADRs originating from countries with better rating for judicial efficiency,
accounting standards, and political stability, have lower transaction costs.
The second stream of literature, and one that the current paper belongs to, examine the
trading costs of paired stocks in different locations. In this relatively sparse literature, Huang and
7 Werner and Kleidon (1996) also investigate British stocks that are cross-listed in the U.S. and find that order flow for cross-listed securities is segmented. Using a sample of Japanese government bonds traded in London and Tokyo, Tse (1999) shows that traders have a marked preference for trading in the home market.
7
Stoll (2001) compare the same set of stocks traded in London Stock Exchange and NYSE and
conclude that market characteristics such as tick size, spreads, market depth, and quote clustering
are endogenous to the market structure. In particular, spreads are higher on trades executed on
the dealer market (the London Stock Exchange). However, as we have argued earlier, traditional
measures of transaction cost (e.g., bid-ask spread) using transaction level data cannot accurately
account for institutional trading costs.8
In sum, none of the existing studies offers a comparison of institutional trading costs in a
matched setting and none asks the question (at a decision level) of which market has lower
institutional trading costs for the same underlying security. This is another focus of our study.
So, which trading venue is likely to have lower transaction costs for institutional trading?
Some suggest that costs are likely to be lower on the stock’s local exchange than on the foreign
stock exchange (ADRs) since most of the order flow and trading volume in the underlying
company may still reside in the home market (see, for example, Barclay, Litzenberger, and
Warner, 1990; and Pulatkonak and Sofianos, 1999). Specifically, the Chowdry and Nanda
model that we use for guidance with the current analysis predicts that if there exists more than
one market for a security, only one will emerge as the dominant market: a “winner-takes-most”
phenomenon. Thus, liquidity traders will seek markets with lowest trading costs and informed
traders will maximize profits by hiding behind liquidity trades. And given the size of institutional
trading, it is even more critical that they trade in markets with greater liquidity, or a greater
relative depth, for both their liquidity-motivated and information-based trading. We measure the
relative depth of the markets using the ratio of the local volume to the total trading volume on the
stock. If the relative local volume is high, institutions are more likely to trade in local markets
and trading costs are expected to be lower.
There also exist studies that suggest adverse selection costs for ADRs may be lower than
the corresponding stocks in their home countries because of the informational advantage of
traders in the home markets relative to the foreign institutional investors (see, for example, Choe,
Kho and Stulz, 1999). Therefore, trading costs should be distinct between a given ADR, and the
corresponding locally traded stock, and that the cost difference should be a function of the net of
8 Another related stream of research examines institutional trading costs solely in international markets (see, for example, Domowitz, Glen and Madhavan (2001), Perold and Sirri (1998), and Chiyachantana, Jain, Jiang and Wood (2004)).
8
the adverse selection and liquidity costs. There are also additional factors that are important in
determining institutional trading costs in international stocks such as overlapping trading hours
(Pulatkanok and Sofianos, 1999), market design, ADR levels, capital control (Lins, Strickland,
and Zenner, 2003), and measures such as shareholder rights, and enforcement of insider trading
laws (La Porta, Lopez-se-Silanes, Shleifer, and Vishny, 2000). Therefore, we also examine the
impact of these factors on institutional trading costs.
3. Data and Sample Characteristics We obtain a sample of institutional trading data across 35 foreign countries and their
corresponding ADRs trading in the U.S. from the Plexus group, an independent consulting firm
for institutional clients. Over the period covered by our data, Plexus had 38 clients trading in
international stocks. Our institutional trading data in foreign stocks includes first three quarters
of 2001. The corresponding trading data in ADRs are collected from the Plexus U.S. database
which includes the same three quarters in 2001. The Plexus data pertaining to international
trading is similar in their format to those pertaining to domestic trading in the U.S. Specifically,
the international data contain information on institutional decisions about stocks that were
traded, direction of the trade (buy versus sell), quantity of shares desired, value-weighted average
stock price on and before decision date, dates of release of orders from institutional clients to
trading desks, prevailing stock price at the time of release, number of shares released, the code
number of brokers used to fill the order, transaction price, quantity of shares traded, execution
date, commissions charged, and the market capitalization of the stock. To maintain data integrity
and to eliminate possible errors, we delete observations with missing prices or order quantities.
In addition, following the approach of Keim and Madhavan (1995, 1997), we exclude orders or
transactions of less than 100 shares, as well as orders for stocks trading under $1.00.
We also augment our data with Datastream International stock market indices for the 35
countries. This enables us to control for market-wide returns in calculating price impact of
institutional trades.9
9 For example, if the Finnish market on a given day rises significantly, then purchases in a Finnish stock in Finland are likely to have a greater positive price impact for purchases and a negative price impact for sales. This may not be the case for the corresponding ADR trading in the U.S. Therefore, for robustness purposes, our analysis also includes transactions costs computed by accounting for such market- wide movements.
9
Table 1 provides sample characteristics. Our unit of examination is a trading decision by
an institution in our dataset. Out of all the 901 cross-listed stocks reported in the Plexus
database, institutions trade some of the stocks exclusively in local markets, and some entirely in
the ADR markets, and the remaining in both the ADR and their respective local markets. Our
sample covers a substantial portion of the foreign stocks cross-listed on U.S. exchanges as the
dollar trading volume of ADRs included in our sample accounts for approximately 80% of the
volume of all ADRs listed on NYSE, NASDAQ and AMEX during the period of our study.
Specifically, there are 237 distinct stocks trading in foreign exchanges and 237 matched ADRs
trading in the U.S. Interestingly, institutions trade a much larger number of securities (583) in the
local markets only, while trading 81 securities exclusively as ADRs. Institutions also appear to
trade more frequently in local markets based on the number of institutional decisions. For stocks
traded in both venues (locally as well as through ADRs), the total number of decisions in the
foreign stocks (ADRs) in our sample is 71,928 (32,251), once again indicating that the ADR
market is used less frequently than the corresponding home market. There are also a higher
number of decisions per stock routed to local markets. Additionally, for stocks trading in both
venues, institutions trade more aggressively when trading stocks in local markets, as evidenced
by a greater dollar value per decision for home stocks, relative to their corresponding ADRs
($2,242,823 versus $1,440,153). Interestingly, for stocks traded exclusively in one market,
although the average decision shares are higher for the local-market-only stocks, the
corresponding average decision dollar volume is smaller than those associated with ADR-only
stocks. This is consistent with the fact that local-market-only stocks have lower prices, as
discussed below.
For stocks traded in one venue only, about 57% of the trades in the home markets were
purchases while only about 43% of the ADR trades were purchases.10 Similarly, for stocks that
are traded as both ADRs and in their home exchanges, purchase decisions in their local markets
(as ADRs) account for 52.85% (46.60%) of the total institutional decisions. This suggests that
institutions are more likely to use ADRs for selling or possibly short selling decisions since
10 Chan and Lakonishok (1993) argue that since an institutional investor typically has limited alternatives amongst its current portfolio to sell a security, such a decision does not necessarily convey negative information. In contrast, the choice of one specific issue to buy, out of virtually all the stocks trading in the market, is more likely to convey positive firm-specific news. Alternatively, they suggest that brokers are willing to facilitate institutional sells and accumulate long inventory position for smaller price concessions but not so willing to facilitate institutional purchases because they have to undertake short selling. Similar arguments are also set forth in Keim and Madhavan (1996).
10
many foreign markets have restrictions on short selling. We also evaluate if orders are routed
differently depending on the degree of order difficulty captured by the metric, Order Complexity,
calculated as the ratio of decision-size to the average daily trading volume in the previous five
trading days for that stock. We find that Order Complexity is, in general, significantly lower for
stocks traded in both markets, relative to stocks traded exclusively in one market. This may
indicates that for less complex orders, institutions use both markets since stocks traded in both
venues also have lower trading costs as measured by the price impact.
For those stocks traded in both markets, the volume-weighted average trade price (all in
U.S. dollars) is approximately $25.43 for the stocks traded in local markets and $28.00 for the
ADRs. For stocks traded as ADRs only, the average share price is $47.84, while stocks bought
and sold in local markets only have an average price of $8.11. Before calculating average
volume for ADRs, we adjust for the number of shares using the conversion ratios from JP
Morgan - Global ADR Universe's Security and Issue Detail file. The average daily volume for
the stocks in local markets (ADRs) in our sample is 927,830 (106,720) shares suggesting that for
stocks traded in both venues, the local (i.e., foreign) markets are much deeper. Similarly, the
market for stocks traded as ADRs only is relatively thin with daily average volume of 1,429,001
shares compare to that for stocks traded as Local only (4,908,700). Overall, the ADR market
appears to be significantly thinner than local markets for cross-listed securities. Trading costs are
the highest for stocks traded as ADRs-only, possibly due to the larger decision dollar values and
order complexity. The stocks traded in both markets have the lowest trading costs likely a result
of competition among exchanges to compete for order flows. As for commission costs, the stocks
that are traded in both venues have higher commission costs, possibly due to order
fragmentation. Also note that the stocks traded as ADRs only have the lowest commission costs.
We also find that, for the group of stocks in our sample that trades in both markets, about 76% of
the total volume transacted in both markets is, in fact, in the respective local markets for that
stock.
In sum, the evidence in Table 1 indicates that institutions are relatively less active in the
ADR market compared to trading the same stocks in their respective home markets.
11
4. Empirical Results on the Choice of Trading Venue From the evidence presented so far, it is clear that institutions often trade both the ADR
and the same stock in its respective home exchange. But, what determines the distribution of
their decisions across these two markets? We first examine this issue at country level and report
the decision volume distribution on a country-by-country basis.
In addition, we study the distribution of institutional decisions at the individual stock
level. We partition all stocks in our sample based on the relative liquidity of the markets for the
stocks, and examine if the distribution of institutional decisions is positively correlated with the
relative liquidity of the two markets. We also perform a regression analysis by including various
factors that influence the distribution of institutional decision volume across the two venues. We
underscore the fact that out of the 901 distinct stocks in our sample only 237 are traded in both
venues, while the rest are traded exclusively in one market with a majority of the stocks trading
in local markets only. Since we are interested in understanding why institutions forego the
opportunity to trade in both venues and, instead, concentrate in one market only, we employ a
multinomial logistic regression model to identify the determinants of institutional choice of
trading venues.
4.1. Distribution of institutional decisions by country and by the relative liquidity in local
and ADR markets
In Table 2, we provide details on the number of stocks, the number of decisions and
trading volume ($), between the local stocks and their corresponding ADRs, for all institutional
trades in our sample, on a country-by-country basis. In the first column labeled number of
stocks, we report two numbers for each country. The first number is the total stocks in our
sample from a particular country (traded in local only, ADR only, or both). The number in the
parenthesis reflects the number of stocks traded in both markets by institutions included in our
sample. Thus, for example, our sample has 18 cross-listed stocks from Argentina and 5 of them
were traded by institutions using both local and ADR markets. There is a large cross sectional
variation with respect to the number of stocks traded in both venues. The countries with a larger
number of cross-listed stocks in both venues include 26 from Japan, 23 Brazilian stocks, and 22
stocks from the Netherlands. In terms of decisions in local markets, the countries have the
highest number of decisions are Japan (14,651 decisions), and the Netherlands (9,031 decisions).
12
Institutions are most active in trading ADRs from the Netherlands (6,727 decisions) and Mexico
(5489 decisions). Our sample also embraces countries where the decisions involving the home
stocks are either greater than those involving the corresponding ADRs in the U.S. (24 countries),
or where the reverse is true (11 countries). This variation across countries allows us to examine
the role of relative liquidity, information asymmetry and other country level institutional
differences in the determination of trading venues between ADRs versus the same stocks in their
respective home markets.
The total institutional dollar volume in the home market varies from $9.544 billion traded
in Japanese stocks to about $2 million in stocks from Venezuela. Dollar trading volume in ADRs
is the highest Netherlands at $7.514 billion and the lowest for Belgium at $1 million.11 The
emergent message is that institutions followed by Plexus are most active in home markets for
countries like Japan, and Netherlands. By the same token, trading in ADRs is most active for
stocks originating in Netherlands, followed by those from Mexico, and the UK. We also compute
the ratio of institutional dollar volume in ADRs as a percentage of total institutional volume in
both ADRs and local markets. The ratio varies from 1% to about 98% in ADRs. Thus, our
sample encompasses the entire gamut ranging from stocks with a majority of the trading in the
local markets (e.g., Japan, Switzerland, and Hong Kong, where ADR shares is less than 2%),
stocks where active trading takes place only as ADRs (e.g., U.K. (98%), Mexico (84%), and few
others), and stocks with active trading present both in local exchanges and as ADRs (e.g., the
Netherlands, with 49% of institutional volume in ADRs and 51% in local markets).
In Table 2, we also report the average daily trading volume of the cross-listed stocks
traded as ADRs and in their respective local markets, as a measure of the depth of the market. If
liquidity, or the depth of the market, is the primary concern of institutions, we would expect to
see that a larger share of institutional decisions in the more liquid (i.e., deeper) venue. Our
results show that the average daily dollar volume of stocks in their home markets is about 10
times larger than the corresponding ADRs and, as expected, a larger share of institutional
decisions occurs in the stocks’ local markets. We also calculate the correlation between (a) the
percentage of decisions (in dollars) in the local markets relative to total dollar volume of all the 11 Since one share of an ADR is not always equivalent to 1 share of the underlying stock in its home exchange, direct comparison of share volume is not appropriate. Formally, the ADR ratio provides the number of foreign shares represented by one ADR. The ratio is typically depicted as, for example, "1:3", which implies that one share of the ADR represents 3 foreign shares, and so on.
13
decisions, and (b) the percentage of daily dollar trading volume in local markets relative to the
daily dollar trading volume of both the local and ADR markets. This correlation is estimated at
0.54 and is statistically significant. Thus, institutions appear to be concentrating their trades in
the deeper markets (see, for example, Argentina and Mexico).
A closer look at the country-level data, however, shows that institutions do not always
trade in the market with the higher volume. For instance, for cross-listed stock originated from
Brazil, the preferred trading venue of institutions is in the ADR market with ADRs account for
81% of the institutional dollar volume, while the local market is deeper as indicated by a
significantly higher dollar volume (account for 99% of the total volume). As for stocks
originating from the United Kingdom, much more active trading is seen in the ADR market
rather than in the deeper U.K. market. In a related study, Pagano, Roell, and Zechner (2002)
report that U.K. suffers from a large net order outflow of its cross-listed stocks because of its
high trading costs. More importantly, our findings above suggest that relative liquidity alone
cannot fully explain institutions' decision on where to trade. Accordingly, other relevant factors
related to an institution's choice of trading venue are investigated later within a regression
analysis framework.
In Figure 1, we plot (a) institutional trades in ADRs as a percentage of total institutional
trades against (b) daily trading volume in ADRs as a percentage of total daily volume, for all the
countries in our sample. From the figure, we confirm our earlier observation that institutions
choose to trade in the deeper market in many of the countries (e.g., Argentina, Luxemburg,
Mexico, to name a few). However, exceptions are also seen for countries like Belgium, Brazil
and the United Kingdom, where institutional trading is concentrated in the market with less
overall volume.
We proceed to explore the correlation between the relative allocation of trading decisions
between the respective home markets and their ADRs, and the relative liquidity across the two
markets, on a stock-by-stock basis. Toward this end, we further partition our sample of matched
stocks into quintiles based on our measure of the depth of the market, calculated as the daily
local volume on a stock relative to the daily total volume in both the local and ADR markets.
For these five groups, our results show that, in general, as the depth of the local market declines,
so does the percentage of institutional decisions in the local market. Thus, for example, for the
first quintile, which has the deepest local markets, the percentage of institutional decision is as
14
high as 70.7%, while for fifth quintile, which has the least depth in the local market, only 44.7%
of the institutional trading volume is in the local markets. This further supports the notion that
relative liquidity, or the depth of the alternative trading venue, is one of the important drivers of
the distribution of institutional decision on trading venue.12
4.2. Determinants of local trading volume for cross-listed stocks traded by institutions in
both markets
To further understand how institutional decisions split across the local and the ADR
markets, we perform a regression analysis on the institutions' dollar trading volume in the local
market (relative to the total institutional volume in both local and ADR markets). Specifically,
we are interested in understanding the impact of variables that are country specific, issue
specific, and order specific on institutions’ relative trading volume. Prior research has shown that
country and stock characteristics are important in determining U.S. trading volume of cross-
listed securities. The current study of institutions’ trading volume adds to our understanding by
including order level information in our analysis.
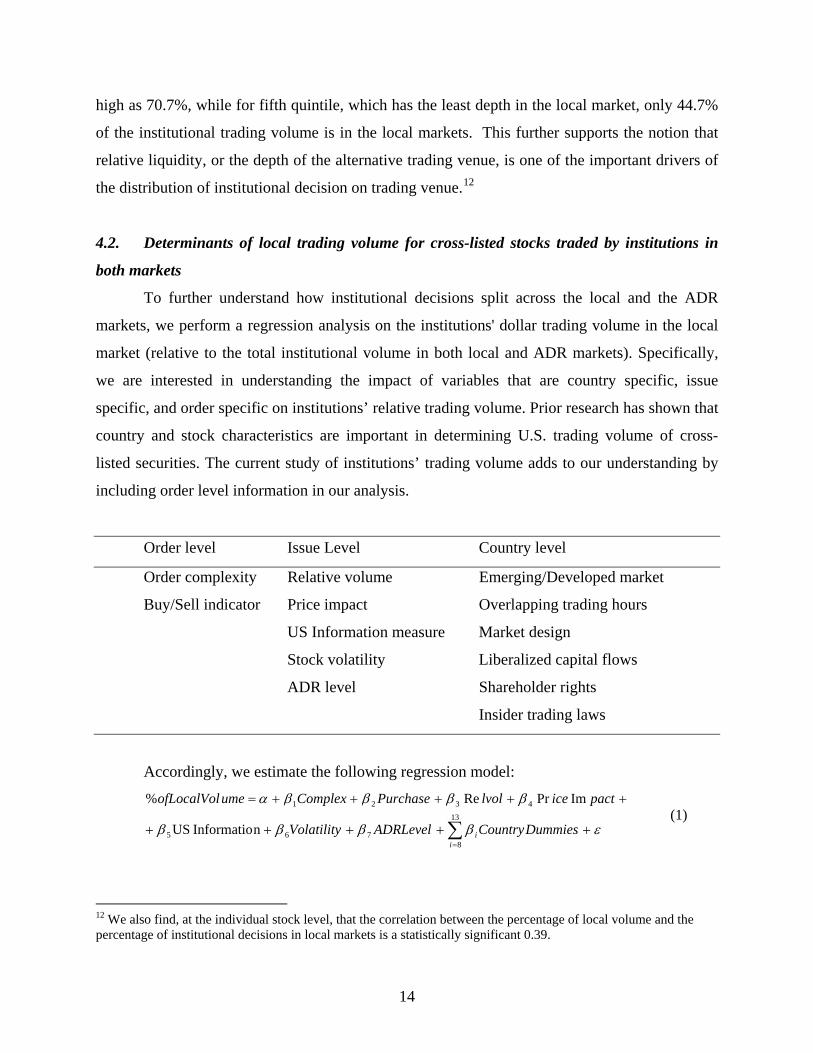
Order level Issue Level Country level
Order complexity Relative volume Emerging/Developed market
Buy/Sell indicator Price impact Overlapping trading hours
US Information measure Market design
Stock volatility Liberalized capital flows
ADR level Shareholder rights
Insider trading laws
Accordingly, we estimate the following regression model:
εββββ
ββββα
+++++
+++++=
∑=
DummiesCountryADRLevelVolatility
pacticelvolPurchaseComplexumeofLocalVol
ii
13
8765
4321
n Informatio US
ImPrRe% (1)
12 We also find, at the individual stock level, that the correlation between the percentage of local volume and the percentage of institutional decisions in local markets is a statistically significant 0.39.
15
where % of Local Volume is the dollar decision volume in the local market relative to the total
decision volume of the stock in both the local and ADR markets; Complex is the difference in
order complexity, calculated as the ratio of decision shares relative to average daily trading
volume over the prior five trading days in the respective local and ADR markets; Purchase is the
difference in percentage of purchase-to-sell decision of foreign stocks and the corresponding
ADR; Price Impact is the difference between the price impacts of local shares and that of the
ADRs, and we calculate price impact following Keim and Madhavan (1997); Relvol refers to the
relative stock trading volume in the local exchange to the overall trading volume; US
Information Measure is the correlation of ADR returns to U.S. stocks as shown in Baruch,
Karolyi and Lemmon (2003); Volatility is the difference in the standard deviation of the foreign
stock and the corresponding ADR; The dummy for ADR level takes a value of 1 for Level II and
III ADRs, and zero for Level I ADRs; Overlap takes a value of 1 if the local stock and ADR
have overlapping trading hours, and zero otherwise; Emerge takes the value of 1 for markets
classified as emerging markets by MSCI, and zero for developed markets; Market Design takes a
value of 1 for countries with designated market makers, based on the information provided in
Jain (2003); CR is the index of shareholders’ rights constructed by La Porta et al. (1998), and
ranges from 0 for worst to 5 for best; Liberal signifies whether a country has liberalized capital
flow policies with minimal restrictions based on Bekaert and Harvey (2000); ITL takes the value
of 1 if the insider trading laws have been enforced in the country through at least one
prosecution, and zero otherwise.
We report our regression results in Table 3. We find that order complexity is positively
correlated with the percentage of institutional decision volume in the local market. Therefore a
significant positive coefficient would imply that more informed trading activity gravitates
towards a stock’s home exchange rather than the ADR market. Further, Keim and Madhavan
(1995, 1997) and Chan and Lakonishok (1993) suggest that institutional buys are often more
informed than institutional sells.13 In our regression, however, percentage of buy orders has no
significant impact on relative decision volume in the local versus the ADR market.
As for stock or issue level variables, we find that the relative liquidity of the two trading
venues is an important determinant of institutional decision volume. Institutions share of local
13 This follows since buys are supposed to be based on extensive research of the whole universe of stocks while sells are triggered more mechanically when target prices are hit.
16
trading increases in deeper market measured by a higher overall local trading volume in the
stock. In addition, the stocks that have higher price impact on local trading (compared to trading
the ADR) are expected to attract less trading interests from institutional investors, suggesting that
institutions do route their orders to the less expensive market. The U.S. information measure is
significant at the 10% level, and the negative sign indicates that stocks with a higher correlation
with the U.S. markets display a lower fraction of institutional trading in the local markets. In
addition, stocks that are more volatile are also found to have a higher percentage of local shares
traded by institutions. As expected, we find that the Level II and Level III ADRs have a higher
fraction of institutional trading in the ADR market.
Several studies have also examined the extent of market integration by comparing
spreads and trading volume when both the home market and the NYSE are open. Werner and
Kleidon (1996), for example, report that volume and volatility are much higher over the 2-hour
trading period each day when both the London Stock Exchange and the NYSE are open. In a
related paper, Hupperets and Menkveld (2002) perform a similar study for a sample of Dutch
ADRs and find that the spreads for the Dutch ADRs traded on the NYSE increase during non-
overlapping hours, indicating that competitive pressure for order flow caused by trading on
multiple exchanges reduces adverse selection and drives spreads down during the overlapping
period. Overlap is included in our regression to gauge the effect of overlapping trading hours on
the distribution of institutional decisions. The coefficient of the overlapping variable is negative,
and statistically significant, suggesting that, there is greater relative trading in the ADR market
for those firms domiciled in countries sharing overlapping trading hours with the United States.
Also, a larger share of decisions is routed to the ADR market for emerging market stocks. This
finding, similar to that reported in Pulatkonak and Sofianos (1999), is consistent with the fact
that emerging markets tend to have higher transaction costs (Chiyachantana, Jain, Jiang and
Wood, 2004). In addition, institutions are less likely to have trading facilities and other
infrastructure located in the local stock exchange, which makes trading ADRs more convenient.
Some countries’ exchanges have designated market makers who are obliged to provide
quotes and then act as counter parties for incoming orders by trading on their own accounts.
Market makers are expected to help improve liquidity when the depth of the order book is not
sufficient or lacks synchronization. However, many theoretical models predict little role for a
market maker (Black, 1995; Rock, 1996). Models provided by Glosten (1989), and Seppi (1997)
17
envisage that a hybrid specialist/limit order market provides better liquidity to small investors.
Our study is ideal in testing if having market makers would increase the order flow. The
coefficient of our market design variable is significantly negative, which suggests having
designated market makers provides no added incentives for institutions to route their orders to
that market. Moreover, it appears to lower the fraction of institutional trading in that market.
Finally, we find that the local share of institutional decisions is positively correlated with
the proxy for the enforcement of insider trading laws. Also institutions appear to prefer to trade a
higher percentage of their transactions in ADRs for issues originating from countries with
liberalized capital markets and better shareholder rights.
4.3. Trade in one market or in both markets?
In forming our matched sample, we observed that institutions do not always trade cross-
listed stocks on both the local exchange and also in its ADR form. Accordingly, in Table 1, we
report that there are 583 stocks traded in local markets exclusively, while 81 securities in our
data are traded as ADRs exclusively. Thus, while institutions have the choice of trading in both
markets, it is clear they do not always do so. The fact that a majority of stocks in our sample are
traded exclusively in their respective home markets by institutions appears to be at odds with the
firms' stated motive to list their shares on a major exchange (such as the NYSE), which is to
improve the company’s exposure to foreign investors. Our sample seems to suggest that the
targeted foreign investors of cross-listed firms are often individual investors. We are interested in
discovering the factors that affect institutions’ decisions on where to trade. Accordingly, we
analyze the decision of trading the ADR versus trading the corresponding stock in its home
exchange, within a multivariate setting using a multinomial logistic framework on a stock-by-
stock basis. In particular, our dependent variable takes the value 1 for stocks that trade in the
ADR market only and 2 for stocks that trade in the local exchange only. Additionally, our base
(or, reference) group comprises of those stocks in our data that were traded both as ADRs and in
their corresponding home exchanges. These stocks are assigned a value of zero in our analysis.
Our independent variables encompass similar variables used earlier in the decision volume
regression.
Table 4 provides the estimates averaged over all stocks. It is clear that, relative to stocks
traded in both markets, stocks traded in the ADR market solely are associated with lower relative
18
local volume. In addition, the coefficient for U.S. information measure is highly significant, and
a higher correlation of the stock with the U.S. market increases the probability that the stock will
be traded exclusively in its ADR form. Stocks with overlapping trading hours, originating from
markets with designated markets makers are also more likely to be traded as ADRs only.
Correspondingly, the probability of stocks trading solely on their home exchanges increases for
larger cap stocks, more complex orders, stocks with deeper market (higher fraction of local
volume), and higher price impact. On the other hand, emerging markets stocks, stocks with a
higher correlation with the U.S. market, having Level II and Level III cross-listed shares, and
with overlapping trading hours display a lower likelihood of being traded exclusively in the local
markets.
5. Methodology and Results on Comparison of Institutional Trading Costs We now turn our attention to the computation of institutional trading costs over the
sample period. Total execution costs comprise of an implicit cost (through the price impact
associated with a given trade) and an explicit cost (i.e., commissions). Unlike commissions,
however, the price impact of a trade – the deviation of the transaction price from the
‘unperturbed’ price that would prevail had the trade not occurred – is arguably more difficult to
measure. Much depends on the proper identification of the unperturbed price. In particular, the
trade itself should least influence the measure of price impact. Keim and Madhavan (1997)
discuss the importance of this issue in great detail. One method that is popular with academics
and practitioners alike is comparing the average price at which an order is executed with the
unperturbed price prevailing just prior to the trading decision. Following Keim and Madhavan
(1997), we compute price impact at the decision level as the ratio of the volume weighted
average trade price of the component trades (WTP) in that decision to the closing price on the
day before the trading decision is made ( 1−dP ). Thus price impact based on decision price is
calculated as 11
−−dP
WTP for buys and )1(1
−−−dP
WTP for sells. Buy (sell) decisions executing at a
higher (lower) average price relative to the closing price on the day before the decision would
have a positive price impact. Similarly, buy (sell) decisions executing at a lower (higher)
average price relative to the benchmark price would display a negative price impact.
19
Furthermore, following Jones and Lipson (2001), we also calculate the price impact at
release level as the ratio of the volume weighted average trade price (WTP) of the component
trades in that decision to the price prevailing at the time the institutions release an order to the
trading desk ( rP ). Thus price impact based on release price is calculated as 1−rP
WTP for buys and
)1( −−rP
WTP for sells. Once again, positive and negative price impacts for buy and sell decisions
are similar to those provided above. Finally, the explicit cost is calculated as commission in
dollars per share as a percentage of the transaction price.
5.1. Comparisons of institutional trading costs by country
Panel A of Table 5 provides the implicit, explicit and total costs based on the two
measures discussed above on a county-by-country basis. Overall, the implicit costs of trading
the ADR are significantly greater relative to trading the stock in his home market (0.66% versus
0.51%). This is true for both benchmark prices (DECISION and RELEASE).
On a country-by-country basis, in terms of explicit costs, home markets do not appear to
enjoy the same dominance as seen with implicit costs. Specifically, for a majority of the
countries in our data, commission costs of trading the ADRs are lower than those associated with
trading the corresponding stocks in their home countries.
Overall, the total trading costs using both implicit and explicit costs reveal that trading in
the ADR is significantly more expensive than trading in the corresponding stock in its home
country. On a country-by-country basis, however, for twenty countries, the total cost of trading
the ADR is significantly greater than trading the corresponding stock at home. For the remaining
fifteen countries, the total trading costs associated with trading the ADR are less than those
incurred by trading the corresponding stocks in their respective home countries.
There also does not appear to be a geographic pattern to our findings: Countries like
United Kingdom, Norway and Greece (all from Europe), Venezuela (South America), and Korea
(Asia) all show that trading the ADR is significantly cheaper than trading the same stocks in their
respective home markets. Contrarily, for countries like Japan, Indonesia, India and Singapore
(all from Asia), Mexico (North America), and the Netherlands (Europe), the total cost of trading
the ADR is significantly greater than trading the same company at home.
20
We further attempt to compare our numbers to those reported by other studies although
the risks of doing so are obvious in terms of ensuring the comparison of “apples-to-apples” by
way of similar measures over the same period of time and using similar samples, etc. In spite of
such inherent risks, we find that trading ADRs result in a much higher implicit cost. The release-
price-based price impact for all ADR trades is 0.66%, while CJJW (2004) reports the same
measure of institutional transaction cost of US stocks at 0.18%. This is perhaps due to the fact
that the stocks in our sample are traded in multiple markets and, for many countries, the winners
are the local markets where a majority of the trading occurs.
A possible criticism of the results presented in Panel A of Table 5 is that they are not
adjusted for market-wide variations. That is, if there is an overall upward market movement on a
given day (or period) in a given country that is not reflected in the U.S. market, then a buy
decision in the home market might lead to a greater price impact compared to a purchase
decision of the same company’s ADR in the U.S. market. The same argument holds for a selling
decision made in a downward trending market of a given country that is not similarly reflected in
the U.S. over the same period of time. More generally, to the extent that the price impact is a
function of the liquidity available on the other side of the trading decision (i.e., the sell side
liquidity for a buy decision and vice versa) and to the extent that there may exist a differential
condition across the two markets (a particular foreign market versus the U.S. market), our results
may be skewed in one direction or another. To see if such issues make a difference in the
trading costs across different countries versus the U.S., we present, in Panel B of Table 5, the
same costs adjusted for market-wide price movements. We use the Datastream International
stock market indices for the 35 countries from which the companies’ local stocks (and their
corresponding ADRs) originate. The market adjusted price impact is the raw price impact for a
decision in a particular stock in excess of the price changes on the foreign market index (of the
market the stock originates from) between the decision date and the date when the last
transaction in the given decision is completed. By presenting these additional results adjusted
for market-wide movements in each of the foreign markets represented in our data, we are able
to examine transactions costs with and without such market-timing costs. Overall, our results
remain the same qualitatively as in Panel A and attest to the robustness of our findings. Thus,
for example, for all stocks, the price impact (using DECISION) without factoring in market-wide
factors were 0.51% and 0.66% for trading the stocks in the Korean markets versus their
21
respective ADRs in the U.S., respectively. After factoring in market-wide effects, the
corresponding costs are 0.38% and 0.76%, respectively. Overall, the price impact of the home
stocks diminishing slightly while simultaneously increasing slightly the price impact of the
corresponding ADR. Collectively, such changes result in a larger gap between the price impacts
of trading in local versus the ADR markets. A reasonable explanation for this is likely due to the
larger movement (i.e., higher volatility) of foreign market indices relative to the U.S. To
corroborate this intuition, we use Datastream International stock market indices to compute the
volatility of foreign markets and the U.S., and find that 20 out of the 35 foreign markets included
in our sample have considerably higher volatility than that in the U.S.
5.2 Institutional trading costs across various partitions of the data
In this section, we investigate institutional trading costs across trading the home stocks
versus the corresponding ADRs for various important partitions of the data. All partitions are
motivated by extant research on trading costs in general and institutional trading costs in
particular. The results are presented in Table 6.
Large, medium and small stocks. Large stocks are often the most liquid, and are
associated with lower transaction costs while small stocks are often speculative and traded in
thinner markets with poorer liquidity. To see if institutional trading costs differ significantly
along stock sizes, we partition our sample of stocks into large, medium and small by dividing the
sample equally into three groups ranked by the market capitalization. From Table 7, we confirm
that price impact is higher for smaller stocks, regardless the location of trades. More importantly,
we find that overall the cost of trading the ADRs of both large and medium foreign companies in
the U.S. is significantly higher than the cost of trading the corresponding companies’ stocks at its
home country (0.23% versus 0.59% based on DECISION for large companies and 0.44% versus
0.66% for medium companies). By contrast, trading smaller stocks in ADRs appears to be
associated with a cost savings of 0.14%. In terms of explicit trading costs, the commissions are
lower with ADRs than with the stocks in their home markets. For example, the commission for
large ADRs is 0.15% compared to 0.23% for the corresponding stocks traded in the home
exchange. Similarly, for small stocks, the commissions are 0.27% in the home market versus
0.19% in the ADR market. The commissions in the U.S. market are smaller for small
capitalization stocks in spite of lower relative volume, possibly due to the cross subsidization
22
across stocks (ADR and domestic) by U.S. brokers. In sum, for medium and large companies, the
total cost of trading the ADR is significantly higher than trading the same stocks in their home
markets, while no significant difference is observed for trading small stocks in the two
alternative venues. This conclusion is robust to using the benchmark price given by either
DECISION or RELEASE.
Easy, moderate and difficult trading decisions. We partition the sample into three equal
groups (easy, moderate, and difficult) based on the complexity of the decision. Decision
complexity is calculated as the ratio of decision-size to the average daily trading volume in the
previous five trading days for that stock. From Table 6, we see that while the overall trading
costs (price impact and commission) are higher for the ADRs relative to the same stocks in their
home exchanges, they are significantly higher only for the difficult decisions. For easy and
moderate decisions, the costs are statistically similar. Hence, institutions are better off trading
difficult decisions in a stock’s home exchange rather than trading them as ADRs.
Buy versus sell trades. We turn our attention to the relation between trading costs and
the direction of trades (i.e., buy versus sell). Unlike many studies of transaction costs that rely on
unsigned trading volume, or use the Lee and ready (1991) algorithm to infer the direction of
trades, our unique dataset includes information on institutions' intended trade direction.
Purchases are often considered more informative than sells and, consequently, the price impacts
associated with a buy or a sell trade should be distinct from each other. Thus, we compare the
relative price impact across the two markets for the two groups, partitioned by the percentage of
purchases relative to all trades. Interestingly, for the group with higher percentage of purchases,
trading costs in the local markets are on average 0.18% lower than that of the ADR markets,
showing a larger cost advantage compared with the group with relatively lower percentage of
purchases.
High volume versus low volume stocks. Chowdry and Nanda (1991) posit that liquidity
traders prefer markets with the lowest trading costs and informed traders maximize profits by
hiding behind liquidity traders’ trades. Thus, in the presence of multiple markets, the venue with
a higher overall trading volume is likely to offer better liquidity to institutions. We partition the
sample firms into two equal groups based on the local volume relative to the combined trading
volume of ADRs and the same firm in its local market. Consistent with above argument, for
stocks with relatively high local volume, the price impact of local stocks are considerably lower
23
than its corresponding ADRs. The difference in the price impact of the two trading venues is
0.29% and statistically significant. Moreover, for stocks with a relative high trading volume in
the ADRs (or relatively low volume in local markets), the overall trading cost is also slightly
higher relative to trading the same companies’ stocks in their respective home markets, but the
difference is not statistically significant.
U.S. information measure. Baruch, Karolyi and Lemmon (2003) show that volume
migrates to the exchange in which the cross-listed asset returns have higher correlations with
returns of other assets traded in the market. We are interested in finding if institutional trading
costs differ across stocks with different degrees of information measure. Thus we partition the
sample firms into two equal groups based on U.S. information measures computed similar to
Baruch, Karolyi and Lemmon (2003) . Interestingly, the price impact for cross-listed stocks with
higher U.S. information measure is significantly lower (when Release Price is used as the
benchmark) in the ADR market than in the corresponding local market. On the contrary, for
stocks with lower U.S. information measure, trading costs are lower for local markets regardless
of the benchmark price used. We interpret this as further evidence of institutions having the
incentive to trade more of the cross-listed shares in the U.S. market as ADRs.
Market design. The market designs for many exchanges around the world have each
stock assigned to designated dealers who are contractually obligated to continuously post binding
quotes. Toronto (Canada), Netherlands, NYSE, AMEX, NASDAQ are a few examples. Many
theoretical models predict little role for a market maker (Balck, 1986; Rock, 1996). However,
Glosten (1989), and Seppi (1997) envisage that a hybrid specialist/limit order market provides
better liquidity to small investors. We study institutional transaction costs through price impact
and commissions for stocks originating from markets with or without marker makers. Our results
suggest that for stocks from markets with market makers, trading costs are somewhat lower for
local markets than for ADRs. Nevertheless, the costs are not statistically significant for stocks
with no designated market makers in the local markets.
Overlapping versus non-overlapping trading periods. Foreign markets normally have
trading hours that are different from that of the ADRs trading in the U.S. The existence of an
alternative trading location for stocks and the presence of overlapping trading hours between the
firm’s home exchange and the ADR market lead to conjectures about relative liquidity and
overlapping trading hours. Hupperets and Menkveld (2002), for example, show that the
24
competitive pressure for order flow caused by trading on multiple exchanges drives spreads
down during the overlap period. In the same vein, we expect the difference in price impact to be
wider for stocks originating from countries with non-overlapping trading hours with the U.S.
market. We divide our sample into overlapping and non-overlapping groups based on whether
the local market has overlapping trading hours with the U.S. Consistent with our conjecture, the
difference in price impact is larger when the local market trading hours do not overlap with that
of the ADR market. And when market-wide price changes are adjusted for, the price impact of
ADRs is 0.59% higher than the same set of stocks on local exchange for the non-overlapping
group -- consistent with the findings of Pulatkonak and Sofianos (1999), and Clarke and Shastri
(2001).
Developed versus emerging markets. We also partition our data along the lines of
developed markets and emerging markets using the Morgan Stanley Capital International’s
(MSCI) classification system. For stocks from developed markets, we find that the overall
trading costs of transacting the ADR are slightly higher than the corresponding stocks in their
home markets (0.48% versus 0.41%), and the difference is not statistically significant.
Institutional trading costs in stocks from emerging markets are much higher in ADRs (0.95%)
than on their local exchanges (0.67%). Thus, our results seem to indicate that institutions prefer
to trade stocks from emerging markets as ADRs despite the higher price impact.
5.3 Determinants of the difference in price impact
The significantly different price impacts observed for institutional trading in the ADRs
versus trading the same companies’ stocks in their home listing markets prompt us to further
investigate the determinants of this difference. We perform a multivariate regression analysis to
better understand the causes of the differences in trading the same firm's stock in alternative
locations. The dependent variable is the difference in the price impact (based on the price
prevailing at release time) between the foreign stock and corresponding ADR. The explanatory
variables include the usual suspects related to order-specific, and firm-specific factors.
Following CJJW (2004), we also include country-specific variables capturing overlapping
trading hours, market design, the level of economic development, the level of shareholder rights
protection, the state of financial liberalization, the legal enforcement of insider trading laws. In
particular, our empirical model is defined as follows:
25
εββ
βββββα
++
++++++=
∑=
DummiesCountryADRLevel
VolatilitylvolPurchaseComplexPI
ii
12
76
54321 ion USInformatRe (2)
where PI is the difference in the measures of price impact for a foreign stock and the
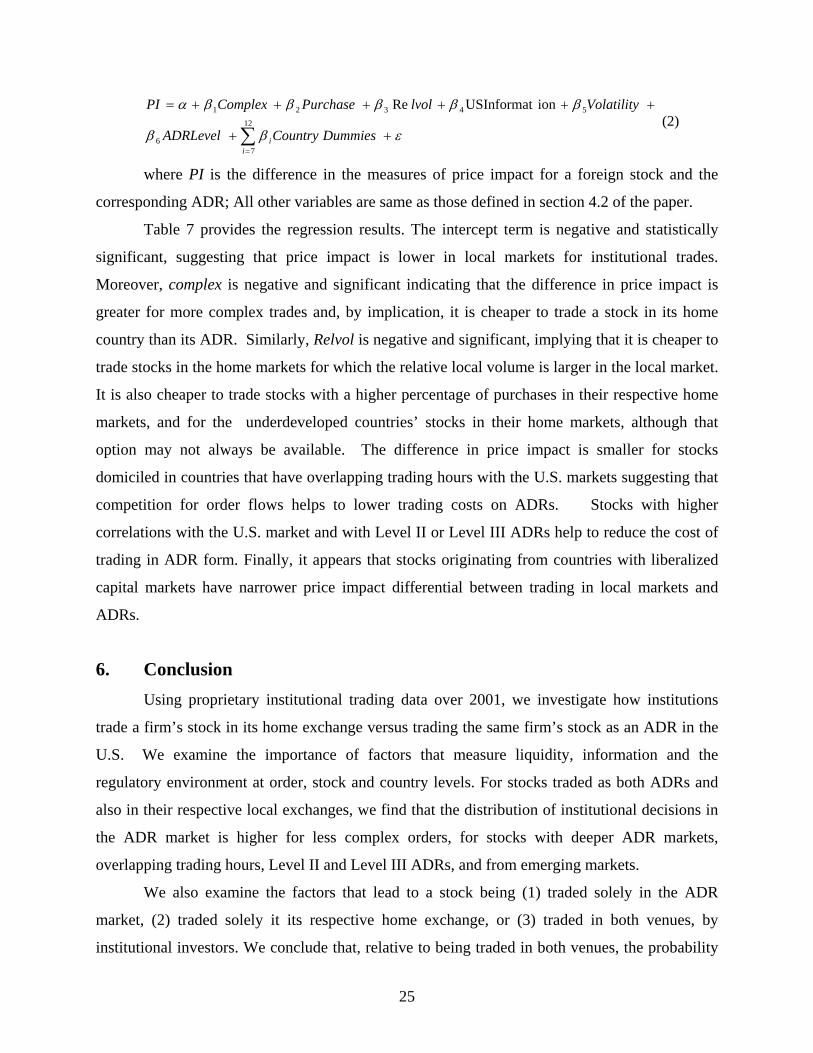
corresponding ADR; All other variables are same as those defined in section 4.2 of the paper.
Table 7 provides the regression results. The intercept term is negative and statistically
significant, suggesting that price impact is lower in local markets for institutional trades.
Moreover, complex is negative and significant indicating that the difference in price impact is
greater for more complex trades and, by implication, it is cheaper to trade a stock in its home
country than its ADR. Similarly, Relvol is negative and significant, implying that it is cheaper to
trade stocks in the home markets for which the relative local volume is larger in the local market.
It is also cheaper to trade stocks with a higher percentage of purchases in their respective home
markets, and for the underdeveloped countries’ stocks in their home markets, although that
option may not always be available. The difference in price impact is smaller for stocks
domiciled in countries that have overlapping trading hours with the U.S. markets suggesting that
competition for order flows helps to lower trading costs on ADRs. Stocks with higher
correlations with the U.S. market and with Level II or Level III ADRs help to reduce the cost of
trading in ADR form. Finally, it appears that stocks originating from countries with liberalized
capital markets have narrower price impact differential between trading in local markets and
ADRs.
6. Conclusion Using proprietary institutional trading data over 2001, we investigate how institutions
trade a firm’s stock in its home exchange versus trading the same firm’s stock as an ADR in the
U.S. We examine the importance of factors that measure liquidity, information and the
regulatory environment at order, stock and country levels. For stocks traded as both ADRs and
also in their respective local exchanges, we find that the distribution of institutional decisions in
the ADR market is higher for less complex orders, for stocks with deeper ADR markets,
overlapping trading hours, Level II and Level III ADRs, and from emerging markets.
We also examine the factors that lead to a stock being (1) traded solely in the ADR
market, (2) traded solely it its respective home exchange, or (3) traded in both venues, by
institutional investors. We conclude that, relative to being traded in both venues, the probability
26
associated with trading exclusively in the ADR market increases for stocks with lower relative
local volume, a higher correlation with U.S. market, overlapping trading hours, and for those
stocks originating from markets with designated markets makers. Correspondingly, the
probability of stocks trading solely in their home exchanges increases for larger cap stocks, more
complex orders, stocks with deeper market (a higher fraction of local volume), and higher price
impact, and decreases for stocks originating from emerging markets, having Level II and Level
III cross-list stocks, and with overlapping trading hours.
In terms of total trading costs, we find that ADRs appear to be more expensive to trade
relative to trading the equivalent securities in their respective home exchanges. On a country-by-
country basis, the overall (implicit plus explicit) costs of trading the ADR are greater (smaller or
similar) for twenty (fifteen) countries in our sample. Specifically, for countries like Japan,
Indonesia, Hong Kong, India, Mexico, the Netherlands, and Singapore, the total cost of trading
the ADR is significantly more expensive than trading the same company’s stocks at home.
Contrarily, for countries like the United Kingdom, Venezuela, Norway, Korea and Greece,
trading the ADR is significantly cheaper than trading the same stocks in their respective home
markets.
Given that significant cost differences do exist between trading the ADR versus trading
the equivalent security at home, we take the logical next step in determining the drivers of such
cost differences. Our multivariate analysis on institutional trading costs reveals that the
difference in costs (between trading in the securities’ home country and in its ADR) is smaller
for stocks associated with relatively lower local trading volume, stocks with a lower percentage
of purchase orders, stock with Level II and Level listed ADRs, and stocks from country with
overlapping trading hours.
Overall, our research sheds light on the choice of trading venues and the relative costs
faced by institutions in trading foreign company stocks, either in the U.S. through ADRs versus
trading the equivalent stocks in the firms’ home exchange. To the best of our knowledge, ours is
the first paper to attempt to do so. Much work remains, however. Future research should
consider issues of correlation across world markets and its relationship to the flight to quality
seen in recent years in some international trading arena, in order to better understand the true
costs of trading in international markets.
27
References Admati, A. R. and P. Pleiderer, 1988, A theory of intraday trading patterns: volume and price variability, Review of Financial Studies 1, 3-40. Bacidore, Jeffrey M., and George Sofianos, 2002, Liquidity provision and specialist trading in NYSE-listed non-U.S. stocks, Journal of Financial Economics 63 (1), 133-158. Badrinath, S.G., and Sunil Wahal, 2002, Momentum Trading by Institutions, Journal of Finance 57, 2449-2478. Barclay, Michael, Robert H. Litzenberger and Jerold B. Warner, 1990, Private information, trading volume and stock return variances, Review of Financial Studies 3, 233-253. Baruch, Shmuel, G. Andrew Karolyi, and Michael Lemmon, 2003, Multi-market trading and liquidity: theory and evidence, forthcoming, Journal of Finance. Bekaert, Geert, and Campbell R. Harvey, 2000, Foreign speculators and emerging equity
markets, Journal of Finance 55, 565-613. Black, F., 1995, Equilibrium exchanges, Financial Analysts Journal 51, 23–29. Buy-side Survey: ADR Investing, 2003, JP Morgan. Chakravarty, S., 2001. Stealth trading: which traders’ trades move stock prices? Journal of Financial Economics 61, 289-307. Chan, Louis K.C., and Josef Lakonishok, 1993, Institutional trades and intra-day stock price behavior, Journal of Financial Economics 33, 173-200. Chiyachantana, Chiraphol, Pankaj Jain, Christine Jiang and Robert Wood, 2004, International evidence on institutional trading behavior and price impact, Journal of Finance 59, 2, 865-881. Choe, Hyuk, Bong-Chan Kho, and René M. Stulz, 1999, Do foreign investors destabilize stock markets? The Korean experience in 1997, Journal of Financial Economics 54, 227-264. Chowdry, Bhagwan and Vikram Nanda, 1991, Multimarket trading and market liquidity, Review of Financial Studies 56, 501-530. Clarke, Jonathan, and Kuldeep Shastri, 2001, On the market microstructure of American Depository Receipts, Working paper, University of Pittsburgh. Domowitz, Ian., Jack Glen, and Ananth Madhavan, 2001, Liquidity, volatility and equity trading costs across countries and over time, International Finance 4, 221-255.
28
Eleswarapu, Venkat R. and Kumar Venkataraman, 2003, The impact of legal and political institutions on equity trading costs: A cross-country analysis, Working paper, Southern Methodist University. Glosten, Lawrence R., 1989, Insider trading, liquidity and role of monopolist specialist, Journal of Business 62, 211–235. Huang, Roger D., and Hans R. Stoll, 2001, Tick Size, Bid–ask spreads and market structure, Journal of Financial and Quantitative Analysis 36, 503–522. Hupperets, E.J., and Albert J. Menkveld, 2002, Intraday analysis of market integration: Dutch blue chip stocks traded in Amsterdam and New York, Journal of Financial Markets 5, 57-82. Jain, Pankaj K., 2003, Institutional Design and Liquidity at Stock Exchanges around the World, working paper, University of Memphis Jones, Charles M., and Marc L. Lipson, 2001, Sixteenths: Direct evidence on institutional execution costs, Journal of Financial Economics 59, 253-278. Keim, Donald B., and Ananth Madhavan, 1995, Anatomy of the trading process: Empirical evidence on the behavior of institutional traders, Journal of Financial Economics 37, 371-398. Keim, Donald B., and Ananth Madhavan, 1996, The upstairs market for large-block transactions: Analysis and measurement of price effects, Review of Financial Studies 9, 1-36. Keim, Donald B., and Ananth Madhavan, 1997, Transaction costs and investment style: An inter-exchange analysis of institutional equity trades, Journal of Financial Economics 46, 265-292. Kurokawa, M., 1988, On the stock market collapse: a view from Tokyo, Speech to the Brookings Institute, March 8. La Porta, Rafael, Florencio Lopez-de-Silanes, Andrei Shleifer and Robert W. Vishny, 1998, Law and Finance, Journal of Political Economy 106, 1113-1155. La Porta, Rafael, Florencio Lopez-de-Silanes, Andrei Shleifer and Robert W. Vishny, 2000, Investor protection and corporate governance, Journal of Financial Economics 58, 3-27. Lee, Charles and Mark Ready., 1991, Inferring trade direction from intraday data, Journal of Finance 46, 733-746. Lins, Karl V., Deon Strickland and Marc Zenner, 2003, Do non-U.S. firms issue equity on U.S. exchanges to relax capital constraints?, Journal of Financial and Quantitative Analysis, forthcoming.
29
Pagano, Marco, 1989, Trading volume and asset liquidity, Quarterly Journal of Economics 104, 255-274. Pagano, Marco, Alisa Roell, and Josef Zechner, 2002, The geography of equity trading: why do companies list abroad? Journal of Finance 57, 2651-2681. Perold, Andre F., and Eric Sirri, 1998, The cost of international equity trading, Working paper, Harvard University. Pulatkonak, Melek, and George Sofianos, 1999, The distribution of global trading in NYSE-listed non-U.S. stocks, Working paper, New York Stock Exchange. Rock, 1996, The specialist's order book and price anomalies, Review of Financial Studies. Seppi, D.J., 1997, Liquidity provision with limit orders and strategic specialist, Review of Financial Studies 10, 103-150. Sias , Richard W., Laura T. Starks, 1997, Institutions and Individuals at the Turn-of-the-Year, The Journal of Finance, Vol. 52, No. 4, 1543-1562. Tse, Yiuman, 1999, Round-the-clock market efficiency and home bias: evidence from the international Japanese government bonds futures markets, Journal of Banking and Finance 23, 1832-1860. Werner, Ingrid M. and Allan W. Kleidon, 1996, U.K. and U.S. trading of British cross-listed stocks: an intraday analysis of market integration, Review of Financial Studies 9, 619-664.

30
Table 1. Institutional Trading in Foreign Stocks and ADRs Data on institutional trading in foreign stocks are obtained from Plexus Group for the first three quarters of 2001. This table contains sample characteristics of institutional trading in ADRs and foreign stocks in 35 countries. We report characteristics for three groups. Stocks traded in local market only, ADR only and both local markets.
Both ADR & Local Trading Characteristics Local only
ADR only Local ADR
Number of Securities 583 81 237 237 Number of Decisions 65,939 4,711 71,928 32,251 Average Number of Decision per Security 113 58 303 136 Average Decision Size (shares) 1,570,300 34,765 298,147 61,081 Average Decision Size (in dollars) 663,891 766,155 2,242,823 1,440,153 Percentage of $ Purchase Decision 57.00% 43.00% 52.85% 46.60% Order Complexity (%) 46.12% 59.91% 31.19% 28.63% Average Daily Volume (Number of Shares) 4,908,700 1,429,001 927,830 106,720 Median Volume Weighted Transaction Price($) 8.11 47.84 25.43 28.00 Relative Local Trading Volume 100% 0% 75.83% 24.17% Price Impact Cost (%) 0.74 0.95 0.51 0.66 Commissions Cost (%) 0.13 0.03 0.21 0.22
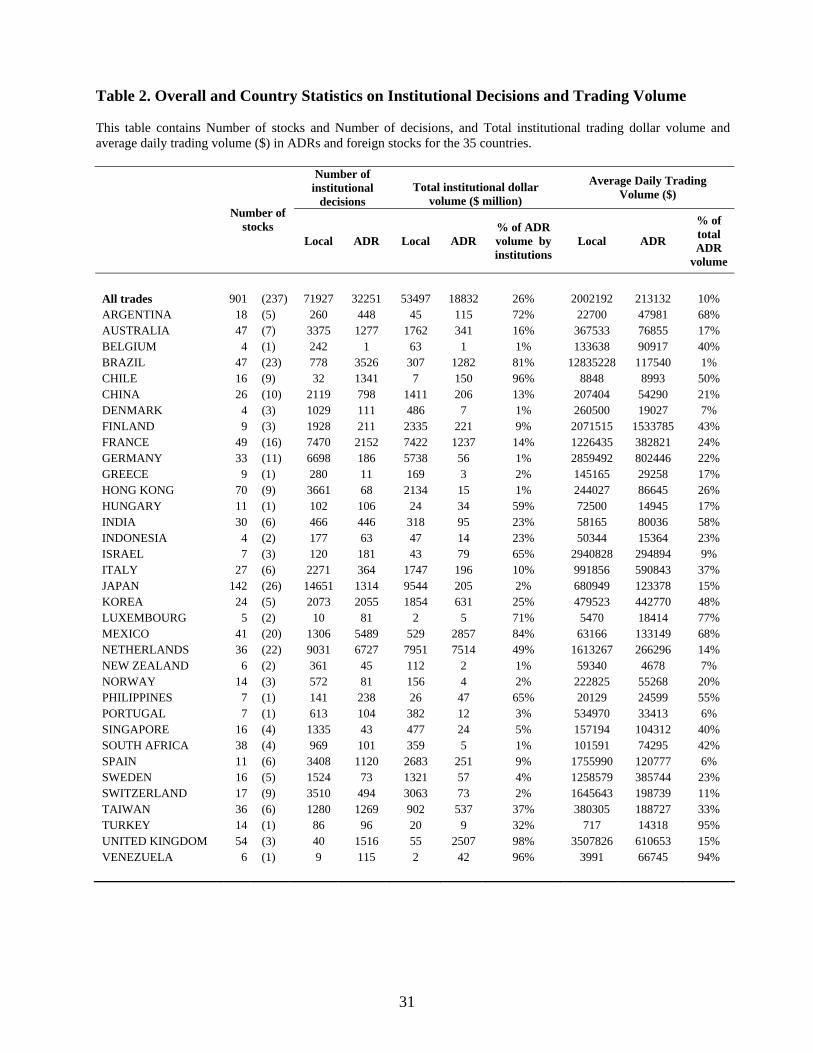
31
Table 2. Overall and Country Statistics on Institutional Decisions and Trading Volume This table contains Number of stocks and Number of decisions, and Total institutional trading dollar volume and average daily trading volume ($) in ADRs and foreign stocks for the 35 countries.
Number of
institutional decisions
Total institutional dollar volume ($ million)
Average Daily Trading Volume ($)
Number of stocks
Local ADR Local ADR % of ADR volume by institutions
Local ADR
% of total ADR
volume
All trades 901 (237) 71927 32251 53497 18832 26% 2002192 213132 10% ARGENTINA 18 (5) 260 448 45 115 72% 22700 47981 68% AUSTRALIA 47 (7) 3375 1277 1762 341 16% 367533 76855 17% BELGIUM 4 (1) 242 1 63 1 1% 133638 90917 40% BRAZIL 47 (23) 778 3526 307 1282 81% 12835228 117540 1% CHILE 16 (9) 32 1341 7 150 96% 8848 8993 50% CHINA 26 (10) 2119 798 1411 206 13% 207404 54290 21% DENMARK 4 (3) 1029 111 486 7 1% 260500 19027 7% FINLAND 9 (3) 1928 211 2335 221 9% 2071515 1533785 43% FRANCE 49 (16) 7470 2152 7422 1237 14% 1226435 382821 24% GERMANY 33 (11) 6698 186 5738 56 1% 2859492 802446 22% GREECE 9 (1) 280 11 169 3 2% 145165 29258 17% HONG KONG 70 (9) 3661 68 2134 15 1% 244027 86645 26% HUNGARY 11 (1) 102 106 24 34 59% 72500 14945 17% INDIA 30 (6) 466 446 318 95 23% 58165 80036 58% INDONESIA 4 (2) 177 63 47 14 23% 50344 15364 23% ISRAEL 7 (3) 120 181 43 79 65% 2940828 294894 9% ITALY 27 (6) 2271 364 1747 196 10% 991856 590843 37% JAPAN 142 (26) 14651 1314 9544 205 2% 680949 123378 15% KOREA 24 (5) 2073 2055 1854 631 25% 479523 442770 48% LUXEMBOURG 5 (2) 10 81 2 5 71% 5470 18414 77% MEXICO 41 (20) 1306 5489 529 2857 84% 63166 133149 68% NETHERLANDS 36 (22) 9031 6727 7951 7514 49% 1613267 266296 14% NEW ZEALAND 6 (2) 361 45 112 2 1% 59340 4678 7% NORWAY 14 (3) 572 81 156 4 2% 222825 55268 20% PHILIPPINES 7 (1) 141 238 26 47 65% 20129 24599 55% PORTUGAL 7 (1) 613 104 382 12 3% 534970 33413 6% SINGAPORE 16 (4) 1335 43 477 24 5% 157194 104312 40% SOUTH AFRICA 38 (4) 969 101 359 5 1% 101591 74295 42% SPAIN 11 (6) 3408 1120 2683 251 9% 1755990 120777 6% SWEDEN 16 (5) 1524 73 1321 57 4% 1258579 385744 23% SWITZERLAND 17 (9) 3510 494 3063 73 2% 1645643 198739 11% TAIWAN 36 (6) 1280 1269 902 537 37% 380305 188727 33% TURKEY 14 (1) 86 96 20 9 32% 717 14318 95% UNITED KINGDOM 54 (3) 40 1516 55 2507 98% 3507826 610653 15% VENEZUELA 6 (1) 9 115 2 42 96% 3991 66745 94%
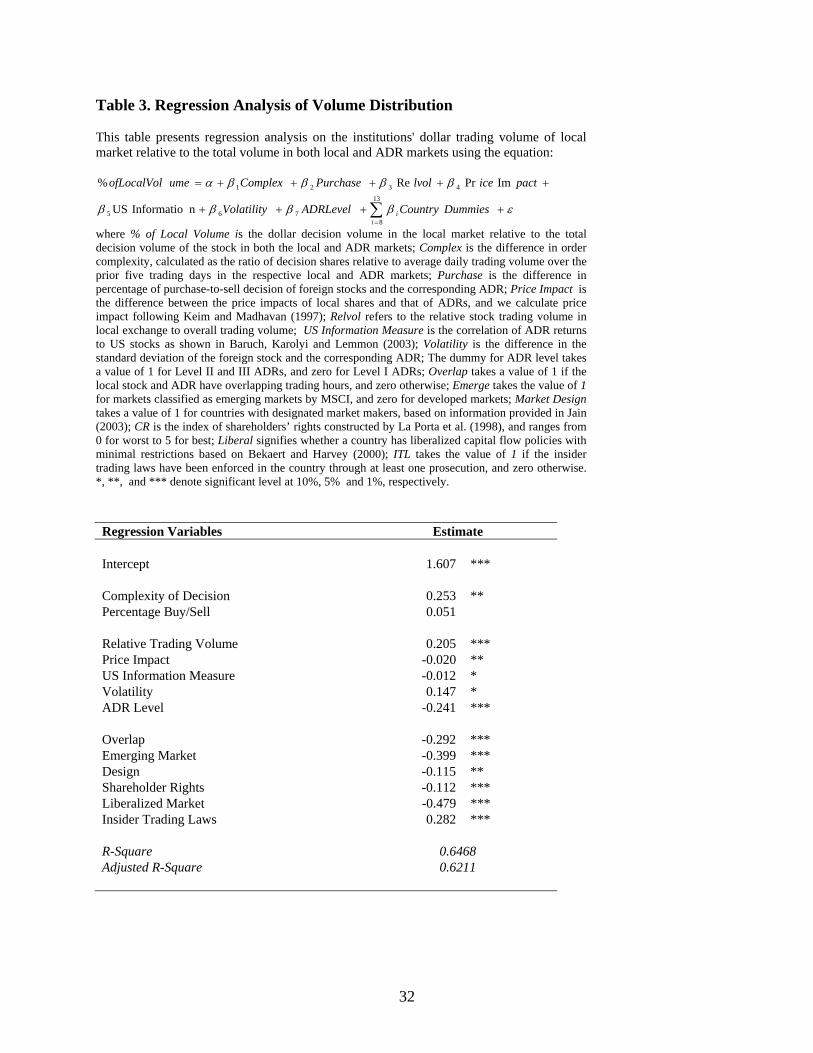
32
Table 3. Regression Analysis of Volume Distribution This table presents regression analysis on the institutions' dollar trading volume of local market relative to the total volume in both local and ADR markets using the equation:
εββββ
ββββα
++++
+++++=
∑=
DummiesCountryADRLevelVolatility
pacticelvolPurchaseComplexumeofLocalVol
ii
13
8765
4321
n Informatio US
ImPrRe%
where % of Local Volume is the dollar decision volume in the local market relative to the total decision volume of the stock in both the local and ADR markets; Complex is the difference in order complexity, calculated as the ratio of decision shares relative to average daily trading volume over the prior five trading days in the respective local and ADR markets; Purchase is the difference in percentage of purchase-to-sell decision of foreign stocks and the corresponding ADR; Price Impact is the difference between the price impacts of local shares and that of ADRs, and we calculate price impact following Keim and Madhavan (1997); Relvol refers to the relative stock trading volume in local exchange to overall trading volume; US Information Measure is the correlation of ADR returns to US stocks as shown in Baruch, Karolyi and Lemmon (2003); Volatility is the difference in the standard deviation of the foreign stock and the corresponding ADR; The dummy for ADR level takes a value of 1 for Level II and III ADRs, and zero for Level I ADRs; Overlap takes a value of 1 if the local stock and ADR have overlapping trading hours, and zero otherwise; Emerge takes the value of 1 for markets classified as emerging markets by MSCI, and zero for developed markets; Market Design takes a value of 1 for countries with designated market makers, based on information provided in Jain (2003); CR is the index of shareholders’ rights constructed by La Porta et al. (1998), and ranges from 0 for worst to 5 for best; Liberal signifies whether a country has liberalized capital flow policies with minimal restrictions based on Bekaert and Harvey (2000); ITL takes the value of 1 if the insider trading laws have been enforced in the country through at least one prosecution, and zero otherwise. *, **, and *** denote significant level at 10%, 5% and 1%, respectively. Regression Variables Estimate Intercept 1.607 *** Complexity of Decision 0.253 ** Percentage Buy/Sell 0.051 Relative Trading Volume 0.205 *** Price Impact -0.020 ** US Information Measure -0.012 * Volatility 0.147 * ADR Level -0.241 *** Overlap -0.292 *** Emerging Market -0.399 *** Design -0.115 ** Shareholder Rights -0.112 *** Liberalized Market -0.479 *** Insider Trading Laws 0.282 *** R-Square 0.6468 Adjusted R-Square 0.6211
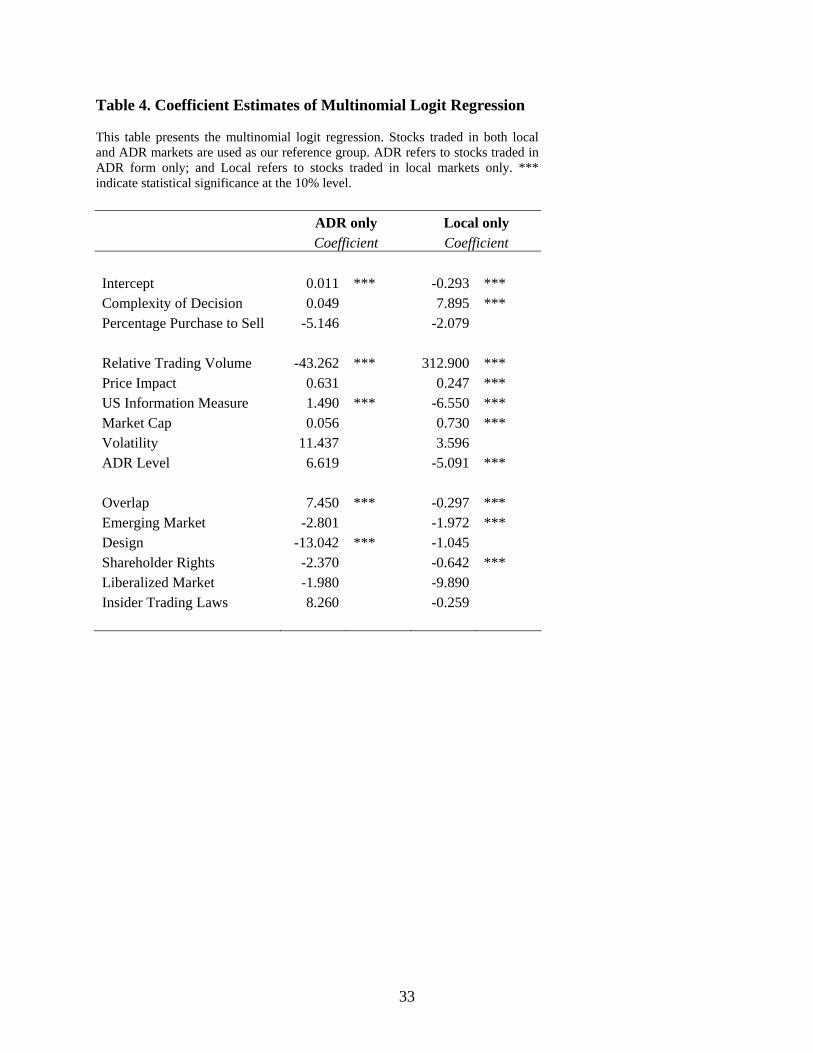
33
Table 4. Coefficient Estimates of Multinomial Logit Regression This table presents the multinomial logit regression. Stocks traded in both local and ADR markets are used as our reference group. ADR refers to stocks traded in ADR form only; and Local refers to stocks traded in local markets only. *** indicate statistical significance at the 10% level. ADR only Local only Coefficient Coefficient Intercept 0.011 *** -0.293 *** Complexity of Decision 0.049 7.895 *** Percentage Purchase to Sell -5.146 -2.079 Relative Trading Volume -43.262 *** 312.900 *** Price Impact 0.631 0.247 *** US Information Measure 1.490 *** -6.550 *** Market Cap 0.056 0.730 *** Volatility 11.437 3.596 ADR Level 6.619 -5.091 *** Overlap 7.450 *** -0.297 *** Emerging Market -2.801 -1.972 *** Design -13.042 *** -1.045 Shareholder Rights -2.370 -0.642 *** Liberalized Market -1.980 -9.890 Insider Trading Laws 8.260 -0.259
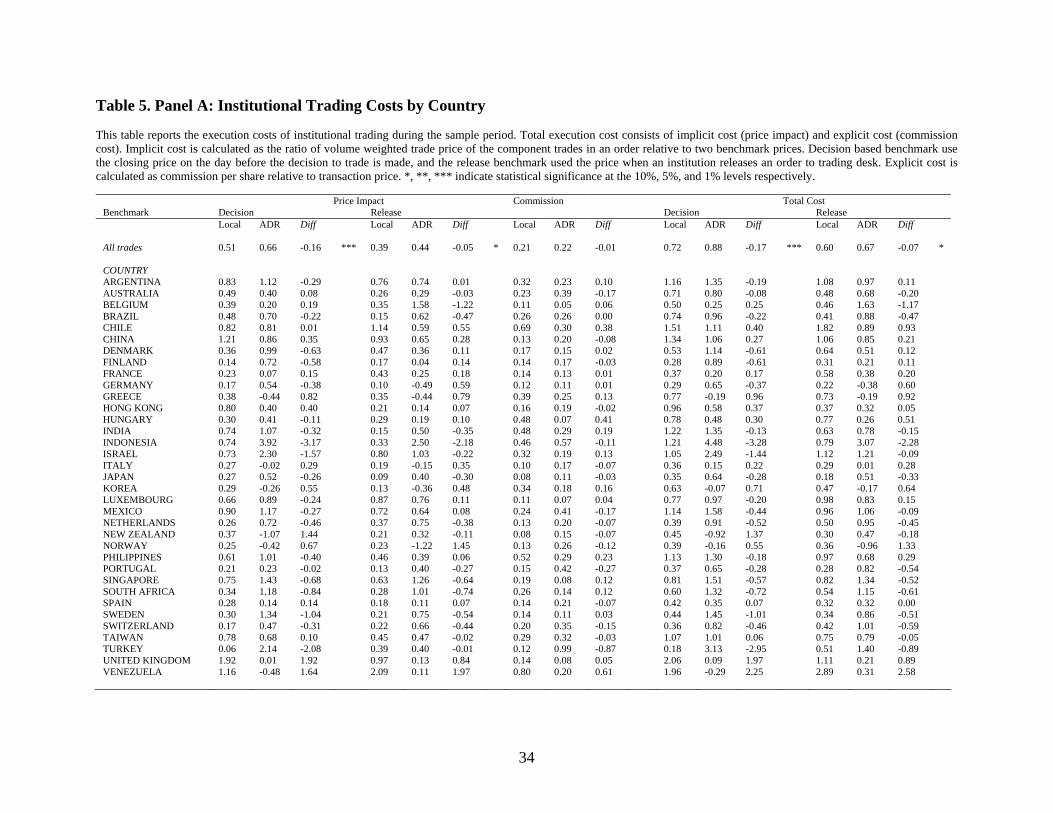
34
Table 5. Panel A: Institutional Trading Costs by Country This table reports the execution costs of institutional trading during the sample period. Total execution cost consists of implicit cost (price impact) and explicit cost (commission cost). Implicit cost is calculated as the ratio of volume weighted trade price of the component trades in an order relative to two benchmark prices. Decision based benchmark use the closing price on the day before the decision to trade is made, and the release benchmark used the price when an institution releases an order to trading desk. Explicit cost is calculated as commission per share relative to transaction price. *, **, *** indicate statistical significance at the 10%, 5%, and 1% levels respectively.
Price Impact Commission Total Cost Benchmark Decision Release Decision Release Local ADR Diff Local ADR Diff Local ADR Diff Local ADR Diff Local ADR Diff All trades 0.51 0.66 -0.16 *** 0.39 0.44 -0.05 * 0.21 0.22 -0.01 0.72 0.88 -0.17 *** 0.60 0.67 -0.07 * COUNTRY ARGENTINA 0.83 1.12 -0.29 0.76 0.74 0.01 0.32 0.23 0.10 1.16 1.35 -0.19 1.08 0.97 0.11 AUSTRALIA 0.49 0.40 0.08 0.26 0.29 -0.03 0.23 0.39 -0.17 0.71 0.80 -0.08 0.48 0.68 -0.20 BELGIUM 0.39 0.20 0.19 0.35 1.58 -1.22 0.11 0.05 0.06 0.50 0.25 0.25 0.46 1.63 -1.17 BRAZIL 0.48 0.70 -0.22 0.15 0.62 -0.47 0.26 0.26 0.00 0.74 0.96 -0.22 0.41 0.88 -0.47 CHILE 0.82 0.81 0.01 1.14 0.59 0.55 0.69 0.30 0.38 1.51 1.11 0.40 1.82 0.89 0.93 CHINA 1.21 0.86 0.35 0.93 0.65 0.28 0.13 0.20 -0.08 1.34 1.06 0.27 1.06 0.85 0.21 DENMARK 0.36 0.99 -0.63 0.47 0.36 0.11 0.17 0.15 0.02 0.53 1.14 -0.61 0.64 0.51 0.12 FINLAND 0.14 0.72 -0.58 0.17 0.04 0.14 0.14 0.17 -0.03 0.28 0.89 -0.61 0.31 0.21 0.11 FRANCE 0.23 0.07 0.15 0.43 0.25 0.18 0.14 0.13 0.01 0.37 0.20 0.17 0.58 0.38 0.20 GERMANY 0.17 0.54 -0.38 0.10 -0.49 0.59 0.12 0.11 0.01 0.29 0.65 -0.37 0.22 -0.38 0.60 GREECE 0.38 -0.44 0.82 0.35 -0.44 0.79 0.39 0.25 0.13 0.77 -0.19 0.96 0.73 -0.19 0.92 HONG KONG 0.80 0.40 0.40 0.21 0.14 0.07 0.16 0.19 -0.02 0.96 0.58 0.37 0.37 0.32 0.05 HUNGARY 0.30 0.41 -0.11 0.29 0.19 0.10 0.48 0.07 0.41 0.78 0.48 0.30 0.77 0.26 0.51 INDIA 0.74 1.07 -0.32 0.15 0.50 -0.35 0.48 0.29 0.19 1.22 1.35 -0.13 0.63 0.78 -0.15 INDONESIA 0.74 3.92 -3.17 0.33 2.50 -2.18 0.46 0.57 -0.11 1.21 4.48 -3.28 0.79 3.07 -2.28 ISRAEL 0.73 2.30 -1.57 0.80 1.03 -0.22 0.32 0.19 0.13 1.05 2.49 -1.44 1.12 1.21 -0.09 ITALY 0.27 -0.02 0.29 0.19 -0.15 0.35 0.10 0.17 -0.07 0.36 0.15 0.22 0.29 0.01 0.28 JAPAN 0.27 0.52 -0.26 0.09 0.40 -0.30 0.08 0.11 -0.03 0.35 0.64 -0.28 0.18 0.51 -0.33 KOREA 0.29 -0.26 0.55 0.13 -0.36 0.48 0.34 0.18 0.16 0.63 -0.07 0.71 0.47 -0.17 0.64 LUXEMBOURG 0.66 0.89 -0.24 0.87 0.76 0.11 0.11 0.07 0.04 0.77 0.97 -0.20 0.98 0.83 0.15 MEXICO 0.90 1.17 -0.27 0.72 0.64 0.08 0.24 0.41 -0.17 1.14 1.58 -0.44 0.96 1.06 -0.09 NETHERLANDS 0.26 0.72 -0.46 0.37 0.75 -0.38 0.13 0.20 -0.07 0.39 0.91 -0.52 0.50 0.95 -0.45 NEW ZEALAND 0.37 -1.07 1.44 0.21 0.32 -0.11 0.08 0.15 -0.07 0.45 -0.92 1.37 0.30 0.47 -0.18 NORWAY 0.25 -0.42 0.67 0.23 -1.22 1.45 0.13 0.26 -0.12 0.39 -0.16 0.55 0.36 -0.96 1.33 PHILIPPINES 0.61 1.01 -0.40 0.46 0.39 0.06 0.52 0.29 0.23 1.13 1.30 -0.18 0.97 0.68 0.29 PORTUGAL 0.21 0.23 -0.02 0.13 0.40 -0.27 0.15 0.42 -0.27 0.37 0.65 -0.28 0.28 0.82 -0.54 SINGAPORE 0.75 1.43 -0.68 0.63 1.26 -0.64 0.19 0.08 0.12 0.81 1.51 -0.57 0.82 1.34 -0.52 SOUTH AFRICA 0.34 1.18 -0.84 0.28 1.01 -0.74 0.26 0.14 0.12 0.60 1.32 -0.72 0.54 1.15 -0.61 SPAIN 0.28 0.14 0.14 0.18 0.11 0.07 0.14 0.21 -0.07 0.42 0.35 0.07 0.32 0.32 0.00 SWEDEN 0.30 1.34 -1.04 0.21 0.75 -0.54 0.14 0.11 0.03 0.44 1.45 -1.01 0.34 0.86 -0.51 SWITZERLAND 0.17 0.47 -0.31 0.22 0.66 -0.44 0.20 0.35 -0.15 0.36 0.82 -0.46 0.42 1.01 -0.59 TAIWAN 0.78 0.68 0.10 0.45 0.47 -0.02 0.29 0.32 -0.03 1.07 1.01 0.06 0.75 0.79 -0.05 TURKEY 0.06 2.14 -2.08 0.39 0.40 -0.01 0.12 0.99 -0.87 0.18 3.13 -2.95 0.51 1.40 -0.89 UNITED KINGDOM 1.92 0.01 1.92 0.97 0.13 0.84 0.14 0.08 0.05 2.06 0.09 1.97 1.11 0.21 0.89 VENEZUELA 1.16 -0.48 1.64 2.09 0.11 1.97 0.80 0.20 0.61 1.96 -0.29 2.25 2.89 0.31 2.58

35
Table 5. Panel B: Institutional Trading Costs by Country Adjusted for Market-Wide Returns This table reports the execution costs of institutional trading during the sample period. Total execution cost consists of implicit cost (price impact) and explicit cost (commission cost). Implicit cost is calculated as the ratio of volume weighted trade price of the component trades in an order to the closing price on the day before the decision to trade is made (decision) and the time the institution releases an order to trading desk (release). Explicit cost is calculated as commission per share relative to transaction price. *, **, *** indicate statistical significance at the 10%, 5%, and 1% levels respectively.
Price Impact Commission Total Cost Benchmark Decision Release Decision Release Local ADR Diff Local ADR Diff Local ADR Diff Local ADR Diff Local ADR Diff All trades 0.38 0.76 -0.38 *** 0.34 0.44 -0.10 * 0.21 0.22 -0.01 0.59 0.98 -0.40 *** 0.55 0.66 -0.11 * COUNTRY ARGENTINA 0.36 0.99 -0.64 0.67 0.73 -0.06 0.32 0.23 0.10 0.68 1.22 -0.54 0.99 0.96 0.03 AUSTRALIA 0.49 0.54 -0.05 0.35 0.29 0.07 0.23 0.39 -0.17 0.72 0.81 -0.22 0.58 0.68 -0.10 BELGIUM 0.46 -3.90 4.36 0.35 -1.34 1.69 0.11 0.05 0.06 0.57 -3.85 4.42 0.46 -1.28 1.74 BRAZIL 0.58 0.82 -0.25 0.09 0.63 -0.54 0.26 0.26 0.00 0.84 1.08 -0.25 0.35 0.90 -0.54 CHILE 0.32 0.83 -0.51 0.74 0.53 0.21 0.69 0.30 0.38 1.00 1.13 -0.13 1.43 0.84 0.60 CHINA 1.15 0.76 0.38 1.01 0.83 0.18 0.13 0.20 -0.08 1.27 0.96 0.31 1.14 1.03 0.10 DENMARK 0.36 0.47 -0.12 0.44 0.45 -0.02 0.17 0.15 0.02 0.53 0.63 -0.10 0.61 0.61 0.00 FINLAND 0.08 0.57 -0.49 0.18 0.02 0.15 0.14 0.17 -0.03 0.22 0.75 -0.52 0.32 0.20 0.12 FRANCE 0.13 -0.06 0.19 0.42 0.19 0.24 0.14 0.13 0.01 0.27 0.07 0.20 0.56 0.31 0.25 GERMANY 0.20 0.58 -0.38 0.14 -0.34 0.47 0.12 0.11 0.01 0.32 0.69 -0.37 0.25 -0.23 0.48 GREECE 0.53 -0.04 0.57 0.46 0.24 0.23 0.39 0.25 0.13 0.92 0.22 0.70 0.85 0.49 0.36 HONG KONG 0.43 0.64 -0.21 0.21 0.14 0.06 0.16 0.19 -0.02 0.59 0.83 -0.24 0.37 0.33 0.04 HUNGARY 0.03 0.54 -0.51 0.02 0.19 -0.17 0.48 0.07 0.41 0.50 0.60 -0.10 0.50 0.26 0.24 INDIA 0.50 1.15 -0.65 0.15 0.52 -0.37 0.48 0.29 0.19 0.98 1.44 -0.46 0.63 0.80 -0.18 INDONESIA 0.74 3.52 -2.77 0.33 2.21 -1.88 0.46 0.57 -0.11 1.21 4.08 -2.88 0.79 2.77 -1.99 ISRAEL 0.60 2.49 -1.89 0.74 1.04 -0.30 0.32 0.19 0.13 0.92 2.68 -1.75 1.06 1.23 -0.17 ITALY 0.29 0.26 0.03 0.23 0.08 0.15 0.10 0.17 -0.07 0.39 0.42 -0.04 0.33 0.25 0.08 JAPAN 0.22 1.34 -1.12 0.13 0.41 -0.28 0.08 0.11 -0.03 0.30 1.45 -1.14 0.21 0.52 -0.31 KOREA 0.18 -0.16 0.34 -0.07 -0.33 0.25 0.34 0.18 0.16 0.53 0.03 0.50 0.27 -0.14 0.41 LUXEMBOURG -0.12 0.13 -0.25 -0.08 0.58 -0.66 0.11 0.07 0.04 -0.01 0.20 -0.21 0.04 0.65 -0.62 MEXICO 0.75 1.31 -0.56 0.73 0.54 0.19 0.24 0.41 -0.17 0.99 1.73 -0.74 0.97 0.95 0.02 NETHERLANDS 0.09 0.73 -0.64 0.29 0.75 -0.46 0.13 0.20 -0.07 0.22 0.92 -0.71 0.42 0.95 -0.53 NEW ZEALAND 0.53 -1.02 1.54 0.17 0.32 -0.15 0.08 0.15 -0.07 0.61 -0.86 1.47 0.25 0.47 -0.22 NORWAY 0.16 -0.68 0.84 0.21 -1.24 1.46 0.13 0.26 -0.12 0.30 -0.42 0.72 0.35 -0.99 1.33 PHILIPPINES 0.05 1.09 -1.04 0.11 0.43 -0.32 0.52 0.29 0.23 0.57 1.38 -0.81 0.62 0.72 -0.10 PORTUGAL 0.17 0.42 -0.24 0.12 0.40 -0.28 0.15 0.42 -0.27 0.33 0.84 -0.51 0.28 0.82 -0.54 SINGAPORE 0.67 1.04 -0.36 0.60 0.98 -0.38 0.19 0.08 0.12 0.86 1.11 -0.25 0.79 1.05 -0.26 SOUTH AFRICA 0.22 1.50 -1.27 0.30 1.04 -0.74 0.26 0.14 0.12 0.49 1.64 -1.15 0.56 1.18 -0.62 SPAIN 0.22 0.14 0.08 0.16 0.11 0.05 0.14 0.21 -0.07 0.36 0.35 0.01 0.30 0.32 -0.02 SWEDEN 0.29 1.16 -0.87 0.25 0.70 -0.45 0.14 0.11 0.03 0.43 1.27 -0.84 0.38 0.81 -0.42 SWITZERLAND 0.20 0.66 -0.46 0.19 0.72 -0.52 0.20 0.35 -0.15 0.40 1.01 -0.61 0.39 1.06 -0.67 TAIWAN 0.54 0.89 -0.35 0.32 0.68 -0.37 0.29 0.32 -0.03 0.83 1.22 -0.39 0.61 1.01 -0.40 TURKEY -0.24 2.25 -2.49 0.51 0.41 0.10 0.12 0.99 -0.87 -0.12 3.25 -3.37 0.63 1.41 -0.77 UNITED KINGDOM 1.00 -0.08 1.08 0.84 0.15 0.68 0.14 0.08 0.05 1.14 0.00 1.13 0.97 0.24 0.74 VENEZUELA 0.86 -0.34 1.20 1.55 0.17 1.38 0.80 0.20 0.61 1.67 -0.14 1.81 2.36 0.37 1.98
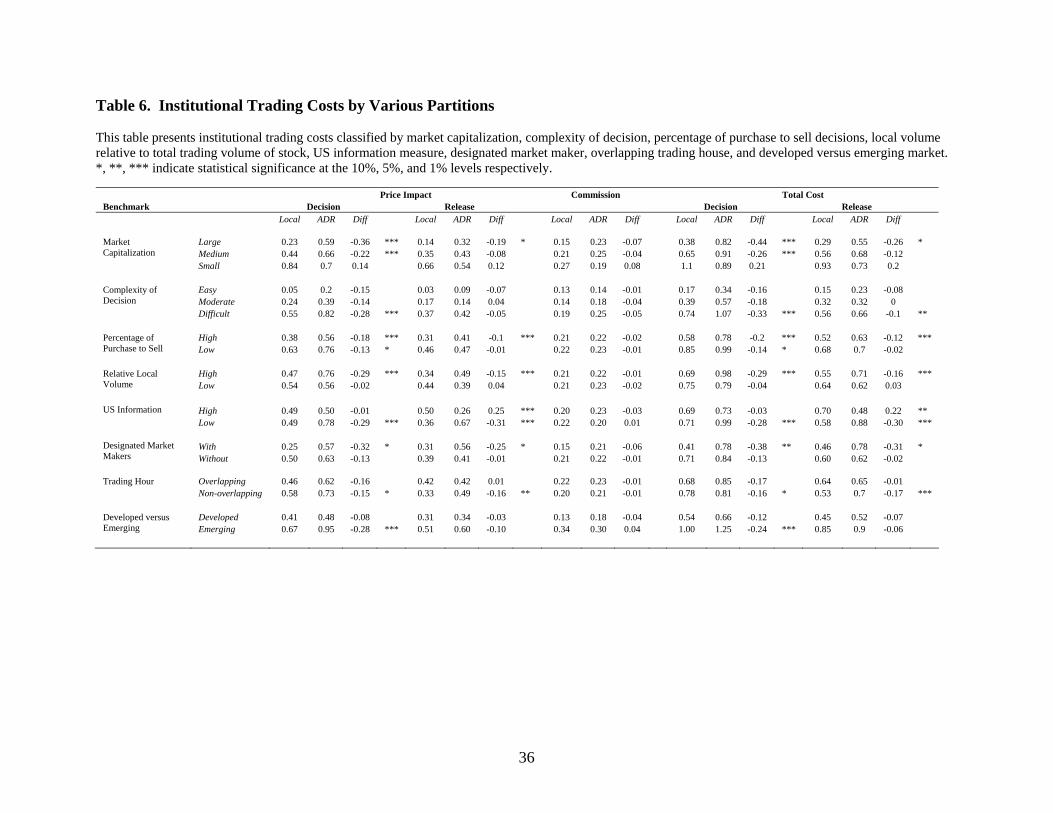
36
Table 6. Institutional Trading Costs by Various Partitions This table presents institutional trading costs classified by market capitalization, complexity of decision, percentage of purchase to sell decisions, local volume relative to total trading volume of stock, US information measure, designated market maker, overlapping trading house, and developed versus emerging market. *, **, *** indicate statistical significance at the 10%, 5%, and 1% levels respectively.
Price Impact Commission Total Cost Benchmark Decision Release Decision Release Local ADR Diff Local ADR Diff Local ADR Diff Local ADR Diff Local ADR Diff
Large 0.23 0.59 -0.36 *** 0.14 0.32 -0.19 * 0.15 0.23 -0.07 0.38 0.82 -0.44 *** 0.29 0.55 -0.26 * Medium 0.44 0.66 -0.22 *** 0.35 0.43 -0.08 0.21 0.25 -0.04 0.65 0.91 -0.26 *** 0.56 0.68 -0.12
Market Capitalization
Small 0.84 0.7 0.14 0.66 0.54 0.12 0.27 0.19 0.08 1.1 0.89 0.21 0.93 0.73 0.2
Easy 0.05 0.2 -0.15 0.03 0.09 -0.07 0.13 0.14 -0.01 0.17 0.34 -0.16 0.15 0.23 -0.08 Moderate 0.24 0.39 -0.14 0.17 0.14 0.04 0.14 0.18 -0.04 0.39 0.57 -0.18 0.32 0.32 0
Complexity of Decision
Difficult 0.55 0.82 -0.28 *** 0.37 0.42 -0.05 0.19 0.25 -0.05 0.74 1.07 -0.33 *** 0.56 0.66 -0.1 **
High 0.38 0.56 -0.18 *** 0.31 0.41 -0.1 *** 0.21 0.22 -0.02 0.58 0.78 -0.2 *** 0.52 0.63 -0.12 *** Percentage of Purchase to Sell Low 0.63 0.76 -0.13 * 0.46 0.47 -0.01 0.22 0.23 -0.01 0.85 0.99 -0.14 * 0.68 0.7 -0.02
High 0.47 0.76 -0.29 *** 0.34 0.49 -0.15 *** 0.21 0.22 -0.01 0.69 0.98 -0.29 *** 0.55 0.71 -0.16 *** Relative Local Volume Low 0.54 0.56 -0.02 0.44 0.39 0.04 0.21 0.23 -0.02 0.75 0.79 -0.04 0.64 0.62 0.03
High 0.49 0.50 -0.01 0.50 0.26 0.25 *** 0.20 0.23 -0.03 0.69 0.73 -0.03 0.70 0.48 0.22 ** US Information Low 0.49 0.78 -0.29 *** 0.36 0.67 -0.31 *** 0.22 0.20 0.01 0.71 0.99 -0.28 *** 0.58 0.88 -0.30 ***
With 0.25 0.57 -0.32 * 0.31 0.56 -0.25 * 0.15 0.21 -0.06 0.41 0.78 -0.38 ** 0.46 0.78 -0.31 * Designated Market
Makers Without 0.50 0.63 -0.13 0.39 0.41 -0.01 0.21 0.22 -0.01 0.71 0.84 -0.13 0.60 0.62 -0.02
Overlapping 0.46 0.62 -0.16 0.42 0.42 0.01 0.22 0.23 -0.01 0.68 0.85 -0.17 0.64 0.65 -0.01 Trading Hour Non-overlapping 0.58 0.73 -0.15 * 0.33 0.49 -0.16 ** 0.20 0.21 -0.01 0.78 0.81 -0.16 * 0.53 0.7 -0.17 ***
Developed 0.41 0.48 -0.08 0.31 0.34 -0.03 0.13 0.18 -0.04 0.54 0.66 -0.12 0.45 0.52 -0.07 Developed versus
Emerging Emerging 0.67 0.95 -0.28 *** 0.51 0.60 -0.10 0.34 0.30 0.04 1.00 1.25 -0.24 *** 0.85 0.9 -0.06
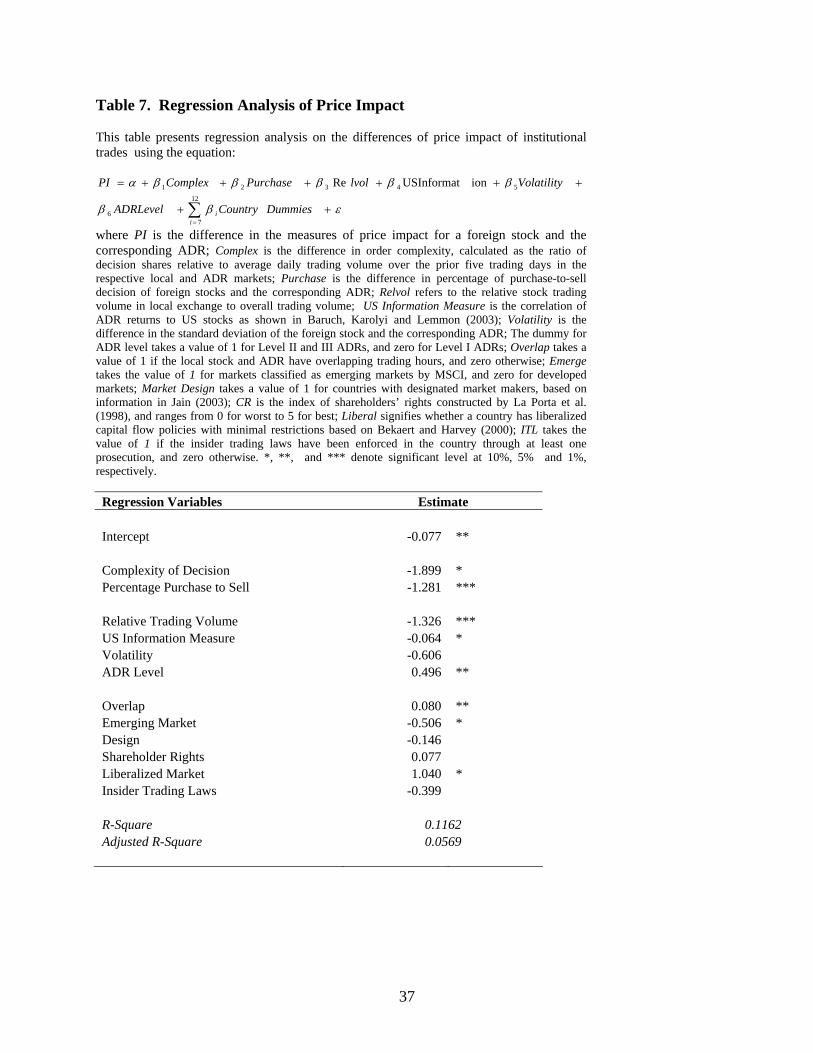
37
Table 7. Regression Analysis of Price Impact This table presents regression analysis on the differences of price impact of institutional trades using the equation:
εββ
βββββα
++
++++++=
∑=
DummiesCountryADRLevel
VolatilitylvolPurchaseComplexPI
ii
12
76
54321 ion USInformatRe
where PI is the difference in the measures of price impact for a foreign stock and the corresponding ADR; Complex is the difference in order complexity, calculated as the ratio of decision shares relative to average daily trading volume over the prior five trading days in the respective local and ADR markets; Purchase is the difference in percentage of purchase-to-sell decision of foreign stocks and the corresponding ADR; Relvol refers to the relative stock trading volume in local exchange to overall trading volume; US Information Measure is the correlation of ADR returns to US stocks as shown in Baruch, Karolyi and Lemmon (2003); Volatility is the difference in the standard deviation of the foreign stock and the corresponding ADR; The dummy for ADR level takes a value of 1 for Level II and III ADRs, and zero for Level I ADRs; Overlap takes a value of 1 if the local stock and ADR have overlapping trading hours, and zero otherwise; Emerge takes the value of 1 for markets classified as emerging markets by MSCI, and zero for developed markets; Market Design takes a value of 1 for countries with designated market makers, based on information in Jain (2003); CR is the index of shareholders’ rights constructed by La Porta et al. (1998), and ranges from 0 for worst to 5 for best; Liberal signifies whether a country has liberalized capital flow policies with minimal restrictions based on Bekaert and Harvey (2000); ITL takes the value of 1 if the insider trading laws have been enforced in the country through at least one prosecution, and zero otherwise. *, **, and *** denote significant level at 10%, 5% and 1%, respectively. Regression Variables Estimate Intercept -0.077 ** Complexity of Decision -1.899 * Percentage Purchase to Sell -1.281 *** Relative Trading Volume -1.326 *** US Information Measure -0.064 * Volatility -0.606 ADR Level 0.496 ** Overlap 0.080 ** Emerging Market -0.506 * Design -0.146 Shareholder Rights 0.077 Liberalized Market 1.040 * Insider Trading Laws -0.399 R-Square 0.1162 Adjusted R-Square 0.0569
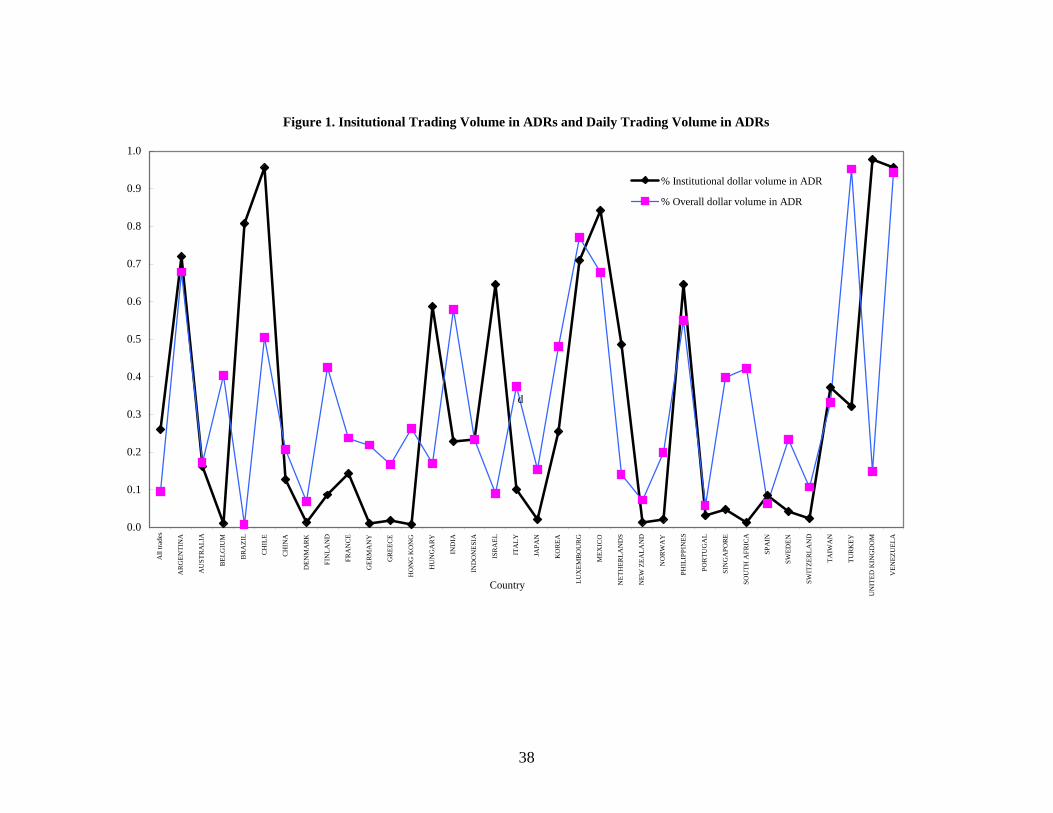
38
Figure 1. Insitutional Trading Volume in ADRs and Daily Trading Volume in ADRs
0.0
0.1
0.2
0.3
0.4
0.5
0.6
0.7
0.8
0.9
1.0A
ll tra
des
AR
GEN
TIN
A
AU
STR
ALI
A
BEL
GIU
M
BR
AZI
L
CH
ILE
CH
INA
DEN
MA
RK
FIN
LAN
D
FRA
NC
E
GER
MA
NY
GR
EEC
E
HO
NG
KO
NG
HU
NG
AR
Y
IND
IA
IND
ON
ESIA
ISR
AEL
ITA
LY
JAPA
N
KO
REA
LUX
EMB
OU
RG
MEX
ICO
NET
HER
LAN
DS
NEW
ZEA
LAN
D
NO
RW
AY
PHIL
IPPI
NES
POR
TUG
AL
SIN
GA
POR
E
SOU
TH A
FRIC
A
SPA
IN
SWED
EN
SWIT
ZER
LAN
D
TAIW
AN
TUR
KEY
UN
ITED
KIN
GD
OM
VEN
EZU
ELA
Country
% Institutional dollar volume in ADR
% Overall dollar volume in ADR
d