Embed Size (px)
Citation preview

9/28/2011
1
Instructions for Making 3D, .dwgContour Lines
Updated for ArcGIS 10Spatial and Numeric Data ServicesMLibrary, University of Michigan

9/28/2011
2
Contents• Overview
• Get a Digital Elevation Model (DEM)
• Open ArcMap, load the DEM
• Convert Z values to feet
• Smooth the DEM
• Create contour lines – Search for Contour (Spatial Analyst)
• Convert Xs and Ys to feet – Search for Raster Calculator
• Convert your contour lines to 3D – Search for Feature to 3D by Attribute
• Export to CAD format
9/28/2011
3
Overview
• This process allows you to make contour lines for a United States‐only site of interest. The contour lines will be in 3D and in .dwg format; you can use them in AutoCAD, Rhino, 3DS, or any other program that can read .dwg files.
• Other options exist to integrate topographic (elevation) data into your work. If a 3D, .dwgvector file is not the output you’re looking for, talk to a SAND librarian.
9/28/2011
4
Overview cont’d• You will use software called ArcGIS to do this. GIS (Geographical Information Systems) software is used to produce and utilize data about the earth, often called geospatial data. In this process, you will work with both existing data and processes built into the software. The goal is to get the data into a usable format.
• You should allow this process to take about an hour. If you have never used GIS software before, we recommend you work on these in the SAND North lab while a librarian is available. Hours are Monday through Friday, 11 a.m. to 5 p.m.

9/28/2011
5
Get a DEM
• Open Mozilla Firefox (Do NOT use Internet Explorer)
• Google the words “seamless data warehouse” and follow the first link to the USGS Seamless Data Warehouse: http://seamless.usgs.gov/
• Click the link on the left under “Tools to Access Data” called “Seamless Viewer.” It will open a new tab in your browser with an interactive map
9/28/2011
6
Get a DEM cont’d – Notes on Map
• This interactive map does not respond well to clicking rapidly. When zooming, panning, etc. let the map reload before you click again
• Firefox may ask you if you want to allow pop‐ups. You DO want to allow them from this site
9/28/2011
7
Get a DEM cont’d
• Use the zoom tool to click or draw squares to zoom into your area of interest
• Think carefully about how big an area you want contours for. You may be tempted to choose a much larger area than you need in case you decide to use it later, but a larger area means less resolution, so keep the file size reasonable
***If you choose a large area for a location that has a large change in elevation, and you want a small interval for your contours, you will have many contour lines. You can adjust this either by using a larger interval for the contour lines, or choosing a smaller area.
9/28/2011
8
Get a DEM cont’d
• Once you’re zoomed in, notice on the right side of the screen that you are in Display mode. Click to expand the “Elevation” category. The default dataset is “NED Shaded Relief (1 arc second)”, which has a resolution of 1 arc second, a non‐linear unit that roughly translates to 30 meters. Most of the US also has 1/3 arc second data, equaling a point approximately every 10 meters in space (This is clearly not engineering‐grade elevation data)
9/28/2011
9
Get a DEM cont’d
• On the right side, switch to Download mode –click on the “Download” button next to “Display”. Notice that fewer layers are available for download, which is typical of interactive GIS viewers.
• Click to expand the “Elevation” category and uncheck the “1” NED” box. Check “1/3” NED;” the browser will not refresh, but the page will reload.

9/28/2011
10
Get a DEM cont’d
• On the left side, under the “Downloads” section, click the first button (it looks like an arrow pointer in a rectangle). With this you will draw a rectangular bounding box for the data you want to download
• If the outline of the rectangle turns red as you are drawing, it means that you have selected too large an area. You can try changing to the 1 arc second resolution, or drawing a smaller download box
9/28/2011
11
Get a DEM cont’d
• You will see a pop‐up window that summarizes your download (Must have them enabled)
• There should only be one item in the list. Select “Download”
If you are given two or more files to download, go back to your map and make sure “NED 1/3” “ is the only item selected in the Download tab. If you still get more than one file, try selecting a smaller area to download. Larger areas can be downloaded, but these directions do not account for that
9/28/2011
12
Get a DEM cont’d
• You will then see a window that says “Current Order Status” while the data downloads
• Save the file, then double‐click on it from the Downloads (Ctrl + J OR Tools Downloads) stored in Firefox
Depending on the time of day, this could take one minute or 30. Be patient.
9/28/2011
13
Get a DEM cont’d
• You will see a new box which will ask you if you want to open or save the file you downloaded. Choose to save the compressed (zipped) file
• You cannot yet use this file until it is unzipped. To do so, you must set up a folder/workspace somewhere– You can use the Desktop, a flash drive, IFS space, etc.– This tutorial will use the desktop
9/28/2011
14
Get a DEM cont’d
• You will need to continue using this workspace to store many intermediate files– Create a folder in your preferred workspace and name it “Contours” or something you will remember
• Drag or decompress/unzip your downloaded file into this new Contours folder
9/28/2011
15
Open ArcMap and load the DEM
• Search for “arcmap” in the Start Menu
• Launch it
9/28/2011
16
Load the DEM cont’d
• Select “Blank Map” in the start‐up dialog box and click “OK” to open a new, empty map
• Click the “Add Data” button at the top
• In the window that appears, click the “Connect to Folder” button (looks like a folder with a plus sign on it)
9/28/2011
17
Load the DEM cont’d
• Navigate to your folder where you are keeping the data and select it. Then click OK
• In the “Add Data” window, navigate into your folder and select the raster shapefile, then click “Add.” The name should be a bunch of numbers
• You should now have your data in the mapNote: if ArcMap asks you if you would like to create pyramids, say no – they will only take up memory and are not necessary
9/28/2011
18
Load the DEM cont’d
• Let’s add some context so we can understand where this is in space. Go to “File” “Add Data” “Add Basemap” and choose “Streets”
• You can see how your DEM lines up with the other map information
If you add a Basemap, ArcMap will ask if you would you like to enable hardware acceleration. Say “Yes”
9/28/2011
19
Convert Z values to feet
Our DEM came from the USGS, a scientific data producer and provider. Because of this, our elevations are in meters, not feet
We must change them to feet to continue
9/28/2011
20
Convert to feet cont’d
• Open the toolbox in ArcMap
• Find “Spatial Analyst” in the toolbox and expand it
• Then expand “Map Algebra” and click on “Raster Calculator”
Note: If you can’t select any of the tools in the Spatial Analyst section, go to “Customize” “Extensions” at the top and check the boxes next to “3D Analyst” and “Spatial Analyst.” Closing the window will save your settings.
9/28/2011
21
Convert to feet cont’d
• In the raster calculator, you are going to create an expression. Double click the name of the raster layer to add it to your formula, then click the “*” button or type it in, then type in the conversion for meters to feet: 3.2808399. Your final result should look like this:
“name‐of‐layer” * 3.2808399
• Click OK
9/28/2011
22
Convert to Feet cont’d
• This will create a new temporary layer in the map called “raster”
• This is the newly converted file
9/28/2011
23
Smooth the DEM
DEMs are grids of pixels. When you convert from this square data representation to lines, you may get jagged lines that are an artifact of the data type rather than the information the data represents. To prevent this from happening, you must smooth the DEM before building contours.
9/28/2011
24
Smooth the DEM cont’d
• Open ArcToolbox by clicking on the red toolbox button at the top
• In ArcToolbox, expand “Spatial Analyst Tools” “Neighborhood” “Focal Statistics”
9/28/2011
25
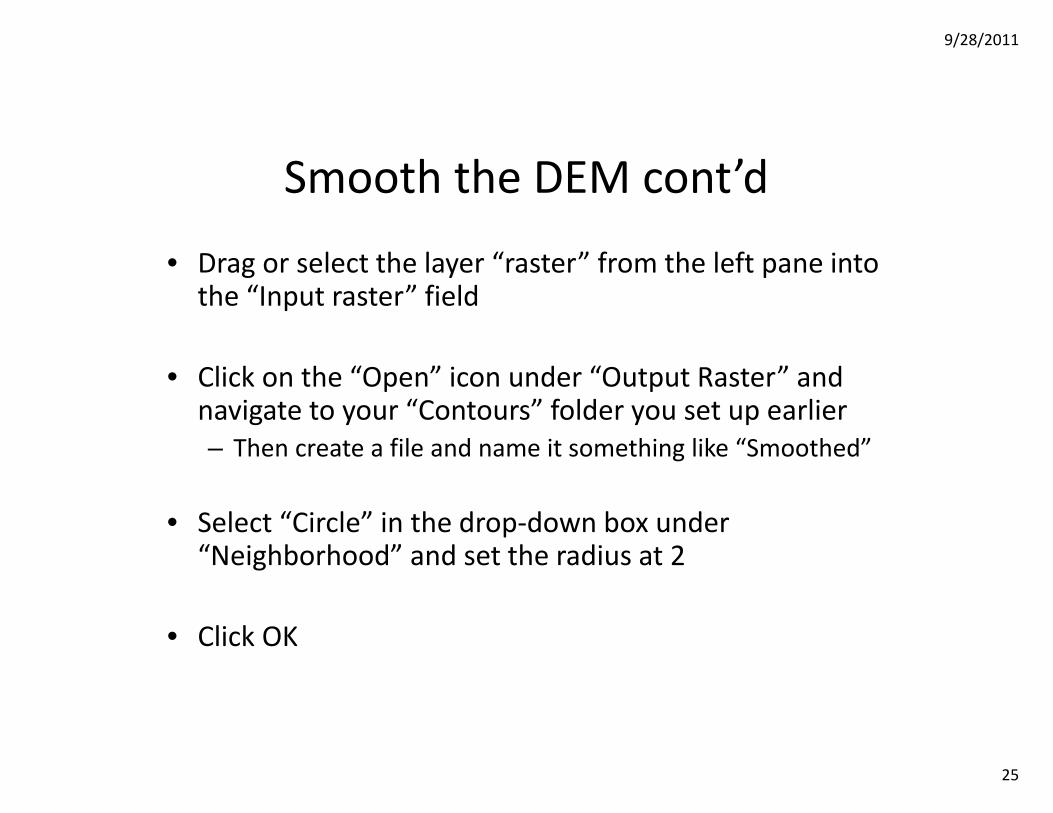
Smooth the DEM cont’d
• Drag or select the layer “raster” from the left pane into the “Input raster” field
• Click on the “Open” icon under “Output Raster” and navigate to your “Contours” folder you set up earlier– Then create a file and name it something like “Smoothed”
• Select “Circle” in the drop‐down box under “Neighborhood” and set the radius at 2
• Click OK

9/28/2011
26
Smooth the DEM cont’d
• Right‐click the layer called “raster” and “Remove” the layer
• Also remove your original DEM (named many numbers)
9/28/2011
27
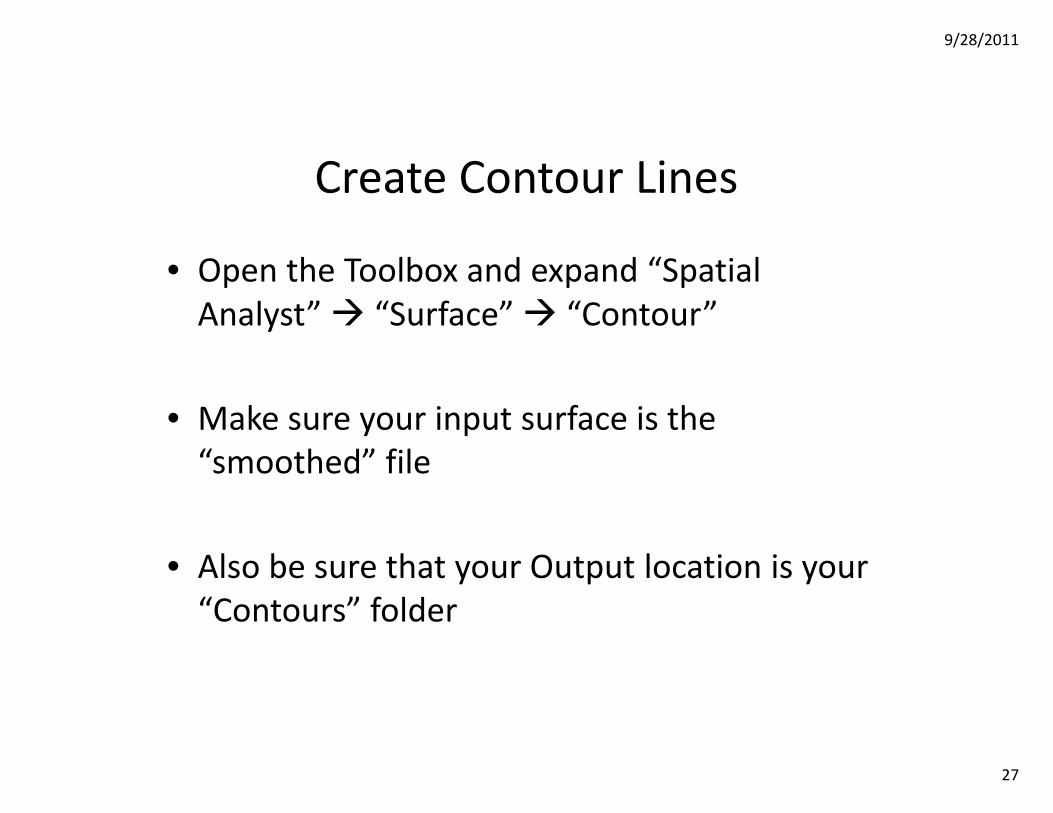
Create Contour Lines
• Open the Toolbox and expand “Spatial Analyst” “Surface” “Contour”
• Make sure your input surface is the “smoothed” file
• Also be sure that your Output location is your “Contours” folder
9/28/2011
28
Create Contour Lines cont’d
• You will have to specify a contour interval– The intervals are in feet, so “10” means there will be a line every 10 feet
• Click “OK.” There should now be a new line feature in the left pane with the name you gave it
9/28/2011
29
Convert Xs and Ys to feet
The data we got is by default in a 2D format that uses a unit called “decimal degrees” for the Xs and Ys. We would obviously prefer a linear unit, probably feet or meters, depending on what your Zs are.
GIS calls this process “Projecting”, which refers to the projection of the 3D earth onto a 2D surface, and the various parameters by which that is done.
9/28/2011
30
Convert Xs and Ys to Feet cont’d
• Open your Toolbox and expand “Data Management Tools” “Projections and Transformations” “Feature” “Project”
• You will see a new dialog box with many empty fields
9/28/2011
31
Convert Xs and Ys to Feet cont’d
• Drag and drop or select your preferred contour file as your “Input Dataset or Feature Class”
• For the “Output Dataset or Feature Class” field, it will automatically name your file with a “_project” at the end– You may have to change the location to your “Contours” folder
9/28/2011
32
Convert Xs and Ys to Feet cont’d
• Click on the button next to “Output Coordinate System”
• In the “Spatial Reference Properties” box that appears, click on “Select…”
• Go to “Projected Coordinate Systems” “State Plane” NAD 1983 (US Feet)
9/28/2011
33
Convert Xs and Ys to Feet cont’d
• You should be at an alphabetical listing by state. Scroll to the right until you find yours
• Some states have multiple projections based on the region. See the next slide for a graphic depicting the different regions
• Click “OK” in the “Spatial Reference Properties” dialog box

9/28/2011
34
9/28/2011
35
Convert Xs and Ys to Feet cont’d
• Click “OK” in your “Project” box
• ArcMap will create a new layer of contour lines, same as your input feature but probably a different color
• Right‐click on “Layers” in the left pane and then click “Properties”
9/28/2011
36
Convert Xs and Ys to Feet cont’d
• Go to the “Coordinate System” tab in the “Data Frame Properties” dialog box
• Click “Import…”
• Find the file you made that ended in “_project” and add it by double‐clicking or highlighting and clicking “Add”
9/28/2011
37
Convert Xs and Ys to Feet cont’d
• The projection definition of that file has now been added to the list of projections for this data frame
• Move the window out of the way of the map and click “OK” while looking at the map. If you get a warning, click “Yes.” Notice how much your projection may have changed
9/28/2011
38
Convert your Contour Lines to 3D
• Open your Toolbox and navigate to “3D Analyst” “3D Features” “Feature to 3D by Attribute”
• Your input feature should be your “_project” shapefile
• Your “Output Feature Class” should be a newly named file, perhaps with “_3D” at the end
• For “Height Field” select “CONTOUR”
9/28/2011
39
Convert your Contour Lines to 3D cont’d
• Click “OK.” A new file will be made that is explicitly 3D but we can’t tell in this 2D program
9/28/2011
40
Export to CAD format
• Open your Toolbox. Navigate to “Conversion Tools” “To CAD” “Export to CAD”
• Drag your final, 3D contour line shapefile into the “Input Feature” field
• Choose a new name for the Output File and click “OK”
9/28/2011
41
Export to CAD format cont’d
• Test your file in AutoCAD or Rhino
• Make sure it is 3D!