Embed Size (px)
Citation preview
W E B R I N G Q U A L I T Y T O L I G H T .
Instrument Systems and LEDs: Total Measurement Solutions
2
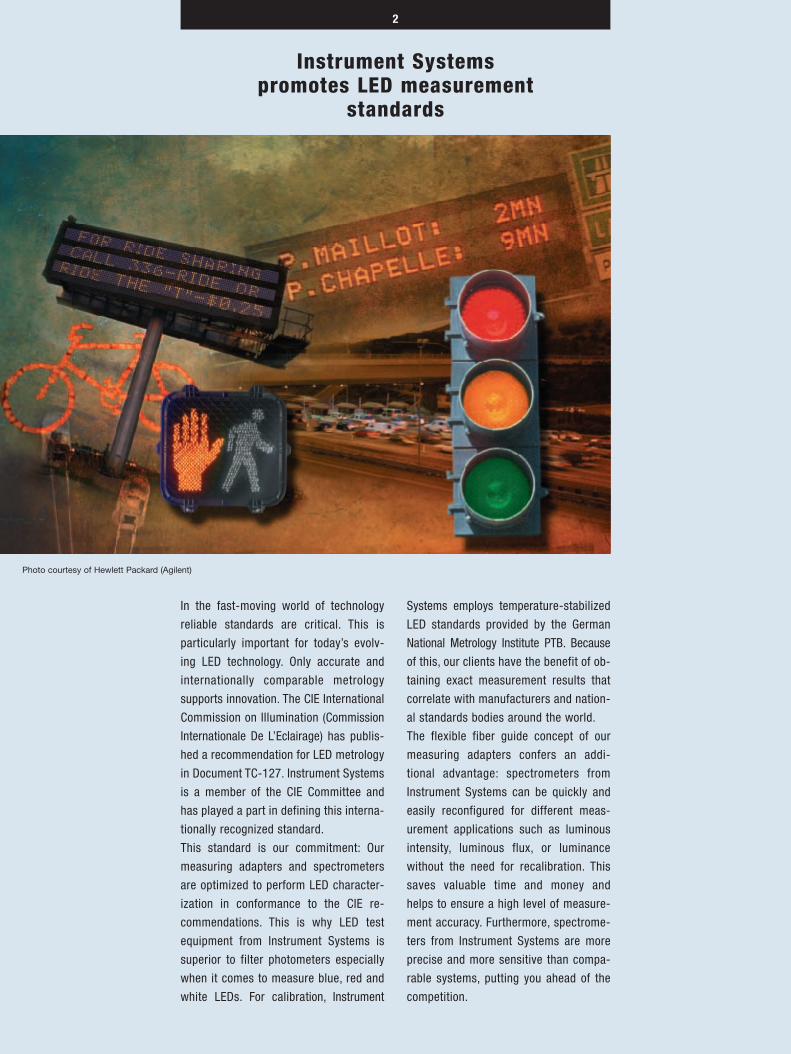
In the fast-moving world of technology
reliable standards are critical. This is
particularly important for today’s evolv-
ing LED technology. Only accurate and
internationally comparable metrology
supports innovation. The CIE International
Commission on Illumination (Commission
Internationale De L’Eclairage) has publis-
hed a recommendation for LED metrology
in Document TC-127. Instrument Systems
is a member of the CIE Committee and
has played a part in defining this interna-
tionally recognized standard.
This standard is our commitment: Our
measuring adapters and spectrometers
are optimized to perform LED character-
ization in conformance to the CIE re-
commendations. This is why LED test
equipment from Instrument Systems is
superior to filter photometers especially
when it comes to measure blue, red and
white LEDs. For calibration, Instrument
Systems employs temperature-stabilized
LED standards provided by the German
National Metrology Institute PTB. Because
of this, our clients have the benefit of ob-
taining exact measurement results that
correlate with manufacturers and nation-
al standards bodies around the world.
The flexible fiber guide concept of our
measuring adapters confers an addi-
tional advantage: spectrometers from
Instrument Systems can be quickly and
easily reconfigured for different meas-
urement applications such as luminous
intensity, luminous flux, or luminance
without the need for recalibration. This
saves valuable time and money and
helps to ensure a high level of measure-
ment accuracy. Furthermore, spectrome-
ters from Instrument Systems are more
precise and more sensitive than compa-
rable systems, putting you ahead of the
competition.
Photo courtesy of Hewlett Packard (Agilent)
Instrument Systemspromotes LED measurement
standards
3
The LED market has grown significantly
since the development of high-intensity
blue and white LEDs. Today, LEDs play an
important role in many applications
including displays, signs, back-lights,
automotive and aircraft lighting, and traf-
fic signals. LEDs will also soon play a
much larger role in the future of archi-
tectural lighting and general illumination.
There’s no doubt about it: LEDs have a
brilliant future. Brighter and more energy
efficient than a conventional filament
lamp, LEDs can have a service life of
more than 100,000 hours.
Companies such as Siemens/Osram,
Hewlett Packard (Agilent), Philips, Nichia,
and General Electric are working hard to
advance LED technology. Instrument
Systems is already cooperating with
these manufacturers and others on
metrology issues. This work is an invest-
ment in your future as well as ours since
it gives us the necessary insight into
industry requirements. That is why
Instrument Systems has market and
technology leadership in LED metrology.
Our customers’ satisfaction is based on
our expertise and we strive to expand our
knowledge base further. Instrument
Systems will continue to work on stand-
ardizing LED metrology – including the
introduction of future ISO standards.
Lighting of the Future: LEDs
Instrument Systems isthe market leader inLED metrology and isworking closely withinternational commis-sions to define LEDstandards.
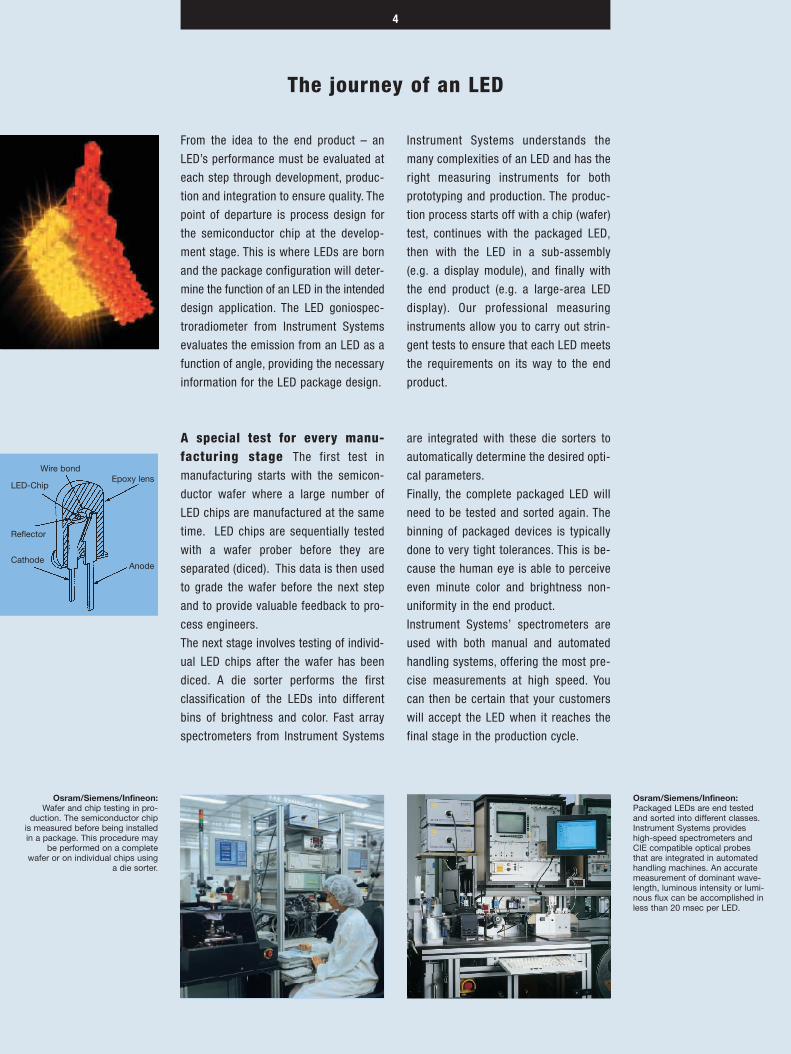
White LEDs revolutionizedthe technology of illumi-nation. When white LEDswere first developed,Instrument Systems focus-ed on metrology for ana-lyzing them and has devel-oped substantial expertisein this domain (Photo cour-tesy of Liane Marek,Fraunhofer-Gesellschaft).
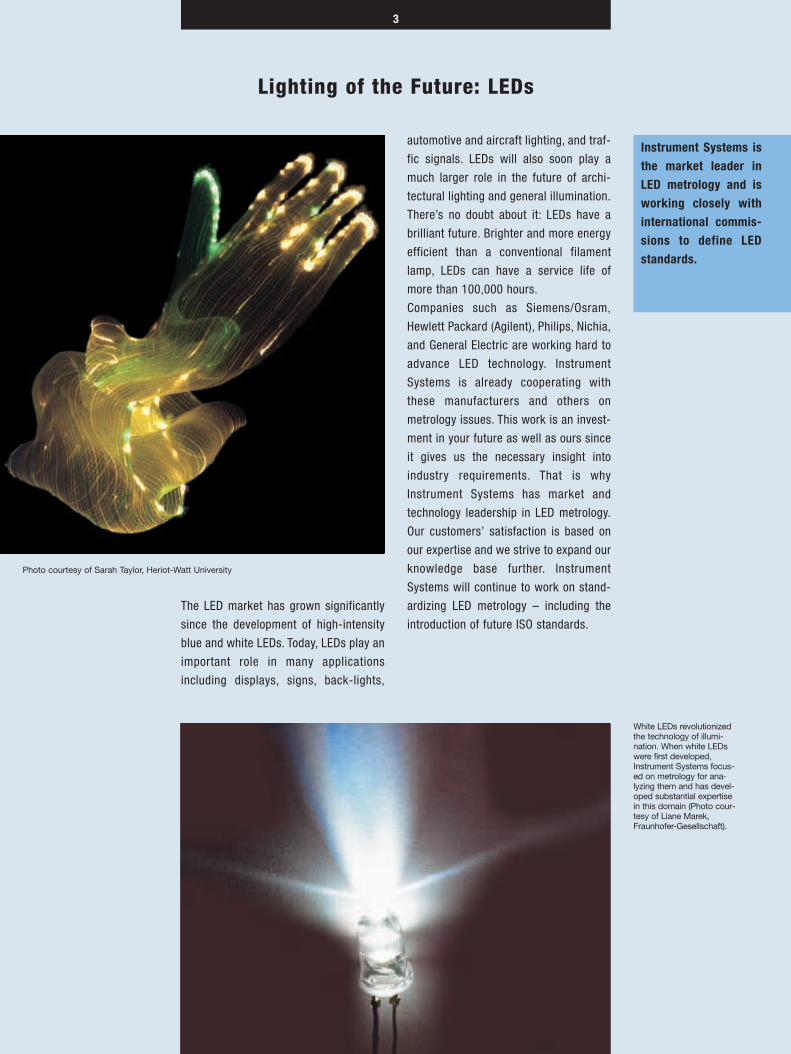
Photo courtesy of Sarah Taylor, Heriot-Watt University
4
From the idea to the end product – an
LED’s performance must be evaluated at
each step through development, produc-
tion and integration to ensure quality. The
point of departure is process design for
the semiconductor chip at the develop-
ment stage. This is where LEDs are born
and the package configuration will deter-
mine the function of an LED in the intended
design application. The LED goniospec-
troradiometer from Instrument Systems
evaluates the emission from an LED as a
function of angle, providing the necessary
information for the LED package design.
Instrument Systems understands the
many complexities of an LED and has the
right measuring instruments for both
prototyping and production. The produc-
tion process starts off with a chip (wafer)
test, continues with the packaged LED,
then with the LED in a sub-assembly
(e.g. a display module), and finally with
the end product (e.g. a large-area LED
display). Our professional measuring
instruments allow you to carry out strin-
gent tests to ensure that each LED meets
the requirements on its way to the end
product.
The journey of an LED
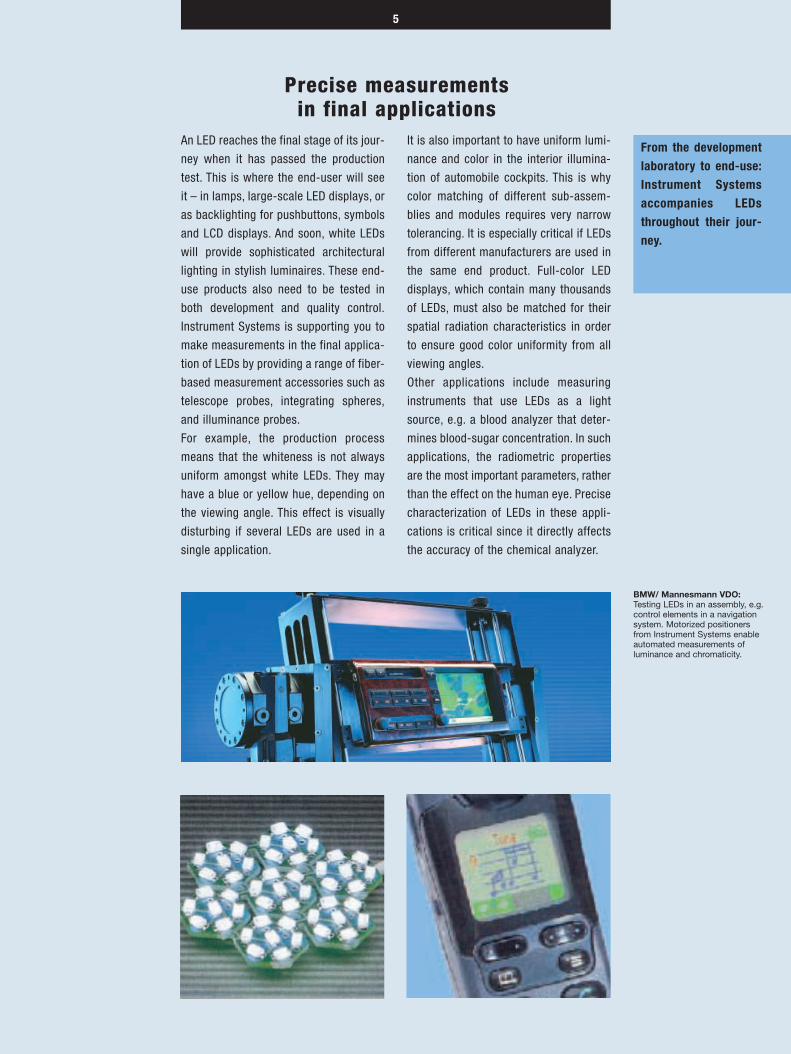
A special test for every manu-facturing stage The first test in
manufacturing starts with the semicon-
ductor wafer where a large number of
LED chips are manufactured at the same
time. LED chips are sequentially tested
with a wafer prober before they are
separated (diced). This data is then used
to grade the wafer before the next step
and to provide valuable feedback to pro-
cess engineers.
The next stage involves testing of individ-
ual LED chips after the wafer has been
diced. A die sorter performs the first
classification of the LEDs into different
bins of brightness and color. Fast array
spectrometers from Instrument Systems
are integrated with these die sorters to
automatically determine the desired opti-
cal parameters.
Finally, the complete packaged LED will
need to be tested and sorted again. The
binning of packaged devices is typically
done to very tight tolerances. This is be-
cause the human eye is able to perceive
even minute color and brightness non-
uniformity in the end product.
Instrument Systems’ spectrometers are
used with both manual and automated
handling systems, offering the most pre-
cise measurements at high speed. You
can then be certain that your customers
will accept the LED when it reaches the
final stage in the production cycle.
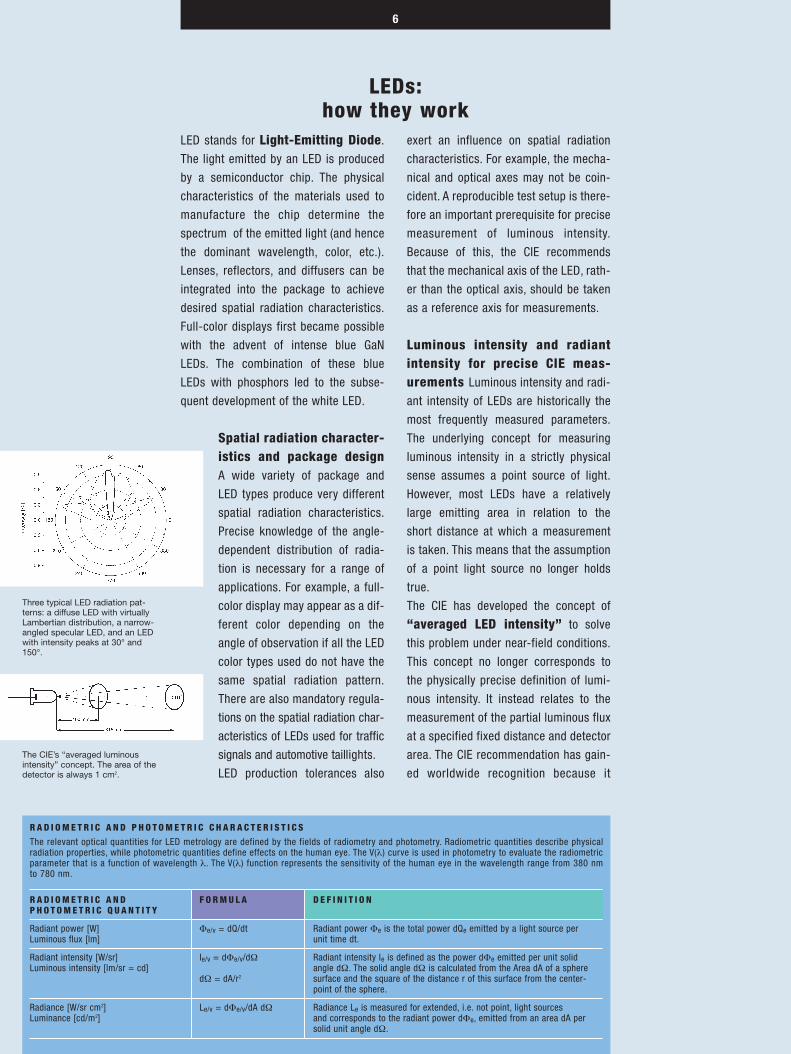
Osram/Siemens/Infineon:Wafer and chip testing in pro-
duction. The semiconductor chipis measured before being installedin a package. This procedure may
be performed on a completewafer or on individual chips using
a die sorter.
Osram/Siemens/Infineon:Packaged LEDs are end testedand sorted into different classes.Instrument Systems provides high-speed spectrometers andCIE compatible optical probesthat are integrated in automatedhandling machines. An accuratemeasurement of dominant wave-length, luminous intensity or lumi-nous flux can be accomplished inless than 20 msec per LED.
LED-Chip
Reflector
Cathode
Wire bondEpoxy lens
Anode
5
An LED reaches the final stage of its jour-
ney when it has passed the production
test. This is where the end-user will see
it – in lamps, large-scale LED displays, or
as backlighting for pushbuttons, symbols
and LCD displays. And soon, white LEDs
will provide sophisticated architectural
lighting in stylish luminaires. These end-
use products also need to be tested in
both development and quality control.
Instrument Systems is supporting you to
make measurements in the final applica-
tion of LEDs by providing a range of fiber-
based measurement accessories such as
telescope probes, integrating spheres,
and illuminance probes.
For example, the production process
means that the whiteness is not always
uniform amongst white LEDs. They may
have a blue or yellow hue, depending on
the viewing angle. This effect is visually
disturbing if several LEDs are used in a
single application.
It is also important to have uniform lumi-
nance and color in the interior illumina-
tion of automobile cockpits. This is why
color matching of different sub-assem-
blies and modules requires very narrow
tolerancing. It is especially critical if LEDs
from different manufacturers are used in
the same end product. Full-color LED
displays, which contain many thousands
of LEDs, must also be matched for their
spatial radiation characteristics in order
to ensure good color uniformity from all
viewing angles.
Other applications include measuring
instruments that use LEDs as a light
source, e.g. a blood analyzer that deter-
mines blood-sugar concentration. In such
applications, the radiometric properties
are the most important parameters, rather
than the effect on the human eye. Precise
characterization of LEDs in these appli-
cations is critical since it directly affects
the accuracy of the chemical analyzer.
Precise measurementsin final applications
BMW/ Mannesmann VDO: Testing LEDs in an assembly, e.g.control elements in a navigationsystem. Motorized positionersfrom Instrument Systems enableautomated measurements ofluminance and chromaticity.
From the developmentlaboratory to end-use:Instrument Systemsaccompanies LEDsthroughout their jour-ney.
6
LED stands for Light-Emitting Diode.
The light emitted by an LED is produced
by a semiconductor chip. The physical
characteristics of the materials used to
manufacture the chip determine the
spectrum of the emitted light (and hence
the dominant wavelength, color, etc.).
Lenses, reflectors, and diffusers can be
integrated into the package to achieve
desired spatial radiation characteristics.
Full-color displays first became possible
with the advent of intense blue GaN
LEDs. The combination of these blue
LEDs with phosphors led to the subse-
quent development of the white LED.
Spatial radiation character-istics and package designA wide variety of package and
LED types produce very different
spatial radiation characteristics.
Precise knowledge of the angle-
dependent distribution of radia-
tion is necessary for a range of
applications. For example, a full-
color display may appear as a dif-
ferent color depending on the
angle of observation if all the LED
color types used do not have the
same spatial radiation pattern.
There are also mandatory regula-
tions on the spatial radiation char-
acteristics of LEDs used for traffic
signals and automotive taillights.
LED production tolerances also
exert an influence on spatial radiation
characteristics. For example, the mecha-
nical and optical axes may not be coin-
cident. A reproducible test setup is there-
fore an important prerequisite for precise
measurement of luminous intensity.
Because of this, the CIE recommends
that the mechanical axis of the LED, rath-
er than the optical axis, should be taken
as a reference axis for measurements.
Luminous intensity and radiantintensity for precise CIE meas-urements Luminous intensity and radi-
ant intensity of LEDs are historically the
most frequently measured parameters.
The underlying concept for measuring
luminous intensity in a strictly physical
sense assumes a point source of light.
However, most LEDs have a relatively
large emitting area in relation to the
short distance at which a measurement
is taken. This means that the assumption
of a point light source no longer holds
true.
The CIE has developed the concept of
“averaged LED intensity” to solve
this problem under near-field conditions.
This concept no longer corresponds to
the physically precise definition of lumi-
nous intensity. It instead relates to the
measurement of the partial luminous flux
at a specified fixed distance and detector
area. The CIE recommendation has gain-
ed worldwide recognition because it
LEDs:how they work
Three typical LED radiation pat-terns: a diffuse LED with virtuallyLambertian distribution, a narrow-angled specular LED, and an LEDwith intensity peaks at 30° and150°.
The CIE’s “averaged luminousintensity” concept. The area of thedetector is always 1 cm2.
R A D I O M E T R I C A N D P H O T O M E T R I C C H A R A C T E R I S T I C S
The relevant optical quantities for LED metrology are defined by the fields of radiometry and photometry. Radiometric quantities describe physicalradiation properties, while photometric quantities define effects on the human eye. The V(λ) curve is used in photometry to evaluate the radiometricparameter that is a function of wavelength λ. The V(λ) function represents the sensitivity of the human eye in the wavelength range from 380 nmto 780 nm.
R A D I O M E T R I C A N D F O R M U L A D E F I N I T I O NP H O T O M E T R I C Q U A N T I T Y
Radiant power [W] Φe/v = dQ/dt Radiant power Φe is the total power dQe emitted by a light source perLuminous flux [lm] unit time dt.
Radiant intensity [W/sr] Ie/v = dΦe/v/dΩ Radiant intensity Ie is defined as the power dΦe emitted per unit solidLuminous intensity [lm/sr = cd] angle dΩ. The solid angle dΩ is calculated from the Area dA of a sphere
dΩ = dA/r2 surface and the square of the distance r of this surface from the center-point of the sphere.
Radiance [W/sr cm2] Le/v = dΦe/v/dA dΩ Radiance Le is measured for extended, i.e. not point, light sources Luminance [cd/m2] and corresponds to the radiant power dΦe, emitted from an area dA per
solid unit angle dΩ.
7
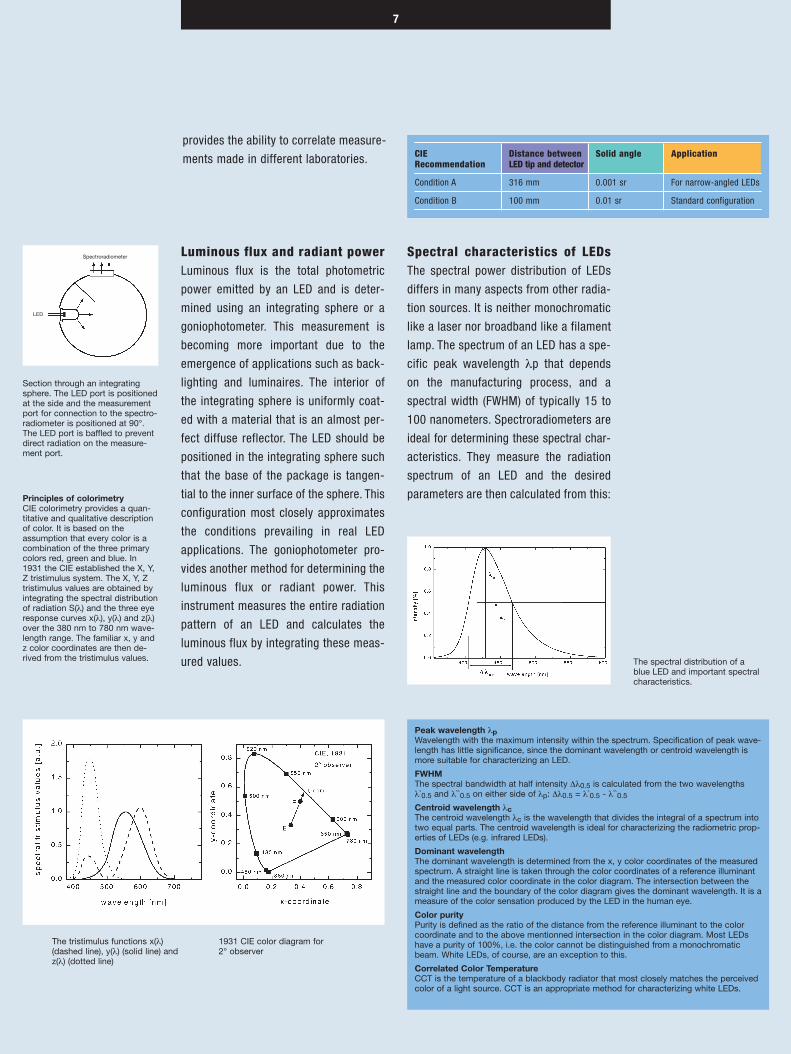
provides the ability to correlate measure-
ments made in different laboratories.
Luminous flux and radiant powerLuminous flux is the total photometric
power emitted by an LED and is deter-
mined using an integrating sphere or a
goniophotometer. This measurement is
becoming more important due to the
emergence of applications such as back-
lighting and luminaires. The interior of
the integrating sphere is uniformly coat-
ed with a material that is an almost per-
fect diffuse reflector. The LED should be
positioned in the integrating sphere such
that the base of the package is tangen-
tial to the inner surface of the sphere. This
configuration most closely approximates
the conditions prevailing in real LED
applications. The goniophotometer pro-
vides another method for determining the
luminous flux or radiant power. This
instrument measures the entire radiation
pattern of an LED and calculates the
luminous flux by integrating these meas-
ured values.
Spectral characteristics of LEDsThe spectral power distribution of LEDs
differs in many aspects from other radia-
tion sources. It is neither monochromatic
like a laser nor broadband like a filament
lamp. The spectrum of an LED has a spe-
cific peak wavelength λp that depends
on the manufacturing process, and a
spectral width (FWHM) of typically 15 to
100 nanometers. Spectroradiometers are
ideal for determining these spectral char-
acteristics. They measure the radiation
spectrum of an LED and the desired
parameters are then calculated from this:
Section through an integratingsphere. The LED port is positionedat the side and the measurementport for connection to the spectro-radiometer is positioned at 90°.The LED port is baffled to preventdirect radiation on the measure-ment port.
Principles of colorimetryCIE colorimetry provides a quan-titative and qualitative descriptionof color. It is based on theassumption that every color is acombination of the three primarycolors red, green and blue. In1931 the CIE established the X, Y,Z tristimulus system. The X, Y, Ztristimulus values are obtained byintegrating the spectral distributionof radiation S(λ) and the three eyeresponse curves x(λ), y(λ) and z(λ)over the 380 nm to 780 nm wave-length range. The familiar x, y andz color coordinates are then de-rived from the tristimulus values.
Peak wavelength λpWavelength with the maximum intensity within the spectrum. Specification of peak wave-length has little significance, since the dominant wavelength or centroid wavelength ismore suitable for characterizing an LED.
FWHM The spectral bandwidth at half intensity ∆λ0.5 is calculated from the two wavelengthsλ`0.5 and λ``0.5 on either side of λp: ∆λ0.5 = λ`0.5 - λ``0.5
Centroid wavelength λcThe centroid wavelength λc is the wavelength that divides the integral of a spectrum intotwo equal parts. The centroid wavelength is ideal for characterizing the radiometric prop-erties of LEDs (e.g. infrared LEDs).
Dominant wavelengthThe dominant wavelength is determined from the x, y color coordinates of the measuredspectrum. A straight line is taken through the color coordinates of a reference illuminantand the measured color coordinate in the color diagram. The intersection between thestraight line and the boundary of the color diagram gives the dominant wavelength. It is ameasure of the color sensation produced by the LED in the human eye.
Color purityPurity is defined as the ratio of the distance from the reference illuminant to the colorcoordinate and to the above mentionned intersection in the color diagram. Most LEDshave a purity of 100%, i.e. the color cannot be distinguished from a monochromaticbeam. White LEDs, of course, are an exception to this.
Correlated Color TemperatureCCT is the temperature of a blackbody radiator that most closely matches the perceivedcolor of a light source. CCT is an appropriate method for characterizing white LEDs.
The tristimulus functions x(λ)(dashed line), y(λ) (solid line) andz(λ) (dotted line)
1931 CIE color diagram for2° observer
The spectral distribution of ablue LED and important spectralcharacteristics.
CIE Distance between Solid angle ApplicationRecommendation LED tip and detector
Condition A 316 mm 0.001 sr For narrow-angled LEDs
Condition B 100 mm 0.01 sr Standard configuration
Spectroradiometer
LED
8
Ultimate precision:LED testing with
Instrument SystemsOur measuring instruments are unique in
being based on spectrometer technology
that conforms to CIE recommendations.
Instrument Systems measuring adapters
realize the precise geometries for lumi-
nous intensity according to CIE conditions
A and B. The distance from the LED tip to
the sensor is either 100 mm or 316 mm.
Furthermore, the sensor is a special dif-
fuser with an aperture of precisely 1 cm2.
In addition, special integrating spheres
have been developed for determining
luminous flux and total radiant power.
The spectroradiometer is connected to
an LED test adapter by fiber-optic cable
to form a complete test station. This
setup is then calibrated as a turnkey
system. The universal fiber connection
means that the test adapter is easily
changed without the calibration becom-
ing invalid – a unique feature of our
instruments. Spectroradiometers from
Instrument Systems can be calibrated
with any number of test accessories, and
individual calibration files are then select-
ed through the software. A single test
system can therefore be used to deter-
mine luminous intensity, luminous flux,
luminance, the spatial distribution pat-
tern, and the corresponding radiometric
and colorimetric quantities.
The benefit: Spectroradiometersfrom Instrument Systems We have
developed spectroradiometers that deliver
superb measurement accuracy for all LED
colors.
Traditional photometers are optimized for
performing measurements on broadband
radiation sources such as halogen lamps,
but the correction of the detector to the
spectral sensitivity function of the eye is
poor at the edge of the visible spectral
range. This entails substantial measuring
errors if photometers are used to analyze
blue, red and white LEDs.
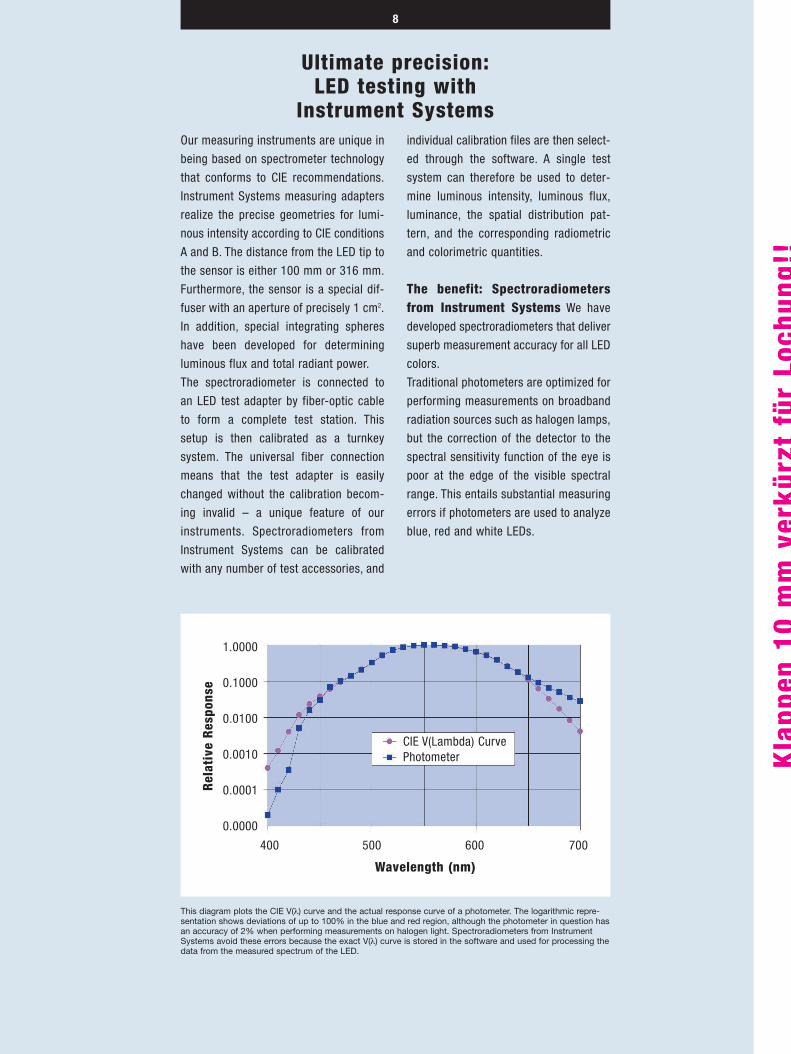
This diagram plots the CIE V(λ) curve and the actual response curve of a photometer. The logarithmic repre-sentation shows deviations of up to 100% in the blue and red region, although the photometer in question hasan accuracy of 2% when performing measurements on halogen light. Spectroradiometers from InstrumentSystems avoid these errors because the exact V(λ) curve is stored in the software and used for processing thedata from the measured spectrum of the LED.
Kla
ppen
10m
mve
rkür
ztfü
rLo
chun
g!!
Wavelength (nm)
500400
CIE V(Lambda) CurvePhotometer
1.0000
0.1000
0.0100
0.0010
0.0001
0.0000
600 700
Rel
ativ
e R
espo
nse
9
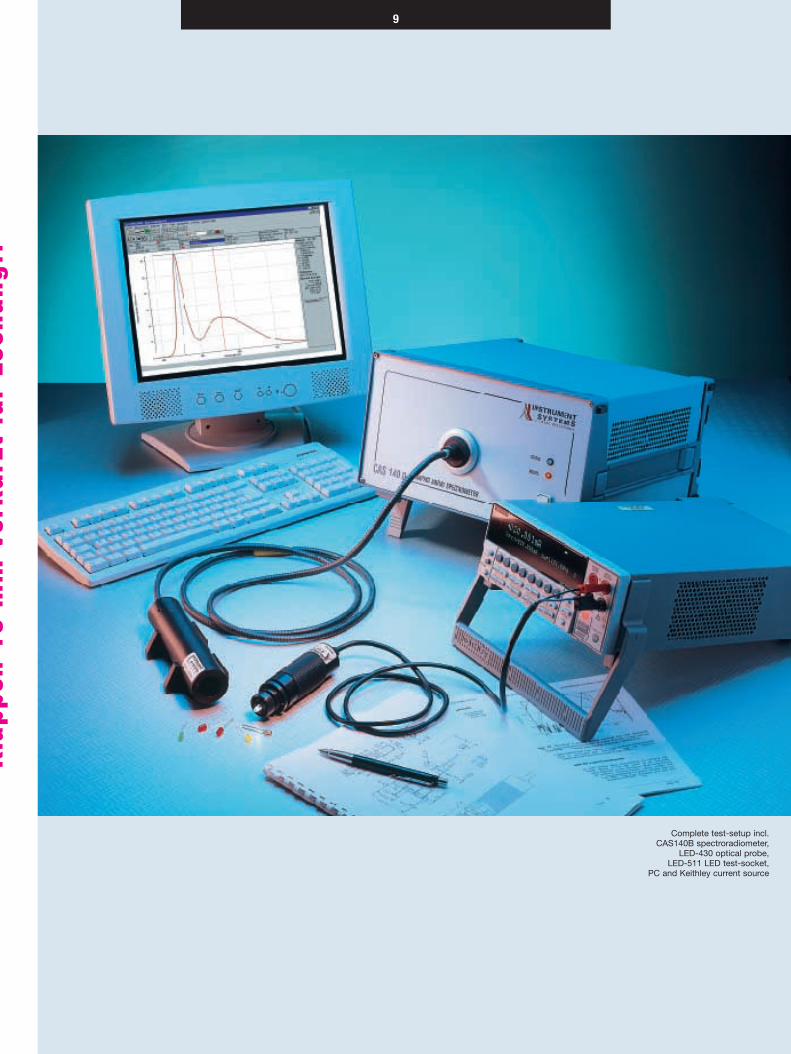
Complete test-setup incl.CAS140B spectroradiometer,
LED-430 optical probe,LED-511 LED test-socket,
PC and Keithley current source
Kla
ppen
10
mm
ver
kürz
t fü
r Lo
chun
g!!
1 0
Spectroradiometers:for different applications
Array spectrometers: for shortmeasuring times. The MAS30and CAS140B array spectrome-ters are simple to operate, ex-tremely robust and have veryshort measuring times. This is dueto the fact that these instrumentshave no moving mechanical partsapart from the shutter for meas-uring dark current. These prop-erties make array spectrome-ters particularly suitable forapplications in quality assuranceand production.
Scanning spectrometers: forthe highest precision. Thehigh signal dynamic range andwavelength resolution of theSPECTRO170 and SPECTRO320scanning spectrometers make itpossible to conduct especiallyprecise measurements. Thesespectrometers are based on aninnovative grating drive that de-livers high wavelength accuracy,high spectral resolution, and fastscanning in the same unit.Exceptionally low levels of straylight in the monochromator anddynamic adjustment of signalgain while the spectrum is beingrecorded ensure a high signaldynamic range and absolutemeasurement accuracy.
*1 Refers to the total available spectralrange covered by all models in eachseries of instruments. The exact spectralrange and resolution of an individualmodel is specified in the data sheet.
*2 Depends on the slit and model in CAS140B; programmable in SPECTRO170/320
*3 Specified for a signal-to-noise ratio ofthe spectrum of 10 : 1, for a yellow LEDat 585 nm, and refering to a VIS model
*4 For a 380 to 780 nm spectral range*5 Valid immediately after calibration, for
diffuse LEDs, relative to the calibrationstandard
*6 Assuming sufficient signal dynamicrange and valid calibration. The specified errors apply a twofold standard deviation.
Specifications are subject to change withoutprior notice.
MAIN CRITERIA FOR SPECTROMETERS SUITABLE FOR TAKING ACCURATELED MEASUREMENTS
Stray light rejection 3 to 4 orders of magnitude Linearity Better than ± 1.5 % over the entire measuring range and
integration timeSignal-to-noise ratio 3 to 4 orders of magnitude, making cooled detectors
preferableSensitivity Light loss with CIE-compliant optical probes demands
extremely high sensitivity
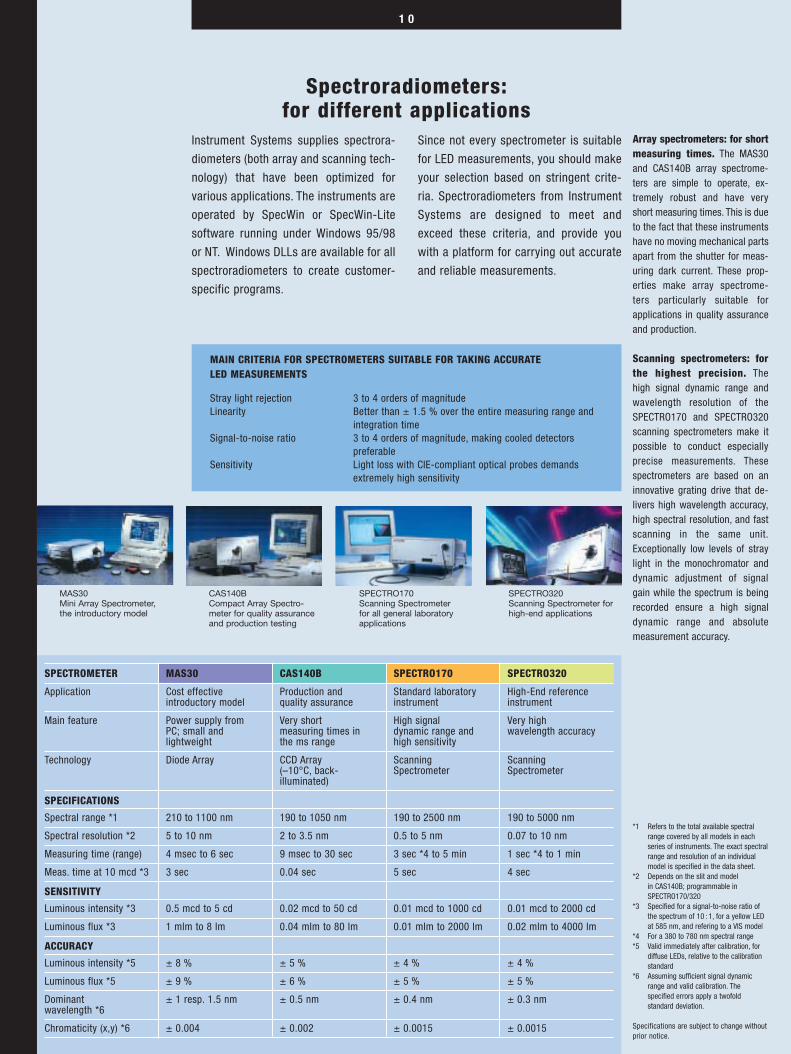
MAS30Mini Array Spectrometer,the introductory model
CAS140B Compact Array Spectro-meter for quality assuranceand production testing
SPECTRO170 Scanning Spectrometerfor all general laboratoryapplications
SPECTRO320Scanning Spectrometer forhigh-end applications
SPECTROMETER MAS30 CAS140B SPECTRO170 SPECTRO320
Application Cost effective Production and Standard laboratory High-End reference introductory model quality assurance instrument instrument
Main feature Power supply from Very short High signal Very highPC; small and measuring times in dynamic range and wavelength accuracylightweight the ms range high sensitivity
Technology Diode Array CCD Array Scanning Scanning(–10°C, back- Spectrometer Spectrometerilluminated)
SPECIFICATIONS
Spectral range *1 210 to 1100 nm 190 to 1050 nm 190 to 2500 nm 190 to 5000 nm
Spectral resolution *2 5 to 10 nm 2 to 3.5 nm 0.5 to 5 nm 0.07 to 10 nm
Measuring time (range) 4 msec to 6 sec 9 msec to 30 sec 3 sec *4 to 5 min 1 sec *4 to 1 min
Meas. time at 10 mcd *3 3 sec 0.04 sec 5 sec 4 sec
SENSITIVITY
Luminous intensity *3 0.5 mcd to 5 cd 0.02 mcd to 50 cd 0.01 mcd to 1000 cd 0.01 mcd to 2000 cd
Luminous flux *3 1 mlm to 8 lm 0.04 mlm to 80 lm 0.01 mlm to 2000 lm 0.02 mlm to 4000 lm
ACCURACY
Luminous intensity *5 ± 8 % ± 5 % ± 4 % ± 4 %
Luminous flux *5 ± 9 % ± 6 % ± 5 % ± 5 %
Dominant ± 1 resp. 1.5 nm ± 0.5 nm ± 0.4 nm ± 0.3 nmwavelength *6
Chromaticity (x,y) *6 ± 0.004 ± 0.002 ± 0.0015 ± 0.0015
Instrument Systems supplies spectrora-
diometers (both array and scanning tech-
nology) that have been optimized for
various applications. The instruments are
operated by SpecWin or SpecWin-Lite
software running under Windows 95/98
or NT. Windows DLLs are available for all
spectroradiometers to create customer-
specific programs.
Since not every spectrometer is suitable
for LED measurements, you should make
your selection based on stringent crite-
ria. Spectroradiometers from Instrument
Systems are designed to meet and
exceed these criteria, and provide you
with a platform for carrying out accurate
and reliable measurements.
1 1
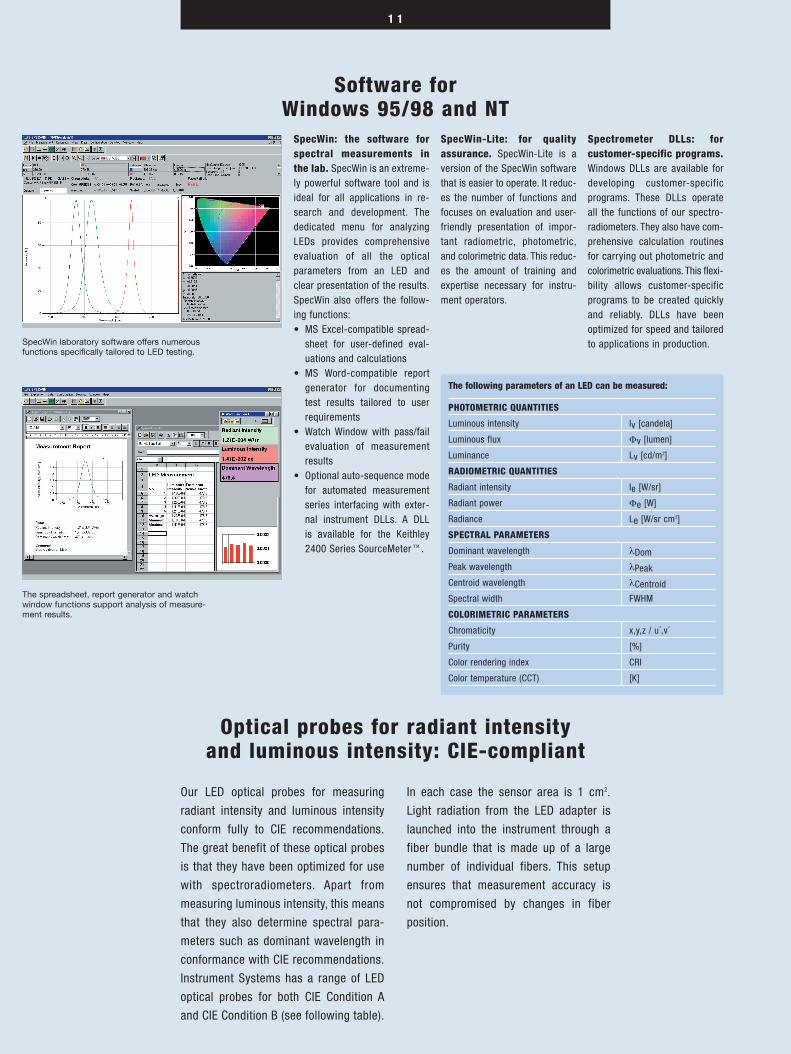
Spectrometer DLLs: forcustomer-specific programs.Windows DLLs are available fordeveloping customer-specificprograms. These DLLs operateall the functions of our spectro-radiometers. They also have com-prehensive calculation routinesfor carrying out photometric andcolorimetric evaluations. This flexi-bility allows customer-specificprograms to be created quicklyand reliably. DLLs have beenoptimized for speed and tailoredto applications in production.
Software forWindows 95/98 and NT
SpecWin-Lite: for qualityassurance. SpecWin-Lite is aversion of the SpecWin softwarethat is easier to operate. It reduc-es the number of functions andfocuses on evaluation and user-friendly presentation of impor-tant radiometric, photometric,and colorimetric data. This reduc-es the amount of training andexpertise necessary for instru-ment operators.
Optical probes for radiant intensityand luminous intensity: CIE-compliant
Our LED optical probes for measuring
radiant intensity and luminous intensity
conform fully to CIE recommendations.
The great benefit of these optical probes
is that they have been optimized for use
with spectroradiometers. Apart from
measuring luminous intensity, this means
that they also determine spectral para-
meters such as dominant wavelength in
conformance with CIE recommendations.
Instrument Systems has a range of LED
optical probes for both CIE Condition A
and CIE Condition B (see following table).
In each case the sensor area is 1 cm2.
Light radiation from the LED adapter is
launched into the instrument through a
fiber bundle that is made up of a large
number of individual fibers. This setup
ensures that measurement accuracy is
not compromised by changes in fiber
position.
SpecWin laboratory software offers numerousfunctions specifically tailored to LED testing.
The spreadsheet, report generator and watchwindow functions support analysis of measure-ment results.
SpecWin: the software forspectral measurements inthe lab. SpecWin is an extreme-ly powerful software tool and isideal for all applications in re-search and development. Thededicated menu for analyzingLEDs provides comprehensiveevaluation of all the opticalparameters from an LED andclear presentation of the results.SpecWin also offers the follow-ing functions:• MS Excel-compatible spread-
sheet for user-defined eval-uations and calculations
• MS Word-compatible reportgenerator for documentingtest results tailored to userrequirements
• Watch Window with pass/failevaluation of measurementresults
• Optional auto-sequence modefor automated measurementseries interfacing with exter-nal instrument DLLs. A DLLis available for the Keithley2400 Series SourceMeter.
The following parameters of an LED can be measured:
PHOTOMETRIC QUANTITIES
Luminous intensity Iv [candela]
Luminous flux Φv [lumen]
Luminance Lv [cd/m2]
RADIOMETRIC QUANTITIES
Radiant intensity Ie [W/sr]
Radiant power Φe [W]
Radiance Le [W/sr cm2]
SPECTRAL PARAMETERS
Dominant wavelength λDom
Peak wavelength λPeak
Centroid wavelength λCentroid
Spectral width FWHM
COLORIMETRIC PARAMETERS
Chromaticity x,y,z / u´,v´
Purity [%]
Color rendering index CRI
Color temperature (CCT) [K]
1 2
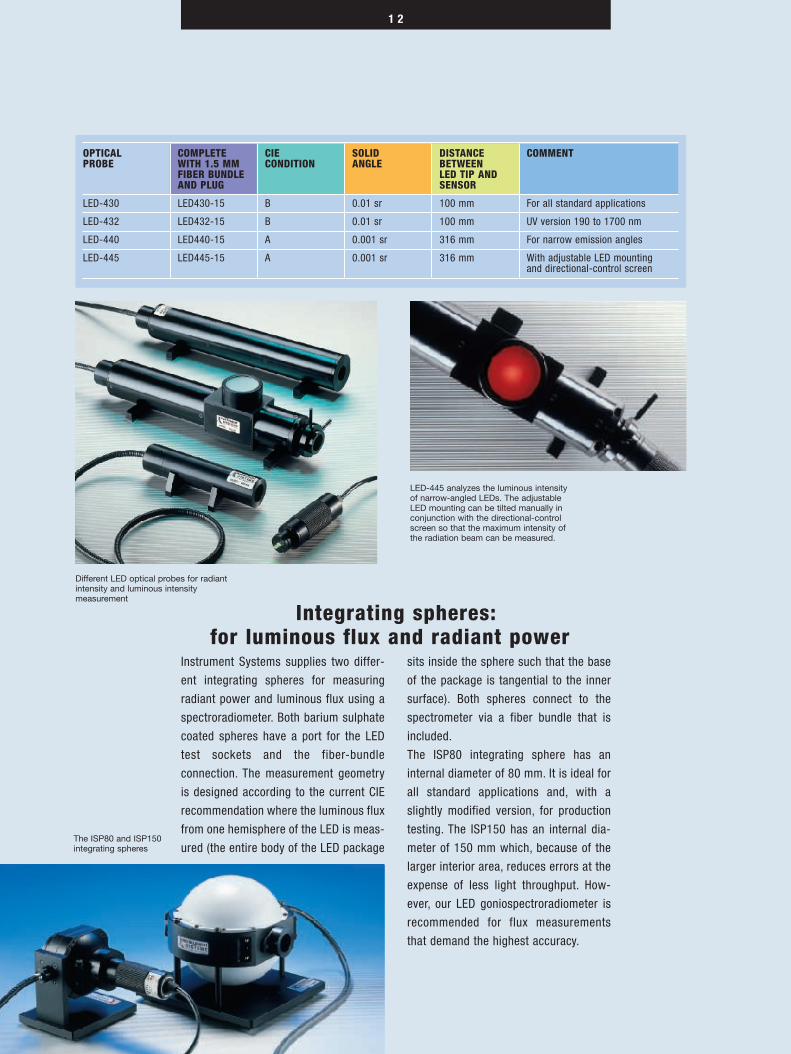
Different LED optical probes for radiantintensity and luminous intensitymeasurement
Integrating spheres:for luminous flux and radiant power
LED-445 analyzes the luminous intensityof narrow-angled LEDs. The adjustableLED mounting can be tilted manually inconjunction with the directional-controlscreen so that the maximum intensity ofthe radiation beam can be measured.
The ISP80 and ISP150integrating spheres
Instrument Systems supplies two differ-
ent integrating spheres for measuring
radiant power and luminous flux using a
spectroradiometer. Both barium sulphate
coated spheres have a port for the LED
test sockets and the fiber-bundle
connection. The measurement geometry
is designed according to the current CIE
recommendation where the luminous flux
from one hemisphere of the LED is meas-
ured (the entire body of the LED package
sits inside the sphere such that the base
of the package is tangential to the inner
surface). Both spheres connect to the
spectrometer via a fiber bundle that is
included.
The ISP80 integrating sphere has an
internal diameter of 80 mm. It is ideal for
all standard applications and, with a
slightly modified version, for production
testing. The ISP150 has an internal dia-
meter of 150 mm which, because of the
larger interior area, reduces errors at the
expense of less light throughput. How-
ever, our LED goniospectroradiometer is
recommended for flux measurements
that demand the highest accuracy.
OPTICAL COMPLETE CIE SOLID DISTANCE COMMENTPROBE WITH 1.5 MM CONDITION ANGLE BETWEEN
FIBER BUNDLE LED TIP ANDAND PLUG SENSOR
LED-430 LED430-15 B 0.01 sr 100 mm For all standard applications
LED-432 LED432-15 B 0.01 sr 100 mm UV version 190 to 1700 nm
LED-440 LED440-15 A 0.001 sr 316 mm For narrow emission angles
LED-445 LED445-15 A 0.001 sr 316 mm With adjustable LED mounting and directional-control screen
1 3
Instrument Systems has developed two
different families of LED test sockets. The
standard series is suitable for general
applications, while the precision series
ensures particularly good alignment with
the mechanical axis of the LED. All LED
test sockets have a cable with banana
plugs for connection with a current
source. The list of available test sockets
is regularly updated to include new
manufacturer types.
Our Model LED 700 current source was
developed for basic requirements when
testing LEDs. The current can be varied
from 2 to 35 mA. Also, sensitive GaN
LEDs are protected against voltage
surges. For precision measurements, we
recommend the Keithley Model 2400
SourceMeter since it has extensive
functions specially designed for LEDs.
Instrument Systems has developed a DLL
for the Keithley 2400 to carry out auto-
mated measurement sequences using
SpecWin software.
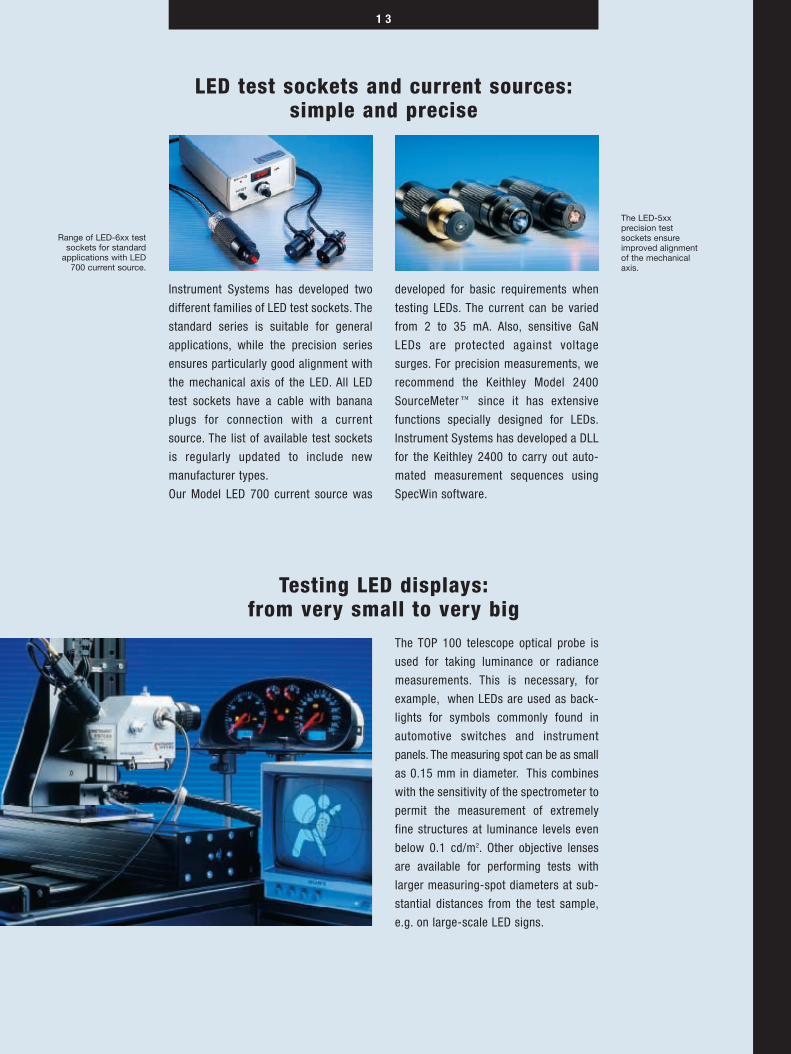
LED test sockets and current sources:simple and precise
The TOP 100 telescope optical probe is
used for taking luminance or radiance
measurements. This is necessary, for
example, when LEDs are used as back-
lights for symbols commonly found in
automotive switches and instrument
panels. The measuring spot can be as small
as 0.15 mm in diameter. This combines
with the sensitivity of the spectrometer to
permit the measurement of extremely
fine structures at luminance levels even
below 0.1 cd/m2. Other objective lenses
are available for performing tests with
larger measuring-spot diameters at sub-
stantial distances from the test sample,
e.g. on large-scale LED signs.
Testing LED displays:from very small to very big
Range of LED-6xx testsockets for standard
applications with LED700 current source.
The LED-5xx precision testsockets ensureimproved alignmentof the mechanicalaxis.
1 4
Luminous flux and radiant power:extremely accurate The LED Gonio-
spectroradiometer is also ideal for a very
accurate determination of radiant power
or luminous flux. Measurement errors
caused by the geometry of integrating
spheres are eliminated. Instrument
Systems has developed a menu within
the SpecWin software that allows these
measurements and calculations to be
performed automatically.
The LED Goniospectroradiometer:for all spatial radiation characteristics
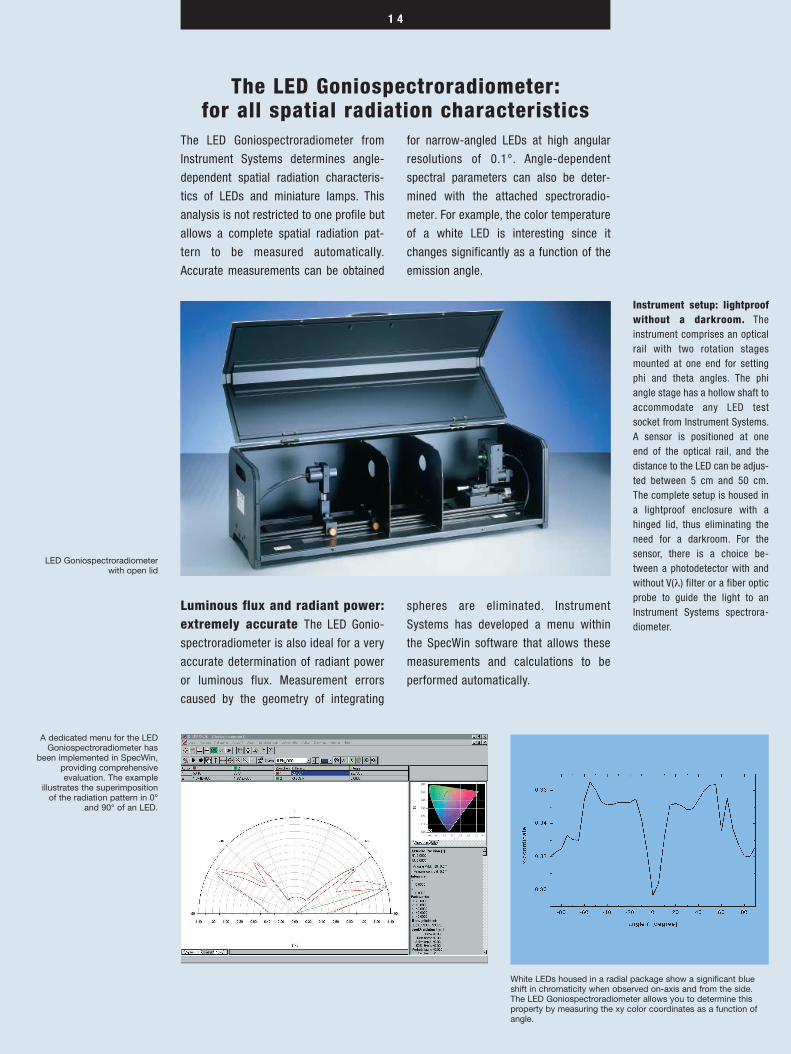
A dedicated menu for the LEDGoniospectroradiometer has
been implemented in SpecWin,providing comprehensiveevaluation. The example
illustrates the superimpositionof the radiation pattern in 0°
and 90° of an LED.
LED Goniospectroradiometerwith open lid
Instrument setup: lightproofwithout a darkroom. Theinstrument comprises an opticalrail with two rotation stagesmounted at one end for settingphi and theta angles. The phiangle stage has a hollow shaft toaccommodate any LED testsocket from Instrument Systems.A sensor is positioned at oneend of the optical rail, and thedistance to the LED can be adjus-ted between 5 cm and 50 cm.The complete setup is housed ina lightproof enclosure with ahinged lid, thus eliminating theneed for a darkroom. For thesensor, there is a choice be-tween a photodetector with andwithout V(λ) filter or a fiber opticprobe to guide the light to anInstrument Systems spectrora-diometer.
The LED Goniospectroradiometer from
Instrument Systems determines angle-
dependent spatial radiation characteris-
tics of LEDs and miniature lamps. This
analysis is not restricted to one profile but
allows a complete spatial radiation pat-
tern to be measured automatically.
Accurate measurements can be obtained
for narrow-angled LEDs at high angular
resolutions of 0.1°. Angle-dependent
spectral parameters can also be deter-
mined with the attached spectroradio-
meter. For example, the color temperature
of a white LED is interesting since it
changes significantly as a function of the
emission angle.
White LEDs housed in a radial package show a significant blueshift in chromaticity when observed on-axis and from the side.The LED Goniospectroradiometer allows you to determine thisproperty by measuring the xy color coordinates as a function ofangle.

Instrument Systems supplies a complete
LED tester that has been designed for the
production environment and can be easi-
ly integrated with a mechanical sorter.
The LED tester comprises a CAS140B
CCD Array Spectrometer, a Keithley
Model 2400 SourceMeter, and a
WindowsNT computer with control soft-
ware. The complete system is housed in
a rugged 19” rack. The tester includes
shortened luminous-intensity adapters
from the LED-4xx series as optical
probes or a modified ISP80 integrating
sphere.
All radiometric, photometric and spectral
characteristics can typically be meas-
ured within a period of 20 msec. Electrical
parameters such as actual current and
forward voltage are also determined for
each LED. In addition, the control soft-
ware has functions for classifying and
sorting LEDs into as many as 32 bin clas-
ses. All data are stored in a database and
are statistically analyzed upon comple-
tion of sorting.
Well connected: interfaces tohandling machines, die sorters,and wafer probers DLL driver and
hardware interfaces are also supplied for
sorting machines manufactured by MBL
(radial LEDs), ASM (die sorters) and a
range of wafer probers. The modular
design also permits other handling
systems to be integrated. Instrument
Systems has already created numerous
hardware/software interfaces for LED man-
ufacturers’ in-house automated systems.
Since current only flows for a very short
time during production tests, differences
in the values for luminous intensity may
arise between pulsed and constant-cur-
rent operation. It is not possible to stabi-
lize the LED temperature in this operating
mode but there is generally a well-
defined correlation between measuring
results for pulsed and constant-current
operation. These correction factors must
be included in the analysis.
Contact us directly to discuss your pro-
duction tester requirements and we can
team up to develop the best solution for
your needs.
1 5
Production testing:new standards for the conveyor belt
A 19” rack houses a CAS140BCCD Array Spectrometer, a
Keithley 2400 series SourceMeterTM,and a Windows NT control
computer.
LED tester softwarefrom InstrumentSystems integrates allfunctions, includingbin classification andstatistical analysis.
Instrument Systemssaves you time andmoney in productionwith pioneering me-trology.
1 6
Accurate LED measurements demand a
precise calibration traceable to a national
standard. Instrument Systems has a fully
equipped calibration laboratory for cali-
brating all the radiometric and photome-
tric parameters used in testing LEDs. We
also supply calibrated LEDs with a con-
trol unit for checking and recalibrating
absolute intensity. This allows you to
guarantee your customers on-site meas-
urements in strict conformity with ISO
9000.
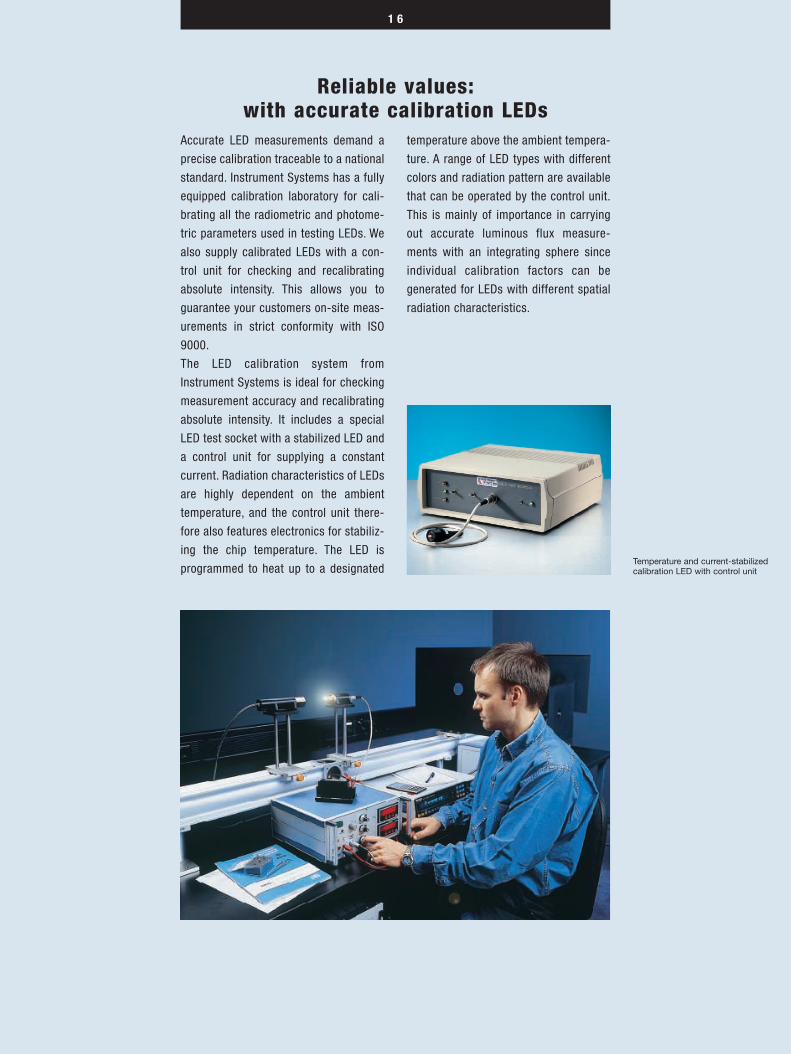
The LED calibration system from
Instrument Systems is ideal for checking
measurement accuracy and recalibrating
absolute intensity. It includes a special
LED test socket with a stabilized LED and
a control unit for supplying a constant
current. Radiation characteristics of LEDs
are highly dependent on the ambient
temperature, and the control unit there-
fore also features electronics for stabiliz-
ing the chip temperature. The LED is
programmed to heat up to a designated
temperature above the ambient tempera-
ture. A range of LED types with different
colors and radiation pattern are available
that can be operated by the control unit.
This is mainly of importance in carrying
out accurate luminous flux measure-
ments with an integrating sphere since
individual calibration factors can be
generated for LEDs with different spatial
radiation characteristics.
Reliable values:with accurate calibration LEDs
Temperature and current-stabilizedcalibration LED with control unit
1 7
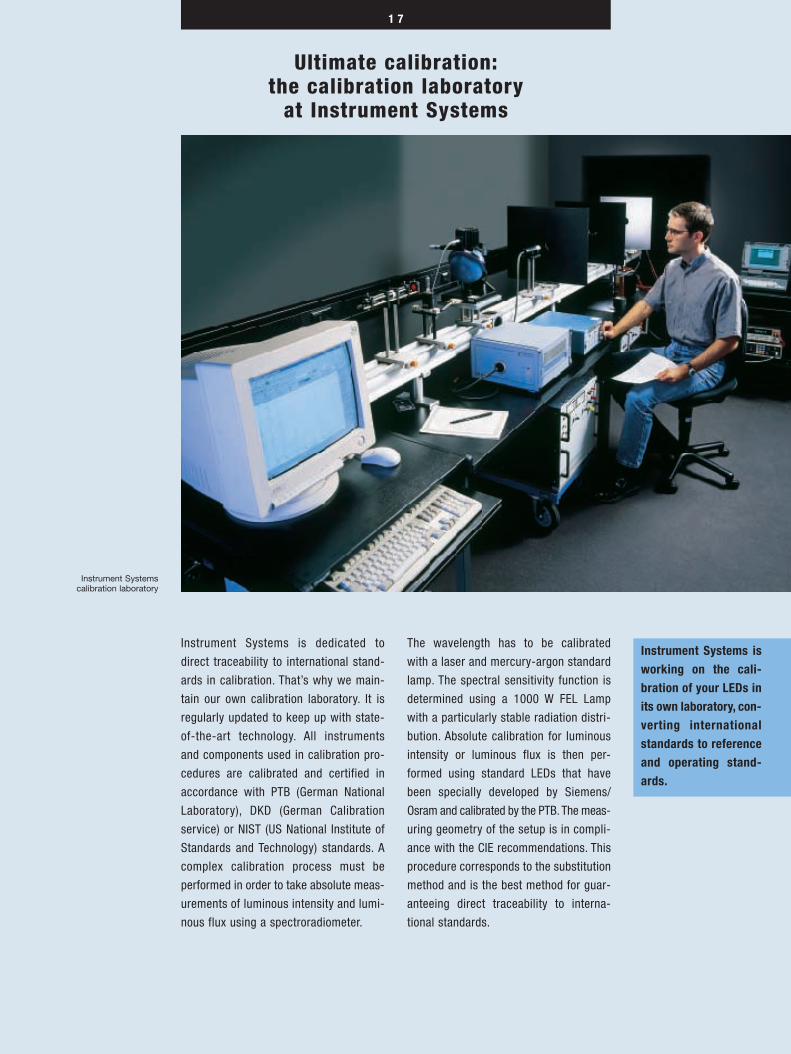
Instrument Systems is dedicated to
direct traceability to international stand-
ards in calibration. That’s why we main-
tain our own calibration laboratory. It is
regularly updated to keep up with state-
of-the-art technology. All instruments
and components used in calibration pro-
cedures are calibrated and certified in
accordance with PTB (German National
Laboratory), DKD (German Calibration
service) or NIST (US National Institute of
Standards and Technology) standards. A
complex calibration process must be
performed in order to take absolute meas-
urements of luminous intensity and lumi-
nous flux using a spectroradiometer.
The wavelength has to be calibrated
with a laser and mercury-argon standard
lamp. The spectral sensitivity function is
determined using a 1000 W FEL Lamp
with a particularly stable radiation distri-
bution. Absolute calibration for luminous
intensity or luminous flux is then per-
formed using standard LEDs that have
been specially developed by Siemens/
Osram and calibrated by the PTB. The meas-
uring geometry of the setup is in compli-
ance with the CIE recommendations. This
procedure corresponds to the substitution
method and is the best method for guar-
anteeing direct traceability to interna-
tional standards.
Instrument Systemscalibration laboratory
Ultimate calibration:the calibration laboratory
at Instrument Systems
Instrument Systems isworking on the cali-bration of your LEDs inits own laboratory, con-verting internationalstandards to referenceand operating stand-ards.

1 8
Instrument Systems has been developing
and manufacturing test instrumentation
for optical metrology since 1986.
Innovation has always been the bench-
mark of success. The development of a
pioneering generation of spectrometers
is just one of our achievements. These
spectrometers delivered precise spectral
analysis with fast measurement speeds
for the first time.
Fast and innovative implemen-tation. Companies like Instrument
Systems who aim to be at the cutting
edge of metrology always have to be one
step ahead of the competition. They also
need pioneering enterprise. We set the
pace when it comes to implementing
customer requirements. One result:
Products offering complete measurement
solutions.
Instrument Systems provides profession-
al expertise in LED metrology and delivers
proven, innovative solutions in other
domains of optical metrology:
Display test systems
Mini/Compact ArraySpectrometers
Scanning spectrometers in ver-sions with single and doublemonochromator
Polarization analyzers
Test systems for determiningstress birefringence
Selected accessories forspectroradiometry, photometry,transmission and reflectionmeasurements
The highest standard:our customers
Audi • Boeing • BMW • Delco Electronics • EBT/Kingbright • FordGELcore • Hewlett Packard • Mannesmann VDO • Nichia ChemicalsNIST • Osram • PTB • Siemens • Samsung • Stanley • Toshiba • TRWVW • Vishay (Temic Telefunken) • Wustlich Optoelektronik
W E B R I N G Q U A L I T Y T O L I G H T .

1 9
Expert advice at Instrument Systems
means that you also have a reliable part-
ner for after-sales service and support.
We ensure that your investment operates
with maximum efficiency and has a long
service life.
Consultation createsadded value

X
International (World Headquarters)
INSTRUMENT SYSTEMS GMBH
Neumarkter Str. 83, 81673 Munich, Germany
Tel. +49-89-45 49 43-0, Fax +49-89-45 49 43-11
E-mail: [email protected]
North America
INSTRUMENT SYSTEMS CANADA
576 Golden Avenue, Ottawa, Ontario, Canada K2A 2E9
Tel.: (613) 729-0614, Fax: (613) 729-9067
E-mail: [email protected]
Distributor/Representative
w w w . i n s t r u m e n t s y s t e m s . d e