Embed Size (px)
Citation preview
Int. J. Nuts & Related Sci., 2(4): 37-54, 2011
37
International Journal of Nuts and Related Sciences 2(4): 37-54, 2011 ISSN 2008-9937 Optimization of Fat Replacers and Sweetener Levels to Formulate Reduced- Calorie Pistachio Butter: A
Response Surface Methodology
Emadzadeh B.1,2, Razavi S. M. A. *2, Hashemi M.3, Nassiri Mahallati M. 4, Farhoosh R. 2
1Khorasan Research Institute for Food Science and Technology (KRIFST), Mashhad, Iran
2 Department of Food Science and Technology, Ferdowsi University of Mashhad (FUM), POBox: 91775-1163, Mashhad, Iran
3Department of Food Processing, Iranian Academic Center for Education Culture and Research (ACECR), Mashhad, Iran
4Department of Agronomy, Ferdowsi University of Mashhad (FUM), POBox: 91775-1163, Mashhad, Iran
Abstract: Consumers' awareness about the nutritional profile of their diets has made the industry to respond their needs seriously. In this study, response surface methodology was used to analyze the effect of three fat replacers and two sweeteners on sensory attributes and viscosity of low- calorie pistachio butter. Balangu seed extract (BSG) (0.01-0.04), Reihan seed gum (RSG) (0.01-0.023), xanthan (0.06-0.1), isomalt (0-1) and sucrose (0.25-1) were the levels investigated. A central composite design was used to develop models for the responses. The optimum levels of ingredients according to the target values were as follows: xanthan (0.1%), isomalt: pistachio paste ratio (0.81), sucrose: pistachio paste ratio (0.71) for formulas prepared using xanthan gum; Balangu seed extract (0.034%), isomalt: pistachio paste ratio (1) and sucrose: pistachio paste ratio (0.25) for products containing Balangu seed extract; and RSG (0.023%), isomalt: pistachio paste ratio (0.333) and sucrose: pistachio paste ratio (1.0) for formulas prepared by RSG.
Keywords: Pistachio butter; Reduced- calorie; Fat replacers; RSM; Optimization; sensory
INTRODUCTION
Pistachio is one of the most important exports of Iran. According to the statistics reported by FAO (2008), Iran is the original home of pistachio and the annual amount of pistachio production in Iran constitutes 62% of the total world production. Pistachio butter is a pasty formed nutritive product which is made from blending the pistachio paste with sucrose, emulsifier and taste improver [3]. By increasing the obesity in many parts of the world and as consumers become increasingly aware about the assistance of food in calorie control, the food industry has responded to consumer demand by offering an ever-increasing reduced- calorie versions of standard products. According to Codex claims, reduced- calorie foods should have reduction ≥ 25% in comparison to the full fat food [16]. In spite of the positive contribution of fats to taste, texture and aroma of foods, the high calorie content
of fat has made some anxieties for consumers and nourishing scientists. In general, fat replacers are implied to all the bulking agents or ingredients that somehow replaces fat in a system. The ideal fat replacer(s) reduces fat and calorie content of the product, while remains all the characteristics of the primary full fat product [28]. The manufacturers and legislatives' requirements should also be taken into account [38]. As hydrocolloids can provide some important functions of fat by texturizing, water-structuring, mouth coating and opacity properties, they are generally expected as proper fat replacers [32]. Xanthan is a versatile hydrocolloid that as a result of its ordered molecular structure can be used in low- fat products. It can give relatively viscous solutions at low concentrations and also stabilize the product's dispersion at rest [38]. Lallemantia royleana (with vernacular name Balangu seed) is a mucilaginous endemic plant which grows in different Middle East countries Corresponding Author: Razavi S. M. A., Department of Food Science and Technology, Ferdowsi University of
Mashhad (FUM), POBox: 91775-1163, Mashhad, Iran Email: [email protected]
Int. J. Nuts & Related Sci., 2(4): 37-54, 2011
38
especially different parts of Iran. According to its mucilaginous extract, it is conventionally consumed as a stimulant, diuretic and expectorant medicine and used in a range of Iranian traditional products [29, 33]. Soaking in water, seeds absorb water quickly and produce a sticky, turbid and tasteless liquid [33]. The optimum extraction conditions of Balangu seed extract (BSG) has previously studied by [26]. Recent rheological researches have approved that its mucilaginous extract can be used as a novel food hydrocolloid in food formulations [34]. Ocimum basilicum also known as Reihan is another endemic medical plant which is distributed in the tropical regions of Asia, Africa and Central and South America [36]. The outer pericarp of Reihan seeds swells as it is soaked in water. The optimum conditions of Reihan seed gum (RSG) extraction have been determined before [35]. Hosseini-Parvar [20] studied the rheological characteristics of RSG and show that the existence of yield stress, the high low shear viscosity and pseudoplastic behavior of this hydrocolloid has made it a good stabilizer in food formulations. Another food ingredient that can be considered in formulation of low- calorie foods is sweetener. The ideal sweetener to be altered in low- calorie food system should be as sweet as sucrose, colorless, odor less, water soluble and stable in both acidic and basic conditions and over a wide range of temperatures [28]. Isomalt is a sweet, low-calorie, bulking agent with properties and characteristics similar to sucrose. It is a non-reducing sugar and stable against chemical and enzymatic hydrolysis. It is also a suitable sweetener for diabetics [25, 28]. In fact, considering a perfect sweetener is impossible and therefore, mixing of sweeteners is commonly used in food formulations. The combination of sweeteners improved the acceptability, functionality and economics of each sweetener individually [30]. The formulation of reduced- calorie food products and its aspects have been studied by many researchers; water continuous low- fat spreads [8], fat- free process- cheese spreads [41], low- fat spread using fish gelatin and pectin [7], low- fat cheeses [37], calorie- reduced yoghurt [22], fat- free stirred yoghurt [11], reduced- calorie chocolate
[39], reduced- calorie salep drink [43] and many others. According to Evans [15] optimization gives the possibility to achieve the best case among the possible alternatives. Response surface methodology (RSM) is an empirical modeling approach to understand the quantitative relationship between input variables and output response. Because of its comprehensive and high efficiency, it is a useful tool to achieve the optimum conditions [14, 19, and 40]. Some good examples of appropriate application of this technique in food formulation are the optimization of formulations of peanut- soy beverage [12], traditional baked cassava cake [18], mango soy fortified yoghurt [23], chocolate peanut spread [9], protein- and vitamin- fortified peanut spreads [47], reduced calorie mixed fruits jam [1], extruded snack food [44], improved wheat bread dough [10], chocolate- flavored, and powdered chocolate milk [21]. In the present study, investigations were undertaken to formulate a novel low- calorie food product, and to employ a central composite design (3 factors and 3 levels) to study the effects of independent variables on the viscosity and sensory attributes. It was also attended to optimize the fat replacer (xanthan gum, Balangu seed extract and Basil seed gum) and sweeteners (isomalt and sucrose) levels by response surface methodology.
MATERIALS AND METHODS
Preparation of formulas The O'hadi pistachio was obtained from a local market in Kashmar city, Khorasan province in Iran in September 2009. It was manually peeled and cleaned to remove all foreign matters. The nuts were cracked and the kernels separated from the shells by hand. The ≥25% oil reduction was achieved by pressing the pistachio kernels in an oil extraction plant. Isomalt was procured from Sim-Sim industry, (Mashhad, Iran). Sucrose and vanilla were obtained from local markets. Potassium sorbate and lecithin were purchased from Merck (Germany) and Acrose (Belgium) companies, respectively. At the first step for all formulas, the proper amount of hydrocolloid, potassium sorbate and lecithin were dissolved in distilled water using
Int. J. Nuts & Related Sci., 2(4): 37-54, 2011
39
a stirrer and then added to the pre- blended pistachio paste, sweetener and vanilla. All ingredients were then mixed with the pre-defined amount of distilled water and the final product was homogenized using ultra turrax T25 at 9500 rpm for 10 min (IKA Labortechnik, Germany). The basic composition formula was suggested by the results of pre- experiments carried out in our laboratory. Sensory evaluation The formulas were prepared one day in advance and kept at 4ºC in refrigerator. They were stored at room temperature 30 min before testing. All samples were coded with random numbers and served in random order to a seven member trained panel. Instructions were given in full to panelists beforehand and they evaluated the odor, oily appearance, spreadability, hardness, graininess, cohesiveness, mouth feel, taste and total acceptance attributes (Table 1). According to the fact that texture, appearance and flavor are the three major characteristics which are mainly judged by the consumers, the sensory evaluation test was structured [42]. Samples were evaluated using a scaling nine point hedonic method. Panelists cleanse their palates with water before rating each sample. Viscosity measurement After the preparation process, the samples were kept at 4ºC for 24 hours. Measurements were carried out using a rotational viscometer (Bohlin Model Visco 88, Bohlin Instruments, UK) equipped with a heating circulator (Julabo, Model F12-MCand, Julabo Labortechnik, Germany) and C14 spindle. All the experiments were performed at 25ºC±0.2. The shear rate of 47 s-1 was chosen as the reference shear rate as its determined thickness can be well correlated with the perceived thickness in mouth [5]. Experimental design After determining the experimental range of the formulation variables through preliminary experiments, a faced central composite design (CCD) with 6 replicates at the centre point was used to develop predictive models for viscosity and
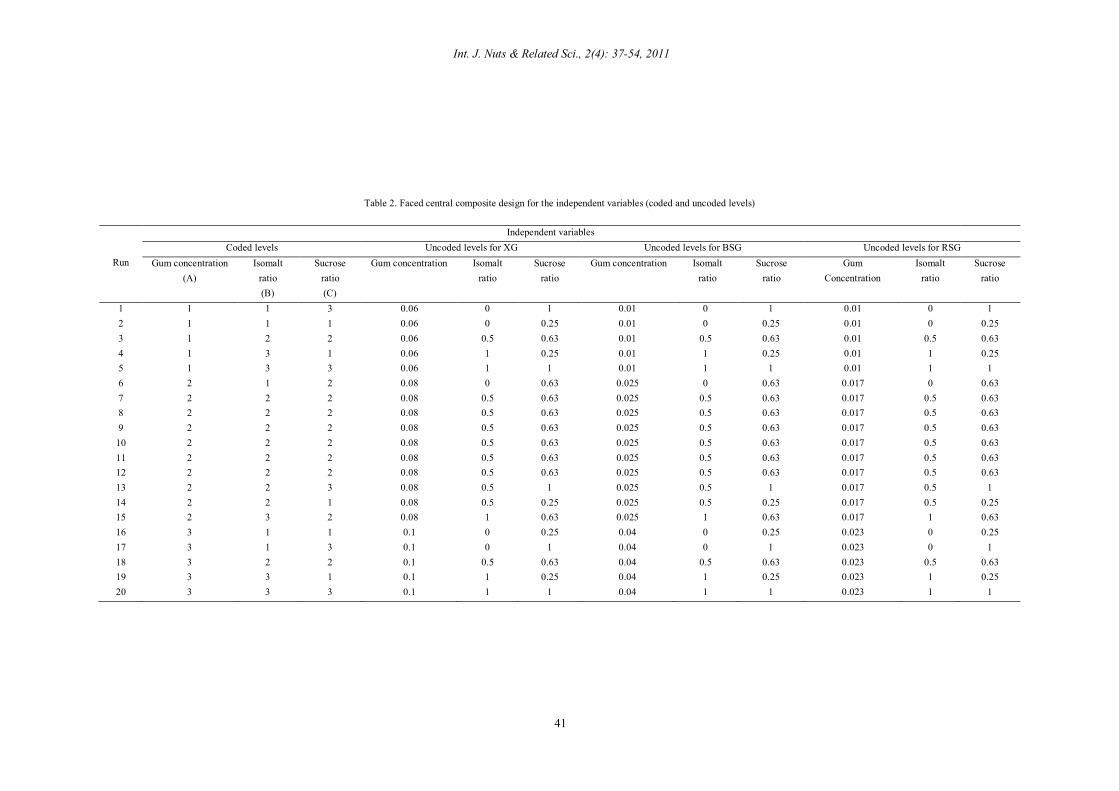
sensory score attributes. As there may occur some systematic errors and therefore some unexplained variability in the observed responses, experiments were replicated in the center of design to make the estimation of pure error possible [31]. The three independent variables (gum concentration, isomalt: pistachio paste ratio, and sucrose: pistachio paste ratio) and experimental design in terms of coded and uncoded values are presented in Table 2. Data from CCD were analyzed by multiple regressions to fit the following quadratic polynomial model.
Where, Y is the estimated response; , , ,
are constant coefficients. , are the
concentration percentages of xanthan, isomalt: pistachio paste ratio, and sucrose: pistachio paste ratio, respectively. The significance of the equation parameters for each independent variable was evaluated using p- value. The goodness of fit was determined by model analysis, lack of fit and coefficient of determination parameters. The optimization and the graphic presentations of the response surface models were performed using Minitab statistical software (version 13.2, MINITABTM, USA). Numerical optimization was carried out to determine the exact optimum value of independent variables. The desired goal and appropriate weight was assigned to each variable and the optimal condition was obtained using the predicted equations determined by RSM. The response surfaces for the models were plotted as a function of two variables, while keeping other variable at the average value.
RESULTS AND DISCUSSIONS Diagnostic checking of the fitted models According to the conditions constructed using CCD, twenty experiments were carried out for each fat replacer (Table 2). Analytical data from central composite design of samples were fitted to multiple regressions to estimate response surfaces of dependent quality variables. Developed regression models and coefficients of determination for
Int. J. Nuts & Related Sci., 2(4): 37-54, 2011
40
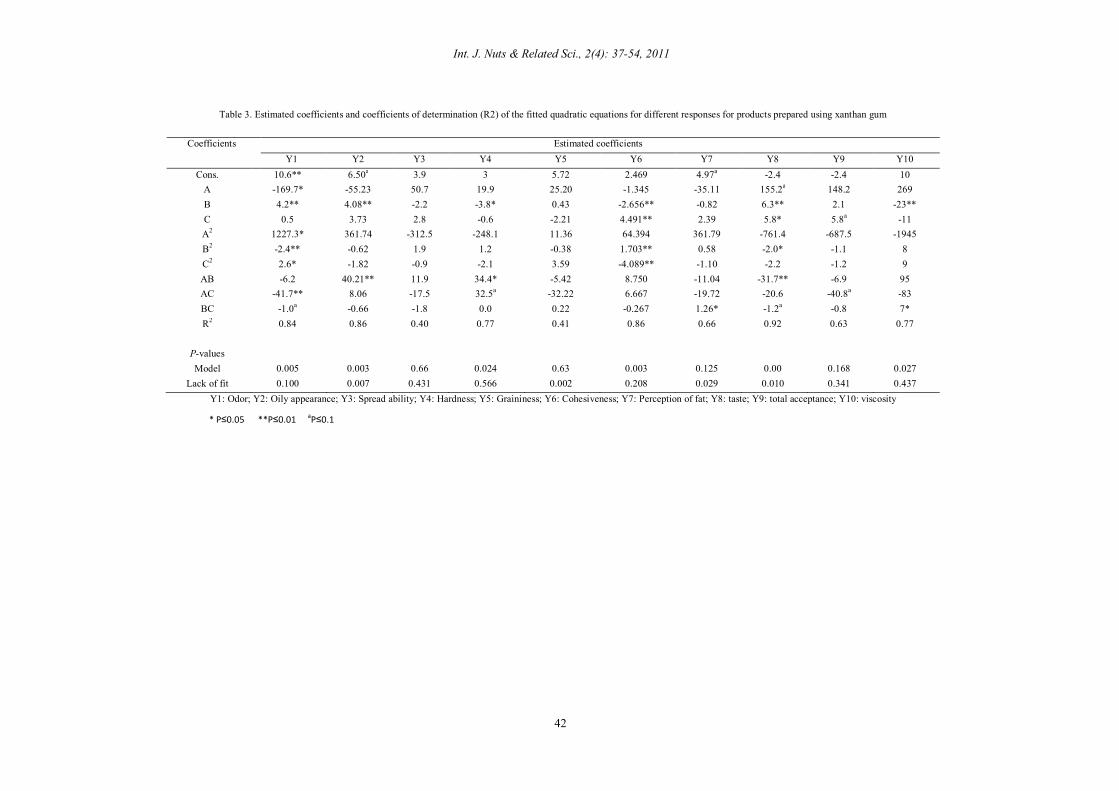
xanthan gum (XG), BSG and RSG are reported in Tables 3, 4 and 5, respectively. The fitted quadratic models accounted for more than 70% variations of the oily appearance, hardness, cohesiveness, taste and viscosity experimental data. All main effects, linear and quadratic, and interaction effects were calculated for each model. The significance of coefficients was evaluated using P-value in Tables 3, 4 and 5 for xanthan gum, BSG and RSG, respectively. This statistic was used as a tool to check the significance of each coefficient and also an indication of the pattern of interactions between variables [40]. The gum concentration has a great quadratic effect on the odor of formulas prepared
using xanthan gum (p≤0.05), graininess and taste characteristics of formulas containing BSG (p≤0.1) and oily paste ratio on the rated cohesiveness score. Higher levels of BSG led to higher cohesiveness scores. It is probably due to the appearance of an additional hydrocolloid network and therefore, an increase in the ability of granules to stay together. Aydi [4] reported similar results for the meat sausages containing carrageenan hydrocolloid. Increasing the sucrose: pistachio paste ratio resulted in a slow increase followed by a decrease in cohesiveness.
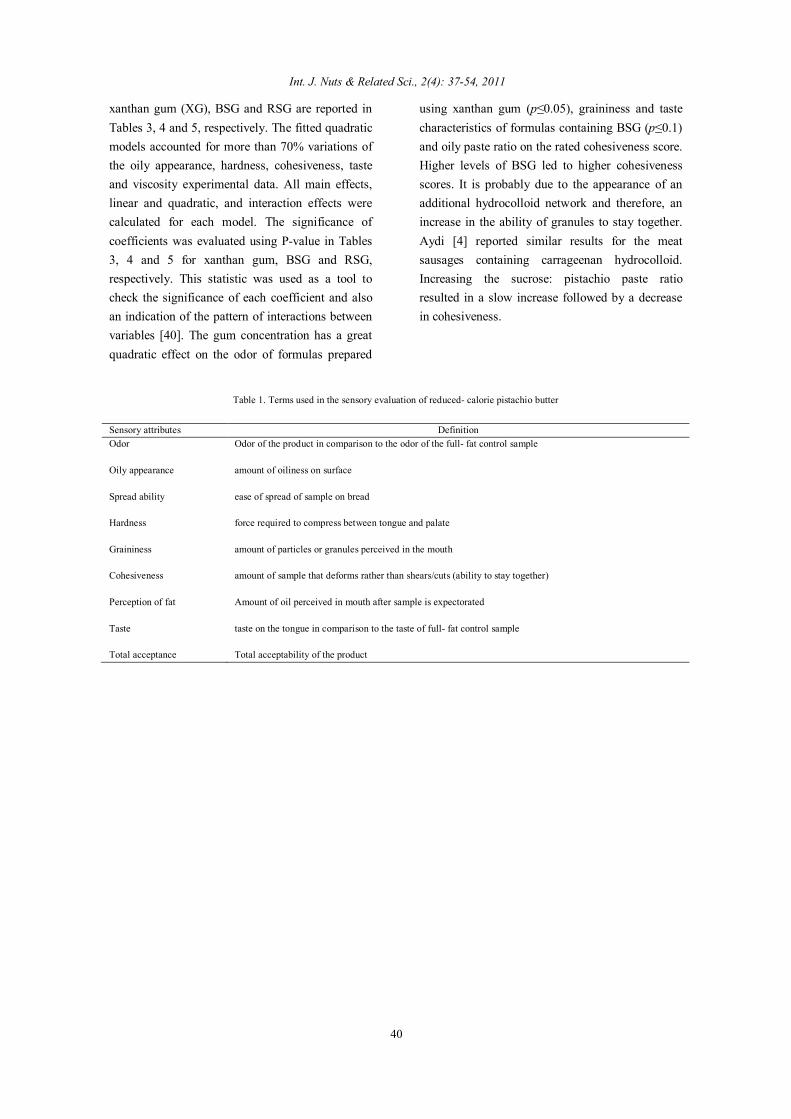
Table 1. Terms used in the sensory evaluation of reduced- calorie pistachio butter
Sensory attributes Definition Odor Odor of the product in comparison to the odor of the full- fat control sample
Oily appearance amount of oiliness on surface
Spread ability ease of spread of sample on bread
Hardness force required to compress between tongue and palate
Graininess amount of particles or granules perceived in the mouth
Cohesiveness amount of sample that deforms rather than shears/cuts (ability to stay together)
Perception of fat Amount of oil perceived in mouth after sample is expectorated
Taste taste on the tongue in comparison to the taste of full- fat control sample
Total acceptance Total acceptability of the product
Int. J. Nuts & Related Sci., 2(4): 37-54, 2011
41
Table 2. Faced central composite design for the independent variables (coded and uncoded levels)
Run
Independent variables Coded levels Uncoded levels for XG Uncoded levels for BSG Uncoded levels for RSG
Gum concentration (A)
Isomalt ratio (B)
Sucrose ratio (C)
Gum concentration
Isomalt ratio
Sucrose ratio
Gum concentration Isomalt ratio
Sucrose ratio
Gum Concentration
Isomalt ratio
Sucrose ratio
1 1 1 3 0.06 0 1 0.01 0 1 0.01 0 1 2 1 1 1 0.06 0 0.25 0.01 0 0.25 0.01 0 0.25 3 1 2 2 0.06 0.5 0.63 0.01 0.5 0.63 0.01 0.5 0.63 4 1 3 1 0.06 1 0.25 0.01 1 0.25 0.01 1 0.25 5 1 3 3 0.06 1 1 0.01 1 1 0.01 1 1 6 2 1 2 0.08 0 0.63 0.025 0 0.63 0.017 0 0.63 7 2 2 2 0.08 0.5 0.63 0.025 0.5 0.63 0.017 0.5 0.63 8 2 2 2 0.08 0.5 0.63 0.025 0.5 0.63 0.017 0.5 0.63 9 2 2 2 0.08 0.5 0.63 0.025 0.5 0.63 0.017 0.5 0.63
10 2 2 2 0.08 0.5 0.63 0.025 0.5 0.63 0.017 0.5 0.63 11 2 2 2 0.08 0.5 0.63 0.025 0.5 0.63 0.017 0.5 0.63 12 2 2 2 0.08 0.5 0.63 0.025 0.5 0.63 0.017 0.5 0.63 13 2 2 3 0.08 0.5 1 0.025 0.5 1 0.017 0.5 1 14 2 2 1 0.08 0.5 0.25 0.025 0.5 0.25 0.017 0.5 0.25 15 2 3 2 0.08 1 0.63 0.025 1 0.63 0.017 1 0.63 16 3 1 1 0.1 0 0.25 0.04 0 0.25 0.023 0 0.25 17 3 1 3 0.1 0 1 0.04 0 1 0.023 0 1 18 3 2 2 0.1 0.5 0.63 0.04 0.5 0.63 0.023 0.5 0.63 19 3 3 1 0.1 1 0.25 0.04 1 0.25 0.023 1 0.25 20 3 3 3 0.1 1 1 0.04 1 1 0.023 1 1
Int. J. Nuts & Related Sci., 2(4): 37-54, 2011
42
Table 3. Estimated coefficients and coefficients of determination (R2) of the fitted quadratic equations for different responses for products prepared using xanthan gum
Coefficients Estimated coefficients Y1 Y2 Y3 Y4 Y5 Y6 Y7 Y8 Y9 Y10
Cons. 10.6** 6.50a 3.9 3 5.72 2.469 4.97a -2.4 -2.4 10 A -169.7* -55.23 50.7 19.9 25.20 -1.345 -35.11 155.2a 148.2 269 B 4.2** 4.08** -2.2 -3.8* 0.43 -2.656** -0.82 6.3** 2.1 -23** C 0.5 3.73 2.8 -0.6 -2.21 4.491** 2.39 5.8* 5.8a -11 A2 1227.3* 361.74 -312.5 -248.1 11.36 64.394 361.79 -761.4 -687.5 -1945 B2 -2.4** -0.62 1.9 1.2 -0.38 1.703** 0.58 -2.0* -1.1 8 C2 2.6* -1.82 -0.9 -2.1 3.59 -4.089** -1.10 -2.2 -1.2 9 AB -6.2 40.21** 11.9 34.4* -5.42 8.750 -11.04 -31.7** -6.9 95 AC -41.7** 8.06 -17.5 32.5a -32.22 6.667 -19.72 -20.6 -40.8a -83 BC -1.0a -0.66 -1.8 0.0 0.22 -0.267 1.26* -1.2a -0.8 7* R2
P-values
0.84 0.86 0.40 0.77 0.41 0.86 0.66 0.92 0.63 0.77
Model 0.005 0.003 0.66 0.024 0.63 0.003 0.125 0.00 0.168 0.027
Lack of fit 0.100 0.007 0.431 0.566 0.002 0.208 0.029 0.010 0.341 0.437 Y1: Odor; Y2: Oily appearance; Y3: Spread ability; Y4: Hardness; Y5: Graininess; Y6: Cohesiveness; Y7: Perception of fat; Y8: taste; Y9: total acceptance; Y10: viscosity
* **
a
* P≤0.05 **P≤0.01 aP≤0.1
Int. J. Nuts & Related Sci., 2(4): 37-54, 2011
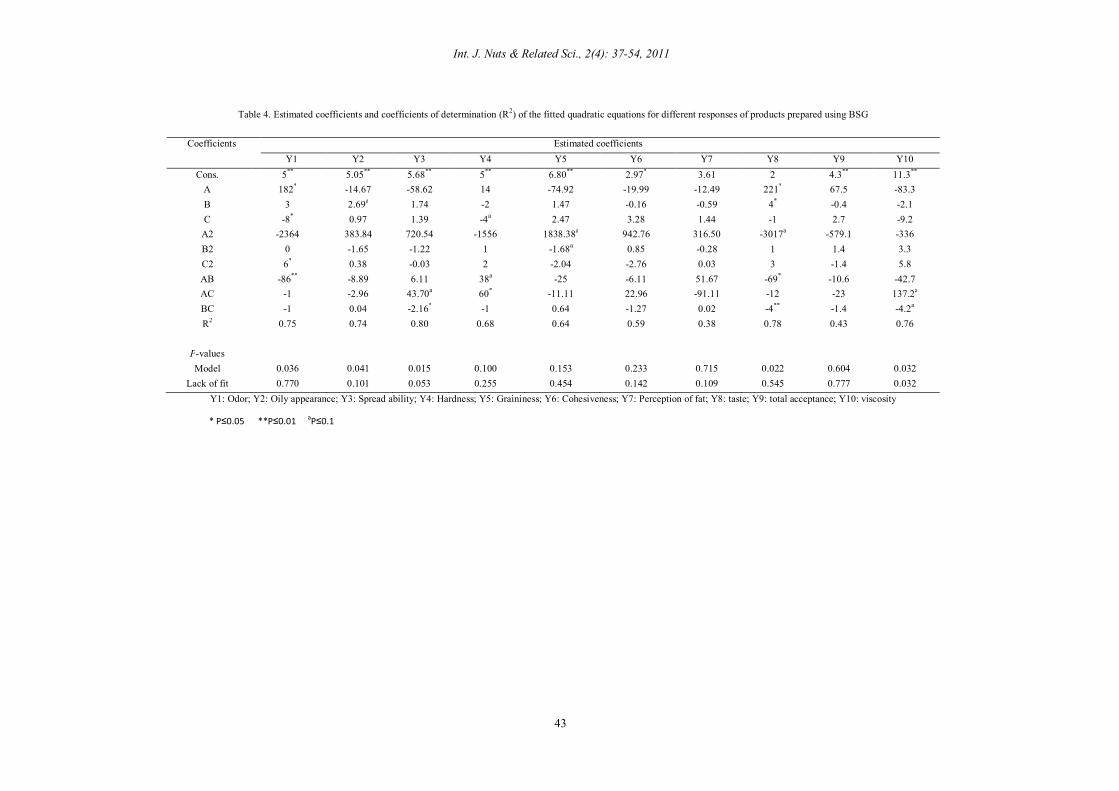
43
Table 4. Estimated coefficients and coefficients of determination (R2) of the fitted quadratic equations for different responses of products prepared using BSG
Coefficients Estimated coefficients Y1 Y2 Y3 Y4 Y5 Y6 Y7 Y8 Y9 Y10
Cons. 5** 5.05** 5.68** 5** 6.80** 2.97* 3.61 2 4.3** 11.3**
A 182* -14.67 -58.62 14 -74.92 -19.99 -12.49 221* 67.5 -83.3 B 3 2.69a 1.74 -2 1.47 -0.16 -0.59 4* -0.4 -2.1 C -8* 0.97 1.39 -4a 2.47 3.28 1.44 -1 2.7 -9.2
A2 -2364 383.84 720.54 -1556 1838.38a 942.76 316.50 -3017a -579.1 -336 B2 0 -1.65 -1.22 1 -1.68a 0.85 -0.28 1 1.4 3.3 C2 6* 0.38 -0.03 2 -2.04 -2.76 0.03 3 -1.4 5.8 AB -86** -8.89 6.11 38a -25 -6.11 51.67 -69* -10.6 -42.7 AC -1 -2.96 43.70a 60* -11.11 22.96 -91.11 -12 -23 137.2a
BC -1 0.04 -2.16* -1 0.64 -1.27 0.02 -4** -1.4 -4.2a
R2
0.75 0.74 0.80 0.68 0.64 0.59 0.38 0.78 0.43 0.76
P-values
Model 0.036 0.041 0.015 0.100 0.153 0.233 0.715 0.022 0.604 0.032
Lack of fit 0.770 0.101 0.053 0.255 0.454 0.142 0.109 0.545 0.777 0.032 Y1: Odor; Y2: Oily appearance; Y3: Spread ability; Y4: Hardness; Y5: Graininess; Y6: Cohesiveness; Y7: Perception of fat; Y8: taste; Y9: total acceptance; Y10: viscosity
* **
a
* P≤0.05 **P≤0.01 aP≤0.1
Int. J. Nuts & Related Sci., 2(4): 37-54, 2011
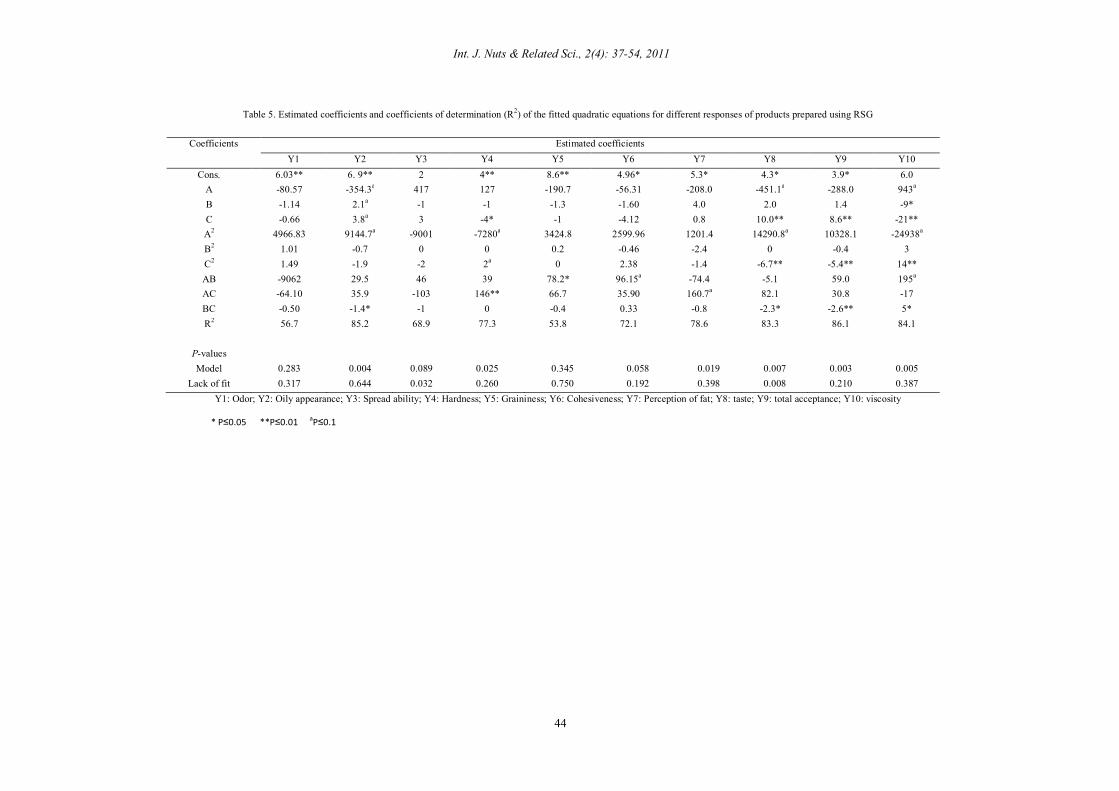
44
Table 5. Estimated coefficients and coefficients of determination (R2) of the fitted quadratic equations for different responses of products prepared using RSG
Coefficients Estimated coefficients Y1 Y2 Y3 Y4 Y5 Y6 Y7 Y8 Y9 Y10
Cons. 6.03** 6. 9** 2 4** 8.6** 4.96* 5.3* 4.3* 3.9* 6.0 A -80.57 -354.3a 417 127 -190.7 -56.31 -208.0 -451.1a -288.0 943a B -1.14 2.1a -1 -1 -1.3 -1.60 4.0 2.0 1.4 -9* C -0.66 3.8a 3 -4* -1 -4.12 0.8 10.0** 8.6** -21** A2 4966.83 9144.7a -9001 -7280a 3424.8 2599.96 1201.4 14290.8a 10328.1 -24938a B2 1.01 -0.7 0 0 0.2 -0.46 -2.4 0 -0.4 3 C2 1.49 -1.9 -2 2a 0 2.38 -1.4 -6.7** -5.4** 14** AB -9062 29.5 46 39 78.2* 96.15a -74.4 -5.1 59.0 195a AC -64.10 35.9 -103 146** 66.7 35.90 160.7a 82.1 30.8 -17 BC -0.50 -1.4* -1 0 -0.4 0.33 -0.8 -2.3* -2.6** 5* R2
P-values
56.7 85.2 68.9 77.3 53.8 72.1 78.6 83.3 86.1 84.1
Model 0.283 0.004 0.089 0.025 0.345 0.058 0.019 0.007 0.003 0.005 Lack of fit 0.317 0.644 0.032 0.260 0.750 0.192 0.398 0.008 0.210 0.387
Y1: Odor; Y2: Oily appearance; Y3: Spread ability; Y4: Hardness; Y5: Graininess; Y6: Cohesiveness; Y7: Perception of fat; Y8: taste; Y9: total acceptance; Y10: viscosity
* **
a
* P≤0.05 **P≤0.01 aP≤0.1
Int. J. Nuts & Related Sci., 2(4): 37-54, 2011
45
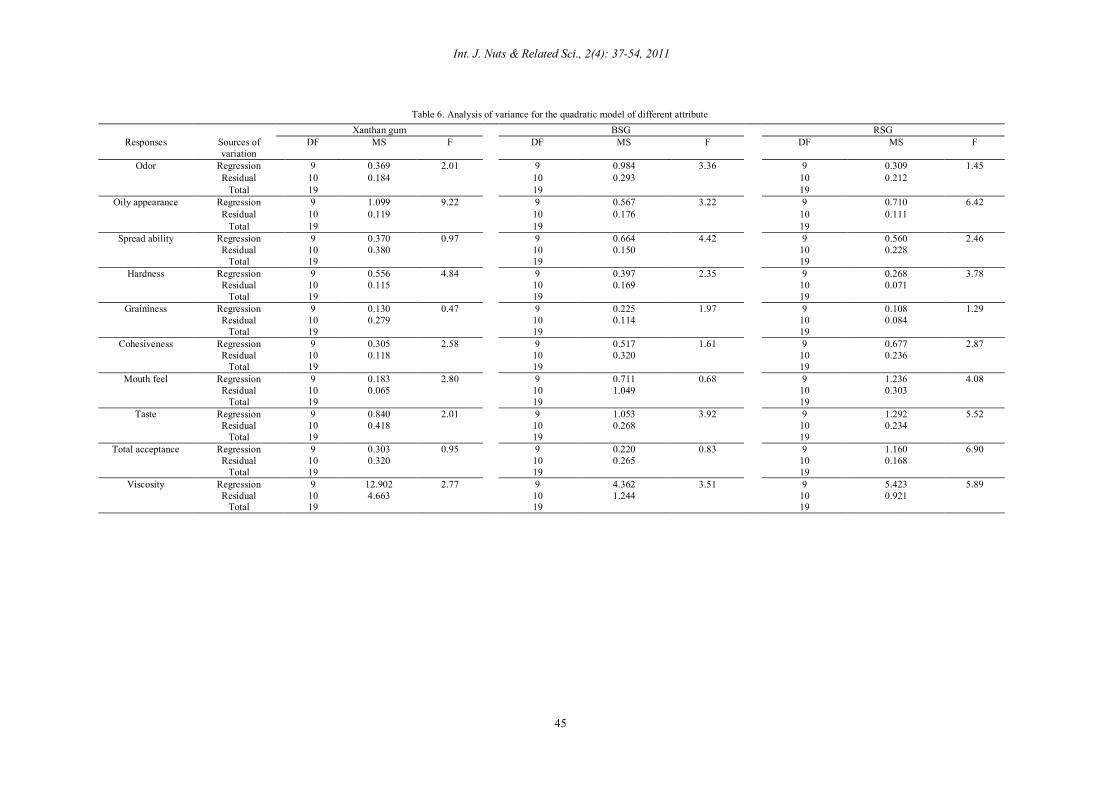
Table 6. Analysis of variance for the quadratic model of different attribute Xanthan gum BSG RSG
Responses Sources of variation
DF MS F DF MS F DF MS F
Odor Regression 9 0.369 2.01 9 0.984 3.36 9 0.309 1.45 Residual 10 0.184 10 0.293 10 0.212
Total 19 19 19 Oily appearance Regression 9 1.099 9.22 9 0.567 3.22 9 0.710 6.42
Residual 10 0.119 10 0.176 10 0.111 Total 19 19 19
Spread ability Regression 9 0.370 0.97 9 0.664 4.42 9 0.560 2.46 Residual 10 0.380 10 0.150 10 0.228
Total 19 19 19 Hardness Regression 9 0.556 4.84 9 0.397 2.35 9 0.268 3.78
Residual 10 0.115 10 0.169 10 0.071 Total 19 19 19
Graininess Regression 9 0.130 0.47 9 0.225 1.97 9 0.108 1.29 Residual 10 0.279 10 0.114 10 0.084
Total 19 19 19 Cohesiveness Regression 9 0.305 2.58 9 0.517 1.61 9 0.677 2.87
Residual 10 0.118 10 0.320 10 0.236 Total 19 19 19
Mouth feel Regression 9 0.183 2.80 9 0.711 0.68 9 1.236 4.08 Residual 10 0.065 10 1.049 10 0.303
Total 19 19 19 Taste Regression 9 0.840 2.01 9 1.053 3.92 9 1.292 5.52
Residual 10 0.418 10 0.268 10 0.234 Total 19 19 19
Total acceptance Regression 9 0.303 0.95 9 0.220 0.83 9 1.160 6.90 Residual 10 0.320 10 0.265 10 0.168
Total 19 19 19 Viscosity Regression 9 12.902 2.77 9 4.362 3.51 9 5.423 5.89
Residual 10 4.663 10 1.244 10 0.921 Total 19 19 19
Int. J. Nuts & Related Sci., 2(4): 37-54, 2011
46
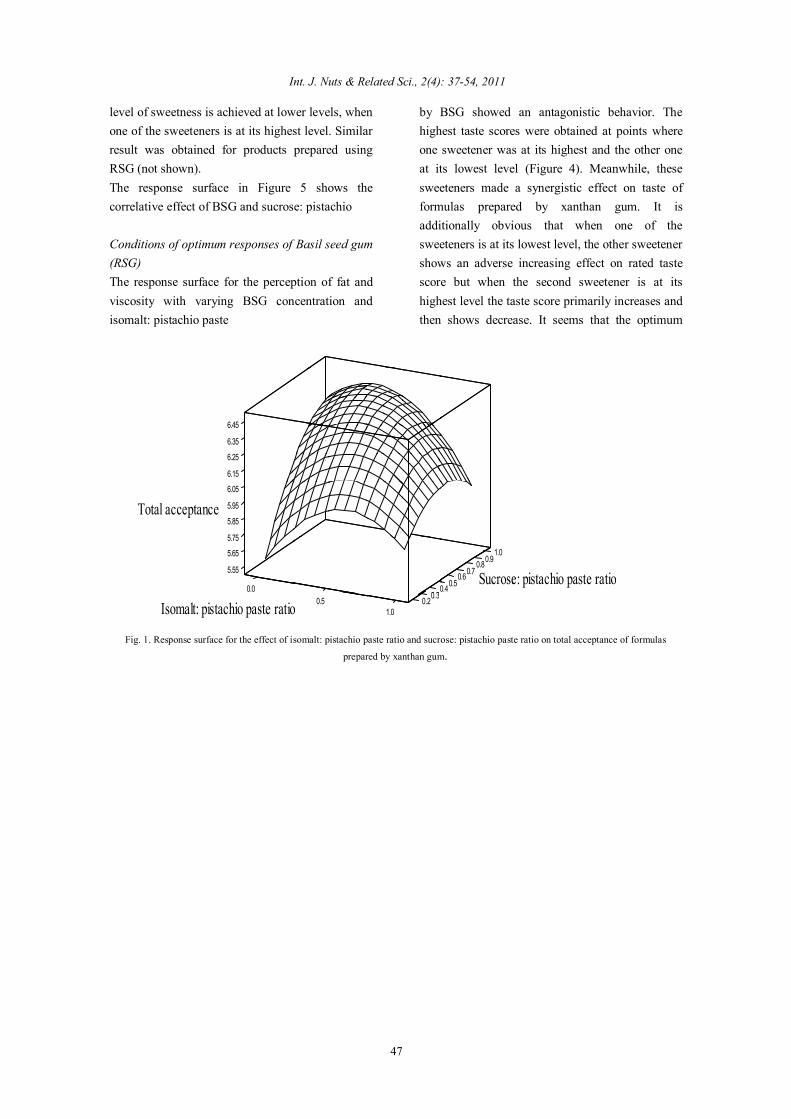
appearance, hardness, taste and viscosity of products containing RSG (P≤0.1). For formula prepared using xanthan gum, isomalt and sucrose individually have a positive significant effect on taste characteristic (P≤0.05) and a negative (P≤0.01) and non-significant effect on viscosity, respectively. However, the interaction of two sweeteners shows a negative significant effect on taste and a significant positive effect on viscosity characteristics. Similar effect of interaction is observed for the taste of formulas containing BSG and RSG (although the effect of isomalt on rated taste score was not significant). Isomalt shows a significant negative linear effect on the viscosity of formulas containing xanthan gum (P≤0.01). There was a significant effect of RSG (P≤0.1) and negative effects of isomalt (P≤0.05) and sucrose (P≤0.01) on the low- fat products. P-values of models and lack of fit are presented in Tables 3, 4 and 5 for xanthan, BSG and RSG, respectively. The analysis of variance was performed to assess how well the model represents the experimental data (Table 6). Results show that in most cases the quadratic regression was adequate for prediction within the range of experiments. Analysis of response surface Conditions of optimum responses of xanthan gum The relationship between dependent and independent variables can be illustrated using three dimensional response surface graphs. Figure 1 shows the interaction effect of isomalt and sucrose: pistachio paste ratios on the rated total acceptance score. By increasing both variables, total acceptance showed an increase. Further increase in the amount of isomalt led to a rapid decrease in total acceptance score, whereas higher levels of sucrose did not make significant changes in total acceptance. Similar effect was observed for the rated scores of taste (not shown). Drewnowski [13] reported that changing the sweetener level will have an adverse effect on overall acceptability. Theunissen & Kroeze [45] suggested the sweetness as a sensation with hedonic meaning. They also mentioned that this hedonic sensation increases with sweetener concentration until an optimum value is reached.
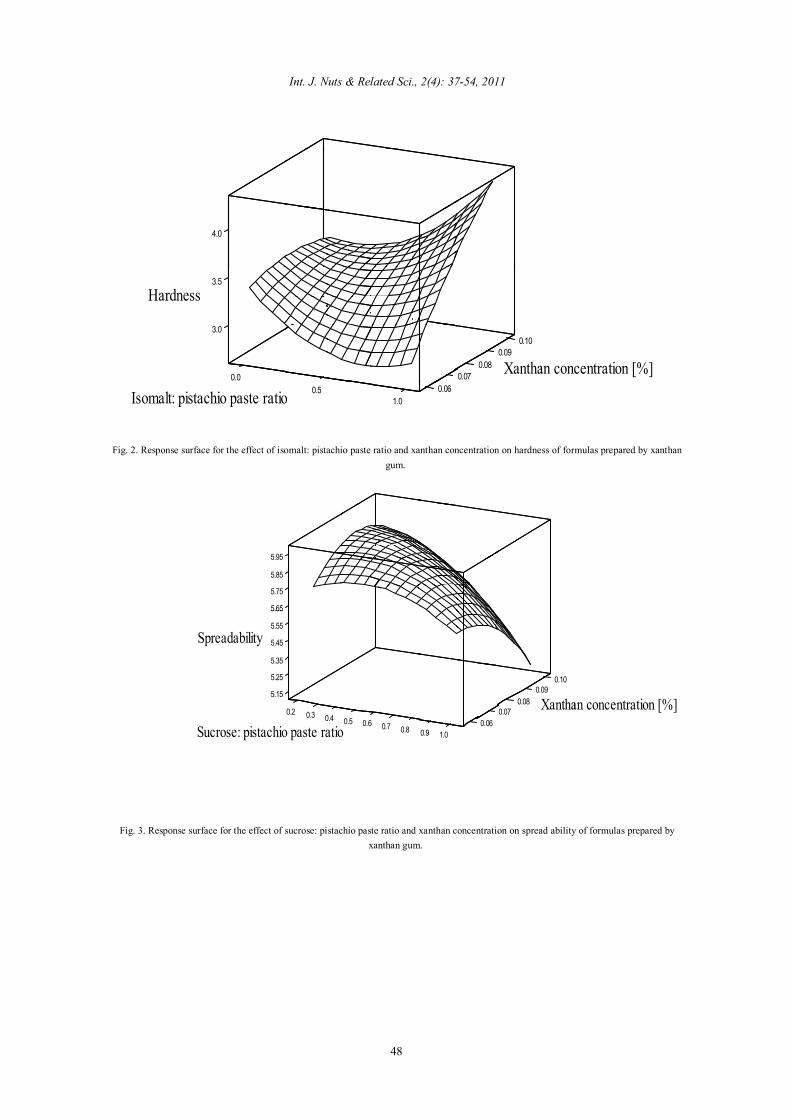
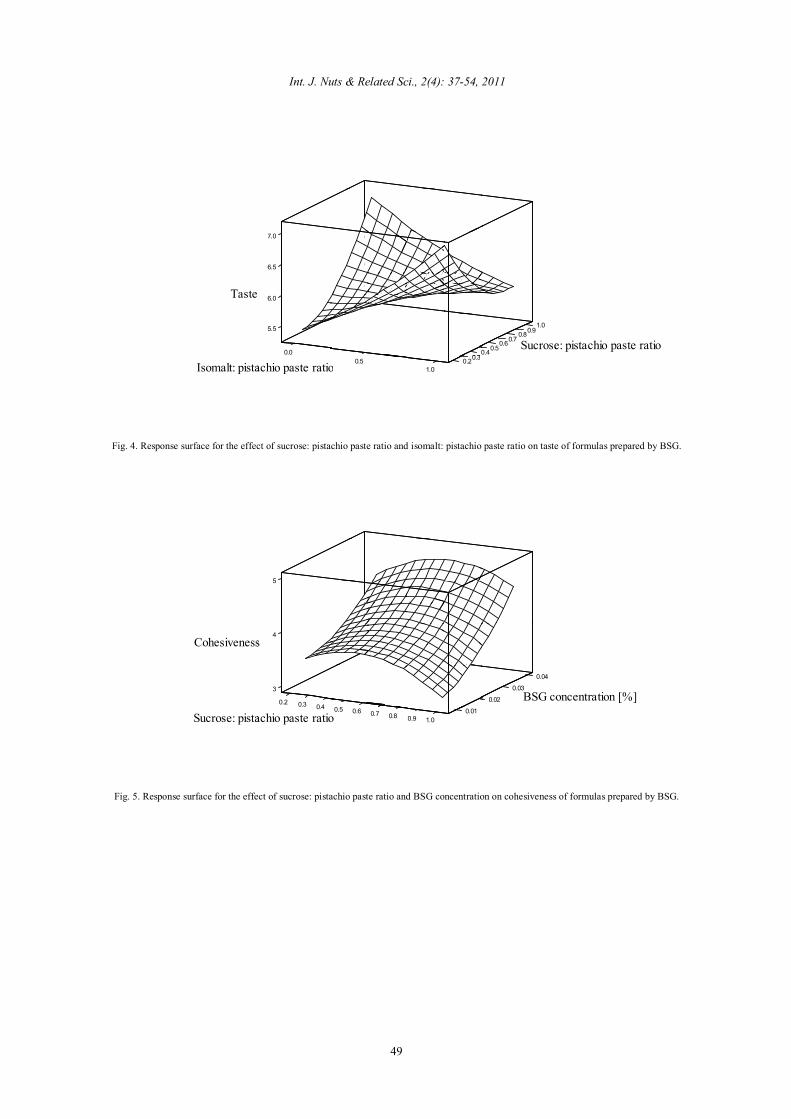
The response surface in Figure 2 shows the combined effects of isomalt: pistachio paste ratio and xanthan concentration on the rated hardness score. The hardness score increased rapidly with the increase in both variables. The effect of isomalt: pistachio paste ratio was markedly shown for higher concentrations of xanthan gum. A reversed effect is oBSGrved at the lowest concentration of fat replacer. It seems that higher concentrations of xanthan increase the hydrocolloid network and subsequently the water holding capacity of network and rated hardness score. The maximum hardness score was attained at the maximum limit of two variables which was an indication of the competition between sweetener and fat replacer in water adsorption. Similar result was also obtained for the interaction between other sweetener and xanthan gum (not shown). Figure 3 shows the response surface of sucrose: pistachio paste ratio and xanthan concentration, indicating that the spreadability of product decreased by increasing the sweetener and fat replacer levels. It was expected according to the results obtained for hardness characteristic. The correlative effect of xanthan concentration and sucrose: pistachio paste ratio on total acceptance score indicates that the total acceptance score is rapidly increased by increasing the gum concentration (not shown). It was found that the panelists have preferred more textured spread. The precise effect of sweetener level on total acceptance was oBSGrved at lower levels of xanthan concentration. According to the fact that higher levels of sucrose can led to higher taste acceptance, it can be concluded that the oBSGrved effect has been resulted from the fat replacer concentration. Earlier Bayarri [6] reported that higher concentrations of hydrocolloid produce a decrease in sweetness intensity, regardless of the type and concentration of sweetener. Other researchers have also shown that the increase in solution viscosity reduces the rated taste sensation at sensory evaluation tests [27, 46]. Conditions of optimum responses of Balangu seed gum (BSG) The interaction effects of sucrose and isomalt: pistachio paste ratios on taste of formula produced
Int. J. Nuts & Related Sci., 2(4): 37-54, 2011
47
by BSG showed an antagonistic behavior. The highest taste scores were obtained at points where one sweetener was at its highest and the other one at its lowest level (Figure 4). Meanwhile, these sweeteners made a synergistic effect on taste of formulas prepared by xanthan gum. It is additionally obvious that when one of the sweeteners is at its lowest level, the other sweetener shows an adverse increasing effect on rated taste score but when the second sweetener is at its highest level the taste score primarily increases and then shows decrease. It seems that the optimum
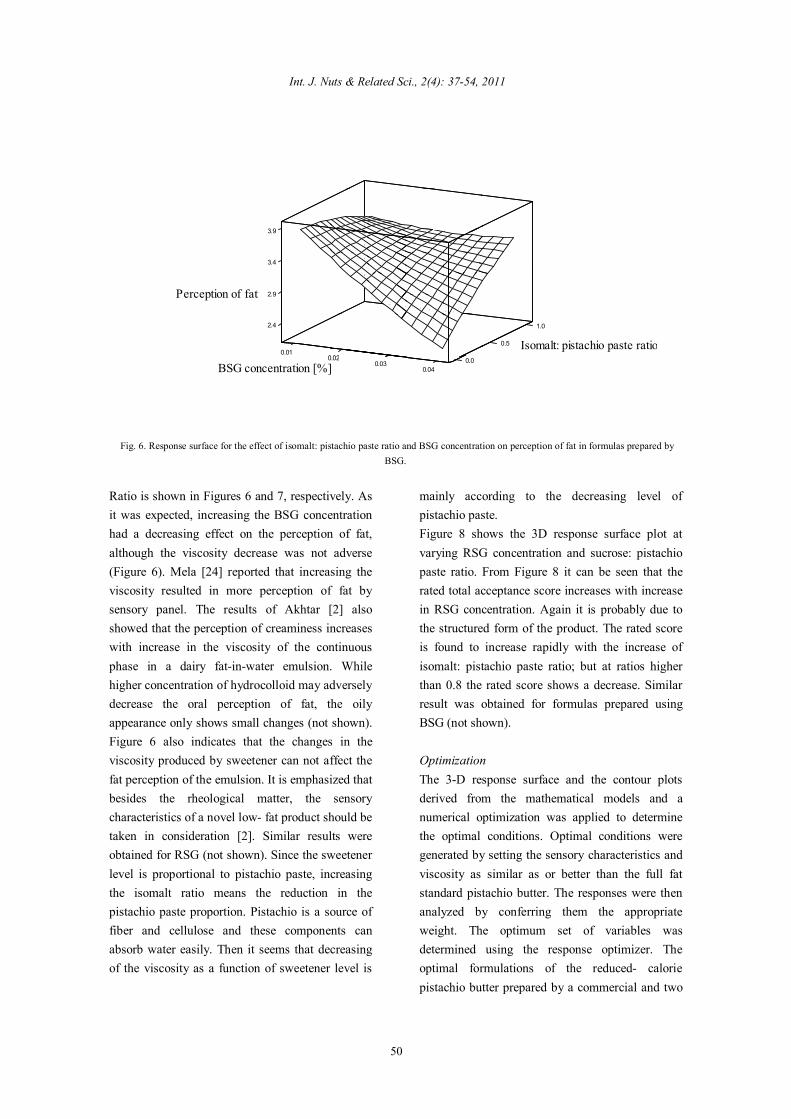
level of sweetness is achieved at lower levels, when one of the sweeteners is at its highest level. Similar result was obtained for products prepared using RSG (not shown). The response surface in Figure 5 shows the correlative effect of BSG and sucrose: pistachio Conditions of optimum responses of Basil seed gum (RSG) The response surface for the perception of fat and viscosity with varying BSG concentration and isomalt: pistachio paste
Total acceptance
Isomalt: pistachio paste ratio0.0
0.5Isomalt: pistachio paste ratio0.0
5.55
5.65
5.75
5.85
5.95
6.05
6.15
6.25
6.35
6.45
0.40.3
1.00.20.3
1.00.90.8
0.70.6 Sucrose: pistachio paste ratio0.50.4Sucrose: pistachio paste ratio
Fig. 1. Response surface for the effect of isomalt: pistachio paste ratio and sucrose: pistachio paste ratio on total acceptance of formulas
prepared by xanthan gum.
Int. J. Nuts & Related Sci., 2(4): 37-54, 2011
48
Hardness
Isomalt: pistachio paste ratio0.0
0.5Isomalt: pistachio paste ratio0.0
3.0
3.5
Hardness
4.0
0.061.0
0.100.09
0.08 Xanthan concentration [%]0.07 Xanthan concentration [%]
Fig. 2. Response surface for the effect of isomalt: pistachio paste ratio and xanthan concentration on hardness of formulas prepared by xanthan gum.
0.2
5.15
0.3
5.25
5.35
5.45
0.4
5.55
5.65
0.5 0.6 0.7 0.8
Spreadability
Sucrose: pistachio paste ratio
5.65
5.75
5.85
5.95
0.90.06
1.0
0.100.09
0.08 Xanthan concentration [%]0.07 Xanthan concentration [%]
Fig. 3. Response surface for the effect of sucrose: pistachio paste ratio and xanthan concentration on spread ability of formulas prepared by xanthan gum.
Int. J. Nuts & Related Sci., 2(4): 37-54, 2011
49
Taste
Isomalt: pistachio paste ratio0.0
0.5Isomalt: pistachio paste ratio0.0
5.5
6.0Taste
6.5
7.0
0.40.3
1.00.20.3
1.00.90.8
0.70.6 Sucrose: pistachio paste ratio0.50.4Sucrose: pistachio paste ratio
Fig. 4. Response surface for the effect of sucrose: pistachio paste ratio and isomalt: pistachio paste ratio on taste of formulas prepared by BSG.
Cohesiveness
Sucrose: pistachio paste ratio0.3 0.4 0.5 0.6 0.7 0.8Sucrose: pistachio paste ratio
0.2
3
0.3 0.4
4Cohesiveness
5
0.90.01
1.0
0.04
0.03BSG concentration [%]0.02 BSG concentration [%]
Fig. 5. Response surface for the effect of sucrose: pistachio paste ratio and BSG concentration on cohesiveness of formulas prepared by BSG.
Int. J. Nuts & Related Sci., 2(4): 37-54, 2011
50
Perception of fat
BSG concentration [%]0.01
0.020.03BSG concentration [%]
0.01
2.4
2.9
0.02
Perception of fat
0.02
3.4
3.9
0.00.04
1.0
0.5 Isomalt: pistachio paste ratioIsomalt: pistachio paste ratio
Fig. 6. Response surface for the effect of isomalt: pistachio paste ratio and BSG concentration on perception of fat in formulas prepared by BSG.
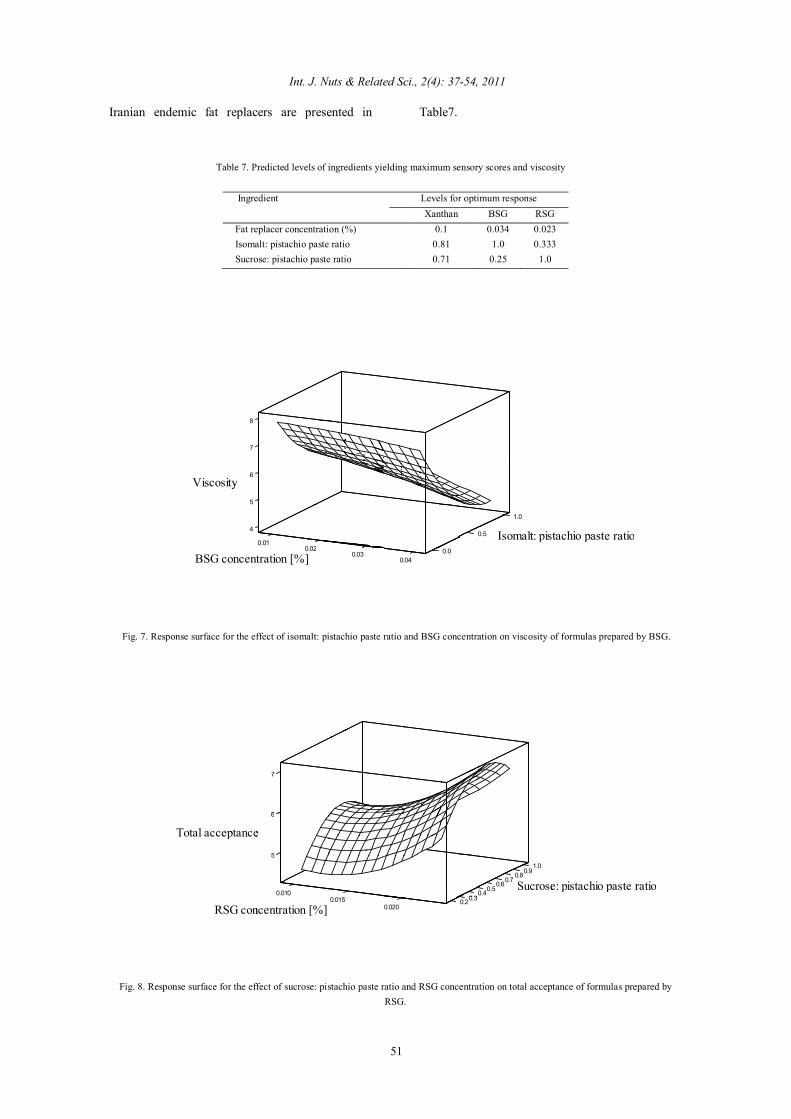
Ratio is shown in Figures 6 and 7, respectively. As it was expected, increasing the BSG concentration had a decreasing effect on the perception of fat, although the viscosity decrease was not adverse (Figure 6). Mela [24] reported that increasing the viscosity resulted in more perception of fat by sensory panel. The results of Akhtar [2] also showed that the perception of creaminess increases with increase in the viscosity of the continuous phase in a dairy fat-in-water emulsion. While higher concentration of hydrocolloid may adversely decrease the oral perception of fat, the oily appearance only shows small changes (not shown). Figure 6 also indicates that the changes in the viscosity produced by sweetener can not affect the fat perception of the emulsion. It is emphasized that besides the rheological matter, the sensory characteristics of a novel low- fat product should be taken in consideration [2]. Similar results were obtained for RSG (not shown). Since the sweetener level is proportional to pistachio paste, increasing the isomalt ratio means the reduction in the pistachio paste proportion. Pistachio is a source of fiber and cellulose and these components can absorb water easily. Then it seems that decreasing of the viscosity as a function of sweetener level is
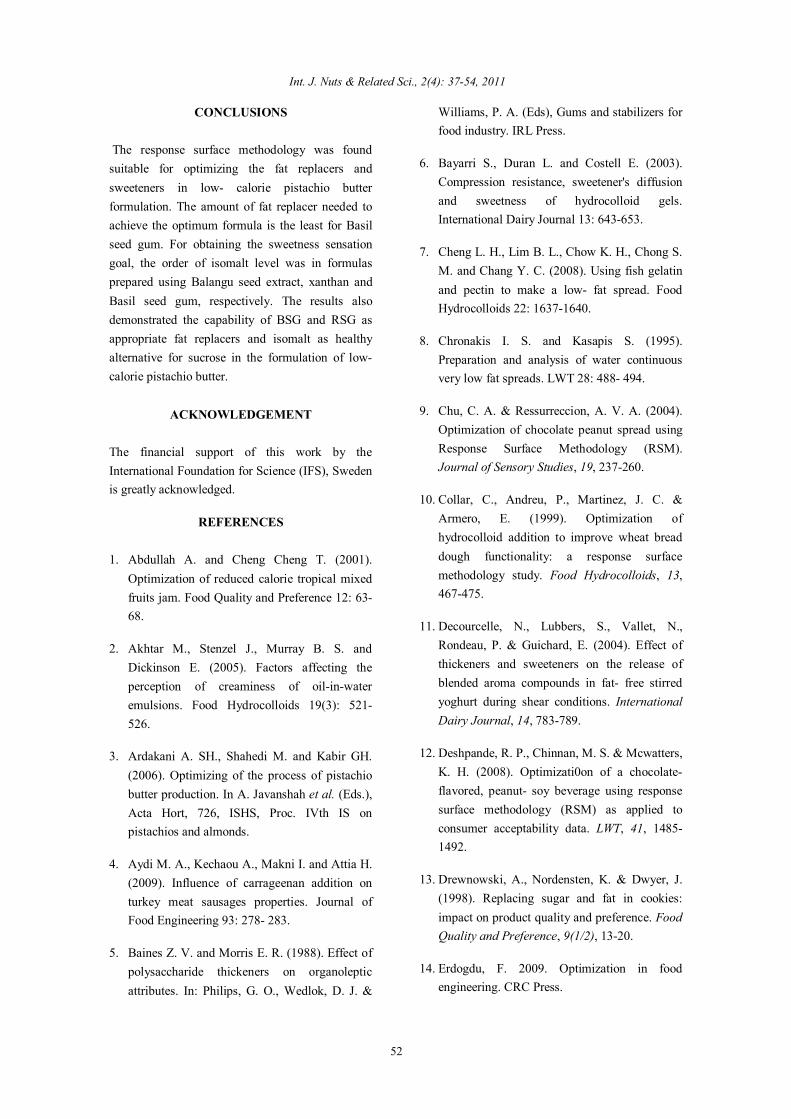
mainly according to the decreasing level of pistachio paste. Figure 8 shows the 3D response surface plot at varying RSG concentration and sucrose: pistachio paste ratio. From Figure 8 it can be seen that the rated total acceptance score increases with increase in RSG concentration. Again it is probably due to the structured form of the product. The rated score is found to increase rapidly with the increase of isomalt: pistachio paste ratio; but at ratios higher than 0.8 the rated score shows a decrease. Similar result was obtained for formulas prepared using BSG (not shown). Optimization The 3-D response surface and the contour plots derived from the mathematical models and a numerical optimization was applied to determine the optimal conditions. Optimal conditions were generated by setting the sensory characteristics and viscosity as similar as or better than the full fat standard pistachio butter. The responses were then analyzed by conferring them the appropriate weight. The optimum set of variables was determined using the response optimizer. The optimal formulations of the reduced- calorie pistachio butter prepared by a commercial and two
Int. J. Nuts & Related Sci., 2(4): 37-54, 2011
51
Iranian endemic fat replacers are presented in Table7.
Table 7. Predicted levels of ingredients yielding maximum sensory scores and viscosity
Viscosity
BSG concentration [%]0.01
0.020.03BSG concentration [%]
0.01
4
5
6
0.02
Viscosity
0.02
7
8
0.00.04
1.0
0.5 Isomalt: pistachio paste ratioIsomalt: pistachio paste ratio
Fig. 7. Response surface for the effect of isomalt: pistachio paste ratio and BSG concentration on viscosity of formulas prepared by BSG.
Total acceptance
RSG concentration [%]0.010
0.0150.020RSG concentration [%]
0.010
5
6
Total acceptance6
7
0.40.30.20.3
1.00.90.8
0.70.6 Sucrose: pistachio paste ratio0.50.4Sucrose: pistachio paste ratio
Fig. 8. Response surface for the effect of sucrose: pistachio paste ratio and RSG concentration on total acceptance of formulas prepared by RSG.
Ingredient Levels for optimum response Xanthan BSG RSG Fat replacer concentration (%) 0.1 0.034 0.023 Isomalt: pistachio paste ratio 0.81 1.0 0.333 Sucrose: pistachio paste ratio 0.71 0.25 1.0
Int. J. Nuts & Related Sci., 2(4): 37-54, 2011
52
CONCLUSIONS
The response surface methodology was found suitable for optimizing the fat replacers and sweeteners in low- calorie pistachio butter formulation. The amount of fat replacer needed to achieve the optimum formula is the least for Basil seed gum. For obtaining the sweetness sensation goal, the order of isomalt level was in formulas prepared using Balangu seed extract, xanthan and Basil seed gum, respectively. The results also demonstrated the capability of BSG and RSG as appropriate fat replacers and isomalt as healthy alternative for sucrose in the formulation of low- calorie pistachio butter.
ACKNOWLEDGEMENT The financial support of this work by the International Foundation for Science (IFS), Sweden is greatly acknowledged.
REFERENCES 1. Abdullah A. and Cheng Cheng T. (2001).
Optimization of reduced calorie tropical mixed fruits jam. Food Quality and Preference 12: 63-68.
2. Akhtar M., Stenzel J., Murray B. S. and Dickinson E. (2005). Factors affecting the perception of creaminess of oil-in-water emulsions. Food Hydrocolloids 19(3): 521- 526.
3. Ardakani A. SH., Shahedi M. and Kabir GH. (2006). Optimizing of the process of pistachio butter production. In A. Javanshah et al. (Eds.), Acta Hort, 726, ISHS, Proc. IVth IS on pistachios and almonds.
4. Aydi M. A., Kechaou A., Makni I. and Attia H. (2009). Influence of carrageenan addition on turkey meat sausages properties. Journal of Food Engineering 93: 278- 283.
5. Baines Z. V. and Morris E. R. (1988). Effect of polysaccharide thickeners on organoleptic attributes. In: Philips, G. O., Wedlok, D. J. &
Williams, P. A. (Eds), Gums and stabilizers for food industry. IRL Press.
6. Bayarri S., Duran L. and Costell E. (2003). Compression resistance, sweetener's diffusion and sweetness of hydrocolloid gels. International Dairy Journal 13: 643-653.
7. Cheng L. H., Lim B. L., Chow K. H., Chong S. M. and Chang Y. C. (2008). Using fish gelatin and pectin to make a low- fat spread. Food Hydrocolloids 22: 1637-1640.
8. Chronakis I. S. and Kasapis S. (1995). Preparation and analysis of water continuous very low fat spreads. LWT 28: 488- 494.
9. Chu, C. A. & Ressurreccion, A. V. A. (2004). Optimization of chocolate peanut spread using Response Surface Methodology (RSM). Journal of Sensory Studies, 19, 237-260.
10. Collar, C., Andreu, P., Martinez, J. C. & Armero, E. (1999). Optimization of hydrocolloid addition to improve wheat bread dough functionality: a response surface methodology study. Food Hydrocolloids, 13, 467-475.
11. Decourcelle, N., Lubbers, S., Vallet, N., Rondeau, P. & Guichard, E. (2004). Effect of thickeners and sweeteners on the release of blended aroma compounds in fat- free stirred yoghurt during shear conditions. International Dairy Journal, 14, 783-789.
12. Deshpande, R. P., Chinnan, M. S. & Mcwatters, K. H. (2008). Optimizati0on of a chocolate- flavored, peanut- soy beverage using response surface methodology (RSM) as applied to consumer acceptability data. LWT, 41, 1485-1492.
13. Drewnowski, A., Nordensten, K. & Dwyer, J. (1998). Replacing sugar and fat in cookies: impact on product quality and preference. Food Quality and Preference, 9(1/2), 13-20.
14. Erdogdu, F. 2009. Optimization in food engineering. CRC Press.
Int. J. Nuts & Related Sci., 2(4): 37-54, 2011
53
15. Evans, L. B. (1982). Optimization theory and its application in food processing. Food technology, 36: 88.
16. FAO/WHO, Codex Alimentarius, CAC/GL 23-1997, Guidelines for the use of nutrition claims.
17. Food and Agriculture Organization of the United Nations (FAO). 2008. Major Food and Agricultural Commodities and Producers: Pistachios (2005). Food and Agriculture Organization of the United Nations, The Statistics Division. Retrieved April 9, 2008.
18. Gan, H. E., Karim, R., Muhammad, S. K. S., Bakar, J. A., Hashim, D. M. & Rahman, R. Abd. (2007). Optimization of the basic formulation of a traditional baked cassava cake using response surface methodology. LWT, 40, 611- 618.
19. Gao, Y. L. & Ju, X. R. (2007). Statistical prediction of effects of food composition on reduction of Bacillus subtilis As 1.1731 spores suspended in food matrices treated with high pressure. Journal of Food Engineering, 82(1), 68-76.
20. Hosseini-Parvar, S. H., Mortazavi, S. A., Razavi, S. M., Merino, L. M. & Goh, K. K. T. (2010). Steady shear flow behavior of gum extracted from Ocimum basilicum L. seed: Effect of concentration and temperature. Journal of Food Engineering, Revised manuscript.
21. Hough, G., Sanchez, R., Barbieri, T. & Martinez, E. (1997). Sensory optimization of a powdered chocolate milk formula. Food Quality and Preference, 8(3), 213-221.
22. Johansen, S. B., Naes, T., Oyass, J. & Hersleth, M. (2010). Acceptance of calorie- reduced yoghurt: effect of sensory characteristics and product information. Food Quality and Preference, 21, 13- 21.
23. Kumar, P. & Mishra, H. N. (2003). Optimization of mango soy fortified formulation using response surface
methodology. International Journal of Food Properties, 6(3), 499-517.
24. Mela, D. J., Langley, K. R. & Martin, A. (1994). Sensory assessment of fat content: effect of emulsion and subject characteristics. Appetite, 22, 67- 81.
25. Mitchell, H. (2006). Sweeteners and sugar alternatives in food technology, Chennai: Blackwell Publishing.
26. Mohammad Amini, A. (2007). Modeling and optimization of mucilage extraction from Lallemantia royleana: a response surface – genetic algorithm approach. EFFOST/EHEDG Joint Conference. 14-16 November, Lisbon-Portugal.
27. Moskowitz, H. R. & Arabie, P. (1970). Taste intensity a function of stimulus concentration and solvent viscosity. Journal of Texture Studies, 1, 502-510.
28. Nabors, L. B. (2001). Alternative sweeteners, 3rd edition, New York: Marcel Dekker, Inc.
29. Naghibi, F., Mosaddegh, M., Mohammadi Motamed, S. & Ghorbani, A. (2005). Labiatae family in folk medicine in Iran: from ethnobotany to pharmacology. Iranian Journal of Pharmaceutical Research, 2, 63-79.
30. Parke, S. A., Birch, G. G., Portmann, M. O. & Kilcast, D. (1999). A study of the solution properties of selected binary mixtures of bulk and intense sweeteners in relation to their psychophysical characteristics. Food Chemistry, 67, 247- 259.
31. Qiu, L., Zhao, G., Wu, H., Jiang, L., Li, X. & LIU, J. (2010). Investigation of combined effects of independent variables on extraction of pectin from banana peel using response surface methodology. Carbohydrate Polymers, doi: 10.1016/j.carbpol.2010.01.018.
32. Razavi, S., M., A., Habibi Najafi, M., B. & Alaee, Z. (2008a). Rheological characterization of low fat sesame paste blended with date
Int. J. Nuts & Related Sci., 2(4): 37-54, 2011
54
syrup. International Journal of Food Properties, 11, 92-101.
33. Razavi, S. M. A., Mohammadi Moghaddam, T. & Mohammad Amini, A. (2008b). Physico-mechanic and chemical properties of Balangu seed. International Journal of Food Engineering, 4 (5), 1-12.
34. Razavi, S. M. A., Emadzadeh, B. & Mohammadi Moghaddam, T. (2009a). Synergistic interaction of Balangu seed gum with selected food hydrocolloids: The rheological investigation. In E. J. Windhab, & P. Fischer. Proceedings of the 5th International Symposium on Food Rheology and Structure, Zurich, Switzerland.
35. Razavi, S. M. A., Mortazavi, S. A., Merino, L. M., Hosseini-Parvar, S. H., Motamedzadegan, A. & Khanipour, E. (2009b). Optimization study of gum extraction from Basil seeds (Ocimum basilicum L.). International Journal of Food Science and Technology, 44, 1755- 1762.
36. Razavi, S.M.A., Bostan, A., & Rezaie, M., (2010). Image processing and physico-mechanical properties of Basil seed (Ocimum Basilicum), Journal of Food Process Engineering, 33 (1), 51-64.
37. Rodriguez, J. (1998). Recent advances in the development of low- fat cheeses. Trends in Food Science and Technology, 9, 249-254.
38. Roller, S. & Jones, S. A. (1996). Handbook of fat replacers, CRC Press.
39. Sokmen, A. & Gunes, G. (2006). Influence of some bulk sweeteners on rheological properties of chocolate. LWT, 39, 1053-1058.
40. Sun, Y. & Liu, J. (2010). Application of response surface methodology for optimization of polysaccharides production parameters from the roots of Codonopsis pilosula by a central composite design. Carbohydrate polymers, doi: 10.1016/j.carbpol.2010.01.011.
41. Swenson, B. J., Wendorff, W. L. & Lindsay, R. C. (2000). Effects of ingredients on the functionality of fat- free process cheese spreads. Journal of Food Science, 65(5), 822-825.
42. Taylor, T. P. (2006). Evaluation of the bulk sweetener D-Tagatose and the high intensity sweetener Splenda as sugar replacers in cookies. Ph.D. thesis, Auburn University.
43. Telcioglu, A. & Kayacier, A. (2007). The effect of sweeteners and milk type on the rheological properties of reduced calorie Salep drink. African Journal of Biotechnology, 6(4), 465- 469.
44. Thakur, S. & Saxena, D. C. (2000). Formulation of extruded snack food (gum based cereal- pulse blend): Optimization of ingredients levels using response surface methodology. LWT, 33, 354-361.
45. Theunissen, M. M. J. & Kroeze, J. H. A. (1995). The effect of sweeteners on perceived viscosity. Chemical senses, 20(4), 441-450.
46. Vaisey, M., Brunon, M. & Cooper, J. (2006). Some sensory effects of hydrocolloid sols on sweetness. Journal of Food Science, 34(5), 397-400.
47. Yeh, J. Y., Phillips, R. D. & Hung, Y. C. (2003). Optimizing protein- and vitamin- fortified peanut spreads containing soybean or milk powder. Journal of Food Quality, 26, 243-256.