Embed Size (px)
Citation preview
1
Intangible Assets, Value Relevance, and Accounting Anomalies
Wanncherng WangProfessor of Accounting
Department of Business AdministrationCollege of Management
National Sun Yat-Sen UniversityNo. 70, Lienhai Rd., Kaohsiung 80424 Taiwan, R.O.C.
Email: [email protected]: +886-7-525-4511
2
Research Background
• Value drivers of firms—tangibles or intangibles• Market valuation vs accounting valuation– Market value and book value; – Accounting and economic earnings have been an
unsolved issue in equity valuation.• The valuation model--the relationship
between earnings, book value and share prices.
3
Motivations
• Information contents of financial statements– Does intangibles estimated from accounting
information predict future earnings?• Low explanatory power of book value and
earnings– Do intangibles thus estimated have explanatory
power for market value– Do intangibles thus estimated predict future
returns?
4
Hypothesis Development
1. Incremental Explanatory Power for Stock Prices and Future Earnings– Recognition of intangibles is inconsistent across firms.
• Internally developed intangibles are not recognized as assets whereas acquired intangibles, e.g., through a purchase business combination, typically are recognized and amortized against net income over the intangible’s estimated useful life.
– Second, changes in intangible values largely are unaccounted for regardless of their magnitude.
– Third, expenditures that increase intangible values are expensed in the period incurred rather than capitalized, e.g., advertisement expenditures
5
Intangibles and Reported Earnings• Simply put, all these accounting treatments
can result in firms that invest in intangible development reporting depressed earnings when their intangible values are increasing. Consequently, it seems reasonable to expect that a portion of firm value is missing from book value. In other words, there is a missing part in the link between book value and market value—the intangible asset.
6
The Price-Book Relation
• H1: Intangible assets have incremental explanatory power for the price-book relation.
7
Intangibles and Future Earnings• The presence of intangible assets represents
future excess earnings ability. One can use book value to predict future earnings in the sense that earnings are created from investment. – Therefore, future earnings based on recognized book
value will be underestimated when intangible assets are missing from book value.
– Inclusion of intangible assets will increase the predictive ability of book value for future earnings.
8
Predictive Ability for Future Earnings
• Therefore, the following hypothesis obtains.
• H2: Intangible assets have predictive ability for future earnings, incremental to book value and current earnings.
9
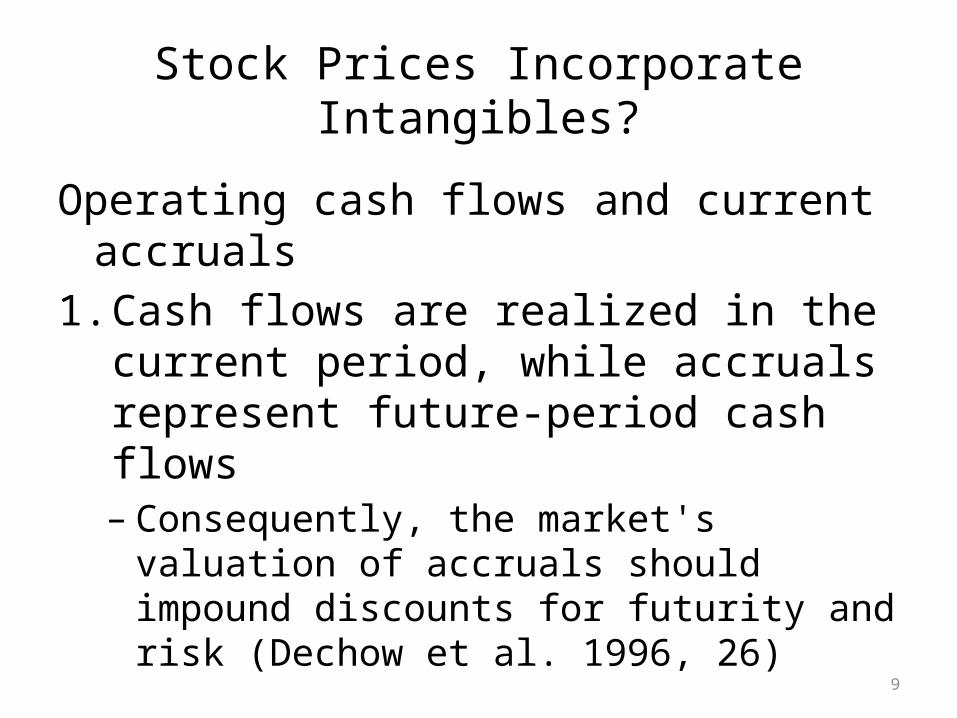
Stock Prices Incorporate Intangibles?
Operating cash flows and current accruals1. Cash flows are realized in the current period,
while accruals represent future-period cash flows– Consequently, the market's valuation of accruals
should impound discounts for futurity and risk (Dechow et al. 1996, 26)
10
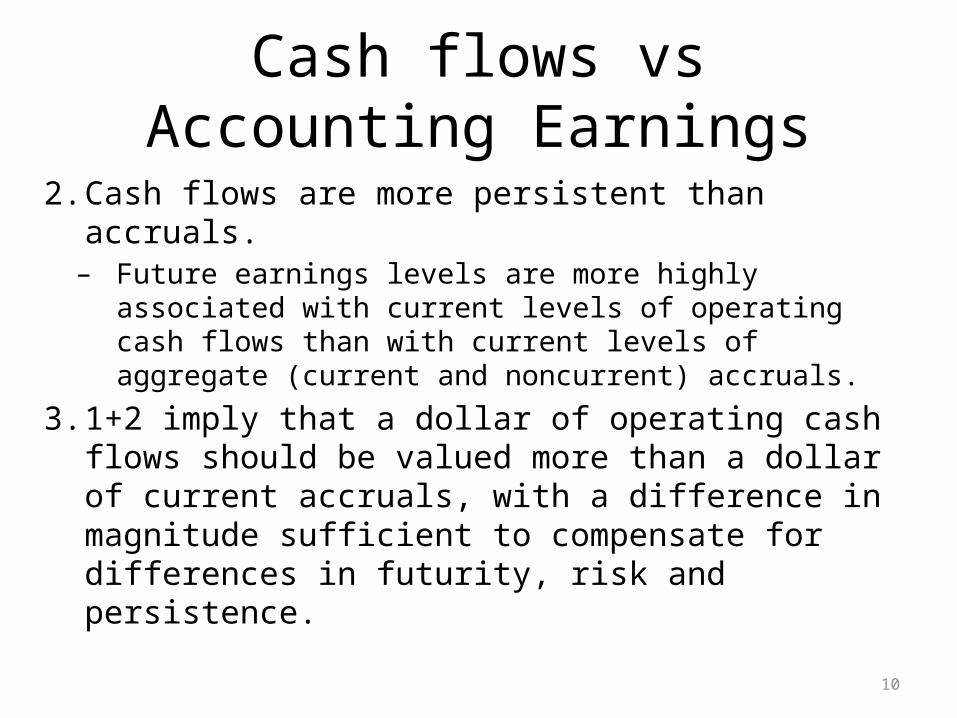
Cash flows vs Accounting Earnings
2. Cash flows are more persistent than accruals. – Future earnings levels are more highly associated
with current levels of operating cash flows than with current levels of aggregate (current and noncurrent) accruals.
3. 1+2 imply that a dollar of operating cash flows should be valued more than a dollar of current accruals, with a difference in magnitude sufficient to compensate for differences in futurity, risk and persistence.
11
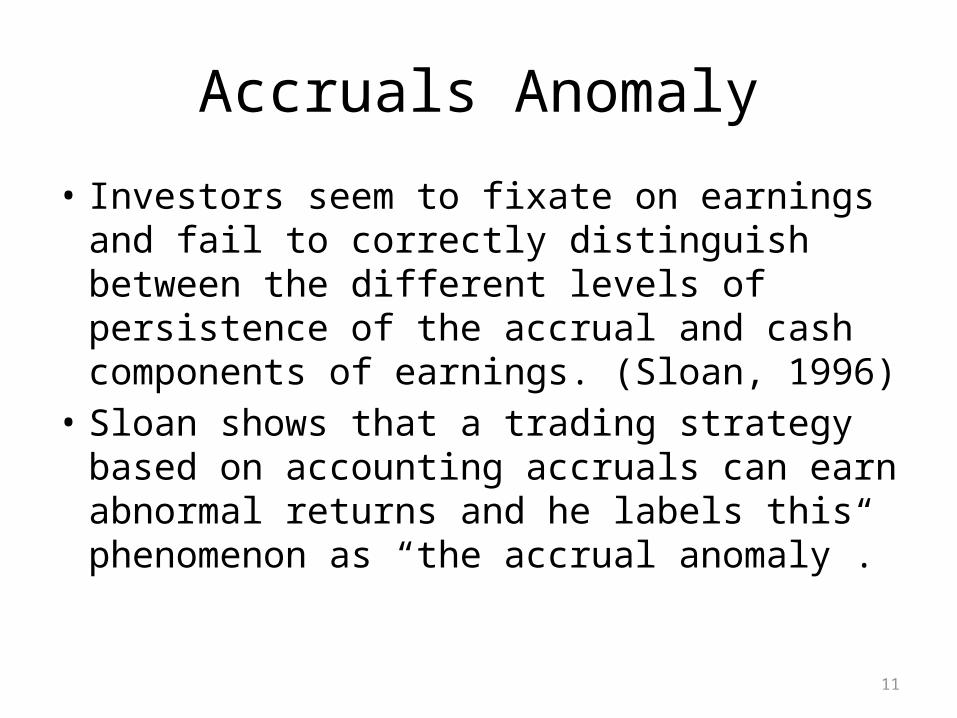
Accruals Anomaly
• Investors seem to fixate on earnings and fail to correctly distinguish between the different levels of persistence of the accrual and cash components of earnings. (Sloan, 1996)
• Sloan shows that a trading strategy based on accounting accruals can earn abnormal returns and he labels this phenomenon as “the accrual anomaly”.
12
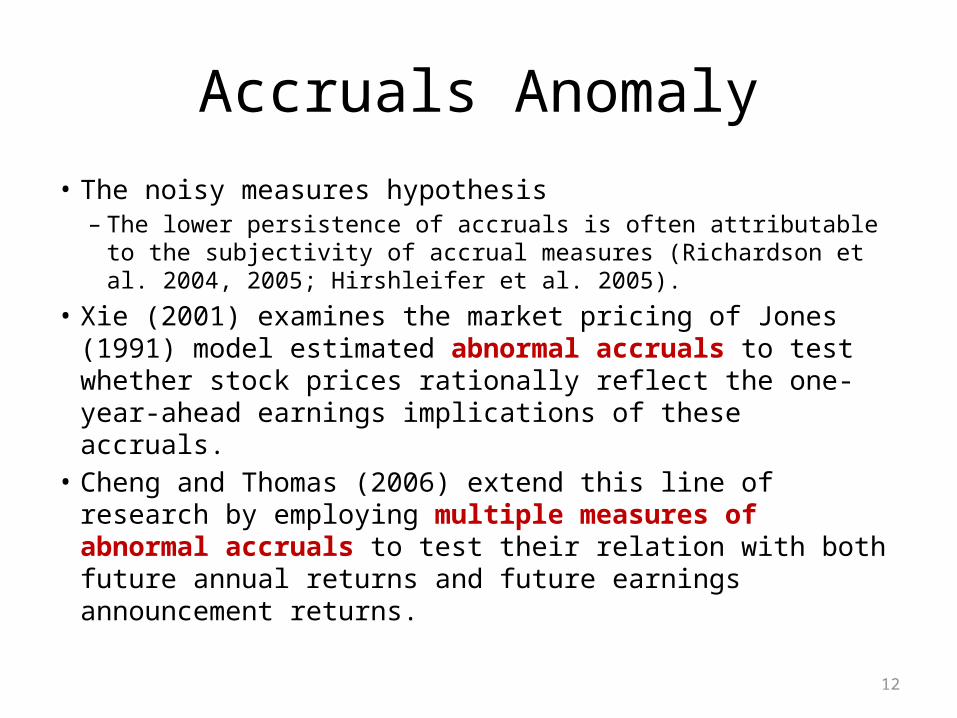
Accruals Anomaly
• The noisy measures hypothesis– The lower persistence of accruals is often attributable to the
subjectivity of accrual measures (Richardson et al. 2004, 2005; Hirshleifer et al. 2005).
• Xie (2001) examines the market pricing of Jones (1991) model estimated abnormal accruals to test whether stock prices rationally reflect the one-year-ahead earnings implications of these accruals.
• Cheng and Thomas (2006) extend this line of research by employing multiple measures of abnormal accruals to test their relation with both future annual returns and future earnings announcement returns.
13
Do the stock market incorporate information regarding future
capabilities contained in intangible assets?
• Intangible assets sustain earnings and growth persistence– one can expect a relationship between intangible assets and
earnings.• intangible assets also introduce measurement errors into
book value and earnings, – obscuring the predictability and raising the uncertainty of
future earnings.
14
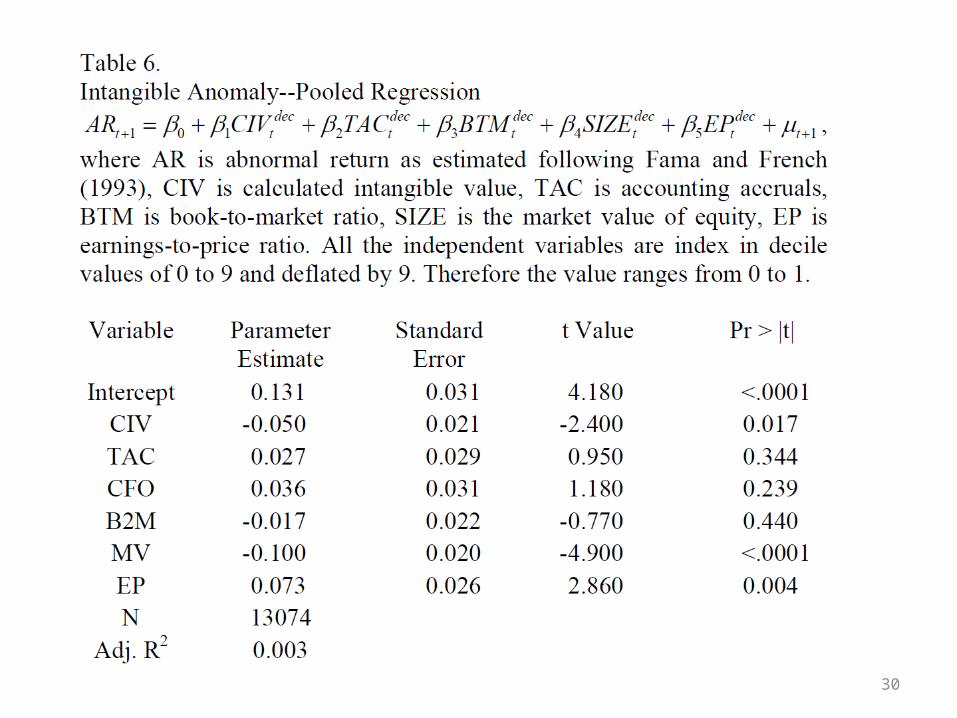
Intangible Anomaly
• Given the conflicting influences of intangible assets in market valuation, an interesting question is whether and how the share market values intangibles.
• If share prices are unable to fully reflect the implications of intangibles for firms’ future performance, one can expect a higher-than-normal returns for firms with higher intangibles (CIV).
15
Intangible Anomaly
• In particular, current share prices will underestimate the share values of firms with high CIV, leading to future positive abnormal returns. Therefore,
• H3: The share market fully reflects the implications of intangibles regarding future earnings.
16
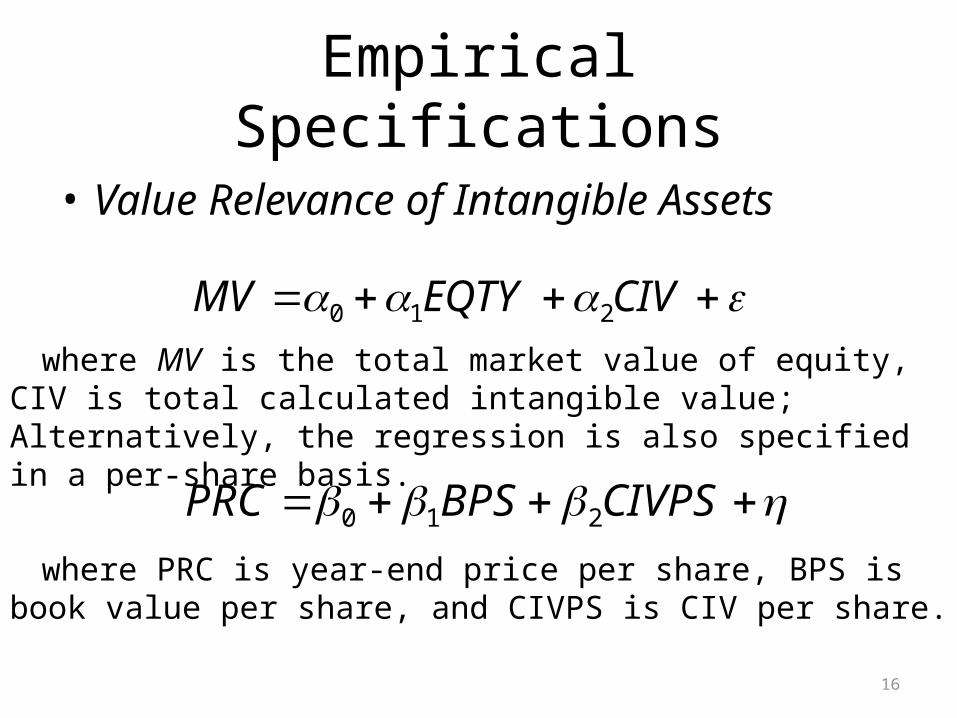
Empirical Specifications
• Value Relevance of Intangible Assets
CIVEQTYMV 210
where MV is the total market value of equity, CIV is total calculated intangible value; Alternatively, the regression is also specified in a per-share basis.
CIVPSBPSPRC 210
where PRC is year-end price per share, BPS is book value per share, and CIVPS is CIV per share.
17
Empirical Model
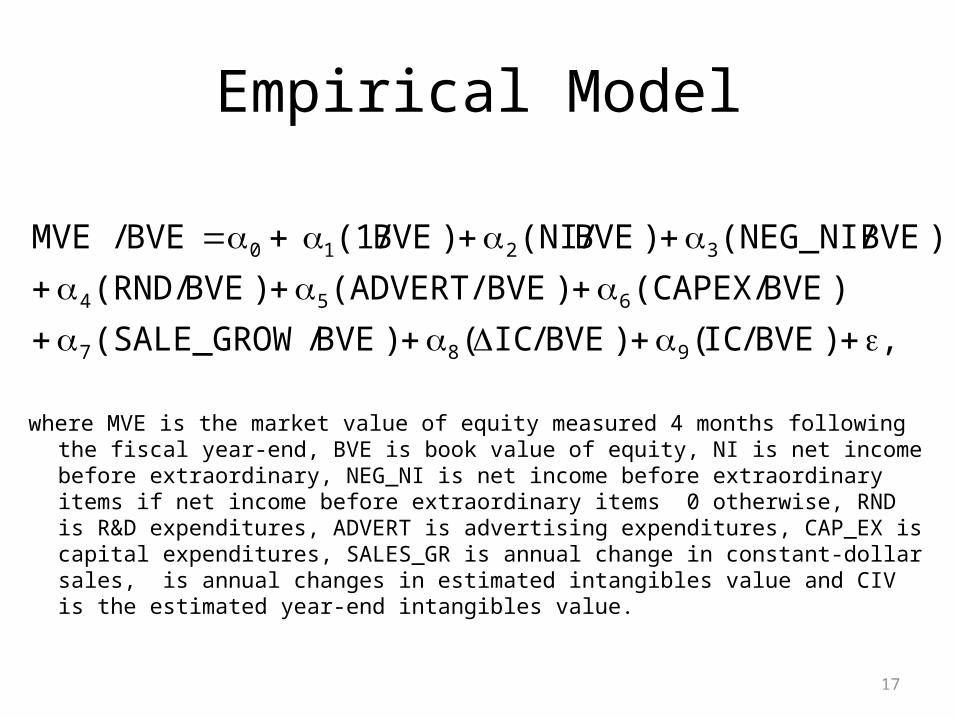
where MVE is the market value of equity measured 4 months following the fiscal year-end, BVE is book value of equity, NI is net income before extraordinary, NEG_NI is net income before extraordinary items if net income before extraordinary items 0 otherwise, RND is R&D expenditures, ADVERT is advertising expenditures, CAP_EX is capital expenditures, SALES_GR is annual change in constant-dollar sales, is annual changes in estimated intangibles value and CIV is the estimated year-end intangibles value.
,)BVE/IC()BVE/IC()BVE/(SALE_GROW
)BVE(CAPEX/ )BVE(ADVERT/)BVE(RND/
)BVE(NEG_NI/)BVE(NI/)BVE(1/BVE/MVE
987
654
3210
18
The Predictive Ability of Intangible Assets for Future Earnings
ttttt CIVPSEPSOCFTACEPS 432101
tttttt CIVPSEPSEPSOCFTACEPS 51432102
;
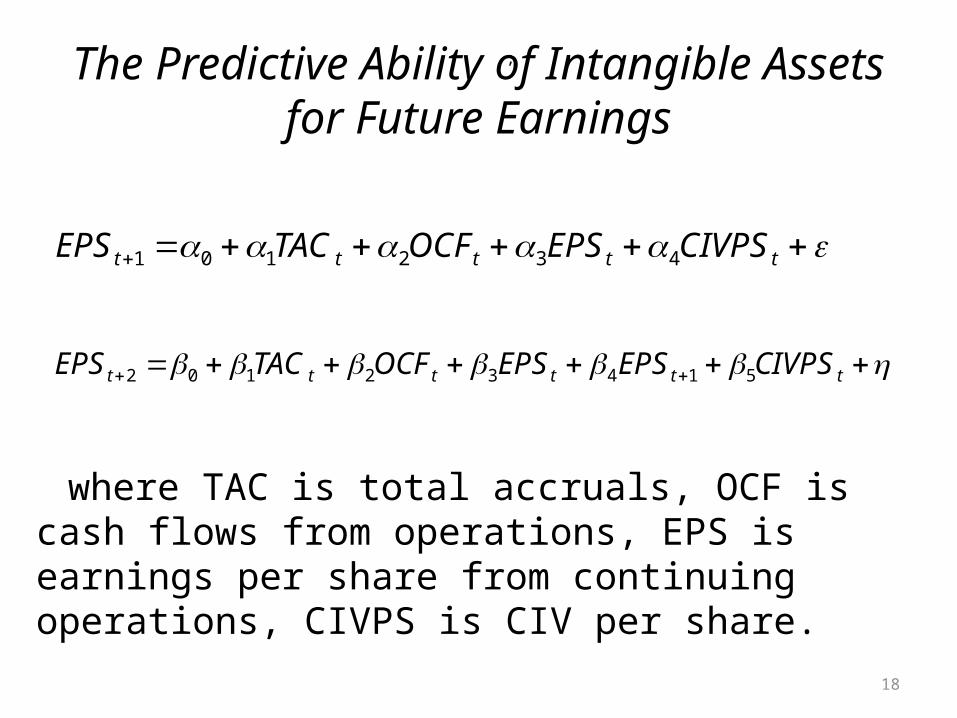
where TAC is total accruals, OCF is cash flows from operations, EPS is earnings per share from continuing operations, CIVPS is CIV per share.
19
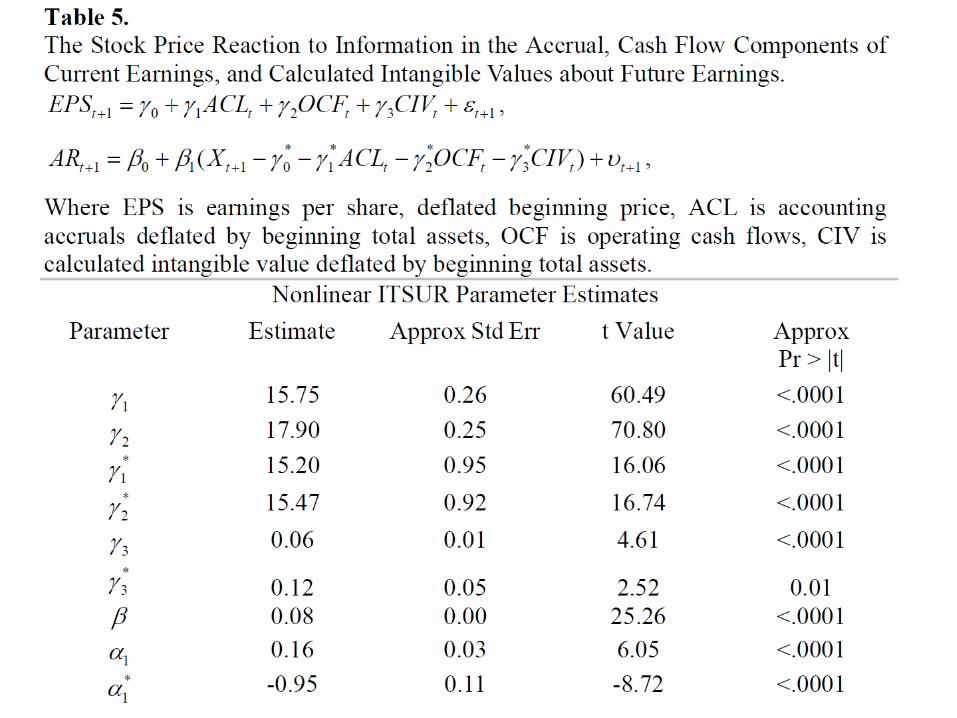
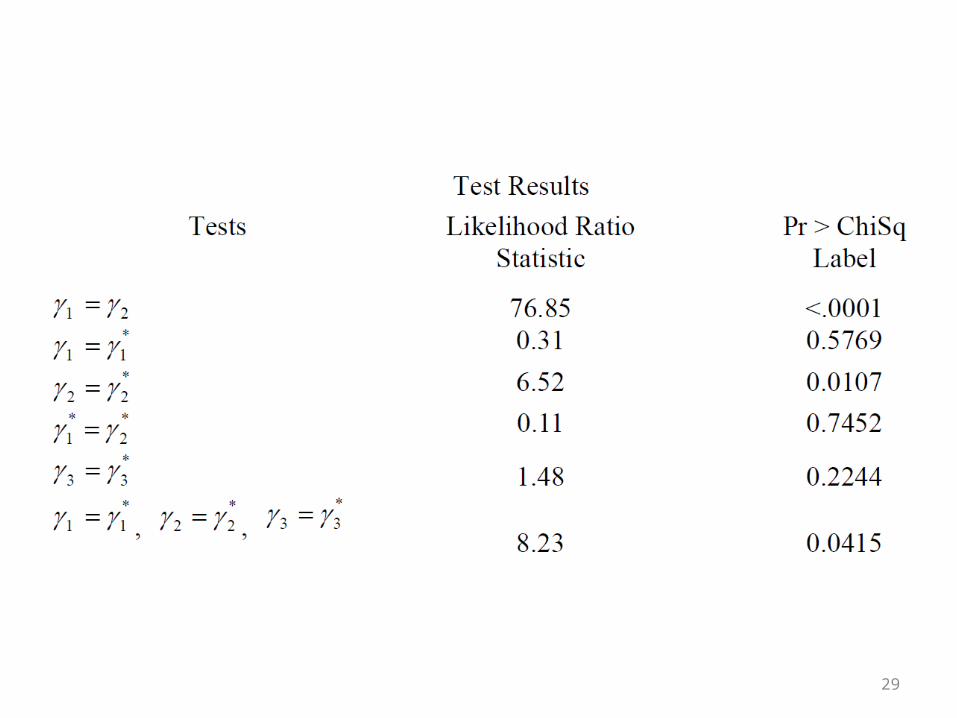
The Mishkin Tests—Rational Pricing of Intangibles
132101 ttttt ICOCFTACX
132101101 )( tttttt CIVOCFTACXAR
, and
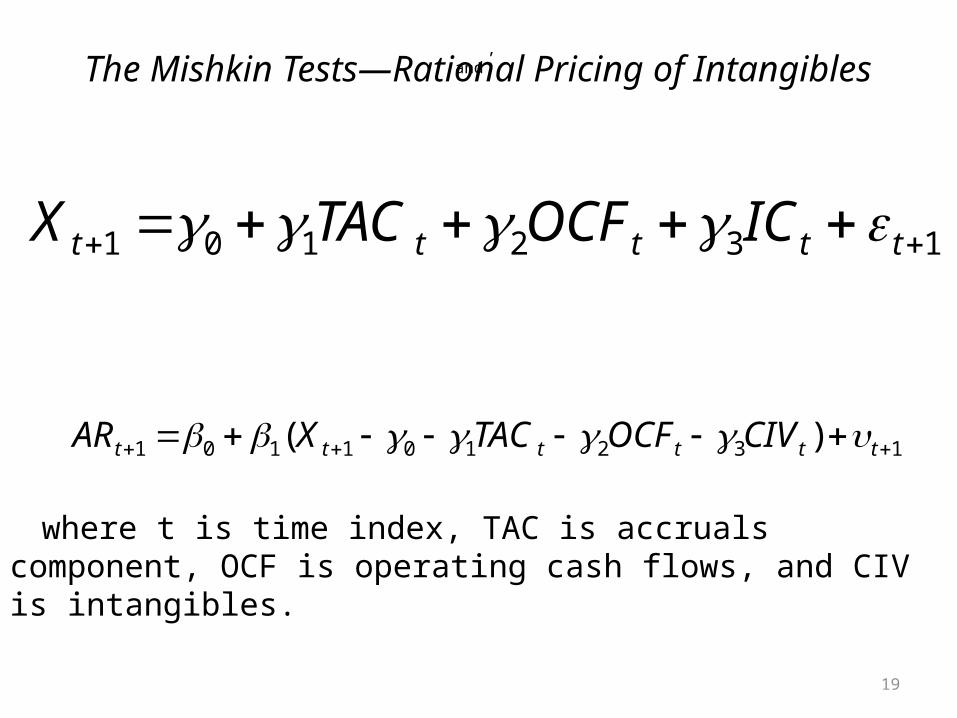
where t is time index, TAC is accruals component, OCF is operating cash flows, and CIV is intangibles.
20
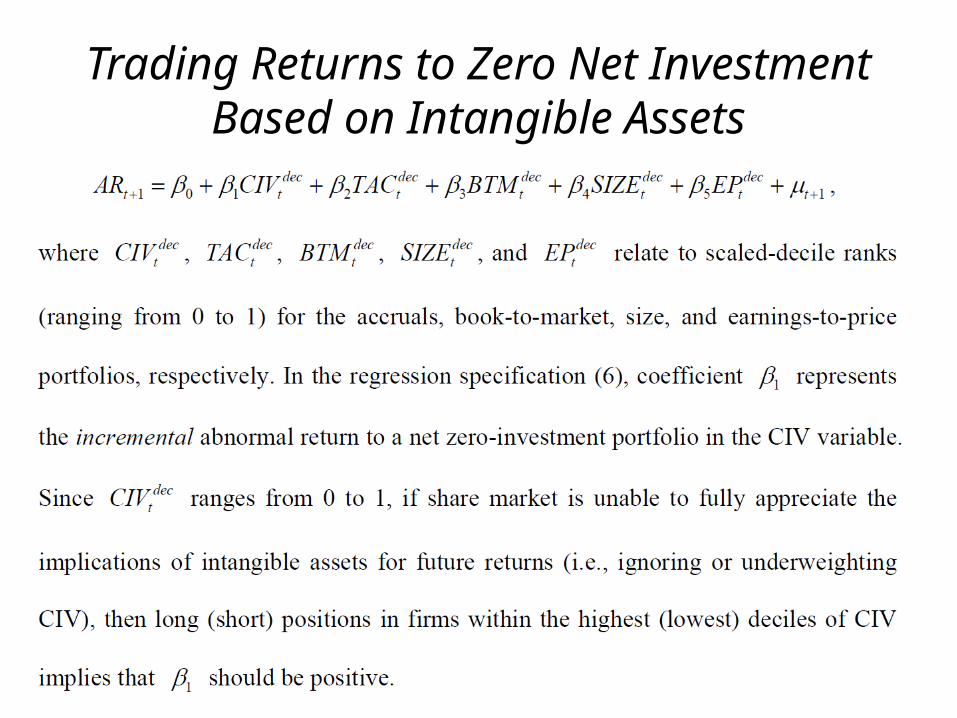
Trading Returns to Zero Net Investment Based on Intangible Assets
21
The empirical results
• Sample Selection and Descriptive Statistics– The study sample includes all firms listed on TSE
and OTC (Taiwan) and covers the period of years 1989-2009. All financial and market data are from Taiwan Economic Journal.
22
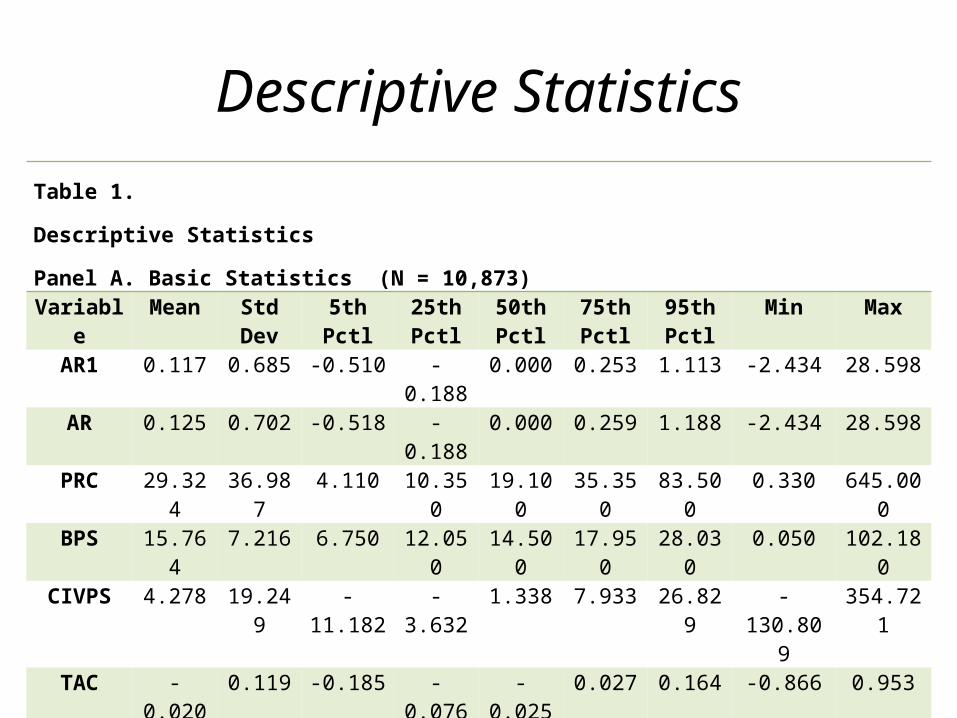
Descriptive StatisticsTable 1.
Descriptive Statistics
Panel A. Basic Statistics (N = 10,873)
Variable Mean Std Dev
5th Pctl 25th Pctl
50th Pctl
75th Pctl
95th Pctl
Min Max
AR1 0.117 0.685 -0.510 -0.188 0.000 0.253 1.113 -2.434 28.598AR 0.125 0.702 -0.518 -0.188 0.000 0.259 1.188 -2.434 28.598
PRC 29.324 36.987 4.110 10.350 19.100 35.350 83.500 0.330 645.000BPS 15.764 7.216 6.750 12.050 14.500 17.950 28.030 0.050 102.180
CIVPS 4.278 19.249 -11.182 -3.632 1.338 7.933 26.829 -130.809 354.721
TAC -0.020 0.119 -0.185 -0.076 -0.025 0.027 0.164 -0.866 0.953OCF 0.066 0.116 -0.089 0.012 0.061 0.123 0.247 -1.034 0.891BTM 0.961 0.893 0.222 0.446 0.735 1.190 2.381 0.011 25.000
EP -0.023 0.437 -0.361 0.000 0.042 0.080 0.136 -16.042 14.400AR is abnormal returns estimated following Fama and French (1993); AR1 = one-year-ahead AR; PRC is price close per share; BPS = book value per share; BPS = book value per share; CIVPS = calculated intangible value per share; TAC = total accounting accruals; OCF = operating cash flows; BTM = book-to-market; EP = earnings-to-price.
23
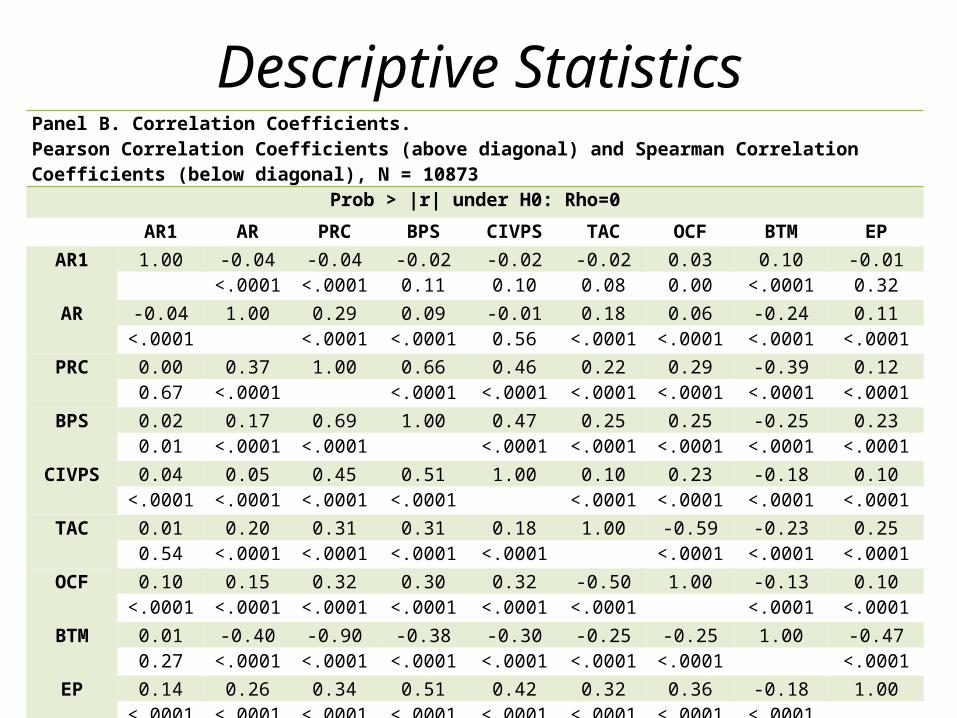
Descriptive StatisticsPanel B. Correlation Coefficients.Pearson Correlation Coefficients (above diagonal) and Spearman Correlation Coefficients (below diagonal), N = 10873
Prob > |r| under H0: Rho=0
AR1 AR PRC BPS CIVPS TAC OCF BTM EP
AR1 1.00 -0.04 -0.04 -0.02 -0.02 -0.02 0.03 0.10 -0.01<.0001 <.0001 0.11 0.10 0.08 0.00 <.0001 0.32
AR -0.04 1.00 0.29 0.09 -0.01 0.18 0.06 -0.24 0.11<.0001 <.0001 <.0001 0.56 <.0001 <.0001 <.0001 <.0001
PRC 0.00 0.37 1.00 0.66 0.46 0.22 0.29 -0.39 0.120.67 <.0001 <.0001 <.0001 <.0001 <.0001 <.0001 <.0001
BPS 0.02 0.17 0.69 1.00 0.47 0.25 0.25 -0.25 0.230.01 <.0001 <.0001 <.0001 <.0001 <.0001 <.0001 <.0001
CIVPS 0.04 0.05 0.45 0.51 1.00 0.10 0.23 -0.18 0.10<.0001 <.0001 <.0001 <.0001 <.0001 <.0001 <.0001 <.0001
TAC 0.01 0.20 0.31 0.31 0.18 1.00 -0.59 -0.23 0.250.54 <.0001 <.0001 <.0001 <.0001 <.0001 <.0001 <.0001
OCF 0.10 0.15 0.32 0.30 0.32 -0.50 1.00 -0.13 0.10<.0001 <.0001 <.0001 <.0001 <.0001 <.0001 <.0001 <.0001
BTM 0.01 -0.40 -0.90 -0.38 -0.30 -0.25 -0.25 1.00 -0.470.27 <.0001 <.0001 <.0001 <.0001 <.0001 <.0001 <.0001
EP 0.14 0.26 0.34 0.51 0.42 0.32 0.36 -0.18 1.00<.0001 <.0001 <.0001 <.0001 <.0001 <.0001 <.0001 <.0001
24
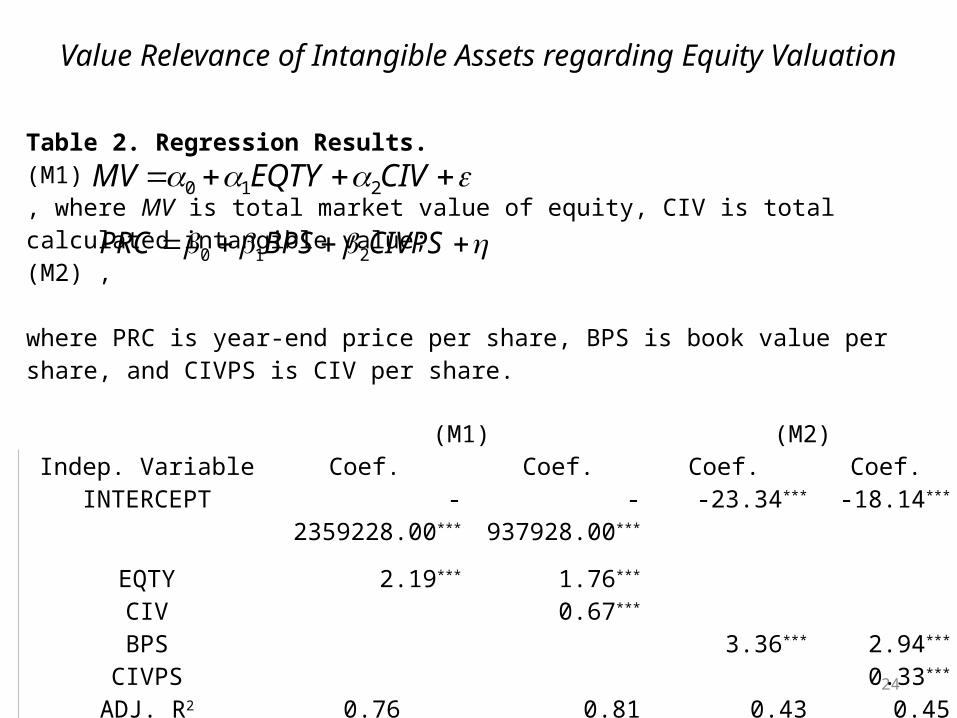
Value Relevance of Intangible Assets regarding Equity Valuation
Table 2. Regression Results. (M1) , where MV is total market value of equity, CIV is total calculated intangible value; (M2) ,
where PRC is year-end price per share, BPS is book value per share, and CIVPS is CIV per share.
(M1) (M2)Indep. Variable Coef. Coef. Coef. Coef.INTERCEPT -2359228.00*** -937928.00*** -23.34*** -18.14***
EQTY 2.19*** 1.76***
CIV 0.67***
BPS 3.36*** 2.94***
CIVPS 0.33***
ADJ. R2 0.76 0.81 0.43 0.45N 10,999 10,999
CIVEQTYMV 210
CIVPSBPSPRC 210
25
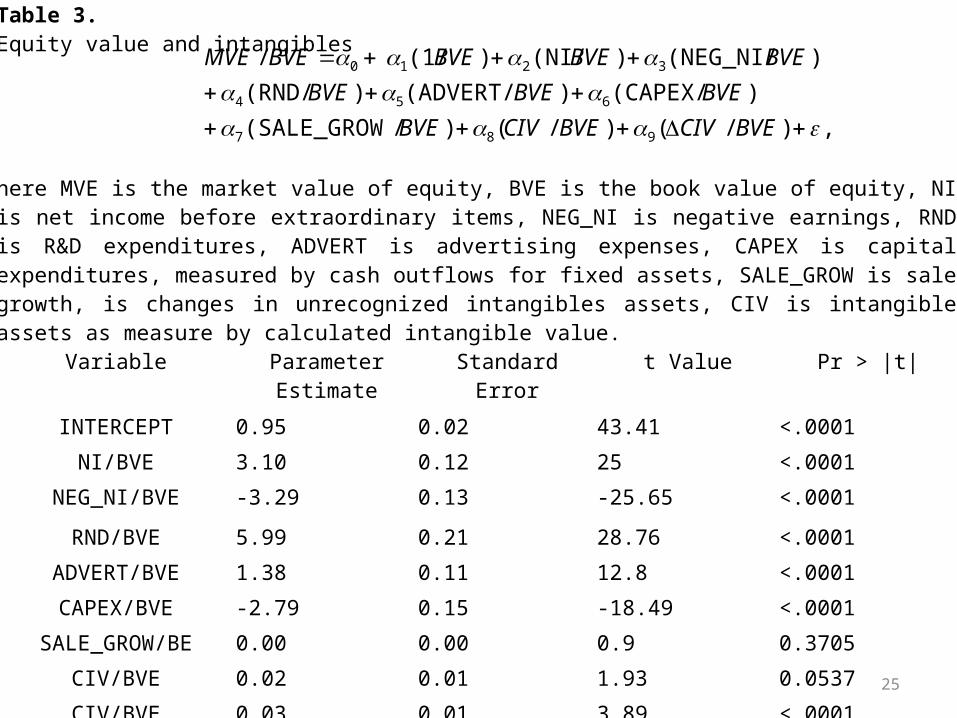
Table 3.Equity value and intangibles
here MVE is the market value of equity, BVE is the book value of equity, NI is net income before extraordinary items, NEG_NI is negative earnings, RND is R&D expenditures, ADVERT is advertising expenses, CAPEX is capital expenditures, measured by cash outflows for fixed assets, SALE_GROW is sale growth, is changes in unrecognized intangibles assets, CIV is intangible assets as measure by calculated intangible value.
Variable ParameterEstimate
StandardError
t Value Pr > |t|
INTERCEPT 0.95 0.02 43.41 <.0001
NI/BVE 3.10 0.12 25 <.0001
NEG_NI/BVE -3.29 0.13 -25.65 <.0001
RND/BVE 5.99 0.21 28.76 <.0001
ADVERT/BVE 1.38 0.11 12.8 <.0001
CAPEX/BVE -2.79 0.15 -18.49 <.0001
SALE_GROW/BE 0.00 0.00 0.9 0.3705
CIV/BVE 0.02 0.01 1.93 0.0537
CIV/BVE 0.03 0.01 3.89 <.0001
N 9740
Adj. R2 0.51
,)/()/()/(SALE_GROW
)(CAPEX/ )(ADVERT/)(RND/
)(NEG_NI/)(NI/)(1//
987
654
3210
BVECIVBVECIVBVE
BVEBVEBVE
BVEBVEBVEBVEMVE
26
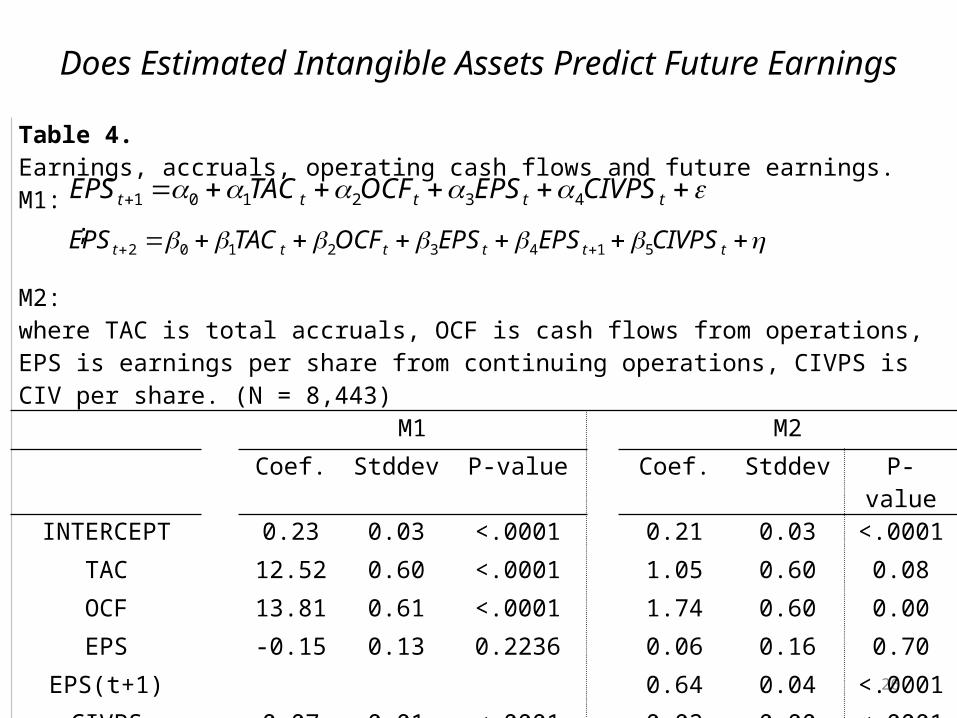
Does Estimated Intangible Assets Predict Future Earnings
Table 4.Earnings, accruals, operating cash flows and future earnings. M1: ;
M2:where TAC is total accruals, OCF is cash flows from operations, EPS is earnings per share from continuing operations, CIVPS is CIV per share. (N = 8,443)
M1 M2
Coef. Stddev P-value Coef. Stddev P-value
INTERCEPT 0.23 0.03 <.0001 0.21 0.03 <.0001
TAC 12.52 0.60 <.0001 1.05 0.60 0.08
OCF 13.81 0.61 <.0001 1.74 0.60 0.00
EPS -0.15 0.13 0.2236 0.06 0.16 0.70
EPS(t+1) 0.64 0.04 <.0001
CIVPS 0.07 0.01 <.0001 0.02 0.00 <.0001
Adj R2 0.47 0.54
N 8,473 8,473
ttttt CIVPSEPSOCFTACEPS 432101
tttttt CIVPSEPSEPSOCFTACEPS 51432102

27
The Accrual Anomaly and the Intangibles Anomaly
28
29
30


![IAS 38: Intangible Assets - riseschool.edu.pk · INTERNATIONAL ACCOUNTING STANDARD 38 INTANGIBLE ASSETS LO1: SCOPE AND DEFINITIONS Scope [Para 2,3] IAS 38 applies to all intangible](https://img.pdfslide.net/doc/110x75/60d26f77f152d20f46438525/ias-38-intangible-assets-international-accounting-standard-38-intangible-assets.jpg)