Embed Size (px)
Citation preview
Intangible Value Executive Summary Value investing has struggled over the past decade. We believe this is due to its failure to incorporate intangible assets, which play an increasingly crucial role in the modern economy. We consolidate our prior research to construct a firm-level measure of intangible value. We find that expanding intrinsic value to include intangibles can help restore value investing to its former glory.
The Death of Value The building chorus of investors singing of the “death of value” has reached a crescendo. They claim value investors have lost the plot, dogmatically clinging to dying businesses as the world passes them by. Few are listening to the faint objections of value investors, buried in the depths of a thirteen-year drawdown.
We have spent a lot of time thinking about the future of value investing. Ultimately, while we do not believe value is dead - Ben Graham’s framework of buying stocks below intrinsic value is both timeless and sensible - we do believe that his metrics for intrinsic value need to be updated.
Graham established the principles of value investing in the days of railroads and steel mills, when intrinsic value was almost fully tangible. However, over the past century, the economy has transformed from industrial to information- based. Today’s dominant firms build moats using not physical but intangible assets, such as intellectual property, brand equity, human capital, and network effects.
Value investors should adapt by expanding their definition of intrinsic value to include not just tangible but also intangible value.
Intrinsic Value = Tangible Value + Intangible Value
While simple in theory, quantifying intangibles is actually challenging as we cannot rely on standardized accounting statements. While alternative data can provide valuable insight, they tend to require special tools to process.
Over the past year, we have written several research papers using machine learning to quantify specific aspects of the intangible economy. This paper consolidates this sprawling research into a single firm-level measure of intangible value.
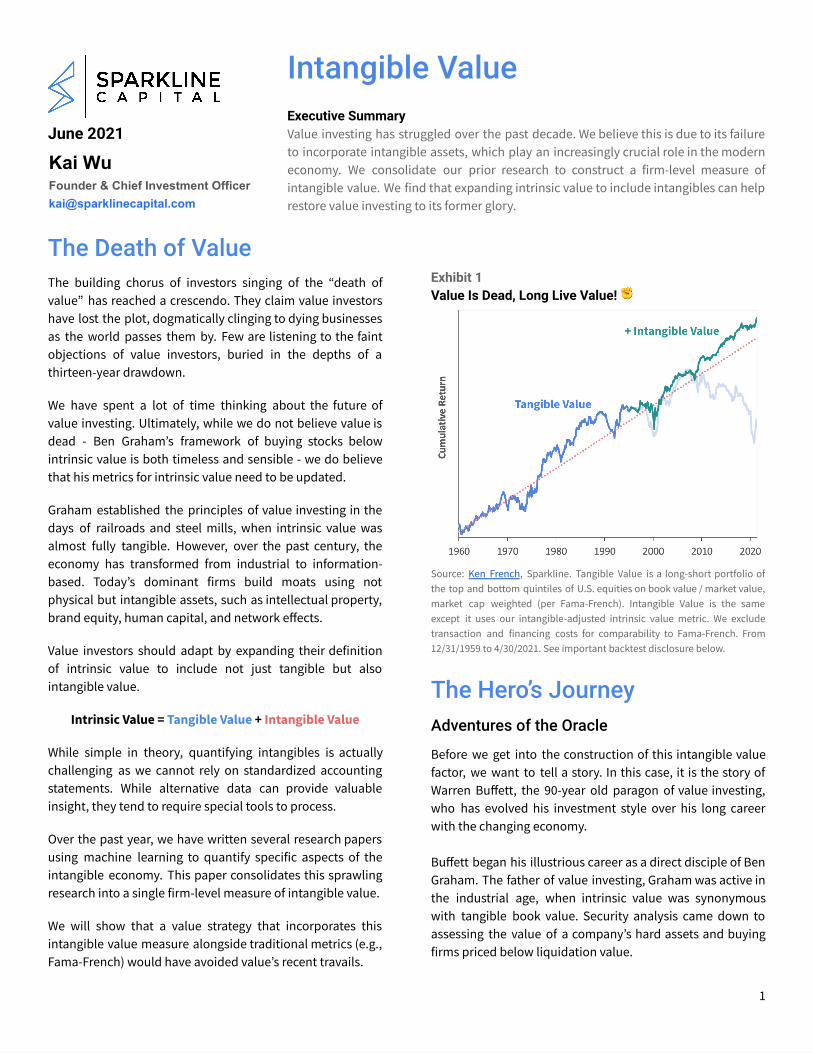
We will show that a value strategy that incorporates this intangible value measure alongside traditional metrics (e.g., Fama-French) would have avoided value’s recent travails.
Exhibit 1 Value Is Dead, Long Live Value! ✊
Source: Ken French , Sparkline. Tangible Value is a long-short portfolio of the top and bottom quintiles of U.S. equities on book value / market value, market cap weighted (per Fama-French). Intangible Value is the same except it uses our intangible-adjusted intrinsic value metric. We exclude transaction and financing costs for comparability to Fama-French. From 12/31/1959 to 4/30/2021. See important backtest disclosure below.
The Hero’s Journey Adventures of the Oracle
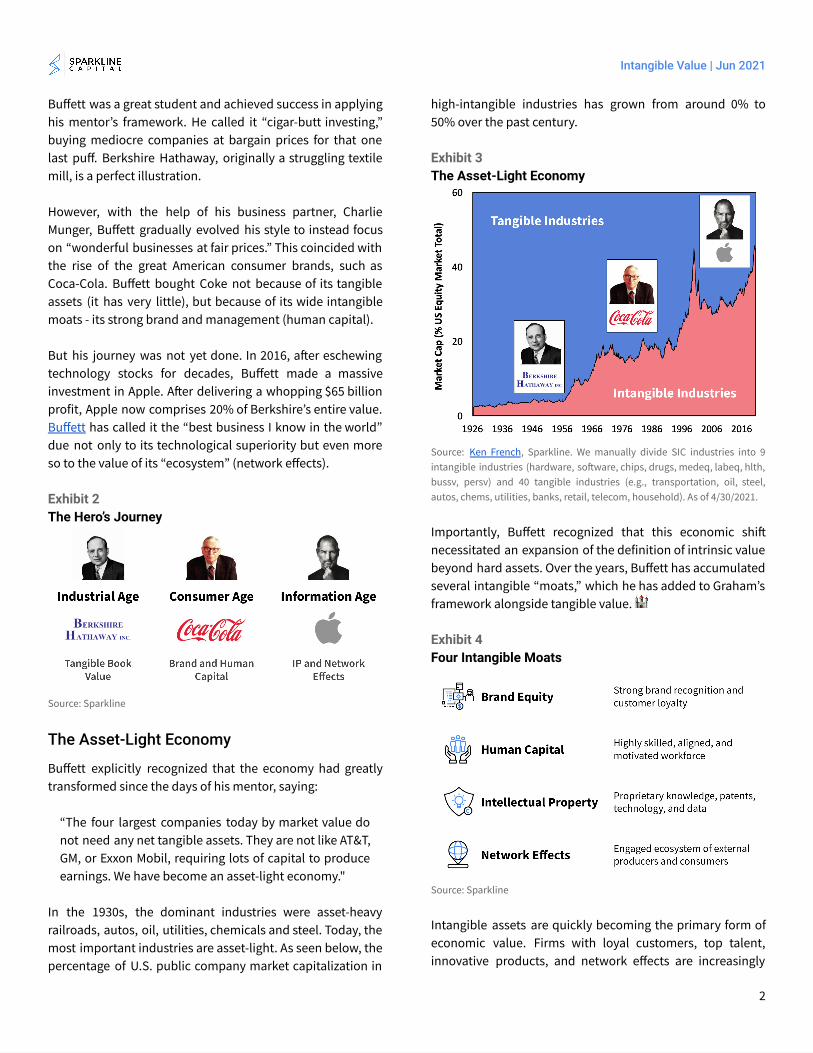
Before we get into the construction of this intangible value factor, we want to tell a story. In this case, it is the story of Warren Buffett, the 90-year old paragon of value investing, who has evolved his investment style over his long career with the changing economy.
Buffett began his illustrious career as a direct disciple of Ben Graham. The father of value investing, Graham was active in the industrial age, when intrinsic value was synonymous with tangible book value. Security analysis came down to assessing the value of a company’s hard assets and buying firms priced below liquidation value.
1
June 2021
Kai WuFounder & Chief Investment Officer [email protected]
Intangible Value | Jun 2021
Buffett was a great student and achieved success in applying his mentor’s framework. He called it “cigar-butt investing,” buying mediocre companies at bargain prices for that one last puff. Berkshire Hathaway, originally a struggling textile mill, is a perfect illustration.
However, with the help of his business partner, Charlie Munger, Buffett gradually evolved his style to instead focus on “wonderful businesses at fair prices.” This coincided with the rise of the great American consumer brands, such as Coca-Cola. Buffett bought Coke not because of its tangible assets (it has very little), but because of its wide intangible moats - its strong brand and management (human capital).
But his journey was not yet done. In 2016, a�er eschewing technology stocks for decades, Buffett made a massive investment in Apple. A�er delivering a whopping $65 billion profit, Apple now comprises 20% of Berkshire’s entire value. Buffett has called it the “best business I know in the world” due not only to its technological superiority but even more so to the value of its “ecosystem” (network effects).
Exhibit 2 The Hero’s Journey
Source: Sparkline
The Asset-Light Economy
Buffett explicitly recognized that the economy had greatly transformed since the days of his mentor, saying:
“The four largest companies today by market value do not need any net tangible assets. They are not like AT&T, GM, or Exxon Mobil, requiring lots of capital to produce earnings. We have become an asset-light economy."
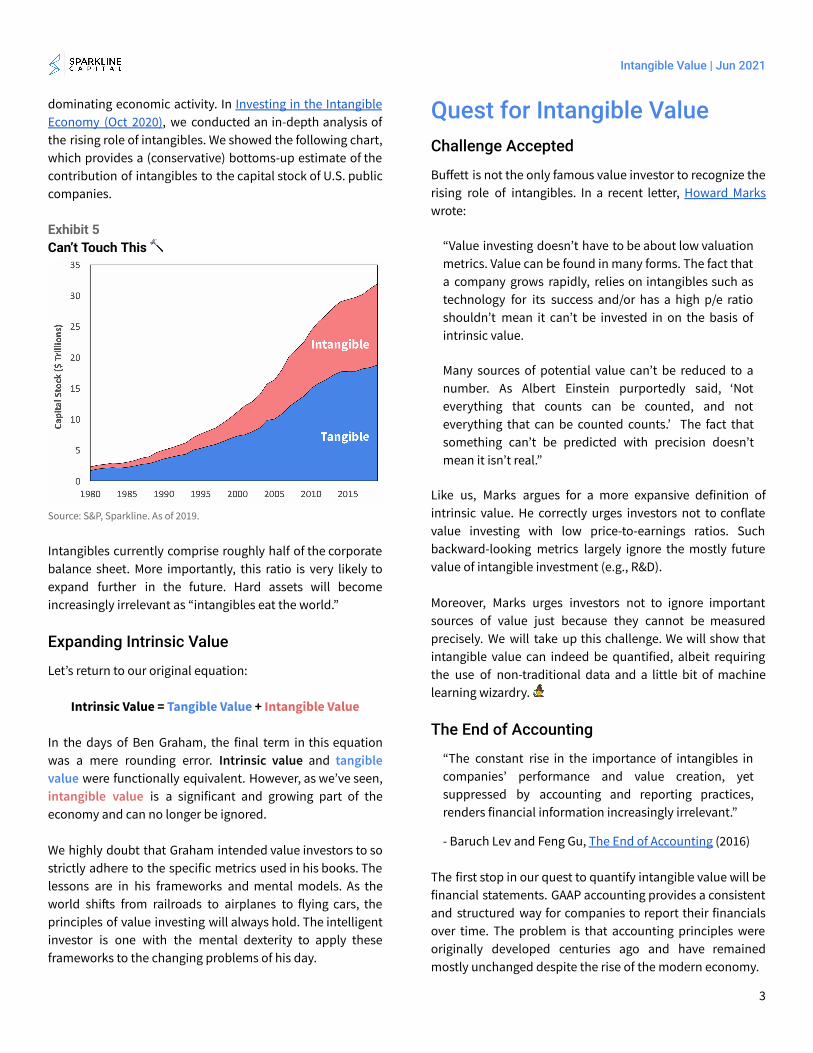
In the 1930s, the dominant industries were asset-heavy railroads, autos, oil, utilities, chemicals and steel. Today, the most important industries are asset-light. As seen below, the percentage of U.S. public company market capitalization in
high-intangible industries has grown from around 0% to 50% over the past century.
Exhibit 3 The Asset-Light Economy
Source: Ken French , Sparkline. We manually divide SIC industries into 9 intangible industries (hardware, so�ware, chips, drugs, medeq, labeq, hlth, bussv, persv) and 40 tangible industries (e.g., transportation, oil, steel, autos, chems, utilities, banks, retail, telecom, household). As of 4/30/2021.
Importantly, Buffett recognized that this economic shi� necessitated an expansion of the definition of intrinsic value beyond hard assets. Over the years, Buffett has accumulated several intangible “moats,” which he has added to Graham’s framework alongside tangible value. 🏰
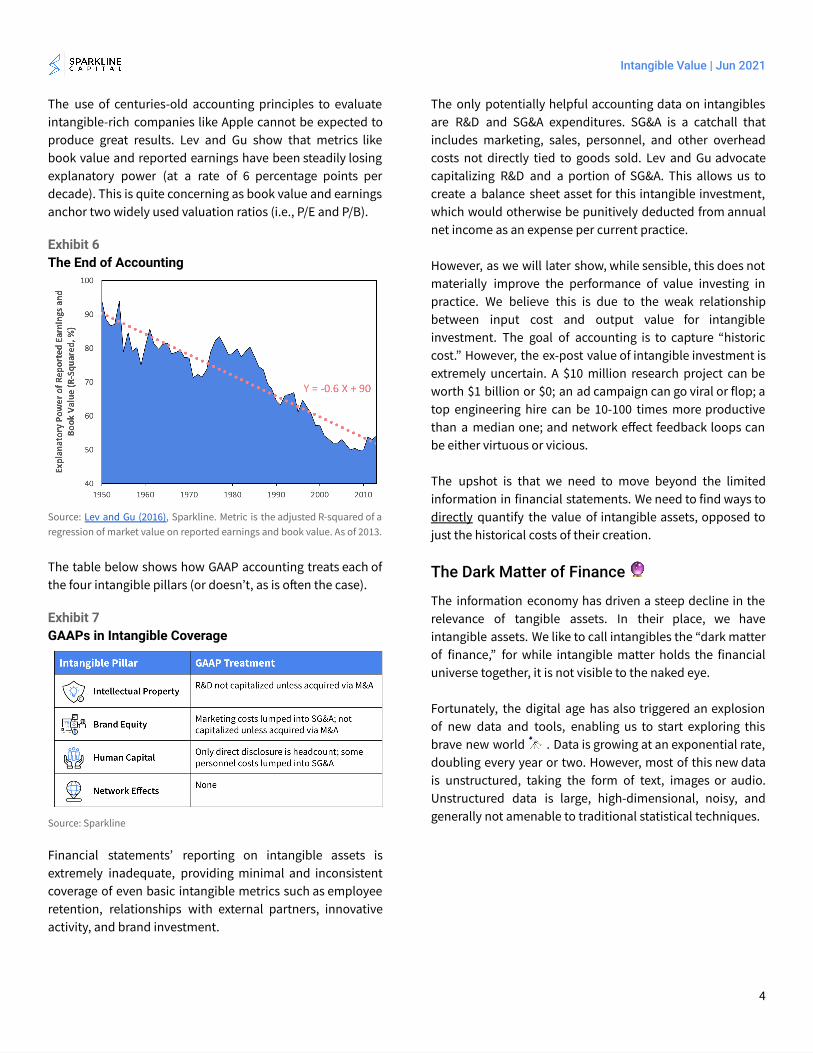
Exhibit 4 Four Intangible Moats
Source: Sparkline
Intangible assets are quickly becoming the primary form of economic value. Firms with loyal customers, top talent, innovative products, and network effects are increasingly
2
Intangible Value | Jun 2021
dominating economic activity. In Investing in the Intangible Economy (Oct 2020) , we conducted an in-depth analysis of the rising role of intangibles. We showed the following chart, which provides a (conservative) bottoms-up estimate of the contribution of intangibles to the capital stock of U.S. public companies.
Exhibit 5 Can’t Touch This 🔨
Source: S&P, Sparkline. As of 2019.
Intangibles currently comprise roughly half of the corporate balance sheet. More importantly, this ratio is very likely to expand further in the future. Hard assets will become increasingly irrelevant as “intangibles eat the world.”
Expanding Intrinsic Value
Let’s return to our original equation:
Intrinsic Value = Tangible Value + Intangible Value
In the days of Ben Graham, the final term in this equation was a mere rounding error. Intrinsic value and tangible value were functionally equivalent. However, as we’ve seen, intangible value is a significant and growing part of the economy and can no longer be ignored.
We highly doubt that Graham intended value investors to so strictly adhere to the specific metrics used in his books. The lessons are in his frameworks and mental models. As the world shi�s from railroads to airplanes to flying cars, the principles of value investing will always hold. The intelligent investor is one with the mental dexterity to apply these frameworks to the changing problems of his day.
Quest for Intangible Value Challenge Accepted
Buffett is not the only famous value investor to recognize the rising role of intangibles. In a recent letter, Howard Marks wrote:
“Value investing doesn’t have to be about low valuation metrics. Value can be found in many forms. The fact that a company grows rapidly, relies on intangibles such as technology for its success and/or has a high p/e ratio shouldn’t mean it can’t be invested in on the basis of intrinsic value.
Many sources of potential value can’t be reduced to a number. As Albert Einstein purportedly said, ‘Not everything that counts can be counted, and not everything that can be counted counts.’ The fact that something can’t be predicted with precision doesn’t mean it isn’t real.”
Like us, Marks argues for a more expansive definition of intrinsic value. He correctly urges investors not to conflate value investing with low price-to-earnings ratios. Such backward-looking metrics largely ignore the mostly future value of intangible investment (e.g., R&D).
Moreover, Marks urges investors not to ignore important sources of value just because they cannot be measured precisely. We will take up this challenge. We will show that intangible value can indeed be quantified, albeit requiring the use of non-traditional data and a little bit of machine learning wizardry. 🧙
The End of Accounting
“The constant rise in the importance of intangibles in companies’ performance and value creation, yet suppressed by accounting and reporting practices, renders financial information increasingly irrelevant.”
- Baruch Lev and Feng Gu, The End of Accounting (2016)
The first stop in our quest to quantify intangible value will be financial statements. GAAP accounting provides a consistent and structured way for companies to report their financials over time. The problem is that accounting principles were originally developed centuries ago and have remained mostly unchanged despite the rise of the modern economy.
3
Intangible Value | Jun 2021
The use of centuries-old accounting principles to evaluate intangible-rich companies like Apple cannot be expected to produce great results. Lev and Gu show that metrics like book value and reported earnings have been steadily losing explanatory power (at a rate of 6 percentage points per decade). This is quite concerning as book value and earnings anchor two widely used valuation ratios (i.e., P/E and P/B).
Exhibit 6 The End of Accounting
Source: Lev and Gu (2016) , Sparkline. Metric is the adjusted R-squared of a regression of market value on reported earnings and book value. As of 2013.
The table below shows how GAAP accounting treats each of the four intangible pillars (or doesn’t, as is o�en the case).
Exhibit 7 GAAPs in Intangible Coverage
Source: Sparkline
Financial statements’ reporting on intangible assets is extremely inadequate, providing minimal and inconsistent coverage of even basic intangible metrics such as employee retention, relationships with external partners, innovative activity, and brand investment.
The only potentially helpful accounting data on intangibles are R&D and SG&A expenditures. SG&A is a catchall that includes marketing, sales, personnel, and other overhead costs not directly tied to goods sold. Lev and Gu advocate capitalizing R&D and a portion of SG&A. This allows us to create a balance sheet asset for this intangible investment, which would otherwise be punitively deducted from annual net income as an expense per current practice.
However, as we will later show, while sensible, this does not materially improve the performance of value investing in practice. We believe this is due to the weak relationship between input cost and output value for intangible investment. The goal of accounting is to capture “historic cost.” However, the ex-post value of intangible investment is extremely uncertain. A $10 million research project can be worth $1 billion or $0; an ad campaign can go viral or flop; a top engineering hire can be 10-100 times more productive than a median one; and network effect feedback loops can be either virtuous or vicious.
The upshot is that we need to move beyond the limited information in financial statements. We need to find ways to directly quantify the value of intangible assets, opposed to just the historical costs of their creation.
The Dark Matter of Finance 🔮
The information economy has driven a steep decline in the relevance of tangible assets. In their place, we have intangible assets. We like to call intangibles the “dark matter of finance,” for while intangible matter holds the financial universe together, it is not visible to the naked eye.
Fortunately, the digital age has also triggered an explosion of new data and tools, enabling us to start exploring this brave new world 🔭 . Data is growing at an exponential rate, doubling every year or two. However, most of this new data is unstructured, taking the form of text, images or audio. Unstructured data is large, high-dimensional, noisy, and generally not amenable to traditional statistical techniques.
4
Intangible Value | Jun 2021
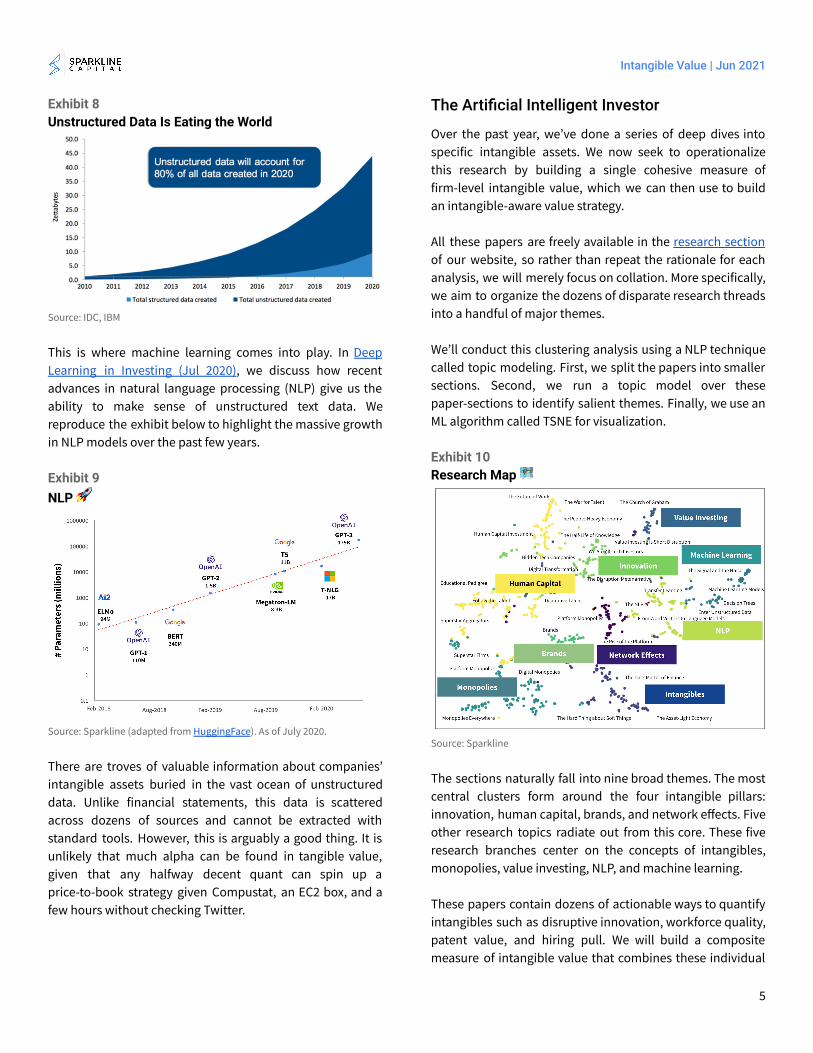
Exhibit 8 Unstructured Data Is Eating the World
Source: IDC, IBM
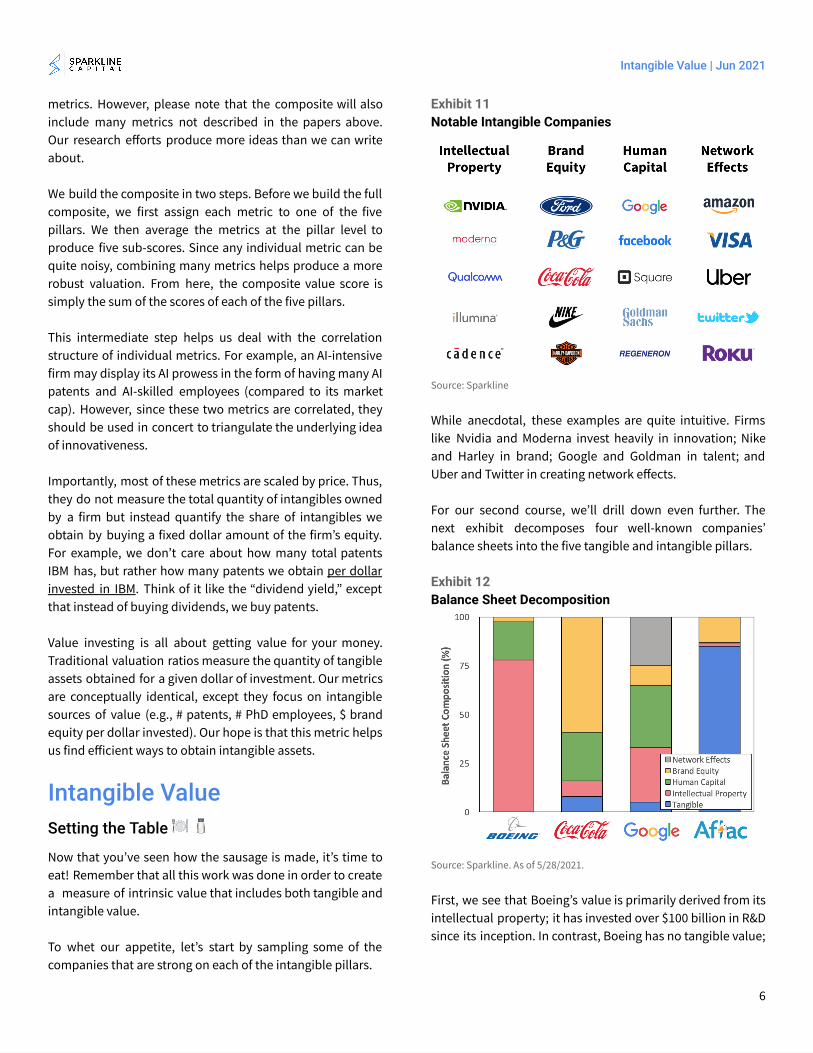
This is where machine learning comes into play. In Deep Learning in Investing (Jul 2020) , we discuss how recent advances in natural language processing (NLP) give us the ability to make sense of unstructured text data. We reproduce the exhibit below to highlight the massive growth in NLP models over the past few years.
Exhibit 9 NLP 🚀
Source: Sparkline (adapted from HuggingFace ). As of July 2020.
There are troves of valuable information about companies’ intangible assets buried in the vast ocean of unstructured data. Unlike financial statements, this data is scattered across dozens of sources and cannot be extracted with standard tools. However, this is arguably a good thing. It is unlikely that much alpha can be found in tangible value, given that any halfway decent quant can spin up a price-to-book strategy given Compustat, an EC2 box, and a few hours without checking Twitter.
The Artificial Intelligent Investor
Over the past year, we’ve done a series of deep dives into specific intangible assets. We now seek to operationalize this research by building a single cohesive measure of firm-level intangible value, which we can then use to build an intangible-aware value strategy.
All these papers are freely available in the research section of our website, so rather than repeat the rationale for each analysis, we will merely focus on collation. More specifically, we aim to organize the dozens of disparate research threads into a handful of major themes.
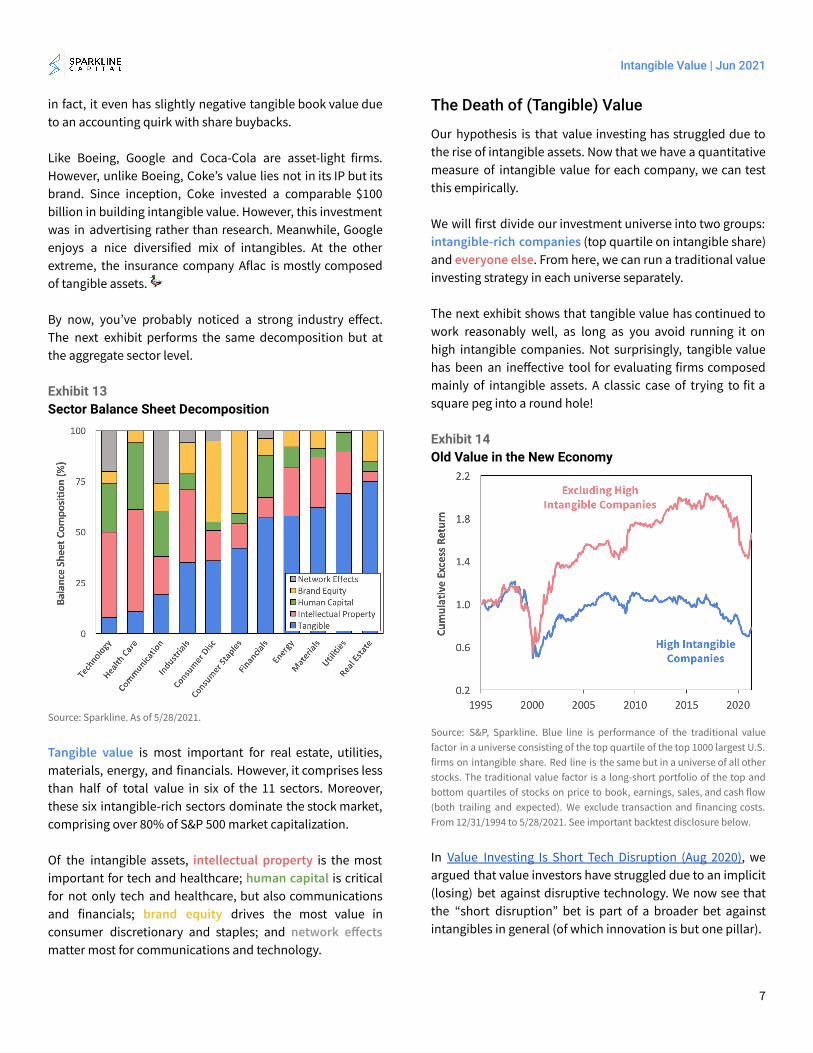
We’ll conduct this clustering analysis using a NLP technique called topic modeling. First, we split the papers into smaller sections. Second, we run a topic model over these paper-sections to identify salient themes. Finally, we use an ML algorithm called TSNE for visualization.
Exhibit 10 Research Map 🗺
Source: Sparkline
The sections naturally fall into nine broad themes. The most central clusters form around the four intangible pillars: innovation, human capital, brands, and network effects. Five other research topics radiate out from this core. These five research branches center on the concepts of intangibles, monopolies, value investing, NLP, and machine learning.
These papers contain dozens of actionable ways to quantify intangibles such as disruptive innovation, workforce quality, patent value, and hiring pull. We will build a composite measure of intangible value that combines these individual
5
Intangible Value | Jun 2021
metrics. However, please note that the composite will also include many metrics not described in the papers above. Our research efforts produce more ideas than we can write about.
We build the composite in two steps. Before we build the full composite, we first assign each metric to one of the five pillars. We then average the metrics at the pillar level to produce five sub-scores. Since any individual metric can be quite noisy, combining many metrics helps produce a more robust valuation. From here, the composite value score is simply the sum of the scores of each of the five pillars.
This intermediate step helps us deal with the correlation structure of individual metrics. For example, an AI-intensive firm may display its AI prowess in the form of having many AI patents and AI-skilled employees (compared to its market cap). However, since these two metrics are correlated, they should be used in concert to triangulate the underlying idea of innovativeness.
Importantly, most of these metrics are scaled by price. Thus, they do not measure the total quantity of intangibles owned by a firm but instead quantify the share of intangibles we obtain by buying a fixed dollar amount of the firm’s equity. For example, we don’t care about how many total patents IBM has, but rather how many patents we obtain per dollar invested in IBM . Think of it like the “dividend yield,” except that instead of buying dividends, we buy patents.
Value investing is all about getting value for your money. Traditional valuation ratios measure the quantity of tangible assets obtained for a given dollar of investment. Our metrics are conceptually identical, except they focus on intangible sources of value (e.g., # patents, # PhD employees, $ brand equity per dollar invested). Our hope is that this metric helps us find efficient ways to obtain intangible assets.
Intangible Value Setting the Table 🍽🧂
Now that you’ve seen how the sausage is made, it’s time to eat! Remember that all this work was done in order to create a measure of intrinsic value that includes both tangible and intangible value.
To whet our appetite, let’s start by sampling some of the companies that are strong on each of the intangible pillars.
Exhibit 11 Notable Intangible Companies
Source: Sparkline
While anecdotal, these examples are quite intuitive. Firms like Nvidia and Moderna invest heavily in innovation; Nike and Harley in brand; Google and Goldman in talent; and Uber and Twitter in creating network effects.
For our second course, we’ll drill down even further. The next exhibit decomposes four well-known companies’ balance sheets into the five tangible and intangible pillars.
Exhibit 12 Balance Sheet Decomposition
Source: Sparkline. As of 5/28/2021.
First, we see that Boeing’s value is primarily derived from its intellectual property; it has invested over $100 billion in R&D since its inception. In contrast, Boeing has no tangible value;
6
Intangible Value | Jun 2021
in fact, it even has slightly negative tangible book value due to an accounting quirk with share buybacks.
Like Boeing, Google and Coca-Cola are asset-light firms. However, unlike Boeing, Coke’s value lies not in its IP but its brand. Since inception, Coke invested a comparable $100 billion in building intangible value. However, this investment was in advertising rather than research. Meanwhile, Google enjoys a nice diversified mix of intangibles. At the other extreme, the insurance company Aflac is mostly composed of tangible assets. 🦆
By now, you’ve probably noticed a strong industry effect. The next exhibit performs the same decomposition but at the aggregate sector level.
Exhibit 13 Sector Balance Sheet Decomposition
Source: Sparkline. As of 5/28/2021.
Tangible value is most important for real estate, utilities, materials, energy, and financials. However, it comprises less than half of total value in six of the 11 sectors. Moreover, these six intangible-rich sectors dominate the stock market, comprising over 80% of S&P 500 market capitalization.
Of the intangible assets, intellectual property is the most important for tech and healthcare; human capital is critical for not only tech and healthcare, but also communications and financials; brand equity drives the most value in consumer discretionary and staples; and network effects matter most for communications and technology.
The Death of (Tangible) Value
Our hypothesis is that value investing has struggled due to the rise of intangible assets. Now that we have a quantitative measure of intangible value for each company, we can test this empirically.
We will first divide our investment universe into two groups: intangible-rich companies (top quartile on intangible share) and everyone else . From here, we can run a traditional value investing strategy in each universe separately.
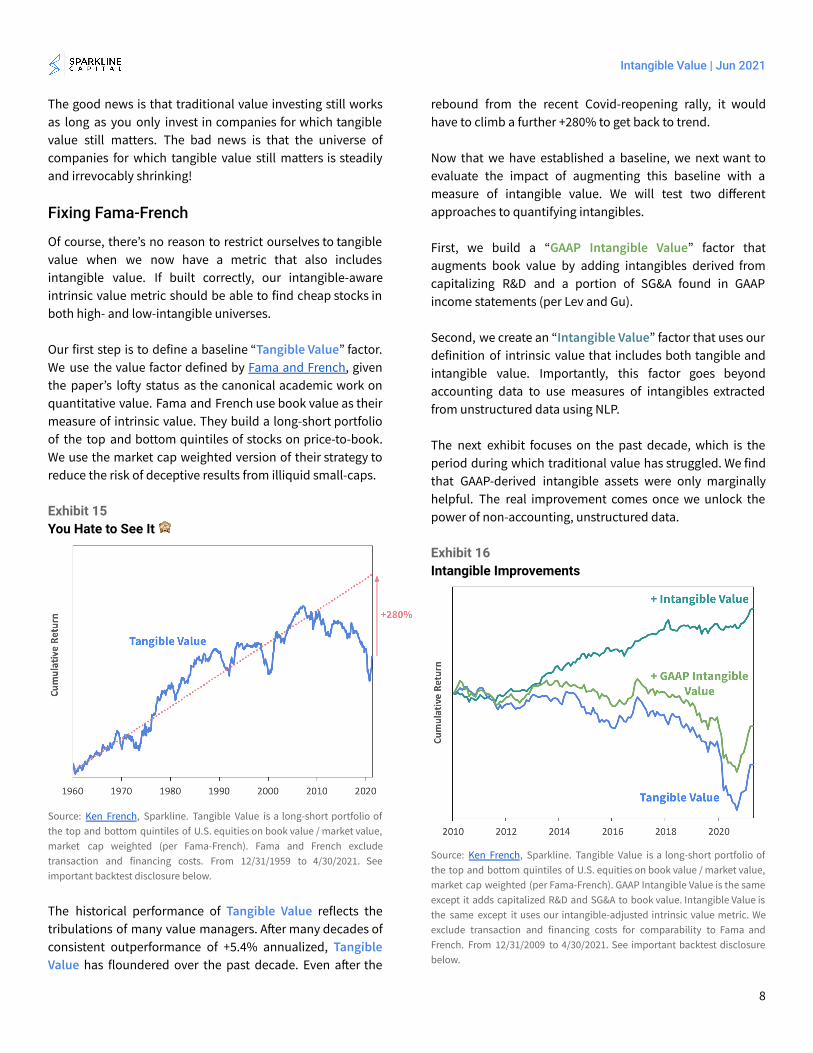
The next exhibit shows that tangible value has continued to work reasonably well, as long as you avoid running it on high intangible companies. Not surprisingly, tangible value has been an ineffective tool for evaluating firms composed mainly of intangible assets. A classic case of trying to fit a square peg into a round hole!
Exhibit 14 Old Value in the New Economy
Source: S&P, Sparkline. Blue line is performance of the traditional value factor in a universe consisting of the top quartile of the top 1000 largest U.S. firms on intangible share. Red line is the same but in a universe of all other stocks. The traditional value factor is a long-short portfolio of the top and bottom quartiles of stocks on price to book, earnings, sales, and cash flow (both trailing and expected). We exclude transaction and financing costs. From 12/31/1994 to 5/28/2021. See important backtest disclosure below.
In Value Investing Is Short Tech Disruption (Aug 2020) , we argued that value investors have struggled due to an implicit (losing) bet against disruptive technology. We now see that the “short disruption” bet is part of a broader bet against intangibles in general (of which innovation is but one pillar).
7
Intangible Value | Jun 2021
The good news is that traditional value investing still works as long as you only invest in companies for which tangible value still matters. The bad news is that the universe of companies for which tangible value still matters is steadily and irrevocably shrinking!
Fixing Fama-French
Of course, there’s no reason to restrict ourselves to tangible value when we now have a metric that also includes intangible value. If built correctly, our intangible-aware intrinsic value metric should be able to find cheap stocks in both high- and low-intangible universes.
Our first step is to define a baseline “ Tangible Value ” factor. We use the value factor defined by Fama and French , given the paper’s lo�y status as the canonical academic work on quantitative value. Fama and French use book value as their measure of intrinsic value. They build a long-short portfolio of the top and bottom quintiles of stocks on price-to-book. We use the market cap weighted version of their strategy to reduce the risk of deceptive results from illiquid small-caps.
Exhibit 15 You Hate to See It 🙈
Source: Ken French , Sparkline. Tangible Value is a long-short portfolio of the top and bottom quintiles of U.S. equities on book value / market value, market cap weighted (per Fama-French). Fama and French exclude transaction and financing costs. From 12/31/1959 to 4/30/2021. See important backtest disclosure below.
The historical performance of Tangible Value reflects the tribulations of many value managers. A�er many decades of consistent outperformance of +5.4% annualized, Tangible Value has floundered over the past decade. Even a�er the
rebound from the recent Covid-reopening rally, it would have to climb a further +280% to get back to trend.
Now that we have established a baseline, we next want to evaluate the impact of augmenting this baseline with a measure of intangible value. We will test two different approaches to quantifying intangibles.
First, we build a “ GAAP Intangible Value ” factor that augments book value by adding intangibles derived from capitalizing R&D and a portion of SG&A found in GAAP income statements (per Lev and Gu).
Second, we create an “ Intangible Value ” factor that uses our definition of intrinsic value that includes both tangible and intangible value. Importantly, this factor goes beyond accounting data to use measures of intangibles extracted from unstructured data using NLP.
The next exhibit focuses on the past decade, which is the period during which traditional value has struggled. We find that GAAP-derived intangible assets were only marginally helpful. The real improvement comes once we unlock the power of non-accounting, unstructured data.
Exhibit 16 Intangible Improvements
Source: Ken French , Sparkline. Tangible Value is a long-short portfolio of the top and bottom quintiles of U.S. equities on book value / market value, market cap weighted (per Fama-French). GAAP Intangible Value is the same except it adds capitalized R&D and SG&A to book value. Intangible Value is the same except it uses our intangible-adjusted intrinsic value metric. We exclude transaction and financing costs for comparability to Fama and French. From 12/31/2009 to 4/30/2021. See important backtest disclosure below.
8
Intangible Value | Jun 2021
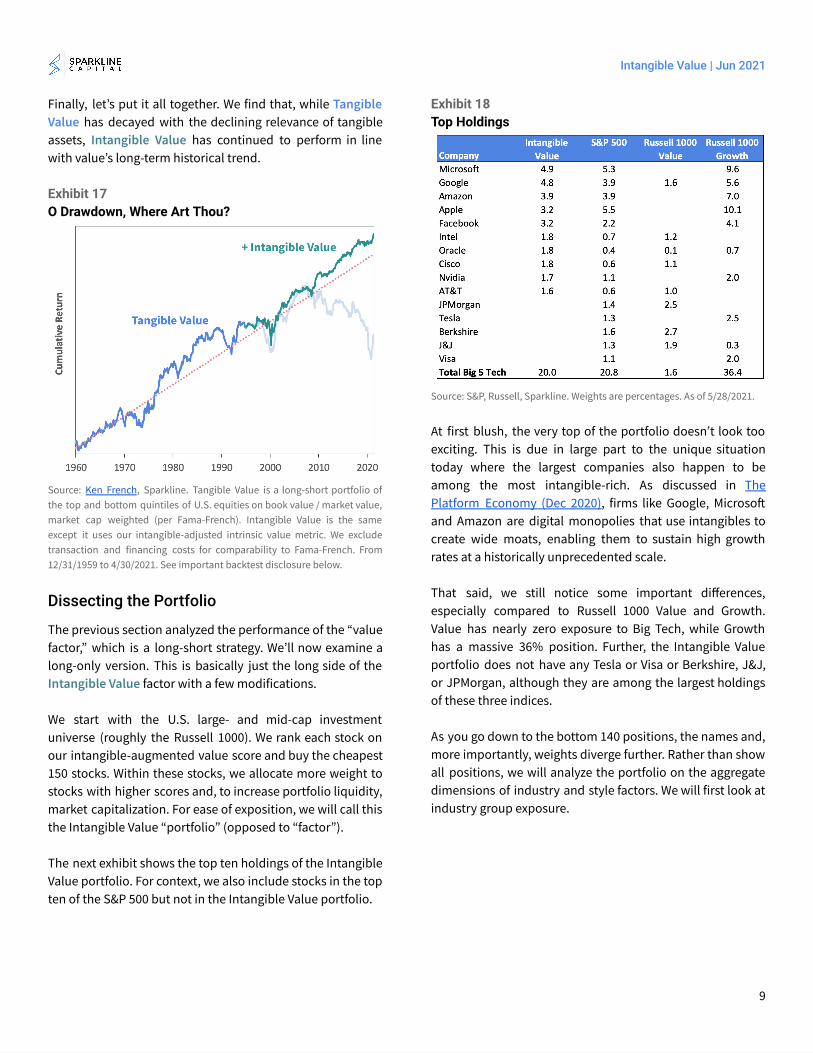
Finally, let’s put it all together. We find that, while Tangible Value has decayed with the declining relevance of tangible assets, Intangible Value has continued to perform in line with value’s long-term historical trend.
Exhibit 17 O Drawdown, Where Art Thou?
Source: Ken French , Sparkline. Tangible Value is a long-short portfolio of the top and bottom quintiles of U.S. equities on book value / market value, market cap weighted (per Fama-French). Intangible Value is the same except it uses our intangible-adjusted intrinsic value metric. We exclude transaction and financing costs for comparability to Fama-French. From 12/31/1959 to 4/30/2021. See important backtest disclosure below.
Dissecting the Portfolio
The previous section analyzed the performance of the “value factor,” which is a long-short strategy. We’ll now examine a long-only version. This is basically just the long side of the Intangible Value factor with a few modifications.
We start with the U.S. large- and mid-cap investment universe (roughly the Russell 1000). We rank each stock on our intangible-augmented value score and buy the cheapest 150 stocks. Within these stocks, we allocate more weight to stocks with higher scores and, to increase portfolio liquidity, market capitalization. For ease of exposition, we will call this the Intangible Value “portfolio” (opposed to “factor”).
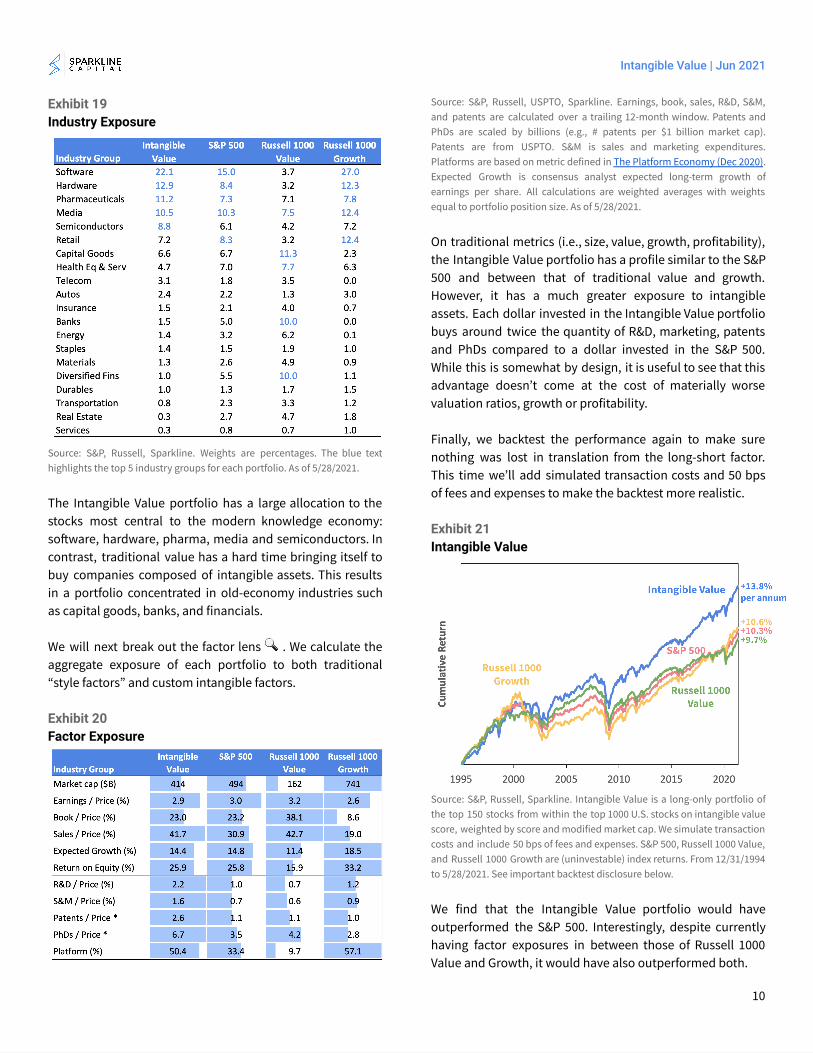
The next exhibit shows the top ten holdings of the Intangible Value portfolio. For context, we also include stocks in the top ten of the S&P 500 but not in the Intangible Value portfolio.
Exhibit 18 Top Holdings
Source: S&P, Russell, Sparkline. Weights are percentages. As of 5/28/2021.
At first blush, the very top of the portfolio doesn’t look too exciting. This is due in large part to the unique situation today where the largest companies also happen to be among the most intangible-rich. As discussed in The Platform Economy (Dec 2020) , firms like Google, Microso� and Amazon are digital monopolies that use intangibles to create wide moats, enabling them to sustain high growth rates at a historically unprecedented scale.
That said, we still notice some important differences, especially compared to Russell 1000 Value and Growth. Value has nearly zero exposure to Big Tech, while Growth has a massive 36% position. Further, the Intangible Value portfolio does not have any Tesla or Visa or Berkshire, J&J, or JPMorgan, although they are among the largest holdings of these three indices.
As you go down to the bottom 140 positions, the names and, more importantly, weights diverge further. Rather than show all positions, we will analyze the portfolio on the aggregate dimensions of industry and style factors. We will first look at industry group exposure.
9
Intangible Value | Jun 2021
Exhibit 19 Industry Exposure
Source: S&P, Russell, Sparkline. Weights are percentages. The blue text highlights the top 5 industry groups for each portfolio. As of 5/28/2021.
The Intangible Value portfolio has a large allocation to the stocks most central to the modern knowledge economy: so�ware, hardware, pharma, media and semiconductors. In contrast, traditional value has a hard time bringing itself to buy companies composed of intangible assets. This results in a portfolio concentrated in old-economy industries such as capital goods, banks, and financials.
We will next break out the factor lens 🔍 . We calculate the aggregate exposure of each portfolio to both traditional “style factors” and custom intangible factors.
Exhibit 20 Factor Exposure
Source: S&P, Russell, USPTO, Sparkline. Earnings, book, sales, R&D, S&M, and patents are calculated over a trailing 12-month window. Patents and PhDs are scaled by billions (e.g., # patents per $1 billion market cap). Patents are from USPTO. S&M is sales and marketing expenditures. Platforms are based on metric defined in The Platform Economy (Dec 2020) . Expected Growth is consensus analyst expected long-term growth of earnings per share. All calculations are weighted averages with weights equal to portfolio position size. As of 5/28/2021.
On traditional metrics (i.e., size, value, growth, profitability), the Intangible Value portfolio has a profile similar to the S&P 500 and between that of traditional value and growth. However, it has a much greater exposure to intangible assets. Each dollar invested in the Intangible Value portfolio buys around twice the quantity of R&D, marketing, patents and PhDs compared to a dollar invested in the S&P 500. While this is somewhat by design, it is useful to see that this advantage doesn’t come at the cost of materially worse valuation ratios, growth or profitability.
Finally, we backtest the performance again to make sure nothing was lost in translation from the long-short factor. This time we’ll add simulated transaction costs and 50 bps of fees and expenses to make the backtest more realistic.
Exhibit 21 Intangible Value
Source: S&P, Russell, Sparkline. Intangible Value is a long-only portfolio of the top 150 stocks from within the top 1000 U.S. stocks on intangible value score, weighted by score and modified market cap. We simulate transaction costs and include 50 bps of fees and expenses. S&P 500, Russell 1000 Value, and Russell 1000 Growth are (uninvestable) index returns. From 12/31/1994 to 5/28/2021. See important backtest disclosure below.
We find that the Intangible Value portfolio would have outperformed the S&P 500. Interestingly, despite currently having factor exposures in between those of Russell 1000 Value and Growth, it would have also outperformed both.
10
Intangible Value | Jun 2021
Think Outside the Style Box 📦 Style Boxed In
As quantitative managers, we have benefited professionally from the rising tide of factor-based investing. However, we believe that the “factorization” of the investment industry has at this point reached an excessive level and is now actually contributing to its stagnation.
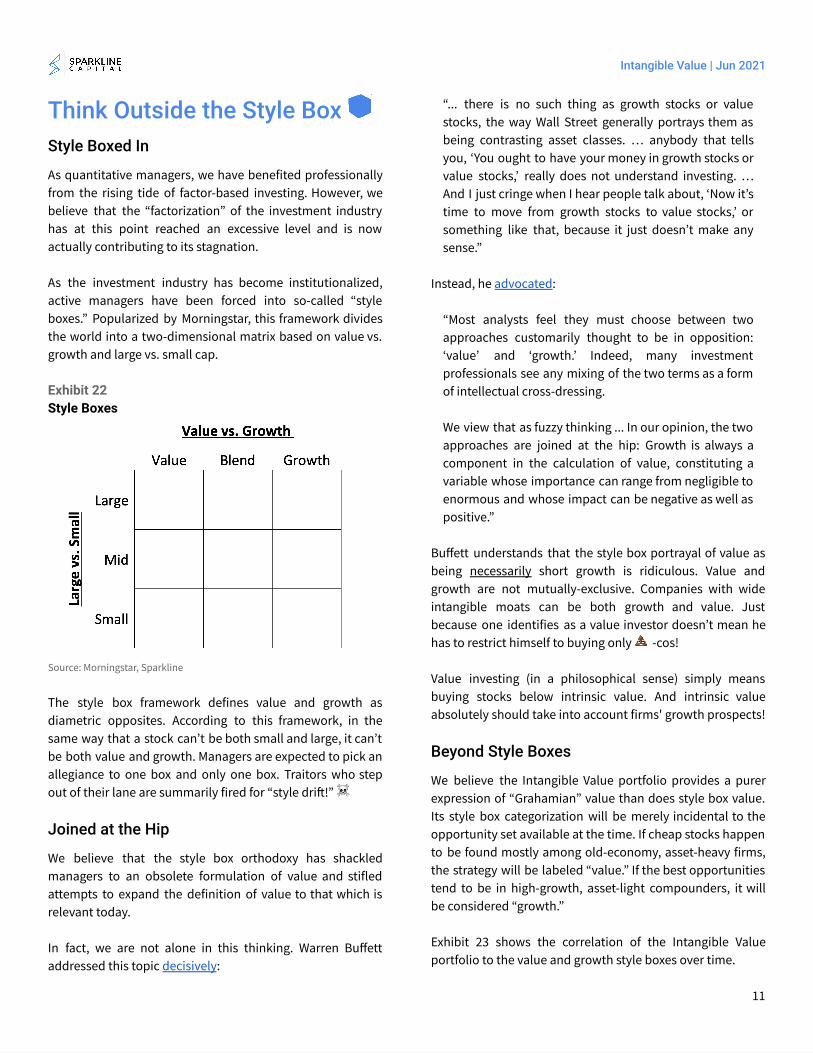
As the investment industry has become institutionalized, active managers have been forced into so-called “style boxes.” Popularized by Morningstar, this framework divides the world into a two-dimensional matrix based on value vs. growth and large vs. small cap.
Exhibit 22 Style Boxes
Source: Morningstar, Sparkline
The style box framework defines value and growth as diametric opposites. According to this framework, in the same way that a stock can’t be both small and large, it can’t be both value and growth. Managers are expected to pick an allegiance to one box and only one box. Traitors who step out of their lane are summarily fired for “style dri�!” ☠
Joined at the Hip
We believe that the style box orthodoxy has shackled managers to an obsolete formulation of value and stifled attempts to expand the definition of value to that which is relevant today.
In fact, we are not alone in this thinking. Warren Buffett addressed this topic decisively :
“... there is no such thing as growth stocks or value stocks, the way Wall Street generally portrays them as being contrasting asset classes. … anybody that tells you, ‘You ought to have your money in growth stocks or value stocks,’ really does not understand investing. … And I just cringe when I hear people talk about, ‘Now it’s time to move from growth stocks to value stocks,’ or something like that, because it just doesn’t make any sense.”
Instead, he advocated :
“Most analysts feel they must choose between two approaches customarily thought to be in opposition: ‘value’ and ‘growth.’ Indeed, many investment professionals see any mixing of the two terms as a form of intellectual cross-dressing.
We view that as fuzzy thinking ... In our opinion, the two approaches are joined at the hip: Growth is always a component in the calculation of value, constituting a variable whose importance can range from negligible to enormous and whose impact can be negative as well as positive.”
Buffett understands that the style box portrayal of value as being necessarily short growth is ridiculous. Value and growth are not mutually-exclusive. Companies with wide intangible moats can be both growth and value. Just because one identifies as a value investor doesn’t mean he has to restrict himself to buying only 💩 -cos!
Value investing (in a philosophical sense) simply means buying stocks below intrinsic value. And intrinsic value absolutely should take into account firms' growth prospects!
Beyond Style Boxes
We believe the Intangible Value portfolio provides a purer expression of “Grahamian” value than does style box value. Its style box categorization will be merely incidental to the opportunity set available at the time. If cheap stocks happen to be found mostly among old-economy, asset-heavy firms, the strategy will be labeled “value.” If the best opportunities tend to be in high-growth, asset-light compounders, it will be considered “growth.”
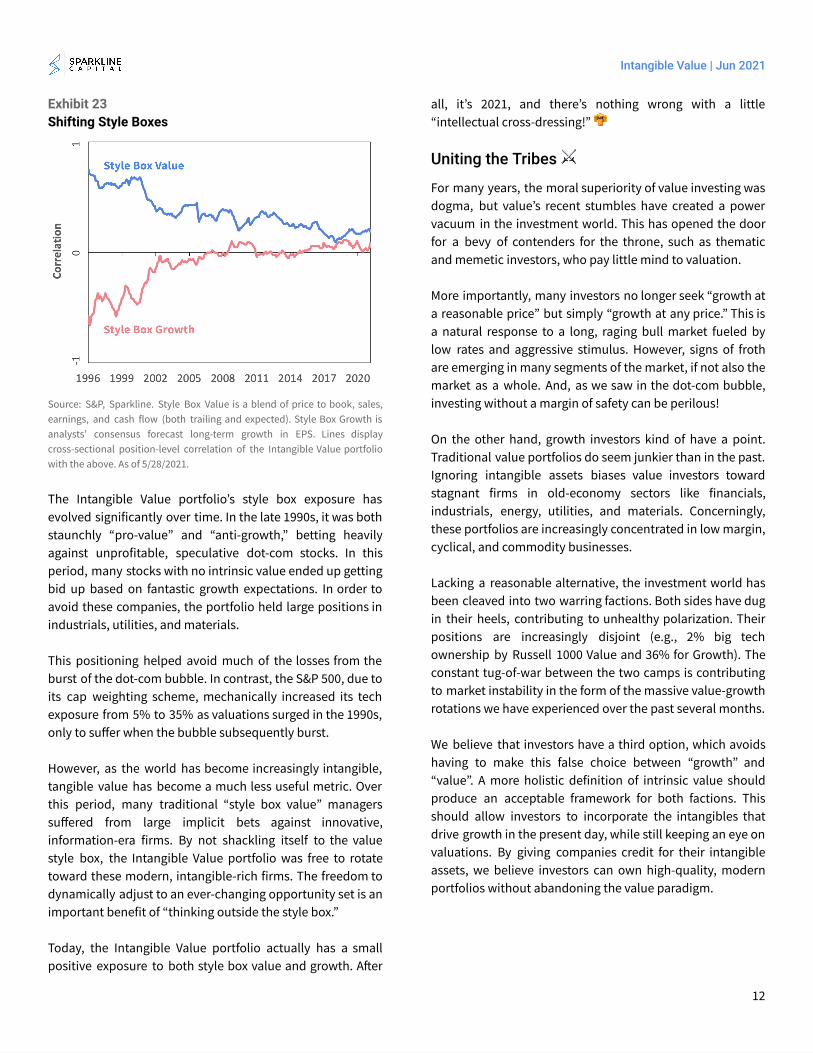
Exhibit 23 shows the correlation of the Intangible Value portfolio to the value and growth style boxes over time.
11
Intangible Value | Jun 2021
Exhibit 23 Shifting Style Boxes
Source: S&P, Sparkline. Style Box Value is a blend of price to book, sales, earnings, and cash flow (both trailing and expected). Style Box Growth is analysts’ consensus forecast long-term growth in EPS. Lines display cross-sectional position-level correlation of the Intangible Value portfolio with the above. As of 5/28/2021.
The Intangible Value portfolio’s style box exposure has evolved significantly over time. In the late 1990s, it was both staunchly “pro-value” and “anti-growth,” betting heavily against unprofitable, speculative dot-com stocks. In this period, many stocks with no intrinsic value ended up getting bid up based on fantastic growth expectations. In order to avoid these companies, the portfolio held large positions in industrials, utilities, and materials.
This positioning helped avoid much of the losses from the burst of the dot-com bubble. In contrast, the S&P 500, due to its cap weighting scheme, mechanically increased its tech exposure from 5% to 35% as valuations surged in the 1990s, only to suffer when the bubble subsequently burst.
However, as the world has become increasingly intangible, tangible value has become a much less useful metric. Over this period, many traditional “style box value” managers suffered from large implicit bets against innovative, information-era firms. By not shackling itself to the value style box, the Intangible Value portfolio was free to rotate toward these modern, intangible-rich firms. The freedom to dynamically adjust to an ever-changing opportunity set is an important benefit of “thinking outside the style box.”
Today, the Intangible Value portfolio actually has a small positive exposure to both style box value and growth. A�er
all, it’s 2021, and there’s nothing wrong with a little “intellectual cross-dressing!” 👘
Uniting the Tribes ⚔
For many years, the moral superiority of value investing was dogma, but value’s recent stumbles have created a power vacuum in the investment world. This has opened the door for a bevy of contenders for the throne, such as thematic and memetic investors, who pay little mind to valuation.
More importantly, many investors no longer seek “growth at a reasonable price” but simply “growth at any price.” This is a natural response to a long, raging bull market fueled by low rates and aggressive stimulus. However, signs of froth are emerging in many segments of the market, if not also the market as a whole. And, as we saw in the dot-com bubble, investing without a margin of safety can be perilous!
On the other hand, growth investors kind of have a point. Traditional value portfolios do seem junkier than in the past. Ignoring intangible assets biases value investors toward stagnant firms in old-economy sectors like financials, industrials, energy, utilities, and materials. Concerningly, these portfolios are increasingly concentrated in low margin, cyclical, and commodity businesses.
Lacking a reasonable alternative, the investment world has been cleaved into two warring factions. Both sides have dug in their heels, contributing to unhealthy polarization. Their positions are increasingly disjoint (e.g., 2% big tech ownership by Russell 1000 Value and 36% for Growth). The constant tug-of-war between the two camps is contributing to market instability in the form of the massive value-growth rotations we have experienced over the past several months.
We believe that investors have a third option, which avoids having to make this false choice between “growth” and “value”. A more holistic definition of intrinsic value should produce an acceptable framework for both factions. This should allow investors to incorporate the intangibles that drive growth in the present day, while still keeping an eye on valuations. By giving companies credit for their intangible assets, we believe investors can own high-quality, modern portfolios without abandoning the value paradigm.
12
Intangible Value | Jun 2021
Conclusion Value investing has struggled over the past decade. We believe this is due to its omission of intangibles, which are becoming the dominant form of value in the information economy. We show that adding intangible value to the traditional definition of intrinsic value would have helped value avoid its recent travails.
Intrinsic Value = Tangible Value + Intangible Value
Measuring intangibles can be challenging. Due to the many limitations of structured accounting data, investors must seek out alternative data sources in their quest to quantify intangibles. Since these datasets are generally unstructured, investors must equip themselves with modern NLP tools.
We believe value investing has a bright future if we can break the style box orthodoxy and embrace a more modern conception of value. We are fortunate that the digital age has armed us with powerful new data and tools for this grand adventure. Let’s get value investing back on track!
Kai Wu Founder & CIO, Sparkline Capital LP
Kai Wu is the founder and Chief Investment Officer of Sparkline Capital, an investment management firm applying state-of-the-art machine learning and computing to uncover alpha in large, unstructured data sets.
Prior to Sparkline, Kai co-founded and co-managed Kaleidoscope Capital, a quantitative hedge fund in Boston. With one other partner, he grew Kaleidoscope to $350 million in assets from institutional investors. Kai jointly managed all aspects of the company, including technology, investments, operations, trading, investor relations, and recruiting.
Previously, Kai worked at GMO, where he was a member of Jeremy Grantham’s $40 billion asset allocation team. He also worked closely with the firm's equity and macro investment teams in Boston, San Francisco, London, and Sydney.
Kai graduated from Harvard College Magna Cum Laude and Phi Beta Kappa.
Disclaimer This paper is solely for informational purposes and is not an offer or solicitation for the purchase or sale of any security, nor is it to be construed as legal or tax advice. References to securities and strategies are for illustrative purposes only and do not constitute buy or sell recommendations. The information in this report should not be used as the basis for any investment decisions.
We make no representation or warranty as to the accuracy or completeness of the information contained in this report, including third-party data sources. This paper may contain forward-looking statements or projections based on our current beliefs and information believed to be reasonable at the time. However, such statements necessarily involve risk and uncertainty and should not be used as the basis for investment decisions. The views expressed are as of the publication date and subject to change at any time.
13
Intangible Value | Jun 2021
Backtest Disclosure The performance shown reflects the simulated model performance an investor may have obtained had it invested in the manner shown but does not represent performance that any investor actually attained. This performance is not representative of any actual investment strategy or product and is provided solely for informational purposes.
Hypothetical performance has many significant limitations and may not reflect the impact of material economic and market factors if funds were actually managed in the manner shown. Actual performance may differ substantially from simulated model performance. Simulated performance may be prepared with the benefit of hindsight and changes in methodology may have a material impact on the simulated returns presented.
The simulated model performance is adjusted to reflect the reinvestment of dividends and other income. Simulations that include estimated transaction costs assume the payment of the historical bid-ask spread and $0.01 in commissions. Simulated fees, expenses, and transaction costs do not represent actual costs paid.
Index returns are shown for informational purposes only and/or as a basis of comparison. Indexes are unmanaged and do not reflect management or trading fees. One cannot invest directly in an index. The S&P 500 is a popular gauge of large-cap U.S. equities that includes 500 leading companies. The Russell 1000 Index consists of the approximately top 1000 U.S. stocks by market cap. The Russell 1000 Value (Growth) Index includes those Russell 1000 companies with lower (higher) price-to-book ratios and expected and historical growth rates.
No representation or warranty is made as to the reasonableness of the methodology used or that all methodologies used in achieving the returns have been stated or fully considered. There can be no assurance that such hypothetical performance is achievable in the future. Past performance is no guarantee of future results.
14


![CHAPTER 12 INTANGIBLE ASSETS - John Wiley & Sons · based on a value-in-use estimate.4 Because the fair value of the division exceeds the Chapter 12 Intangible Assets [1]Intangible](https://img.pdfslide.net/doc/110x75/5af3f3dd7f8b9a9e598bfe75/chapter-12-intangible-assets-john-wiley-on-a-value-in-use-estimate4-because-the.jpg)


![INTANGIBLE VALUE –FACT OR FICTION - AI Home | … · [IAS 38.8] 3. INTANGIBLE VALUE –FACT OR FICTION ... 2.36 INTANGIBLE PROPERTY (INTANGIBLE ASSETS): Non-physical assets, …](https://img.pdfslide.net/doc/110x75/5af0812f7f8b9ac2468e1bc2/intangible-value-fact-or-fiction-ai-home-ias-388-3-intangible-value.jpg)