Embed Size (px)
Citation preview
INTEGRATED ANALYSIS OF ASTER AND LANDSAT ETM DATA TO MAP EXPLORATION TARGETS IN THE MUTEH GOLD-MINING AREA, IRAN
H. Asadi Haroni a * and A. Lavafan a
aIsfahan University of Technology, Isfahan, Iran (* [email protected])
KEY WORDS: Exploration, Gold Deposits, ASTER, ETM, Iran, GIS, Data Integration ABSTRACT: In this research, first a spectral analysis was performed on the ASTER and ETM Landsat Imagery data of Muteh gold mining area, located in central part of Iran, to map hydrothermal alteration associated with a shear zone gold mineralization. The Aster scene, covering the study area, was analysed for general clay alteration and sericitic alteration, using a least square method. An individual mineral probability map of clay and sericite alteration were produced using relevant image spectra. Landsat ETM imagery data of the same area were also analysed to map hydrothermal alteration associated with general clay minerals and Iron oxides, associated with gold mineralizatoin. Integrated analysis of processed ASTER and ETM as well as geological data was used to map targets for ground, follow-up, gold exploration in the Muteh gold mining area and its surrounding region.
* Corresponding author. H. Asadi Haroni, Mining Department, Isfahan University of Technology, Iran ([email protected])
1. INTRODUCTION
Iran is located in the Alpine-Himalian orogenic and metalogenic belt and has high potentials for gold and copper deposits. In Iran, due to the unsystematic gold exploration and lack of modern exploration techniques, there are still several unexplored outcropping gold deposits. High resolution remote sensing data and Geographic Information Systems (GIS) are important tools to map subtle anomalies associated with unknown gold deposits (Crosta et al, 2005 and Asadi, 2000). Muteh is the only active gold mine in Iran and is located in the northern part of the Isfahan province in the central part of Iran (Fig. 1). There are 9 gold prospects in the Muteh gold mining area, and so far only one of them (Senjedeh) is being mined. Gold mineralization at Muteh occurs in the deformed-altered shear zones of Precambrian meta volcanics and schists. The main types of hydrothermal alterations, associated with gold mineralization, are clay-sericite alterations, silicification and carbonatization. In this research, a spectral analysis was performed on the ASTER and ETM satellite imagery data of the Muteh gold mining area to map spectral signatures associated with the hydrothermal alterations, associated with the gold mineralization. Spectral signatures of hydrothermal alterations at the known Senjedeh gold deposit, along with the potential host lithologies, were integrated in a GIS environment to model similar signatures associated with unknown gold mineralized zones, surrounding the Senjedeh gold deposit.
2. ASTER IMAGERY DATA
The Advanced Space borne Thermal Emission and Reflection Radiometer (ASTER) which is aboard the Earth observing system (EOS) TERRA platform, records solar radiation in 14 spectral bands. It measures reflected radiation in 3 bands between 0.52 and 0.86 µm (VNIR); in 6 bands from 1.6 to 2.43 µm (SWIR), and emitted radiation in 5 bands in the 8.125 to 11.65µm wavelength region (TIR). The resolution of VNIR, SWIR, and TIR is 15m, 30m and 90m respectively (Fujisada, 1995).
Senjedeh Au Deposit
Muteh Village
Muteh Gold Minng
Muteh Au Plant
Figure 1. Location Map of the Muteh Gold mining area (ASTER-VNIR231, UTM Zone 39) With the spectral resolution provided by ASTER, identification of specific alteration assemblages becomes feasible. The VNIR, SWIR, and TIR wavelength regions provide complementary data for lithologic mapping and exploration through alteration mapping. Already ASTER data have been extensively used for these purposes (Rowan et al, 2005). A 568×568 pixel subscene of ASTER data with Path/Row/View: 164/105/3 covers the study area. The images were radiometrically corrected and ortho-rectified using UTM zone 39N and the WGS-84 ellipsoid by Geosense company in the Netherlands. For the ortho-rectification, Geosense used SRTM and ortho-rectified Landsat ETM as reference material.
The orthorectified images have a positional accuracy better than 30m, with respect to the orthorectified Landsat scene. 2.1 Processing
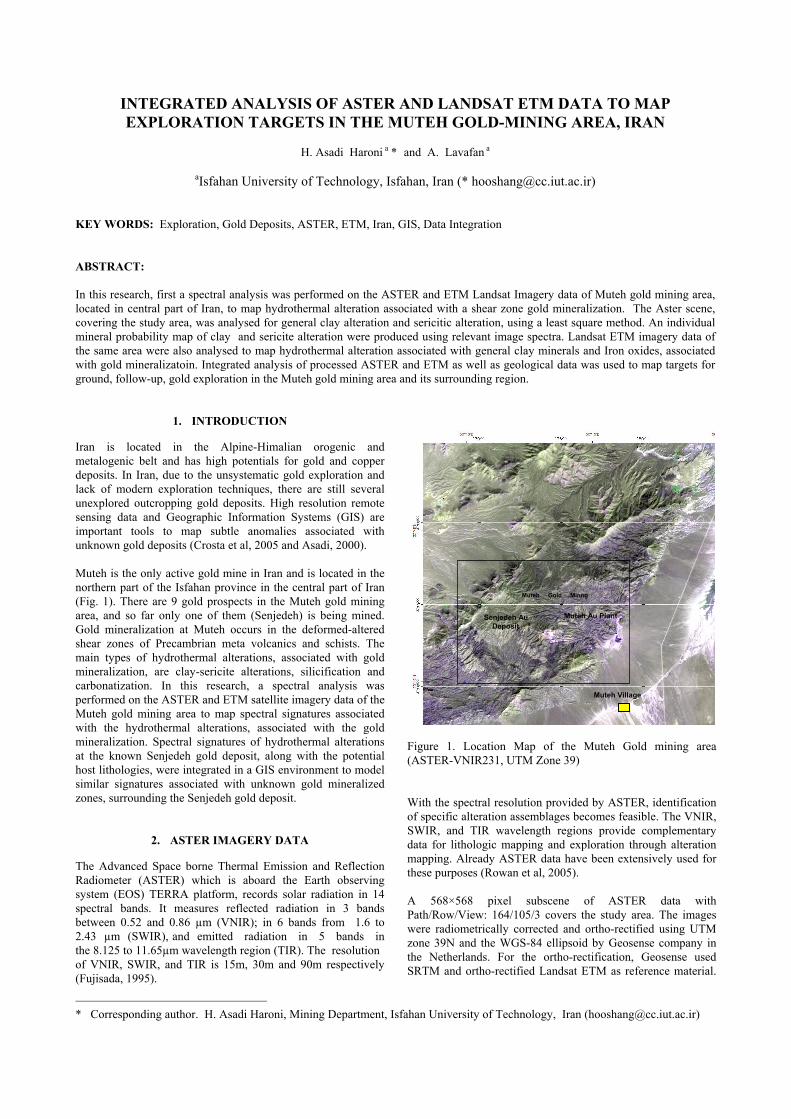
Both colour composite (RGB) and a least square fit (Ls-Fit) method were applied in the SWIR data of the Muteh gold mining area, to map spectral signatures of hydrothermal alteration (caly minerals and sericite), associated with gold mineralization. In a color composite image, gray scale images are transformed into a synthetic color image, showing ground features in three combined red, green, blue colours. While, LS-Fit method performs a linear band prediction using a least squares fitting technique. It can be used to find regions of anomalous spectral response (e.g. altered clay minerals) in a data set. It calculates the covariance of the input data and uses it to predict the selected band as a linear combination of the predictor bands. The difference (residual) between the actual band and the modeled band is calculated and output as an image. Pixels with a large residual (positive and negative) indicate the presence of a feature not predicted (that is an absorption band). The predicted band can be calculated using existing statistics or from new statistics. Figure 2 is a colour composite image (SWIR468) of the Muteh gold mining area and its surrounding region, showing the general clay-sericite hydrothermal alteration as pink-red colour, which could be associated with gold mineralization. The Senjedeh gold deposit as well as several other zones, in the 5-8 km NE of Senjedeh deposit, are characterized by these alterations.
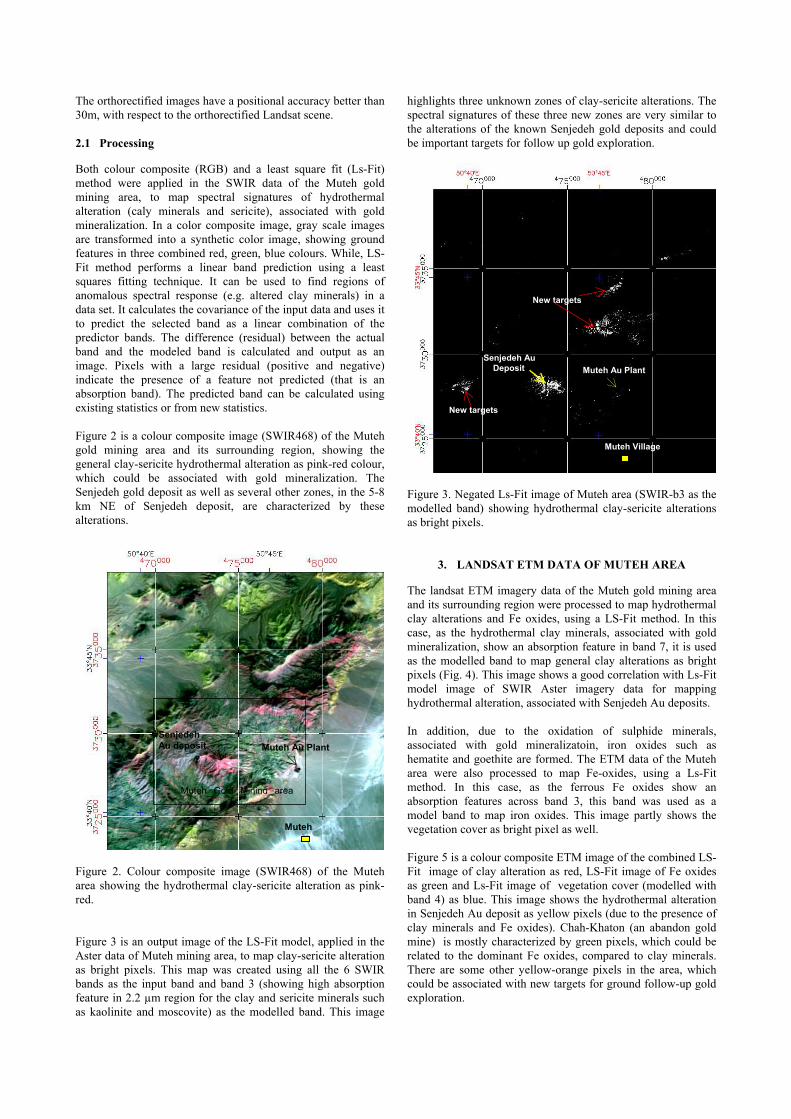
Figure 2. Colour composite image (SWIR468) of the Muteh area showing the hydrothermal clay-sericite alteration as pink-red. Figure 3 is an output image of the LS-Fit model, applied in the Aster data of Muteh mining area, to map clay-sericite alteration as bright pixels. This map was created using all the 6 SWIR bands as the input band and band 3 (showing high absorption feature in 2.2 µm region for the clay and sericite minerals such as kaolinite and moscovite) as the modelled band. This image
highlights three unknown zones of clay-sericite alterations. The spectral signatures of these three new zones are very similar to the alterations of the known Senjedeh gold deposits and could be important targets for follow up gold exploration.
Senjedeh Au Deposit
Muteh Village
Muteh Au Plant
New targets
New targets
Figure 3. Negated Ls-Fit image of Muteh area (SWIR-b3 as the modelled band) showing hydrothermal clay-sericite alterations as bright pixels.
Senjedeh Au deposit
Muteh
Muteh Gold Mining area
Muteh Au Plant
3. LANDSAT ETM DATA OF MUTEH AREA
The landsat ETM imagery data of the Muteh gold mining area and its surrounding region were processed to map hydrothermal clay alterations and Fe oxides, using a LS-Fit method. In this case, as the hydrothermal clay minerals, associated with gold mineralization, show an absorption feature in band 7, it is used as the modelled band to map general clay alterations as bright pixels (Fig. 4). This image shows a good correlation with Ls-Fit model image of SWIR Aster imagery data for mapping hydrothermal alteration, associated with Senjedeh Au deposits. In addition, due to the oxidation of sulphide minerals, associated with gold mineralizatoin, iron oxides such as hematite and goethite are formed. The ETM data of the Muteh area were also processed to map Fe-oxides, using a Ls-Fit method. In this case, as the ferrous Fe oxides show an absorption features across band 3, this band was used as a model band to map iron oxides. This image partly shows the vegetation cover as bright pixel as well. Figure 5 is a colour composite ETM image of the combined LS-Fit image of clay alteration as red, LS-Fit image of Fe oxides as green and Ls-Fit image of vegetation cover (modelled with band 4) as blue. This image shows the hydrothermal alteration in Senjedeh Au deposit as yellow pixels (due to the presence of clay minerals and Fe oxides). Chah-Khaton (an abandon gold mine) is mostly characterized by green pixels, which could be related to the dominant Fe oxides, compared to clay minerals. There are some other yellow-orange pixels in the area, which could be associated with new targets for ground follow-up gold exploration.
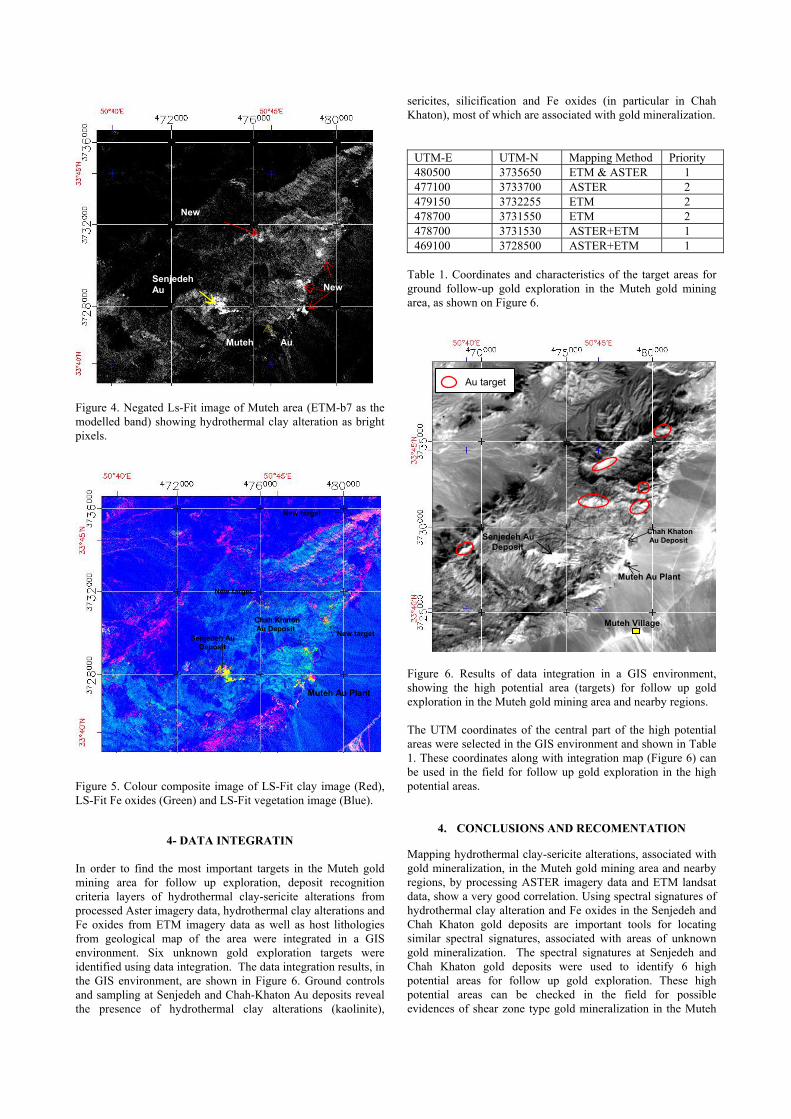
Figure 4. Negated Ls-Fit image of Muteh area (ETM-b7 as the modelled band) showing hydrothermal clay alteration as bright pixels.
Figure 5. Colour composite image of LS-Fit clay image (Red), LS-Fit Fe oxides (Green) and LS-Fit vegetation image (Blue).
4- DATA INTEGRATIN In order to find the most important targets in the Muteh gold mining area for follow up exploration, deposit recognition criteria layers of hydrothermal clay-sericite alterations from processed Aster imagery data, hydrothermal clay alterations and Fe oxides from ETM imagery data as well as host lithologies from geological map of the area were integrated in a GIS environment. Six unknown gold exploration targets were identified using data integration. The data integration results, in the GIS environment, are shown in Figure 6. Ground controls and sampling at Senjedeh and Chah-Khaton Au deposits reveal the presence of hydrothermal clay alterations (kaolinite),
sericites, silicification and Fe oxides (in particular in Chah Khaton), most of which are associated with gold mineralization.
Senjedeh Au
Muteh Au
New
New
UTM-E UTM-N Mapping Method Priority 480500 3735650 ETM & ASTER 1 477100 3733700 ASTER 2 479150 3732255 ETM 2 478700 3731550 ETM 2 478700 3731530 ASTER+ETM 1 469100 3728500 ASTER+ETM 1
Table 1. Coordinates and characteristics of the target areas for ground follow-up gold exploration in the Muteh gold mining area, as shown on Figure 6.
Senjedeh Au Deposit
Muteh Village
Muteh Au Plant
Chah Khaton Au Deposit
Au target
Senjedeh Au Deposit
Muteh Au Plant
Chah Khaton Au Deposit New target
New target
New target
Figure 6. Results of data integration in a GIS environment, showing the high potential area (targets) for follow up gold exploration in the Muteh gold mining area and nearby regions. The UTM coordinates of the central part of the high potential areas were selected in the GIS environment and shown in Table 1. These coordinates along with integration map (Figure 6) can be used in the field for follow up gold exploration in the high potential areas.
4. CONCLUSIONS AND RECOMENTATION
Mapping hydrothermal clay-sericite alterations, associated with gold mineralization, in the Muteh gold mining area and nearby regions, by processing ASTER imagery data and ETM landsat data, show a very good correlation. Using spectral signatures of hydrothermal clay alteration and Fe oxides in the Senjedeh and Chah Khaton gold deposits are important tools for locating similar spectral signatures, associated with areas of unknown gold mineralization. The spectral signatures at Senjedeh and Chah Khaton gold deposits were used to identify 6 high potential areas for follow up gold exploration. These high potential areas can be checked in the field for possible evidences of shear zone type gold mineralization in the Muteh

area. As the silicification is closely associated with gold mineralization in the Muteh area, it is recommended to map zones of silicification, using thermal infrared ASTER imagery data. References Asadi, H.H., 2000. The Zarshuran gold deposit model applied in a mineral exploration GIS in Iran. PhD dissertation, University of Delft and ITC, The Netherlands, pp. 127-165. Crosta, A.P., Souza Filho, C.R., Azevedo, F. and Brodie, C., 2003. Targeting key alteration minerals in epithermal deposits in Patagonia, Argentina, Using ASTER imagery and principal component analysis, International Journal of Remote sensing, 24, PP. 4233-4240. Rowan, L.C., Mars, J.C., Simpson, C.J., 2005. Lithologic mapping of the Mordor N.T, Anstralia ultramafic complex by using the Advanced Spaceborne Thermal Emission and Reflection Radiometer (ASTER). Remote sensing of Environment, 99, pp. 105-126. Fujisada, H., 1995. Design and performance of ASTER instrument, Proceedings of SPIE, the international society for optical engineering, 2583, PP. 16-25.