Embed Size (px)
Citation preview
Integrated Brand ResponseJenny Craig Case StudyiMedia Brand Summit Presentation
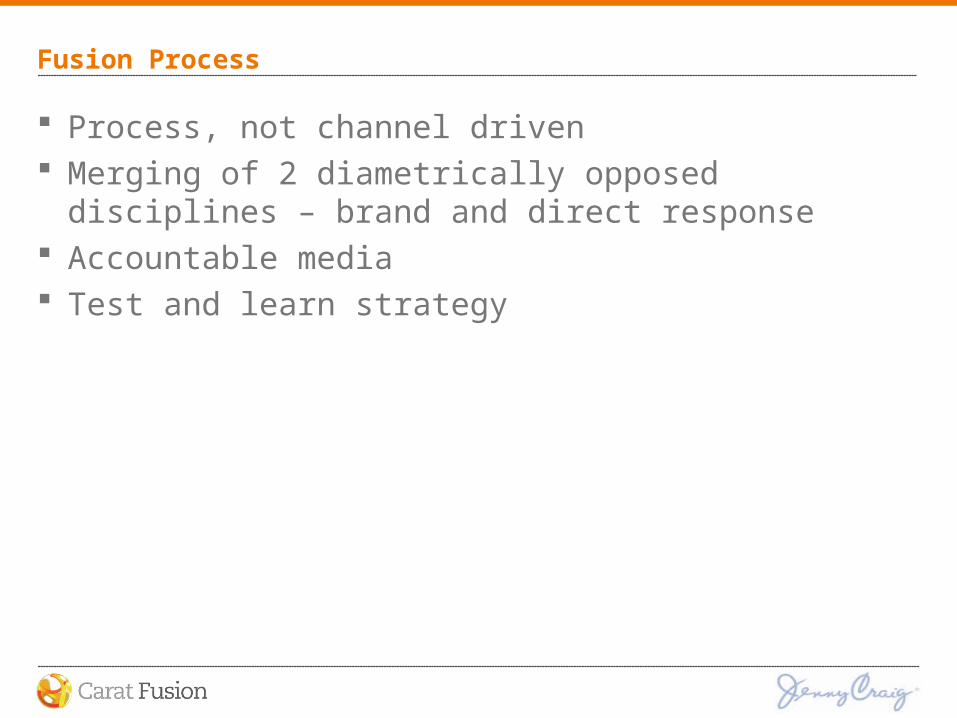
Fusion Process
Process, not channel driven Merging of 2 diametrically opposed disciplines – brand and
direct response Accountable media Test and learn strategy

Jenny Craig – A Pioneer in Blending Brand and Direct
Response
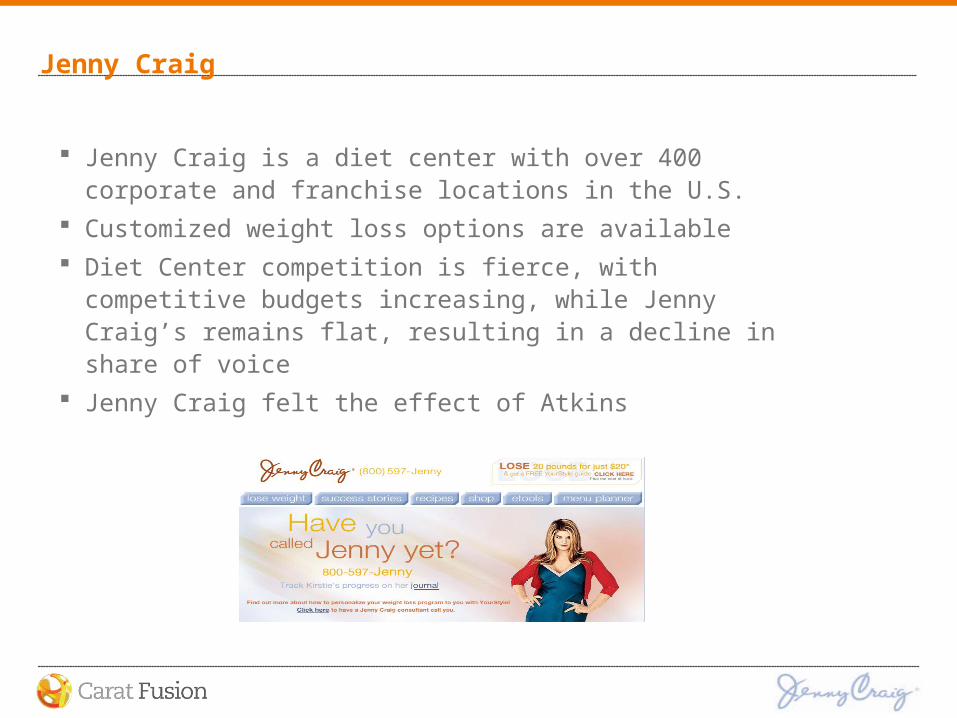
Jenny Craig
Jenny Craig is a diet center with over 400 corporate and franchise locations in the U.S.
Customized weight loss options are available
Diet Center competition is fierce, with competitive budgets increasing, while Jenny Craig’s remains flat, resulting in a decline in share of voice
Jenny Craig felt the effect of Atkins
Campaign Overview
Kirstie Allie campaign launched – January 2005 Desire to make Jenny Craig more contemporary, while
simultaneously driving incremental lead volume Campaign employs a blended strategy of fixed branding and
traditional direct response Must drive brand preference, image enhancement AND
efficient phone volume
Kirstie Alley Campaign
Creative Examples
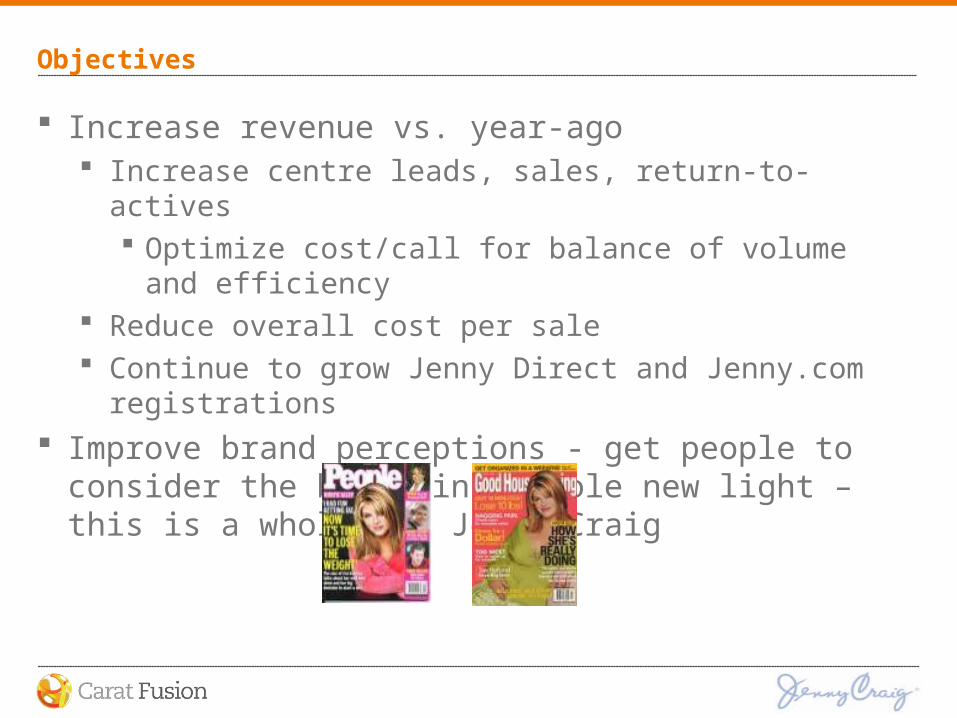
Objectives
Increase revenue vs. year-ago Increase centre leads, sales, return-to-actives
Optimize cost/call for balance of volume and efficiency Reduce overall cost per sale Continue to grow Jenny Direct and Jenny.com registrations
Improve brand perceptions - get people to consider the brand in a whole new light – this is a whole new Jenny Craig
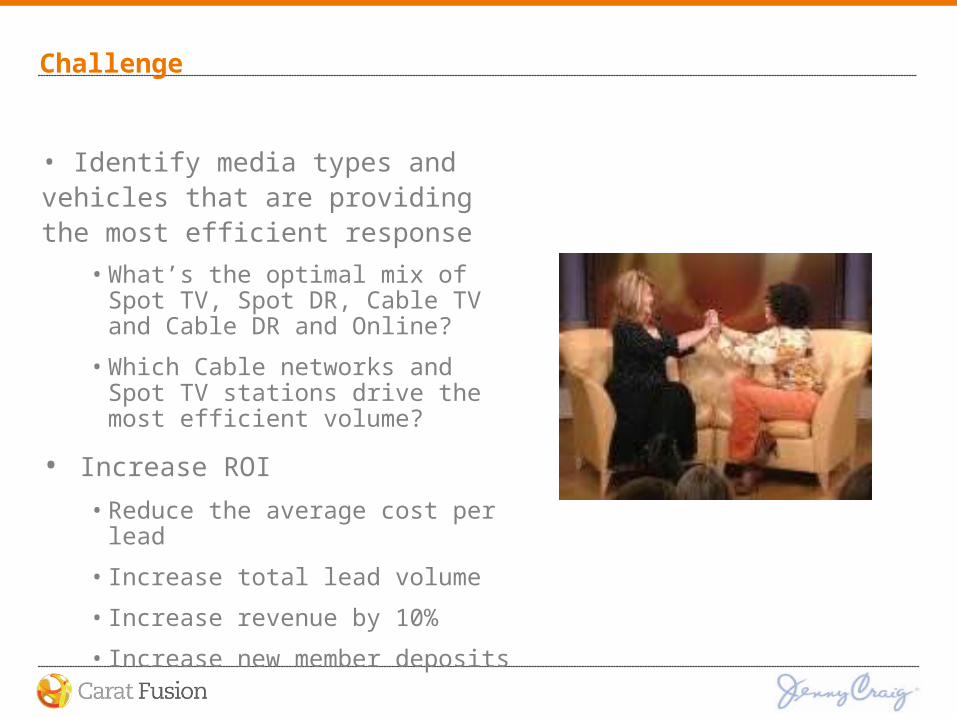
Challenge
• Identify media types and vehicles that are providing the most efficient response
• What’s the optimal mix of Spot TV, Spot DR, Cable TV and Cable DR and Online?
• Which Cable networks and Spot TV stations drive the most efficient volume?
• Increase ROI
• Reduce the average cost per lead
• Increase total lead volume
• Increase revenue by 10%
• Increase new member deposits
MMA
Marketing Effectiveness Realized Forecasting Marketing mix analysis Optimization Portfolio management What-if planning & simulation
Strategy: Finding the Mix to Drive Sales
MMA ROI analysis Revealed several tactical changes to the media mix
investment strategy that could be employed to improve performance metrics
Media mix must be adjusted to optimize volume and efficiency, given flat budget and shrinking share of voice
All strategic media tactics need to focus around increasing lead volume, at an efficient cost per new lead
Solution: MMA’s Optimization
Acted on MMA optimization recommendation Reduced Spot TV spend in top markets
Using Core Direct, evaluated lead metrics, even on fixed $ Reduced Spot DR spend in top markets
Invested Spot DR $ only on historically good performers Reinvested inefficient spot $ onto National Cable DRTV
Tested, evaluated and optimized existing and new networks on a weekly basis
Strategically selected and invested on cable networks based on fixed or DR strengths and CPL efficiencies
Recommended reduced spend on radio
MMA Provided Overall Direction, but…
Half of my advertising is not working – which half? Optimize my offline like my online
Desire to drill down to the individual cable network Core Direct Solution
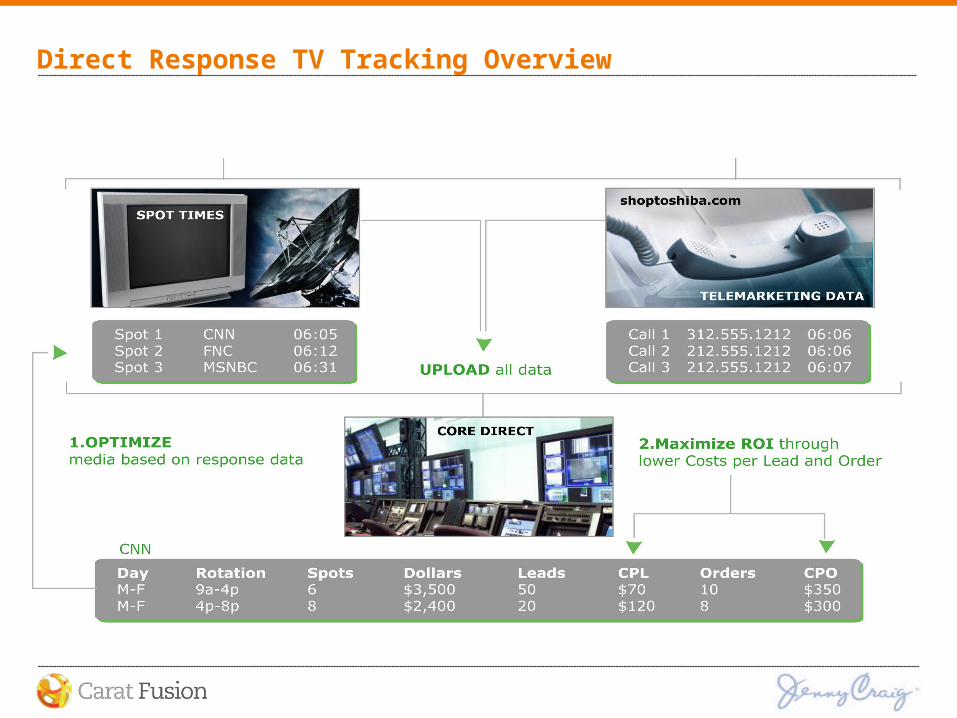
Direct Response TV Tracking Overview
Vanity Number and URL Tracking: Unmatched Superiority
Advantages of vanity numbers and URL’s Increased drag Less expensive during production Consumer friendly
Disadvantages of vanity numbers and URL’s Difficult to track in a “tie” situation where two or more
stations/networks run spots simultaneously Most tracking systems significantly “miss the mark” in
sophistication Computers don’t use existing database, which contains
historical information to determine the media that delivered the call spikes, during a tie
Impossible to accurately track newspaper, network radio
Vanity Number and URL Tracking: Carat’s Proprietary Solution!
In tie situations, Carat’s tracking system delves back into the database for average “spikes” created when a spot runs in a clean environment Applies historical insight to clarify ties
If no prior data exists, Carat’s system adopts an “exponential falloff” approach Assigns calls to spots airing within proximity to each other
The closer the call to the spot, the greater the likelihood the call will be allocated to that spot
Carat’s proprietary system leads the industry, taking the guesswork out of vanity number and web address tracking
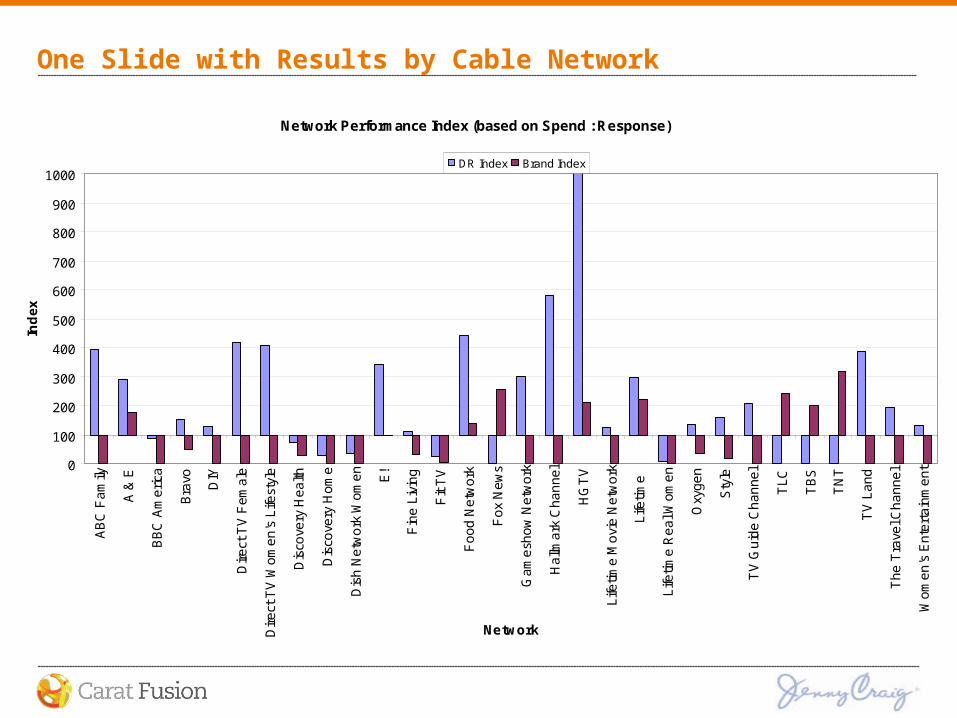
One Slide with Results by Cable Network
Network Performance Index (based on Spend : Response)
0
100
200
300
400
500
600
700
800
900
1000
AB
C F
am
ily
A &
E
BB
C A
me
rica
Bra
vo DIY
Dir
ect
TV
Fe
ma
le
Dir
ect
TV
Wo
me
n's
Life
styl
e
Dis
cove
ry H
ea
lth
Dis
cove
ry H
om
e
Dis
h N
etw
ork
Wo
me
n
E!
Fin
e L
ivin
g
Fit
TV
Fo
od
Ne
two
rk
Fo
x N
ew
s
Ga
me
sho
w N
etw
ork
Ha
llma
rk C
ha
nn
el
HG
TV
Life
time
Mo
vie
Ne
two
rk
Life
time
Life
time
Re
al W
om
en
Oxy
ge
n
Sty
le
TV
Gu
ide
Ch
an
ne
l
TL
C
TB
S
TN
T
TV
La
nd
Th
e T
rave
l Ch
an
ne
l
Wo
me
n's
En
tert
ain
me
nt
Network
Ind
ex
DR Index Brand Index
FY’05 Search Strategy / Performance
FY’05 Search Engine MarketingStrategy / Performance

What we did in FY’05
Campaign Expansion Strategic Dayparting
Google campaigns Daypart bidding (Yahoo Search Marketing)
Utilize Emerging Technologies Contextual Search Local Search
Leverage Niche Areas Engines Keywords / Themes
Cross Channel Integration
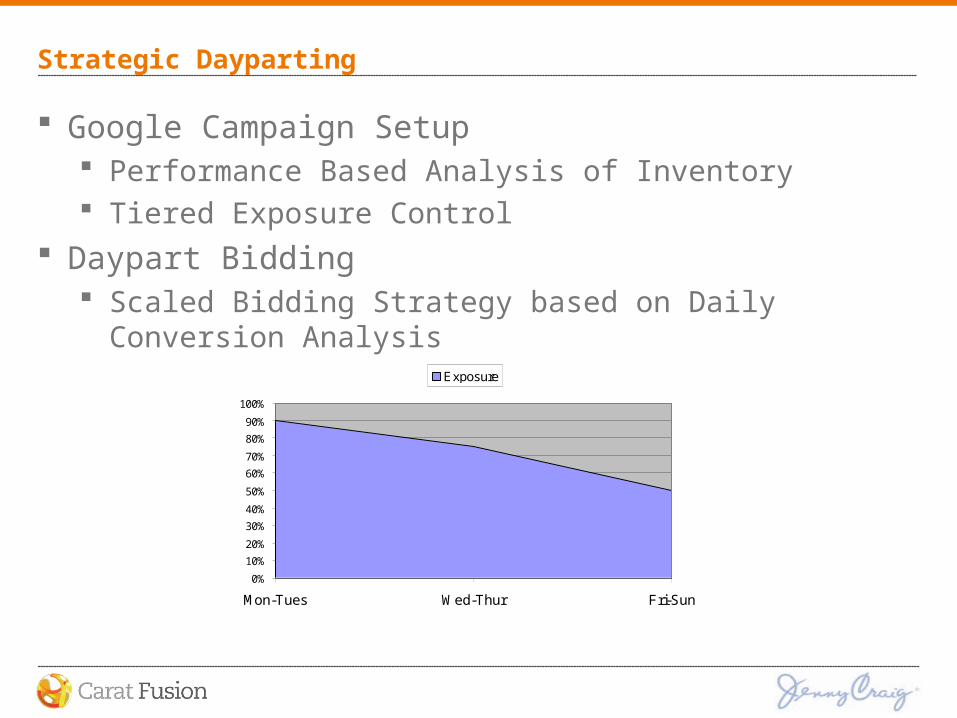
Strategic Dayparting
Google Campaign Setup Performance Based Analysis of Inventory Tiered Exposure Control
Daypart Bidding Scaled Bidding Strategy based on Daily Conversion Analysis
Exposure
0%
10%
20%
30%
40%
50%
60%
70%
80%
90%
100%
Mon-Tues Wed-Thur Fri-Sun
Exposure

Utilize Emerging Technologies
Contextual Search A Media/Search Hybrid, with CPC pricing
Far more exposure than just search Only pay when a user clicks
Ads appear next to relevant articles & content on web sites such as About.com
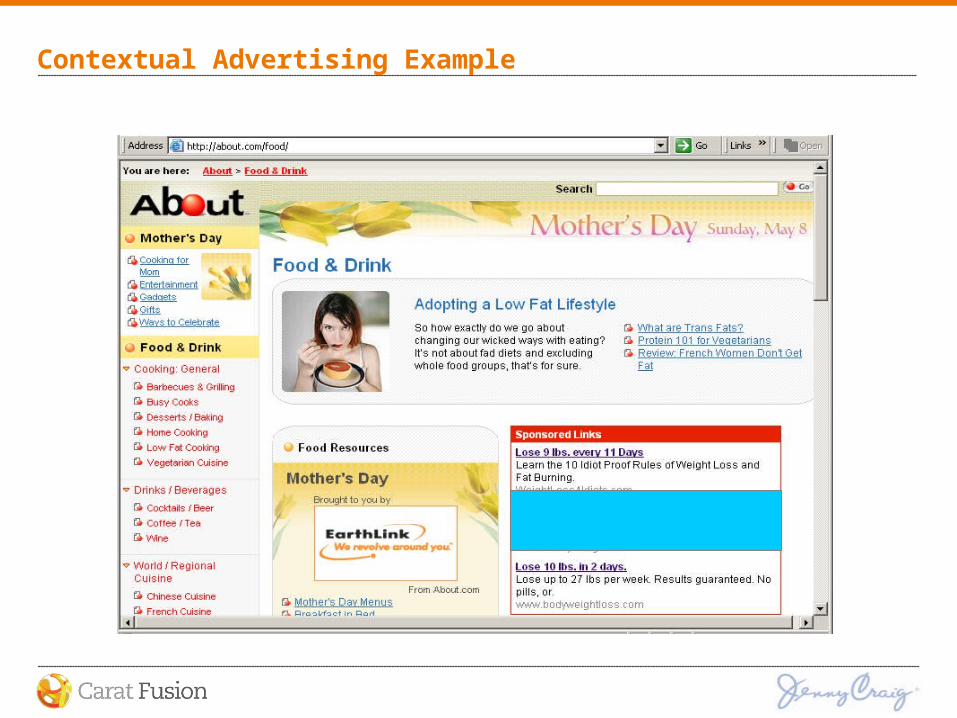
Contextual Advertising Example
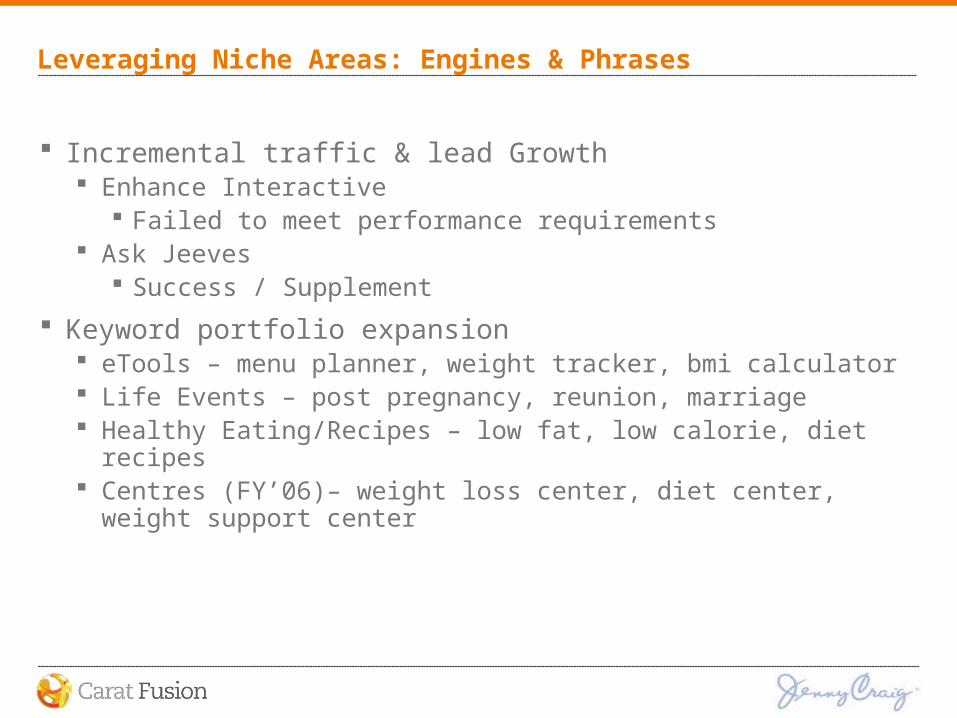
Leveraging Niche Areas: Engines & Phrases
Incremental traffic & lead Growth Enhance Interactive
Failed to meet performance requirements Ask Jeeves
Success / Supplement
Keyword portfolio expansion eTools – menu planner, weight tracker, bmi calculator Life Events – post pregnancy, reunion, marriage Healthy Eating/Recipes – low fat, low calorie, diet recipes Centres (FY’06)– weight loss center, diet center, weight
support center

Cross Channel Integration
Support Celebrity Spokesperson Capture overflow from other channels
What were the results from the strategy?
• Optimization & Expansion efforts help to grow traffic in Fiscal ’05.
• Cost to attain traffic increasing
•Substantial lead increases resulted in Fiscal’05, at a favorable cost per lead.
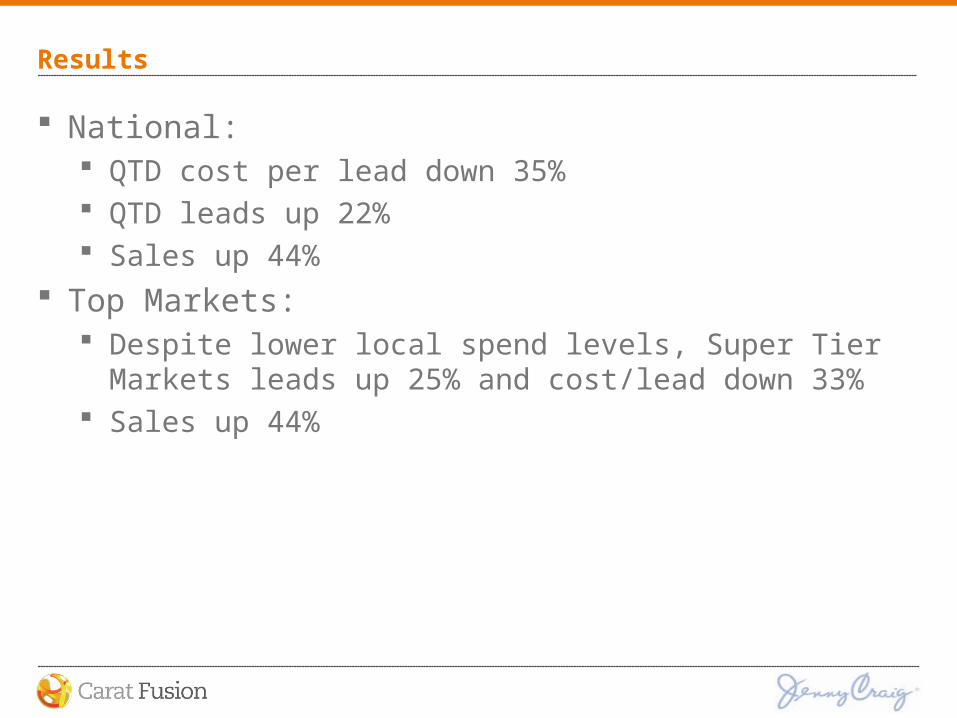
Results
National: QTD cost per lead down 35% QTD leads up 22% Sales up 44%
Top Markets: Despite lower local spend levels, Super Tier Markets leads up
25% and cost/lead down 33% Sales up 44%

Key Learning:
Media Mix modeling provides critical insight that drives additional media optimization
Blended strategy provides the greatest success
Balancing the strengths of fixed and DR, with national and local tactics, drive maximum media ROI