Embed Size (px)
Citation preview
Integrated Simulation and Optimization Scheme ofReal-time Large Scale Water Supply Network:
Applied to Catalunya Case Study
Cong Cong Suna, Vicenc Puiga,∗, Gabriela Cembranoa,b
aAdvanced Control Systems Group at the Institut de Robotica i Informatica Industrial(CSIC-UPC), Llorens i Artigas, 4-6, 08028 Barcelona, (Spain). Tel: +34 68 804 18 55
bCETaqua, Water Technology Centre at Esplugues 75, 08940, Cornella de Llobregat, Barcelona
Abstract
This paper presents an integrated simulation and optimization modelling approach
in order to provide the optimal configuration for the large scale water supply sys-
tem (LSWSS) in real time. Model Predictive Control (MPC) has been chosen
to handle the complex set of objectives and also being shown its effectiveness.
The computation of control strategies by MPC uses a simplified model of the
network dynamics. The use of the combined approach of optimization and simu-
lation contributes to making sure that the effect of more complex dynamics, better
represented by the simulation model, may be taken into account. Coordination
between simulator and optimizer works in a feedback scheme, from which both
real-time interaction and also extensive validation of the proposed solution have
been realized by realistic demonstrations. The Catalunya regional water network
has been used as the case study.
∗Corresponding authorEmail address: [email protected] (Vicenc Puig)The manuscript of this paper has been received on 2nd, February, revised on 06th, June and
accepted on 20th of October, 2014.
Preprint submitted to Journal of Simulation April 22, 2015
Keywords: MPC, simulation, optimization, coordination
1. Introduction
Impacts of climate changes are likely to give rise to uncertainties in water
availability and water demands, which may results in major economical and eco-
logical consequences. [1] presented a discussion of uncertainty paradigms in wa-
ter resources, and provided his views on water management tools that can be used
in the future.
LSWSS, which is composed of various physical elements such as reservoirs,
channels, pumping stations, irrigation area and urban water supply systems, oper-
ates to supply water for municipal, industrial and irrigation needs. Management
of these systems from planning to operation is very challenging since the prob-
lem deals with many complex modelling issues related to inflows, transportation
delays, storage, irrigation and industrial as described at [2]. An effective manage-
ment of LSWSS requires a supervisory control system that takes optimal decisions
about the current operational configuration of the whole network. Such decisions
are implemented automatically or offered as a decision support to operators and
managers. The control system should take into account operating constraints,
costs and consumer demands. The decisions of the control systems are translated
into set-points to individual, localized, lower level systems that optimize the pres-
sure profile to minimize losses by leakage and provide sufficient pressure. The
whole control system responds to changes in network topology (ruptures), typical
daily/weekly profiles, as well as major changes in demand as discussed in [3].
A number of systems analysis techniques involving simulation and optimiza-
tion algorithms have been developed and applied over the last several decades
2
to study LSWSS and also have been reviewed in [4], [5] and [6]. [4] provides
a comprehensive state-of-the-art review of theories and applications of systems
analysis techniques to LSWSS with a strong emphasis on optimization methods.
LSWSS simulation and optimization models were reviewed by [5] who evaluated
the usefulness of each approach for different decision support situations in order
to provide better understanding of modelling tools which could help the practi-
tioner in choosing the appropriate model. [6], in his review on optimal operation
of LSWSS, suggested the need to improve operational effectiveness and efficiency
of water resources systems through the use of computer modelling tools. Contin-
uous development in information technology (hardware and software) creates a
good environment for transition to new decision making tools. Spatial decision
support systems using object oriented programming algorithms are integrating
transparent tools that will be easy to use and understand at [1]. A number of text
books on modelling and systems analysis of water resources including LSWSS
are available like [2], [7], [8], [9], [10], [11] and [12].
MPC has been proven to be one of the most effective and accepted control
strategies for the global optimal operational control of large-scale water networks
in [13]. Applications to different large-scale infrastructures as LSWSS as in [14],
sewer networks in [15], open-flow channel networks at [16] or electrical networks
in [17] prove the applicability of this technique. The main characteristic is that
after the plant dynamical model has been obtained, the MPC design just consists
of expressing the desired performance specifications through different control ob-
jectives (e.g., weights on tracking errors and actuator efforts as in classical linear
quadratic regulation), and constraints on system variables (e.g., minima/maxima
of selected process variables and/or their rates of change) which are necessary to
3
ensure process safety and asset health.
SIMULINK, as talked about in [18], is an environment for multi-domain sim-
ulation and model-based design for dynamic and control systems. It provides an
interactive graphical environment and a customizable set of block libraries that
allow to design, simulate, implement, and test a variety of systems, used in com-
munications, control, signal processing, video processing, and image processing.
According to these properties, SIMULINK is appropriate to develop a water net-
work simulation environment that allows to include a network model and the cost
function computation. This model allows to interface the controller, developed in
this work in MATLAB using the MPC method, which provides the set points of
the related elements and meanwhile close a control in a feedback loop as in [19].
The aim of this article is presenting simulation, optimization and integrated
simulation-optimization modelling approaches in order to provide the optimal
configuration for LSWSS in real time. MPC has been chosen to handle the com-
plex set of objectives and also being shown its effectiveness. The computation
of control strategies by MPC uses a simplified model of the network dynamics.
The use of the combined approach of optimization and simulation contributes to
making sure that the effect of more complex dynamics, better represented by the
simulation model, may be taken into account. Coordination between simulator
and optimizer works in an feedback scheme. The remainder of the paper is or-
ganized as follows. Control-oriented modelling methodology of MPC optimizer
is first provided in Section 2. Then, in Section 3, controlling problem statement
is described. In Section 4, integrated simulation and optimization scheme is ex-
plained in detail. Case study and preliminary results are outlined at Section 5 and
finally, conclusion is provided at Section 6.
4

2. Control-Oriented Modelling Methodology
Several modelling techniques dealing with the operational control of LSWSS
have been presented in the literature, see [14], [20] and [21] and the references
therein. Here, a control-oriented modelling approach is outlined, which follows
the principles presented in the reference by [22] and [23]. The extension to include
the pressure-model can be found in the references provided by [14] and [20].
A LSWSS generally contains tanks, which store the drinking water that comes
from the network sources, a network of pressurized pipes and a number of sinks.
Valves and/or pumping stations are elements that allow to manipulate the water
flow according to a specific policy and to supply water requested by the network
users.
2.1. Tanks and Reservoirs
Water tanks/reservoirs provide the entire network with the water storage ca-
pacity. The mass balance expression relating the stored volume v, the manipulated
inflows qi, jin and outflows qi,l
out (including the demand flows as outflows) for the i-th
tank can be written as the discrete-time difference equation
vi(k + 1) = vi(k) + ∆t
∑j
qi, jin (k) −
∑l
qi,lout(k)
, (1)
where ∆t is the sampling time and k denotes the discrete-time instant. The physical
constraint related to the range of admissible water in the i-th tank is expressed as
vi ≤ vi(k) ≤ vi, for all k, (2)
where vi and vi denote the minimum and the maximum admissible storage ca-
pacity, respectively. Although vi might correspond to an empty tank, in practice
5
this value can be set as nonzero in order to maintain an emergency stored volume
enough to supply for facing extreme circumstances.
For simplicity purposes, the dynamic behavior of these elements is described
as a function of volume. However, in most of the cases, the measured variable is
the tank water level (by using level sensors), which implies the computation of the
water volume taking into account the tank geometry.
2.2. Actuators
Two types of control actuators are considered: valves/gates and pumps (more
precisely, pumping stations). The manipulated flows through the actuators repre-
sent the control variables, denoted as qu. Both pumps and valves/gates have lower
and upper physical limits, which are taken into account as system constraints. As
in (2), they are expressed as
qui≤ qui(k) ≤ qui, for all k, (3)
where quiand qui denote the minimum and the maximum flow capacity, respec-
tively.
2.3. Nodes
These elements correspond to the points in the whole water system where wa-
ter flows are merged or split. Thus, the nodes represent mass balance relations,
being modelled as equality constraints related to inflows (from other tanks through
valves or pumps) and outflows, the latter being represented not only by manipu-
lated flows but also by demand flows. The expression of the mass conservation in
these nodes can be written as∑j
qi, jin (k) =
∑h
qi,hout(k). (4)
6
Node inflows and outflows are still denoted by qin and qout, respectively, de-
spite the fact that they can be manipulated flows and hence denoted by qu, if
required.
2.4. River Reaches
A single canal reach can be approximated by using the modelling approach
proposed by [24] that leads to the following relation between the upstream (qups)
and downstream (qdns) flows:
qdns(k + 1) = a1qdns(k) + b0qups(k − d) (5)
where d = τd/Ts, τd is the downstream transport delay, Ts is the sampling time,
b0 = 1 − a1 and a1 = e−TsT .
2.5. Demand and Irrigation Sectors
Demand and irrigation sectors represent the water demand made by the net-
work users of a certain physical area. For the purpose of computing control ac-
tions, it is considered as a measured disturbance of the system at a given time
instant. The demand in urban areas can be anticipated by a forecasting algorithm
that is integrated within the MPC closed-loop architecture in [13]. The demand
forecasting algorithm typically uses a two-level scheme composed by (i) a time-
series model to represent the daily aggregate flow values, and (ii) a set of different
daily flow demand patterns according to the day type to cater for different con-
sumption during the weekends and holidays periods. Every pattern consists of
24 hourly values for each daily pattern as explained in [25]. This algorithm runs
in parallel with the MPC algorithm. The daily series of hourly-flow predictions
are computed as a product of the daily aggregate flow value and the appropriate
7

hourly demand pattern. On the other hand, irrigation demand is typically planned
in advance with farmers. Pre-established flows for irrigation are planned for agri-
cultural areas in certain periods of the year.
3. Control Problem Statement
Because of the complex large scale property and multi-variable control char-
acteristic of LSWSS as described in Section 2, a feasible and efficient control
method is needed.
MPC is one of the most advanced control methodologies which has made a
significant impact on industrial control. MPC does not consider a specific control
strategy but a very wide range of control methods which make an explicit use of
the process model to obtain the control signal by minimizing an objective function
which represents the desired control goals. MPC can handle multi-variable con-
trol problems and it can consider actuator limitations as well as operational and
physical constraints.
The standard MPC problem based on the linear discrete-time prediction model
is considered as described in [26]:
x(k + 1) = Ax(k) + Bu(k), (6a)
y(k) = Cx(k), (6b)
where x(k) ∈ Rnx is the state vector and u(k) ∈ Rnu is the vector of command
variables at time step k, and y(k) ∈ Rny is the vector of the measured outputs.
Following the formalism provided by [26] for the basic formulation of a predictive
control, the cost function is assumed to be quadratic and the constraints are in
the form of linear inequalities. The model (6) is obtained applying the control-
8
oriented modelling methodology presented in previous section taking into account
the LSWSS topology and physical parameters.
3.1. Operational Goals
The main operational goals need to be achieved in LSWSS are:
• Goal 1. Cost reduction (Jcost): Economic cost is usually includes water
source costs and water transportation costs two parts. Water source cost is
usually related to acquisition, which may have different prices at different
sources, while transportation cost is affected by power tariffs which may
vary during different time steps in a day.
Assuming Wa as the related weight of Goal 1, the vectors u, a1 and a2
contain control variables, cost of water source and pumping at time step k,
respectively, the object function of Goal 1 is
Jcost = Wa(a1 + a2(k))u(k), (7)
• Goal 2. Operational safety (Jsa f ety): This criterion refers to maintain appro-
priate water storage levels in dams and reservoirs for emergency-handling.
Operated in both supply and transportation layers.
Assuming Wx as the related weight of Goal 2, x(k) and xr represent real-
time water level and emergency-handling level in dams and reservoirs at
time step k, respectively, the object function of Goal 2 is
Jsa f ety = (x(k) − xr)>Wx(x(k) − xr), (8)
9
• Goal 3. Balance management (Jbalance): This is operated only at supply layer
which is necessary for keeping rivers or reservoirs consumed in a balanced
way and escaping water deficit problem for both of the two rivers in the long
run.
Assuming wm as the related weight of Goal 3, xi and x j are two main reser-
voirs located in two different rivers, the object function of Goal 3 is
Jbalance = ((0 . . . 0 1
xi′max0 . . . 0 −1
x j′max0 . . . 0
)x(k))
>
wm (9)
× ((0 . . . 0 1
xi′max0 . . . 0 −1
x j′max0 . . . 0
)x(k)) (10)
• Goal 4. Demand management (Jdemand): This is especially important in
the supply layer when urban and irrigation demands exist since irrigation
demands allow some degree of slackness.
Assuming w f as the related weight of Goal 4, ε(k) is vector of irrigation
demand slackness, the object function of Goal 4 is
Jdemand = ε(k)>W fε(k), (11)
• Goal 5. Minimizing waste (Jmwaste): To take into account that the river water
eventually goes to the sea, this term gets to avoid unnecessary water re-
lease from reservoirs (releasing water that does not meet any demand and is
eventually wasted).
Assuming ww as the related weight of Goal 5, variables ui... j(k) are the flows
from the rivers to the sea. us(k) are their ecological penalty levels, the object
function of Goal 5 is
10
Jmwaste = (ui... j(k) − us(k))>Ww(ui... j(k) − us(k)), (12)
• Goal 6. Environment conservation (Jecological): Water sources such as bore-
holes, reservoirs and rivers are usually subject to operational constraints to
maintain water levels and ecological flows. The objective function of Goal
6 is contained in (8) because that water flows in the rivers are modelled as
additional state variables as discussed before.
Above mentioned goals lead to the following optimized function:
J = Jsa f ety + Jdemand + Jmwaste + Jbalance + Jcost (13)
= εx(k)>Wxεx(k) + ε(k)>W fε(k) (14)
+ (ui... j(k) − us(k))>Ww(ui... j(k) − us(k)) (15)
+ ((0 . . . 0 1
xi′max0 . . . 0 −1
x j′max0 . . . 0
)x(k))
>
wm (16)
× ((0 . . . 0 1
xi′max0 . . . 0 −1
x j′max0 . . . 0
)x(k)) (17)
+ Wa(a1 + a2(k))u(k) (18)
where
εx(k) = x(k) − xr
The weight tuning method proposed in [27], based on computing the Pareto
front of the multi-objective optimization problem presented in (13), is used in this
paper. The initial step of this tuning approach is to find what are known as the
11
anchor points that correspond to the best possible value for each objective ob-
tained by optimizing a single criterion at a time. Then, a normalization procedure
is applied, a Management Point (MP) defined by establishing objective priorities
is defined, and the optimal weights are determined by computing those that mini-
mize the distance from the solutions of the Pareto front and the MP.
4. Integrated Simulation and Optimization Scheme
Simulation could be the starting point in the planning of LSWSS but in view
of the large number of configuration options, capacity and operating policy, sim-
ulation without preliminary screening through optimization would be very time
consuming. The studies of large scale systems at [28] and [29] have indicated
that even with the use of simple programming approaches such as LP, valuable
improvement can be obtained to organize simulation.
Identifying effective pre-defined operating rules for simulating complex water
supply systems is a challenging task. To overcome this problem the researchers
generally employ optimization methods to simulation models like [29] and [30].
4.1. General Structure
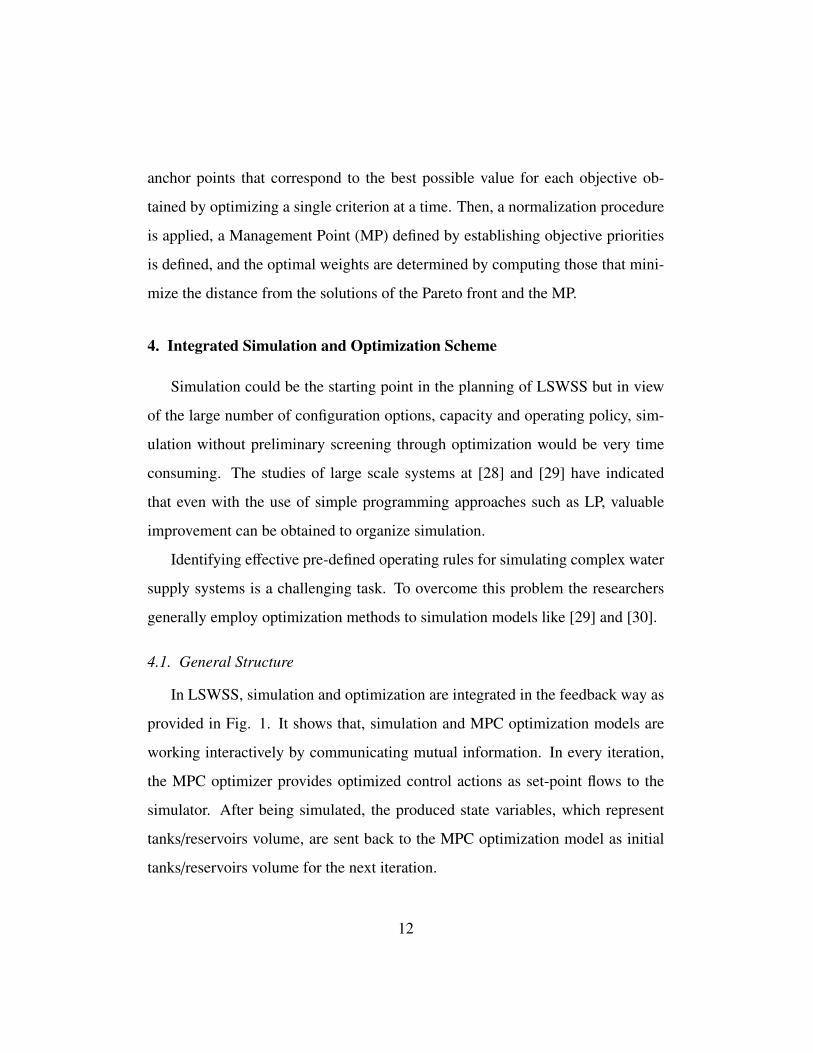
In LSWSS, simulation and optimization are integrated in the feedback way as
provided in Fig. 1. It shows that, simulation and MPC optimization models are
working interactively by communicating mutual information. In every iteration,
the MPC optimizer provides optimized control actions as set-point flows to the
simulator. After being simulated, the produced state variables, which represent
tanks/reservoirs volume, are sent back to the MPC optimization model as initial
tanks/reservoirs volume for the next iteration.
12
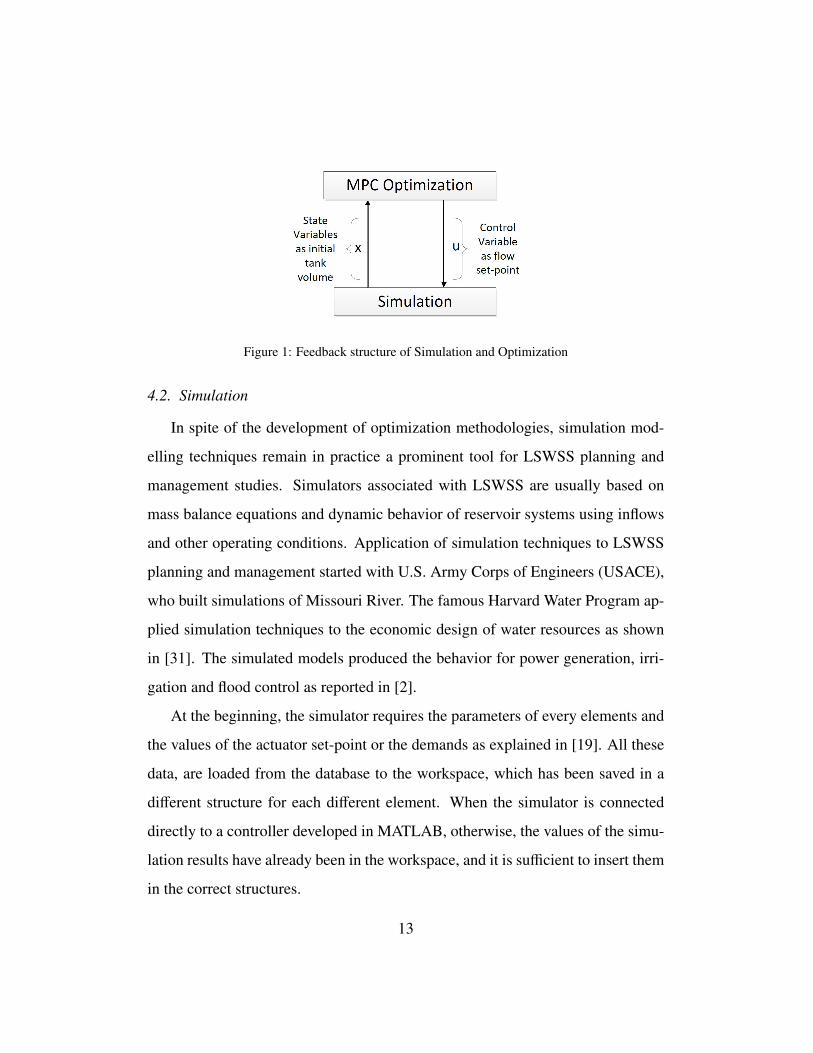
Figure 1: Feedback structure of Simulation and Optimization
4.2. Simulation
In spite of the development of optimization methodologies, simulation mod-
elling techniques remain in practice a prominent tool for LSWSS planning and
management studies. Simulators associated with LSWSS are usually based on
mass balance equations and dynamic behavior of reservoir systems using inflows
and other operating conditions. Application of simulation techniques to LSWSS
planning and management started with U.S. Army Corps of Engineers (USACE),
who built simulations of Missouri River. The famous Harvard Water Program ap-
plied simulation techniques to the economic design of water resources as shown
in [31]. The simulated models produced the behavior for power generation, irri-
gation and flood control as reported in [2].
At the beginning, the simulator requires the parameters of every elements and
the values of the actuator set-point or the demands as explained in [19]. All these
data, are loaded from the database to the workspace, which has been saved in a
different structure for each different element. When the simulator is connected
directly to a controller developed in MATLAB, otherwise, the values of the simu-
lation results have already been in the workspace, and it is sufficient to insert them
in the correct structures.
13
Figure 2: Main window of simulator
Fig. 2 is the main window of the LSWSS simulator environment, which in-
cludes inputs, outputs and also all the functional blocks needed during the whole
simulating process. The blocks at the left side are the main inputs, providing and
updating the required parameters (e.g. water demands, objective weights or elec-
tricity price of pumps) to the simulator by loading related data file. Blocks on
the right side are the main outputs for visualizing the simulating results. Inside
the center part, embedded the complete water network, see Fig. 4, which is the
simulating of the regional water network of Catalunya case study as an example
(see Section 5 for more detail).
4.3. Optimization
The MPC optimizer of LSWSS is presented in this section. The controller
computes the optimal solution with a predictive horizon and a multi-objective cost
function, which reflects the control strategy of water networks. At any time inter-
14
val, only the first set-point value is used and at the next time interval a new compu-
tation is started. The results are obtained interfacing the simulator described in the
section above, with the MATLAB platform with the help of TOMLAB/CPLEX
optimizer.
4.3.1. Formulation of the optimization problem
The objective function (13) of the MPC problem can be formulated in the
following way:
J = zT Φz + φT z + c (19)
where
z = [∆u εx ε]T (20)
∆u(k) = u(k) − u(k − 1)
and c is a constant value produced by vector calculation.
This allows to determine the optimal control actions at each instant k by solv-
ing a quadratic optimization problem by means of quadratic programming (QP)
algorithm of the form:
minz
z>Φx + φ>z
A1z ≤ b1
A2z = b2
4.4. Integration scheme of Simulator and Controller
As described in Fig. 1 at the section above, the MPC controller coordinates
with the simulator by communicating and exchanging mutual information. This
15
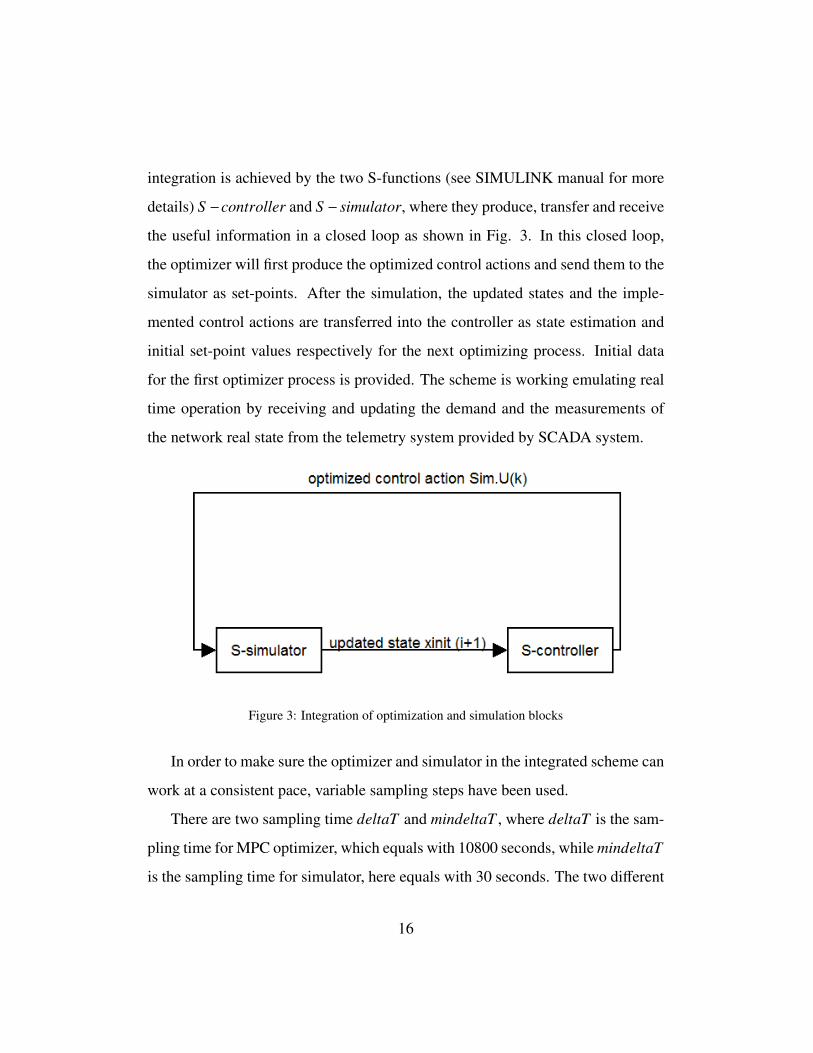
integration is achieved by the two S-functions (see SIMULINK manual for more
details) S −controller and S − simulator, where they produce, transfer and receive
the useful information in a closed loop as shown in Fig. 3. In this closed loop,
the optimizer will first produce the optimized control actions and send them to the
simulator as set-points. After the simulation, the updated states and the imple-
mented control actions are transferred into the controller as state estimation and
initial set-point values respectively for the next optimizing process. Initial data
for the first optimizer process is provided. The scheme is working emulating real
time operation by receiving and updating the demand and the measurements of
the network real state from the telemetry system provided by SCADA system.
Figure 3: Integration of optimization and simulation blocks
In order to make sure the optimizer and simulator in the integrated scheme can
work at a consistent pace, variable sampling steps have been used.
There are two sampling time deltaT and mindeltaT , where deltaT is the sam-
pling time for MPC optimizer, which equals with 10800 seconds, while mindeltaT
is the sampling time for simulator, here equals with 30 seconds. The two different
16
sampling time synchronize the simulator and optimizer as presented in Algorithm
1 and are selected according to the network dynamics.
5. Case Study: The Catalunya Regional Water Network
5.1. Description
The Catalunya Regional Water Network lies within the Catalunya Inland Basins,
and supplies the Metropolitan area of Barcelona, where most of the population is
concentrated (approximately 5.5 million people). The sources of the Catalunya
Regional Water Network are related mainly to two rivers (Llobregat and Ter).
An assessment based on data obtained by the supply companies in the Barcelona
metropolitan area shows that in 2007, 81 percent of the water input came from
surface sources. Of the total water input, 90 hm3 came from the Llobregat system
and 124 hm3 from the Ter system. The water flow supplied by the Ter and Llobre-
gat rivers are regulated respectively by three and two reservoirs and purified by
one and two water treatment plants, respectively.
Fig. 4 is the whole simulation network scheme of Catalunya Regional case
study, where the two part at the sides are two rivers which names Llobregat and Ter
and the center part is the aggregated network of water transportation in Barcelona
city.
5.2. Results
Among demands in this network, some demands can receive water from both
of the two rivers. In practical applications, there are three kinds of scenarios
divided by the amount of water in Llobregat and Ter rivers, they are:
• Scenarios 1: More water in Llobregat than in Ter.
17

Algorithm 1 Integrated Simulation and Optimization Algorithm in S-functions1: DeltaT := 10800 seconds
{sampling time of optimizer}
2: mindeltaT := 30 seconds
{sampling time of simulator}
3: K := Tsim/mindeltaT
{scenario of simulator, Tsim is the simulating time}
4: for k := 1 to K do
5: if mod(k ∗ mindeltaT, deltaT ) == 0 then
6: i := (k ∗ mindeltaT )/deltaT
{step of optimizer}
7: if i == 1 then
8: xinit (i) = XINIT
{XINIT is known value}
9: S im.U (k) = Optimizer ( xinit (i), block (i) )
{Run MPC optimizer}
{ block (i) are known values of demands, objective weights, electricity price.}
10: end if
11: end if
12: S tate (k) = S imulator ( S im.U(k), block(k) )
{Run Simulator}
13: if mod(k ∗ mindeltaT, deltaT ) == 0 then
14: i := (k ∗ mindeltaT )/deltaT
15: xinit (i + 1) = S tate (k)
16: end if
17: end for
18
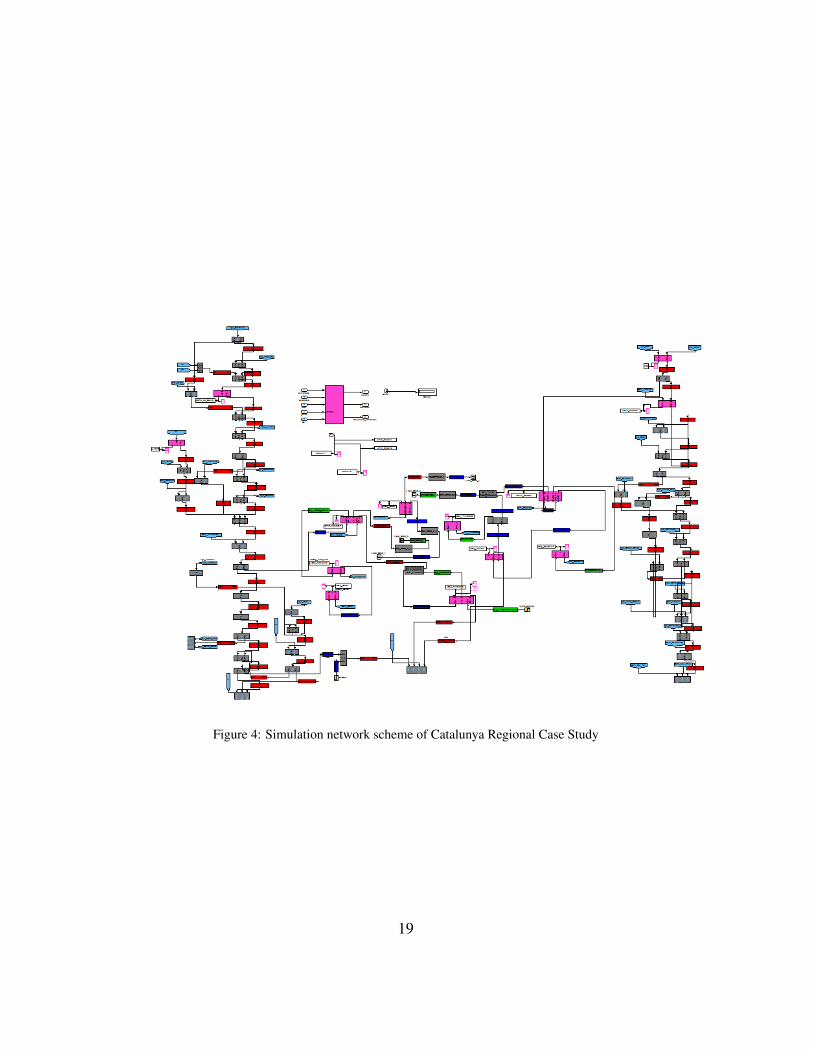
Figure 4: Simulation network scheme of Catalunya Regional Case Study
19
• Scenarios 2: More water in Ter than in Llobregat.
• Scenarios 3: Abundant water in both of the rivers.
For the first two scenarios, when water in one river is adequate while in another
river is limited, management policies will set the shared demands ask water from
the abundant river. For the scenario 3, when water is abundant in both of rivers,
according to the balance management, which is one of control objectives in the
MPC controller, water consumption in both of rivers will be proportional to their
supplying ability. In this paper, only scenario 3 is considered as the case study.
The following results are used to show the usefulness of this tool and also
the benefits of the integrated scheme that make the water supply and transport
keep the supply of both rivers balanced. In Section 5.2.1, optimal results of the
MPC controller are provided while integrated results between MPC controller and
simulator are described in Section 5.2.2.
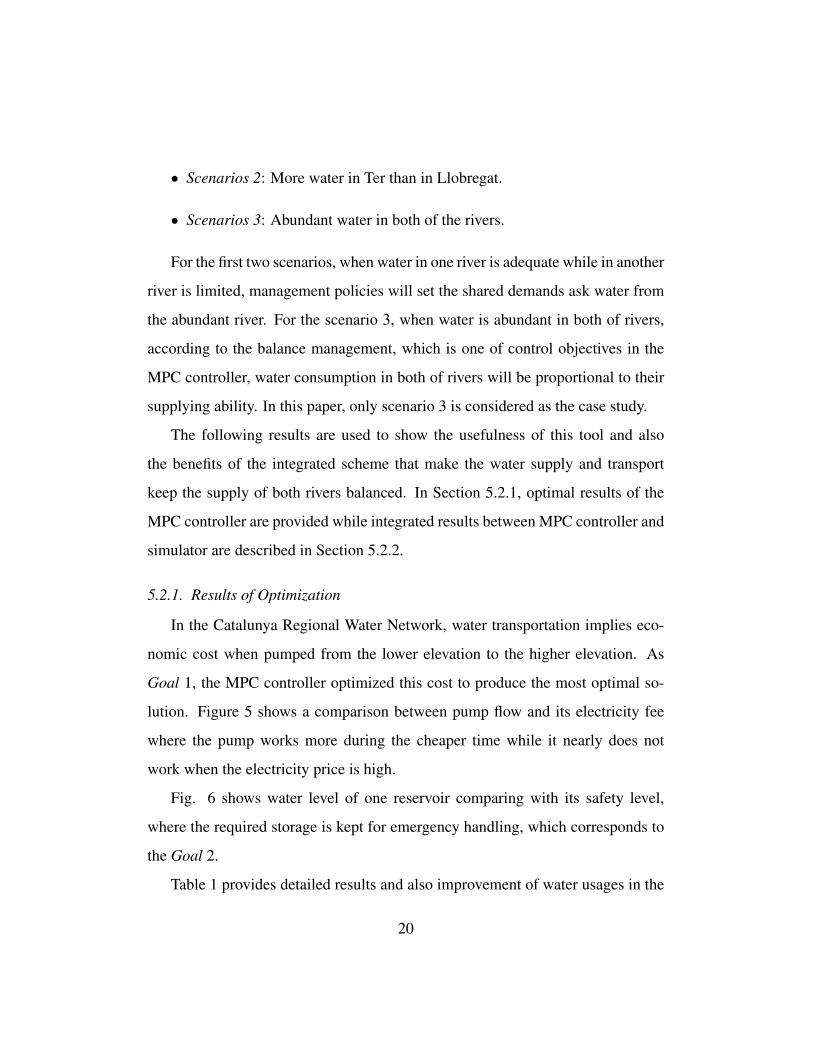
5.2.1. Results of Optimization
In the Catalunya Regional Water Network, water transportation implies eco-
nomic cost when pumped from the lower elevation to the higher elevation. As
Goal 1, the MPC controller optimized this cost to produce the most optimal so-
lution. Figure 5 shows a comparison between pump flow and its electricity fee
where the pump works more during the cheaper time while it nearly does not
work when the electricity price is high.
Fig. 6 shows water level of one reservoir comparing with its safety level,
where the required storage is kept for emergency handling, which corresponds to
the Goal 2.
Table 1 provides detailed results and also improvement of water usages in the
20
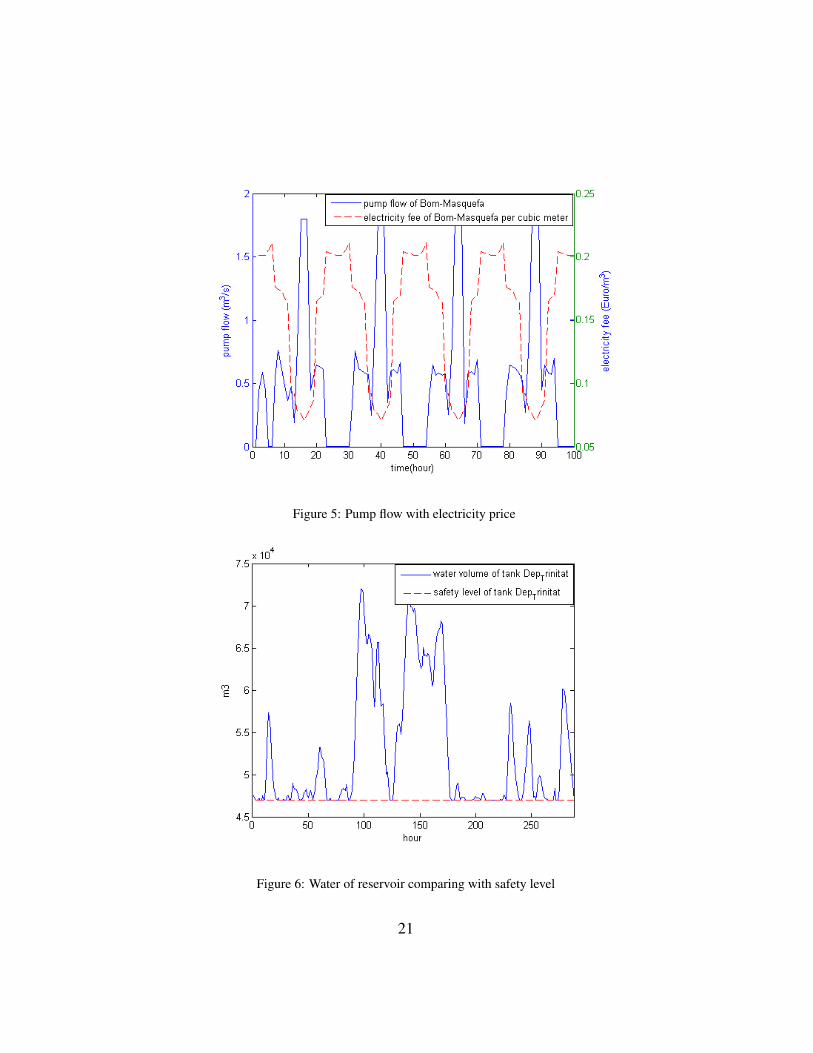
Figure 5: Pump flow with electricity price
Figure 6: Water of reservoir comparing with safety level
21

two rivers achieved by the balanced management, as explained in Goal 3, in the
MPC optimizer. In this table, Source means flow into the rivers from external
sources, Fixed Demand refers to demands which cannot choose their water source
while Variable Demand is the demand which can receive water from more than
one river. BD, abbreviation of Balanced Demand, is water volume that has been
consumed from each of the reservoirs and PB, abbreviation of Proportion of Bal-
anced demands, is the proportion of BD for the two reservoirs. PR, abbreviation
of Proportion of Reservoir capacity, is the proportion of storage capacities of the
two reservoirs. The similar values for PB and PR is what the multi-layer scheme
seeks to achieve. And SA, abbreviation of Supplying Ability, is water supply abil-
ity (in days) of the whole water network before meeting deficit problem in case
of no rain and no external water flow into the reservoir. The comparisons prove
that, after adding the objective of balance management, the proportion of water
usage from both rivers (58.93%, which is ratio of Llobregat/Ter) is much closer
to the proportion of their storage capacities (53.48%). Moreover, the Catalunya
Regional Water Network can supply water 65 days longer than without balance
management, which is a good benefit regarding the sustainable usage of water
resource in the long term perspective.
5.3. Result of the integrated Scheme
In the integrated scheme, simulator and MPC controller keep communicating
at every time step. MPC optimizer send control action as set-point to the simu-
lator, after simulating, state variables used as initial value for the next iteration.
The computation of control strategies by MPC uses a simplified model of the net-
work dynamics. The use of the combined approach of optimization and simulation
contributes to making sure that the effect of more complex dynamics, better repre-
22
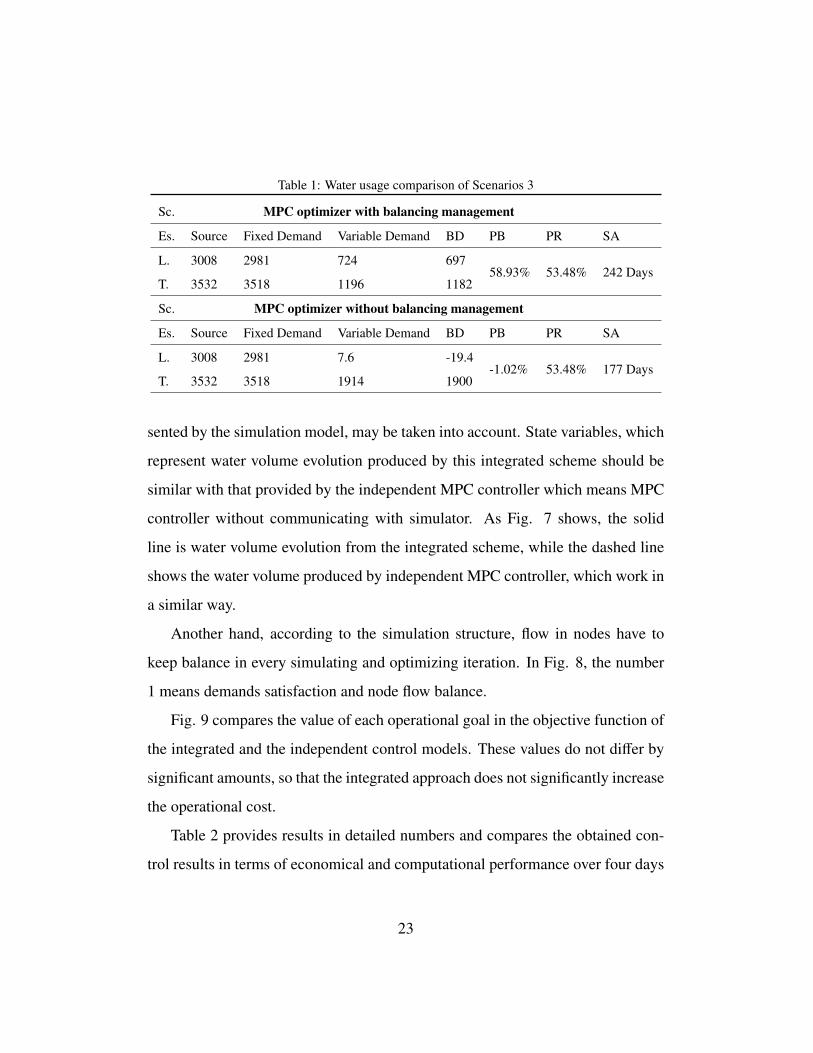
Table 1: Water usage comparison of Scenarios 3
Sc. MPC optimizer with balancing management
Es. Source Fixed Demand Variable Demand BD PB PR SA
L. 3008 2981 724 69758.93% 53.48% 242 Days
T. 3532 3518 1196 1182
Sc. MPC optimizer without balancing management
Es. Source Fixed Demand Variable Demand BD PB PR SA
L. 3008 2981 7.6 -19.4-1.02% 53.48% 177 Days
T. 3532 3518 1914 1900
sented by the simulation model, may be taken into account. State variables, which
represent water volume evolution produced by this integrated scheme should be
similar with that provided by the independent MPC controller which means MPC
controller without communicating with simulator. As Fig. 7 shows, the solid
line is water volume evolution from the integrated scheme, while the dashed line
shows the water volume produced by independent MPC controller, which work in
a similar way.
Another hand, according to the simulation structure, flow in nodes have to
keep balance in every simulating and optimizing iteration. In Fig. 8, the number
1 means demands satisfaction and node flow balance.
Fig. 9 compares the value of each operational goal in the objective function of
the integrated and the independent control models. These values do not differ by
significant amounts, so that the integrated approach does not significantly increase
the operational cost.
Table 2 provides results in detailed numbers and compares the obtained con-
trol results in terms of economical and computational performance over four days
23
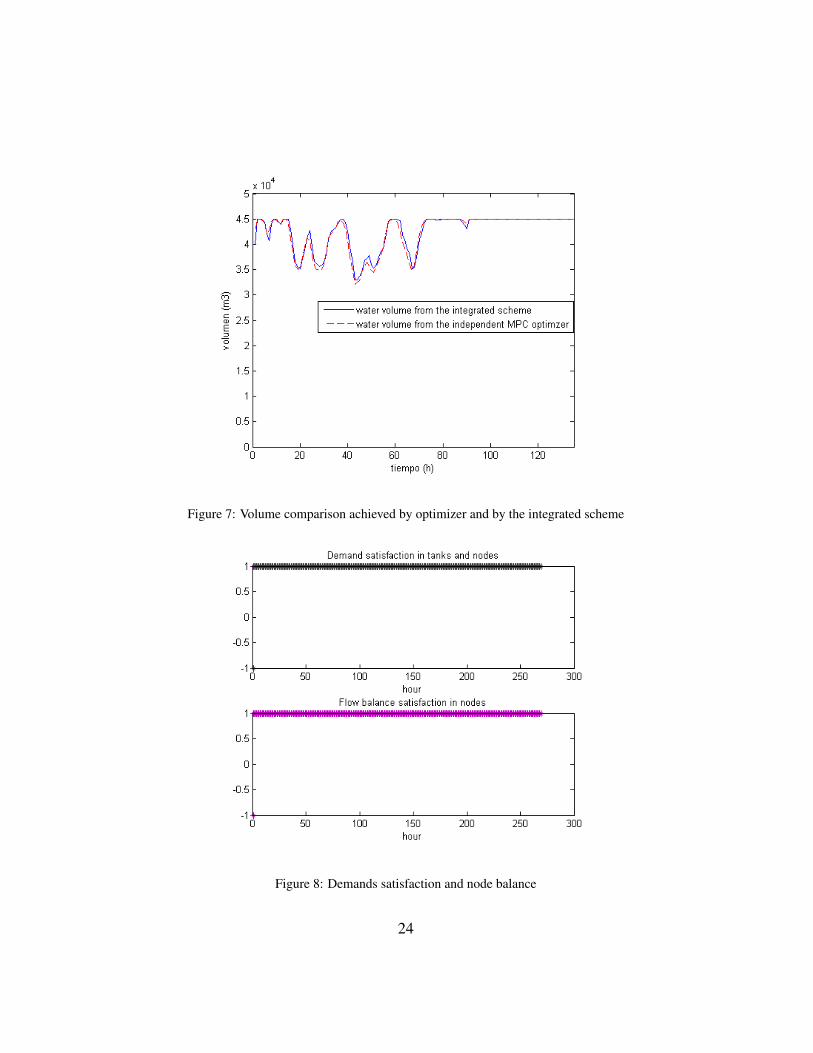
Figure 7: Volume comparison achieved by optimizer and by the integrated scheme
Figure 8: Demands satisfaction and node balance
24
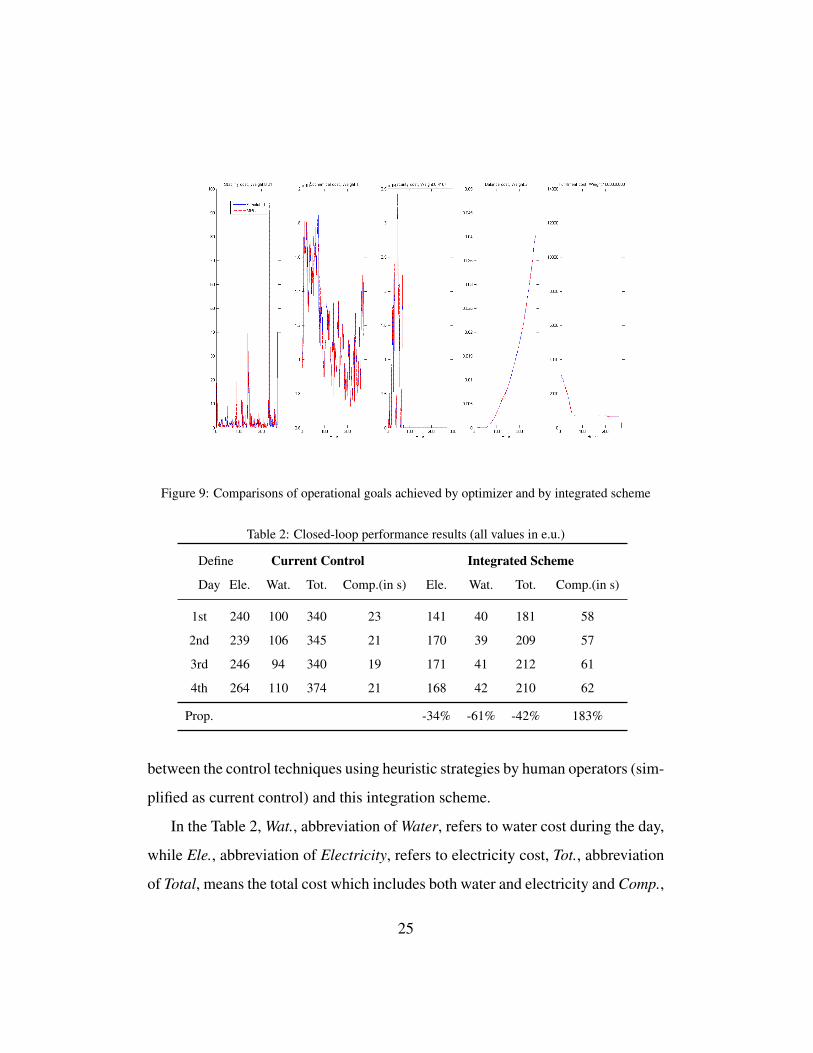
Figure 9: Comparisons of operational goals achieved by optimizer and by integrated scheme
Table 2: Closed-loop performance results (all values in e.u.)
Define
Day
Current Control Integrated Scheme
Ele. Wat. Tot. Comp.(in s) Ele. Wat. Tot. Comp.(in s)
1st 240 100 340 23 141 40 181 58
2nd 239 106 345 21 170 39 209 57
3rd 246 94 340 19 171 41 212 61
4th 264 110 374 21 168 42 210 62
Prop. -34% -61% -42% 183%
between the control techniques using heuristic strategies by human operators (sim-
plified as current control) and this integration scheme.
In the Table 2, Wat., abbreviation of Water, refers to water cost during the day,
while Ele., abbreviation of Electricity, refers to electricity cost, Tot., abbreviation
of Total, means the total cost which includes both water and electricity and Comp.,
25
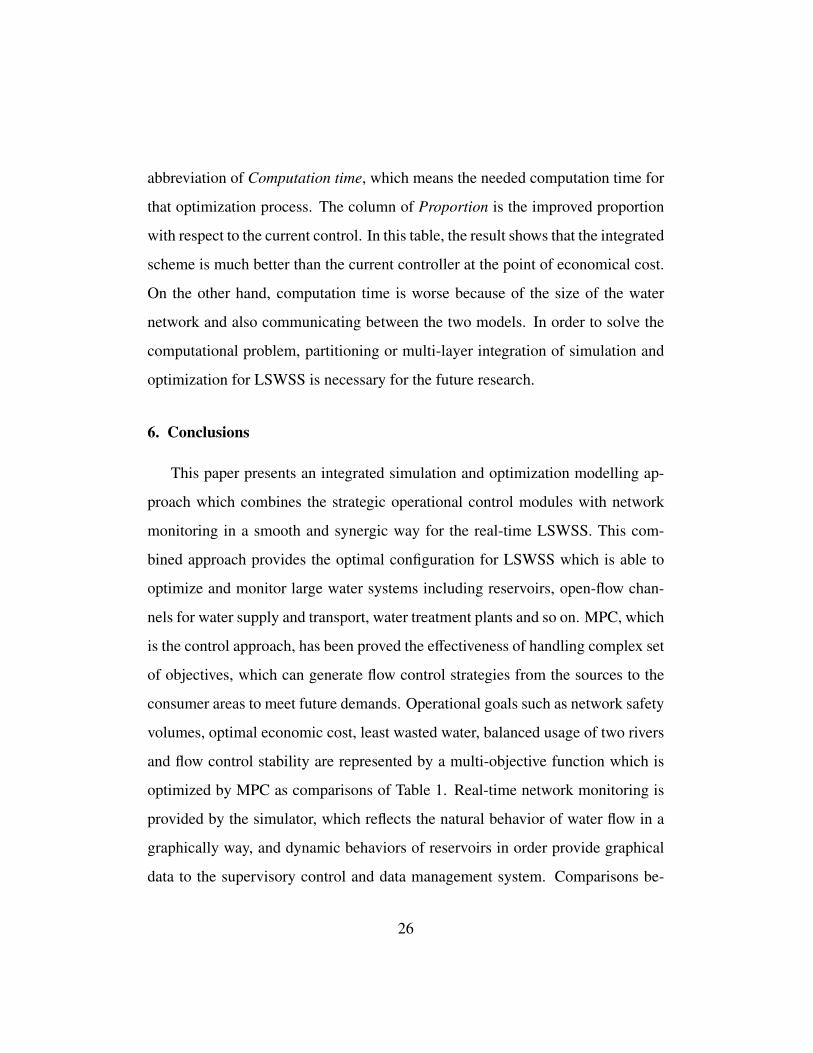
abbreviation of Computation time, which means the needed computation time for
that optimization process. The column of Proportion is the improved proportion
with respect to the current control. In this table, the result shows that the integrated
scheme is much better than the current controller at the point of economical cost.
On the other hand, computation time is worse because of the size of the water
network and also communicating between the two models. In order to solve the
computational problem, partitioning or multi-layer integration of simulation and
optimization for LSWSS is necessary for the future research.
6. Conclusions
This paper presents an integrated simulation and optimization modelling ap-
proach which combines the strategic operational control modules with network
monitoring in a smooth and synergic way for the real-time LSWSS. This com-
bined approach provides the optimal configuration for LSWSS which is able to
optimize and monitor large water systems including reservoirs, open-flow chan-
nels for water supply and transport, water treatment plants and so on. MPC, which
is the control approach, has been proved the effectiveness of handling complex set
of objectives, which can generate flow control strategies from the sources to the
consumer areas to meet future demands. Operational goals such as network safety
volumes, optimal economic cost, least wasted water, balanced usage of two rivers
and flow control stability are represented by a multi-objective function which is
optimized by MPC as comparisons of Table 1. Real-time network monitoring is
provided by the simulator, which reflects the natural behavior of water flow in a
graphically way, and dynamic behaviors of reservoirs in order provide graphical
data to the supervisory control and data management system. Comparisons be-
26
tween integrated scheme also versify the feasibility of the proposed solution. The
case study of Catalunya regional water network has been also emphasize practical
meaning of the proposed approach.
References
[1] Simonovic Slobodan P. Tools for water management: one view of future.
Water International, 25:76–88, 2000.
[2] Rani D. and Moreira M.M. Simulation-optimizaiton modeling: A survey
and potential application in reservoir systems operation. Water Resource
Management, 24(1):1107–1138, 2010.
[3] Miguel Molina. Efficient integrated real-time monitoring and control of
drinking water networks. Research proposal, 2011.
[4] Yeh William W-G. Reservoir management and operations models:a state-
of-the-art review. Journal of Water Resources and Research, 21:1797–1818,
1985.
[5] Wurbs Ralph A. Reservoir-system simulation and optimization models.
Journal of Water Resources Planning and Management, 119:455–472, 1993.
[6] Labadie John W. Optimal operation of multireservoir systems:state-of-the-
art review. Journal of Water Resources Planning and Management, 130:93–
111, 2004.
[7] Wurbs R.A. Modeling and analysis of reservoir system operation. Prentice
Hall, Upper Saddle River, 1996.
27
[8] ReVelle C. Optimizing reservoir resources:including a new model for reser-
voir reliability. Wiley, New York, 1999.
[9] McMahon G.F. and Mein R.G. River and reservoir yield. Water Resources
Publications, Fort Collins, 1986.
[10] Loucks D.P., Stedinger J.R., and Haith D.A. Water resources systems plan-
ning and analysis. Prentice-Hall, Englewood Cliffs, 1981.
[11] Karamouz M., Szidarovszky F., and Zahraie B. Water resources systems
analysis. Lewis, Boca Raton, 2003.
[12] Loucks D.P. and Beek V. Water resources systems planning and manage-
ment: an introduction to method, models and applications. UNESCO, Paris,
2005.
[13] Ocampo-Martinez C., Puig V., Cembrano G., and Quevedo J. Application of
predictive control strategies to the management of complex networks in the
urban water cycle. IEEE Control Systems Magazine, 33(1):15–45, 2013.
[14] Brdys M.A. and Ulanicki B. Operational Control of Water System. Prentice
Hall, London, 1994.
[15] Marinaki M. and Papageorgiou M. Optimal Real-time Control of Sewer Net-
works. Springer, London, 2005.
[16] Overloop P.J.V. Model Predictive Control on Open Water Systems. Delft
University Press, Delft, 2006.
28

[17] Negenborn R.R., Schutter B.D., and Hellendoorn J. Multi-agent model pre-
dictive control for transportation networks: Serial vs. parallel schemes. En-
gineering Applications of Artificial Intelligence, 21(3):353–366, 2008.
[18] Bishop Robert H. Modern Control Systems Anaylysis and Design Us-
ing MATLAB and SIMULINK. Addison-Wesley Longman Publishing Co.,
Boston, 1996.
[19] Caini Elena. Sviluppo di un Tool di Simulazione per il Controllo Predit-
tivo di Reti Idriche di Trasporto di Acqua Potabile. PhD thesis, Facolta di
ingegneria, Universita Degli Studi Di Siena, 2009.
[20] Mays L. Urban Stormwater Management Tools. McGrawHill Professional
Publishing, USA, 2004.
[21] Litrico X. and Fromion V. Modeling and control of hydrosystems. Springer
Dordrecht Heidelberg London, New York, 2009.
[22] Cembrano G., Quevedo J., Salamero M., Puig V., Figueras J., and Marti J.
Optimal control of urban drainage systems. a case study. Control Engineer-
ing Practice, 12(1):1–9, 2004.
[23] Ocampo-Martinez C., Barcelli D., Puig V., and Bemporad A. Hierarchi-
cal and decentralised model predictive control of drinking water networks:
Application to barcelona case study. IET Control Theory and Applications,
6(1):62–71, 2012.
[24] Litrico X. and Fromion V. Simplified modeling of irrigation canals for con-
troller design. Journal of Irrigation and Drainage Engineering, 130:373–
383, 2004.
29
[25] Quevedo J., Puig V., Cembrano G., and Blanch J. Validation and reconstruc-
tion of flow meter data in the barcelona water distribution network. Control
Engineering Practice, 11:640–651, 2010.
[26] Maciejowski J.M. Predictive Control with Constraints. Prentice Hall, Great
Britain, 2002.
[27] Toro R., Ocampo-Martinez C., Logist F., Van Impe J., and Puig V. Tuning
of predictive controllers for drinking water networked systems. Proc. 18th
IFAC World Congress, 2011.
[28] Chaturvedi and Srivastave. Study of a complex water-resources system with
screening and simulation-models. Journal of Water Resources and Research,
17:783–794, 1981.
[29] Kuo Jan-Tai, Hsu Nien-Sheng, Chu Wen-sen, Wan Shian, and Lin Youn-Jan.
Real-time operation of tanshui river reservoirs. Journal of Water Resources
Planning and Management, 116:349–361, 1990.
[30] Johnson Sharon A., Stedinger Jery R., and Staschus Konstantin. Heuristic
operating policies for reservoir system simulation. Journal of Water Re-
sources and Research, 27:673–685, 1991.
[31] Maass Arthur, Hufschmidt Maynard M., Dorfman Robert, JR Harold A.
Thomas, Marglin Stephen A., and Fair Gordon Maskew. Design of water
resources systems. Harvard University Press, Cambridge, 1962.
Author biographies
Congcong Sun received her Bachelor degree of Computer Science and Technol-
ogy from Nanjing Audit University(NAU) in June of 2008, and later on, obtained
30
her master Degree in Systems Engineering from Tongji University(TJU) in March
of 2011. She is currently a research fellow from the SAC-ESAII research group
at IRI and also temporary academic visitor in Water Center of Exeter University.
Her main research interests are Multi-layer MPC, Non-linear control theory and
also coordinating management of large scale systems.
Vicenc Puig received the telecommunications engineering degree in 1993 and the
Ph.D. in control engineering in 1999, both from the Technical University of Cat-
alonia, Barcelona, Spain. He is currently professor of automatic control and leader
of the advanced control systems research group at the Universitat Politecnica de
Catalunya. His main research interests are fault detection and isolation, fault-
tolerant control of dynamic systems, and model predictive control of large-scale
systems with special emphasis on water systems. He has been involved in several
European projects and networks and has published approximately 200 papers in
international conference proceedings and about 45 in scientific journals.
Gabriela Cembrano received her M.Sc. and Ph.D. in industrial engineering and
automatic control from the Technical University of Catalonia in 1984 and 1988,
respectively. Since 1989, she has been a tenured researcher of the Spanish Na-
tional Research Council at Instituto de Robotica e Informatica Industrial (CSIC-
UPC) and CETaqua Centro Tecnologica del Agua (Agbar-CSIC-UPC). Her main
research area is control engineering, and she has been involved in numerous in-
dustrial projects on the modeling and optimal control of water supply, distribu-
tion, and urban drainage system since 1985. She has taken part in several Spanish
and European research projects in the field of advanced control and especially
its application in water systems. Currently, she is the leader of the WATMAN
project on the modeling and control of systems in the water cycle, funded by the
31

Spanish Ministry of Science and Innovation (2010 − 2012) and scientific director
of the European Commission project EFFINET Integrated Real-time Monitoring
and Control of Drinking Water Networks FP7ICT − 318556(2012 − 2014). She
has published over 50 journal and conference papers in this field.
32