Embed Size (px)
Citation preview

INTEGRATED STRUCTURAL HEALTH
MONITORING AND ENERGY HARVESTING
POTENTIAL OF ADHESIVELY BONDED THIN PIEZO
PATCHES OPERATING IN d31 MODE
NAVEET KAUR
DEPARTMENT OF CIVIL ENGINEERING
INDIAN INSTITUTE OF TECHNOLOGY DELHI
MAY 2015

© Indian Institute of Technology Delhi (IITD), New Delhi, 2015

INTEGRATED STRUCTURAL HEALTH
MONITORING AND ENERGY HARVESTING
POTENTIAL OF ADHESIVELY BONDED THIN PIEZO
PATCHES OPERATING IN d31 MODE
by
NAVEET KAUR
Department of Civil Engineering
Submitted
in fulfilment of the requirements of the degree of
Doctor of Philosophy
to the
INDIAN INSTITUTE OF TECHNOLOGY DELHI
MAY 2015

Dedicated to my family and teachers
for their support and guidance.

i
CERTIFICATE
This is to certify that the thesis titled “INTEGRATED STRUCTURAL HEALTH
MONITORING AND ENERGY HARVESTING POTENTIAL OF ADHESIVELY
BONDED THIN PIEZO PATCHES OPERATING IN d31 MODE” which is being
submitted by Ms. NAVEET KAUR for the fulfilment of the requirements for the award
of degree of Doctor of Philosophy, is a record of the student‟s own work carried out at
the Indian Institute of Technology Delhi under my supervision and guidance. The
matter embodied in this thesis has not been submitted elsewhere for the award of any
other degree or diploma.
New Delhi
May, 2015
Dr. Suresh Bhalla
Associate Professor
Department of Civil Engineering
Indian Institute of Technology Delhi

iii
ACKNOWLEDGMENTS
As I sat down to write this note of gratitude, I can’t help but think of what a wild and
wonderful ride the journey of my doctorate has been. From the day one in the lab to the
bunch of publications today, the destination, which I set out to achieve, has surely been
mine but the journey has been supported by many. I am at a loss of words, to do justice
to thank the quantum of support offered by Prof. Suresh Bhalla throughout. Be it the
critical guidance on work or the encouragement to stay strong and motivated to execute
all kinds of tasks required to complete the work, he has been my strongest anchor. A
heartfelt thanks to him for giving me the immense freedom to design my work plan and for
always being around to help, provide feedback and valuable mentoring. Thanks to the
professor for being a kind fatherly figure to me.
I thank Dr. Sumedha Moharana for all the head-start she gave me in networking and
pitching my work at various places and forums. I am equally grateful to the staff members
of the Smart Structures and Dynamics Laboratory, who, with their immense cooperation
and friendly attitude, made experiments as exciting initiatives to look forward to in
routine. I cannot thank enough Mr. Vinod, Mr. Deepak and Mr. Vijay who lent their
prompt help in anything and everything I needed in the labs. I appreciate Mr. Jaitely’s
kind help from the bottom of my heart for providing the much required assistance in the
interdisciplinary activities required for my research work. Working in laboratory would
not have been that fun if it was not for amazing juniors like Abhishek Pal, Kamal Patel
and Ravi Shanker, who contributed with their efforts in the experimental work. Nikit and
Neshan, the work you guys did still makes me feel good about my initial days in the lab.
Thanks a bunch for taking me on board in your work. And of course, I can’t miss
thanking IIT Delhi and especially the Civil Engineering Department for being a warm
host for my work and providing me with all the required facilities including library,
grants and laboratories. I would always remember this place as a warm nest which not
only hosted me for my tenure here, but also provided a nurturing environment for my
research ideas to bloom. My tenure here in campus would be surely a memorable part of
my life.

iv
Thanks Anuj Parasher and Rajinder Deol for all the uncountable laughters at our tea
sessions. I would like to give a huge token of gratitude to Prateek Negi for being the best
brainstorming partner. I would always remember the time spent with you on the
discussions on science and astronomy. Your capability of visualizing the working of
mathematical models helped me to understand and interpret my results better.
I'd be a great amiss if I don't acknowledge the role of my family whole throughout. To
begin with, I'd like to thank Harshdeep Rapal for not just his patience to deal with my
schedule but also for the positivity he kept filling in, which motivated me to push my limits
as much as possible. Harsh, I think it takes more than just courage to be in long distance
marriage and still making it all happening and beautiful, and I think nobody but only you
have the capacity to do it. Thank you for being you and for always being around, without
fail. Heartfelt thanks to my parents and my in-laws for continuous appreciation and
understanding towards my work life. I hope the degree at the end and the work so far
makes your hearts swell with pride.
I would like to thank Neha Chaturvedi for her consistent moral support as a family
member throughout my tenure at IIT Delhi. I would also like to thank Surabhi Yadav and
Akshi Singla for giving the perfect ending to my stay in IIT Delhi. Surabhi, your happy-
go-lucky and go-getter attitude made the last leg of my PhD even more amazing and fun
filled.
Last but the not the least, I would like to express my immense gratitude towards God. I
don’t think I would have been what I am today if it was not for his blessings. Baba Ji,
please always keep me in the list of your much-loved children.
Naveet Kaur

v
ABSTRACT
Piezoelectric materials have so far proven their efficacy for both energy harvesting and
structural health monitoring (SHM) individually. Piezoelectric ceramic (PZT) patches,
operating in d31-mode, are considered best for SHM. However, for energy harvesting,
built up configurations such as stack actuators are more preferred. The main objective of
this research was to explore the possibility of employing the same piezo sensor for SHM
as well as energy harvesting on real-life civil structures such as bridges. Experiments
have been carried out in the laboratory environment to measure the voltage and the power
generated by PZT patches in surface bonded as well as embedded d31 configurations. In
embedded form, the PZT patches have been considered in the form of concrete vibration
sensor (CVS), operating in the normal axial strain (d31) mode. This packaged sensor
(CVS), which is composite in nature, has better compatibility with the surrounding
concrete and can withstand the harsh conditions typically encountered during casting.
Analytical models have been developed based on Euler Bernoulli‟s theory for a beam
under harmonic vibrations, using which the voltage output of a PZT patch, either surface
bonded or embedded (CVS), can be determined duly considering the effects of shear lag
and other losses associated with the bonding layers. Beam structure has been considered
for modelling as well as lab experimentation owing to the energy harvesting potential
offered by real-life bridges. Utilization of the same patch for energy harvesting as well as
for SHM through a combination of the global vibration and the local EMI techniques has
been experimentally demonstrated. The strength gain and the fatigue characteristics of the
real-life sized RC beam have been duly investigated via the embedded CVS in laboratory.
The experimental observations have been found to match with theoretical predictions.
The performance of the CVS is compared with surface-bonded PZT patch. The typical

vi
measured output power from a piezo sensor 10100.3 mm has been determined to be in
microwatt range.
Optimum parameters of PZT patches have been arrived at by performing detailed
numerical investigations. A comprehensive parametric study to investigate the effect of
various parameters such as PZT geometric parameters, adhesive layer thickness and bond
stiffness, which is otherwise difficult to perform experimentally, has been done. A
numerical model has been developed for a real-life sized simply supported beam
instrumented with (a) surface bonded PZT sensor (SBPS), and (b) embedded PZT patch
in form of concrete vibration sensor (CVS), and coupled field analysis has been
performed for the two configurations through finite element method (FEM). The results
have been compared with the existing analytical model as well as the experimental data
and the comparison has been found satisfactory. Effect of varying load resistance across
the PZT patch on the close circuit power generated by the patch has also been
investigated. The investigations show that a piezo thickness lying between 0.3 mm and 1
mm ensures maximum yield for SBPS. For CVS, the thickness above 1 mm is somewhat
more beneficial. In addition, covering the SBPS with a layer of epoxy is also beneficial.
A real-life flyover with span of length 25 m has been numerically modelled to estimate
the dynamic strain levels and hence, the power that could be produced in real-life
structures. The numerical study predicts a yield of 2.2 µW from a typical city flyover.
This aids to quantify the gap between the voltage generated by the PZT patches under
specific conditions in lab environment and corresponding to the strain levels produced in
real-life structures. Harvesting potential of the structural vibration energy by PZT sensors
during idle time is experimentally demonstrated and this concept has been extended to

vii
eight real-life bridges across the world, based on the validated analytical model. Effect of
losses such as mechanical loss, dielectric loss and shear lag loss, on the real-life structure
have been duly considered. Computations show that the power yield could range
anywhere from less than a microwatt (RC bridges) to over 25 µW (steel bridges). These
figures correspond to power densities over 30 µW/cm-3 and 800 µW/cm-3, respectively.
The study reveals that the PZT patches could harvest enough energy in reasonable time in
the idle state so as to enable intermittent operation of SHM system. Typically, it could
take only a couple of seconds to scavenge enough energy to power commercially
available A/D converters.
Proof-of-concept demonstration of normal plate type piezo in axial strain mode in place
of commercial expensive transducers for energy harvesting from real-life civil structure
has been the original aspect of this study. It is expected that the outcomes of this research
will pave way for dual use of the ordinary piezo patch in SHM as well as energy
harvesting.

ix
TABLE OF CONTENTS
TITLE PAGE NO.
Certificate............................................................................................................... i
Acknowledgements................................................................................................ iii
Abstract.................................................................................................................. v
Table of Contents................................................................................................... ix
List of Figures........................................................................................................ xiii
List of Tables.......................................................................................................... xix
List of Symbols...................................................................................................... xxi
List of Acronyms.................................................................................................... xxv
CHAPTER-1 INTRODUCTION..................................................................... 1-10
1.1 Background................................................................................................. 1
1.2 Motivation................................................................................................... 2
1.3 Piezo Sensors for Structural Heath Monitoring (SHM) and Energy
Harvesting................................................................................................... 4
1.4 Research Objectives and Scope.................................................................. 9
1.5 Organization of thesis................................................................................. 10
CHAPTER-2 STATE-OF-THE-ART IN STRUCTURAL HEALTH
MONITORING AND ENERGY HARVESTING................ 11-47
2.1 Introduction................................................................................................. 11
2.2 Evolution and Advances in Structural Health Monitoring......................... 12
2.3 Piezoelectric Energy Harvesting: Theoretical and Practical Aspects......... 21
2.3.1 Transduction Principle.............................................................. 22
2.3.2 Electro-mechanical Model for Resonating Piezoelectric
Devices.......................................................................................... 24
2.3.3 Optimal Shapes of Secondary Structures ................................. 27
2.3.4 Piezoelectric Transducer Configurations for Energy
Harvesting..................................................................................... 27
2.3.5 Energy Harvesting Circuits........................................................ 28
2.3.6 Strategies For Enhancing Performance of Energy
Harvester.......................................................................... 29
2.3.6.1 Multi-Modal Energy Harvesting................................. 29
2.3.6.2 Frequency Pumping...................................................... 30
2.3.6.3 Self-Tuning.................................................................... 31
2.3.6.4 Wide-Bandwidth Transducers..................................... 32

x
TITLE PAGE NO.
2.3.7 Practical Applications of Piezoelectric Energy Harvesting . 32
2.4 Evolution and Recent Advances in Energy Harvesting Using
Piezo Sensor............................................................................................. 33
2.5 Critical Literature Review: Identification of Research Gaps........ . 44
2.6 Research Objectives, Scope and Original Contributions............... 46
CHAPTER-3 FEASIBILITY OF ENERGY HARVESTING FROM
THIN SURFACE BONDED PIEZO PATCHES:
MODELLING AND EXPERIMENTATION....................... 49-75
3.1 Introduction................................................................................................. 49
3.2 Energy Harvesting by Surface Bonded PZT Patch: Analytical Modelling 50
3.3 Laboratory Experimentation....................................................................... 55
3.3.1 Experimental Set-Up.................................................................. 55
3.3.2 Determination of Calibration Constant for In-House Piezo
Force-Sensor............................................................................... 57
3.4 Comparison of Analytical and Experimental Results................... 62
3.4.1 Mechanical Loss.......................................................................... 65
3.4.2 Dielectric Loss............................................................................. 65
3.4.3 Shear Lag Loss............................................................................. 66
3.5 Energy Harvesting: Power Measurement Across the PZT Patch.... 69
3.6 Possibility Of Battery Charging Using Energy Harvested From
PZT Patch.................................................................................................. 73
3.7 Summary and Concluding Remarks..................................................... 74
CHAPTER-4 ENERGY HARVESTING POTENTIAL OF
EMBEDDED PIEZO PATCHES: MODELLING AND
EXPERIMENTATION........................................................ 77-104
4.1 Introduction............................................................................................... 77
4.2 Energy Harvesting From Embedded Concrete Vibration Sensor:
Analytical Modelling................................................................................ 78
4.2.1 Details of Concrete Vibration Sensor ..................................... 78
4.2.2 Development of Coupled Electro-Mechanical Model......... 80
4.2.3 Comparison of Voltage Response of Embedded and
Surface-Bonded PZT Patches................................................... 88
4.3 Comparison with Experiment..................................................... 68 90
4.4 Energy Harvesting Potential of Embedded CVS..................... ..... 99
4.5 Summary and Concluding Remarks....... ..................................... 104

xi
TITLE PAGE NO.
CHAPTER-5 PROOF-OF-CONCEPT DEMONSTRATION OF
ENERGY HARVESTING AND STRUCTURAL
HEALTH MONITORING USING EMBEDDED CVS.. 105-126
5.1 Introduction............................................................................................... 105
5.2 Short Term Monitoring of RC Beam Using CVS..................................... 105
5.2.1 Global Vibration Technique..................................................... 106
5.2.2 Electro-Mechanical Impedance (EMI) Technique................. 110
5.3 Long Term Monitoring of RC Beam Using Embedded CVS................... 114
5.3.1 Global Vibration Technique..................................................... 115
5.3.2 Electro-Mechanical Impedance (EMI) Technique................. 119
5.4 Proof-of-Concept Demonstration of Energy Harvesting for SHM
Using Embedded CVS............................................................... 68 123
5.5 Summary and Concluding Remarks.................................................... 125
CHAPTER-6 ENERGY HARVESTING USING THIN PZT
PATCHES SURFACE BONDED/EMBEDDED IN
REAL-LIFE STRUCTURES: AN EXTENDED
STUDY................................................................................. 127-140
6.1 Introduction............................................................................................... 127
6.2 Energy Harvesting From Typical City Flyover: Semi Analytical Study.. 127
6.3 Extension to Existing Real-life Bridges/ Flyovers.................................... 135
6.3.1 Steel Bridges............................................................................... 135
6.3.2 RC Bridges.................................................................................. 136
6.3.3 Computation of Charging Period............................................ 137
6.4 Summary and Concluding Remarks....................... ..................... 68 140
CHAPTER-7 NUMERICAL INVESTIGATIONS ON ENERGY
HARVESTING FROM ADHESIVELY BONDED
THIN PZT PATCHES IN SURFACE BONDED/
EMBEDDED CONFIGURATIONS................................. 141-172
7.1 Introduction............................................................................................... 141
7.2 Numerical Modelling................................................................................ 142
7.3 Model Validation....................................................................................... 146
7.4 Numerical Energy Harvesting Investigations........................................... 150
7.4.1 Effect of External Load Resistance......................................... 151
7.4.2 Effect of Piezo and Bond Thicknesses ..................................... 156
7.4.3 Effect of Piezo’s Plan Dimensions .......................................... 160

xii
TITLE PAGE NO.
7.4.4 Effect of Shear Modulus of Adhesive................................ 164
7.4.5 Effect of Adhesive Covering on Surface Bonded PZT
Sensor.............................................................................. 165
7.4.6 Effect of Adhesive Covering on EMI Signature .................. 167
7.5 Summary and Concluding Remarks.................................................... 170
CHAPTER-8 CONCLUSIONS AND RECOMMENDATIONS................173-178
8.1 Introduction............................................................................................... 173
8.2 Research Conclusions and Contributions................................................... 174
8.3 Recommendations for Future Work........................................................... 177
AUTHOR’S PUBLICATIONS............................................................................. 179
AUTHOR’S INVITED LECTURES.................................................................... 183
REFERENCES....................................................................................................... 185
APPENDIX A MATLAB Program for determination of amplitude of
vibration of simply supported beam under sinusoidally
varying concentrated load………....……………………... 201
APPENDIX B Design calculations for determination of ultimate
moment carrying capacity, Mu, of RC beam…….………. 203
APPENDIX C Design calculations for determination of stiffness of
spring used in inertial-type shaker……….……………… 205
APPENDIX D Design calculations for compensating effect of
temperature on PZT parameters..................................... 209
APPENDIX E Invention Disclosure: Abstract ..................................... 211
AUTHOR’S CURRICULUM VITAE....................................................... 213

xiii
LIST OF FIGURES
FIGURE CAPTION PAGE NO.
1.1 (a) Behaviour of PZT patch under direct effect.. ......................................................................... 7
(b) Behaviour of PZT patch under converse effect...................................................................... 7
(c) A typical commercial PZT patch (PI Ceramic, 2014)............................................................ 7
(d) PZT patch with conventional 1, 2 and 3 axis.. ....................................................................... 7
1.2 Operating modes (a) d33-mode and (b) d31-mode of piezoelectric
transducer (Priya and Inman, 2009)... .................................................................................... 9
2.1 (a) A typical structure under interrogation by EMI technique.. .................................................. 17
(b) A PZT patch surface-bonded to a structure........................................................................... 17
(c) Liang‟s 1D impedance model for system shown in (b)... ..................................................... 17
2.2 Hierarchy of main energy harvesting technologies (Calio et al.,
2014). ..................................................................................................................................... 21
2.3 (a) Monocrystal (b) Polycrystal (Calio et al., 2014) .............................................................. 23
2.4 (a) Polarization (b) Surviving polarity (Calio et al., 2014). ................................................... 24
2.5 Mass-spring-damper-piezo model (Williams and Yates, 1996). ........................................... 24
2.6 Power of the piezoelectric generator as a function of the electrical
damping ratio (Calio et al., 2014). ......................................................................................... 26
2.7 Variation of strain along the length for various shapes of
cantilevers (Calio et al., 2014). .............................................................................................. 27
2.8 Block diagram for the energy harvesting circuit (Priya and Inman,
2009). ..................................................................................................................................... 29
2.9 Enhancing energy harvesting efficiency through increase of
frequency (Priya and Inman, 2009). ....................................................................................... 30
2.10 Self-tuning double cantilevered harvester (Eichhorn et al., 2011)......................................... 31
2.11
Schematic and results of energy harvesting shoe (Kymissis et al.,
1998).
(a) External view of shoe. ........................................................................................................... 37
(b) Location of piezo sensors. ..................................................................................................... 37
(b) Typical power vs time. .......................................................................................................... 37
2.12
Energy harvesting “eel” concept (Ocean Power Technologies, Inc.
2014)................. ..................................................................................................................... 40
2.13 A prototype of sensor node with piezoelectric energy harvester
(Microstrain, Inc., 2007). ....................................................................................................... 42
2.14 Bio-inspired bi-stable structure (Kim and Kim, 2013). ......................................................... 43
3.1 Principle of integrated SHM and energy harvesting. ............................................................. 50
3.2 (a) Free body diagram of beam under concentrated load. ........................................................... 51
(b) Variation of excitation load with respect to time. .................................................................. 51
(c) Strain distribution of beam with PZT patch at centre. .......................................................... 51
3.3 Experimental set up for voltage measurement across PZT patch. ......................................... 56
3.4 Function generator with amplifier. ......................................................................................... 57

xiv
FIGURE CAPTION PAGE NO.
3.5 Portable dynamic shaker along with Dytran force-sensor and
piezo force-sensor. ................................................................................................................. 58
3.6 Data acquisition system for PZT patch at top flange and piezo
force-sensor. ........................................................................................................................... 59
3.7 Oscilloscope with PCB box. .................................................................................................. 59
3.8 Calibration constant with varying operating frequencies....................................................... 60
3.9 Comparison of the experimental and theoretical amplitudes for
different damping values. ....................................................................................................... 63
3.10 Comparison of the experimental and theoretical voltage. ...................................................... 64
3.11 Comparison of experimental and theoretical voltage incorporating
the effect of losses (h: thickness of PZT patch). .................................................................... 68
3.12 (a) Measuring equipment set up for power quantification. ......................................................... 70
(b) Simple Circuit employed for power measurement................................................................. 70
3.13 Plot showing area under the curve of power and time. .......................................................... 72
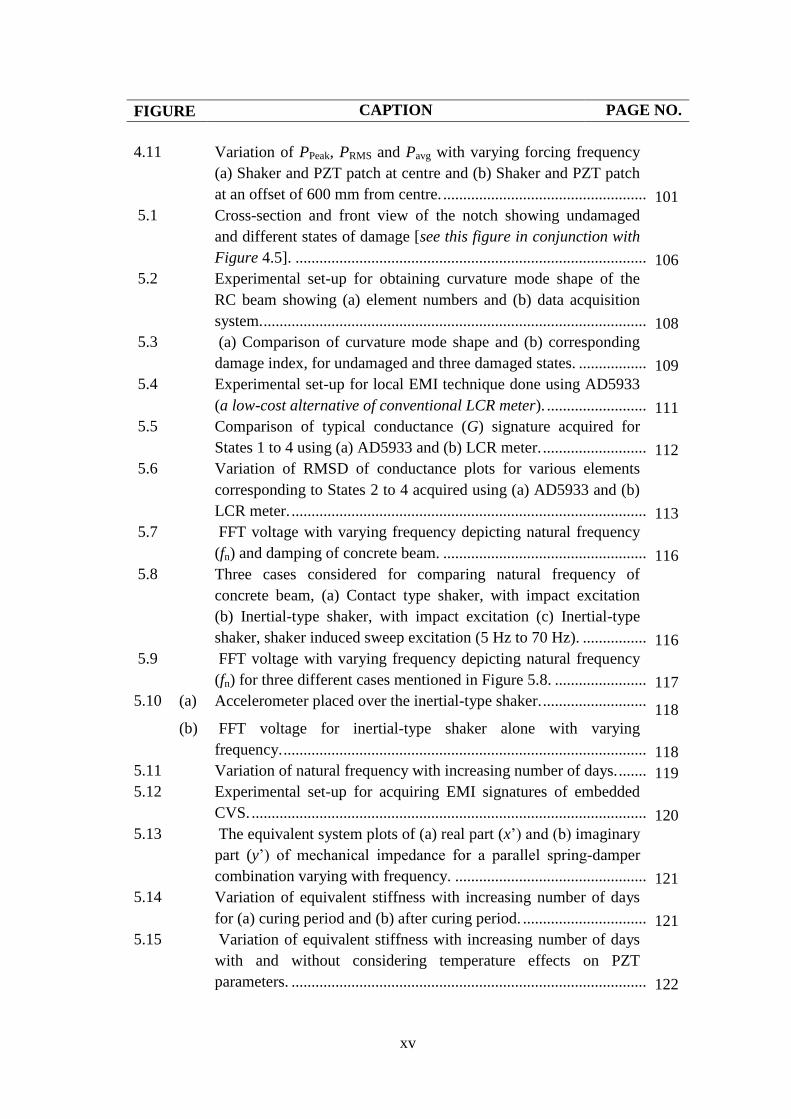
3.14 Variation of PPeak, PRMS and Pavg with varying forcing frequency. 72
4.1 (a) Dynamic load acting on a RC beam housing a CVS. Strain
distribution across depth is also shown. ................................................................................ 79 (b) Variation of excitation load with respect to time ................................................................... 79
4.2 Optical image showing different layers of CVS. ................................................................... 79
4.3 (a) A PZT patch embedded inside concrete beam and bonded using
adhesive layer. ........................................................................................................................ 81 (b) Deformation in bonding layer and PZT patch embedded in
concrete beam. ....................................................................................................................... 81
4.4 Theoretical comparison of voltage generated by embedded and
surface PZT patch considering mechanical, dielectric and shear
lag loss. ................................................................................................................................... 90
4.5 RC beam (a) before casting and (b) during casting................................................................ 91
4.6 (a) RC beam showing reinforcement, embedded CVS and notch for
damage. .................................................................................................................................. 92
(b) Detail of reinforforcement(cross-section) (refer Figure 7.1 for
Section 2-2) ............................................................................................................................ 92
4.7 Complete experimental set up with CVS location. ................................................................ 93
4.8 (a) Contact type shaker; (b) inertial-type Shaker; schematic
diagram of inertial-type shaker showing (c) elevation; (d) View 1-
1 and (e) View 2-2 (units in „mm‟)......................................................................................... 94
4.9 Voltage generated by surface bonded and embedded CVS at
location 11 varying with time for four cases namely case (a) to
case (d). .................................................................................................................................. 97
4.10 (a) Overall set up for power quantification. ................................................................................ 100
(b) Details of energy quantification circuit. ................................................................................. 100
xv
FIGURE CAPTION PAGE NO.
4.11 Variation of PPeak, PRMS and Pavg with varying forcing frequency
(a) Shaker and PZT patch at centre and (b) Shaker and PZT patch
at an offset of 600 mm from centre. ....................................................................................... 101
5.1 Cross-section and front view of the notch showing undamaged
and different states of damage [see this figure in conjunction with
Figure 4.5]. ............................................................................................................................ 106
5.2 Experimental set-up for obtaining curvature mode shape of the
RC beam showing (a) element numbers and (b) data acquisition
system. .................................................................................................................................... 108
5.3 (a) Comparison of curvature mode shape and (b) corresponding
damage index, for undamaged and three damaged states. ..................................................... 109
5.4 Experimental set-up for local EMI technique done using AD5933
(a low-cost alternative of conventional LCR meter). ............................................................. 111
5.5 Comparison of typical conductance (G) signature acquired for
States 1 to 4 using (a) AD5933 and (b) LCR meter. .............................................................. 112
5.6 Variation of RMSD of conductance plots for various elements
corresponding to States 2 to 4 acquired using (a) AD5933 and (b)
LCR meter. ............................................................................................................................. 113
5.7 FFT voltage with varying frequency depicting natural frequency
(fn) and damping of concrete beam. ....................................................................................... 116
5.8 Three cases considered for comparing natural frequency of
concrete beam, (a) Contact type shaker, with impact excitation
(b) Inertial-type shaker, with impact excitation (c) Inertial-type
shaker, shaker induced sweep excitation (5 Hz to 70 Hz). .................................................... 116
5.9 FFT voltage with varying frequency depicting natural frequency
(fn) for three different cases mentioned in Figure 5.8. ........................................................... 117
5.10 (a) Accelerometer placed over the inertial-type shaker. .............................................................. 118
(b) FFT voltage for inertial-type shaker alone with varying
frequency. ............................................................................................................................... 118
5.11 Variation of natural frequency with increasing number of days. ........................................... 119
5.12 Experimental set-up for acquiring EMI signatures of embedded
CVS. ....................................................................................................................................... 120
5.13 The equivalent system plots of (a) real part (x‟) and (b) imaginary
part (y‟) of mechanical impedance for a parallel spring-damper
combination varying with frequency. .................................................................................... 121
5.14 Variation of equivalent stiffness with increasing number of days
for (a) curing period and (b) after curing period. ................................................................... 121
5.15 Variation of equivalent stiffness with increasing number of days
with and without considering temperature effects on PZT
parameters. ............................................................................................................................. 122

xvi
FIGURE CAPTION PAGE NO.
5.16 (a) Full-wave bridge rectifier circuit used for storing energy in
capacitor. ................................................................................................................................ 124
(b) Equivalent circuit for the energy harvesting circuit shown in (a). ......................................... 124
(b) Charging and discharging voltage across capacitor. .............................................................. 124
6.1 (a) Cross section of the flyover (obligatory span) and (b) cross
girder (typical) (All dimensions are in mm). .......................................................................... 128
6.2 Plan of the flyover (All dimensions are in mm).. ................................................................... 129
6.3 FE model of flyover (single span) in SAP2000 software. ..................................................... 130
6.4 (a) 1Lane(L) Class A: longitudinal and transverse placement of
vehicle wheel loads. ............................................................................................................... 131
(b) 2L Class A: transverse placement of vehicle wheel loads. .................................................... 131
(c) 3L Class A: transverse placement of vehicle wheel loads. .................................................... 131
(d) 1L Class 70R: longitudinal and transverse placement of vehicle
wheel loads. ............................................................................................................................ 131
(e) 1L Class 70R + 1L Class A: transverse placement. ............................................................... 131
6.5 Deformation pattern of the central node of the deck for 3rd
load
case: 3L Class A (focusing on dynamic component) ............................................................. 133
7.1 Experimental set-up showing RC beam considered in present
study with embedded CVS and SBPS (covered with adhesive) at
its mid point. .......................................................................................................................... 143
7.2 (a) Isometric view of RC beam with PZT patch surface bonded at
midpoint. ................................................................................................................................ 144
(b) RC beam with an enlarged view to show embedded PZT patch.... 144
7.3 (a) Isometric view of free PZT patch restrained at top and bottom
central node. ........................................................................................................................... 147
(b) Electrical boundary conditions of free PZT patch. ................................................................ 147
7.4 Comparison of numerical (a) conductance and (b) suscetance
signature of a free PZT patch with analytical and experimental
results. .................................................................................................................................... 148
7.5 Comparison of (a) numerical and (b) experimental voltage
generated by SBPS and embedded CVS in the RC beam. ..................................................... 150
7.6 Load resistance attached across the (a) SBPS and (b) embedded
CVS. ....................................................................................................................................... 152
7.7 RMS power for varying load resistance across (a) SBPS and (b)
embedded CVS. ..................................................................................................................... 152
7.8 Variation of (a) maximum power and (b) power corresponding to
load resistance, RL = 10 MΩ generated by SBPS and embedded
CVS with varying piezo thickness. ........................................................................................ 153
7.9 RMS voltage varying with load resistance across (a) SBPS and (b)
embedded CVS. ..................................................................................................................... 154
xvii
FIGURE CAPTION PAGE NO.
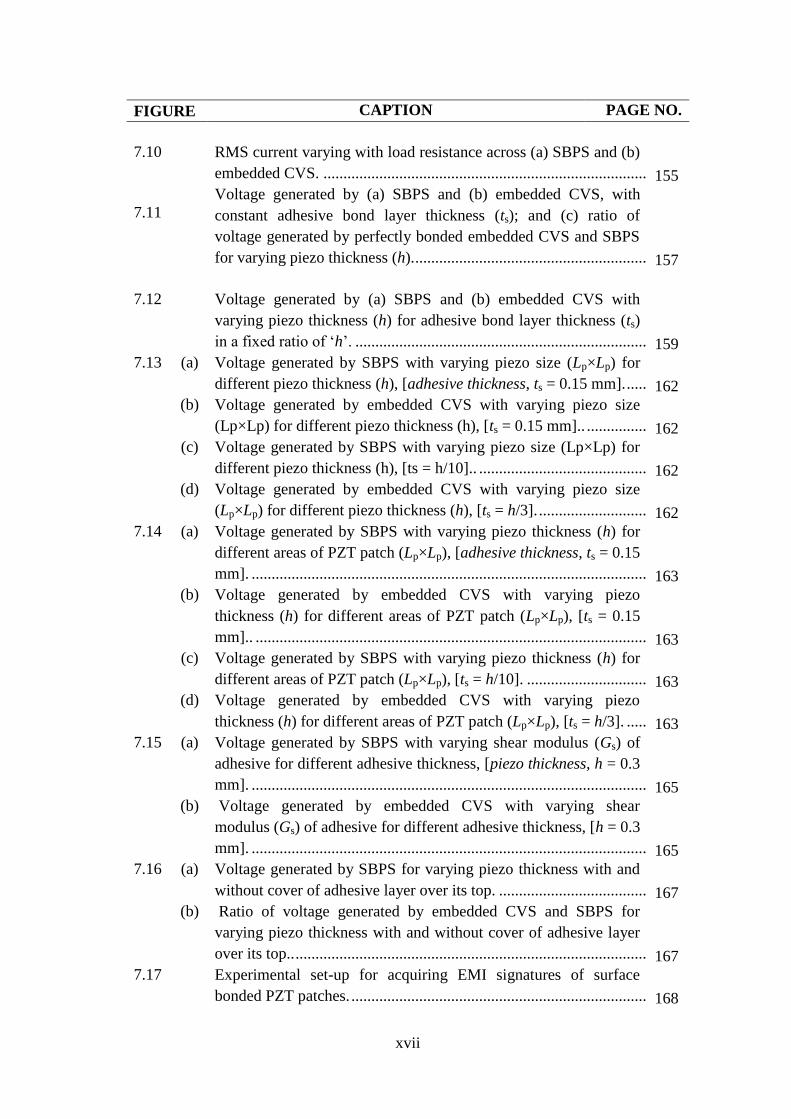
7.10 RMS current varying with load resistance across (a) SBPS and (b)
embedded CVS. ..................................................................................................................... 155
7.11
Voltage generated by (a) SBPS and (b) embedded CVS, with
constant adhesive bond layer thickness (ts); and (c) ratio of
voltage generated by perfectly bonded embedded CVS and SBPS
for varying piezo thickness (h). .............................................................................................. 157
7.12 Voltage generated by (a) SBPS and (b) embedded CVS with
varying piezo thickness (h) for adhesive bond layer thickness (ts)
in a fixed ratio of „h‟. ............................................................................................................. 159
7.13 (a) Voltage generated by SBPS with varying piezo size (Lp×Lp) for
different piezo thickness (h), [adhesive thickness, ts = 0.15 mm]. ......................................... 162
(b) Voltage generated by embedded CVS with varying piezo size
(Lp×Lp) for different piezo thickness (h), [ts = 0.15 mm].. ................................................... 162
(c) Voltage generated by SBPS with varying piezo size (Lp×Lp) for
different piezo thickness (h), [ts = h/10].. .............................................................................. 162
(d) Voltage generated by embedded CVS with varying piezo size
(Lp×Lp) for different piezo thickness (h), [ts = h/3]. ............................................................... 162
7.14 (a) Voltage generated by SBPS with varying piezo thickness (h) for
different areas of PZT patch (Lp×Lp), [adhesive thickness, ts = 0.15
mm]. ....................................................................................................................................... 163
(b) Voltage generated by embedded CVS with varying piezo
thickness (h) for different areas of PZT patch (Lp×Lp), [ts = 0.15
mm].. ...................................................................................................................................... 163
(c) Voltage generated by SBPS with varying piezo thickness (h) for
different areas of PZT patch (Lp×Lp), [ts = h/10]. .................................................................. 163
(d) Voltage generated by embedded CVS with varying piezo
thickness (h) for different areas of PZT patch (Lp×Lp), [ts = h/3]. ......................................... 163
7.15 (a) Voltage generated by SBPS with varying shear modulus (Gs) of
adhesive for different adhesive thickness, [piezo thickness, h = 0.3
mm]. ....................................................................................................................................... 165
(b) Voltage generated by embedded CVS with varying shear
modulus (Gs) of adhesive for different adhesive thickness, [h = 0.3
mm]. ....................................................................................................................................... 165
7.16 (a) Voltage generated by SBPS for varying piezo thickness with and
without cover of adhesive layer over its top. ......................................................................... 167
(b) Ratio of voltage generated by embedded CVS and SBPS for
varying piezo thickness with and without cover of adhesive layer
over its top.. ............................................................................................................................ 167
7.17 Experimental set-up for acquiring EMI signatures of surface
bonded PZT patches. .............................................................................................................. 168

xviii
FIGURE CAPTION PAGE NO.
7.18 Comparison of conductance and susceptance signatures with and
without protective layer over the sensors for surface bonded PZT
patch at (a) location 9, (b) location 10 and (c) location 11. ................................................... 169
xix
LIST OF TABLES
TABLE CAPTION PAGE NO.
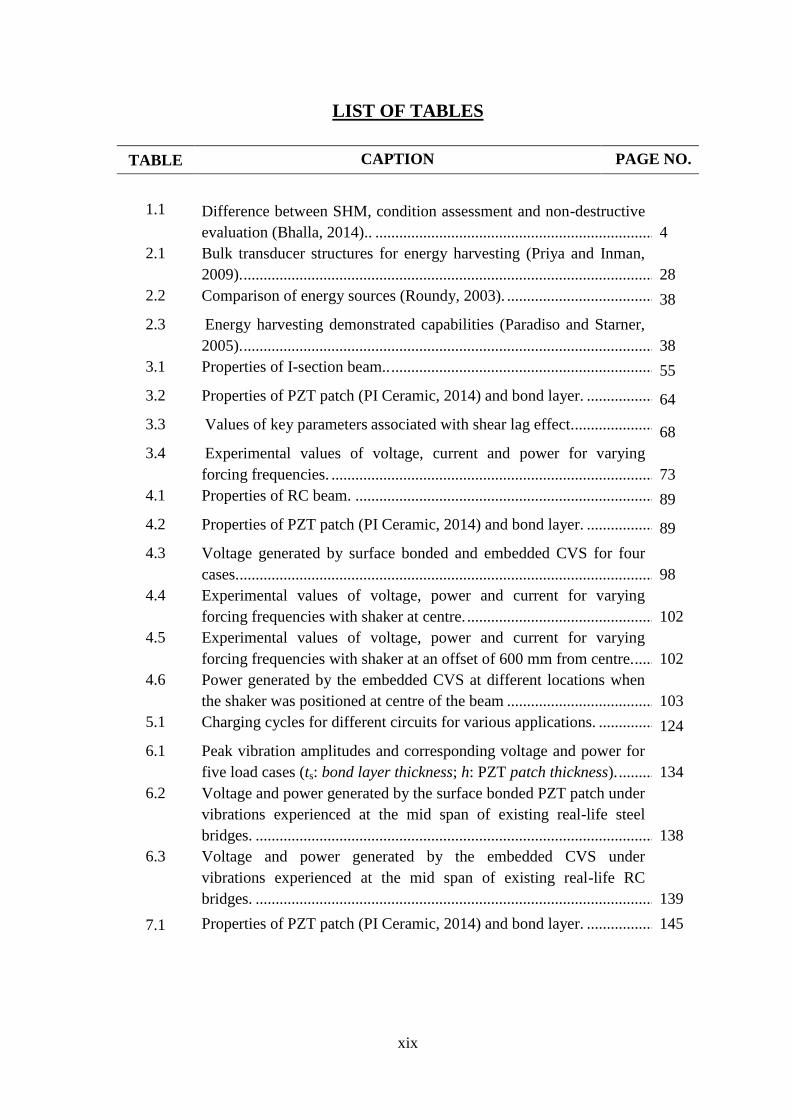
1.1
Difference between SHM, condition assessment and non-destructive
evaluation (Bhalla, 2014).. .................................................................................................... 4
2.1 Bulk transducer structures for energy harvesting (Priya and Inman,
2009). ..................................................................................................................................... 28
2.2 Comparison of energy sources (Roundy, 2003). ................................................................... 38
2.3 Energy harvesting demonstrated capabilities (Paradiso and Starner,
2005). ..................................................................................................................................... 38
3.1 Properties of I-section beam.. ................................................................................................ 55
3.2 Properties of PZT patch (PI Ceramic, 2014) and bond layer. ............................................... 64
3.3 Values of key parameters associated with shear lag effect. .................................................. 68
3.4 Experimental values of voltage, current and power for varying
forcing frequencies. ............................................................................................................... 73
4.1 Properties of RC beam. ......................................................................................................... 89
4.2 Properties of PZT patch (PI Ceramic, 2014) and bond layer. ............................................... 89
4.3 Voltage generated by surface bonded and embedded CVS for four
cases. ...................................................................................................................................... 98
4.4 Experimental values of voltage, power and current for varying
forcing frequencies with shaker at centre. ............................................................................. 102
4.5 Experimental values of voltage, power and current for varying
forcing frequencies with shaker at an offset of 600 mm from centre. ................................... 102
4.6 Power generated by the embedded CVS at different locations when
the shaker was positioned at centre of the beam ................................................................... 103
5.1 Charging cycles for different circuits for various applications. ............................................ 124
6.1 Peak vibration amplitudes and corresponding voltage and power for
five load cases (ts: bond layer thickness; h: PZT patch thickness). ....................................... 134
6.2 Voltage and power generated by the surface bonded PZT patch under
vibrations experienced at the mid span of existing real-life steel
bridges. .................................................................................................................................. 138
6.3 Voltage and power generated by the embedded CVS under
vibrations experienced at the mid span of existing real-life RC
bridges. .................................................................................................................................. 139
7.1 Properties of PZT patch (PI Ceramic, 2014) and bond layer. ............................................... 145

xxi
LIST OF SYMBOLS
a Amplitude of vibration of beam
Ast Area of tensile reinforcement
b Width of RC beam
B Susceptance
c Equivalent damping
(CF)exp Experimental calibration constant for piezo force-sensor
(CF)th Theoretical calibration constant for piezo force-sensor
C Capacitance of piezo sensor
Ca Calibration constant for accelerometer
Cb Curvature of beam
Cn Generalized damping
d Depth of neutral axis
d' Distance of the centre line of PZT patch from neutral axis of
beam
d Third order piezoelectric strain coefficient tensor
D Overall depth of beam
D’ Equivalent overall depth of beam(=D-2tc-2ts-h)
D3 Charge density
eD Electric displacement vector
E Young‟s modulus of elasticity
E3 Electric field along direction 3
EI Flexural rigidity of beam
EIg Flexural rigidity of girder of flyover
f Operating frequency of dynamic shaker
fa , fb Forcing frequencies at which the amplitude is 21 times the
resonant amplitude
fbr Natural frequency of bridge
fck Characteristic strength of concrete
fn Resonance frequency
fsh Natural frequency of vibration of inertial-type shaker
fy Characteristic strength of reinforcement in the RC beam
F Force
g Acceleration due to gravity
G Conductance
u
kG Undamaged conductance value
d
kG Damaged conductance value
Gs Shear modulus of elasticity of bonding layer

xxii
h Thickness of PZT patch
i Instantaneous current flowing in power measuring circuit
iL Current flowing in circuit with load resistance across PZT patch
ipeak Maximum current flowing in power measuring circuit
iRMS RMS current flowing in power measuring circuit
I Second moment of inertia of beam
k Equivalent stiffness
k31 Coupling coefficient of the PZT patch
SbK ,
EbK Correction factor for the shear lag effect in bond layer for
surface bonded and embedded PZT patch, respectively
Kn Generalized stiffness
Kp Correction factor due to Poisson‟s effect
Eeffl Effective length of embedded PZT patch
L Length of beam
Lp Length of PZT patch
Mass per unit length of beam
mP1, mP2,
mP3, mP4
Mass of additional four mass plates in inertial shaker
mt Mass of top plate in inertial shaker
M Bending moment at any section of the beam
Mn Generalized mass
Mu Ultimate load carrying capacity of RC beam
n Number of modes
p(x,t) Forcing function
po Amplitude of dynamic load
P Instantaneous power generated by PZT patch
Pavg Average power generated by PZT patch
Pn Generalized force
Ppeak Maximum power generated by PZT patch
PRMS RMS power generated by PZT patch
Q Total charge across PZT patch
qn Generalized displacement
R1, R2 Resistance used in power measuring circuit
R Resistances measured by AD5933
RD Dynamic magnification factor
RL Load resistance across PZT patch
S Second order strain tensor
S
S1,
ES1
Strain in the topmost fibre of beam with surface-bonded and
embedded PZT patch, respectively
m

xxiii
S2 Strain in the bottom-most fiber of the beam
Es11 Elastic compliance of PZT patch corresponding to 11 axis
Sb Strain in RC beam
Sp Strain in PZT patch
*
qS Circuit sensitivity
tc Depth of PZT patch in embedded CVS from surface of concrete
beam
Sst ,
Est Thickness of bond layer for surface bonded and embedded PZT
patch, respectively
T3 Stress in direction „3‟ (thickness of patch)
Tp Axial stress in PZT patch
u(x,t) Displacement amplitude of dynamic vibration
up Displacement at the interface between PZT patch and bond layer
ub Corresponding displacement at interface between bond layer and
beam
ostu Static deflection of beam at centre
peakstu Peak deflection of beam at centre
U Total energy generated by PZT patch
V1 Voltage across PZT patch in power measuring circuit
V2 Voltage across Resistance „R2‟ in power measuring circuit
Va Voltage output across accelerometer
VF Voltage across piezo force-sensor
VFFT FFT amplitude of voltage
VL Voltage across load resistance attached to PZT patch
SpV
EpV Voltage across the terminals of surface bonded and embedded
PZT patch, respectively
S
M
pV , E
M
pV Voltage generated by surface bonded and embedded PZT patch,
respectively, considering mechanical loss
S
S
pV , E
S
pV Voltage generated by surface bonded and embedded PZT patch,
respectively, considering shear lag loss
wb Width of beam
wp Width of PZT patch
x Displacement
x' Real component of mechanical impedance
x Acceleration
X Reactance measured by AD5933
SeffX ,
EeffX
Effective length fraction of the surface bonded and embedded
PZT patch, respectively
y' Imaginary component of mechanical impedance
y Beam deflection

xxiv
Yo Amplitude of vibration
EY Complex young‟s modulus of elasticity of the PZT patch at
constant electric field
SeffY ,
EeffY Effective width fraction of surface bonded and embedded PZT
patch, respectively Z Mechanical impedance of the structural system,
Za Mechanical impedance of the PZT patch
Damping Ratio
e and m Transducer and mechanical damping ratio
Operating angular frequency
n Natural angular frequency
n nth
mode shape
Phase angle
T
33 Complex electric permittivity (in direction „3‟) at constant stress
ξE Strain lag ratio for embedded PZT patch
2/pLE Strain lag ratio at the ends of embedded PZT patch
σb Bending stress of beam at its extreme top fibre
Wave number.
Mechanical loss factor of the PZT material
cE Compliance matrix loss factor
S Structural loss factor
Dielectric loss factor of PZT material
ν Poisson‟s ratio
Density
τ Interfacial shear stress
ΓS Shear lag parameter for surface bonded PZT patch
ΓE Modified shear lag parameter for embedded PZT patch
Shear strain in bond layer

xxv
LIST OF ACRONYMS
AC Alternative Current
CVS Concrete Vibration Sensor
CVEH Concrete Vibration Energy Harvester
c/c Centre to centre distance
DAQ Data Acquisition system
DC Direct Current
DI Damage Index
EMI Electro-Mechanical Impedance
FFT Fast Fourier Transformation
FRF Frequency Response Function
LCR Inductance Capacitance Resistance
NASA National Aeronautics and Space Administration
NDT&E Non-destructive Testing and Evaluation
PA Power Amplifier
PVDF Polyvinylidene Fluoride
PZT Lead Zirconate Titanate (Piezoelectric Ceramic)
RC Reinforced Concrete
RF Radio Frequency
RMS Root Mean Square
RMSD Root Mean Square Deviation
SBPS Surface Bonded PZT Sensor
SHM Structural Health Monitoring
SMIS Shuttle Modal Inspection System
SOI Silicon on Insulator
SSDL Smart Structures and Dynamic Laboratory
UDL Uniformly Distributed Load