Embed Size (px)
Citation preview

http://shm.sagepub.com
Structural Health Monitoring
DOI: 10.1177/1475921709340979 2009; 8; 493 originally published online Aug 6, 2009; Structural Health Monitoring
Yi Huang, Fabrizia Ghezzo and Sia Nemat-Nasser Numerical Analysis
Onset of Resin Micro-cracks in Unidirectional Glass Fiber Laminates with Integrated SHM Sensors:
http://shm.sagepub.com/cgi/content/abstract/8/6/493 The online version of this article can be found at:
Published by:
http://www.sagepublications.com
can be found at:Structural Health Monitoring Additional services and information for
http://shm.sagepub.com/cgi/alerts Email Alerts:
http://shm.sagepub.com/subscriptions Subscriptions:
http://www.sagepub.com/journalsReprints.navReprints:
http://www.sagepub.co.uk/journalsPermissions.navPermissions:
http://shm.sagepub.com/cgi/content/refs/8/6/493 Citations
at UNIV CALIFORNIA SAN DIEGO on October 19, 2009 http://shm.sagepub.comDownloaded from
493
Onset of Resin Micro-cracks in Unidirectional
Glass Fiber Laminates with Integrated SHM
Sensors: Numerical Analysis
Yi Huang,** Fabrizia Ghezzoz and Sia Nemat-Nasser*
Department of Mechanical and Aerospace Engineering, Center of Excellence for
Advanced Materials, University of California, San Diego, 9500 Gilman Drive
La Jolla, CA 92093-0416, USA
The embedment of micro-sensors and micro-devices into composite laminates for structural health
monitoring systems leads to stress/strain concentrations due to geometrical and material
discontinuities around such embedded inclusions, with high potential to initiate premature failures.
This article presents the efforts to estimate the effects of these stress/strain concentrations induced by
the integration of rectangular-shape sensors within unidirectional fiber-glass composites. The micro-
crack initiation sites and the failure load are predicted using finite-element simulations. Good
agreement has been found between the numerical results and the experimental findings presented in
an accompanying paper.
Keywords structural health monitoring � embedded sensor � stress/strain concentration �
finite- element analysis � matrix micro-cracking � composites
1 Introduction
Adding health monitoring functionalities by
integrating micro-devices within composites brings
out structural integrity concerns about the effect
of the inclusions on the load-carrying capability of
the resulting structures, their expected service
lives, and the associated failure mechanisms. The
presence of the embedded micro-devices causes
material and geometric discontinuities, which can
be responsible for unwanted stress/strain concen-
trations with consequent stiffness reduction and
degradation of the overall material performance,
necessitating the study of the mechanical interac-
tion among the host material, the embedded
devices, and their interfaces.
A number of experimental studies [1–6] have
been conducted to assess the strength and failure
modes of composite materials with embedded
devices such as silicon chips, piezoelectric (PZT)
sensors, or fiber-optic sensors (FO). From these
studies it appears that in cases where the thick-
ness of the inclusion does not alter significantly
the through-the-thickness geometry of the host
material, the resulting stress concentration is
rather small, and thus has negligible effects on
the material integrity. However, in cases where
**Present address: CGGveritas, 10300 Town Park Drive, Houston,
TX 77072, USA.zPresent address: ECE Department, Duke University, 130 Hudson
Hall, Durham, 27708, NC, USA.
*Author to whom correspondence should be addressed.
E-mail: [email protected]
Figures 3–11 appear in color online:
http://shm.sagepub.com
� The Author(s), 2009. Reprints and permissions:
http://www.sagepub.co.uk/journalsPermissions.nav
Vol 8(6): 0493–15
[1475-9217 (200911) 8:6;493–15 10.1177/1475921709340979]
at UNIV CALIFORNIA SAN DIEGO on October 19, 2009 http://shm.sagepub.comDownloaded from
the integrated devices are not suitably small, the
strength reduction as well as the resulting damage
mechanisms needs to be investigated and quanti-
fied.
Several numerical studies have addressed the
effects of embedded optical fiber sensors on the
failure mechanisms of the composite laminates.
Dasgupta et al. [7] have used the Rayleigh–Ritz
method to investigate the effect of the geometry of
the resin-rich region around the FO sensors
embedded in laminated composites. The predicted
geometry was discretized for finite element analysis
to obtain stress information in the vicinity of the
resin pocket. Levin and Nilsson [8] have performed
finite element analyses to determine the local stress
field in a tensile composite specimen with an
embedded Extrinsic Fabry-Perot Interferometer
(EFPI). The actual reduced local fiber volume
content around the sensor was determined based
on image analysis technique and used in the
computational model. Their results showed that
the sensor-coating and the coating-composite inter-
faces are the sites where failure is initiated due to
the stress concentration caused by the cavity in the
EFPI-sensor. Eaton et al. [9] have analyzed the
stress and strain concentrations in and around an
optical fiber embedded in composite laminates.
Three general laminate constructions were studied.
For the case of optical fibers embedded perpendi-
cularly to the neighboring fibers, they observed
that significant stress concentration occurred in the
distorted plies representing a shift of the load path
away from the resin pocket tip. Recently,
Shivakumar and Bhargava [10] have studied the
effect of an ‘eye’-shaped resin pocket defect pro-
duced by embedding a FO sensor perpendicularly
to the reinforcing fibers. The fiber waviness due to
the embedment of the sensor is represented in their
finite-element study by using a local element
coordinate system parallel to the distorted fibers.
Based on the computed stress concentration fac-
tors and residual curing stresses, the fracture stress
was calculated using the maximum stress criterion.
Their results indicate that, under a tensile loading,
the initial failure is by transverse matrix cracking
at the resin pocket root, which then leads to a final
fracture by fiber breakage.
Among the few numerical studies on
embedded rectangular implants, Chow and
Graves [11] investigate the stress and displace-
ment fields near a soft implant in a laminated
composite material. The implant is embedded by
cutting several plies of the composites. Their
results indicate that the interlaminar stresses are
an order of magnitude lower than the stress
representing the applied far-field load and the
stress concentration factor is dependent on the
stacking sequence of the laminates. Singh and
Vizzini [12] have analyzed the interlaminar stress
state surrounding an interlaced, active piezocera-
mic actuator embedded within a unidirectional
composite laminate. Their finite element model
appears to be insensitive to the transition resin
layer thickness and the resin-pocket length when
the length is greater than seven times the ply
thickness. They conclude that interlacing
increases the strength of the composite structure
with embedded actuators by redistributing the
load around the inclusion and the host-inclusion
interface. They also state that the delamination in
the host composite is virtually independent of
whether or not the inclusion is active.
A previous experimental study has been con-
ducted by Ghezzo et al. [13] to investigate the
micro-crack initiation within S2 glass–epoxy lami-
nates with embedded dummy sensors under
quasi-static tensile loading conditions.
Based on the experimental results obtained,
the present paper aims at simulating numerically
the interaction between the fiber glass–epoxy
laminate and the embedded (simulated) sensor.
The objective is to investigate numerically the
impact on the local stress and strain fields of the
resin-rich area and the fiber distortion due to
the embedment of a rectangular implant. In addi-
tion, von Mises and Drucker–Prager criteria are
applied to identify and locate the damage initiation
sites. The finite element simulation results are then
compared with experimental data.
2 Finite Element Model
2.1 Idealized Model for the
Host-Sensor System
In the experiments described in [13], a 0805
chip resistor is embedded into a composite
494 Structural HealthMonitoring 8(6)
at UNIV CALIFORNIA SAN DIEGO on October 19, 2009 http://shm.sagepub.comDownloaded from
laminate to simulate an embedded sensor. The
composite laminate is made from S2/BT250E-
1LV unidirectional glass–epoxy prepreg. The
fiber volume fraction is �53%. An embedded
rectangular-shaped simulated sensor in a fiber-
reinforced composite creates a resin pocket, as
shown in the previous work [13]. The dimensions
of the resin pocket are measured off the micro-
graphs of sectioned samples.
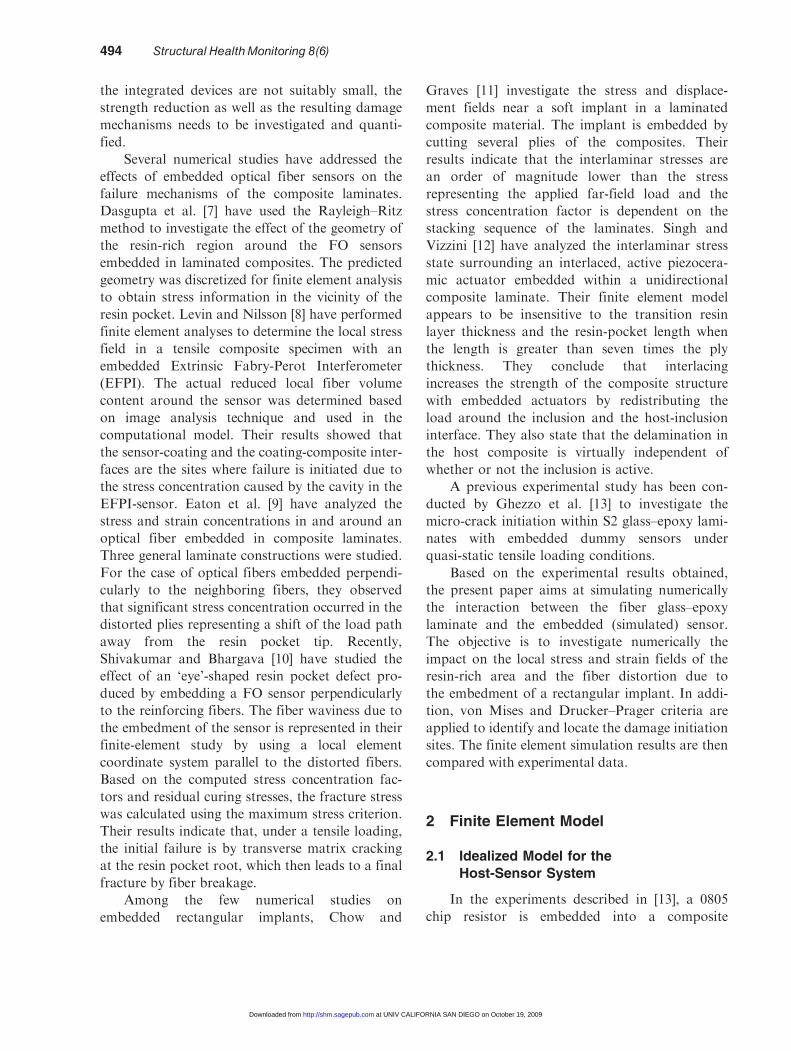
The 0805 chip resistor (shown in Figure 1),
whose dimension are 2.03mm (LS) by 1.27mm
(WS) by 0.55mm (TS), is placed with its length
aligned with the fibers direction. The protective
polymeric coating material in this analysis is
assumed to have the same material properties as
the composite matrix and the effect of the
resistive film is ignored.
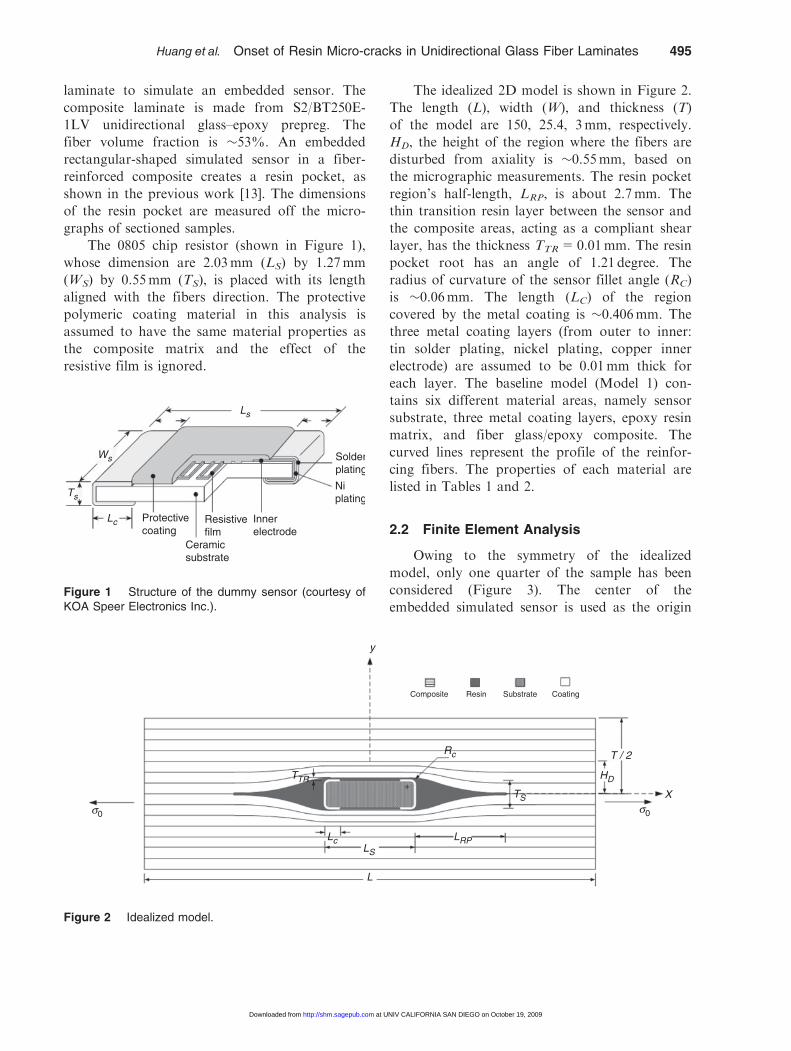
The idealized 2D model is shown in Figure 2.
The length (L), width (W), and thickness (T)
of the model are 150, 25.4, 3mm, respectively.
HD, the height of the region where the fibers are
disturbed from axiality is �0.55mm, based on
the micrographic measurements. The resin pocket
region’s half-length, LRP, is about 2.7mm. The
thin transition resin layer between the sensor and
the composite areas, acting as a compliant shear
layer, has the thickness TTR=0.01mm. The resin
pocket root has an angle of 1.21 degree. The
radius of curvature of the sensor fillet angle (RC)
is �0.06mm. The length (LC) of the region
covered by the metal coating is �0.406mm. The
three metal coating layers (from outer to inner:
tin solder plating, nickel plating, copper inner
electrode) are assumed to be 0.01mm thick for
each layer. The baseline model (Model 1) con-
tains six different material areas, namely sensor
substrate, three metal coating layers, epoxy resin
matrix, and fiber glass/epoxy composite. The
curved lines represent the profile of the reinfor-
cing fibers. The properties of each material are
listed in Tables 1 and 2.
2.2 Finite Element Analysis
Owing to the symmetry of the idealized
model, only one quarter of the sample has been
considered (Figure 3). The center of the
embedded simulated sensor is used as the origin
Ws
Ts
Lc
Ls
Protectivecoating
Resistivefilm
Ceramicsubstrate
Innerelectrode
Solderplating
Niplating
Figure 1 Structure of the dummy sensor (courtesy ofKOA Speer Electronics Inc.).
y
Rc
LS
L
Lc
TS
TTR
LRP
HD
T / 2
Xs0s0
Composite Resin Substrate Coating
Figure 2 Idealized model.
Huang et al. Onset of Resin Micro-cracks in Unidirectional Glass Fiber Laminates 495
at UNIV CALIFORNIA SAN DIEGO on October 19, 2009 http://shm.sagepub.comDownloaded from
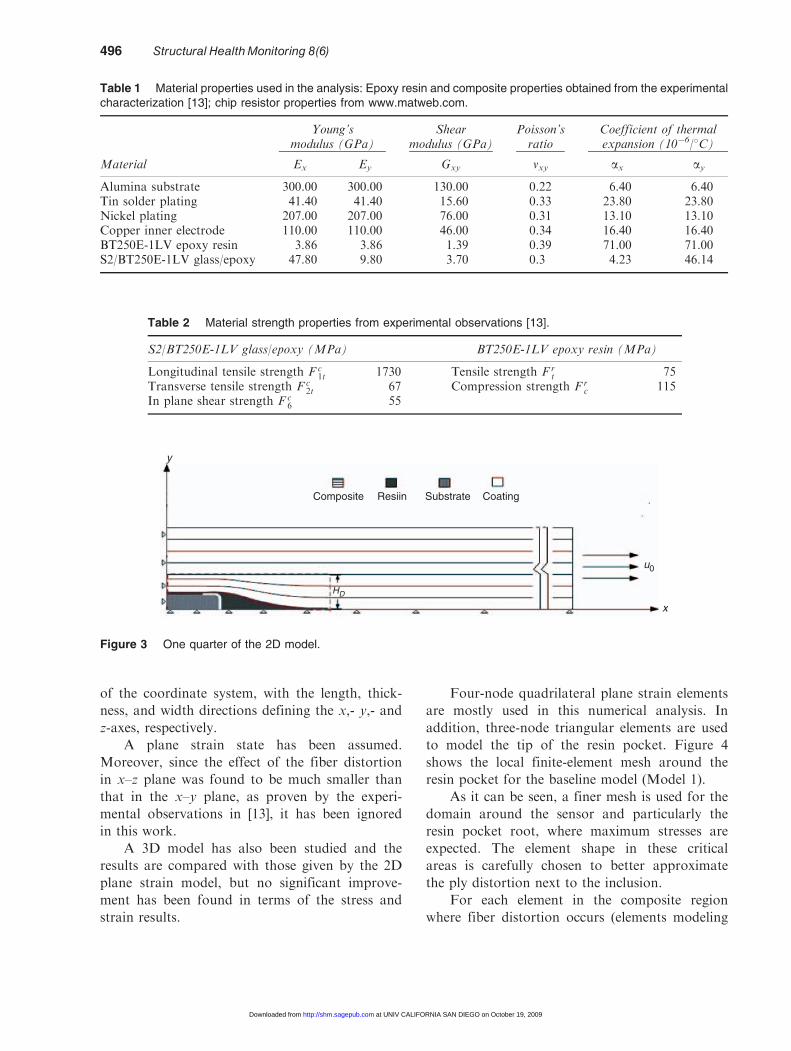
of the coordinate system, with the length, thick-
ness, and width directions defining the x,- y,- and
z-axes, respectively.
A plane strain state has been assumed.
Moreover, since the effect of the fiber distortion
in x–z plane was found to be much smaller than
that in the x–y plane, as proven by the experi-
mental observations in [13], it has been ignored
in this work.
A 3D model has also been studied and the
results are compared with those given by the 2D
plane strain model, but no significant improve-
ment has been found in terms of the stress and
strain results.
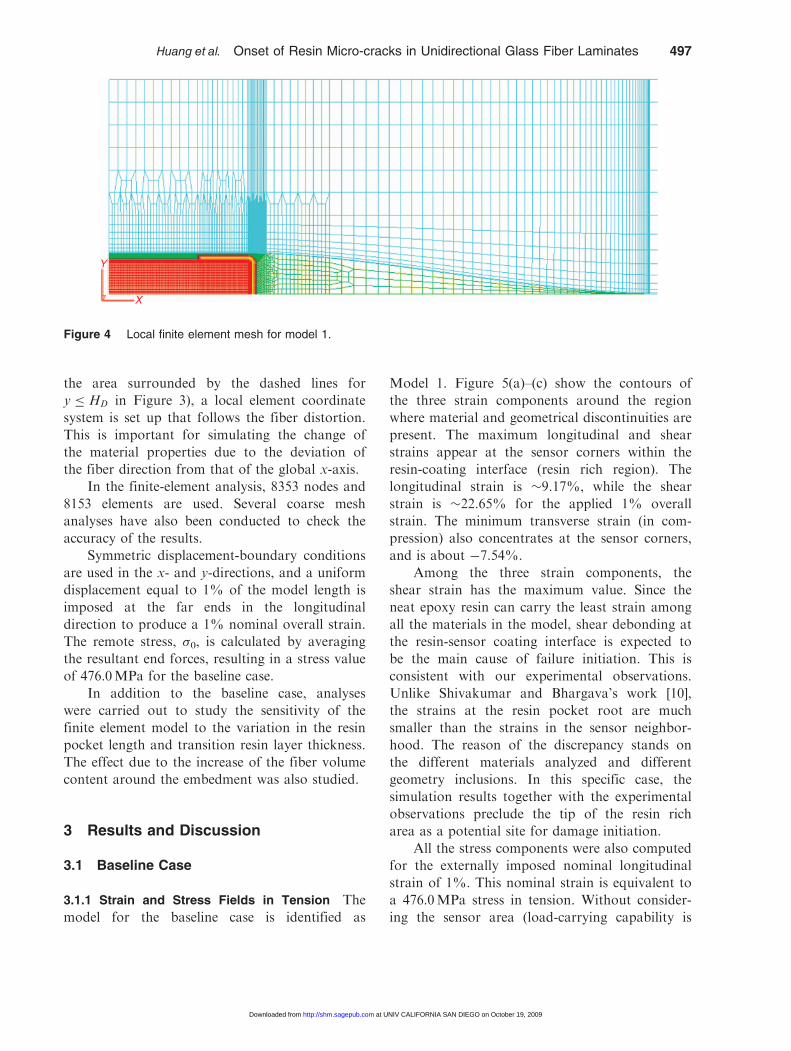
Four-node quadrilateral plane strain elements
are mostly used in this numerical analysis. In
addition, three-node triangular elements are used
to model the tip of the resin pocket. Figure 4
shows the local finite-element mesh around the
resin pocket for the baseline model (Model 1).
As it can be seen, a finer mesh is used for the
domain around the sensor and particularly the
resin pocket root, where maximum stresses are
expected. The element shape in these critical
areas is carefully chosen to better approximate
the ply distortion next to the inclusion.
For each element in the composite region
where fiber distortion occurs (elements modeling
Table 1 Material properties used in the analysis: Epoxy resin and composite properties obtained from the experimentalcharacterization [13]; chip resistor properties from www.matweb.com.
Young’smodulus (GPa)
Shearmodulus (GPa)
Poisson’sratio
Coefficient of thermalexpansion (10�6/8C)
Material Ex Ey Gxy vxy ax ay
Alumina substrate 300.00 300.00 130.00 0.22 6.40 6.40Tin solder plating 41.40 41.40 15.60 0.33 23.80 23.80Nickel plating 207.00 207.00 76.00 0.31 13.10 13.10Copper inner electrode 110.00 110.00 46.00 0.34 16.40 16.40BT250E-1LV epoxy resin 3.86 3.86 1.39 0.39 71.00 71.00S2/BT250E-1LV glass/epoxy 47.80 9.80 3.70 0.3 4.23 46.14
Table 2 Material strength properties from experimental observations [13].
S2/BT250E-1LV glass/epoxy (MPa) BT250E-1LV epoxy resin (MPa)
Longitudinal tensile strength F c1t 1730 Tensile strength F r
t 75Transverse tensile strength F c
2t 67 Compression strength F rc 115
In plane shear strength F c6 55
Composite Substrate CoatingResiin
HD
y
x
u0
Figure 3 One quarter of the 2D model.
496 Structural HealthMonitoring 8(6)
at UNIV CALIFORNIA SAN DIEGO on October 19, 2009 http://shm.sagepub.comDownloaded from
the area surrounded by the dashed lines for
y � HD in Figure 3), a local element coordinate
system is set up that follows the fiber distortion.
This is important for simulating the change of
the material properties due to the deviation of
the fiber direction from that of the global x-axis.
In the finite-element analysis, 8353 nodes and
8153 elements are used. Several coarse mesh
analyses have also been conducted to check the
accuracy of the results.
Symmetric displacement-boundary conditions
are used in the x- and y-directions, and a uniform
displacement equal to 1% of the model length is
imposed at the far ends in the longitudinal
direction to produce a 1% nominal overall strain.
The remote stress, �0, is calculated by averaging
the resultant end forces, resulting in a stress value
of 476.0MPa for the baseline case.
In addition to the baseline case, analyses
were carried out to study the sensitivity of the
finite element model to the variation in the resin
pocket length and transition resin layer thickness.
The effect due to the increase of the fiber volume
content around the embedment was also studied.
3 Results and Discussion
3.1 Baseline Case
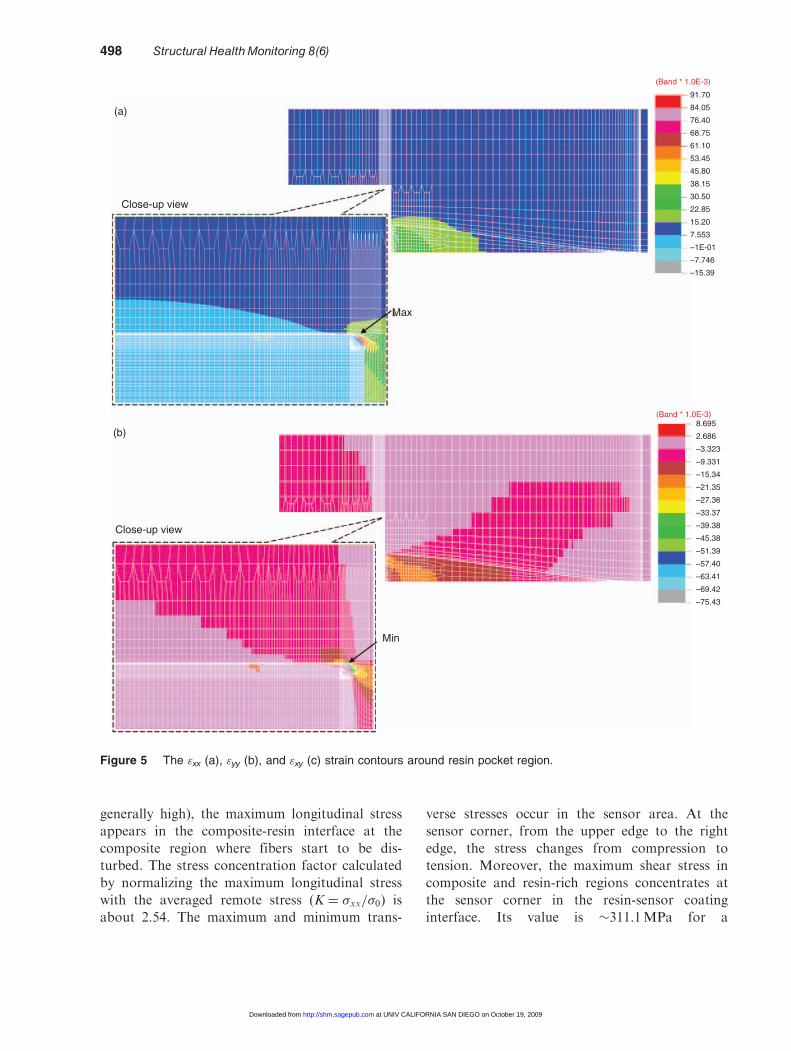
3.1.1 Strain and Stress Fields in Tension The
model for the baseline case is identified as
Model 1. Figure 5(a)–(c) show the contours of
the three strain components around the region
where material and geometrical discontinuities are
present. The maximum longitudinal and shear
strains appear at the sensor corners within the
resin-coating interface (resin rich region). The
longitudinal strain is �9.17%, while the shear
strain is �22.65% for the applied 1% overall
strain. The minimum transverse strain (in com-
pression) also concentrates at the sensor corners,
and is about �7.54%.
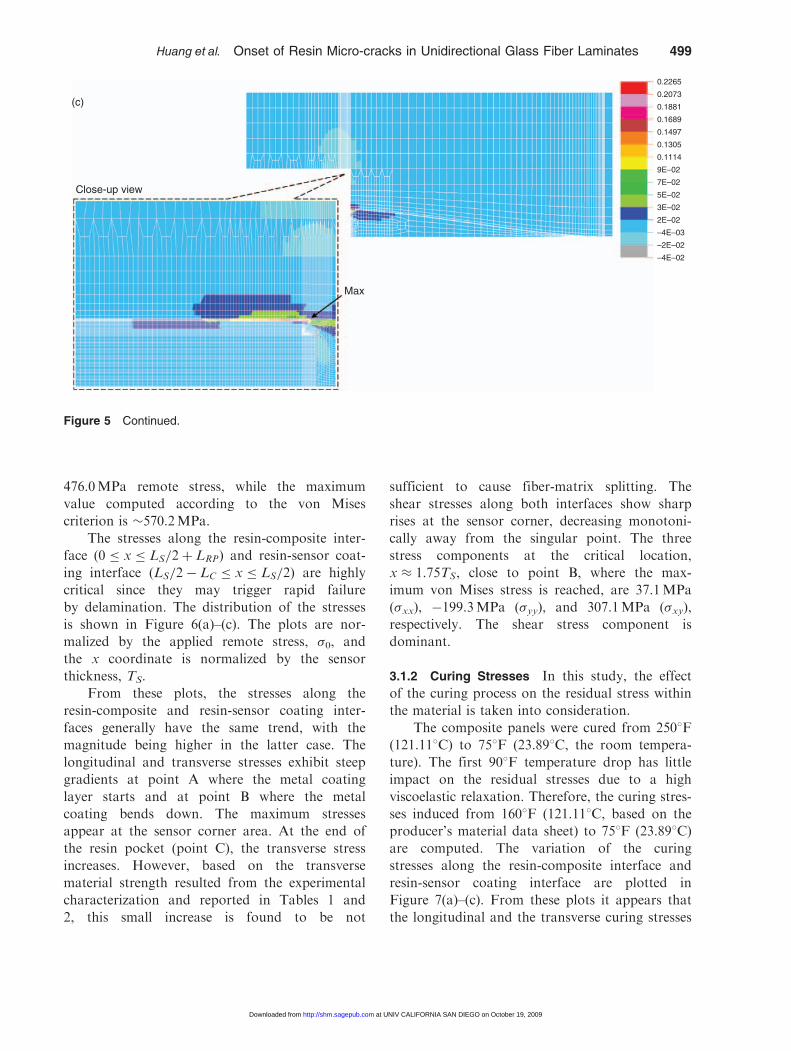
Among the three strain components, the
shear strain has the maximum value. Since the
neat epoxy resin can carry the least strain among
all the materials in the model, shear debonding at
the resin-sensor coating interface is expected to
be the main cause of failure initiation. This is
consistent with our experimental observations.
Unlike Shivakumar and Bhargava’s work [10],
the strains at the resin pocket root are much
smaller than the strains in the sensor neighbor-
hood. The reason of the discrepancy stands on
the different materials analyzed and different
geometry inclusions. In this specific case, the
simulation results together with the experimental
observations preclude the tip of the resin rich
area as a potential site for damage initiation.
All the stress components were also computed
for the externally imposed nominal longitudinal
strain of 1%. This nominal strain is equivalent to
a 476.0MPa stress in tension. Without consider-
ing the sensor area (load-carrying capability is
Y
X
Figure 4 Local finite element mesh for model 1.
Huang et al. Onset of Resin Micro-cracks in Unidirectional Glass Fiber Laminates 497
at UNIV CALIFORNIA SAN DIEGO on October 19, 2009 http://shm.sagepub.comDownloaded from
generally high), the maximum longitudinal stress
appears in the composite-resin interface at the
composite region where fibers start to be dis-
turbed. The stress concentration factor calculated
by normalizing the maximum longitudinal stress
with the averaged remote stress (K ¼ �xx=�0) is
about 2.54. The maximum and minimum trans-
verse stresses occur in the sensor area. At the
sensor corner, from the upper edge to the right
edge, the stress changes from compression to
tension. Moreover, the maximum shear stress in
composite and resin-rich regions concentrates at
the sensor corner in the resin-sensor coating
interface. Its value is �311.1MPa for a
Max
Close-up view
Min
Close-up view
(b)
(a)
(Band * 1.0E-3)
91.70
84.05
76.40
68.75
61.10
53.45
45.80
38.15
30.50
22.85
15.20
7.553
–1E-01
–7.746
–15.39
(Band * 1.0E-3)8.695
2.686
–3.323
–9.331
–15.34
–21.35
–27.36
–33.37
–39.38
–45.38
–51.39
–57.40
–63.41
–69.42
–75.43
Figure 5 The "xx (a), "yy (b), and "xy (c) strain contours around resin pocket region.
498 Structural HealthMonitoring 8(6)
at UNIV CALIFORNIA SAN DIEGO on October 19, 2009 http://shm.sagepub.comDownloaded from
476.0MPa remote stress, while the maximum
value computed according to the von Mises
criterion is �570.2MPa.
The stresses along the resin-composite inter-
face (0 � x � LS=2þ LRP) and resin-sensor coat-
ing interface (LS=2� LC � x � LS=2) are highly
critical since they may trigger rapid failure
by delamination. The distribution of the stresses
is shown in Figure 6(a)–(c). The plots are nor-
malized by the applied remote stress, �0, and
the x coordinate is normalized by the sensor
thickness, TS.
From these plots, the stresses along the
resin-composite and resin-sensor coating inter-
faces generally have the same trend, with the
magnitude being higher in the latter case. The
longitudinal and transverse stresses exhibit steep
gradients at point A where the metal coating
layer starts and at point B where the metal
coating bends down. The maximum stresses
appear at the sensor corner area. At the end of
the resin pocket (point C), the transverse stress
increases. However, based on the transverse
material strength resulted from the experimental
characterization and reported in Tables 1 and
2, this small increase is found to be not
sufficient to cause fiber-matrix splitting. The
shear stresses along both interfaces show sharp
rises at the sensor corner, decreasing monotoni-
cally away from the singular point. The three
stress components at the critical location,
x � 1:75TS, close to point B, where the max-
imum von Mises stress is reached, are 37.1MPa
(�xx), �199.3MPa (�yy), and 307.1MPa (�xy),respectively. The shear stress component is
dominant.
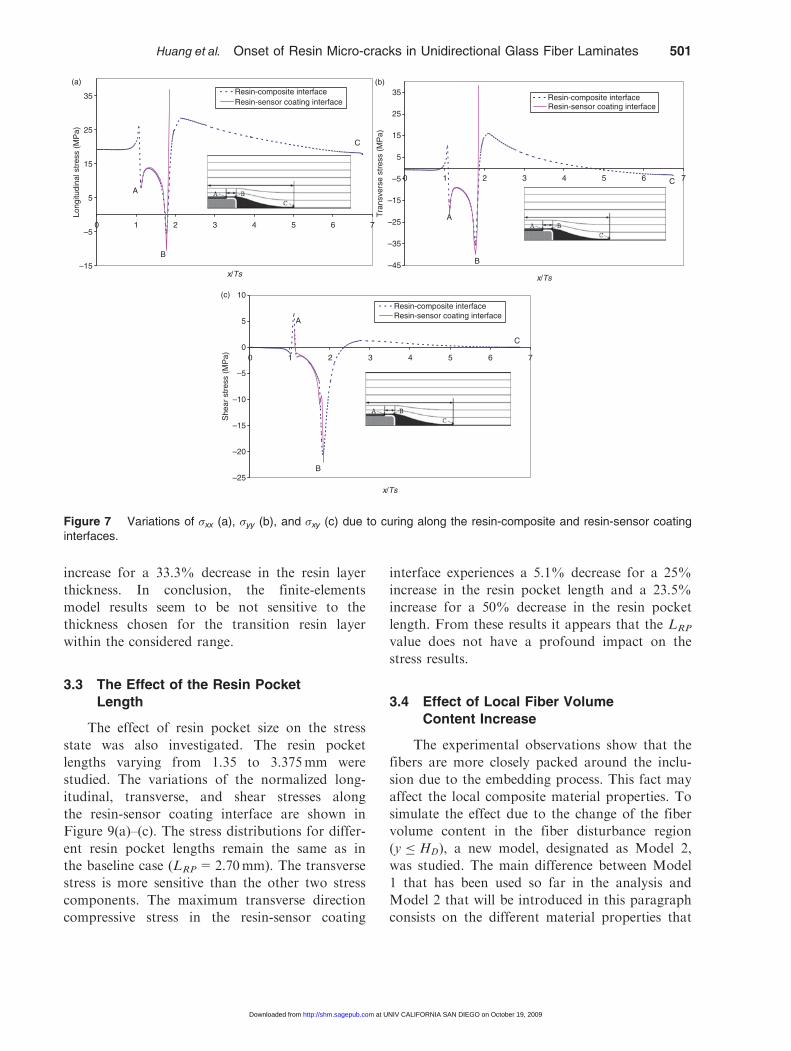
3.1.2 Curing Stresses In this study, the effect
of the curing process on the residual stress within
the material is taken into consideration.
The composite panels were cured from 2508F(121.118C) to 758F (23.898C, the room tempera-
ture). The first 908F temperature drop has little
impact on the residual stresses due to a high
viscoelastic relaxation. Therefore, the curing stres-
ses induced from 1608F (121.118C, based on the
producer’s material data sheet) to 758F (23.898C)are computed. The variation of the curing
stresses along the resin-composite interface and
resin-sensor coating interface are plotted in
Figure 7(a)–(c). From these plots it appears that
the longitudinal and the transverse curing stresses
Max
Close-up view
(c)
0.2265
0.2073
0.1881
0.1689
0.1497
0.1305
0.1114
9E–02
7E–02
5E–02
3E–02
2E–02
–4E–03
–2E–02
–4E–02
Figure 5 Continued.
Huang et al. Onset of Resin Micro-cracks in Unidirectional Glass Fiber Laminates 499
at UNIV CALIFORNIA SAN DIEGO on October 19, 2009 http://shm.sagepub.comDownloaded from
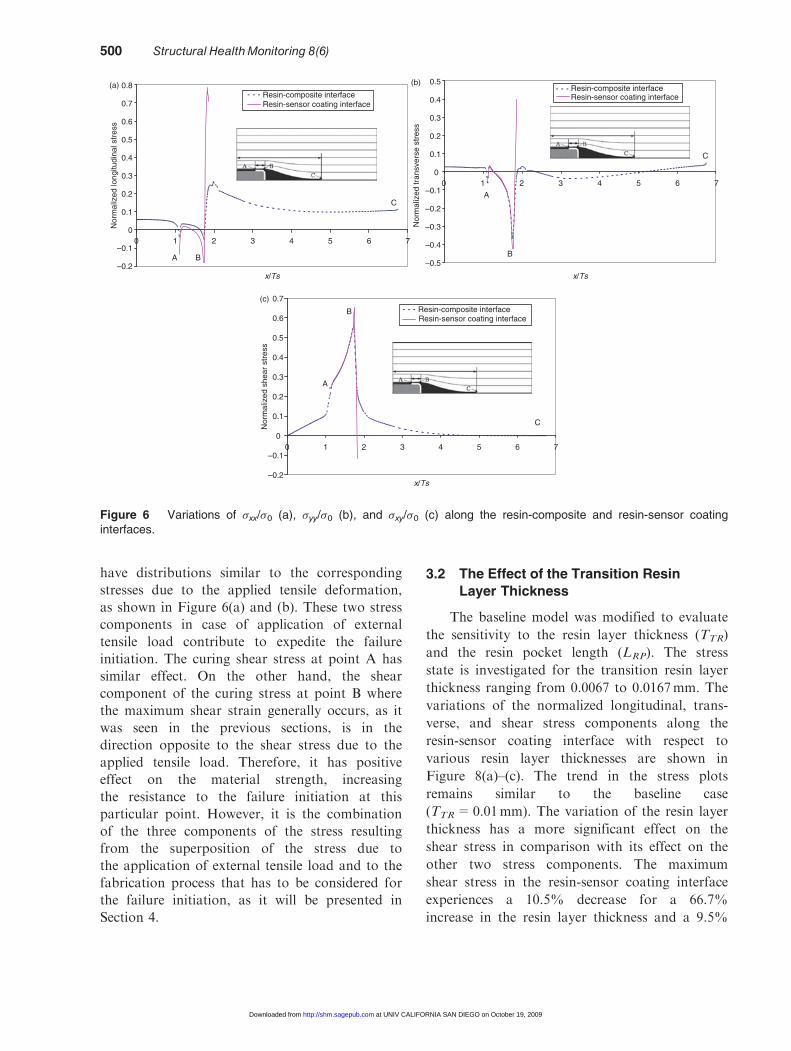
have distributions similar to the corresponding
stresses due to the applied tensile deformation,
as shown in Figure 6(a) and (b). These two stress
components in case of application of external
tensile load contribute to expedite the failure
initiation. The curing shear stress at point A has
similar effect. On the other hand, the shear
component of the curing stress at point B where
the maximum shear strain generally occurs, as it
was seen in the previous sections, is in the
direction opposite to the shear stress due to the
applied tensile load. Therefore, it has positive
effect on the material strength, increasing
the resistance to the failure initiation at this
particular point. However, it is the combination
of the three components of the stress resulting
from the superposition of the stress due to
the application of external tensile load and to the
fabrication process that has to be considered for
the failure initiation, as it will be presented in
Section 4.
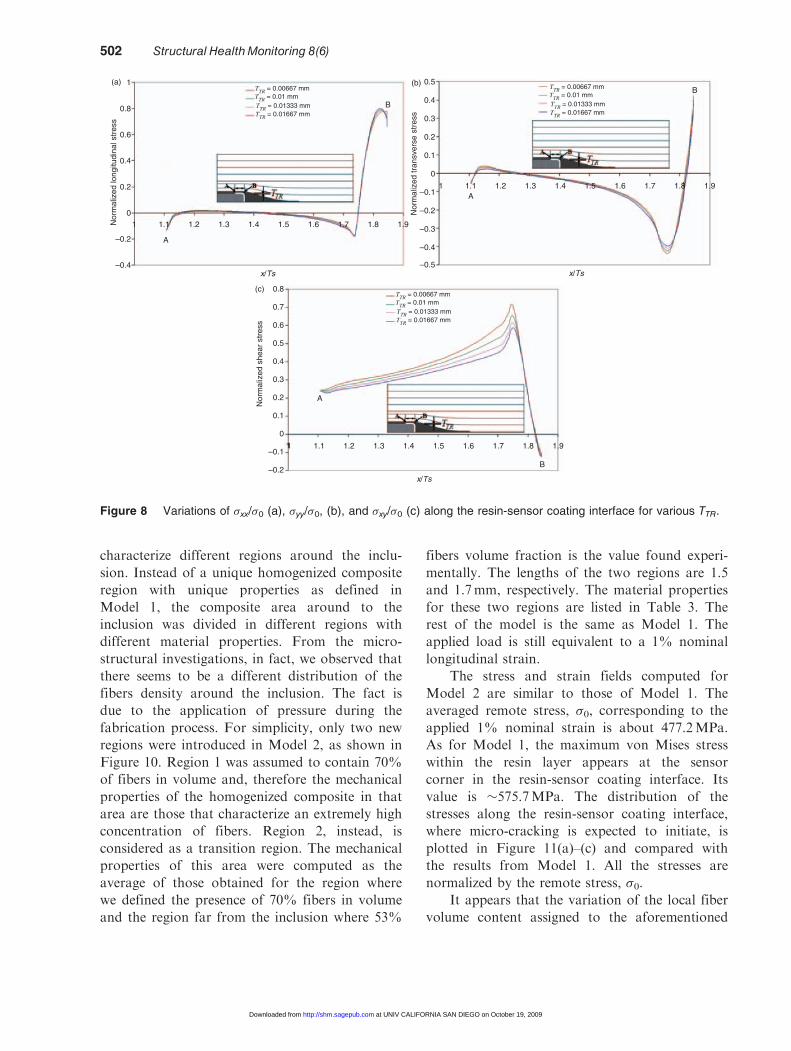
3.2 The Effect of the Transition Resin
Layer Thickness
The baseline model was modified to evaluate
the sensitivity to the resin layer thickness (TTR)
and the resin pocket length (LRP). The stress
state is investigated for the transition resin layer
thickness ranging from 0.0067 to 0.0167mm. The
variations of the normalized longitudinal, trans-
verse, and shear stress components along the
resin-sensor coating interface with respect to
various resin layer thicknesses are shown in
Figure 8(a)–(c). The trend in the stress plots
remains similar to the baseline case
(TTR=0.01mm). The variation of the resin layer
thickness has a more significant effect on the
shear stress in comparison with its effect on the
other two stress components. The maximum
shear stress in the resin-sensor coating interface
experiences a 10.5% decrease for a 66.7%
increase in the resin layer thickness and a 9.5%
–0.2
–0.1
0
0.1
0.2
0.3
0.4
0.5
0.6
0.7
0.8
0
x/Ts
Nor
mal
ized
long
itudi
nal s
tres
s
Resin-composite interfaceResin-sensor coating interface
C
BA–0.5
–0.4
–0.3
–0.2
–0.1
0
0.1
0.2
0.3
0.4
0.5
x/Ts
Nor
mal
ized
tran
sver
se s
tres
s
Resin-composite interfaceResin-sensor coating interface
B
A
C
(a) (b)
–0.2
–0.1
0
0.1
0.2
0.3
0.4
0.5
0.6
0.7
x/Ts
Nor
mal
ized
she
ar s
tres
s
Resin-composite interfaceResin-sensor coating interface
A
B
C
(c)
1 2 3 4 5 6 7
0 1 2 3 4 5 6 7
0 1 2 3 4 5 6 7
Figure 6 Variations of �xx/�0 (a), �yy/�0 (b), and �xy/�0 (c) along the resin-composite and resin-sensor coatinginterfaces.
500 Structural HealthMonitoring 8(6)
at UNIV CALIFORNIA SAN DIEGO on October 19, 2009 http://shm.sagepub.comDownloaded from
increase for a 33.3% decrease in the resin layer
thickness. In conclusion, the finite-elements
model results seem to be not sensitive to the
thickness chosen for the transition resin layer
within the considered range.
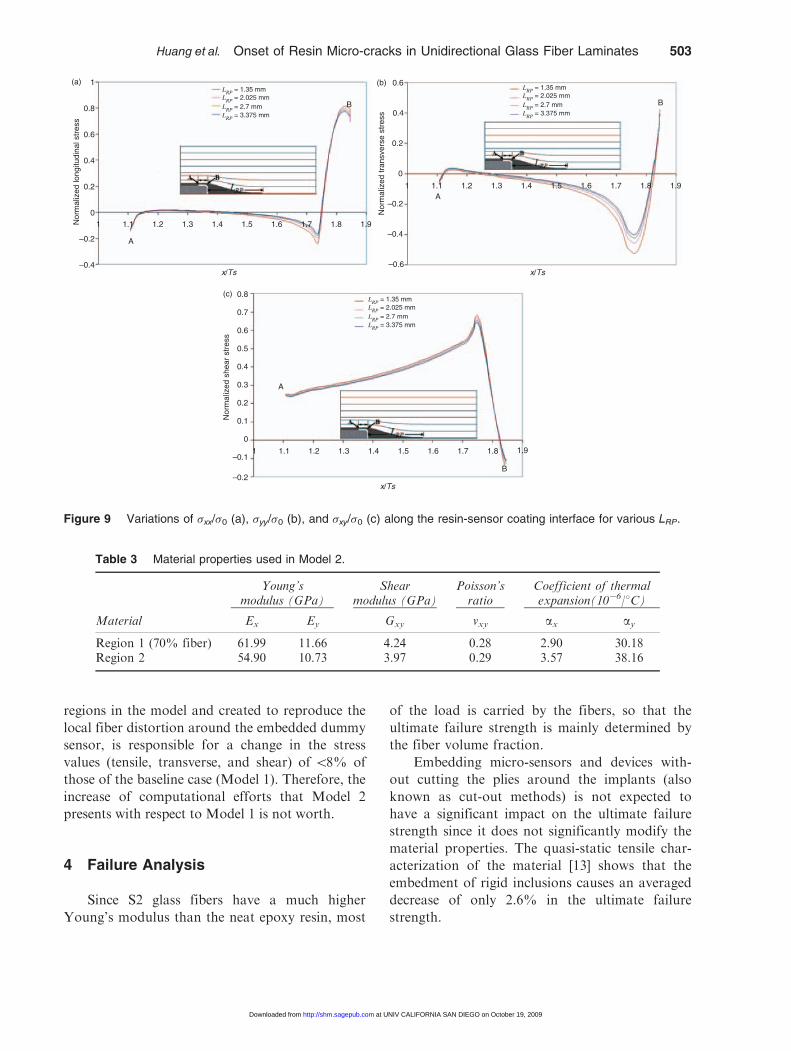
3.3 The Effect of the Resin Pocket
Length
The effect of resin pocket size on the stress
state was also investigated. The resin pocket
lengths varying from 1.35 to 3.375mm were
studied. The variations of the normalized long-
itudinal, transverse, and shear stresses along
the resin-sensor coating interface are shown in
Figure 9(a)–(c). The stress distributions for differ-
ent resin pocket lengths remain the same as in
the baseline case (LRP=2.70mm). The transverse
stress is more sensitive than the other two stress
components. The maximum transverse direction
compressive stress in the resin-sensor coating
interface experiences a 5.1% decrease for a 25%
increase in the resin pocket length and a 23.5%
increase for a 50% decrease in the resin pocket
length. From these results it appears that the LRP
value does not have a profound impact on the
stress results.
3.4 Effect of Local Fiber Volume
Content Increase
The experimental observations show that the
fibers are more closely packed around the inclu-
sion due to the embedding process. This fact may
affect the local composite material properties. To
simulate the effect due to the change of the fiber
volume content in the fiber disturbance region
(y � HD), a new model, designated as Model 2,
was studied. The main difference between Model
1 that has been used so far in the analysis and
Model 2 that will be introduced in this paragraph
consists on the different material properties that
–15
–5
5
15
25
35
x/Ts
Long
itudi
nal s
tres
s (M
Pa)
Resin-composite interfaceResin-sensor coating interface
A
B
C
–45
–35
–25
–15
–5
5
15
25
35
x/Ts
Tra
nsve
rse
stre
ss (
MP
a)
Resin-composite interfaceResin-sensor coating interface
A
B
C
(a) (b)
–25
–20
–15
–10
–5
0
5
10
x/Ts
She
ar s
tres
s (M
Pa)
Resin-composite interfaceResin-sensor coating interface
A
B
C
(c)
0 1 2 3 4 5 6 7
0 1 2 3 4 5 6 7
0 1 2 3 4 5 6 7
Figure 7 Variations of �xx (a), �yy (b), and �xy (c) due to curing along the resin-composite and resin-sensor coatinginterfaces.
Huang et al. Onset of Resin Micro-cracks in Unidirectional Glass Fiber Laminates 501
at UNIV CALIFORNIA SAN DIEGO on October 19, 2009 http://shm.sagepub.comDownloaded from
characterize different regions around the inclu-
sion. Instead of a unique homogenized composite
region with unique properties as defined in
Model 1, the composite area around to the
inclusion was divided in different regions with
different material properties. From the micro-
structural investigations, in fact, we observed that
there seems to be a different distribution of the
fibers density around the inclusion. The fact is
due to the application of pressure during the
fabrication process. For simplicity, only two new
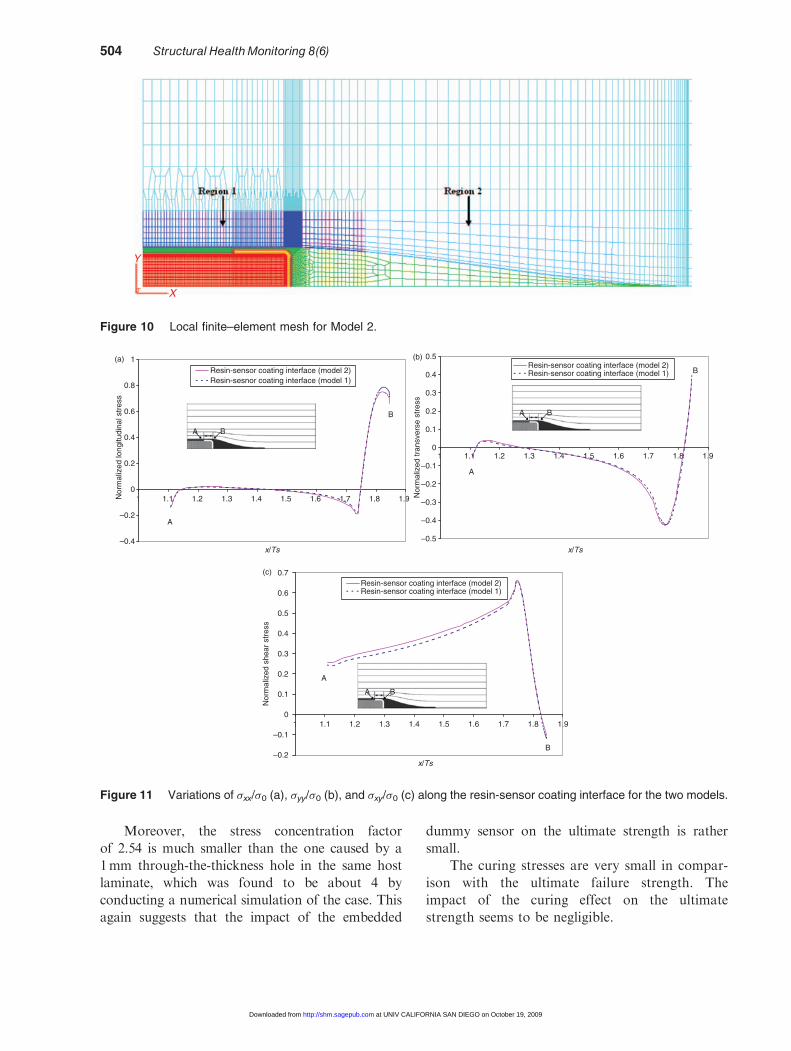
regions were introduced in Model 2, as shown in
Figure 10. Region 1 was assumed to contain 70%
of fibers in volume and, therefore the mechanical
properties of the homogenized composite in that
area are those that characterize an extremely high
concentration of fibers. Region 2, instead, is
considered as a transition region. The mechanical
properties of this area were computed as the
average of those obtained for the region where
we defined the presence of 70% fibers in volume
and the region far from the inclusion where 53%
fibers volume fraction is the value found experi-
mentally. The lengths of the two regions are 1.5
and 1.7mm, respectively. The material properties
for these two regions are listed in Table 3. The
rest of the model is the same as Model 1. The
applied load is still equivalent to a 1% nominal
longitudinal strain.
The stress and strain fields computed for
Model 2 are similar to those of Model 1. The
averaged remote stress, �0, corresponding to the
applied 1% nominal strain is about 477.2MPa.
As for Model 1, the maximum von Mises stress
within the resin layer appears at the sensor
corner in the resin-sensor coating interface. Its
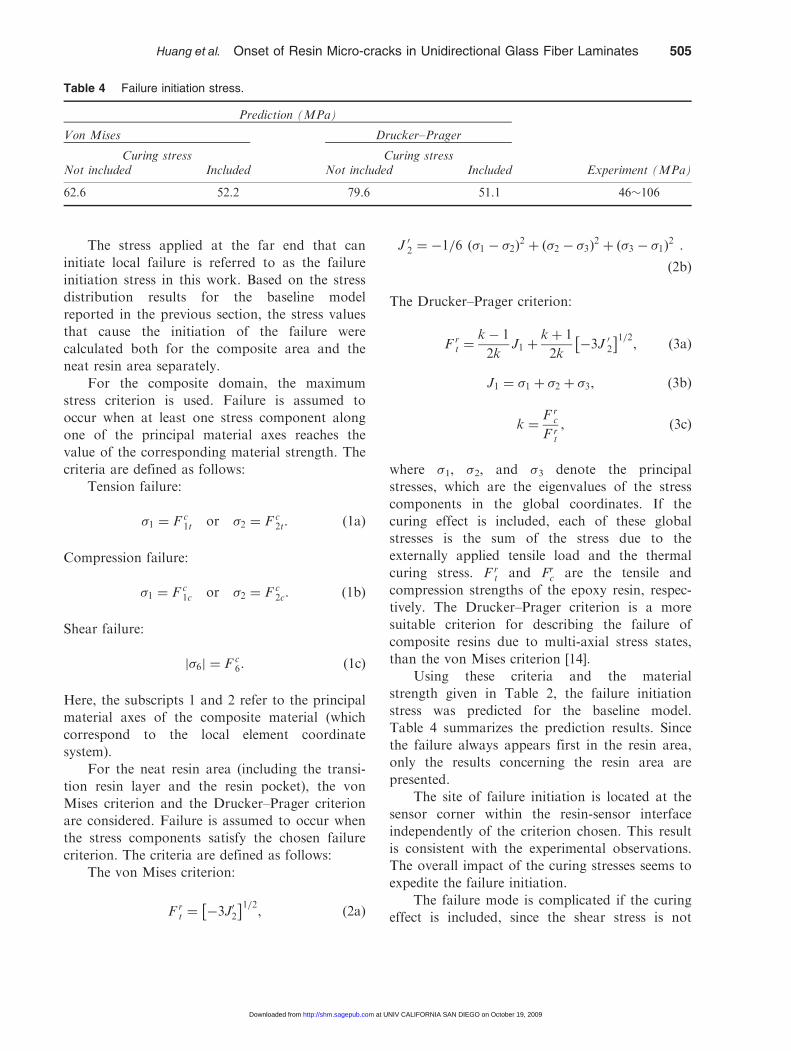
value is �575.7MPa. The distribution of the
stresses along the resin-sensor coating interface,
where micro-cracking is expected to initiate, is
plotted in Figure 11(a)–(c) and compared with
the results from Model 1. All the stresses are
normalized by the remote stress, �0.It appears that the variation of the local fiber
volume content assigned to the aforementioned
–0.4
–0.2
0.4
0.2
0.6
0.8
1
x/Ts x/Ts
x/Ts
Nor
mal
ized
long
itudi
nal s
tres
s
Nor
mal
ized
she
ar s
tres
s
(a)
–0.4
–0.5
–0.2
–0.1
–0.3
0.2
0.1
0
0.3
0.5
0.4
Nor
mal
ized
tran
sver
se s
tres
s
(b)
–0.1
–0.2
0.4
0.3
0.2
0.1
0
0.6
0.7
0.5
0.8(c)
01
A
B
1.1 1.2 1.3 1.4 1.5 1.6 1.7 1.8 1.9
1 1.1 1.2 1.3 1.4 1.5 1.6 1.7 1.8 1.9
1 1.1 1.2 1.3 1.4 1.5 1.6 1.7 1.8 1.9
A
B
A
B
Figure 8 Variations of �xx/�0 (a), �yy/�0, (b), and �xy/�0 (c) along the resin-sensor coating interface for various TTR.
502 Structural HealthMonitoring 8(6)
at UNIV CALIFORNIA SAN DIEGO on October 19, 2009 http://shm.sagepub.comDownloaded from
regions in the model and created to reproduce the
local fiber distortion around the embedded dummy
sensor, is responsible for a change in the stress
values (tensile, transverse, and shear) of 58% of
those of the baseline case (Model 1). Therefore, the
increase of computational efforts that Model 2
presents with respect to Model 1 is not worth.
4 Failure Analysis
Since S2 glass fibers have a much higher
Young’s modulus than the neat epoxy resin, most
of the load is carried by the fibers, so that the
ultimate failure strength is mainly determined by
the fiber volume fraction.
Embedding micro-sensors and devices with-
out cutting the plies around the implants (also
known as cut-out methods) is not expected to
have a significant impact on the ultimate failure
strength since it does not significantly modify the
material properties. The quasi-static tensile char-
acterization of the material [13] shows that the
embedment of rigid inclusions causes an averaged
decrease of only 2.6% in the ultimate failure
strength.
–0.4
–0.2
0.4
0.2
0.6
0.8
1
x/Ts x/Ts
x/Ts
Nor
mal
ized
long
itudi
nal s
tres
s
Nor
mal
ized
she
ar s
tres
s
(a)
–0.4
–0.6
–0.2
0.2
0
0.6
0.4
Nor
mal
ized
tran
sver
se s
tres
s
(b)
–0.1
–0.2
0.4
0.3
0.2
0.1
0
0.6
0.7
0.5
0.8(c)
01
A
B
1.1 1.2 1.3 1.4 1.5 1.6 1.7 1.8 1.9
1 1.1 1.2 1.3 1.4 1.5 1.6 1.7 1.8 1.9
1 1.1 1.2 1.3 1.4 1.5 1.6 1.7 1.8 1.9
A
B
A
B
Figure 9 Variations of �xx/�0 (a), �yy/�0 (b), and �xy/�0 (c) along the resin-sensor coating interface for various LRP.
Table 3 Material properties used in Model 2.
Young’smodulus (GPa)
Shearmodulus (GPa)
Poisson’sratio
Coefficient of thermalexpansion(10�6/8C)
Material Ex Ey Gxy vxy ax ay
Region 1 (70% fiber) 61.99 11.66 4.24 0.28 2.90 30.18Region 2 54.90 10.73 3.97 0.29 3.57 38.16
Huang et al. Onset of Resin Micro-cracks in Unidirectional Glass Fiber Laminates 503
at UNIV CALIFORNIA SAN DIEGO on October 19, 2009 http://shm.sagepub.comDownloaded from
Moreover, the stress concentration factor
of 2.54 is much smaller than the one caused by a
1mm through-the-thickness hole in the same host
laminate, which was found to be about 4 by
conducting a numerical simulation of the case. This
again suggests that the impact of the embedded
dummy sensor on the ultimate strength is rather
small.
The curing stresses are very small in compar-
ison with the ultimate failure strength. The
impact of the curing effect on the ultimate
strength seems to be negligible.
Y
X
Figure 10 Local finite–element mesh for Model 2.
1 1.1 1.2 1.3 1.4 1.5 1.6 1.7 1.8 1.9
1 1.1 1.2 1.3 1.4 1.5 1.6 1.7 1.8 1.9
1 1.1 1.2 1.3 1.4 1.5 1.6 1.7 1.8 1.9
–0.4
–0.2
0
0.2
0.4
0.6
0.8
1
x/Ts x/Ts
x/Ts
Nor
mal
ized
long
itudi
nal s
tres
s
Resin-sensor coating interface (model 2)Resin-sesnor coating interface (model 1)
B
A
BA
–0.5
–0.4
–0.3
–0.2
–0.1
0
0.1
0.2
0.3
0.4
0.5
Nor
mal
ized
tran
sver
se s
tres
s
Resin-sensor coating interface (model 2)Resin-sensor coating interface (model 1) B
A
BA
(a) (b)
–0.2
–0.1
0
0.1
0.2
0.3
0.4
0.5
0.6
0.7
Nor
mal
ized
she
ar s
tres
s
Resin-sensor coating interface (model 2)Resin-sensor coating interface (model 1)
B
A
BA
(c)
Figure 11 Variations of �xx/�0 (a), �yy/�0 (b), and �xy/�0 (c) along the resin-sensor coating interface for the two models.
504 Structural HealthMonitoring 8(6)
at UNIV CALIFORNIA SAN DIEGO on October 19, 2009 http://shm.sagepub.comDownloaded from
The stress applied at the far end that can
initiate local failure is referred to as the failure
initiation stress in this work. Based on the stress
distribution results for the baseline model
reported in the previous section, the stress values
that cause the initiation of the failure were
calculated both for the composite area and the
neat resin area separately.
For the composite domain, the maximum
stress criterion is used. Failure is assumed to
occur when at least one stress component along
one of the principal material axes reaches the
value of the corresponding material strength. The
criteria are defined as follows:
Tension failure:
�1 ¼ F c1t or �2 ¼ F c
2t: ð1aÞ
Compression failure:
�1 ¼ F c1c or �2 ¼ F c
2c: ð1bÞ
Shear failure:
�6j j ¼ F c6: ð1cÞ
Here, the subscripts 1 and 2 refer to the principal
material axes of the composite material (which
correspond to the local element coordinate
system).
For the neat resin area (including the transi-
tion resin layer and the resin pocket), the von
Mises criterion and the Drucker–Prager criterion
are considered. Failure is assumed to occur when
the stress components satisfy the chosen failure
criterion. The criteria are defined as follows:
The von Mises criterion:
F rt ¼ �3J
02
� �1=2, ð2aÞ
J 02 ¼ �1=6 ð�1 � �2Þ2þ ð�2 � �3Þ
2þ ð�3 � �1Þ
2� �
:
ð2bÞ
The Drucker–Prager criterion:
F rt ¼
k� 1
2kJ1 þ
kþ 1
2k�3J 02� �1=2
, ð3aÞ
J1 ¼ �1 þ �2 þ �3, ð3bÞ
k ¼F r
c
F rt
, ð3cÞ
where �1, �2, and �3 denote the principal
stresses, which are the eigenvalues of the stress
components in the global coordinates. If the
curing effect is included, each of these global
stresses is the sum of the stress due to the
externally applied tensile load and the thermal
curing stress. F rt and Fr
c are the tensile and
compression strengths of the epoxy resin, respec-
tively. The Drucker–Prager criterion is a more
suitable criterion for describing the failure of
composite resins due to multi-axial stress states,
than the von Mises criterion [14].
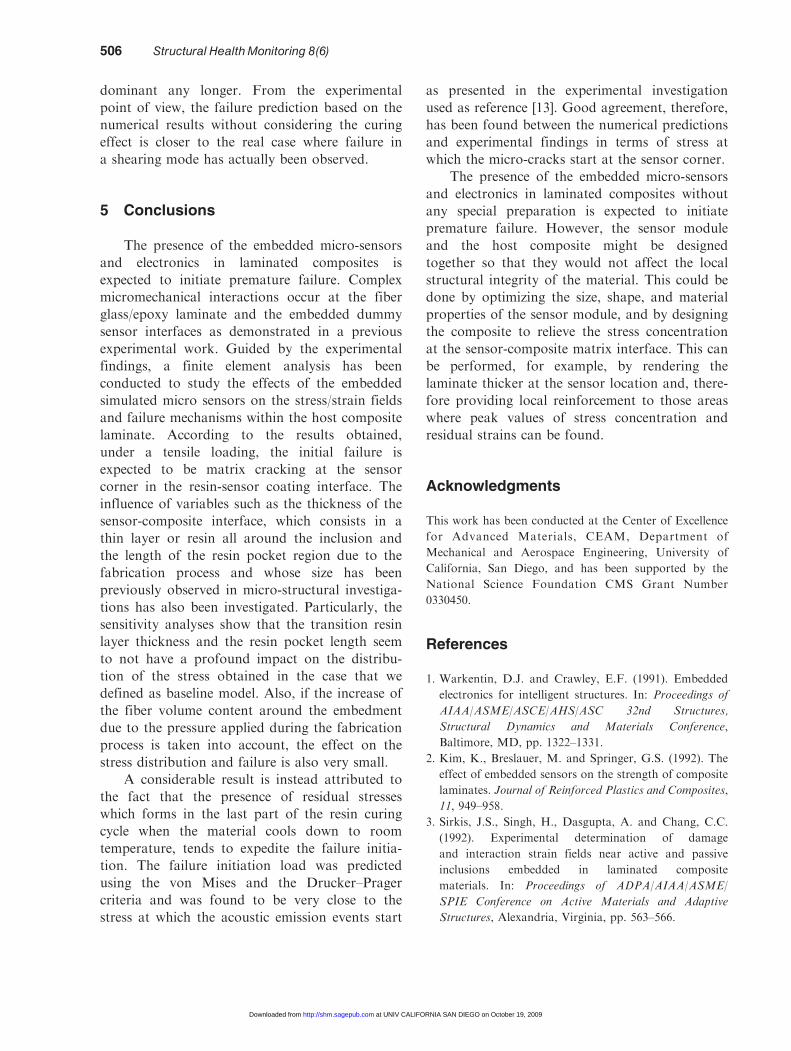
Using these criteria and the material
strength given in Table 2, the failure initiation
stress was predicted for the baseline model.
Table 4 summarizes the prediction results. Since
the failure always appears first in the resin area,
only the results concerning the resin area are
presented.
The site of failure initiation is located at the
sensor corner within the resin-sensor interface
independently of the criterion chosen. This result
is consistent with the experimental observations.
The overall impact of the curing stresses seems to
expedite the failure initiation.
The failure mode is complicated if the curing
effect is included, since the shear stress is not
Table 4 Failure initiation stress.
Prediction (MPa)
Von Mises Drucker–Prager
Curing stress Curing stressNot included Included Not included Included Experiment (MPa)
62.6 52.2 79.6 51.1 46�106
Huang et al. Onset of Resin Micro-cracks in Unidirectional Glass Fiber Laminates 505
at UNIV CALIFORNIA SAN DIEGO on October 19, 2009 http://shm.sagepub.comDownloaded from
dominant any longer. From the experimental
point of view, the failure prediction based on the
numerical results without considering the curing
effect is closer to the real case where failure in
a shearing mode has actually been observed.
5 Conclusions
The presence of the embedded micro-sensors
and electronics in laminated composites is
expected to initiate premature failure. Complex
micromechanical interactions occur at the fiber
glass/epoxy laminate and the embedded dummy
sensor interfaces as demonstrated in a previous
experimental work. Guided by the experimental
findings, a finite element analysis has been
conducted to study the effects of the embedded
simulated micro sensors on the stress/strain fields
and failure mechanisms within the host composite
laminate. According to the results obtained,
under a tensile loading, the initial failure is
expected to be matrix cracking at the sensor
corner in the resin-sensor coating interface. The
influence of variables such as the thickness of the
sensor-composite interface, which consists in a
thin layer or resin all around the inclusion and
the length of the resin pocket region due to the
fabrication process and whose size has been
previously observed in micro-structural investiga-
tions has also been investigated. Particularly, the
sensitivity analyses show that the transition resin
layer thickness and the resin pocket length seem
to not have a profound impact on the distribu-
tion of the stress obtained in the case that we
defined as baseline model. Also, if the increase of
the fiber volume content around the embedment
due to the pressure applied during the fabrication
process is taken into account, the effect on the
stress distribution and failure is also very small.
A considerable result is instead attributed to
the fact that the presence of residual stresses
which forms in the last part of the resin curing
cycle when the material cools down to room
temperature, tends to expedite the failure initia-
tion. The failure initiation load was predicted
using the von Mises and the Drucker–Prager
criteria and was found to be very close to the
stress at which the acoustic emission events start
as presented in the experimental investigation
used as reference [13]. Good agreement, therefore,
has been found between the numerical predictions
and experimental findings in terms of stress at
which the micro-cracks start at the sensor corner.
The presence of the embedded micro-sensors
and electronics in laminated composites without
any special preparation is expected to initiate
premature failure. However, the sensor module
and the host composite might be designed
together so that they would not affect the local
structural integrity of the material. This could be
done by optimizing the size, shape, and material
properties of the sensor module, and by designing
the composite to relieve the stress concentration
at the sensor-composite matrix interface. This can
be performed, for example, by rendering the
laminate thicker at the sensor location and, there-
fore providing local reinforcement to those areas
where peak values of stress concentration and
residual strains can be found.
Acknowledgments
This work has been conducted at the Center of Excellence
for Advanced Materials, CEAM, Department of
Mechanical and Aerospace Engineering, University of
California, San Diego, and has been supported by the
National Science Foundation CMS Grant Number
0330450.
References
1. Warkentin, D.J. and Crawley, E.F. (1991). Embedded
electronics for intelligent structures. In: Proceedings of
AIAA/ASME/ASCE/AHS/ASC 32nd Structures,
Structural Dynamics and Materials Conference,
Baltimore, MD, pp. 1322–1331.
2. Kim, K., Breslauer, M. and Springer, G.S. (1992). The
effect of embedded sensors on the strength of composite
laminates. Journal of Reinforced Plastics and Composites,
11, 949–958.
3. Sirkis, J.S., Singh, H., Dasgupta, A. and Chang, C.C.
(1992). Experimental determination of damage
and interaction strain fields near active and passive
inclusions embedded in laminated composite
materials. In: Proceedings of ADPA/AIAA/ASME/
SPIE Conference on Active Materials and Adaptive
Structures, Alexandria, Virginia, pp. 563–566.
506 Structural HealthMonitoring 8(6)
at UNIV CALIFORNIA SAN DIEGO on October 19, 2009 http://shm.sagepub.comDownloaded from
4. Hansen, J.P. and Vizzini, A.J. (2000). Fatigue response of
a host structure with interlaced embedded devices. Journal
of Intelligent Material System and Structures, 11, 902–909.
5. Mall, S. and Coleman, J.M. (1998). Monotonic and
fatigue loading behavior of quasi-isotropic graphite/
epoxy laminate embedded with piezoelectric sensor.
Smart Materials and Structures, 7, 822–832.
6. Paget, C.A. and Levin, K. (1999). Structural integrity of
composites with embedded piezoelectric ceramic trans-
ducer. In: Proceedings of SPIE Conference on Smart
Structure and Integrated Systems, Newport Beach,
California, Vol. 3668, pp. 306–312.
7. Dasgupta, A., Wan, Y. and Sirkis, J.S. (1992). Prediction
of resin pocket geometry for stress analysis of optical
fibers embedded in laminated composites. Smart
Materials and Structures, 1, 101–107.
8. Levin, K. and Nilsson, S. (1994). Analysis of the local
stress field in a composite material with an embedded
EFPI-sensor. Proceedings of the 2nd European
Conference on Smart Structures and Materials,
Glasgow, pp. 379–382.
9. Eaton, N.C., Drew R.C. and Geiger, H. (1995). Finite
element stress and strain analysis in composites with
embedded optical fiber sensors. Smart Materials and
Structures, 4, 113–117.
10. Shivakumar, K. and Bhargava, A. (2005). Failure
mechanics of a composite laminate embedded with a
fiber optic sensor. Journal of Composite Materials,
39(9), 777–798.
11. Chow, W.T. and Graves, M.J. (1992). Stress analysis of
a rectangular implant in laminated composites using
2-D and 3-D finite elements. In: Proceedings of AIAA/
ASME/ASCE/AHS/ASC 33rd Structures, Structural
Dynamics and Materials Conference, Dallas, TX,
pp. 848–861.
12. Singh, D.A. and Vizzini, A.J. (1994). Structural
integrity of composite laminates with interlaced actua-
tors. Smart Materials and Structures, 3, 71–79.
13. Ghezzo, F., Huang Y. and Nemat-Nasser, S. (2008).
Onset of resin micro-cracks in unidirectional glass fiber
laminates with integrated SHM sensors: experimental
results. Structural Health Monitoring, 8, 477–491
14. De Groot, R., Perters, M.C.R.B., DE Haan, Y.M,
Dop, G.J. and Plasschaert, A.J.M. (1987). Failure stress
criteria for composite resin. Journal of Dental Research,
66, 1748–1752.
Huang et al. Onset of Resin Micro-cracks in Unidirectional Glass Fiber Laminates 507
at UNIV CALIFORNIA SAN DIEGO on October 19, 2009 http://shm.sagepub.comDownloaded from