Embed Size (px)
Citation preview
Integrating genetic data into management of marine
resources: how can we do it better?
Robin S Waples1, Andre E Punt2 & Jason M Cope3
1Northwest Fisheries Science Center, 2725 Montlake Blvd East, Seattle, WA 98112, USA; 2School of Aquatic and Fishery
Sciences, Box 355020, University of Washington, Seattle, WA 98195-5020, USA; 3Fishery Resource Analysis and
Monitoring Division, Northwest Fisheries Science Center, 2725 Montlake Blvd East, Seattle, WA 98112, USA
Introduction 424
Factors contributing to the problem 425
Biological Realities 425
Identifying populations and stocks 425
Mixed-stock fishery analysis 428
Communication issues 429
Statistical significance vs. best available science 429
Disagreements and uncertainties among geneticists 430
Institutional issues 431
Mismatch between management units and biological units 431
Allocation issues 433
Organizational structure 434
An example – genetic stock identification of Chinook salmon 434
Background 434
Biological and technical challenges 435
Institutional issues 435
Communication 435
Solutions: some strategies for improving the use of genetic data in fisheries management 435
Communication 435
Abstract
Molecular genetic data have found widespread application in the identification of
population and conservation units for aquatic species. However, integration of
genetic information into actual management has been slow, and explicit and
quantitative inclusion of genetic data into fisheries models is rare. In part, this reflects
the inherent difficulty in using genetic markers to draw inferences about demo-
graphic independence, which is generally the information of the greatest short-term
interest to fishery managers. However, practical management constraints, institu-
tional structures and communication issues have also contributed to the lack of
integration. This paper identifies some of the organizational, conceptual and technical
barriers that have hampered full use of genetics data in stock assessment and hence
fishery management and outlines how such use could be enhanced.
Keywords Demographic independence, fish stock assessment, fisheries manage-
ment, mixed-stock fisheries, stock identification
Correspondence:
Robin Waples, North-
west Fisheries Science
Center, 2725 Mont-
lake Blvd East, Seattle,
WA 98112, USA
Tel.: +1 206 860 3254
Fax: +1 206 860 3335
E-mail: robin.waples@
noaa.gov
Received 5 May 2008
Accepted 27 Aug 2008
Journal compilation � 2008 Blackwell Publishing Ltd
No claim to original US government works 423
F I S H and F I S H E R I E S , 2008, 9, 423–449
MARAM/IWS/2019/Hake/BG4
1
Integration 435
Improved dialogue 436
Getting real 437
Analytical methods 437
Institutional changes 438
Being opportunistic 438
Emerging areas where genetic information can improve fisheries management 438
Management strategy evaluation 438
Novel applications 439
Population abundance 439
A global testing of genetic techniques for management purposes 441
Miscellaneous 441
Conclusions 441
Acknowledgements 442
References 442
Appendix 1: Fred Utter’s take on the genetic marker wars (unpublished data) 448
Introduction
Management of living marine resources involves
modifying anthropogenic impacts to achieve societal
goals. It is widely recognized that sound manage-
ment depends on scientific information, and a
variety of international organizations have been
established to facilitate collection and interpretation
of scientific data for marine species in a management
context (e.g. International Council for the Explora-
tion of the Sea, ICES; International Whaling Com-
mission, IWC; International Commission for the
Conservation of Atlantic Tunas, ICCAT; North
Pacific Marine Science Organization, PICES). In the
USA, the three laws with the greatest direct impact
on fisheries management at the national level are
the Magnusson–Stevens Fisheries Conservation and
Management Act (MSA), the Endangered Species
Act (ESA) and the Marine Mammal Protection Act
(MMPA). Each of these acts has different (and
potentially conflicting) goals, but all have a common
need for scientific advice on the likely consequences
of alternative management actions.
Much of the scientific advice for fisheries manage-
ment is based on outputs of stock assessment models.
Several texts (Hilborn and Walters 1992; Quinn and
Deriso 1999; Haddon 2001; Walters and Martell
2004) describe the plethora of methods used for
fisheries stock assessment, which differ with respect
to data requirements, complexity and the quantities
they are designed to estimate. However, all involve (to
at least some extent) three steps: (i) fitting a model
to data; (ii) using results of the model fitting exercise
to make inferences about attributes of the population
being assessed and (iii) using results of the population
assessment to evaluate the ability of alternative
management actions to satisfy management goals
and objectives (which arise from legislation, interna-
tional agreements and court decisions). In addition,
all stock assessment methods require that the stocks/
populations to be assessed are defined.
Some of the most fundamental (and vexing)
problems in marine resource management are
amenable to study with genetic methods. For
example, in the 1950s, dissatisfaction with perfor-
mance of phenotypic methods for stock identifica-
tion encouraged early exploration of the usefulness
of genetic markers (reviewed by Cadrin et al. 2005).
Identification of genetically based differences among
populations spurred development of statistical algo-
rithms that can provide estimates of contributions of
source populations to a mixed-stock fishery (Milner
et al. 1985). The field of fishery genetics has greatly
expanded in recent decades (Sweijd et al. 2000;
Ward 2000; Hauser and Carvalho 2008), in parallel
with (and due in no small part to spin-offs from)
rapidly developing technologies in the field of
human genetics. A recent meeting reviewing six
decades of fishery genetics included, among many
others, talks on genetic variation in reaction norms
in fish, fishery-induced selection, parentage analysis
to evaluate relative reproductive success, genetic
analysis of domestication, insights into population
histories using DNA from archived scales, gene
Genetic data and fisheries management R S Waples et al.
Journal compilation � 2008 Blackwell Publishing Ltd
424 No claim to original US government works, F I S H and F I S H E R I E S , 9, 423–449
MARAM/IWS/2019/Hake/BG4
2
expression analyses to assess reproductive status,
co-evolutionary relationships between IHNV virus
and salmonid fishes and molecular tools for remote
biosensing (see Waples et al. 2008 or http://
www.nwfsc.noaa.gov/events/workshops/index.cfm
for a meeting summary and agenda). More broadly,
genetic data are widely used in many aspects of
global biodiversity conservation, including identifi-
cation of species (Hebert et al. 2004; Smith et al.
2006) and conservation units (Waples 1991;
Moritz 1994; Crandall et al. 2000) and manage-
ment of captive or artificially propagated popula-
tions (Frankham et al. 2002; Ryder 2003).
It is therefore somewhat ironic that, in spite of the
considerable needs for scientific information by
managers of living marine resources, and in spite
of the demonstrated ability of genetic data to
address questions of direct management relevance,
formal integration of genetic information into fish-
eries management has been slow in many cases and
uneven in even the most favourable situations. For
example, on the West Coast of the USA, there is a
rather imperfect correlation between the population
units of groundfish species that have been identified
with genetic markers and the units that are used for
stock assessments (Table 1), and similar patterns
can be found elsewhere in the world. This paper
explores some of the reasons why this has occurred,
where and how genetic information is currently
being used in fisheries management, and how better
integration of genetic information and traditional
methods of fisheries stock assessment could sub-
stantially improve the quality of management
advice. This is a large topic, so in this paper we
have chosen to focus primarily on two widespread
uses for genetic information in providing manage-
ment advice: identification of populations or stocks
and analysis of mixed-stock fisheries. We illustrate
with examples drawn primarily from our experi-
ences with the management of fisheries and whal-
ing off Australia, South Africa and the West Coast of
North America.
Factors contributing to the problem
Biological realities
Identifying populations and stocks
Andrewartha and Birch (1984) identified two major
ways of thinking about populations: the ecological
paradigm and the evolutionary paradigm (see
Waples and Gaggiotti 2006 for more discussion).
Both paradigms invoke a cohesive force that unites
individuals. In the ecological paradigm, the cohesive
forces are demographic; a population is character-
ized by individuals that co-occur in space and time
and have an opportunity to interact demographi-
cally. Important linkages between populations can
largely be captured by the migration rate, m, which
is the fraction of individuals in one population that
were born in another population. The ecological
paradigm is a natural way to approach the problem
of defining populations or stocks because managers
are typically interested primarily in population
dynamic processes. One of the most common
management problems is to identify populations
that are demographically independent and can be
modelled as separate entities. Information that
indicates whether migration between two putative
populations is low enough that they can be consid-
ered to be demographically independent (or, con-
versely, whether migration is high enough that they
should be treated as a single demographic unit) is
therefore of considerable interest to managers.
In the evolutionary paradigm, the cohesive forces
are genetic; a population is characterized by indi-
viduals that interbreed. Most population genetic
models are sensitive to the combined parameter
mNe, where Ne is the effective population size. The
product mNe represents the effective number of
migrants per generation (roughly, those that actu-
ally reproduce and contribute genes to the new
generation). This parameter is a key one in evolu-
tionary biology; for example, it is central to Wright’s
(1931) famous equation that relates a measure of
population genetic differentiation (FST) to the level
of gene flow:
FST � 1=ð1þ 4mNeÞ; mNe � ð1=FST � 1Þ=4:
ð1Þ
FST is easy to estimate in natural populations from
samples analysed for molecular markers. Although
Equation (1) is based on a simple, equilibrium model
and assumptions that are rarely satisfied by natural
populations (Waples 1998; Whitlock and McCauley
1999; Hedgecock et al. 2007), it still can provide
useful insights into levels of population differentia-
tion, and this equation (or variations thereof) has
been widely used in studying patterns of connectiv-
ity in marine and terrestrial systems. However, the
estimation of mNe, is of little direct use to managers,
who (as noted above) are generally interested in
m. A consequence of these contrasting paradigms
(ecological and demographic) is that, although
Genetic data and fisheries management R S Waples et al.
Journal compilation � 2008 Blackwell Publishing Ltd
No claim to original US government works, F I S H and F I S H E R I E S , 9, 423–449 425
MARAM/IWS/2019/Hake/BG4
3
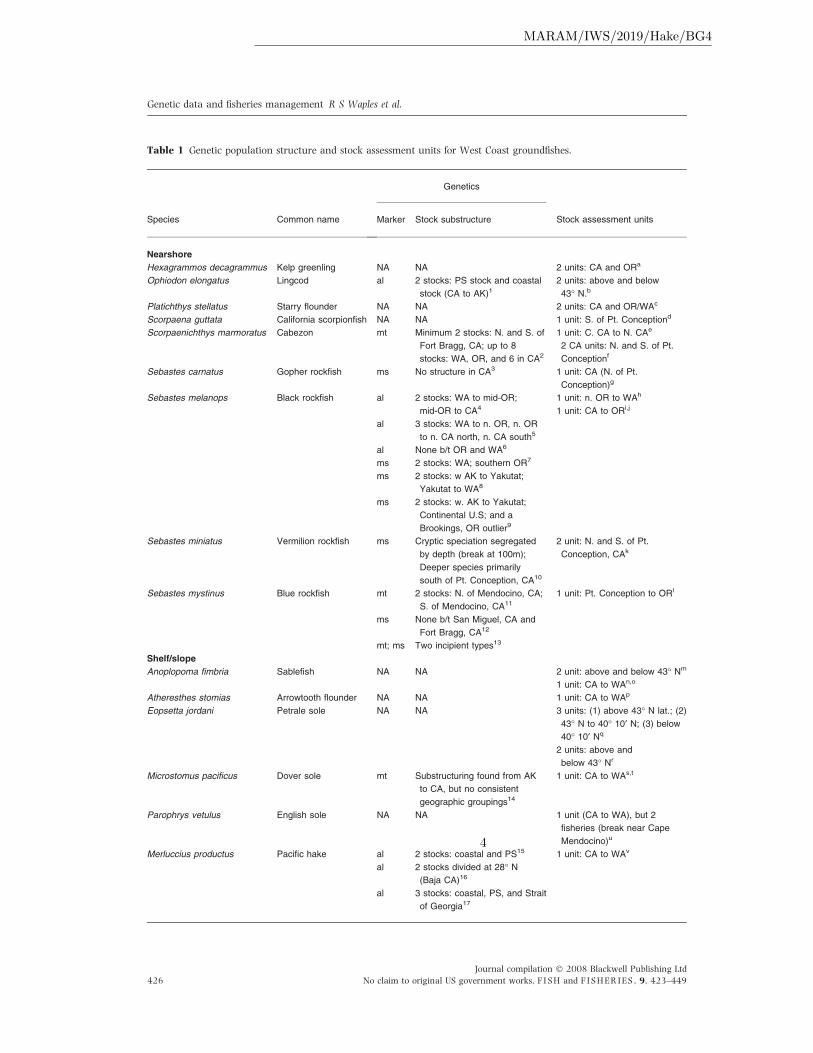
Table 1 Genetic population structure and stock assessment units for West Coast groundfishes.
Species Common name
Genetics
Stock assessment unitsMarker Stock substructure
Nearshore
Hexagrammos decagrammus Kelp greenling NA NA 2 units: CA and ORa
Ophiodon elongatus Lingcod al 2 stocks: PS stock and coastal
stock (CA to AK)1
2 units: above and below
43� N.b
Platichthys stellatus Starry flounder NA NA 2 units: CA and OR/WAc
Scorpaena guttata California scorpionfish NA NA 1 unit: S. of Pt. Conceptiond
Scorpaenichthys marmoratus Cabezon mt Minimum 2 stocks: N. and S. of
Fort Bragg, CA; up to 8
stocks: WA, OR, and 6 in CA2
1 unit: C. CA to N. CAe
2 CA units: N. and S. of Pt.
Conceptionf
Sebastes carnatus Gopher rockfish ms No structure in CA3 1 unit: CA (N. of Pt.
Conception)g
Sebastes melanops Black rockfish al 2 stocks: WA to mid-OR;
mid-OR to CA4
1 unit: n. OR to WAh
1 unit: CA to ORi,j
al 3 stocks: WA to n. OR, n. OR
to n. CA north, n. CA south5
al None b/t OR and WA6
ms 2 stocks: WA; southern OR7
ms 2 stocks: w AK to Yakutat;
Yakutat to WA8
ms 2 stocks: w. AK to Yakutat;
Continental U.S; and a
Brookings, OR outlier9
Sebastes miniatus Vermilion rockfish ms Cryptic speciation segregated
by depth (break at 100m);
Deeper species primarily
south of Pt. Conception, CA10
2 unit: N. and S. of Pt.
Conception, CAk
Sebastes mystinus Blue rockfish mt 2 stocks: N. of Mendocino, CA;
S. of Mendocino, CA11
1 unit: Pt. Conception to ORl
ms None b/t San Miguel, CA and
Fort Bragg, CA12
mt; ms Two incipient types13
Shelf/slope
Anoplopoma fimbria Sablefish NA NA 2 unit: above and below 43� Nm
1 unit: CA to WAn,o
Atheresthes stomias Arrowtooth flounder NA NA 1 unit: CA to WAp
Eopsetta jordani Petrale sole NA NA 3 units: (1) above 43� N lat.; (2)
43� N to 40� 10¢ N; (3) below
40� 10¢ Nq
2 units: above and
below 43� Nr
Microstomus pacificus Dover sole mt Substructuring found from AK
to CA, but no consistent
geographic groupings14
1 unit: CA to WAs,t
Parophrys vetulus English sole NA NA 1 unit (CA to WA), but 2
fisheries (break near Cape
Mendocino)u
Merluccius productus Pacific hake al 2 stocks: coastal and PS15 1 unit: CA to WAv
al 2 stocks divided at 28� N
(Baja CA)16
al 3 stocks: coastal, PS, and Strait
of Georgia17
Genetic data and fisheries management R S Waples et al.
Journal compilation � 2008 Blackwell Publishing Ltd
426 No claim to original US government works, F I S H and F I S H E R I E S , 9, 423–449
MARAM/IWS/2019/Hake/BG4
4
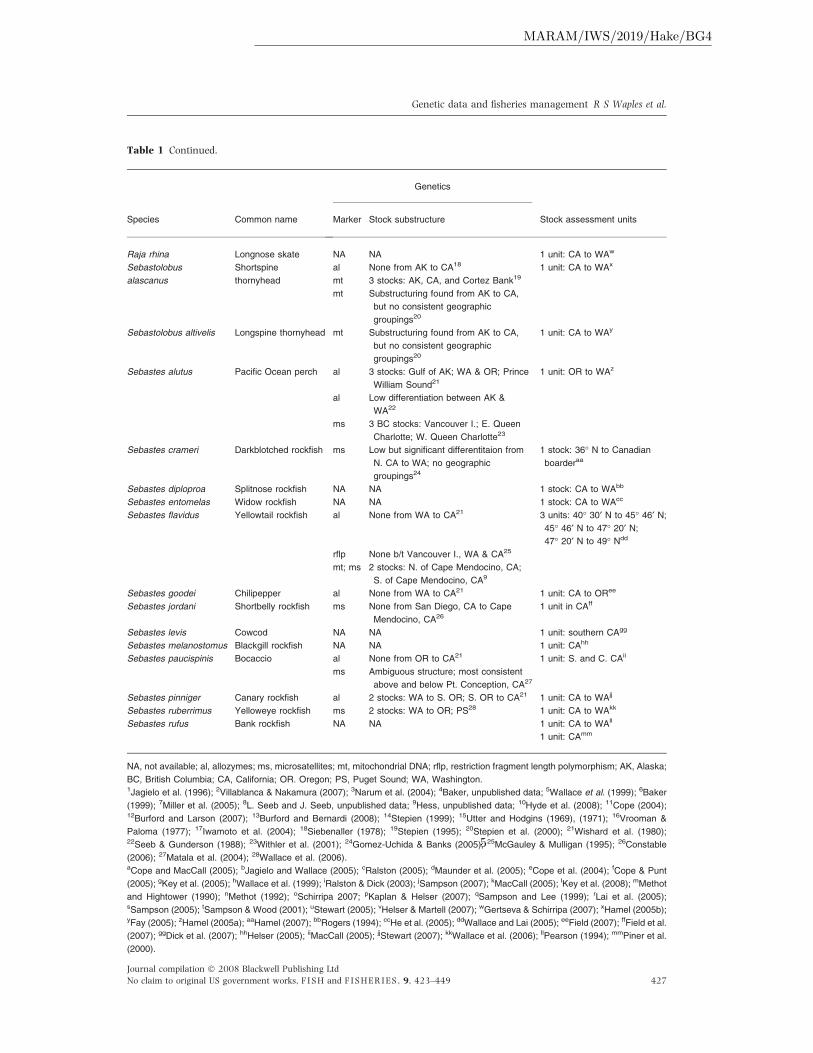
Table 1 Continued.
Species Common name
Genetics
Stock assessment unitsMarker Stock substructure
Raja rhina Longnose skate NA NA 1 unit: CA to WAw
Sebastolobus Shortspine al None from AK to CA18 1 unit: CA to WAx
alascanus thornyhead mt 3 stocks: AK, CA, and Cortez Bank19
mt Substructuring found from AK to CA,
but no consistent geographic
groupings20
Sebastolobus altivelis Longspine thornyhead mt Substructuring found from AK to CA,
but no consistent geographic
groupings20
1 unit: CA to WAy
Sebastes alutus Pacific Ocean perch al 3 stocks: Gulf of AK; WA & OR; Prince
William Sound21
1 unit: OR to WAz
al Low differentiation between AK &
WA22
ms 3 BC stocks: Vancouver I.; E. Queen
Charlotte; W. Queen Charlotte23
Sebastes crameri Darkblotched rockfish ms Low but significant differentitaion from
N. CA to WA; no geographic
groupings24
1 stock: 36� N to Canadian
boarderaa
Sebastes diploproa Splitnose rockfish NA NA 1 stock: CA to WAbb
Sebastes entomelas Widow rockfish NA NA 1 stock: CA to WAcc
Sebastes flavidus Yellowtail rockfish al None from WA to CA21 3 units: 40� 30¢ N to 45� 46¢ N;
45� 46¢ N to 47� 20¢ N;
47� 20¢ N to 49� Ndd
rflp None b/t Vancouver I., WA & CA25
mt; ms 2 stocks: N. of Cape Mendocino, CA;
S. of Cape Mendocino, CA9
Sebastes goodei Chilipepper al None from WA to CA21 1 unit: CA to ORee
Sebastes jordani Shortbelly rockfish ms None from San Diego, CA to Cape
Mendocino, CA26
1 unit in CAff
Sebastes levis Cowcod NA NA 1 unit: southern CAgg
Sebastes melanostomus Blackgill rockfish NA NA 1 unit: CAhh
Sebastes paucispinis Bocaccio al None from OR to CA21 1 unit: S. and C. CAii
ms Ambiguous structure; most consistent
above and below Pt. Conception, CA27
Sebastes pinniger Canary rockfish al 2 stocks: WA to S. OR; S. OR to CA21 1 unit: CA to WAjj
Sebastes ruberrimus Yelloweye rockfish ms 2 stocks: WA to OR; PS28 1 unit: CA to WAkk
Sebastes rufus Bank rockfish NA NA 1 unit: CA to WAll
1 unit: CAmm
NA, not available; al, allozymes; ms, microsatellites; mt, mitochondrial DNA; rflp, restriction fragment length polymorphism; AK, Alaska;
BC, British Columbia; CA, California; OR. Oregon; PS, Puget Sound; WA, Washington.1Jagielo et al. (1996); 2Villablanca & Nakamura (2007); 3Narum et al. (2004); 4Baker, unpublished data; 5Wallace et al. (1999); 6Baker
(1999); 7Miller et al. (2005); 8L. Seeb and J. Seeb, unpublished data; 9Hess, unpublished data; 10Hyde et al. (2008); 11Cope (2004);12Burford and Larson (2007); 13Burford and Bernardi (2008); 14Stepien (1999); 15Utter and Hodgins (1969), (1971); 16Vrooman &
Paloma (1977); 17Iwamoto et al. (2004); 18Siebenaller (1978); 19Stepien (1995); 20Stepien et al. (2000); 21Wishard et al. (1980);22Seeb & Gunderson (1988); 23Withler et al. (2001); 24Gomez-Uchida & Banks (2005); 25McGauley & Mulligan (1995); 26Constable
(2006); 27Matala et al. (2004); 28Wallace et al. (2006).aCope and MacCall (2005); bJagielo and Wallace (2005); cRalston (2005); dMaunder et al. (2005); eCope et al. (2004); fCope & Punt
(2005); gKey et al. (2005); hWallace et al. (1999); iRalston & Dick (2003); jSampson (2007); kMacCall (2005); lKey et al. (2008); mMethot
and Hightower (1990); nMethot (1992); oSchirripa 2007; pKaplan & Helser (2007); qSampson and Lee (1999); rLai et al. (2005);sSampson (2005); tSampson & Wood (2001); uStewart (2005); vHelser & Martell (2007); wGertseva & Schirripa (2007); xHamel (2005b);yFay (2005); zHamel (2005a); aaHamel (2007); bbRogers (1994); ccHe et al. (2005); ddWallace and Lai (2005); eeField (2007); ffField et al.
(2007); ggDick et al. (2007); hhHelser (2005); iiMacCall (2005); jjStewart (2007); kkWallace et al. (2006); llPearson (1994); mmPiner et al.
(2000).
Genetic data and fisheries management R S Waples et al.
Journal compilation � 2008 Blackwell Publishing Ltd
No claim to original US government works, F I S H and F I S H E R I E S , 9, 423–449 427
MARAM/IWS/2019/Hake/BG4
5
fishery managers need information about migration,
and genetic data can provide information about
migration, it is not in a currency that is immediately
useful to managers.
A second difficulty is that the transition between
demographic dependence and independence occurs
at a level of migration that is very high in
evolutionary terms. Surprisingly, little attention in
the literature has been paid to assessing the level of
migration required to produce demographic cou-
pling, but one simulation study (Hastings 1993)
suggests that this might occur at about m = 0.1:
populations connected by 10% or more migration
are demographically coupled, whereas those expe-
riencing less migration are demographically inde-
pendent. Under what circumstances could genetic
data distinguish between migration rates of, say,
5%, 10% and 20% – that is, half, equal to or twice
the putative threshold for demographic indepen-
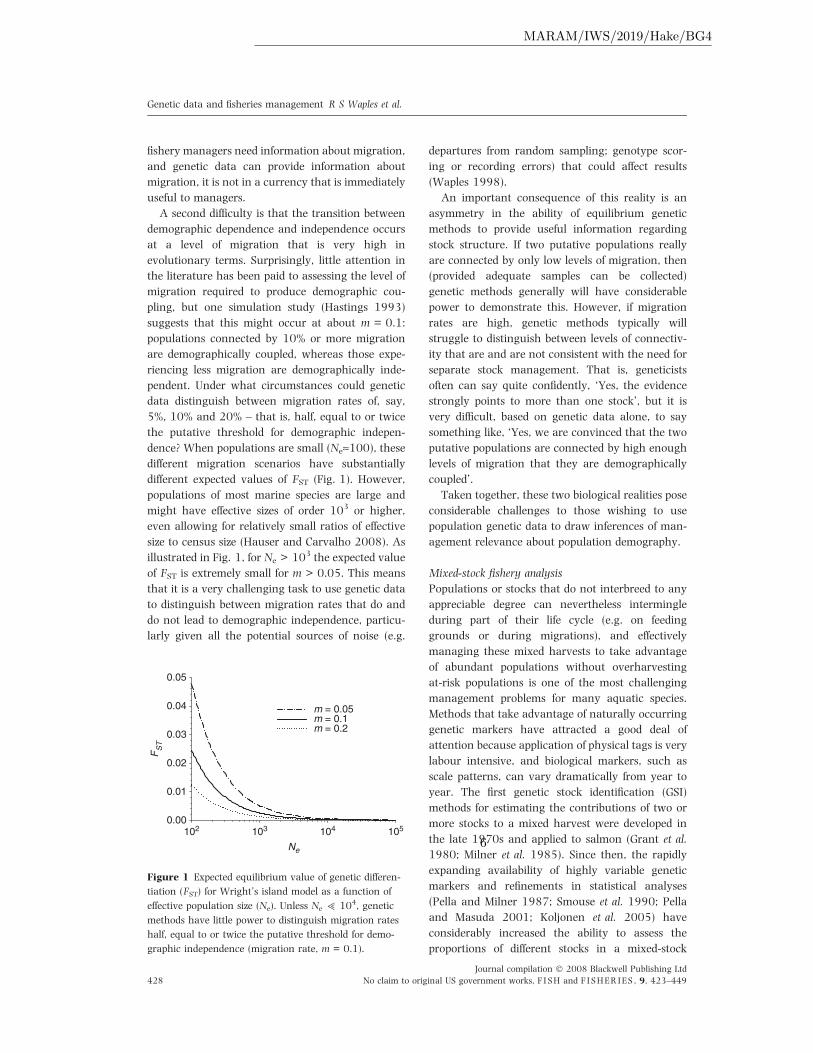
dence? When populations are small (Ne»100), these
different migration scenarios have substantially
different expected values of FST (Fig. 1). However,
populations of most marine species are large and
might have effective sizes of order 103 or higher,
even allowing for relatively small ratios of effective
size to census size (Hauser and Carvalho 2008). As
illustrated in Fig. 1, for Ne > 103 the expected value
of FST is extremely small for m > 0.05. This means
that it is a very challenging task to use genetic data
to distinguish between migration rates that do and
do not lead to demographic independence, particu-
larly given all the potential sources of noise (e.g.
departures from random sampling; genotype scor-
ing or recording errors) that could affect results
(Waples 1998).
An important consequence of this reality is an
asymmetry in the ability of equilibrium genetic
methods to provide useful information regarding
stock structure. If two putative populations really
are connected by only low levels of migration, then
(provided adequate samples can be collected)
genetic methods generally will have considerable
power to demonstrate this. However, if migration
rates are high, genetic methods typically will
struggle to distinguish between levels of connectiv-
ity that are and are not consistent with the need for
separate stock management. That is, geneticists
often can say quite confidently, ‘Yes, the evidence
strongly points to more than one stock’, but it is
very difficult, based on genetic data alone, to say
something like, ‘Yes, we are convinced that the two
putative populations are connected by high enough
levels of migration that they are demographically
coupled’.
Taken together, these two biological realities pose
considerable challenges to those wishing to use
population genetic data to draw inferences of man-
agement relevance about population demography.
Mixed-stock fishery analysis
Populations or stocks that do not interbreed to any
appreciable degree can nevertheless intermingle
during part of their life cycle (e.g. on feeding
grounds or during migrations), and effectively
managing these mixed harvests to take advantage
of abundant populations without overharvesting
at-risk populations is one of the most challenging
management problems for many aquatic species.
Methods that take advantage of naturally occurring
genetic markers have attracted a good deal of
attention because application of physical tags is very
labour intensive, and biological markers, such as
scale patterns, can vary dramatically from year to
year. The first genetic stock identification (GSI)
methods for estimating the contributions of two or
more stocks to a mixed harvest were developed in
the late 1970s and applied to salmon (Grant et al.
1980; Milner et al. 1985). Since then, the rapidly
expanding availability of highly variable genetic
markers and refinements in statistical analyses
(Pella and Milner 1987; Smouse et al. 1990; Pella
and Masuda 2001; Koljonen et al. 2005) have
considerably increased the ability to assess the
proportions of different stocks in a mixed-stock
Ne
102 103 104 105
FS
T
0.00
0.01
0.02
0.03
0.04
0.05
m = 0.05m = 0.1m = 0.2
Figure 1 Expected equilibrium value of genetic differen-
tiation (FST) for Wright’s island model as a function of
effective population size (Ne). Unless Ne > 104, genetic
methods have little power to distinguish migration rates
half, equal to or twice the putative threshold for demo-
graphic independence (migration rate, m = 0.1).
Genetic data and fisheries management R S Waples et al.
Journal compilation � 2008 Blackwell Publishing Ltd
428 No claim to original US government works, F I S H and F I S H E R I E S , 9, 423–449
MARAM/IWS/2019/Hake/BG4
6
assemblage. Applications to a number of species
have shown that these methods can provide infor-
mation of direct management relevance (Utter et al.
1987; Brown et al. 1996; Beacham et al. 1999,
2004; Potvin and Bernatchez 2001). However,
such information has not always been fully incor-
porated into fishery management. As discussed
below in the example, this can be attributed in part
to institutional and historical issues, but it also
reflects the biological reality that the ability to
resolve mixtures involving closely related popula-
tions can be limited.
Communication issues
Statistical significance vs. best available science
Many geneticists come from a hypothesis-testing
background; a typical study design is to take
samples of individuals from different localities and
test whether one can reject the null hypothesis that
the samples were drawn from a single, panmictic
population. The hypothesis-testing framework is
well suited to many types of scientific inquiry, where
few or no practical consequences might ensue from
making a type II error (failing to detect a true effect).
In that case, it can be reasonable to stipulate a low
a level to keep the type I error (false positive) rate
low. Unfortunately, this approach has limited use-
fulness for fishery management, even though it is
well grounded in statistical methodology. This is
because the probability of obtaining a statistically
significant result (power to reject the null hypoth-
esis when it is false) depends not only on the effect
size (true level of population differentiation – the
biological signal of interest), but also on the amount
of data (numbers of individuals, loci and alleles per
locus). With limited data, important biological
differences might be missed because of a lack of
statistical power (Martien and Taylor 2003). Con-
versely, with modern techniques it might be possible
to demonstrate that very small genetic differences
are statistically significant, even if they are too small
to be biologically meaningful in a particular context
(Waples 1998).
More generally, a statistical test of panmixia is
not often of much use to decision makers by itself. In
most cases, there are sound biological reasons for
believing that individuals from location A are more
likely to breed with other individuals from location
A than they are with individuals from location B. If
that is true, then with sufficient effort it eventually
will be possible to show that allele frequencies are
not identical in the two areas. What managers
really want to know is how much more likely is local
interbreeding than migration. This is directly related
to the true level of population differentiation, or
effect size. Notably, a P-value from a statistical test
does not provide any information about effect size.
Furthermore, in natural resource management,
there can be severe (perhaps irreversible) conse-
quences of making a type II error (e.g. failing to
detect population structure when it exists). As a
consequence, fishery scientists and managers typi-
cally work on the basis of ‘best available science’, in
which various lines of evidence (including P-values
and effect sizes, as well as associated sources of
uncertainty and any other related information) are
considered in an overall context before making a
management decision. Application of ‘best available
science’ approaches are designed to avoid some of
management mistakes of the past, where, for
example, fisheries managers sometimes assumed a
null hypothesis of ‘no depletion’ and only acted to
constrain fisheries if that hypothesis could be
convincingly rejected.
Stock assessments of school shark (Galeorhinus
galeus, Triakidae), which is considered overfished
off Australia but sustainably harvested off New
Zealand, illustrate these contrasting philosophies.
Tagging studies document some migration between
the two areas (Hurst et al. 1999), and at best weak
evidence for genetic differentiation (FST = 0.0014
for allozymes and 0.0016 for mtDNA; both
P > 0.05) has been found between school sharks
in Australia and New Zealand (Ward and Gardner
1997; R.D. Ward, personal communication).
Although the genetic analyses could not reject the
hypothesis of a single stock at the nominal a = 0.05
level, the school shark populations in the two
countries are assessed and managed separately
(Punt et al. 2000). This is done because the weight
of evidence from the genetics data (a Bayesian
analysis in which the one- and two-stock hypoth-
eses are assigned equal prior probability) and
tagging data (which suggest only low rates of
movement between Australia and New Zealand and
that only ‘sub-adult’ school sharks tagged in New
Zealand had been recaptured in Australia) lend
relatively more support to the hypothesis of two
populations. Furthermore, treating Australian and
New Zealand school sharks separately is more
precautionary for the species in Australia because
if the assumption were made that there is only one
stock, there might have been no reason to reduce
Genetic data and fisheries management R S Waples et al.
Journal compilation � 2008 Blackwell Publishing Ltd
No claim to original US government works, F I S H and F I S H E R I E S , 9, 423–449 429
MARAM/IWS/2019/Hake/BG4
7
harvest rates in Australia. It should be noted that, in
this particular case, separate management (and
assessment) would probably occur simply for
administrative and logistical reasons because fish
from one species are managed by two different
national jurisdictions and hence under different
objectives and legislation. It should also be noted
that always treating putative population as separate
stocks for assessment and management purposes is
not always precautionary and that doing so unneces-
sarily can lead to loss of yield.
Disagreements and uncertainties among geneticists
As is typical of any rapidly evolving scientific
discipline, evolutionary biology is characterized by
energetic discussions among practitioners regarding
the best approaches for experimental design, labo-
ratory techniques, data interpretation and statistical
and analytical methods. Inevitably, disagreements
arise among scientists on some of these key issues.
Although this is a natural part of the scientific
process and can be a healthy way of advancing the
field, real or perceived disagreements among geneti-
cists can be confusing and troubling to managers, as
can occasional publications that question the basic
premise of applying genetic principles to conserva-
tion and management (Gauldie 1991; Backman and
Berg 1992; Cronin 2007).
The genetic ‘marker wars’ of the past several
decades are a case in point. For many years,
allozymes were the universal workhorse genetic
makers, and they made many valuable contribu-
tions to basic and applied conservation and man-
agement. Around 1980, the first applications of
mitochondrial DNA (mtDNA) analysis to natural
populations were published, and it was not long
before some predicted that mtDNA would com-
pletely replace allozymes and provide answers to all
key management questions regarding stock struc-
ture. Although mtDNA has indeed provided a
wealth of new insights, it is not a panacea and
has some limitations with respect to fishery man-
agement (e.g. it is clonal and maternally inherited,
so provides no information about male migration or
gene flow, and it is only a single marker and hence
has much less power for some applications than a
full suite of nuclear markers). In the 1990s,
microsatellites muscled aside mtDNA and largely
replaced allozymes as the markers of choice for
population genetics studies. These highly variable
markers have provided greatly increased power and
opened up exciting new opportunities (e.g. parent-
age analysis and individual assignments) that were
generally not feasible with allozymes or mtDNA.
Again, some touted microsatellites as the silver
bullet geneticists needed to answer management
questions. However, microsatellites have not made
(and cannot make) the biological realities discussed
above go away. Managers who remember the
overzealous promotion by some of mtDNA or
microsatellites are understandably sceptical of sub-
sequent (valid) claims by geneticists for the potential
of new methods.
Now the field seems poised to shift toward
another type of marker, single-nucleotide polymor-
phisms (SNPs; Morin et al. 2004a, Hauser and Seeb
2008). Like allozymes, SNPs are generally diallelic,
so each marker has less power than a single
microsatellite locus. However, they occur in vast
numbers throughout the genome; therefore, even-
tually large overall increases in power are possible.
Furthermore, once developed, SNPs can be assayed
more reliably and cheaply than microsatellites,
which could be a considerable advantage in large-
scale fishery management applications. However,
development of sufficient numbers of SNP markers
will be neither easy nor cheap, and analytical issues
such as minimizing ascertainment bias (Clark et al.
2005) remain to be resolved. As a consequence,
scientists hold diverse views on the best approach to
take in the near future. Given uncertainties or
disagreements among geneticists on such funda-
mental issues, it is not surprising that managers
often elect to take a wait-and-see approach and
defer major investments in genetic methodology
until the situation has been clarified (see example
below).
A related issue pertains to exciting opportunities
provided by new analytical and statistical methods
in population genetics. To take just one example, a
nagging problem for genetic stock identification is a
lack of certainty whether all populations contribut-
ing to the mixed harvest are represented in the
genetic baseline. If not, the resulting stock compo-
sition estimates will be biased. An early attempt to
address this problem (Smouse et al. 1990) provided
a way to estimate contributions from a single
population not included in the baseline. In the
current decade, much more powerful and much
more general genetic clustering programmes have
been developed (Pritchard et al. 2000; Corander
et al. 2004; Pella and Masuda 2006) which do not
require any baseline data at all. These programmes
attempt to identify component gene pools by form-
Genetic data and fisheries management R S Waples et al.
Journal compilation � 2008 Blackwell Publishing Ltd
430 No claim to original US government works, F I S H and F I S H E R I E S , 9, 423–449
MARAM/IWS/2019/Hake/BG4
8
ing groups of individuals that minimize single-locus
(Hardy–Weinberg) and multiple-locus (linkage) dis-
equilibrium within groups, using only the multilo-
cus genotypic information in a mixed sample. The
new clustering programmes have been widely used,
both in academic and applied management con-
texts, and are remarkably powerful in some situa-
tions. Indeed, the potential ability to identify
multiple gene pools in a single sample, without
a priori assumptions about the relationship between
sample location and population membership, is of
considerable management interest. However, power
of these methods is not unlimited, and their ability
to provide meaningful information when levels of
population genetic differentiation are weak (as
occurs with many marine species) has not been
rigorously studied (Hauser et al. 2006; Latch et al.
2006; Waples and Gaggiotti 2006; Schwartz and
McKelvey 2008). It is difficult to develop solid
recommendations for appropriate uses in applied
management contexts because rigorous evaluation
of programme performance has not been conducted
at low levels of genetic differentiation. Population
geneticists have a range of views on this issue, as
evidenced by heated discussions at some recent
meetings of the Scientific Committee of the IWC
(IWC SC) (IWC 2007a). Healthy discussions like this
can ultimately promote successful implementation
of genetic methods into fishery management, but
only if the technical issues are worked through in a
logical, transparent and systematic way. The longer
the debates continue without this sort of resolution,
the more disenchanted managers are likely to be
with geneticists and genetic methods in general.
Sometimes multiple genetic studies produce con-
flicting results. In the case of the black rockfish
(Sebastes melanops, Sebastidae), Wallace et al.
(1999) suggested separate genetic stocks north
and south of Cape Falcon, Oregon, while Baker
(1999) found that samples from north and south of
Cape Falcon were quite similar (Table 1). The
studies had different sampling and experimental
designs; so, without additional information it is
difficult to determine which provides a more accu-
rate picture of stock structure. Changes to the
population structures underlying a stock assessment
can have profound implications for stock status
regionally and hence for management actions.
Assessments of hoki (Macruronus novazelandie,
Macruronidae) off New Zealand have considered
one- and two-stock scenarios (Francis 2006). The
possibility of two (‘western’ and ‘eastern’) stocks is
supported by consistent differences seen in morpho-
metric and ageing studies (Livingston et al. 1992;
Horn and Sullivan 1996; Livingston and Schofield
1996), but early genetic studies did not identify
significant differences (Smith et al. 1981). The stock
status is sufficiently different between assessments
based on one- and two-stock scenarios potentially to
be consequential for management decision making.
Institutional issues
Institutional uncertainty relates to the inability of
institutional structures that underlie fisheries mana-
gement to deal with the problems they confront
(and how those problems change over time).
Management systems in many jurisdictions have
evolved from supporting development and expan-
sion of fisheries and fishing fleets to focusing on
conservation and sustainable utilization, but this
transition has not always been smooth.
Mismatch between management units and biological
units
The purpose of a stock assessment is to provide
timely and appropriate scientific advice to manage-
ment (see, for example, Fig. 2, which outlines the
assessment and management process for federally
managed species off the West Coast of the USA).
Stock assessments always involve simplifications
and assumptions that relate not only to biology, but
also to the realities of providing management
advice. In this section, we will focus on potential
mismatches between units on which assessments
and management are based and those inferred from
biological data, but similar consideration apply for
related issues. For example, assessments are almost
always conducted for single species, whereas in
reality stocks are influenced by multi-species effects.
However, in the absence of accepted data and
models for multi-species interactions, stock assess-
ments will continue to be based on single-species
models, the behaviour and data needs for which are
well known and familiar to managers.
Stock assessments are generally based on a
variety of sources of information, including catches,
trends in abundance and size and/or age structure.
Sampling designs for these data sources are often
based on political or administrative boundaries. For
example, data for groundfish species off the US West
Coast are generally organized into regions defined
by the International North Pacific Fisheries Com-
mission (NPFMC), while management often occurs
Genetic data and fisheries management R S Waples et al.
Journal compilation � 2008 Blackwell Publishing Ltd
No claim to original US government works, F I S H and F I S H E R I E S , 9, 423–449 431
MARAM/IWS/2019/Hake/BG4
9
at state (California, Oregon and Washington) levels
and almost always along national lines (manage-
ment arrangements for US West Coast groundfish
can be very different between the USA, Canada and
Mexico). The 2007 assessment of black rockfish
S. melanops (Sebastidae, Wallace et al. 2007;
Sampson 2007) involved an assessment boundary
at Cape Falcon, OR, rather than at the Columbia
River because Cape Falcon was the boundary for
which most of the data were available. Had the
Columbia River between chosen as the assessment
boundary, it would have been difficult, if not
impossible, to partition historical catches collected
based on NPFMC boundaries to the new regions.
Not surprisingly, the resulting discrepancy between
biological and assessment boundaries can be frus-
trating for geneticists and managers alike.
Several factors probably contribute to the com-
mon mismatch between biological and manage-
ment units evident in Table 1. The sampling design
of genetic studies does not always match the
geographic regions to which management controls
are applied. In addition, as noted above, different
genetics studies sometimes give conflicting results,
or are presented in a format or currency (e.g.
P-values or estimates of gene flow) that is not very
useful to managers. Finally, sometimes population
structure identified using genetic methods is difficult
to reconcile with standard stock structure models.
This can happen, for example, if genetic methods
find a clinal pattern, where genetic affinities change
gradually over distance rather than with discrete
breaks (Table 1). Although one might define an
arbitrary boundary (or boundaries) within the
range of a species that exhibits clinal structure
and estimate migration between the putative stocks
so defined, this would require information on
movement which is not available for the vast bulk
of marine species.
A more extreme form of the mismatch between
biology and management units occurs when genetic
data indicate that there are multiple species (rather
than just stocks) in a putative managed species. For
example, an assessment of blue rockfish (Sebastes
FISHERY INDEPENDENT
MONITORING AND
RESEARCH
ADOPTION OF REMOVAL
LEVELS, REBUILDING
TARGETS, HARVEST
ALLOCATIONS
STOCK ASSESSMENT
MODELS
FISHERY- DEPENDENT
DATA AND CATCH
ESTIMATES
ASSESSMENT
REVIEW
CONTROL
RULES, LEGAL
MANDATES,
AGENCY
GUIDELINES
MANAGEMENT MEASURES
ADVISORY BODY
GUIDANCE,
FEDERAL REVIEW,
PUBLIC COMMENT
FISHERY OUTCOME
(EFFORT, LANDINGS,
REVENUES, DISCARDS)
SOCIO-ECONOMIC ANALYSIS
IN-SEASON
MONITORING AND
ENFORCEMENT
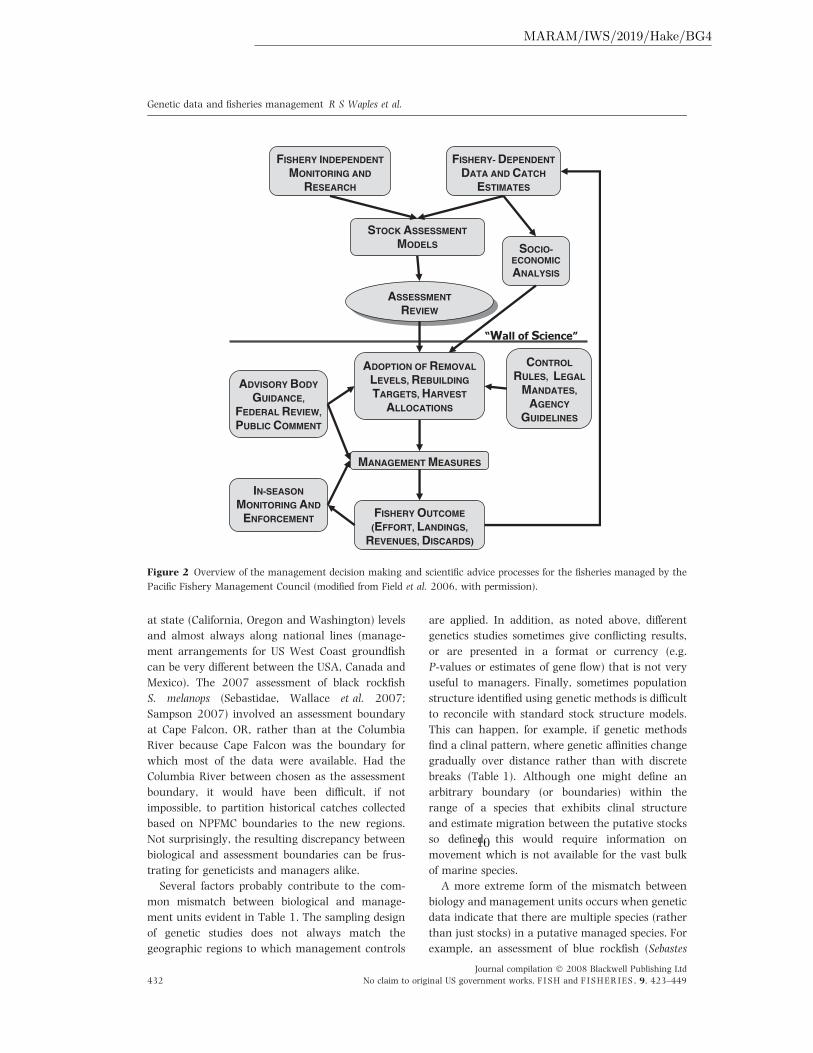
Figure 2 Overview of the management decision making and scientific advice processes for the fisheries managed by the
Pacific Fishery Management Council (modified from Field et al. 2006, with permission).
Genetic data and fisheries management R S Waples et al.
Journal compilation � 2008 Blackwell Publishing Ltd
432 No claim to original US government works, F I S H and F I S H E R I E S , 9, 423–449
MARAM/IWS/2019/Hake/BG4
10
mystinus, Sebastidae) was conducted, even though
genetic and other evidence suggests that two species
are involved (Key et al. 2008, Table 1). This
assessment combined data for the putative species
because it is currently (and probably always will be)
impossible to split the historical catches to species.
Although conducting aggregate assessments is not
ideal from a management viewpoint, it is better
than not providing any management advice at all.
Furthermore, simulation studies (Punt 1992) have
shown that management objectives can be achieved
if two stocks are assessed and managed as one,
provided that the inherent productivity of the two
stocks is similar and the catches by species reflect
the relative abundance of each stock. A similar
situation exists with the deepwater and Acadian
redfish (Sebastes mentella and S. fasciatus, Sebastidae)
from Atlantic waters of Canada. Although genetic
data confirm these two closely related species are
distinct (Sevigny et al. 2003), they are nearly
impossible to tell apart in the field. As a conse-
quence, although these redfish are managed sepa-
rately in nine different areas of the North Atlantic,
within each of the broad areas of sympatry (inclu-
ding the Gulf of St Lawrence, Laurentian Channel,
Grand Banks and southern Labrador Sea), the two
species are jointly managed as a single ‘stock’
(Morin et al. 2004b).
A different type of mismatch between biological
and management units can arise from managing
fisheries on a more regional basis. Interest in this
approach has been spurred recently by two factors:
(i) community-based efforts to collect more informa-
tion on local stocks and (ii) the perception that these
finer scale data will show that stock status in the local
area is better than is reflected in coast-wide assess-
ments. This approach can lead to more accurate
allocation of local resources, provided that the spatial
scales of interest for coastal communities match the
scales of population-level processes that are naturally
found within marine ecosystems (PMCC 2007).
However, there is no reason to expect that natural
population units will match the borders of local
communities. If local management is implemented on
too fine a scale, a single biological population could be
subjected to independent and perhaps conflicting
management regimes in different areas of its range.
Another factor that can limit use of genetic data
in stock assessments is the trade-off between accu-
racy and precision. A typical stock assessment used
for West Coast fish species has tens to hundreds of
parameters. Dividing an area into multiple popula-
tions should, all else being equal, reduce bias caused
by assessing several populations as one. However,
there will also be a cost in terms of reduced degrees
of freedom and hence possibly lower precision when
data from a single region are partitioned into several
assessment areas. The trade-off can be examined
using simulation (Punt 2003) or more generally
using management strategy evaluation (MSE) (see
below).
Finally, often it is not clear that modifying
management advice to match biology ‘matters’ in
the sense of affecting how fisheries management
decisions will be made and implemented. For
example, the recommendation to reduce fishing
mortality for an overfished stock is likely to be
robust to the choice of management units. A key
role for assessment biologists is therefore to high-
light the trade-offs and uncertainties (with respect
to effects on management decisions) associated with
different modelling and biological assumptions. In
many cases, for example, uncertainties about reli-
ability of abundance indices will dominate those
related to stock structure.
Allocation issues
Allocation of access rights is one of the most
important issues in fisheries management, and
effective management generally requires a well-
defined approach for allocation. Above we discussed
how new genetic information can, for historical
reasons, be difficult to accommodate into stock
assessments. The same scenarios can create enor-
mous challenges in deciding how management
controls should be implemented in systems in which
access rights have been allocated spatially. Individ-
ual transferable quotas (ITQs) have been used
extensively worldwide and have formed the basis
for fisheries management in Iceland and New
Zealand since the 1980s. It is now common for
total allowable catches (TACs) to be modified
annually based on information from stock assess-
ments. Consider a hypothetical species managed
over a single region based on a TAC that is allocated
in the form of ITQs. Suppose that new genetic
evidence suggests that the region contains two
demographically independent stocks. Ideally, this
would lead to separate assessments for each stock
and stock-specific TACs. However, this could raise a
thorny allocation issue if the allocation rules do not
explicitly account for this possibility. How should
ITQs for the original (single) management unit be
divided into ITQs for the newly defined units?
Genetic data and fisheries management R S Waples et al.
Journal compilation � 2008 Blackwell Publishing Ltd
No claim to original US government works, F I S H and F I S H E R I E S , 9, 423–449 433
MARAM/IWS/2019/Hake/BG4
11
Moreover, what should happen if one of the two
stocks is assessed to be overfished while the other is
not? Each ITQ holder currently has been allocated a
percentage of the TAC, and one solution might be to
give each ITQ holder that same percentage for each
of the new stocks. However, this might mean that
ITQ holders get new rights for areas they do not fish
at the cost of rights for areas they do fish.
Alternatively, if rights are allocated based on where
individuals have fished historically, only fishers who
harvest the overfished stock would have their rights
reduced. Unfortunately, when a rights-based system
is implemented, considerable attention is typically
given to how access rights (including shares of
TACs) are allocated, but potential consequences of
subsequent changes in the definitions of the mana-
gement units are almost never considered. This
problem has occurred for blue warehou (Seriolella
brama, Centrolophidae) off southern Australia.
Genetic and other analyses suggest that separate
stocks occur east and west of Bass Strait (Talman
et al. 2003), and stock assessments are conducted
by stock (Punt 2006a). However, TACs pertain to
both stocks combined, and there has been no
restriction on the fraction of the TAC taken from
each stock.
Organizational structure
A clear need exists for geneticists to be more aware
of standards applied by assessment scientists (and
vice versa) and for both groups to be aware of the
needs of managers. However, interchange of ideas
to achieve this is often hampered by the organiza-
tional structure of management agencies, which
frequently group scientists by discipline rather than
by species. For example, a typical agency might
have a genetics unit and a stock assessment unit,
with only episodic communication between them. It
is also uncommon for scientists other than those
who conduct stock assessments to attend assess-
ment and management meetings, and hence see
how information on population structure feeds into
the management process.
An example – genetic stock identification
of Chinook salmon
Chinook salmon (Oncorhynchus tshawytscha, Sal-
monidae) is the largest Pacific salmon and is prized
by sport, commercial and tribal fishers. Harvest
primarily occurs at sea or in major rivers, where
individuals from a few to over 100 populations can
comingle. A brief review of the history of mixed-
stock fishery management for this species illustrates
many of the complicating factors discussed above,
as well as some novel ones.
Background
In the 1960s, development of the coded-wire tag
(CWT: a small wire coded with alpha-numeric data
that is inserted into the snout of juvenile fish)
produced an effective means of tagging fish.
Because the tags provide direct evidence of origin
for individual fish, managers can use CWT data
from samples of a fishery to shape the harvests (in
space and time) to focus on abundant populations
while keeping incidental take of at-risk stocks below
acceptable levels. Valuable adaptive management
information can also be obtained by differentially
marking treatment groups within a hatchery. The
CWT programme has been the cornerstone of
salmon harvest management on the US West Coast
for several decades and has been an integral part of
international harvest management of Chinook
salmon under the Pacific Salmon Treaty since the
mid-1980s (Bernard and Clark 1996).
On the other hand, the CWT programme is
expensive and labour intensive, as massive mark-
ing and recovery efforts must be conducted every
year (Hammer and Blankenship 2001). Only a
small fraction of fish is marked, so field workers
have to either handle many fish to find the few
with CWTs, or invest in expensive electronic
wands to detect the tiny tags in the field. Because
marking wild populations is difficult, virtually all
available CWT information is for hatchery popu-
lations. Some tags are lost, and some errors occur
in reading codes. Finally, with widespread popu-
lation declines and associated harvest reductions,
samples of marked fish are often too small to yield
the desired precision.
Although the initial application of GSI was for
sockeye salmon (Oncorhynchus nerka, Salmonidae,
Grant et al. 1980), the first application on a coast-
wide scale occurred with Chinook salmon. A major
advantage of GSI over the CWT is that GSI depends
on naturally occurring genetic marks and thus can
provide valuable insights into contributions by wild
populations. Still, in spite of a number of demon-
strated successes with Pacific salmon and other
species, application of GSI to harvest management
of Chinook salmon has been limited. Here are some
of the reasons why this has occurred.
Genetic data and fisheries management R S Waples et al.
Journal compilation � 2008 Blackwell Publishing Ltd
434 No claim to original US government works, F I S H and F I S H E R I E S , 9, 423–449
MARAM/IWS/2019/Hake/BG4
12
Biological and technical challenges
Implementing GSI on a coast-wide (or Pacific Rim)
scale requires extensive efforts to collect baseline
data for populations from California to Alaska (or
Asia) and to standardize laboratory procedures so
that comparable data can be obtained by different
state, federal and university laboratories (Shaklee
et al. 1999; Seeb et al. 2007). This requires broad
collaboration among laboratories and a willingness
to share unpublished data for use in management –
provisions that are a stumbling block for some
potential participants. For the most part, no cen-
tralized funding is available for coast-wide GSI;
therefore, funds have to be pieced together from
diverse sources, typically on a year-to-year basis.
Chinook salmon GSI has experienced the ‘marker
wars’ described above (see also Appendix 1). The
transition from allozymes to microsatellites over the
past decade required major groundbreaking efforts
to standardize data collection (LaHood et al. 2002;
Moran et al. 2006). Now, some favour another
major shift to SNPs. While energetic discussions
among geneticists on the markers of the future take
place, managers are reluctant to commit major
funds lest they end up backing a soon-to-be obsolete
technology.
After decades of being accustomed to definitive
information about origins of individual fish provided
by CWTs, some managers find it difficult to accept
probabilistic assignments based on genetic markers,
even in cases where other aspects of experimental
design and analytical methodology lead to greater
accuracy and precision of overall stock composition
estimates. Moreover, GSI cannot generally distin-
guish separate treatments or release groups within a
population, as can be done with CWTs.
Institutional issues
The CWT programme for Chinook salmon has a
long history that spans the entire careers of many
scientists, and this promotes inertia and resistance
to change. Because management rules and treaties
(especially the Pacific Salmon Treaty) have been
developed based on models that rely on CWT data,
changes to the technology (GSI vs. CWT) would
require completely revamping some management
rules. However, major changes cannot be imple-
mented unilaterally; even demonstrably imperfect
methods can be perpetuated because they have
survived hard-fought efforts to reach agreement
among parties with disparate objectives and per-
spectives. In general, broad participation is essential
in the development of any new methodology.
Communication
Geneticists have not always taken the time to fully
understand the intricacies of the management
process so that genetic information can be packaged
in the most effective manner, and limitations of GSI
have not always been portrayed accurately. For
example, GSI proponents have sometimes failed to
realize that computer simulations can lead to overly
optimistic estimates of the power of GSI to resolve
mixtures of specific salmon populations (see
Anderson et al. 2008), which can erode credibility.
Conversely, scientists and managers involved in the
CWT programme have been slow to acknowledge
and integrate into their assessment paradigm the
many empirical demonstrations that GSI can pro-
vide valuable management information.
Solutions: some strategies for improving the
use of genetic data in fisheries management
As the problems identified above have many causes,
improvements must come from a variety of direc-
tions as well. Below we outline some measures that
should help to more fully integrate genetic consid-
erations into fishery management, beginning with
perhaps the single most important area where
progress can be made – communication.
Communication
Integration
Stock assessments, and hence the provision of
management advice, are usually conducted by
‘assessment teams’ and peer-reviewed prior to being
used for management (see boxes in Fig. 2 above the
‘Wall of Science’). Historically, assessment teams
have primarily included quantitative fishery biolo-
gists employed by fishery management agencies. In
appropriate situations, the teams should be
expanded to include geneticists as well as academ-
ics, statisticians and field biologists. This would
improve understanding of the needs of managers,
and it would also bring the latest technologies to the
attention of those tasked with providing manage-
ment advice. Adding geneticists to assessment
teams would also help alleviate the perception that
geneticists are ‘ivory tower scientists’ who seldom
Genetic data and fisheries management R S Waples et al.
Journal compilation � 2008 Blackwell Publishing Ltd
No claim to original US government works, F I S H and F I S H E R I E S , 9, 423–449 435
MARAM/IWS/2019/Hake/BG4
13
understand how their results can actually be used.
However, geneticists are not the only group cur-
rently under-represented on assessment teams. For
example, it is not uncommon for assessment teams
not to include the field biologists who are most
familiar with the bulk of the data sources used, and
for managers (and other stakeholders) not to
participate in meetings of assessment teams –
thereby potentially rendering the assessment pro-
cess uninformative for management purposes.
Unfortunately, most geneticists (and field biolo-
gists) are not exposed to the techniques of statistical
model fitting and decision analysis that form the
basis for modern stock assessment science. There-
fore, it might be necessary for management agencies
(perhaps in collaboration with academic institu-
tions) to develop courses to prepare geneticists (and
others) for work on assessment teams. Such courses
are now standard for decision makers in Australia
and the USA. Conversely, most managers and
assessment biologist alike would benefit from a
greater literacy regarding the evolutionary forces
(and associated methods) that can profoundly affect
the living resources for which they share steward-
ship responsibility. For the past several years, the US
Fish and Wildlife Service has offered a course in
Applied Conservation Genetics to managers and
biologists (information available at http://doilearn.
doi.gov/CourseCatalog/index.cfm; accessed August
2008). Consistent with the agency’s mission, this
course typically emphasizes terrestrial and freshwa-
ter species. A comparable course that focused on
issues of particular relevance to marine species
could help bridge the information gap between
geneticists, managers and stock assessment
biologists.
Improved dialogue
Scientists, managers and policymakers could work
together more effectively to foster productive dia-
logue about the relationship between statutory
definitions and management or conservation goals.
Just as terms like ‘population’ or ‘stock’ do not have
unique biological definitions, most management-
related problems do not have a single, generic
scientific solution. Therefore, it is important to
clearly articulate the goals one is trying to accom-
plish and how key terms are being used so that
scientific evaluations can be conducted and com-
municated in the most effective way. For example,
within the USA, the MSA states that ‘To the extent
practicable, an individual stock of fish shall be
managed as a unit throughout its range, and
interrelated stocks of fish shall be managed as a
unit or in close coordination’. However, the MSA
does not define what an ‘individual stock’ is, which
leaves the term open to a wide range of interpre-
tations. Similar issues apply to most other major
pieces of legislation, such as the ESA and MMPA –
management agencies are legally mandated to use
scientific methods to achieve societal goals, but
doing so requires dealing with poorly defined legal
terms that have no precise biological definitions. As
discussed above, the idea that stocks are demo-
graphically independent units lies at the core of
much of marine conservation and management. To
maximize the usefulness of genetic information for
fishery management, geneticists could do a better
job in focusing on questions related to demographic
independence rather than (or in addition to) more
traditional analyses that provide insights into levels
of gene flow. For reasons outlined above, this will be
challenging; so, it is reasonable to expect that
improvements will come only incrementally.
In general, units are demographically indepen-
dent if population dynamics is affected more by local
demographic processes (births and deaths) than by
immigration or emigration. However, the appropri-
ate threshold to use in determining demographic
independence can differ depending on which pro-
cesses one is primarily interested in. For example,
the concept of demographic independence is central
to three landmark US laws that guide management
of living marine resources, but each piece of
legislation implies a different flavour of demographic
independence (Eagle et al. 2008):
1. The ESA is primarily concerned with extinction
risk. It is difficult to conduct meaningful viability
analyses on units that are not demographically
independent; therefore, identifying such units
should be a key step in status assessments and
recovery planning. In one framework that has
been adopted to guide recovery planning for ESA-
listed Pacific salmon (McElhany et al. 2000),
populations are considered demographically
independent if the level of immigration from
other populations is low enough that it does not
appreciably affect extinction risk on a 100-year
time frame.
2. Goals of the MMPA include maintaining marine
mammal stocks as functioning elements of their
ecosystems. In defining stocks, therefore, it is
important to consider units that might suffer
Genetic data and fisheries management R S Waples et al.
Journal compilation � 2008 Blackwell Publishing Ltd
436 No claim to original US government works, F I S H and F I S H E R I E S , 9, 423–449
MARAM/IWS/2019/Hake/BG4
14
local depletion. It is easy to imagine that migra-
tion levels that can affect extinction probabilities
over 100 years might be too small to have an
appreciable effect in avoiding local depletions on
ecological time frames.
3. Under the MSA, when a stock is considered
overfished it triggers management actions that
are projected to rebuild the stock within 10 years
(with an adjustment to the recovery time if the
stock cannot be rebuilt in 10 years). This implies
a short time horizon; demographic linkages must
be very strong for nearby populations to have an
appreciable rescue effect within an MSA rebuild
period.
These different flavours of demographic indepen-
dence, each valid in its own context, mean that
managers need to define in operational terms what
they mean by ‘demographic independence’ or ‘indi-
vidual stock’. After management goals and opera-
tional concepts are clarified, it is the responsibility of
scientists (including, but not limited to, geneticists)
to develop analyses that will deliver information in
the necessary format and currency. Although some
common themes will emerge, these processes – both
reviewing and articulating management goals and
developing operational definitions for key terms –
will be unique for each specific application.
An innovative programme in coastal Oregon and
California employs out-of-work fishers to conduct
widespread sampling of the marine distribution of
salmon (Bellinger et al. 2007). Under this pro-
gramme, samples collected are genetically analysed
by using GSI methods to provide a more complete
picture of stock composition in space and time than
is possible with current sampling regimes. This
collaborative, multi-stakeholder project could help
bridge long-standing gaps between geneticists,
fishery biologists, managers and fishers and could
serve as a model for how to facilitate understanding
of genetic data and its integration into fishery
management.
Getting real
Over the last 25 years, geneticists have sometimes
oversold the products they can deliver. These
examples of ‘crying wolf’ are remembered by
decision makers and assessment scientists, and this
has helped to erode confidence in advice provided by
geneticists. Scientists, managers and living marine
resources alike will be better served in the future if
geneticists (and other scientists as well) make a
concerted effort to understand the limitations as
well as the power of the methods they use, and to
understand appropriate (and inappropriate) appli-
cations in the management realm. Conversely,
managers and fishery assessment biologists can
‘get real’ by showing more genuine interest in
genetic and evolutionary processes and being
receptive to the many geneticists who are capable
of communicating complex topics to non-geneti-
cists.
Analytical methods
Over the past decade, three factors have conspired
to produce a veritable information explosion of
genetic data: development of DNA technology that
can identify large numbers of highly variable
markers; development of sophisticated new statisti-
cal methods for analysing population genetic data;
and continuing rapid increases in computational
power (see Hauser and Seeb 2008). Some of the new
analytical techniques, broadly known as assign-
ment methods (Pearse and Crandall 2004; Manel
et al. 2005), have the potential to study contempo-
rary dispersal over ecological time frames, rather
than relying on assumptions about long-term
migration–drift equilibrium, as do most standard
population genetic models. With careful application,
these new methods should be able to provide
information of management relevance. However,
like the traditional methods, they are also con-
strained by biological and statistical realities. Power
to detect migrants depends on genetic differences
among populations, which are inversely related to
levels of gene flow. Migrants can be most reliably
detected in strongly diverged populations, but it is
generally easy to show with traditional genetic
methods that strongly diverged populations cannot
be exchanging enough migrants to be demographi-
cally coupled. Conversely, when migrants are
numerous, perhaps near the proportion required
to produce demographic coupling, they will be
genetically similar to resident individuals and thus
difficult to detect using genetic markers (Paetkau
et al. 2004; Manel et al. 2005). This limitation can
be gradually eased with the use of more and more
genetic markers, but the problem is likely to remain
challenging for the foreseeable future.
Although the dominant paradigm in population
genetic studies of natural populations still involves
collecting individuals from two or more geographic
locations and considering them putative populations,
Genetic data and fisheries management R S Waples et al.
Journal compilation � 2008 Blackwell Publishing Ltd
No claim to original US government works, F I S H and F I S H E R I E S , 9, 423–449 437
MARAM/IWS/2019/Hake/BG4
15

landscape genetics – the study of spatial genetic
patterns in continuously distributed species – is
rapidly evolving (Manel et al. 2003; Guillot et al.
2005). Most landscape genetic methods have been
developed with terrestrial species in mind, but they
are beginning to be applied to marine species as well
(Palumbi 2003; Galindo et al. 2006; Selkoe et al.
2008). These studies provide important insights into
biological processes and, for example, can help
guide decisions about optimal design and efficacy of
marine reserves. However, the population struc-
tures these models describe cannot be easily accom-
modated by conventional population assessments.
Taking advantage of new insights that are possible
from the field of landscape genetics will require
considerable dialogue between geneticists, stock
assessment scientists and managers, as well as
creative thinking on both sides to develop effective
ways to integrate these insights into stock assess-
ment and management.
Finally, because the signal of population differen-
tiation is often weak in marine species, it is
important to take advantages of all types of infor-
mation that shed light on population structure.
Geneticists could do a better job of integrating their
data with other types of biological and oceano-
graphic information; see Selkoe et al. (2008) for a
number of recent, encouraging examples showing
how this can be performed. Ideally, this would
involve collaborations at the experimental design
stage so that joint sampling and analytical efforts
can be planned more effectively. In particular, it is
difficult to develop an ideal sampling design for a
genetic study without understanding the details of
the life history of the target species and physical
processes in the marine realm.
Institutional changes
Institutional changes typically occur very slowly
because considerable inertia must be overcome. For
example, the problem of how to reallocate rights if
our understanding of stock structure changes will
probably require resolution in the courts for those
species whose rights have already been allocated.
However, the possibility that such changes will
occur in the future should be recognized and the
processes for reallocating rights should be included
in any future management plans that include
individual rights (such as systems based on ITQs or
territorial rights). Similarly, although lack of appro-
priate historical information might currently limit
the ability to separately manage some stocks (or
even species) that are biologically distinct (see
examples of black rockfish, blue rockfish and Aca-
dian redfish cited above), we can begin now to collect
the necessary information that in the future should
reduce the discrepancy between biological units and
management units. More generally, if serious efforts
are made as outlined above to improve integration
and dialogue, the institutional barriers to fuller use
of genetic information in fishery management
should be significantly weakened.
Being opportunistic
Historical factors have contributed to the lack of full
integration of genetics into fishery management and
still represent inertia that must be overcome.
However, changes are possible under some circum-
stances, and geneticists and managers alike have to
be ready to take advantages of opportunities as they
arise. For example, in response to increasing logis-
tical challenges to the coast-wide CWT programme
(detailed above in the Example) and increasing
awareness of the potential of GSI, the Pacific Salmon
Commission sponsored two workshops in 2007
having the following objectives:
‘‘To develop recommendations for integration of
GSI information into a coordinated coast-wide
management system to improve the ability of ocean
fisheries to access abundant stocks within impact
constraints established for other specific stocks and,
to the extent possible, to identify and quantify the
costs, implementation steps and timeframes to
implement these recommendations’’.
Following these workshops, a set of recommen-
dations was developed (Pacific Salmon Commission
2008) that provides at least a partial roadmap for
better integration of genetics into West Coast
salmon management.
Emerging areas where genetic information
can improve fisheries management
Management strategy evaluation
The bulk of management actions designed to
achieve the objectives of national legislation (e.g.
ESA, MSA and MMPA in the USA) and multi-
national fisheries management agreements (e.g.
IWC and ICES) affect fisheries either directly or
indirectly. These actions include restrictions on
inputs through closed areas and limitations on
Genetic data and fisheries management R S Waples et al.
Journal compilation � 2008 Blackwell Publishing Ltd
438 No claim to original US government works, F I S H and F I S H E R I E S , 9, 423–449
MARAM/IWS/2019/Hake/BG4
16
fishing effort, and on outputs through catch limits.
For most resource management problems, the key
uncertainties relate to how many populations exist
and what their statuses are. Genetics has a role to
play in informing both of these issues. Management
strategies (sets of rules which specify the data on
which management decisions are based and stipu-
late what management actions will be taken given
what the data say about the status of the manage-
ment system) have been developed in many juris-
dictions. For example, management (or harvest)
strategies have been adopted formally in South
Africa for management of several of its most
economically valuable fishery resources (Plaganyi
et al. 2007) and by the IWC for management of
commercial and aboriginal whaling (Punt and
Donovan 2007). In most jurisdictions that have
not formally adopted management strategies, man-
agement decisions are nevertheless based in some
way on decision rules which approximate fully
specified management strategies (Smith et al.
in press).
Management decision making, whether based on
formal management strategies or not, depend on a
variety of assumptions, some related to population
dynamics and others to stock structure. It is
important to determine which assumptions, if vio-
lated, will most seriously compromise the ability to
achieve management objectives. This process, often
referred to as Management Strategy Evaluation
(MSE; Smith 1994), involves developing a number
of alternative models (operating models) to capture
plausible alternative hypotheses regarding the
dynamics of the system to be managed, and then
evaluating the management consequences or out-
comes (summarized by the resulting status of
managed stocks and of catches and other measures
of management success) for each alternative
hypothesis.
Management strategy evaluation has been desc-
ribed extensively elsewhere (Smith 1994; Butter-
worth et al. 1997; Punt 2006b). A key aspect of
MSE for our purposes is to select an appropriate
range of plausible stock structure hypotheses,
because it is well known that performance of a
management strategy can be poor in the face of this
source of uncertainty (IWC 1992, 1993). Genetics
(and other approaches to identifying stock struc-
ture) can be important in selecting and refining
such hypotheses. For example, the IWC SC recently
evaluated management strategies for Western
North Pacific minke whales (Balaenoptera acutoro-
strata, Balaenopteridae) (IWC, 2004), motivated in
part by the need to consider the implications of
harvest during migration. Three major stock-struc-
ture hypotheses were considered: (i) two stocks
(west and east of Japan); (ii) three stocks (one west
and two east of Japan) and (iii) four stocks (one west
and three east of Japan) (Fig. 3). The least compli-
cated stock-structure hypotheses (two and three
stocks; Fig. 3 upper two panels) were justified
primarily by the lack of evidence for multiple
populations from statistical hypothesis tests applied
to a range of genetic and non-genetic data. The
most complicated hypothesis (four stocks; Fig. 3
bottom panel) arose from the application of a
clustering algorithm (Martien and Taylor 2001) to
mtDNA data. Perhaps not unexpectedly, the oper-
ating models based on four stocks posed more of a
challenge to the candidate management strategies,
and uncertainty about stock structure led, in part,
to the IWC SC being unable to reach agreement
on relative weights for different stock structure
hypotheses.
Thus, even when it is not possible to fully
integrate genetic data into fishery management
models, genetic information can be used through
the MSE process to help assess the consequences of
ignoring population structure. Only a limited exam-
ination of the implications of failure to correctly
identify stock structure has been conducted to date
(Punt 2006b, 2008), but this could be expanded
considerably. This would help managers assess the
consequences of incomplete information or situa-
tions where it proves impossible to formally inte-
grate genetic information into management advice.
Novel applications
This paper has focused on two major themes (stock
identification and mixed-stock fishery analysis), as
these are among the most pressing management
problems and the ones for which use of genetic
information is most common. However, genetic data
can potentially provide valuable insights into a
number of other questions of direct management
relevance. These include the following.
Population abundance
The two most important outcomes from any
stock assessment are current status (the current
population size (N) and the population size relative
to management reference points) and productivity.
Several genetic approaches can provide information
Genetic data and fisheries management R S Waples et al.
Journal compilation � 2008 Blackwell Publishing Ltd
No claim to original US government works, F I S H and F I S H E R I E S , 9, 423–449 439
MARAM/IWS/2019/Hake/BG4
17
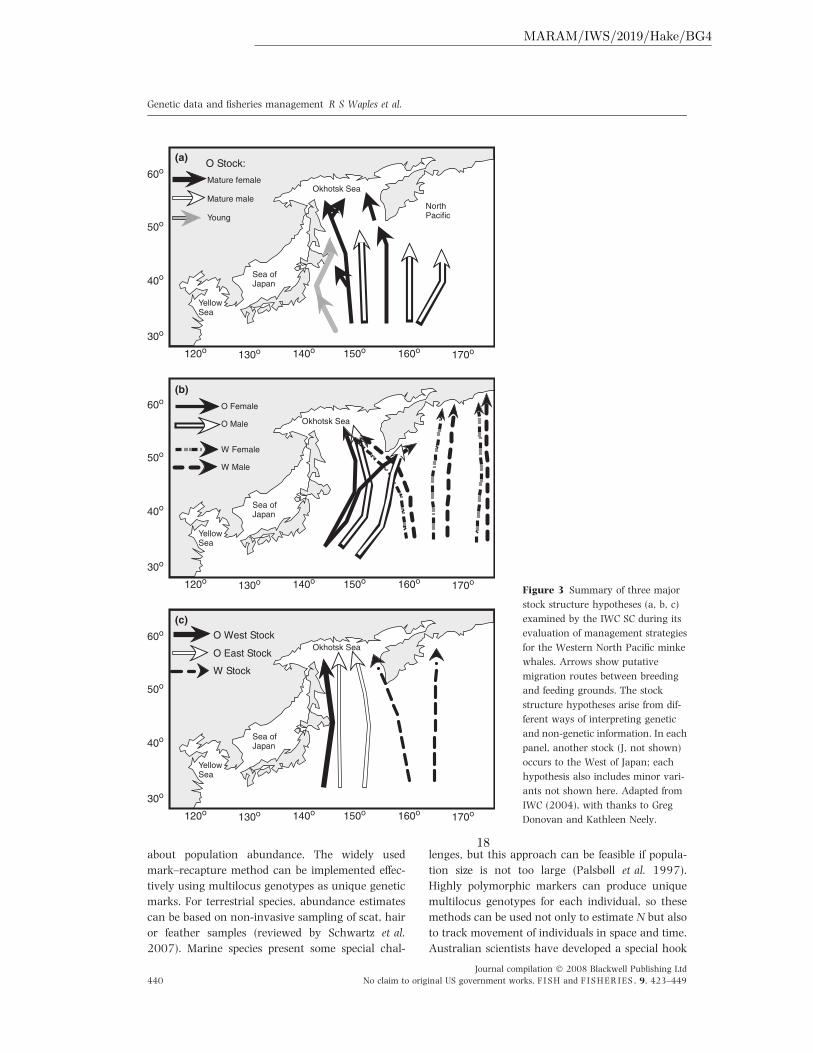
about population abundance. The widely used
mark–recapture method can be implemented effec-
tively using multilocus genotypes as unique genetic
marks. For terrestrial species, abundance estimates
can be based on non-invasive sampling of scat, hair
or feather samples (reviewed by Schwartz et al.
2007). Marine species present some special chal-
lenges, but this approach can be feasible if popula-
tion size is not too large (Palsbøll et al. 1997).
Highly polymorphic markers can produce unique
multilocus genotypes for each individual, so these
methods can be used not only to estimate N but also
to track movement of individuals in space and time.
Australian scientists have developed a special hook
60o
50o
40o
30o
120o 130o 140o 150o 160o 170o
Sea ofJapan
Okhotsk Sea
NorthPacific
YellowSea
Mature female
Mature male
Young
(a)
60o
50o
40o
30o
120o 130o 140o 150o 160o 170o
Sea ofJapan
Okhotsk Sea
YellowSea
O West Stock
W Stock
O East Stock
(c)
60o
50o
40o
30o
120o 130o 140o 150o 160o 170o
Sea ofJapan
Okhotsk Sea
YellowSea
O Male
O Female
W Male
W Female
(b)
O Stock:
Figure 3 Summary of three major
stock structure hypotheses (a, b, c)
examined by the IWC SC during its
evaluation of management strategies
for the Western North Pacific minke
whales. Arrows show putative
migration routes between breeding
and feeding grounds. The stock
structure hypotheses arise from dif-
ferent ways of interpreting genetic
and non-genetic information. In each
panel, another stock (J, not shown)
occurs to the West of Japan; each
hypothesis also includes minor vari-
ants not shown here. Adapted from
IWC (2004), with thanks to Greg
Donovan and Kathleen Neely.
Genetic data and fisheries management R S Waples et al.
Journal compilation � 2008 Blackwell Publishing Ltd
440 No claim to original US government works, F I S H and F I S H E R I E S , 9, 423–449
MARAM/IWS/2019/Hake/BG4
18
that can take small biopsies for DNA marking
(Buckworth et al. 2008), and a variant of this
approach has been used to study abundance and
distribution of rockfish (Sebastes spp.) within a
conservation area in the Pacific Northwest (Hague
2006).
Although census size is generally of primary
interest to managers, effective population size is of
considerable evolutionary and conservation rele-
vance and can be estimated using genetic markers
(Schwartz et al. 1998; Leberg 2005). Furthermore,
if the ratio Ne/N is known or can be estimated (see
Hauser and Carvalho 2008), a genetically based
estimate of Ne can provide a rough indication of N
(Laurent and Planes 2007). A single-sample esti-
mator of Ne based on linkage disequilibrium (Hill
1981) has seen relatively few practical applications,
but has considerable potential to provide useful
information about contemporary Ne (Waples and
Do 2008). A novel application of a related method
used current diversity of mtDNA to estimate the
minimum (bottleneck) population size of cetaceans
at the time commercial whaling was suspended
(Jackson et al. 2008). Minimum bounds on popula-
tion size obtained in this way have been included in
recent cetacean stock assessments in the southern
hemisphere. Assessments without the bound tend to
indicate that humpback whale stocks were reduced
to very low levels (below the minima implied by the
genetic bounds) and have faster recovery rates
(Johnson et al. in press). Other genetically based
methods for estimating N in marine species include
kinship analysis (Skaug 2001) and paternity anal-
ysis (Nielsen et al. 2001). Parentage analysis can
also be used to study mating systems and patterns of
realized reproductive success (Bekkevold et al.
2002) in marine species.
A global testing of genetic techniques for
management purposes
Difficulties in using genetic data in stock assess-
ments are compounded by the plethora of genetic
methods, most of which have not been tested within
a management context. To address this problem, the
IWC SC has sponsored a global effort (testing of
spatial structure models; IWC 2007b) to compare
the performance of different genetic methods on
common data sets. Importantly, performance is
evaluated not only in terms of correctly identifying
the ‘true’ number of populations, but also with
respect to achieving management goals of sustain-
able utilization.
Miscellaneous
Other potential genetically based methods, all with
empirical demonstrations of applicability to aquatic
species, are too numerous to treat in detail here.
These include analysis of fishery bycatch (Baker
et al. 2006), identification of early life stages (Graves
et al. 1990), forensic analysis of species at risk and
product labelling (Schwenke et al. 2006, Ogden
2008), identifying origins of invasive species
(Audzijonyte et al. 2008; Hess et al. in press), study-
ing maturation and reproductive potential (Swanson
et al. 2008), population genomics (Goetz and
MacKenzie 2008), the link between the genotype
and the phenotype (Naish and Hard 2008) and
analysis of historical DNA samples to provide a
temporal perspective on population genetic struc-
ture (Nielsen and Hansen 2008).
Conclusions
Numerous factors have contributed to the imperfect
integration of genetic data into management of
marine species. Some factors are inherently biolog-
ical and relate to the relatively low signal-to-noise
ratio for population structure in many marine
species. Increasingly powerful laboratory and ana-
lytical techniques will make incremental progress in
reducing these limitations. Considerable room for
improvement exists on many communication issues
involving geneticists, fishery biologists and manag-
ers. Historical factors that are largely out of the
control of geneticists also impede integration of
genetic information, and progress in these areas is
likely to be episodic and opportunistic. However,
even when historical factors impede full integration,
genetic data can still be used to help assess the likely
consequences of ignoring particular types of popu-
lation structure, and this information can be valu-
able in the interim and, potentially, help
the transition to a more effective management
framework.
Consistent with the theme of this special issue,
our paper has focused on the use of genetic
information in fishery management. Some of the
issues discussed above (especially those dealing with
communication) are particularly challenging for
geneticists because fishery stock assessments and
fishery management are based primarily on
ecological rather than evolutionary principles.
These two fields of study are still imperfectly
integrated, even in academic institutions where
they are housed in the same department. Other
Genetic data and fisheries management R S Waples et al.
Journal compilation � 2008 Blackwell Publishing Ltd
No claim to original US government works, F I S H and F I S H E R I E S , 9, 423–449 441
MARAM/IWS/2019/Hake/BG4
19
challenges to better integration of genetic data (e.g.
the need to produce timely information of manage-
ment relevance in a currency that is useful to
decision makers; difficulties associated with replac-
ing outdated but accepted methods with promising
new technologies; the importance of providing
realistic assessments of both the power and limita-
tions of each method, as well as associated uncer-
tainties and the consequences of making different
types of errors) are simply new twists on themes
that have long affected the use of science in fishery
management (Francis and Shotton 1997; Dayton
1998). In a broader sense, the topics discussed here
reflect parallel issues about the appropriate rela-
tionship between science, management and envi-
ronmental policy (Meffe et al. 1998). Although this
relationship has a troubled history (Houck 2003),
clear opportunities exist for science to better inform
fishery management, and better integration of
genetic data can help advance that enterprise.
Acknowledgments
We thank Terry Beacham, Michael Hansen, Robert
Kope and Paul Moran for valuable discussions and
information. Elizabeth Clarke, Bob Francis, Jann
Martinsohn, Kevin Stokes, the associate editor
(Lorenz Hauser) and an anonymous reviewer pro-
vided useful comments on an earlier version of this
paper. We are indebted to Fred Utter for the
Appendix.
References
Anderson, E.C., Waples, R.S. and Kalinowski, S.T. (2008)
An improved method for predicting the accuracy of
genetic stock identification. Canadian Journal of Fisheries
and Aquatic Sciences, 65, 1475–1486.
Andrewartha, H.G. and Birch, L.C. (1984) The Ecological
Web. University of Chicago Press, Chicago, IL.
Audzijonyte, A., Wittmann, K.J. and Vainola, R. (2008)
Tracing recent invasions of the Ponto-Caspian mysid
shrimp Hemimysis anomala across Europe and to North
America with mitochondrial DNA. Diversity and Distri-
butions 14, 179–186.
Backman, T.W.H. and Berg, L. (1992) Managing mole-
cules or saving salmon? The evolutionary significant
unit. Wana Chinook Tymoo (Columbia River Inter-Tribal
Fish Commission) 2, 8–14.
Baker, B.M. (1999) Genetic analysis of eight black rockfish
collections from northern Oregon. Unpublished report,
Washington Department of Fish and Wildlife, Olympia,
WA, 27 pp.
Baker, C.S., Lukoschek, V., Lavery, S., Dalebout, M.L.,
Yong-Un, M., Endo, T. and Funahashi, N. (2006)
Incomplete reporting of whale, dolphin and porpoise
‘bycatch’ revealed by molecular monitoring of Korean
markets. Animal Conservation 9, 474–482.
Beacham, T.D., Pollard, S. and Le, K.D. (1999) Population
structure and stock identification of steelhead in south-
ern British Columbia, Washington, and the Columbia
River based on microsatellite DNA variation. Transac-
tions of the American Fisheries Society 128, 1068–1084.
Beacham, T.D., Lapointe, M., Candy, J.R., Miller, K.M. and
Withler, R.E. (2004) DNA in action: rapid application of
DNA variation to sockeye salmon fisheries management.
Conservation Genetics 5, 411–416.
Bekkevold, D., Hansen, M.M. and Loeschcke, V. (2002)
Male reproductive competition in spawning aggrega-
tions of cod (Gadus morhua, L.). Molecular Ecology 11,
91–102.
Bellinger, R., Lawson, P., Sylvia, G. et al. (2007) Project
CROOS: collaborative research on Oregon ocean salmon.
Final Report to the Oregon Salmon Commission. Oregon
State University, Corvallis, OR.
Bernard, D.R. and Clark, J.E. (1996) Estimating salmon
harvest with coded-wire tags. Canadian Journal of Fishe-
ries and Aquatic Sciences 53, 2323–2332.
Brown, B.L., Epifanio, J.M., Smouse, P.E. and Kobak, C.J.
(1996) Temporal stability of mtDNA haplotype frequen-
cies in American shad stocks: to pool or not to pool
across years? Canadian Journal of Fisheries and Aquatic
Sciences 53, 2274–2283.
Buckworth, R.C., Ovenden, J.R., Broderick, D. and Mac-
beth, M. (2008) Proof of concept for ‘Genetag’: genetic
tagging for monitoring mortality rates and catchability
(Advances in Fish Tagging and Marking Technology: An
International Symposium. Auckland, NZ, February
2008), Abstract available at: http://www.fisheries.org/
units/tag2008/FishTagging_abstracts.pdf.
Burford, M.O. and Bernardi, G. (2008) Incipient speciation
within a subgenus of rockfish (Sebastomus) provides
evidence of recent radiations within an ancient species
flock. Marine Biology 154, 701–717.
Burford, M.O. and Larson, R.J. (2007) Genetic heteroge-
neity in a single year-class from a panmictic population
of adult blue rockfish (Sebastes mystinus). Marine Biology
151, 451–465.
Butterworth, D.S., Cochrane, K.L. and De Oliveira, J.A.A.
(1997) Management procedures: a better way to man-
age fisheries? The South African experience. American
Fisheries Society Symposium 20, 83–90.
Cadrin, S.X., Friedland, K.D. and Waldman, J.R. (eds)
(2005) Stock Identification Methods: Applications to Fish-
ery Science. Elsevier Academic Press, Amsterdam.
Clark, A.G., Hubisz, M.J., Bustamonte, C.D., Williamson,
S.H. and Nielsen, R. (2005) Ascertainment bias in
studies of genome-wide polymorphism. Genome Research
15, 1496–1502.
Genetic data and fisheries management R S Waples et al.
Journal compilation � 2008 Blackwell Publishing Ltd
442 No claim to original US government works, F I S H and F I S H E R I E S , 9, 423–449
MARAM/IWS/2019/Hake/BG4
20
Constable, H. (2006) Population Genetics of Juvenile Sebastes
jordani, Shortbelly Rockfish, along the California Coast.
Masters Thesis, Department of Biology, San Francisco
State University, San Francisco, CA.
Cope, J.M. (2004) Population genetics and phylogeogra-
phy of the blue rockfish (Sebastes mystinus) from
Washington to California. Canadian Journal of Fisheries
and Aquatic Sciences 61, 332–342.
Cope, J.M. and MacCall, A.D. (2005) Status of Kelp
Greenling (Hexagrammos decagrammus) in Oregon and
California Waters as Assessed in 2005. Pacific Fishery
Management Council, Portland, OR, 158 pp.
Cope, J.M. and Punt, A.E. (2005) Status of Cabezon
(Scorpaenichthys marmoratus) in California Waters as
Assessed in 2005. Pacific Fishery Management Council,
Portland, OR, 190 pp.
Cope, J.M., Piner, K.R., Minte-Vera, C.V. and Punt, A.E.
(2004) Status and Future Prospects for the Cabezon (Scor-
paneichthys marmoratus) as Assessed in 2003. Pacific
Fishery Management Council, Portland, OR, 147 pp.
Corander, J., Waldmann, P., Marttinen, P. and Sillanpaa,
M.J. (2004) BAPS2: enhanced possibilities for the
analysis of genetic population structure. Bioinformatics
20, 2363–2369.
Crandall, K.A., Bininda-Emonds, O.R.P., Mace, G.M. and
Wayne, R.K. (2000) Considering evolutionary processes
in conservation biology. Trends in Ecology and Evolution
15, 290–295.
Cronin, M.A. (2007) EIEIO: old MacDonald would have
known how to fix the Endangered Species Act. Range
Magazine, Spring 2007, 24–25.
Dayton, P. (1998) Reversal of the burden of proof in
fishery management. Science 279, 821–822.
Dick, E.J., Ralston, S. and Pearson, D. (2007) Status of
Cowcod, Sebastes levis, in the Southern California Bight.
Pacific Fishery Management Council, Portland, OR, 90
pp.
Eagle, T.C., Cadrin, S.X., Caldwell, M.E., Methot, R.D. and
Nammack, M.F. (eds) (2008) Conservation Units of
Managed Fish, Threatened or Endangered Species, and
Marine Mammals: Report of a Workshop: 14–16 February
2006, Silver Spring, MD. NOAA Technical Memorandum
NMFS-OPR-37.
Fay, G. (2005) Stock Assessment and Status of Longspine
Thornyhead (Sebatolobus altivelis) off California, Oregon and
Washington in 2005. Pacific Fishery Management Coun-
cil, Portland, OR, 98 pp.
Field, J.C. (2007) Status of the Chilipepper Rockfish, Sebastes
goodei, in 2007. Pacific Fishery Management Council,
Portland, OR, 227 pp.
Field, J.C., Punt, A.E., Methot, R.D. and Thomson, C.J.
(2006) Does MPA mean ‘‘Major Problem for
Assessments?’’ Considering the consequences of place-
based management systems. Fish and Fisheries 7, 284–
302.
Field, J.C., Dick, E.J. and MacCall, A.D. (2007) Stock
Assessment Model for the Shortbelly Rockfish, Sebastes
jordani, in the California Current. Pacific Fishery Manage-
ment Council, Portland, OR, 108 pp.
Francis, R.I.C.C. (2006). Assessment of Hoki (Macruronus
novaezelandiae) in 2005. New Zealand Fisheries Assess-
ment Report 2006/3. Available from the NIWA library,
Wellington.
Francis, R.I.C.C. and Shotton, R. (1997) ‘Risk’ in fisheries
management: a review. Canadian Journal of Fisheries and
Aquatic Sciences 54, 1699–1715.
Frankham, R., Ballou, J.D. and Bricoe, D.A. (2002)
Introduction to Conservation Genetics. Cambridge Univer-
sity Press, Cambridge, UK.
Galindo, H.M., Olson, D.B. and Palumbi, S.R. (2006)
Seascape genetics: a coupled oceanographic-genetic
model predicts population structure of Caribbean corals.
Current Biology 16, 1622–1626.
Gauldie, R.W. (1991) Taking stock of genetic concepts in
fisheries management. Canadian Journal of Fisheries and
Aquatic Sciences 48, 722–731.
Gertseva, V.V. and Schirripa, M.J. (2007) Status of the
Longnose Skate (Raja rhina) off the Continental US Pacific
Coast in 2007. Pacific Fishery Management Council,
Portland, OR, 132 pp.
Goetz, F. and MacKenzie, S. (2008) Functional genomics in
fish biology and fisheries. Fish and Fisheries 9, 378–395.
Gomez-Uchida, D. and Banks, M.A. (2005) Microsatellite
analyses of spatial genetic structure in darkblotched
rockfish (Sebastes crameri): Is pooling samples safe?
Canadian Journal of Fisheries and Aquatic Sciences 62,
1874–1886.
Grant, W.S., Milner, G.B., Krasnowski, P. et al. (1980) Use
of biochemical genetic variants for identification of
sockeye salmon (Oncorhynchus nerka) stocks in Cook
Inlet, Alaska. Canadian Journal of Fisheries and Aquatic
Sciences 37, 1236–1247.
Graves, J.E., Curtis, M.J., Oeth, P.A. and Waples, R.S. (1990)
Biochemical genetics of southern California basses of the
genus Paralabrax and a method for the specific identifica-
tion of fresh and ethanol-preserved individual eggs and
early larvae. Fishery Bulletin (U.S.) 88, 59–66.
Guillot, G., Estoup, A., Mortier, F. and Cosson, J.F. (2005)
A spatial statistical model for landscape genetics. Genet-
ics 170, 1261–1280.
Haddon, M. (2001) Modelling and Quantitative Methods in
Fisheries. Chapman & Hall/CRC, New York.
Hague, M.J. (2006) The Use of Genetic Tagging to Assess
Inshore Rockfish Populations within a Marine Conservation
Area in the Strait of Georgia. MS Thesis, Simon Fraser
University, Vancouver, BC.
Hamel, O.S. (2005a) Status and Future Prospects for the
Pacific Ocean Perch Resource in Waters off Washington and
Oregon as Assessed in 2005. Pacific Fishery Management
Council, Portland, OR, 76 pp.
Genetic data and fisheries management R S Waples et al.
Journal compilation � 2008 Blackwell Publishing Ltd
No claim to original US government works, F I S H and F I S H E R I E S , 9, 423–449 443
MARAM/IWS/2019/Hake/BG4
21
Hamel, O.S. (2005b) Status and Future Prospects for the
Shortspine Thornyhead Resource in Waters off Washington,
Oregon, and California as Assessed in 2005. Pacific Fishery
Management Council, Portland, OR, 74 pp.
Hamel, O.S. (2007) Status and Future Prospects for the
Darkblotched Rockfish Resources in Waters off
Washington, Oregon, and California as assessed in
2007. Pacific Fishery Management Council, Portland,
OR, 179 pp.
Hammer, S.A. and Blankenship, H.L. (2001) Technical
notes: cost comparison of marks, tags, and mark-with-
tag combinations used in salmonid research. North
American Journal of Aquaculture 63, 171–178.
Hastings, A. (1993) Complex interactions between dis-
persal and dynamics: lessons from coupled logistic
equations. Ecology 74, 1362–1372.
Hauser, L. and Carvalho, G.R. (2008) Paradigm shifts in
fisheries genetics: ugly hypotheses slain by beautiful
facts. Fish and Fisheries 9, 333–362.
Hauser, L. and Seeb, J.E. (2008) Advances in molecular
technology and their impact on fisheries genetics. Fish
and Fisheries 9, 473–486.
Hauser, L., Seamons, T.R., Dauer, M., Naish, K.A. and
Quinn, T.P. (2006) An empirical verification of popula-
tion assignment methods by marking and parentage
data: hatchery and wild steelhead (Oncorhynchus mykiss)
in Forks Creek, Washington, USA. Molecular Ecology 15,
3157–3173.
He, X., Pearson, D.E., Dick, E.J., Field, J.F., Ralston, S. and
MacCall, A.D. (2005) Status of the Widow Rockfish
Resource in 2005. Pacific Fishery Management Council,
Portland, OR, 119 pp.
Hebert, P.D.N., Stoeckle, M.Y., Zemlak, T.S. and Francis,
C.M. (2004) Identification of birds through DNA bar-
codes. PLoS Biology 2, 1657–1663.
Hedgecock, D., Barber, P.H. and Edmands, S. (2007)
Genetic approaches to measuring connectivity. Oceanog-
raphy 20, 70–79.
Helser, T.E. (2005) Stock Assessment of the Blackgill Rockfish
(Sebastes melanostomus) Population off the West Coast of
the United States in 2005. Pacific Fishery Management
Council, Portland, OR, 117 pp.
Helser, T.E. and Martell, S.J. (2007) Stock Assessment of
Pacific Hake (whiting) in U.S. and Canadian Waters in
2007. Pacific Fishery Management Council, Portland,
OR, 225 pp.
Hess, J.E., Swalla, B.J. and Moran, P. (in press) New
molecular markers to genetically differentiate popula-
tions of Didemnum vexillum (Kott, 2002) – an invasive
ascidian species. Aquatic Invasions.
Hilborn, R. and Walters, C.J. (1992) Quantitative Fisheries
Stock Assessment: Choice, Dynamics and Uncertainty.
Chapman & Hall, New York.
Hill, W.G. (1981) Estimation of effective population size
from data on linkage disequilibrium. Genetical Research
(Cambridge) 38, 209–216.
Horn, P.L. and Sullivan, K.J. (1996) Validated aging
methodology using otoliths, and growth parameters for
hoki (Macruronus novaezelandiae) in New Zealand waters.
New Zealand Journal of Marine and Freshwater Research
30, 161–174.
Houck, O. (2003) Tales from a troubled marriage: science
and law in environmental policy. Science 302, 1926–
1929.
Hurst, R.J., Bagley, N.W., McGregor, G.A. and Francis, P.
(1999) Movement of the New Zealand school shark,
Galeorhinus galeus, from tag returns. New Zealand Journal
of Marine and Freshwater Research 33, 29–48.
Hyde, J.R., Kimbrell, C.A., Budrick, J.E., Lynn, E.A. and
Vetter, R.D. (2008) Cryptic speciation in the vermilion
rockfish (Sebastes miniatus) and the role of bathymetry in
the speciation process. Molecular Ecology 17, 1122–1136.
Iwamoto, E., Ford, M.J. and Gustafson, R.G. (2004) Genetic
population structure of Pacific hake, Merluccius produc-
tus, in the Pacific Northwest. Environmental Biology of
Fishes 69, 187–199.
IWC. (1992) Report of the Scientific Committee, Annex D.
Report of the Sub-Committee on Management Proce-
dures. Reports of the International Whaling Commission
42, 87–136.
IWC. (1993) Report of the Scientific Committee, Annex I.
Report of the Working Group on Implementation Trials.
Reports of the International Whaling Commission 43, 153–
196.
IWC. (2004) Report of the Scientific Committee, Annex D.
Report of the Sub-Committee on Management Proce-
dures. Journal of Cetacean Research and Management
6(Suppl.), 75–184.
IWC. (2007a) Report of the Scientific Committee, Annex F.
Report of the Sub-Committee on Bowhead, Right, and
Gray Whales. Journal of Cetacean Research and Manage-
ment 9(Suppl.), 142–155.
IWC. (2007b) Report of the 2nd TOSSOM (Testing of
Spatial Structure Models) Workshop. Journal of Cetacean
Research and Management 9(Suppl.), 489–498.
Jackson, J.A., Patenaude, N.J., Carroll, E.L. and Baker, C.S.
(2008) How few whales were there after whaling?
Inference from contemporary mtDNA diversity. Molecu-
lar Ecology 17, 236–251.
Jagielo, T.H. and Wallace, F.R. (2005) Assessment of
Lingcod (Ophiodon elongatus) for the Pacific Fishery Man-
agement Council in 2005. Pacific Fishery Management
Council, Portland, OR, 153 pp.
Jagielo, T.H., LeClair, L.L. and Vorderstrasse, B.A. (1996)
Genetic variation and population structure of lingcod.
Transactions of the American Fisheries Society 125, 372–
386.
Johnson, S.J., Zerbini, A. and Butterworth, D.S. (in press) A
Bayesian approach to assess the status of Southern
Hemisphere humpback whales (Megaptera novaengliae)
with an application to breeding stock G. Journal of
Cetacean Research and Management.
Genetic data and fisheries management R S Waples et al.
Journal compilation � 2008 Blackwell Publishing Ltd
444 No claim to original US government works, F I S H and F I S H E R I E S , 9, 423–449
MARAM/IWS/2019/Hake/BG4
22
Kaplan, I.C. and Helser, T.E. (2007) Stock Assessment of the
Arrowtooth Flounder (Atheresthes stomias) Population off
the West Coast of the United States in 2007. Pacific
Fishery Management Council, Portland, OR, 233 pp.
Key, M., MacCall, A.D., Bishop, T. and Leos, B. (2005)
Stock Assessment of the Gopher Rockfish. Pacific Fishery
Management Council, Portland, OR, 58 pp.
Key, M.K., MacCall, A.D., Field, J., Aseltine-Nielson, D. and
Lynn, K. (2008) The 2007 Assessment of Blue Rockfish
(Sebastes mystinus) in California. Pacific Fishery Manage-
ment Council, Portland, OR, 155 pp.
Koljonen, M.-L., Pella, J.J. and Masuda, M. (2005) Classical
individual assignment versus mixture modelling to
estimate stock proportions in Atlantic salmon (Salmo
salar) catches from DNA microsatellite data. Canadian
Journal of Fisheries and Aquatic Sciences 62, 2143–2158.
LaHood, E., Moran, P., Olsen, J., Grant, W.S. and Park, L.K.
(2002) Microsatellite allele ladders in two species of
Pacific salmon: preparation and field-test results. Molec-
ular Ecology Notes, 2, 187–190.
Lai, H.-L., Haltuch, M.A., Punt, A.E. and Cope, J.M. (2005)
Stock Assessment of Petrale Sole: 2004. Pacific Fishery
Management Council, Portland, OR, 211 pp.
Latch, E.K., Dharmarajan, G., Glaubitz, J.C. and Rhodes,
O.E. Jr (2006) Relative performance of Bayesian clus-
tering software for inferring population substructure
and individual assignment at low levels of population
differentiation. Conservation Genetics 7, 295–302.
Laurent, V. and Planes, S. (2007) Effective population size
estimation on Sardina pilchardus in the Bay of Biscay
using a temporal genetic approach. Biological Journal of
the Linnean Society 90, 591–602.
Leberg, P. (2005) Genetic approaches for estimating the
effective size of populations. Journal of Wildlife Manage-
ment 69, 1385–1399.
Livingston, M.E. and Schofield, K.A. (1996) Stock discrim-
ination of hoki (Macruronus novaezelandiae Merlucciidae)
in New Zealand waters, using morphometrics. New
Zealand Journal of Marine and Freshwater Research 30,
197–208.
Livingston, M.E., Schofield, K.A. and Sullivan, K.J. (1992)
The discrimination of hoki groups in New Zealand waters
using morphometrics and age-growth parameters. New
Zealand Fisheries Assessment Research Document
92/18. Available from the NIWA library, Wellington.
MacCall, A.D. (2005) Assessment of Vermilion Rockfish in
Southern and Northern California. Pacific Fishery Man-
agement Council, Portland, OR, 128 pp.
Manel, S., Schwartz, M., Luikart, G. and Taberlet, P.
(2003) Landscape genetics: combining landscape ecol-
ogy and population genetics. Trends in Ecology and
Evolution 18, 189–197.
Manel, S., Gaggiotti, O. and Waples, R.S. (2005) Assign-
ment methods: matching biological questions with
appropriate techniques. Trends in Ecology and Evolution
20, 136–142.
Martien, K.K. and Taylor, B.L. (2001) A new method of
generating hypothesized population structures for continu-
ously distributed species using genetic data. Paper SC/
53SD7 presented to the IWC Scientific Committee, July
2001. Available from the Journal of Cetacean Research
and Management, Cambridge, UK.
Martien, K. and Taylor, B.L. (2003) Limitations of
hypothesis testing in defining management units for
continuously distributed species. Journal of Cetacean
Research and Management 5, 213–219.
Matala, A.P., Gray, A.K. and Gharrett, A.J. (2004)
Microsatellite variation indicates population genetics
structure of bocaccio. North American Journal of Fisheries
Management 24, 1189–1202.
Maunder, M.N., Barnes, J.T., Aseltine-Nielson, D. and
MacCall, A.D. (2005) The Status of California Scorpionfish
(Scorpaena guttata) off Southern California in 2004. Pacific
Fisheries Management Council, Portland, OR, 132 pp.
McElhany, P., Ruckelshaus, M.H., Ford, M.J., Wainwright,
T.C. and Bjorkstedt, E.P. (2000) Viable Salmonid Popu-
lations and the Recovery of Evolutionarily Significant Units.
NOAA Technical Memorandum NMFS-NWFSC 42, 156
pp.
McGauley, K. and Mulligan, T.J. (1995) Polymerase chain
reaction-restriction fragment length polymorphism
analysis of mitochondrial rRNA genes from yellowtail
rockfish. Journal of Fish Biology 47, 744–747.
Meffe, G.K., Boersma, P.D., Murphy, D.D. et al. (1998)
Independent scientific review in natural resource man-
agement. Conservation Biology 12, 268–270.
Methot, R. (1992) Assessment of the West Coast Sablefish
Stock in 1992. Pacific Fishery Management Council,
Portland, OR, 96 pp.
Methot, R.D. and Hightower, J. (1990) Assessment of the
West Coast Sablefish Stock in 1990 and Recommendations
to Management in 1991. Pacific Fishery Management
Council, Portland, OR, 67 pp.
Miller, J.A., Banks, M.A., Gomez-Uchida, D. and Shanks,
A.L. (2005) A comparison of population structure in
black rockfish (Sebastes melanops) as determined with
otolith microchemistry and microsatellite DNA. Cana-
dian Journal of Fisheries and Aquatic Sciences 62, 2189–
2198.
Milner, G.B., Teel, D.J., Utter, F.M. and Winans, G.A.
(1985) A genetic method of stock identification in mixed
populations of pacific salmon, Oncorhynchus spp. Marine
Fisheries Review 47, 1–8.
Moran, P., Teel, D.J., LaHood, E., Drake, J. and
Kalinowski, S.T. (2006) Standardizing multi-laboratory
microsatellite data in Pacific salmon: an historical
view of the future. Ecology of Freshwater Fish 15,
597–605.
Morin, P.A., Luikart, G. and Wayne, R.K. and the SNP
Working Group (2004a) SNPs in ecology, evolution and
conservation. Trends in Ecology and Evolution 19, 208–
216.
Genetic data and fisheries management R S Waples et al.
Journal compilation � 2008 Blackwell Publishing Ltd
No claim to original US government works, F I S H and F I S H E R I E S , 9, 423–449 445
MARAM/IWS/2019/Hake/BG4
23
Morin, B., Methot, R., Sevigny, J.-M., Power, D., Branton,
B. and Mcintyre, T. (2004b) Revue de la structure, de
l’abondance et de la repartition de Sebastes mentella et
S. fasciatus dans le Canada atlantique dans le contexte des
especes en peril [Review of the structure, the abundance and
distribution of Sebastes mentella and S. fasciatus in Atlantic
Canada in a species-at-risk context]. DFO, Canadian
Science Advisory Secretariat, Research Document,
2004/058, 96 pp.
Moritz, C. (1994) Defining ‘evolutionarily significant units’
for conservation. Trends in Ecology and Evolution 9, 373–
375.
Naish, K. and Hard, J.J. (2008) Bridging the gap between
the genotype and the phenotype: linking genetic vari-
ation, selection and adaptation in fishes. Fish and
Fisheries 9, 396–422.
Narum, S.R., Buonaccorsi, V.P., Kimbrell, C.A. and Vetter,
R.D. (2004) Genetic divergence between gopher rockfish
(Sebastes carnatus) and black and yellow rockfish (Se-
bastes chrysomelas). Copeia 2004, 926–931.
Nielsen, E. and Hansen, M. (2008) Waking the dead: the
value of genetic analyses of historical samples. Fish and
Fisheries 9, 450–461.
Nielsen, R., Mattila, D.K., Clapham, P.J. and Palsbøll, P.J.
(2001) Statistical approaches to paternity analysis in
natural populations and applications to the North
Atlantic humpback whale. Genetics 157, 1673–1682.
Ogden, R. (2008) Fisheries forensics: the use of DNA tools
for improving compliance, traceability and enforcement
in the fishing industry. Fish and Fisheries 9, 462–472.
Pacific Salmon Commission. (2008) Recommendations for
application of Genetic Stock Identification (GSI) methods
to management of ocean salmon fisheries: special report
of the Genetic Stock Identification Steering Committee
and the Pacific Salmon Commission’s Committee on
Scientific Cooperation. Pacific Salmon Communications
Technical Report No. 23, 35 pp.
Paetkau, D., Slade, R., Burden, M. and Estoup, A. (2004)
Genetic assignment methods for the direct, real-time
estimation of migration rate: a simulation-based explo-
ration of accuracy and power. Molecular Ecology 13, 55–
65.
Palsbøll, P., Allen, J., Berube, M. et al. (1997) Genetic
tagging of humpback whales. Nature 388, 767–769.
Palumbi, S.R. (2003) Population genetics, demographic
connectivity, and the design of marine reserves. Ecolog-
ical Applications 13, S146–S158.
Pearse, D.E. and Crandall, K. (2004) Beyond FST: analysis
of population genetic data for conservation. Conservation
Genetics 5, 585–602.
Pearson, D.E. (1994) An initial examination of the status of the
bank rockfish fishery off the coast of California. Southwest
Fisheries Science Center, Santa Cruz, CA, 22 pp.
Pella, J. and Masuda, M. (2001) Bayesian methods for
analysis of stock mixtures from genetic characters.
Fishery Bulletin 99, 151–167.
Pella, J. and Masuda, M. (2006) The Gibbs and split-merge
sampler for population mixture analysis from genetic
data with incomplete baselines. Canadian Journal of
Fisheries and Aquatic Sciences 63, 576–596.
Pella, J.J. and Milner, G.B. (1987) Use of genetic marks in
stock composition analysis. In: Population Genetics &
Fishery Management (eds N. Ryman and F. Utter).
University of Washington Press, Seattle, WA, pp. 247–
276.
Piner, K., Schirripa, M., Builder, T., Rogers, J. and Methot,
R. (2000) Bank Rockfish (Sebastes rufus) Stock Assessment
for Eureka, Monterey, and Conception INPFC Areas North
of Pt. Conception, California. Pacific Fishery Management
Council, Portland, OR, 65 pp.
Plaganyi, E.E., Rademeyer, R.A., Butterworth, D.S., Cunn-
ingham, C.L. and Johnson, S.J. (2007) Making manage-
ment procedures operational – innovations implemented
in South Africa. ICES Journal of Marine Science 64, 626–
632.
PMCC (2007) Consensus Statement on Management of Spatial
Management of West Coast Fisheries. Pacific Marine
Conservation Council, Astoria, OR, 6 pp.
Potvin, C. and Bernatchez, L. (2001) Lacustrine spatial
distribution of landlocked Atlantic salmon populations
assessed across generations by multilocus individual
assignment and mixed-stock analyses. Molecular Ecology
10, 2375–2388.
Pritchard, J.K., Stephens, P. and Donnelly, P. (2000)
Inference of population structure using multilocus
genotype data. Genetics 155, 945–959.
Punt, A.E. (1992). Management Procedures for Cape Hake
and Baleen Whale Resources. PhD thesis, University of
Cape Town, 689 pp.
Punt, A.E. (2003) The performance of a size-structured
stock assessment method in the face of spatial hetero-
geneity in growth. Fisheries Research 65, 391–409.
Punt, A.E. (2006a). Updated stock assessment of blue
warehou (Seriollela brama) based on data up to 2006.
Document presented to SlopeRAG, August 2006 (CSIRO
Marine and Atmospheric Research).
Punt, A.E. (2006b) The FAO Precautionary Approach
after almost 10 years: have we progressed towards
implementing simulation-tested feedback-control man-
agement systems for fisheries management? Natural
Resource Modeling 19, 441–464.
Punt, A.E. (2008) Refocussing stock assessment in support
of policy evaluation. In: Fisheries for Global Welfare and
Environment (Memorial Book of the Fifth World Fisheries
Congress in Japan, October 2008) (eds K. Tsukamoto, T.
Kawamura, T. Takeuchi, T.D. Beard Jr and M.J. Kaiser).
Terra Scientific Publishing Company, Tokyo, pp. 139–
152.
Punt, A.E. and Donovan, G. (2007) Developing manage-
ment procedures that are robust to uncertainty: lessons
from the International Whaling Commission. ICES
Journal of Marine Science 64, 603–612.
Genetic data and fisheries management R S Waples et al.
Journal compilation � 2008 Blackwell Publishing Ltd
446 No claim to original US government works, F I S H and F I S H E R I E S , 9, 423–449
MARAM/IWS/2019/Hake/BG4
24
Punt, A.E., Pribac, F., Walker, T.I., Taylor, B.L. and
Prince, J.D. (2000) Stock assessment of school shark
Galeorhinus galeus based on a spatially-explicit popula-
tion dynamics model. Marine and Freshwater Research
51, 205–220.
Quinn, T.J. II and Deriso, R.B. (1999) Quantitative Fish
Dynamics. Oxford University Press, New York.
Ralston, S. (2005) An Assessment of Starry Flounder off
California, Oregon, and Washington. Pacific Fishery Man-
agement Council, Portland, OR, 86 pp.
Ralston, S. and Dick, E.J. (2003) The Status of Black Rockfish
(Sebastes melanops) off Oregon and Northern California in
2003. Pacific Fishery Management Council, Portland,
OR, 75 pp.
Rogers, J.B. (1994) Preliminary Status of the Splitnose
Rockfish in 1994. Pacific Fishery Management Council,
Portland, OR, 20 pp.
Ryder, O. (2003) Genetic studies in zoological parks and
their application to conservation: past, present and
future. International Zoo Yearbook 38, 102–111.
Sampson, D.B. (2005) The Status of Dover Sole off the U.S.
West Coast in 2005. Pacific Fisheries Management
Council, Portland, OR, 198 pp.
Sampson, D.B. (2007) The Status of Black Rockfish off
Oregon and California in 2007. Pacific Fishery Manage-
ment Council, Portland, OR, 236 pp.
Sampson, D.B. and Lee, Y.W. (1999) An Assessment of the
Stocks of Petrale Sole off Washington, Oregon, and Northern
California in 1998. Pacific Fishery Management Council,
Portland, OR, 100 pp.
Sampson, D.B. and Wood, C. (2001) Stock Status of Dover
Sole off the U.S. West Coast in 2000. Pacific Fishery
Management Council, Portland, OR, 120 pp.
Schirripa, M.J. (2007) Status of the Sablefish Resource off the
Continental U.S. Pacific Coast in 2007. Pacific Fishery
Management Council, Portland, OR, 117 pp.
Schwartz, M.K. and McKelvey, K.S. (2008) Why sampling
scheme matters: the effect of sampling scheme on
landscape genetic results. Conservation Genetics (Online
early, DOI: 10.1007/s10592-008-9622-1).
Schwartz, M.K., Tallmon, D.A. and Luikart, G. (1998)
Review of DNA-based census and effective population
size estimators. Animal Conservation 1, 293–299.
Schwartz, M.K., Luikart, G. and Waples, R.S. (2007)
Genetic monitoring: a promising tool for conservation
and management. Trends in Ecology and Evolution 22,
25–33.
Schwenke, P.L., Rhydderch, J.G., Ford, M.J., Marshall, A.R.
and Park, L.K. (2006) Forensic identification of endan-
gered Chinook Salmon (Onchorhynchus tshawytscha)
using a multilocus SNP assay. Conservation Genetics 7,
983–989.
Seeb, L.W. and Gunderson, D.R. (1988) Genetic variation
and population structure of Pacific ocean perch (Sebastes
alutus). Canadian Journal of Fisheries and Aquatic Sciences
45, 78–88.
Seeb, L.W., Antonovich, A., Banks, M.A. et al. (2007)
Development of a standardized DNA database for Chi-
nook salmon. Fisheries 32, 540–552.
Selkoe, K.A., Henzler, C.M. and Gaines, S.D. (2008)
Seascape genetics and the spatial ecology of marine
populations. Fish and Fisheries (in press).
Sevigny, J.-M., Roques, S., Bernatchez, L. et al. (2003)
Species identification and stock structure. In: Redfish
Multidisciplinary Research Zonal Program (1995–1998):
Final Report (ed. D. Gascon) Canadian Technical Report
Fisheries and Aquatic Sciences 2462, xiii + 139 pp.
Shaklee, J.B., Beacham, T.B., Seeb, L. et al. (1999) Man-
aging fisheries using genetic data: case studies from four
species of Pacific Salmon. Fishery Research 43, 45–78.
Siebenaller, J.F. (1978) Genetic variability in deep-sea
fishes of the genus Sebastolobus (Scorpaenidae). In:
Marine Organisms: Genetics, Ecology, and Evolution (eds
B. Battaglia and J.A. Beardmore). Plenum Press, New
York and London, pp. 95–122.
Skaug, H.J. (2001) Allele-sharing methods for estimation
of population size. Biometrics 57, 750–756.
Smith, A.D.M. (1994) Management strategy evaluation:
the light on the hill. In: Population Dynamics for Fisheries
Management (ed. D.A. Hancock). Australian Society for
Fish Biology, Perth, pp. 249–253.
Smith, P.J., Patchell, G. and Benson, P.G. (1981) Genetic
tags in the New Zealand hoki Macruronus novaezelandiae.
Animal Blood Groups and Biochemical Genetics 12, 37–45.
Smith, M.A., Woodley, N.E., Janzen, D.H., Hallwachs, W.
and Hebert, P.D. (2006) DNA barcodes reveal cryptic
host-specificity within the presumed polyphagous mem-
bers of a genus of parasitoid flies (Diptera: Tachinidae).
Proceedings of the National Academy of Sciences USA 103,
3657–3662.
Smith, A.D.M., Smith, D.C., Tuck, G.N. et al. (in press)
Experience in implementing harvest strategies in Aus-
tralia’s south-eastern fisheries. Fisheries Research.
Smouse, P.E., Waples, R.S. and Tworek, J.A. (1990) A
mixed fishery model for use with incomplete source
population data. Canadian Journal of Fisheries and Aquatic
Sciences 47, 620–634.
Stepien, C.A. (1995) Population genetic divergence and
geographic patterns from DNA sequences: examples
from marine and freshwater fishes. American Fisheries
Society Symposium 17, 263–287.
Stepien, C.A. (1999) Phylogeographical structure of the
Dover sole Microstomus pacificus: the larval retention
hypothesis and genetic divergence along the deep
continental slope of the northeastern Pacific Ocean.
Molecular Ecology 8, 923–939.
Stepien, C.A., Dillon, A.K. and Patterson, A.K. (2000)
Population genetics, phylogeography, and systematics
of the thornyhead rockfishes (Sebastolobus) along the
deep continental slopes of the North Pacific Ocean.
Canadian Journal of Fisheries and Aquatic Sciences 57,
1701–1717.
Genetic data and fisheries management R S Waples et al.
Journal compilation � 2008 Blackwell Publishing Ltd
No claim to original US government works, F I S H and F I S H E R I E S , 9, 423–449 447
MARAM/IWS/2019/Hake/BG4
25
Stewart, I.J. (2005) Status of the U.S. English Sole Resource
in 2005. Pacific Fishery Management Council, Portland,
OR, 221 pp.
Stewart, I.J. (2007) Status of the U.S. Canary Rockfish
Resources in 2007. Pacific Fishery Management Council,
Portland, OR, 362 pp.
Swanson, P., Campbell, B., Shearer, K.D. et al. (2008)
Application of reproductive technologies to captive
breeding programs for conservation of imperiled stocks
of Pacific salmon. Cybium 32, 279–282.
Sweijd, N.A., Bowie, R.C.K., Evans, B.S. and Lopata, A.L.
(2000) Molecular genetics and the management and
conservation of marine organisms. Hydrobiologia 420,
153–164.
Talman, S., Hamer, P., Robertson, S., Robinson, N.,
Skinner, A. and Smith, D.C. (2003) Stock structure
and spatial dynamics of the warehou: a pilot study. Final
Report of FRDC Project 2001/004. PIRVic, Marine and
Freshwater Systems, Queenscliff, 72 pp.
Utter, F.M. and Hodgins, H.O. (1969) Lactate dehydroge-
nase isozymes of Pacific hake (Merluccius productus).
Journal of Experimental Zoology 172, 59–67.
Utter, F.M. and Hodgins, H.O. (1971) Biochemical poly-
morphisms in the Pacific hake (Merluccius productus).
Conseil international pour l’exploitation de la mer 161, 87–
89.
Utter, F.M., Teel, D.J., Milner, G.B. and McIsaac, D. (1987)
Genetic estimates of stock compositions of 1983 chinook
salmon, Oncorhynchus tshawytscha, harvests off the
Washington coast and Columbia River. Fishery Bulletin
(U.S.) 85, 13–23.
Villablanca, F. and Nakamura, R. (2007) Population Genetics
of the Commercially Important Cabezon. Sea Grant R/MLPA-
05, Cal Poly San Luis Obispo, San Luis Obispo, 38 pp.
Vrooman, A.M. and Paloma, P.A. (1977) Dwarf hake off
the coast of Baja California, Mexico. CalCOFI Report 19,
67–72.
Wallace, J. and Lai, H.-L. (2005) Status of the Yellowtail
Rockfish in 2004. Pacific Fishery Management Council,
Portland, OR, 115 pp.
Wallace, F.R., Hoffmann, A. and Tagart, J.V. (1999) Status
of the black rockfish resource in 1999. In: Appendix to
the Status of the Pacific Coast Groundfish Fishery Through
1999 and Recommended Acceptable Biological Catches for
2000, Stock Assessment and Fishery Evaluation. Pacific
Fishery Management Council, Portland, OR, 85 pp.
Wallace, F.R., Tsou, T.S., Jagielo, T. and Cheng, Y.W.
(2006) Status of Yelloweye Rockfish (Sebastes ruberrimus)
off the U.S. West Coast in 2006. Pacific Fishery
Management Council, Portland, OR, 141 pp.
Wallace, F.R., Cheng, Y.W. and Tsou, T.S. (2007) Status of
the Black Rockfish Resource North of Cape Falcon, Oregon to
the U.S.-Canadian border in 2006. Pacific Fishery Man-
agement Council, Portland, OR, 120 pp.
Walters, C.J. and Martell, S.J.D. (2004) Fisheries Ecology and
Management. Princeton University Press, Princeton, NJ.
Waples, R.S. (1991) Pacific salmon, Oncorhynchus spp.,
and the definition of ‘‘species’’ under the Endangered
Species Act. Marine Fishery Review 53, 11–22.
Waples, R.S. (1998) Separating the wheat from the chaff:
patterns of genetic differentiation in high gene flow
species. Journal of Heredity 89, 438–450.
Waples, R.S. and Do, C. (2008) LDNE: a program for
estimating effective population size from data on
linkage disequilibrium. Molecular Ecology Resources 8,
753–756.
Waples, R.S. and Gaggiotti, O. (2006) What is a popula-
tion? An empirical evaluation of some genetic methods
for identifying the number of gene pools and their
degree of connectivity. Molecular Ecology 15, 1419–
1439.
Waples, R.S., Dickhoff, W.W., Hauser, L. and Ryman, N.
(2008) Six decades of fishery genetics: taking stock.
Fisheries 33, 76–79.
Ward, R.D. (2000) Genetics in fisheries management.
Hydrobiologia 420, 191–201.
Ward, R.D. and Gardner, M.G. (1997) Stock Structure and
Species Identification of School and Gummy Sharks in
Australian Waters. Report of FRRF 93/11 & FRDC 93/
64. CSIRO Marine Research, Hobart.
Whitlock, M.C. and McCauley, D.E. (1999) Indirect mea-
sures of gene flow and migration: FST „ 1/(4Nm + 1).
Heredity, 82, 117–125.
Wishard, L.N., Utter, F.M. and Gunderson, D.R. (1980)
Stock separation of five rockfish species using naturally
occurring biochemical genetic markers. Marine Fishery
Review 42, 64–73.
Withler, R.E., Beacham, T.D., Schulze, A.D., Richards, L.J.
and Miller, K.M. (2001) Co-existing populations
of Pacific Ocean perch, Sebastes alutus, in Queen
Charlotte Sound, British Columbia. Marine Biology
139, 1–12.
Wright, S. (1931) Evolution in Mendelian populations.
Genetics 16, 97–159.
Appendix 1: Fred Utter’s take on the genetic
marker wars (unpublished data)
Hello SNPs
With allozymes dying, fish workers were trying to
replace now-defunct data bases that for decades
had grown and become widely known as the
key to identify places where fish populations
from various nations and regions were all
intermixing.
Allozymes got expensive as they got less extensive
and support for them rapidly nixing.
Allozymes hit the basement. To find a replacement,
new DNA tools claimed the day.
Genetic data and fisheries management R S Waples et al.
Journal compilation � 2008 Blackwell Publishing Ltd
448 No claim to original US government works, F I S H and F I S H E R I E S , 9, 423–449
MARAM/IWS/2019/Hake/BG4
26
Each crowing their merits, they were dangled like
carrots,
asking management bodies to pay to develop,
then sample – until data were ample to reach a
new peak very fast for mixture solution with more
resolution than allozymes did in the past.
Mitochondrial genomes were first seen as phenoms
to reclaim salmon management’s crown,
but these female lines even failed to define
what was known - this made managers frown.
Microsatellites came with immediate fame
and abounding in loci, alleles.
Very soon major groups had the management
troops
strongly sniffing at microsat’s heels.
Different groups had their foci on different loci.
Different setups weren’t very repeatable.
Analytical squeals from six dozen alleles
suggested this tool was defeatable.
Among other blips, crept a tool known as SNPs
with apparent explicit simplicity,
proclaiming its wares based on nucleotide pairs,
from proponents of zeal and felicity.
This tool at this place is the primary basis
of research intended to be
a model – of course – for revealing the source
of – sometime – every fish in the sea!!
Though it seems a bit chilling – living up to this
billing
is our intention right from the get go.
So come one and all. We are having a ball.
Your problems we pledge never to let go.
Genetic data and fisheries management R S Waples et al.
Journal compilation � 2008 Blackwell Publishing Ltd
No claim to original US government works, F I S H and F I S H E R I E S , 9, 423–449 449
MARAM/IWS/2019/Hake/BG4
27