Embed Size (px)
Citation preview
University of South CarolinaScholar Commons
Theses and Dissertations
2018
Integrating Literacy Strategies In The BiologyClassroom: Using A Generative Vocabulary MatrixTo Improve Standardized Test ScoresAnna H. MorrisonUniversity of South Carolina - Columbia
Follow this and additional works at: https://scholarcommons.sc.edu/etd
Part of the Curriculum and Instruction Commons
This Open Access Dissertation is brought to you by Scholar Commons. It has been accepted for inclusion in Theses and Dissertations by an authorizedadministrator of Scholar Commons. For more information, please contact [email protected].
Recommended CitationH. Morrison, A.(2018). Integrating Literacy Strategies In The Biology Classroom: Using A Generative Vocabulary Matrix To ImproveStandardized Test Scores. (Doctoral dissertation). Retrieved from https://scholarcommons.sc.edu/etd/5022
INTEGRATING LITERACY STRATEGIES IN THE BIOLOGY
CLASSROOM:
USING A GENERATIVE VOCABULARY MATRIX TO IMPROVE
STANDARDIZED TEST SCORES
by
Anna H. Morrison
Bachelor of Arts
Mercer University, 2012
Master of Arts
Kennesaw State University, 2013
Submitted in Partial Fulfillment of the Requirements
For the Degree of Doctor of Education in
Curriculum and Instruction
College of Education
University of South Carolina
2018
Accepted by:
Leigh K. D’Amico, Major Professor
Suha Tamim, Committee Member
Yasha Becton, Committee Member
Jennifer K. Frisch, Committee Member
Cheryl L. Addy, Vice Provost and Dean of the Graduate School

ii
© Copyright by Anna H. Morrison, 2018
All Rights Reserved.
iii
DEDICATION
To my grandmother, Ann Elizabeth Casey, who served her community as a high school
English teacher and librarian from 1952 until 1987. Her unique teaching methods were
ahead of her time. My grandmother’s life and her work have inspired me never to stop
pursuing greater knowledge.
To my husband, Zachary Morrison, who has provided me with unfailing support and
encouragement throughout this process and to whom I owe an immense amount of
gratitude.
iv
ABSTRACT
This dissertation focuses on the development and implementation of an action
research study that seeks to determine the impact of integrating literacy strategies in the
biology classroom on standardized test scores. The teacher-researcher identified the
problem of practice in her classroom after four years of observation of ninth-grade
biology students. These observations led the teacher-researcher to develop, research, and
investigate the following question: What is the impact of Larson’s (2014b) Generative
Vocabulary Matrix (GVM) in a high school biology course as demonstrated by students’
performance on the South Carolina End-of-Course Examination Program? This
dissertation orients the research question from a theoretical perspective and provides
literature to support the relevance of this work. Additionally, this dissertation provides
details associated with the process of planning, developing, acting, and reflecting on this
action research study.

v
TABLE OF CONTENTS
DEDICATION ................................................................................................................... iii
ABSTRACT ....................................................................................................................... iv
LIST OF TABLES ........................................................................................................... viii
CHAPTER 1 INTRODUCTION AND METHODOLOGY .............................................. 1
Topic & Background............................................................................................... 1
Problem of Practice ................................................................................................. 2
Research Question and Objectives .......................................................................... 3
Purpose Statement ................................................................................................... 5
Theoretical Framework ........................................................................................... 5
Potential Weakness ................................................................................................. 9
Significance of the Study ...................................................................................... 10
Summary and Conclusion ..................................................................................... 12
Keywords Glossary ............................................................................................... 13
CHAPTER 2 LITERATURE REVIEW ........................................................................... 14
Introduction ........................................................................................................... 14
Historical Context ................................................................................................. 15
Instructional Strategies.......................................................................................... 19

vi
Literacy Education ................................................................................................ 26
South Carolina Biology Curriculum ..................................................................... 28
Action Research Methodology ............................................................................. 35
Summary of Research ........................................................................................... 36
CHAPTER 3 RESEARCH DESIGN ................................................................................ 37
Introduction ........................................................................................................... 37
Research Context .................................................................................................. 38
Action Research Design ........................................................................................ 40
Summary and Conclusion ..................................................................................... 57
CHAPTER 4 PRESENTATION AND ANALYSIS OF DATA ...................................... 58
Overview ............................................................................................................... 58
Intervention Strategy ............................................................................................. 60
General Findings and Results ............................................................................... 60
Supplemental Analysis.......................................................................................... 73
Summary ............................................................................................................... 75
CHAPTER 5 CONCLUSIONS AND RECOMMENDATIONS ..................................... 78
Overview of Study ................................................................................................ 78
Results Related to Existing Literature .................................................................. 83
Limitations of Study ............................................................................................. 90
Action Plan............................................................................................................ 92
vii
Recommendations for Future Research ................................................................ 93
Summary ............................................................................................................... 96
REFERENCES ................................................................................................................. 97
APPENDIX A RESEARCH DESIGN FLOWCHART ................................................. 101
APPENDIX B GENERATIVE VOCABULARY MATRIX PROGRESSION ............. 102
APPENDIX C PARENT NOTIFICATION LETTER ................................................... 105
viii
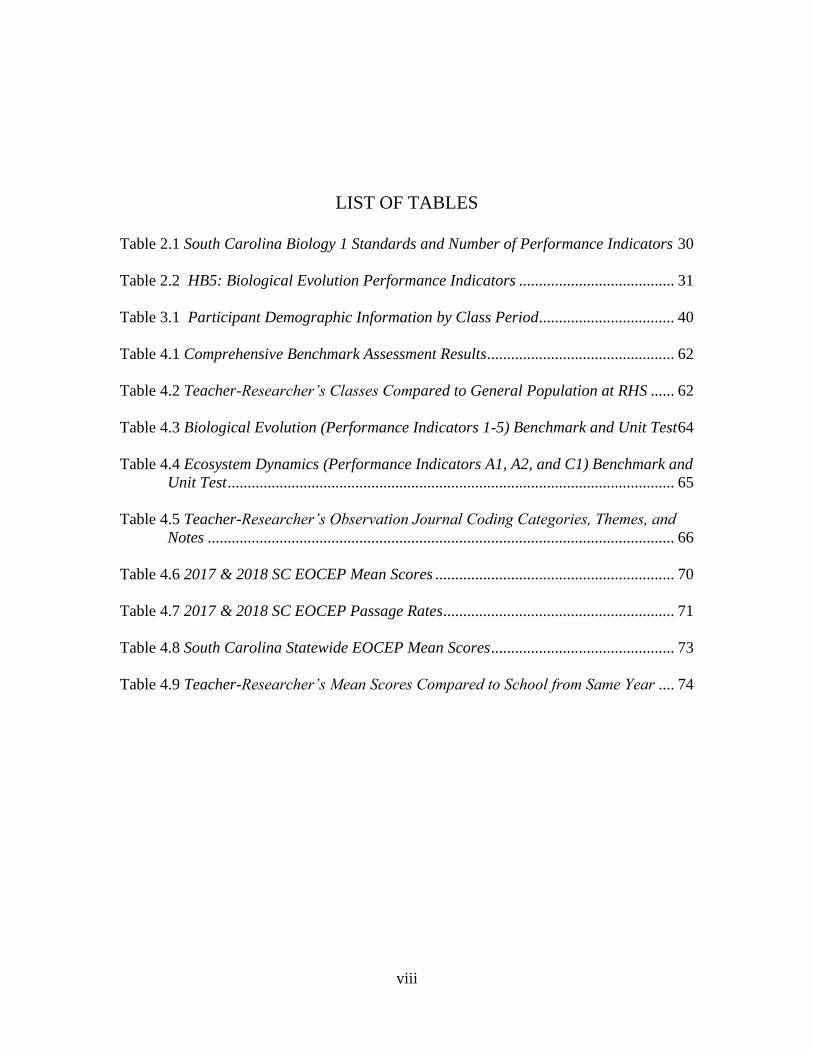
LIST OF TABLES
Table 2.1 South Carolina Biology 1 Standards and Number of Performance Indicators 30
Table 2.2 HB5: Biological Evolution Performance Indicators ....................................... 31
Table 3.1 Participant Demographic Information by Class Period.................................. 40
Table 4.1 Comprehensive Benchmark Assessment Results ............................................... 62
Table 4.2 Teacher-Researcher’s Classes Compared to General Population at RHS ...... 62
Table 4.3 Biological Evolution (Performance Indicators 1-5) Benchmark and Unit Test 64
Table 4.4 Ecosystem Dynamics (Performance Indicators A1, A2, and C1) Benchmark and
Unit Test ................................................................................................................ 65
Table 4.5 Teacher-Researcher’s Observation Journal Coding Categories, Themes, and
Notes ..................................................................................................................... 66
Table 4.6 2017 & 2018 SC EOCEP Mean Scores ............................................................ 70
Table 4.7 2017 & 2018 SC EOCEP Passage Rates .......................................................... 71
Table 4.8 South Carolina Statewide EOCEP Mean Scores .............................................. 73
Table 4.9 Teacher-Researcher’s Mean Scores Compared to School from Same Year .... 74

1
CHAPTER 1
INTRODUCTION AND METHODOLOGY
Topic & Background
The present action research study integrated literacy strategies into the biology
classroom using Larson’s (2014b) Generative Vocabulary Matrix (GVM). The GVM
emphasizes the need for student engagement in academic content through experiences.
By using an active learning method for literacy instruction, such as the GVM, students
can develop personal connections to the content while simultaneously building science
literacy skills.
The teacher-researcher is a high school biology teacher whose students often find
it very difficult to learn and retain the concepts taught in the high school biology
classroom because of a lack of science literacy skills. Students think of literacy and
science as separate entities, never overlapping, while in reality the two are permanently
intertwined. Larson (2014a) states that "Over half of the work of scientists involves
reading and writing, yet secondary instruction does not typically incorporate the very
reading and writing discourses of the subject area domain that develop reasoning and
conceptual understanding" (pp. 287-288). To increase student achievement in the
sciences, science educators must begin integrating literacy fundamentals into their
lessons and build on those principles regularly. This study evaluated the importance of
integrating literacy instruction in the science classroom on student performance on the
2
South Carolina End-of-Course Examination Program for biology. The teacher-researcher
utilized action research methods to conduct this study within her classroom. Chapter 2
includes detailed information regarding the historical context of this study and research
related to instructional strategies, literacy education, and the SC biology curriculum.
Problem of Practice
The identified Problem of Practice (PoP) involves Rushmore High School (RHS),
a pseudonym used to protect the school’s identity, where student achievement on the
South Carolina End-of-Course Examination Program (EOCEP) for biology needs
improvement. The identified PoP was developed after several years of direct observation
by the teacher-researcher who was a ninth-grade biology instructor at RHS. Students
consistently perform below their potential in ninth-grade biology because their reading
ability and writing skills in science collectively referred to as “science literacy skills,” are
not at the levels necessary for students to effectively memorize and comprehend the
vocabulary and concepts evaluated on the SC EOCEP for biology. The teacher-researcher
also noted that students do not have identical experiences contributing to their scientific
knowledge. If assumptions regarding shared experiences are made in the process of test
development, this diversity has the potential to place some students at a disadvantage on
standardized tests, such as the SC EOCEP for biology.
The teacher-researcher evaluated the relationship between integrating literacy
strategies in the biology classroom and performance on the SC EOCEP for biology.
Larson’s (2014b) Generative Vocabulary Matrix (GVM) is a literacy strategy that utilizes
experiences as part of instruction. The integration of literacy strategies and science is a
pedagogical technique that has been effective with ninth-grade biology students in other
3
areas of the United States using Larson’s (2014b) GVM. Before the present action
research study, the integration of literacy strategies and biology had not previously been
researched using Larson’s (2014b) GVM at RHS. The teacher-researcher implemented
Larson’s (2014b) GVM as a literacy strategy with ninth-grade biology students in the
spring of 2018.
The SC EOCEP for biology is a high-stakes test which accounts for 20% of each
student’s overall course average and consequently has the potential to impact students’
overall grade point averages (GPA). Additionally, the passage rate on this test is
published in the public domain on the SC Department of Education’s website. This
information can be used by parents and community members to evaluate a school’s merit
and achievement level. Based on these factors, the PoP was identified as a need for
increased student achievement on the SC EOCEP for biology due to the potential impact
this test has on students’ overall course averages, their GPAs, and the consequences these
results may have on public opinion of the present school. This identified PoP was the
subject of the present action research study.
Research Question and Objectives
This study is classified as an action research study and was conducted by the
teacher-researcher. According to Mills (as cited in Mertler 2014), action research can be
defined as, “any systematic inquiry conducted by teachers…with a vested interest in the
teaching and learning process or environment for the purpose of gathering information
about…how they teach and how their students learn” (p.4). This study took place at
Rushmore High School where the teacher-researcher was employed during the 2016-
2017 and 2017-2018 school years. The action research study was conducted in the
4
teacher-researcher’s ninth-grade biology classes during the 2017-2018 school year. The
teacher-researcher had a vested interest in improving her students’ retention and
comprehension of the concepts covered in introductory biology. The teacher-researcher
sought to improve her students’ scores on the South Carolina End-of-Course Examination
Program for biology by implementing Larson’s (2014b) Generative Vocabulary Matrix
(GVM) as the foundation for literacy instruction.
The design of this action research study was a mixed-methods study. Most of the
data were quantitative and the teacher-researcher used descriptive statistics to analyze the
results. The teacher-researcher kept an informal observational journal during the study
that was used to triangulate the data. In this study, the scores of the teacher-researcher’s
students on the SC EOCEP for biology were compared to the results of similar students
from the previous year. During the 2017-2018 school year, Larson’s (2014b) GVM was
implemented as the foundation for literacy instruction in both teacher-researcher’s
biology classes. This instructional strategy was not used in the previous year in the
teacher-researcher’s classes or by any teacher at Rushmore High School. The study was
designed as an action research study with the intent of being suggestive, not probative.
The research question at the center of this action research study was:
1. What is the impact of Larson’s (2014b) Generative Vocabulary Matrix (GVM)
in a high school biology course as demonstrated by students’ performance on
the SC End-of-Course Examination Program?
The teacher-researcher hypothesized that the biology classes at Rushmore High School
where students used Larson’s (2014b) GVM would have higher average scores on the SC
EOCEP than the scores of similar students from the previous year. Further details on the

5
research design, including participant selection, statistical analysis, and ethical
considerations, are included in Chapter 3.
Purpose Statement
The primary purpose of the present action research study was to integrate literacy
strategies into the biology classroom using Larson’s (2014b) Generative Vocabulary
Matrix (GVM). The secondary purpose was to develop an action plan based on the use of
Larson’s (2014b) GVM and the South Carolina biology standards for instruction. The
tertiary purpose was to describe the relationship between science literacy skills and
performance on the SC End-of-Course Examination Program for biology.
Theoretical Framework
The present action research study draws on the theories of Franklin Bobbitt,
William F. Pinar, and Wayne Au. Franklin Bobbitt (2013) emphasizes the importance of
creating and drawing on students’ experiences to meet learning objectives. William Pinar
(2013) shares the importance of blending various educational ideologies in developing an
effective curriculum. Wayne Au (2013) seeks to combat unwelcome instructional trends
associated with the increase of high-stakes testing.
Experience and Education
In far too many instances, science is taught as a series of facts presented in
isolation while in the real-world these facts are woven together to create events, systems,
and phenomena. It is to the detriment of students that the methods of teaching science do
not accurately reflect the real-world applications of the subject. Franklin Bobbitt (2013)
suggests,
6
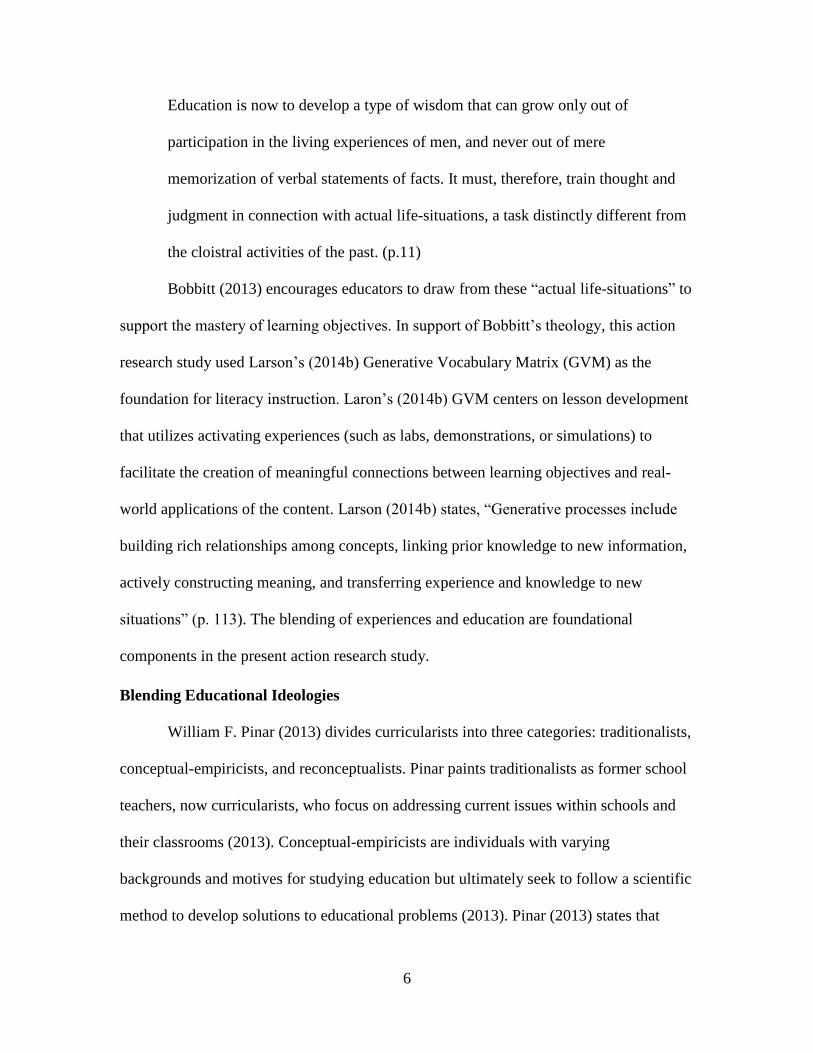
Education is now to develop a type of wisdom that can grow only out of
participation in the living experiences of men, and never out of mere
memorization of verbal statements of facts. It must, therefore, train thought and
judgment in connection with actual life-situations, a task distinctly different from
the cloistral activities of the past. (p.11)
Bobbitt (2013) encourages educators to draw from these “actual life-situations” to
support the mastery of learning objectives. In support of Bobbitt’s theology, this action
research study used Larson’s (2014b) Generative Vocabulary Matrix (GVM) as the
foundation for literacy instruction. Laron’s (2014b) GVM centers on lesson development
that utilizes activating experiences (such as labs, demonstrations, or simulations) to
facilitate the creation of meaningful connections between learning objectives and real-
world applications of the content. Larson (2014b) states, “Generative processes include
building rich relationships among concepts, linking prior knowledge to new information,
actively constructing meaning, and transferring experience and knowledge to new
situations” (p. 113). The blending of experiences and education are foundational
components in the present action research study.
Blending Educational Ideologies
William F. Pinar (2013) divides curricularists into three categories: traditionalists,
conceptual-empiricists, and reconceptualists. Pinar paints traditionalists as former school
teachers, now curricularists, who focus on addressing current issues within schools and
their classrooms (2013). Conceptual-empiricists are individuals with varying
backgrounds and motives for studying education but ultimately seek to follow a scientific
method to develop solutions to educational problems (2013). Pinar (2013) states that

7
conceptual-empiricists hold, “the view that education is not a discipline in itself, but an
area to be studied by the disciplines” (p. 152). Pinar (2013) believes that while each type
of curricularist has a unique view of education, the field of education must blend the
ideas of each to prosper and flourish. Reconceptualists take ideas from both traditionalists
and conceptual-empiricists but diverge by adding a, “‘value-laden’ perspective and a
perspective with a politically emancipatory intent” (Pinar, 2013, p. 153). This action
research study seeks to find a middle ground between the reconstructionist views and the
ideals of both the traditionalists and conceptual-empiricists. This study addresses a
problem in the classroom which is a focus of traditionalists and will use the scientific
method to develop an action research plan and collect data that orients the study with the
conceptual-empiricists. Pinar (2013) states, “We are not faced with an exclusive choice:
either the traditional wisdom of the field, or conceptual-empiricism, or
reconceptualization. Each is reliant upon the other” (p. 155).
In South Carolina, standardized testing is required of students at the end of select
courses. At the culmination of biology courses, students take the SC End-of-Course
Examination Program. Larson’s (2014b) General Vocabulary Matrix (GVM), which is
the foundation for the literacy instruction in the present action research study, works
within the instructional framework outlined by the government by building upon the core
content standards, but also incorporates the focus of reconceptualists by implementing a
strategy of interactive learning which is targeted towards the students’ interests and
personal experiences.
Educators may work towards changing policies associated with the over-testing of
high school students, but while the tests are in place, educators must explore

8
opportunities to enrich students’ educational experiences within the current framework.
Educators can use strategies such as Larson’s (2014b) GVM, which gives students
educational experiences, provides them with “intellectual freedom,” and helps them
achieve academic success on the standardized tests which currently contribute heavily to
their overall course averages (Pinar, 2004, p.10).
High-Stakes Testing
Wayne Au (2013) defines a test as high-stakes, “when its results are used to make
important decisions that affect students, teachers, administrators, communities, schools,
and districts” (p. 236). According to these guidelines, the South Carolina End-of-Course
Examination Program for biology is identified as a high-stakes test. The SC EOCEP
directly impacts students by contributing to 20% of their overall course averages for
biology. Due to the impact this test can make on a student’s overall course average, it
also has the potential to impact a student’s grade point average (GPA). Additionally,
administrators, communities, schools, and districts are affected by the results of the SC
EOCEP. The results of this test and EOCEPs in other subject areas are in the public
domain and parents may decide to move their students into or out of the district or school
zone based on how the schools perform on high-stakes tests such as this one.
The present action-research study seeks to combat the unwelcome trends that
have arisen due to the proliferation of high-stakes testing in the United States. In Au’s
(2013) study, he found that “overwhelmingly, the prevalent theme triplet in the
qualitative research was the combination of contracting curricular content, fragmentation
of the structure of knowledge, and increasing teacher-centered pedagogy in response to
high stakes testing” (p. 245). The structure of Larson’s (2014b) Generative Vocabulary

9
Matrix (GVM) focuses on making connections throughout the curriculum and relating the
content to real-world experiences instead of teaching in isolated units. Larson’s (2014b)
GVM also increases student-centered pedagogy instead of focusing on a teacher-centered
lecture. Larson’s (2014b) GVM is based on students integrating curricular content
through experience-based lessons into their current understanding of the world. By using
Larson’s (2014b) GVM to increase student achievement on a high-stakes test, like the SC
EOCEP for biology, students are benefiting from an unrestricted curricular content, a
fluid and continuous structure of knowledge, and increased student-centered pedagogy.
Moe (2003) states, “Virtually all organizations need to engage in top-down control,
because the people at the top have goals they want the people at the bottom to pursue, and
something has to be done to bring about the desired behaviors” (p. 81). While this may be
true, the implementation of high-stakes tests such as the SC EOCEP begs the question,
how do the goals of the people at the top directly benefit the people (teachers and
students) at the bottom who are pursuing them?
The present action research study seeks to help students be successful within the
current educational system without losing the benefits of an academically rich and
student-centered instructional method. The method used for the present action research
study weaves together student experience and perspective within the framework that is
currently in place at the school and district of interest for this study.
Potential Weakness
As previously stated, the design of this action research study is a mixed-methods
study but is largely quantitative using descriptive statistics to analyze the results. In this
study, the scores of the teacher-researcher’s students on the South Carolina End-of-

10
Course Examination Program for biology were compared to the results of similar students
from the previous year. One of the limitations of the study was consistency in the specific
questions asked on the SC EOCEP for biology. The 2017 and 2018 SC EOCEPs had
identical blueprints, but the questions themselves were not necessarily identical from year
to year. The significance of this issue may be minimal because the SC Department of
Education develops the test with the goal of comparing results from year to year and
establishing trends; however, to show consistency and determine any differences, the
state mean scores for the 2017 and 2018 SC EOCEP for biology are included and
evaluated as part of the reported data for this study.
Significance of the Study
The present action research study took place in an era where students’ grades in
select high school courses are largely determined by results of high-stakes tests, such as
the South Carolina End of Course Examination Program for biology. The SC EOCEP for
biology accounts for 20% of each student’s overall class average in ninth-grade biology
with the semester averages accounting for the other 80% of the final grade. This one
assessment could greatly impact a student’s grade in the class and potentially affect their
overall high school grade point averages (GPA). The teacher-researcher seeks to provide
students with instruction that will afford them the best opportunity to score at their
maximum ability on this examination. If students feel successful at the beginning of their
high school career, they may have more drive to continue putting forth effort in the
following years. The present action research study sought to produce statistical relevance
related to improving standardized test scores by integrating literacy strategies using
Larson’s (2014b) Generative Vocabulary Matrix (GVM).
11
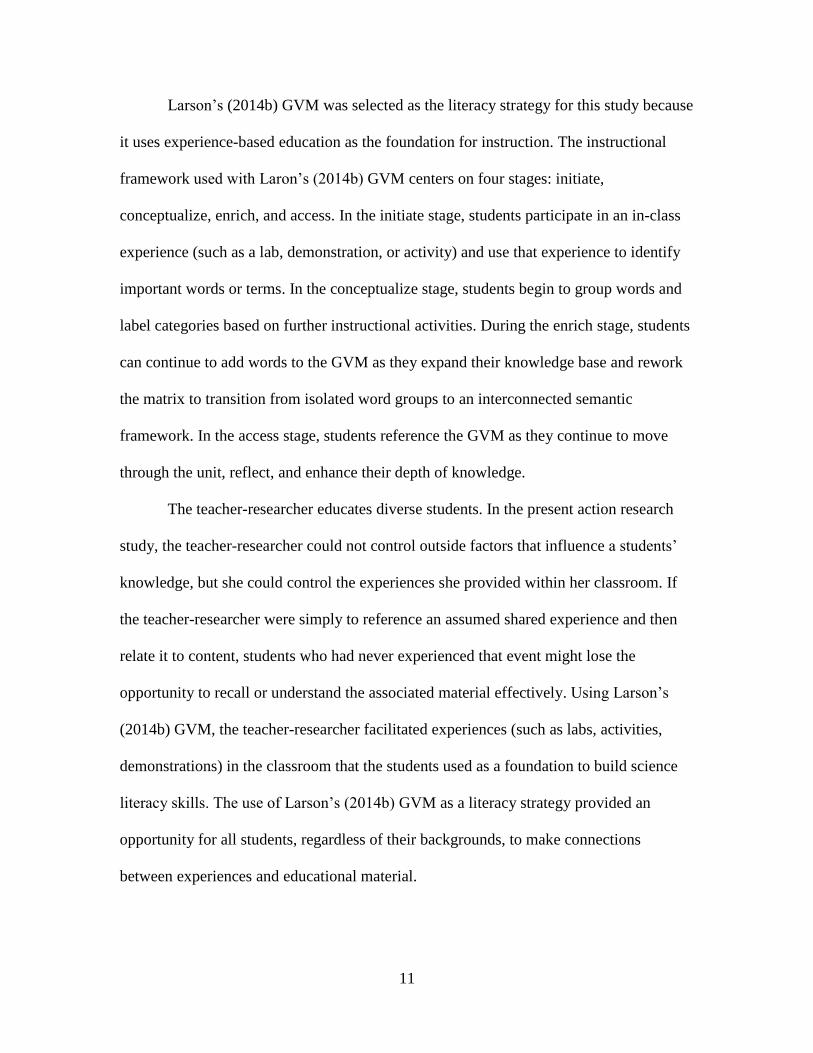
Larson’s (2014b) GVM was selected as the literacy strategy for this study because
it uses experience-based education as the foundation for instruction. The instructional
framework used with Laron’s (2014b) GVM centers on four stages: initiate,
conceptualize, enrich, and access. In the initiate stage, students participate in an in-class
experience (such as a lab, demonstration, or activity) and use that experience to identify
important words or terms. In the conceptualize stage, students begin to group words and
label categories based on further instructional activities. During the enrich stage, students
can continue to add words to the GVM as they expand their knowledge base and rework
the matrix to transition from isolated word groups to an interconnected semantic
framework. In the access stage, students reference the GVM as they continue to move
through the unit, reflect, and enhance their depth of knowledge.
The teacher-researcher educates diverse students. In the present action research
study, the teacher-researcher could not control outside factors that influence a students’
knowledge, but she could control the experiences she provided within her classroom. If
the teacher-researcher were simply to reference an assumed shared experience and then
relate it to content, students who had never experienced that event might lose the
opportunity to recall or understand the associated material effectively. Using Larson’s
(2014b) GVM, the teacher-researcher facilitated experiences (such as labs, activities,
demonstrations) in the classroom that the students used as a foundation to build science
literacy skills. The use of Larson’s (2014b) GVM as a literacy strategy provided an
opportunity for all students, regardless of their backgrounds, to make connections
between experiences and educational material.

12
Summary and Conclusion
The present action research study focused on the impact of integrating literacy
strategies in the biology classroom on standardized test scores. The goal of this research
was to implement Larson’s (2014b) Generative Vocabulary Matrix (GVM), an
experience-based literacy strategy, to increase student performance on the South Carolina
End-of-Course Examination Program. The present action research study sought to answer
the question: What is the impact of Larson’s (2014b) Generative Vocabulary Matrix
(GVM) in a high school biology course as demonstrated by students’ performance on the
SC End-of-Course Examination Program? The teacher-researcher sought to improve the
quality of biology instruction for her students using the Larson’s (2014b) GVM. The
teacher-researcher hoped to demonstrate that this change in instructional methods would
increase the students’ scores on the SC EOCEP. The literature review in Chapter 2
provides a historical context for the study and in-depth research on instructional
strategies, literacy education, the SC biology curriculum. Chapter 3 explains the
methodology and research design for this study. Chapter 4 presents and analyzes the data
for this study, and Chapter 5 provides conclusions and recommendations for future
research.
13
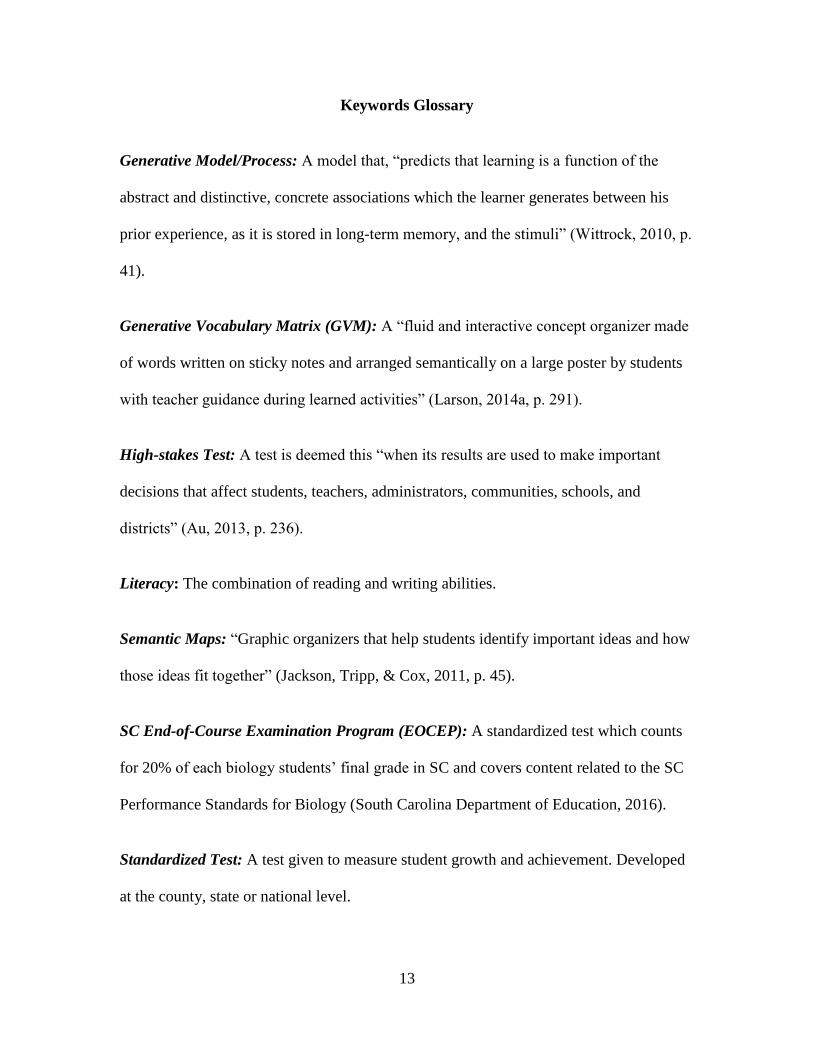
Keywords Glossary
Generative Model/Process: A model that, “predicts that learning is a function of the
abstract and distinctive, concrete associations which the learner generates between his
prior experience, as it is stored in long-term memory, and the stimuli” (Wittrock, 2010, p.
41).
Generative Vocabulary Matrix (GVM): A “fluid and interactive concept organizer made
of words written on sticky notes and arranged semantically on a large poster by students
with teacher guidance during learned activities” (Larson, 2014a, p. 291).
High-stakes Test: A test is deemed this “when its results are used to make important
decisions that affect students, teachers, administrators, communities, schools, and
districts” (Au, 2013, p. 236).
Literacy: The combination of reading and writing abilities.
Semantic Maps: “Graphic organizers that help students identify important ideas and how
those ideas fit together” (Jackson, Tripp, & Cox, 2011, p. 45).
SC End-of-Course Examination Program (EOCEP): A standardized test which counts
for 20% of each biology students’ final grade in SC and covers content related to the SC
Performance Standards for Biology (South Carolina Department of Education, 2016).
Standardized Test: A test given to measure student growth and achievement. Developed
at the county, state or national level.
14
CHAPTER 2
LITERATURE REVIEW
Introduction
This chapter provides a review of scholarly literature that explains the relevance
of integrating literacy strategies in the biology classroom in an era of high-stakes testing
in the state of South Carolina. The main topics included in this literature review are:
historical context, instructional strategies, literacy education, SC biology curriculum, and
methodology. This chapter grounds the study by providing a historical context starting in
the early 1800s and extending to the present day. Next, Larson’s (2014b) Generative
Vocabulary Matrix (GVM) is explained by reviewing the instructional strategies that
contribute to its structure and implementation. The instructional strategies addressed are
generative knowledge and process, semantic maps and discussion, and experience-based
education. The review of literacy education discusses continuing literacy education
throughout high school and scientific literacy concerns for subpopulations. Information
on the SC biology curriculum provides details about the state standards and the SC End-
of-Course Examination Program for biology. Lastly, this chapter concludes with a brief
overview of the action research methodology for the present action research study.
15
Historical Context
Common School Movement (the early 1800s)
Rushmore High School is a public high school in a suburban area in South
Carolina. It enrolled approximately 2350 students during the 2017-2018 school year. As a
public school, many of the fundamental ideals of the school evolved from the common
school movement in the early 1800s. The common school movement was a result of
many different groups pushing education in a similar direction, but for vastly different
reasons. The common school was created with the intent of being, “administered by state
and local governments for the purpose of achieving public goals, such as remedying
social, political, and economic problems” (Spring, 2014, p. 78). Throughout the common
school movement, the philosophies of political groups continued to move in opposing
directions, but the common school movement still managed to prevail (Spring, 2014).
One of the focuses of the common school movement was equality. Today, literacy
plays a key role in attaining economic and social equality. While literacy will not solve
all equality issues, just as the common school movement could not, a student who has
learned to express their thoughts through writing and can attain knowledge through
reading can gain power over their future. The concept held today of education leading to
future success and power is an extension of the ideals of the of the workingmen’s parties
during the common school movement. The workingmen’s parties saw the common
school as an opportunity to ensure the sharing power, the protection of their rights, and
fair treatment (Spring, 2014).
16
Post-World War II (1945- early 1960s)
After World War II, the field of education saw a dramatic increase in the role of
the federal government. Reminiscent of the educational movements in the early 1800s,
education once again took on the burden of being the proposed solution to many of the
nation’s growing concerns (Spring, 2014). The aftermath of World War II illuminated the
need for educational and training opportunities for young American men. The nation
required soldiers as well as engineers and scientists. In the 1940s, to rival and ideally
surpass the other nations of the world, the federal government along with Vannevar Bush
and James B. Conant helped to develop the National Science Foundation (NSF) (2014).
The NSF-supported scientific research was devoted to improving science education in
public schools (2014). Approximately a decade later, the National Defense Education Act
(NDEA) was implemented (2014). The NDEA was developed as a response to the Soviet
Union’s launch of Sputnik I. As part of this program President Eisenhower, “called for a
system of nationwide testing of high school students and a system of incentives to
persuade students with high ability to pursue scientific or professional studies” (Spring,
2014, p. 369).
A Nation at Risk (the 1980s)
In the early 1980s, Secretary of Education, Terrel H. Bell, spoke out on the
importance of literacy education. Since this time, the call for nationwide testing has been
a theme in the American educational system. In 1983, the National Commission on
Excellence in Education stated, “our nation is at risk. Our once unchallenged
preeminence in commerce, industry, science, and technological innovation is being
overtaken by competitors throughout the world” (p. 102). One of the recommendations to
17
combat this challenge was that “standardized tests of achievement (not to be confused
with aptitude tests) should be administered at major transition points from one level of
schooling to another and particularly from high school to college or work” (p. 116).
Today, the United States government is still arguing for the necessity of standardized
testing to propel students toward higher academic achievements and ultimately position
the United States as a fierce international academic competitor.
The problem of practice for the present action research study is centered on a
standardized test of achievement which was developed from the past and current
mandates issued by the federal and local government. The South Carolina End-of-Course
Examination Program for biology is one of many standardized tests administered to high
school students in the state of South Carolina. In order to attain the associated goals the
government has for standardized tests, students must not only participate in testing but
are also pushed to achieve specific passing scores. The focus of this research was to
implement a literacy strategy, Larson’s (2014b) Generative Vocabulary Matrix (GVM),
to improve student achievement on the SC EOCEP for biology.
Common Core and South Carolina Standards (2009-present)
In 2009, the Race to the Top education policy, promoted by President Obama’s
administration, was signed into law (Spring, 2014). States developed policies in response
to this legislation. One such policy suggested that educational systems should adopt,
“standards and assessments that prepare students to succeed in college and in the
workplace and to compete in the global economy” (Spring, 2014, p. 445). This policy
initiated the creation of the national Common Core State Standards (2014). The Common
Core Standards were developed for English Language Arts (ELA) and math with the
18
intention that the ELA standards could be used as supplemental literacy standards for
other subjects such as science and social studies (Common Core Standards Initiative,
2012). The Common Core Standards were initially approved by South Carolina in 2010
but were then repealed in 2014 (Kerr, 2015). The current SC standards are similar in
content to the Common Core Standards but are cited as being more specific regarding
what elements of each topic should be taught (Kerr, 2015).
Jackson, Tripp, and Cox (2011) assert that a “contextually rich instruction builds
basic language comprehension through the use of context clues that include authentic
pictures, illustrations, diagrams, graphic organizers, and interactive learning experiences”
(p. 45). Larson’s (2014b) Generative Vocabulary Matrix (GVM) is an experience-based
literacy strategy that centers on an interactive word wall. The use of this literacy strategy
supports the ideology of Jackson et al. (2011) while also building on the fundamentals of
the SC Standards for biology (Larson, 2014a). The SC Biology Standards Support Guide
(2014b) states that “an important component of all scientists and engineers’ work is
communicating their results both by informal and formal speaking and listing, and formal
reading and writing” therefore students should be participating in similar experiences in
their science classes (p.6).
Spring (2014) expresses concern that our nation’s focus on standardization
suggests, “a view that schools would now be, among other things, data collection centers
with students being reduced to statistical data” (p. 453). By using Larson’s (2014b)
GVM, teachers can work within the confines of the state standards, integrate important
literacy strategies, and prepare students for a required standardized test while continuing
to use diverse instructional methods to engage students. Larson (2014a) promotes
19
teaching with a “strong, practical instructional plan that supports both content learning
and sustained engagement in the classroom” (p. 289).
Instructional Strategies
The basis for the present action research study arose from a study conducted by
Sue C. Larson (2014a) which explored the relationship between use of the Generative
Vocabulary Matrix (GVM) and academic literacy engagement among ninth-grade
biology students. In her study, Larson utilized a robust literacy intervention tool called
the Engagement Model of Academic Literacy for Learning (EngageALL).
The EngageALL instructional design, employed in Larson’s (2014a) study, is
based on four steps: (1) situate the inquiry, (2) investigate and construct knowledge, (3)
select and synthesize knowledge, and (4) generate and demonstrate knowledge. A key
component of the EngageALL intervention is the GVM. Larson (2014a) defines the
GVM as a “central placeholder for ongoing thinking and inquiry throughout a unit and to
support student engagement in meaning-making discourse through active use of both core
vocabulary and academic language” (p. 291). Larson’s (2014a) study showed that
students who were taught using the EngageALL intervention method with the GVM,
“performed at significantly higher levels of conceptual understanding of biology content,
engagement, motivational factors, and academic language/vocabulary use compared to
students receiving traditionally organized instruction” (p. 287).
Larson (2014b) also conducted a learning workshop with second-grade students
using the GVM to explore information about the wetlands habitat. In this workshop,
Larson (2014b) modified the four steps utilized in the EngageALL framework to
integrate the GVM for this lesson. The modified steps are listed as initiating the matrix,
20
conceptualizing the matrix, enriching the matrix, and accessing the matrix. These
modified steps provided the framework for the present action research study. The
initiation stage included actions such as connecting two words, asking questions and
integrating relevant prior knowledge (2014b). The conceptualizing the matrix stage asked
student complete tasks such as determining important concept words, labeling categories,
and analyzing results of experiments (2014b). The students enriched the matrix by
completing tasks such as evaluating additional relevant information and synthesizing
information from multiple sources (2014b). Lastly, the students transferred their
knowledge to a task in the “accessing the matrix” phase (2014b). Larson (2014b)
demonstrated through this workshop that the generative method of learning combined
with the matrix structure creates a dynamic and effective learning experience for
students. At the present date, Larson’s (2014b) model and use of the GVM has not been
widely tested by empirical research in other studies.
Generative knowledge and process
Several studies have determined the positive impact of integrating generative
frameworks within an instructional process and provide support and relevance for
Larson’s (2014b) work with the Generative Vocabulary Matrix (GVM). The generative
process as an instructional tool is not limited to use with vocabulary, but it can be used as
a component of literacy instruction. The structure of GVM is considered a generative
process because it seeks to create rich and long-term connections in the minds of students
between content being studied and prior experiences.
Templeton (2012) describes generative knowledge as, “students’ ability to learn
quite literally tens of thousands of words-- words they study explicitly and words they
21
encounter in their independent reading across all disciplines-- by attending to the
combinations of prefixes, suffixes, and roots” (p. 101). Templeton asserts that generative
knowledge is supported by an understanding of word morphology. Morphology is
defined as, “the domain of language that addresses how meaningful word parts,
morphemes, are arranged to create words” (Templeton, 2012, p. 101). When taught the
concept of word morphology, students are quickly able to recognize that related words
often look similar, for example, ecology/ecosystem. Templeton shares instructional
techniques that can facilitate vocabulary expansion. He provides an example of a teacher
who used scenes from a book and directed questioning to generate a learning experience
where students respond to questions and ultimately create the definition of a term before
the teacher shares the new term with them.
Wittrock (2010) studied learning as a generative process by presenting reading
materials to a group of sixth graders and examining students’ mean retention scores.
Wittrock (2010) states that the fundamental concept of the generative model is that,
“people tend to generate perceptions and meaning that are consistent with their prior
learning” (p. 41). In Wittrock’s study, approximately half of the students were designated
as having above-average reading abilities, and the other half were labeled as having
below-average reading abilities (2010). The students were divided into categories: the
control with just the reading material, students who received one-word organizers,
students who received two-word organizers, and students who were asked to generate a
summary of each paragraph (2010). Some students with the organizers were also asked
to generate a sentence to summarize the paragraph (Wittrock, 2010). In both the above-
average and below-average reading groups, mean retention scores were highest in the
22
groups that had two-word organizers and were asked to generate a sentence to summarize
the paragraph. Furthermore, the generative group with two-word organizers, “double[d]
the scores of the control group that had the same stories without generative instructions or
organizers” (Wittrock, 2010, p. 41).
Wittrock (2010) believes progress related to instruction, understanding human
abilities, development, and learning can be united under one fundamental understanding.
The understanding Wittrock (2010) refers to is, “the notion that human learning with
understanding involves the process of generating and transferring meaning for stimuli
and events from one’s background, attitudes, abilities, and experiences” (p. 43). Johnson
and Mrowka (2010) conducted a study based on Wittrock’s research to determine if there
was a correlation between quizzes promoting generative processing and performance on
summative examinations. Their study showed that students who took quizzes that
promoted generative processes performed better on summative examinations than those
who were given knowledge and comprehension-based quizzes (Johnson & Mrowka,
2010). Their findings support the positive impact of the generative learning process.
Johnson and Mrowka (2010) assert that generative learning can create, “cognitive
linkages [that] are likely to stimulate memory, which can facilitate performance on later
assignments where concepts are encountered again” (p. 118).
Semantic maps and discussion
Semantic maps are, “graphic organizers that help students identify important ideas
and how those ideas fit together” (Jackson, Tripp, & Cox, 2011, p. 45). One example of a
semantic map is an interactive word wall. The interactive word wall is a map which
provides not only words but also visual aids, that helps students organize terms and
23
assists in developing more in-depth understanding (2011). Jackson et al. (2011) also
found many benefits to using interactive word walls in the classroom. Teachers stated
that “organizing unit instruction [was] easier and focused planning meetings” (p. 49).
Additionally, the study reports that students could more readily understand connections in
the material and, “became self-sufficient during activities and labs, finding information
they needed by looking at the word wall rather than asking the teacher” (p. 49).
The Generative Vocabulary Matrix (GVM) used by Larson (2014b) is an
extension of a semantic map based on the interactive word wall structure. Larson’s
(2014b) GVM was the literacy strategy used in the present action research study.
Larson’s (2014b) GVM includes semantic mapping as well as discussion. Discussion was
an important factor in the success of this instructional strategy. Stahl and Vancil (1986)
found that “vocabulary discussion is the key element in the effectiveness of semantic
mapping” (p. 62). Their study divided a collection of sixth-grade students into three
groups (1986). One group had discussion only, one group was given a semantic map
only, and one group had both the discussion and the map (1986). The data showed that
both groups with discussion scored higher on each of the three post-tests administered
than the group that received only the semantic map (1986). The group that had the full
treatment, both discussion and semantic map, scored slightly higher than the group who
had discussion only on two of the three posttests administered, although the difference
was not statistically significant (1986).
Experience-based education
The present action research study integrated literacy in science using Larson’s
(2014b) Generative Vocabulary Matrix (GVM). Larson’s (2014b) GVM emphasizes the

24
need for student engagement in the academic content through experiences. Advancing
scientific literacy is aided by experiences that help students personally connect to the
concepts presented in the science curriculum. The present action research study sought to
provide students with quality educational experiences related to literacy and science. By
using an active learning method, such as Larson’s (2014b) GVM, students can develop
personal connections to the content. Larson (2014b) states, “Generative learning is
motivating because students control meaning making during active learning experiences”
(p. 2).
Larson’s (2014b) GVM encourages teachers to develop activities related to
content for the students to experience. At the beginning of a unit on cellular transport, a
teacher instructs students to take droppers of food coloring and dispense the food
coloring into a water bottle to demonstrate the concept of diffusion. After this experience,
the students would write key words from their observations and place them on a display
board near key terms from the unit that have already been pre-placed. The GVM is a
“fluid and interactive concept organizer made of words written on sticky notes and
arranged semantically on a large poster by students with teacher guidance during learning
activities” (Larson, 2014a, p. 291). In this way, the students can make connections from
their shared experience to the vocabulary terms for the unit (Larson, 2014a). Larson’s
(2014b) GVM supports Bobbitt’s (2013) idea that, “education must be concerned with
both [undirected and directed experiences], even though it does not direct both” (p.13).
By using Larson’s (2014b) GVM, a teacher ensures that students have an experience that
typically might be considered undirected (putting food coloring in water) to strengthen
the understanding of the directed training (the concept of diffusion).

25
Experience-based education is not only an example of sound pedagogy, but it also
has relevance to social justice concerns. Many middle and upper-class Americans would
like to assert that individuals in the United States are a heterogeneous group of people
that have unique personalities and backgrounds, but collectively we would also prefer
that an individual's uniqueness fall within a certain “comfort zone.” It makes many
individuals uncomfortable to talk about different social classes in America, but the reality
is that students enter the classroom from diverse backgrounds with unique experiences
that contribute to their understanding of new information. Gregory Mantsios (2013)
provides myths that are common beliefs held regarding life in the United States. One
myth is that “everyone has an equal chance to succeed. Success in the United States
requires no more than hard work, sacrifice, and perseverance” (p. 151). This myth is far
from the truth, but allows individuals to absolve themselves of guilt and responsibility.
Teachers must acknowledge that for some students, their difficulties in the classroom
may not be due to lack of effort, but instead an absence of common experiences. If a
biology teacher gives a lecture on succession in a forest, she may rely on students’
experiences visiting or living near a forested area to create connections and help students
retain the new information. Some students may have grown up in the city where their
experiences include mostly cars, streets, and buildings. These students’ families might
not have had the opportunity to vacation to an area where there was a forest. Due to this
lack of experience, those students are now at a disadvantage to recall the information on
the topic of succession in a forest.
While there are individuals who hold great wealth in America, there are many
more living in poverty. Mantsios (2013) states, “Approximately one out of every five
26
children (4.4 million) in the United States under the age of six lives in poverty” (p. 151).
Hard work, sacrifice, and perseverance are important character traits but do not equate to
equal chances for success. Studies have shown that “class standing has a significant
impact on chances for educational achievement” (p. 155). Willie Lee Buffington, the
founder of the Faith Cabin Library Movement, observed the consequences of class
differences and acted to improve the number of educational opportunities available.
Buffington believed that “individual and community uplift could be achieved through
education” (Powell, 2008, p. 77). Buffington’s story of creating the Faith Cabin Library
Movement “is proof that individuals, no matter what their resources, can work to
alleviate unjust situations for other people” (p. 91). Integrating experience-based
education into instruction is one of many ways to begin alleviating those unjust situations
for students.
Literacy Education
Continuing literacy education throughout high school
At Rushmore High School, all students are required to take biology to graduate.
Students typically take this course when they are in ninth-grade. The biology curriculum
requires students to learn numerous terms, definitions, and concepts at a more accelerated
pace than the students were exposed to at the middle-school level. Many ninth-grade
students begin high school and quickly realize that they are academically unprepared for
high school-level work (Balfanz & Legters, 2006). This lack of academic readiness can
cause students to act disengaged at school, try to avoid school entirely, or create
disruptions in the classroom. Much of their frustration stems from inadequate reading
comprehension and writing levels. Carlson (2014) provides the statistic that,

27
[A]ccording to the 2009 National Assessment of Educational Progress (NAEP) in
reading, only 30% of entering high school freshman read proficiently (NCES,
2009), which means that as the material in the textbooks becomes more
challenging, those students who struggle with literacy fall even further behind.
(p.3)
High school educators must stop assuming the literacy skills taught in elementary
school are effective for reading all forms of texts and for writing in any format, such as
lab reports or argumentative essays (Carlson, 2014). In order for students to be successful
in upper-level science classes, literacy fundamentals must be woven into the science
curriculum. Scaffolding the content-area standards is a common practice of educators, but
it takes added planning and preparation to scaffold the reading and writing associated
with that content-area curriculum. This added effort is necessary for the success of the
students.
Scientific literacy concerns for sub-populations
While scientific literacy is an area of concern for all student groups, research has
shown that many sub-populations of the students in the United States have even greater
difficulty in reading and writing. The National Center for Education Statistics (NCES)
(2010) provides data that demonstrates a significant achievement gap in reading between
White students and their Black and Hispanic peers, in addition to differences in
performance between genders. The 2009 Nation's Report Card states,
[T]he average reading score for the nation’s twelfth-graders in 2009 was 2 points
higher than in 2005 but 4 points lower than in 1992. White students, Asian/Pacific
28
Islander students, and male students all made gains since 2005, but no
racial/ethnic or gender groups showed gains since 1992. (NCES, 2010, p.9)
Buckingham (2012) notes the achievement gaps of these subpopulations but also
brings to light the disconcerting fact that many teachers, "have traditionally felt
unprepared to plan for and instruct" other diverse student groups, such as English
Language Learners (ELL) (p.1). This student group is referred to as “Limited English
Proficient (LEP)” by the South Carolina Department of Education. Many content area
teachers are aware of the need for improvement of student literacy, but they do not feel
that they can effectively integrate literacy curriculum into their courses. This concern is
not isolated to ELL/LEP students. Westover and Martin (2014) researched literacy
instruction for students with significant disabilities and reinforce the importance of this
issue. Westover and Martin (2014) state that for students with disabilities, “strong literacy
skills provide a gateway to generative communication,” but “many educators lack the
knowledge to design or implement appropriate evidence-based literacy instruction for
students with significant disabilities” (p. 364). Buckingham (2012) reveals that the
uncertainty of teachers in integrating literacy instruction is not a consequence of a lack of
available resources. Many books and resources are available for teaching literacy in
various content areas, like science, to diverse student groups but the resources are not
consistently being used.
South Carolina Biology Curriculum
Biology curriculum
The present action research study was conducted in a biology classroom in South
Carolina. Teachers in SC are strongly encouraged to use the SC Biology 1 Standards
29
(South Carolina Department of Education, 2014a) and the Support Guide for Biology 1
South Carolina Academic Standards and Performance Indicators for Science (South
Carolina Department of Education, 2014b) as a framework for developing lesson plans
and assessments, both formative and summative. The SC Biology 1 Standards are broken
down into the following categories: science and engineering practices, cells as a system,
energy transfer, heredity, biological evolution, and ecosystem dynamics (South Carolina
Department of Education, 2014a). Each standard also has sub-categories that the SC
Department of Education refers to as “performance indicators” (South Carolina
Department of Education, 2014a). These performance indicators provide specific
information regarding what a student should be able to do to demonstrate their
knowledge of the standard. Teachers are instructed to integrate the indicators for the
standard on science and engineering practices within the other five core standards instead
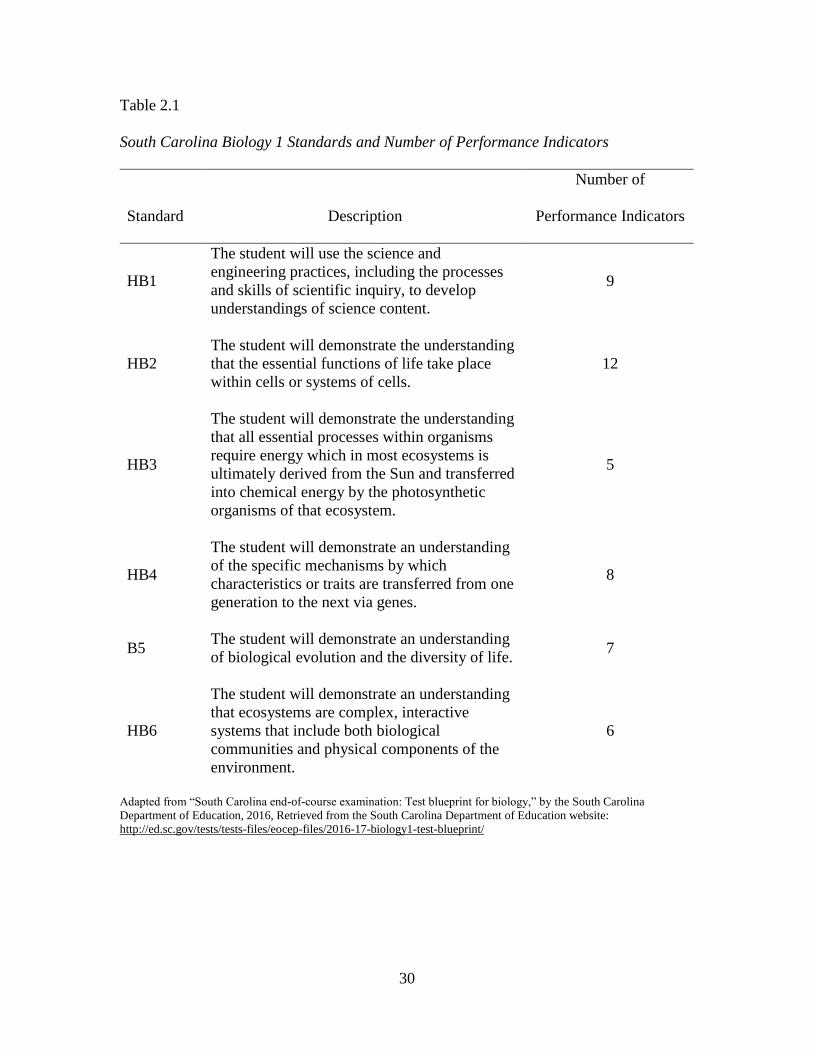
of teaching it in isolation. Each core standard has a range of five to twelve performance
indicators. Table 2.1 provides a description and number of performance indicators for
each standard (South Carolina Department of Education, 2016).
The units that were taught during the present action research study were B5:
Biological Evolution and HB6: Ecosystem Dynamics, but the SC EOCEP for biology
covered material from the entire school year. The CP biology instructors slightly
amended the pacing guide published by the school district in which the teacher-researcher
is employed due to various factors, such as the loss of days due to testing or inclement
weather. The biology teachers at Rushmore High School planned to spend three weeks on
standard B5: Biological Evolution and four weeks of instruction dedicated to the HB6:
Ecosystem Dynamics standard.
30
Table 2.1
South Carolina Biology 1 Standards and Number of Performance Indicators
Standard Description
Number of
Performance Indicators
HB1
The student will use the science and
engineering practices, including the processes
and skills of scientific inquiry, to develop
understandings of science content.
9
HB2
The student will demonstrate the understanding
that the essential functions of life take place
within cells or systems of cells.
12
HB3
The student will demonstrate the understanding
that all essential processes within organisms
require energy which in most ecosystems is
ultimately derived from the Sun and transferred
into chemical energy by the photosynthetic
organisms of that ecosystem.
5
HB4
The student will demonstrate an understanding
of the specific mechanisms by which
characteristics or traits are transferred from one
generation to the next via genes.
8
B5 The student will demonstrate an understanding
of biological evolution and the diversity of life.
7
HB6
The student will demonstrate an understanding
that ecosystems are complex, interactive
systems that include both biological
communities and physical components of the
environment.
6
Adapted from “South Carolina end-of-course examination: Test blueprint for biology,” by the South Carolina
Department of Education, 2016, Retrieved from the South Carolina Department of Education website:
http://ed.sc.gov/tests/tests-files/eocep-files/2016-17-biology1-test-blueprint/
31
Table 2.2
HB5: Biological Evolution Performance Indicators
Performance Indicator Description
B5.1 Summarize the process of natural selection.
B5.2 Explain how genetic processes result in the continuity of
life-forms over time.
B5.3 Explain how diversity within a species increases the
changes of its survival.
B5.4 Explain how genetic variability and environmental factors
lead to biological evolution.
B5.5
Exemplify scientific evidence in the fields of anatomy,
embryology, biochemistry and paleontology that underlies
the theory of biological evolution.
B5.6
Summarize ways that scientists use data from a variety of
sources to investigate and critically analyze aspects of
evolutionary theory.
B5.7 Use a phylogenetic tree to identify the evolutionary
relationships among different group of organisms.
Adapted from “South Carolina biology 1 standards,” by the South Carolina Department of Education, 2014a, Retrieved
from the South Carolina Department of Education website:
http://ed.sc.gov/scdoe/assets/File/instruction/standards/Science/Biology1-Standards-Printable%20.pdf
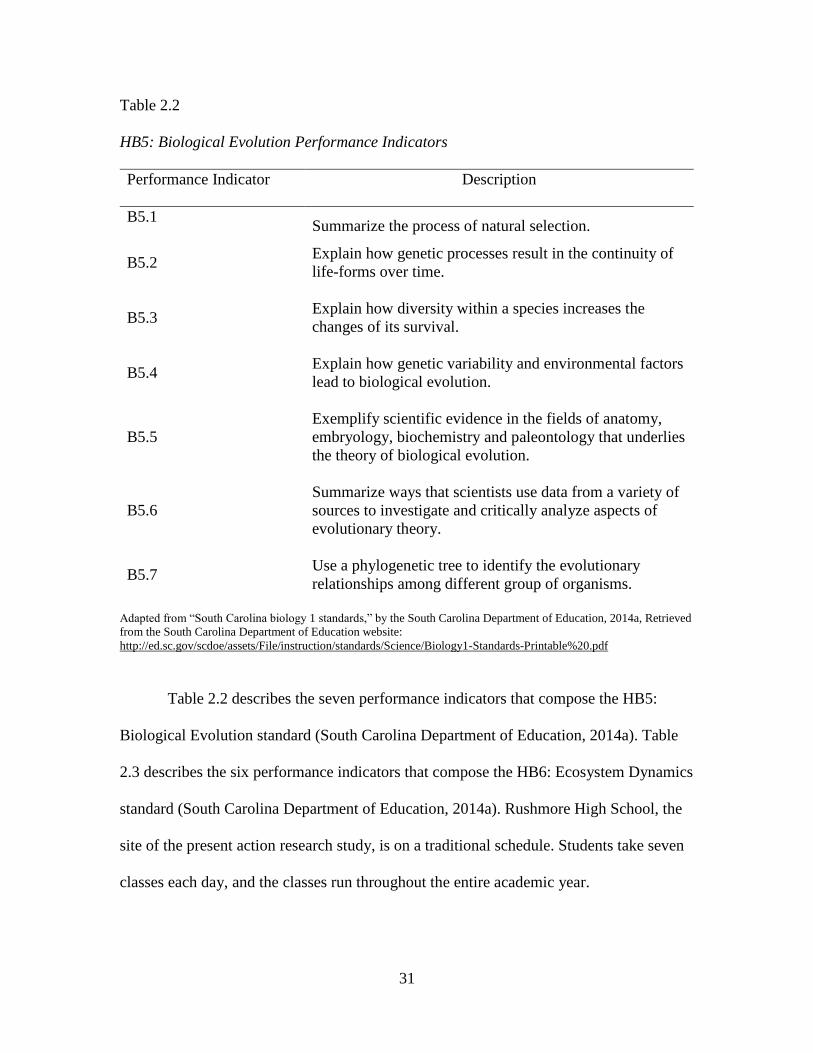
Table 2.2 describes the seven performance indicators that compose the HB5:
Biological Evolution standard (South Carolina Department of Education, 2014a). Table
2.3 describes the six performance indicators that compose the HB6: Ecosystem Dynamics
standard (South Carolina Department of Education, 2014a). Rushmore High School, the
site of the present action research study, is on a traditional schedule. Students take seven
classes each day, and the classes run throughout the entire academic year.

32
Table 2.3
HB6: Ecosystem Dynamics Performance Indicators
Performance Indicator Description
HB6A1
Analyze and interpret data that depict changes in the
abiotic and biotic components of an ecosystem over time
or space and propose hypotheses about possible
relationships between the changes in the abiotic
components and the biotic components of the
environment.
HB6A2
Use mathematical and computational thinking to support
claims that limiting factors affect the number of
individuals than an ecosystem can support.
HB6B1
Develop and use models of the carbon cycle, which
include the interactions between photosynthesis, cellular
respiration and other processes that release carbon
dioxide, to evaluate the effects of increasing atmospheric
carbon dioxide on natural and agricultural ecosystems.
HB6B2
Analyze and interpret quantitative data to construct an
explanation for the effects of greenhouse gases on the
carbon cycle and global climate.
HB6C1
Construct scientific arguments to support claims that the
changes in the biotic and abiotic components of various
ecosystems over time affect the ability of an ecosystem to
maintain homeostasis.
HB6D1 Design solutions to reduce the impact of human activity
on the biodiversity of an ecosystem.
Adapted from “South Carolina biology 1 standards,” by the South Carolina Department of Education, 2014a, Retrieved
from the South Carolina Department of Education website:
http://ed.sc.gov/scdoe/assets/File/instruction/standards/Science/Biology1-Standards-Printable%20.pdf
Standardized testing
In South Carolina, upon completion of a biology course, all students are required
to take the SC End of Course (EOC) examination. The test is given at the end of the
academic year, typically in mid-May. The SC EOCEP accounts for 20% of the students’
33
final grades and covers content related to the SC Biology 1 Standards (South Carolina
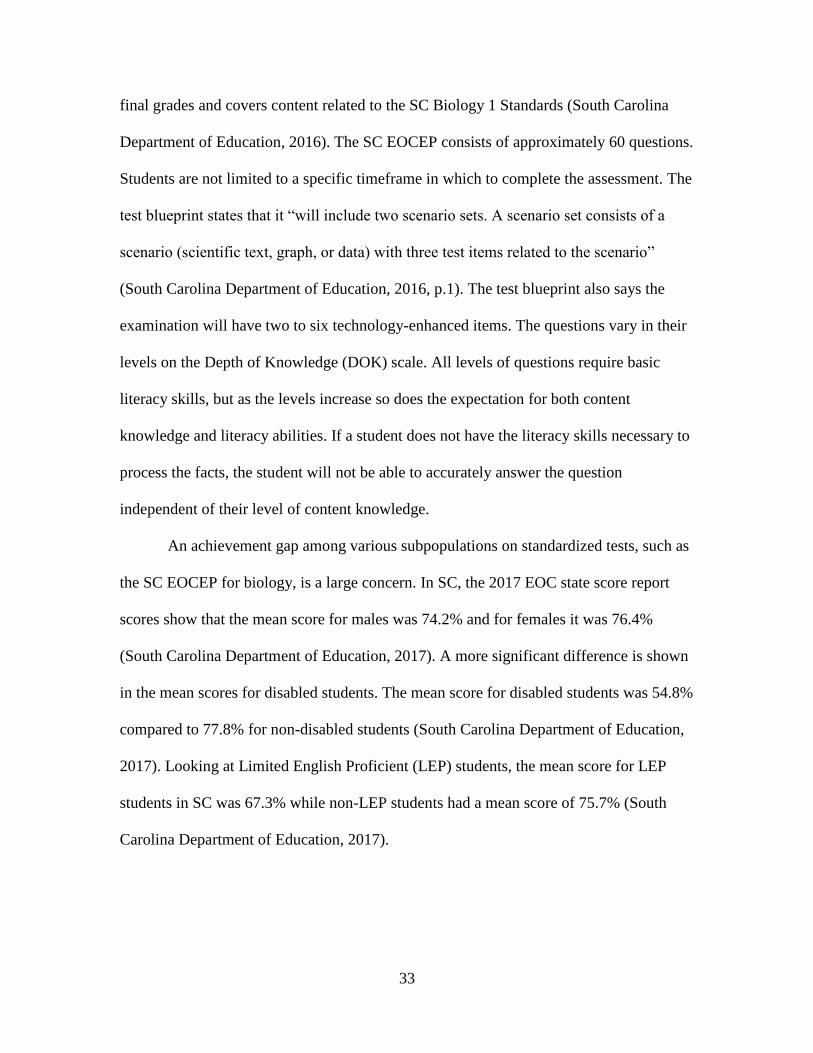
Department of Education, 2016). The SC EOCEP consists of approximately 60 questions.
Students are not limited to a specific timeframe in which to complete the assessment. The
test blueprint states that it “will include two scenario sets. A scenario set consists of a
scenario (scientific text, graph, or data) with three test items related to the scenario”
(South Carolina Department of Education, 2016, p.1). The test blueprint also says the
examination will have two to six technology-enhanced items. The questions vary in their
levels on the Depth of Knowledge (DOK) scale. All levels of questions require basic
literacy skills, but as the levels increase so does the expectation for both content
knowledge and literacy abilities. If a student does not have the literacy skills necessary to
process the facts, the student will not be able to accurately answer the question
independent of their level of content knowledge.
An achievement gap among various subpopulations on standardized tests, such as
the SC EOCEP for biology, is a large concern. In SC, the 2017 EOC state score report
scores show that the mean score for males was 74.2% and for females it was 76.4%
(South Carolina Department of Education, 2017). A more significant difference is shown
in the mean scores for disabled students. The mean score for disabled students was 54.8%
compared to 77.8% for non-disabled students (South Carolina Department of Education,
2017). Looking at Limited English Proficient (LEP) students, the mean score for LEP
students in SC was 67.3% while non-LEP students had a mean score of 75.7% (South
Carolina Department of Education, 2017).
34
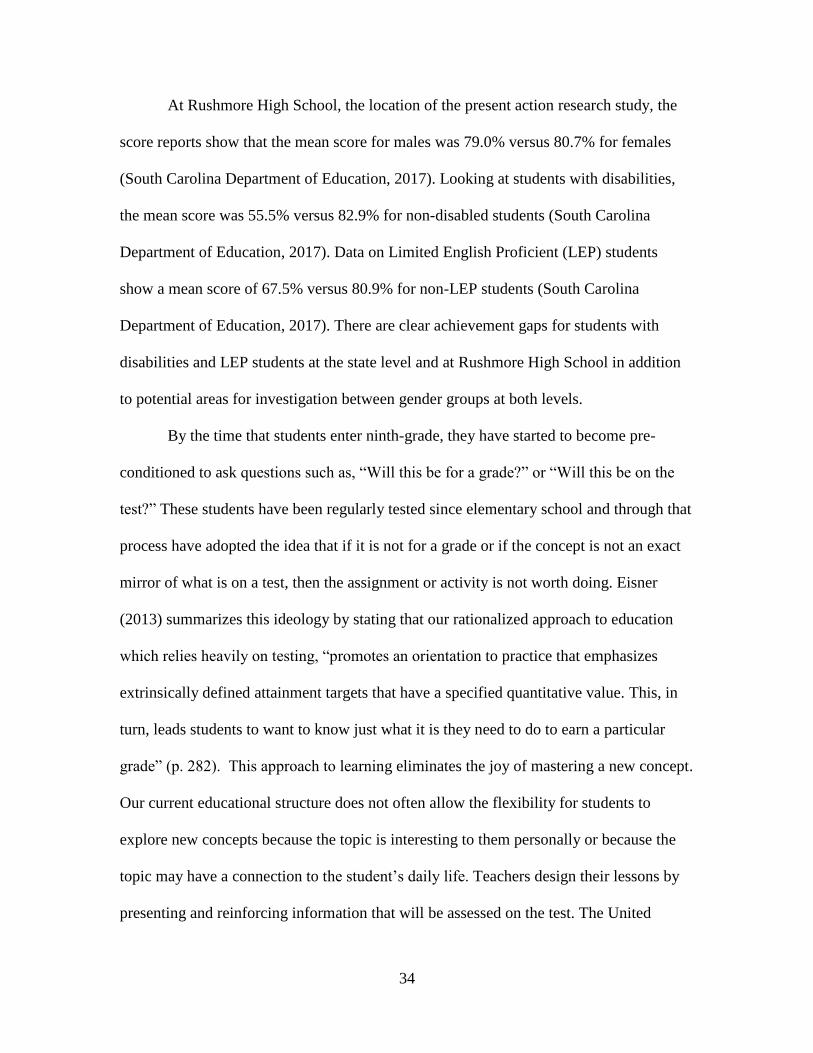
At Rushmore High School, the location of the present action research study, the
score reports show that the mean score for males was 79.0% versus 80.7% for females
(South Carolina Department of Education, 2017). Looking at students with disabilities,
the mean score was 55.5% versus 82.9% for non-disabled students (South Carolina
Department of Education, 2017). Data on Limited English Proficient (LEP) students
show a mean score of 67.5% versus 80.9% for non-LEP students (South Carolina
Department of Education, 2017). There are clear achievement gaps for students with
disabilities and LEP students at the state level and at Rushmore High School in addition
to potential areas for investigation between gender groups at both levels.
By the time that students enter ninth-grade, they have started to become pre-
conditioned to ask questions such as, “Will this be for a grade?” or “Will this be on the
test?” These students have been regularly tested since elementary school and through that
process have adopted the idea that if it is not for a grade or if the concept is not an exact
mirror of what is on a test, then the assignment or activity is not worth doing. Eisner
(2013) summarizes this ideology by stating that our rationalized approach to education
which relies heavily on testing, “promotes an orientation to practice that emphasizes
extrinsically defined attainment targets that have a specified quantitative value. This, in
turn, leads students to want to know just what it is they need to do to earn a particular
grade” (p. 282). This approach to learning eliminates the joy of mastering a new concept.
Our current educational structure does not often allow the flexibility for students to
explore new concepts because the topic is interesting to them personally or because the
topic may have a connection to the student’s daily life. Teachers design their lessons by
presenting and reinforcing information that will be assessed on the test. The United
35
States’ focus on high-stakes tests, such as the SC EOCEP, removes student interest from
the educational equation. Eisner (2013) emphasizes this by stating, “Prediction is not easy
when what the outcome is going to be is a function not only of what is introduced in the
situation but also of what a student makes of what has been introduced” (p. 280). As
more teachers follow the trend and narrow their curriculum to match the precise content
of each high-stakes test, students’ positive experiences and connections with the material
become less frequent.
Unfortunately, school districts will not easily change these policies. Eisner
(2013) sheds light on the sad fact that, “Education has evolved from a form of human
development serving personal and civic needs into a product our nation produces to
compete in a global economy. Schools have become places to mass produce this product”
(p. 282). Not only are students unique in their interests and learning styles, but teachers
also have varying personalities and strengths. Analysis of test scores leads schools to lock
teachers into certain teaching formats because the methods are “proven.” The influx of
high-stakes testing in the United States may have the goal of producing a certain product,
but the road to reaching that goal must allow room for individuality for it to be successful
for both teachers and their students. This design of the present action research study was
structured to work within the confines of the current education system while continuing
to promote the importance of individuality for students and teachers.
Action Research Methodology
The present action research study took place at Rushmore High School during the
spring of 2018. The teacher-researcher introduced Larson’s (2014b) Generative
Vocabulary Matrix (GVM) after students took a benchmark test to assess student mastery
36
of all standards required to be taught in a ninth-grade biology course. Larson (2014b)
promotes the use of four major steps to integrate the GVM into any content area:
initiating the matrix, conceptualizing the matrix, enriching the matrix, and accessing the
matrix. These steps were implemented throughout the study.
Larson’s (2014b) GVM was used in both the teacher-researcher’s ninth-grade
biology classes. The data for the present action research study was both quantitative and
qualitative. The core data came from a test that is currently administered to all high
school biology students, the South Carolina End-of-Course Examination Program
(EOCEP) for biology. This test was conducted approximately eight weeks after the
benchmark test. The benchmark test, unit tests, and a teacher-researcher observation
journal were used to triangulate the standardized test data. Data were compared to the
results of similar students on the SC EOCEP for biology from the previous year.
Summary of Research
The present action research study is based on principles of respected educational
theorists and grounded within a historical context. Support for the use of Larson’s
(2014b) Generative Vocabulary Matrix (GVM) is provided by research that substantiates
the positive impact of generative knowledge and the generative process, semantic maps
and discussion, and experience-based education. Larson’s (2014b) GVM builds on
research related to the importance of continuing literacy education throughout high
school and addresses concerns associated with scientific literacy among sub-populations.
The action research methodology outlines a comprehensive process to address the present
research question. This review of the literature demonstrates evidence for the merit of this
study.
37
CHAPTER 3
RESEARCH DESIGN
Introduction
The primary purpose of the present action research study was to integrate literacy
strategies into the biology classroom using Larson’s (2014b) Generative Vocabulary
Matrix (GVM). The secondary purpose was to develop an action plan based on the use of
Larson’s (2014b) GVM and the SC biology standards for instruction. The tertiary
purpose was to describe the relationship between science literacy skills and performance
on the South Carolina End-of-Course Examination Program for biology. The research
question at the center of this action research study was:
1. What is the impact of Larson’s (2014b) Generative Vocabulary Matrix
(GVM) in a high school biology course as demonstrated by students’
performance on the SC End-of-Course Examination Program?
The purpose of this chapter is to provide an overview of the methodology for the present
action research study. This chapter includes a summary of the research context and
details related to the action research design.
38
Research Context
Participant Selection
The participants in the present action research study were biology students of the
teacher-researcher at Rushmore High School during the 2017-2018 school year. The
students selected for this study were classified as ninth-grade students at the high school
level. There was no recruitment process for this study. The participants were placed in the
teacher-researcher’s classes by the school’s guidance department. The participants in the
teacher-researcher’s classes were enrolled in College Prep (CP) biology. At Rushmore
High School the term “college prep” is used for courses that are part of the standard
academic requirement for students who plan to graduate high school and then attend
college. Courses identified as honors or advanced placement (AP) would be considered
more academically rigorous versions of a specific course.
In the present action research study, the participants were students enrolled in the
teacher-researcher’s third and fourth-period classes. The teacher-researcher’s third-period
class was a traditional College Prep (CP) biology course. The teacher-researcher’s fourth-
period class was an inclusion College Prep (CP) biology class. This section was
instructed by the teacher-researcher and supported by a co-teacher who was certified in
special education. The inclusion class was created due to the number of students with
Individual Education Plans (IEPs) in that class and their specific accommodations. The
co-teacher provided instructional support during the class period based on the specific
accommodations of the students in the class. These accommodations included, but were
not limited to, small group testing, extended time on assignments, and oral administration
of tests. The teacher-researcher’s comparison classes from the 2016-2017 school year
39
were both non-inclusion, CP biology courses. The teacher-researcher’s 2017-2018 class
data was disaggregated by class period to evaluate any possible differences between the
two types of classes. Additionally, the population differences introduced with the
inclusion CP biology class were further accounted for in a breakdown of subpopulation
data, specifically students with disabilities. The demographic composition of the teacher-
researcher’s classes is noted in Table 3.1. Larson’s (2014b) Generative Vocabulary
Matrix (GVM) was used in both teacher-researcher’s biology classes during the 2017-
2018 school year.
Research Site
Rushmore High School is a public high school that enrolled approximately 2350
students, grades nine through twelve during the 2017-2018 school year. The demographic
breakdown of the RHS student body during the 2017-2018 school year was
approximately: 61.7% Caucasian, 20.6% African-American, 9.6% Hispanic, 3.3% Asian,
0.2% American Indian/Alaskan Native, 0.1% Hawaiian Native/Pacific Islander, and 4.6%
Multi-Racial. Approximately 25.7% of the student body was enrolled in the free and
reduced lunch program, 9.7% of the student body had an Individualized Education Plan
(IEP), and 4.0% had a 504 plan.
Participants
Table 3.1 provides detailed demographic information for the participants from
each of the teacher-researcher’s College Prep (CP) biology courses during the 2017-2018
school year. The third-period class was a traditional CP biology course, and the fourth-
period class was an inclusion CP biology course. Scores of students in these classes who
were classified as grades 10-12 were not included in the study. There was a ninth-grade
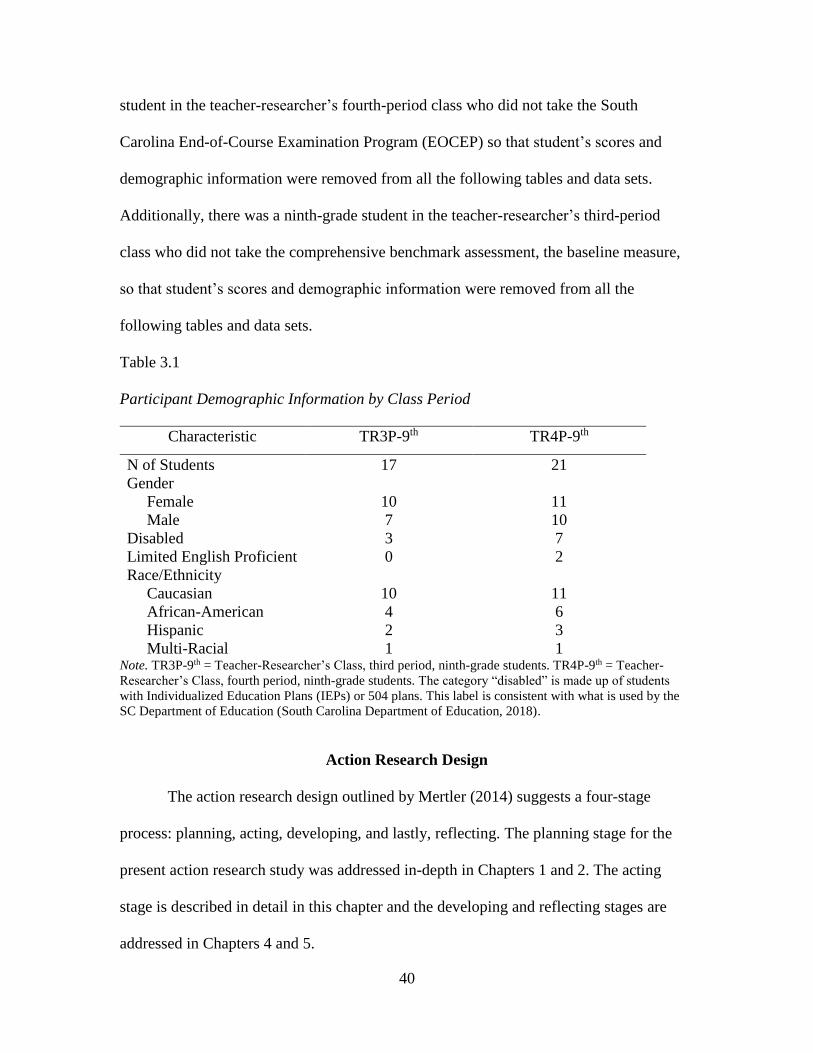
40
student in the teacher-researcher’s fourth-period class who did not take the South
Carolina End-of-Course Examination Program (EOCEP) so that student’s scores and
demographic information were removed from all the following tables and data sets.
Additionally, there was a ninth-grade student in the teacher-researcher’s third-period
class who did not take the comprehensive benchmark assessment, the baseline measure,
so that student’s scores and demographic information were removed from all the
following tables and data sets.
Table 3.1
Participant Demographic Information by Class Period
Characteristic TR3P-9th TR4P-9th
N of Students 17 21
Gender
Female
Male
10
7
11
10
Disabled 3 7
Limited English Proficient 0 2
Race/Ethnicity
Caucasian
African-American
Hispanic
Multi-Racial
10
4
2
1
11
6
3
1 Note. TR3P-9th = Teacher-Researcher’s Class, third period, ninth-grade students. TR4P-9th = Teacher-
Researcher’s Class, fourth period, ninth-grade students. The category “disabled” is made up of students
with Individualized Education Plans (IEPs) or 504 plans. This label is consistent with what is used by the
SC Department of Education (South Carolina Department of Education, 2018).
Action Research Design
The action research design outlined by Mertler (2014) suggests a four-stage
process: planning, acting, developing, and lastly, reflecting. The planning stage for the
present action research study was addressed in-depth in Chapters 1 and 2. The acting
stage is described in detail in this chapter and the developing and reflecting stages are
addressed in Chapters 4 and 5.
41
Research Design
The present action research study began with the administration of a district-
mandated benchmark test created by an education company contracted by the district
where the teacher-researcher was employed. The district provided a window for this
benchmark test to be administered. The window for the 2017-2018 school year was
between March 12th and March 30th. The teacher-researcher administered the test on
March 19th-20th, 2018. After the benchmark test was administered in both teacher-
researcher’s biology classes, integration of the Larson (2014b) Generative Vocabulary
Matrix (GVM) began. See Appendix A for the Research Design Flowchart.
Hypothesis
The teacher-researcher hypothesized that the biology classes at Rushmore High
School where students used Larson’s (2014b) Generative Vocabulary Matrix would have
higher average scores on the South Carolina End-of-Course Examination Program
(EOCEP) than the scores of similar students from the previous year.
Intervention
Larson’s (2014b) Generative Vocabulary Matrix (GVM) was implemented as the
foundation for literacy instruction in both teacher-researcher’s classes. The use of
Larson’s (2014b) GVM was limited to two classes because during the time of the data
collection the teacher-researcher also served as an instructional coach at RHS and only
taught two periods each day. The implementation of Larson’s (2014b) GVM as an
instructional strategy was not used in the previous year at RHS by the teacher-research or
by any other biology teacher at the school. Additionally, the teacher-researcher was the
only teacher utilizing Larson’s (2014b) GVM as an instructional strategy at RHS during
42
the 2017-2018 school year. The core data for this study comes from the South Carolina
End-of-Course Examination Program for biology and is supported by data from other
sources including a benchmark test, unit tests, and a teacher-researcher observation
journal.
Larson (2014b) suggests a specific protocol for implementing the GVM. This
protocol was implemented in two cycles throughout the duration of the present action
research study. The teacher-research followed Larson’s (2014b) GVM implementation
method which is described in detail in Figure 1. Larson’s (2014b) GVM protocol was
implemented in two cycles over the course of five weeks, March 21st -May 1st, 2018.
The topic for the first unit was Biological Evolution. To initiate the
implementation of Larson’s (2014b) GVM, the students participated in a trigger
experience. In this unit, the trigger experience was a lab titled “Bird Beak Adaptations.”
This lab simulated the use of four bird beaks and demonstrated how variation among
character traits allows certain species to be better suited for competition for different food
sources. The students selected key terms from the background information and the lab
itself to begin creating their GVM. The students wrote the words on sticky notes and
placed them on chart paper. As part of the lab reflections, students were instructed to
select a minimum of two terms from the GVM to answer the question “How does this lab
simulation provide support for the theory of evolution?” The following day, the students
continued to build the GVM and make connections between key vocabulary terms. The
teacher-researcher led her classes in reading an article on a study of Darwin’s finches.
During the reading, there was discussion, and the students continued to select key terms
for the GVM. The teacher-researcher was absent for several days attending an
43
educational conference, so the students watched pre-recorded video lectures and
completed guided notes to enrich their understanding of the topic.
Upon the teacher-researcher's return, the students worked to conceptualize and
enrich the matrix. The teacher-researcher took the terms from the chart paper and typed
them into a digital format that could be manipulated using the class Promethean board.
The teacher-researcher shared the main topic, inquiry questions, and learning goals. The
teacher-researcher guided the students in using their prior knowledge and guided notes to
discuss and create categories for the words. Students also used their guided notes to add
additional words to the digital GVM. At the end of the lesson, the students were asked to
apply their understanding of the topic to a worksheet on evolutionary patterns. The
students accessed the GVM several times in the following days. The students completed
short writing assignments, multiple-choice assessments, a project, and discussions that
referenced the GVM.
The topic for the second unit was Ecosystem Dynamics. In the unit on Ecosystem
Dynamics, the trigger experience was an activity called “Oh Deer” that simulated the
impact of limiting factors on an ecosystem. In this activity, students are assigned the task
of being deer, food, water, or shelter. The deer stand on one side of the designated
activity area and the resources stand on the other side. The deer and resources turn their
backs to one another. The deer decide what resource they need during each round. Once
the decision has been made, the deer and resources face each other and try to pair up. If
the deer do not find the resource they were looking for, they die and become a resource.
If the resources do not find a deer, they stay a resource. If the deer find their selected
resource, they stay a deer and the resource also becomes a deer.
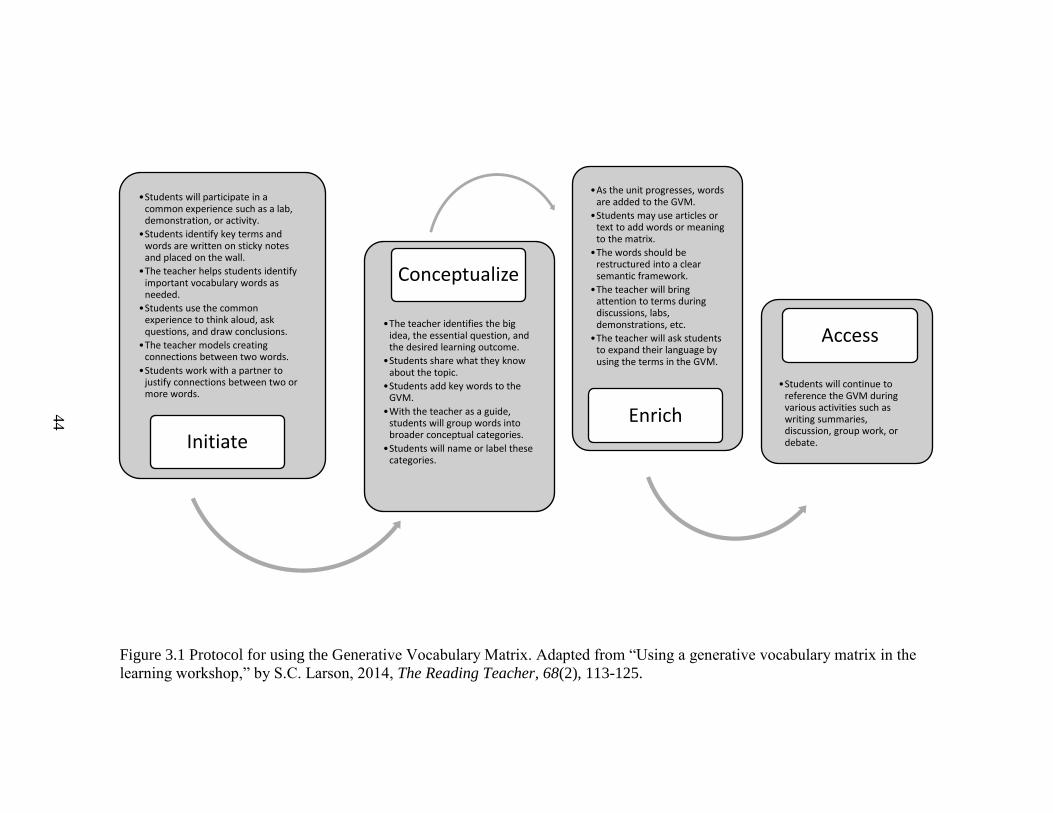
44
Figure 3.1 Protocol for using the Generative Vocabulary Matrix. Adapted from “Using a generative vocabulary matrix in the
learning workshop,” by S.C. Larson, 2014, The Reading Teacher, 68(2), 113-125.
•Students will participate in a common experience such as a lab, demonstration, or activity.
•Students identify key terms and words are written on sticky notes and placed on the wall.
•The teacher helps students identify important vocabulary words as needed.
•Students use the common experience to think aloud, ask questions, and draw conclusions.
•The teacher models creating connections between two words.
•Students work with a partner to justify connections between two or more words.
Initiate
•The teacher identifies the big idea, the essential question, and the desired learning outcome.
•Students share what they know about the topic.
•Students add key words to the GVM.
•With the teacher as a guide, students will group words into broader conceptual categories.
•Students will name or label these categories.
Conceptualize
•As the unit progresses, words are added to the GVM.
•Students may use articles or text to add words or meaning to the matrix.
•The words should be restructured into a clear semantic framework.
•The teacher will bring attention to terms during discussions, labs, demonstrations, etc.
•The teacher will ask students to expand their language by using the terms in the GVM.
Enrich
•Students will continue to reference the GVM during various activities such as writing summaries, discussion, group work, or debate.
Access
45
Following this activity, the students used key terms from the activity to begin
creating their GVM. The teacher-researcher provided the students the main topic and
guiding questions. The students used this information to identify keywords on sticky
notes and place them on chart paper. In this unit, the students seemed to feel more
comfortable with the process of creating the GVM. The students worked to initiate and
conceptualize the GVM almost simultaneously. The students began grouping key terms
as they supplied them. In the following days, the teacher-researcher converted the GVM
into a digital format. The teacher-researcher guided the students in discussion and lecture.
During this time the students continued to conceptualize and enrich the matrix. The
students accessed the GVM to complete reflections forms, create concept maps on small
segments of information, and participate in discussions. See Appendix B for images and
diagrams created during the implementation of the GVM.
Following two complete GVM cycles, the teacher-researcher’s classes
participated in a mini-unit on the remaining indicators for the Ecosystem Dynamics
standard and then completed a brief review of most of the Biology 1 Standards before the
South Carolina End-of-Course Examination Program (EOCEP) for biology. This mini-
unit and review were not specifically evaluated as part of this study because Larson’s
(2014b) GVM was not used during this instructional period. The time constraints at this
point in the year did not allow for the implementation of Larson’s (2014b) GVM during
the mini-unit and review, but there were still some indicators that needed to be addressed,
and the teacher-researcher wanted to provide a review of concepts from earlier in the year
before the SC EOCEP. The SC EOCEP was administered in the teacher-researcher’s
classes on May 23rd and May 24th, 2018.

46
Data Collection
The data collection for this action research study was both qualitative and
quantitative. The quantitative data is presented using descriptive statistics to analyze the
results. The qualitative data is presented in a narrative format. In this study, the scores of
the teacher-researcher’s students on the South Carolina End-of-Course Examination
Program (EOCEP) for biology are compared to the results of similar students from the
previous year. The scores from the 2017 and 2018 administrations of the SC EOCEP are
reported for all ninth-grade students enrolled in College Prep biology at Rushmore High
School (RHS) and used as comparison data. Students in the tenth, eleventh, and twelfth-
grade were eliminated from the analysis of the SC EOCEP due to the small sample
population and the potential for conflicting variables such as repeating the course or
previous enrollment in preparatory coursework (e.g., Environmental Studies). The
teacher-researcher categorized the data from the SC EOCEP into subpopulations to
examine potential correlations. The core data for this study comes from the SC EOCEP
for biology but is supported by data from other sources including a comprehensive
benchmark test, unit tests, and a teacher-researcher observation journal. Additionally, the
SC state averages on the SC EOCEP for biology from the 2017 and 2018 administrations
are reported to determine if there were significant variances across the state between the
two administrations of this assessment.
Variables
The independent variable in the present action research study was the use of
Larson’s (2014b) Generative Vocabulary Matrix (GVM). The dependent variable was
students' performance on the South Carolina End-of-Course Examination Program
47
(EOCEP). The teacher-researcher had two class periods, third and fourth. On a traditional
day, third period took place from 10:40am-11:30 am and fourth period took place from
11:35am-12:30 pm. The students participating in the present action research study were
ninth-grade students enrolled in the teacher-researcher's biology classes. Data was not
used for students in tenth, eleventh, or twelfth-grade who were enrolled in the teacher-
researcher’s classes.
Assessments
Benchmark Assessment
The benchmark test was generated by an education company contracted by the
district where the teacher-researcher was employed. The benchmark test was designed to
mimic the South Carolina End-of-Course Examination Program (EOCEP) for biology.
The education company that created the benchmark test utilized the SC state-released
blueprint for the SC EOCEP for biology and the SC standards for biology to generate
their assessment. The education company that created the benchmark test boasts of high
accuracy in predicting scores on SC standardized assessments using their benchmark
tests. The benchmark test covered all the standards included in the SC Biology 1
curriculum. The test was composed of 60 selected-response questions. The test was
administered through an online platform. The students took the assessment utilizing
school provided devices (Chromebooks). The teacher-researcher’s classes had two, 50-
minute class periods to complete the assessment. The assessment was given to both
classes on March 19th-20th, 2018.
48
Unit Tests
The unit tests were created by the teacher-researcher using a question bank
provided by the same company that made the benchmark assessments. The first unit test
covered content on SC Standard B5: Biological Evolution (Performance Indicators 1-5)
and the second test covered content on SC Standard HB6: Ecosystem Dynamics
(Performance Indicators A1, A2, and C1). The Biological Evolution (Performance
Indicators 1-5) test consisted of 35 selected response questions. The Ecosystem
Dynamics (Performance Indicators A1, A2, and C1) test consisted of 30 selected
response questions. The tests were given on paper, and each student was provided with a
bubble sheet to record their answers. Students could write on the test as needed, but only
responses recorded on the bubble sheet were graded (unless an IEP has other
requirements). The unit tests were designed to be completed in one, 50-minute class
period. The Biological Evolution unit test, performance indicators 1-5, was given on
April 10th, 2018. The Ecosystem Dynamics unit test, performance indicators A1, A2, and
C1, was given on May 1st, 2018.
Observations
The teacher-researcher completed an observation journal. The observation journal
included unstructured, narrative reflections generated throughout the study. Additionally,
the journal was supplemented with images of the various stages of creation and revision
of the Generative Vocabulary Matrix (see Appendix B). Journal entries were made a
minimum of four times during each unit. The format of these observations allowed the
teacher-researcher to gather data about student behaviors and helped clarify results on
49
summative assessments (benchmark exam, unit tests, and the South Carolina End-of-
Course Examination Program).
South Carolina End-of-Course Examination Program
The South Carolina End-of-Course Examination Program (EOCEP) for biology
was created by the SC Department of Education. The state utilized the released blueprint
for the SC EOCEP for biology and the SC standards for biology to generate their
assessment. The SC EOCEP covered content related to all the SC Biology 1 Standards.
The SC EOCEP consisted of 66 questions. According to documents released by the SC
Department of Education, the test “include[d] two scenario sets. A scenario set consists
of a scenario (scientific text, graph, or data) with three test items related to the scenario”
(South Carolina Department of Education, 2016, p.1). The test also had two to six
technology-enhanced items. The questions varied in their levels on the Depth of
Knowledge (DOK) scale. Students took the assessment using their Chromebooks through
a secure, online platform. Students were not limited to a specific timeframe in which to
complete the assessment.
The SC EOCEP was given to the teacher-researcher’s third-period class on May
23rd and her fourth-period class on May 24th, 2018. Some students took the exam on
make-up days after these assigned dates. For comparison purposes, data from the 2016-
2017 administration of the SC EOCEP was used, which was administered May 15th
through May 18th.
Data Analysis
The analysis for the present action research study includes the use of descriptive
statistics. Mean scores for the comprehensive benchmark assessment, unit tests, and the
50
South Carolina End-of-Course Examination Program (EOCEP) were calculated and
reported. The goal of using these statistics was to demonstrate the performance of a group
of students in addition to identifying trends in subpopulations (Mertler, 2014). The
teacher-researcher utilized Microsoft Excel to calculate the data. The results are presented
in Chapter 4 using narrative, tables, and graphs.
Comprehensive Benchmark Assessment
The teacher-researcher collected and analyzed data from the March 2018
administration of the comprehensive benchmark assessment for all students at Rushmore
High School (RHS) enrolled in College Prep (CP) biology. The teacher-researcher
received a report from the education company that created the benchmark test that
provided the average scores, projected percent proficient, and average suggested marks
for each class period. The average score is a raw score on the benchmark assessment, in
other words, the percentage of questions answered correctly. The projected percent
proficient is calculated from each student’s projected achievement level which is reported
on a scale from one to five. Level five denotes superior command, and level one denotes
limited command of the standards and performance indicators being assessed. The
projected percent proficient is given for the class and is calculated from the number of
students who scored at a level three or above. The suggested marks are a prediction,
based on performance on the benchmark assessment, of students’ scores on the South
Carolina End-of-Course Examination Program for biology.
The mean scores for these three measures on the comprehensive benchmark
assessment were calculated and reported for each of the teacher-researcher’s class periods
and all students at RHS enrolled in CP biology. The teacher-researcher also calculated the
51
percent difference between the teacher-researcher’s class averages for each data point,
and the averages for all students at RHS enrolled in CP biology. This assessment served
as a baseline to compare the teacher-researcher’s class performance with students at the
same school with different teachers, before the introduction of Larson’s (2014b)
Generative Vocabulary Matrix.
Unit Tests
The unit test data were used to compare how well individual students did on the unit
test in relation to their performance on the same standards on the comprehensive
benchmark assessment. This data was then used to calculate mean class performance for
each measurement and demonstrate the class growth on each of the units taught as part of
the present action research study. These steps were followed:
1. The teacher-researcher randomly assigned each student a three-digit number
to protect their identity. The key to this code was not publicly shared.
2. The company that created the benchmark assessment provided an item
analysis that showed which standard and performance indicator were assessed
by each question on the benchmark assessment. The teacher-researcher
identified the questions that were associated with the standards and
performance indicators assessed on each unit test.
3. The teacher-researcher created a Microsoft Excel spreadsheet that included a
column for students’ coded IDs and two columns for reporting each of the
students’ data points from the benchmark assessment.
52
4. Using the data from the item analysis, the teacher-researcher calculated a
percent correct for each student for the standard and indicators addressed on
each of the unit tests.
5. The teacher-researcher inserted a column for each unit test in the Microsoft
Excel spreadsheet that was created for analysis after the comprehensive
benchmark assessment. The column for the unit test was inserted next to the
data from the comprehensive benchmark assessment that corresponded to the
same standards.
6. The teacher-researcher inputted each student’s percent correct for each of the
unit tests.
7. The teacher-researcher calculated and compared the average percent correct
on the selected questions from the comprehensive benchmark assessment and
the average percent correct for the corresponding unit test for each class.
8. The two data points for each unit and each class were reported to demonstrate
growth (or a lack of growth) after the implementation of Larson’s (2014b)
Generative Vocabulary Matrix.
Observations
The teacher-researcher’s observations provided descriptions of events taking
place in the classroom during the creation and use of Larson’s (2014b) Generative
Vocabulary Matrix. The teacher-researcher utilized the inductive analysis model outlined
in Mertler’s (2014) book: Action Research: Improving Schools and Empowering
Educators. The following steps were followed:

53
1. When reading through the observational notes, the teacher-researcher looked
for patterns and themes. Based on these themes, the teacher-researcher began
creating coding categories.
2. After developing the coding categories, the teacher-researcher re-read the
observational journal and assigned code labels to various parts of the
observation journal keeping in mind the original research question. This
process was repeated and re-evaluated multiple times until the teacher-
researcher was content with the system and its product.
3. The teacher-researcher separated the information from each category by
typing the information into different sections of a table, titled for each
category.
4. The teacher-researcher drew connections between the themes and patterns that
emerged and how those topics related to the original research question.
5. The teacher-researcher examined the notes to see if there were any patterns or
themes that conflicted with other results or analysis.
6. The teacher-researcher explored the significance of the connections between
the observations and the research question. Additionally, the teacher-research
evaluated the significance of any observational themes that provided
conflicting data. The teacher-researcher wrote a summary reflection of this
information.
South Carolina End-of-Course Examination Program
The teacher-researcher collected the test scores for all teachers at Rushmore High
School (RHS) from the 2017 and 2018 administrations of the South Carolina End-of-

54
Course Examination Program (EOCEP). This data was provided by the school district’s
Department of Accountability and Quality Assurance. The teacher calculated the mean
scores for the following groups and subpopulations for the 2017 and 2018 administrations
of the SC EOCEP:
1. All ninth-grade students at RHS enrolled CP biology
2. All ninth-grade students at RHS enrolled in CP biology with an IEP or 504 plan
3. All ninth-grade students at RHS enrolled in CP biology with an ELL plan
4. All ninth-grade male students at RHS enrolled in CP biology
5. All ninth-grade female students at RHS enrolled in CP biology
6. Ninth-grade students at RHS enrolled in the teacher-researcher’s CP biology class
7. Ninth-grade students at RHS enrolled in the teacher-researcher’s CP biology class
with an IEP or 504 plan
8. Ninth-grade students at RHS enrolled in the teacher-researcher’s CP biology class
with an ELL plan
9. Ninth-grade male students at RHS enrolled in the teacher-researcher’s CP biology
class
10. Ninth-grade female students at RHS enrolled in the teacher-researcher’s CP
biology class
The teacher-researcher also calculated the percentage of students in the following
categories who received a passing score on the SC EOCEP (60-100%):
11. All ninth-grade students at RHS enrolled in CP biology
12. All ninth-grade students at RHS enrolled in CP biology with an IEP or 504 plan
13. All ninth-grade students at RHS enrolled in CP biology with an ELL plan
55
14. All ninth-grade male students at RHS enrolled in CP biology
15. All ninth-grade female students at RHS enrolled in CP biology
16. Ninth-grade students at RHS enrolled in the teacher-researcher’s CP biology class
17. Ninth-grade students at RHS enrolled in the teacher-researcher’s CP biology class
with an IEP or 504 plan
18. Ninth-grade students at RHS enrolled in the teacher-researcher’s CP biology class
with an ELL plan
19. Ninth-grade male students at RHS enrolled in the teacher-researcher’s CP biology
class
20. Ninth-grade female students at RHS enrolled in the teacher-researcher’s CP
biology class
The teacher-researcher used this data to determine trends or correlations among the data
sets and used that information to evaluate the impact of the use of Larson’s (2014b)
Generative Vocabulary Matrix on the students’ standardized test scores. The teacher-
researcher also included the SC state mean scores for the 2017 and 2018 SC EOCEP for
biology for the following populations:
1. All students
2. Disabled
3. Limited English Proficient (LEP)
4. Male
5. Female
The SC state category “disabled” encompasses students with Individualized Education
Plans (IEPs) and 504 plans. The SC state category “Limited English Proficient” would
56
include students with ELL plans. The SC state scores were compared from one year to
the next to determine if there were any significant changes in scores between the two
administrations of the examination. The difference in scores between the two
administrations was taken into consideration when evaluating the scores from RHS.
Ethical Considerations
In an action research study, it is important to consider the participants involved
and the ethical obligations the teacher-researcher owes to participants. This action
research study was conducted with students in the teacher-researcher’s biology classes at
Rushmore High School. As the instructor, the teacher-researcher was privy to the test
scores of each of her students. This data was a central part of the study, and therefore it is
important to note that ethically, the teacher-researcher was permitted to use these test
results as data in the present action research study. While this study used the test results
of students, the privacy of individual students was protected. To protect the
confidentiality of the students, the teacher-research, “limit[ed] detailed descriptions [and]
remov[ed] explanations of characteristics that are not essential to the nature of the
research” (Metler, 2014, p.233). Additionally, the teacher-research sent home a parent
notification letter before the start of the data collection period. This letter provided an
overview of the study, potential risks, and benefits to participants, and the option for
parents to withdraw their student from participating in the study. See Appendix C for
Parent Notification Letter.
The literature review in Chapter 2 of this dissertation includes information on
student subpopulations that include racial, ethnic, and gender differences. As

57
recommended by Metler (2014), when analyzing and reporting data on these topics, the
teacher-researcher made every effort to eliminate any inherent biases she might have. The
results of this study hold the most meaning if data related to ethnic, racial, and gender
differences are presented in a factual, unbiased format that is respectful of all students
and people groups represented.
Summary and Conclusion
It might be uncommon for a teacher with an undergraduate degree in biology and
a master’s degree in teaching science to plan an action research study centered on
integrating literacy in science. However, the teacher-researcher believes that her
background and extensive research provide compelling evidence to support the
importance of this study. As a conscientious educator, the teacher-researcher cannot turn
a blind eye to what her experience has conclusively shown. The teacher-researcher has
observed an obvious lack of literacy skills among high school students and has seen the
detrimental effect that gap of knowledge has on their achievement in the biology
classroom. The present action-research study integrated literacy fundamentals with the
biology curriculum with the goal of increasing students’ scores on the South Carolina
End-of-Course Examination Program. The goal is that students not only benefit from the
improved test scores but also improve their literacy abilities and develop greater
confidence in their academic capabilities as they progress through their high school
career.

58
CHAPTER 4
PRESENTATION AND ANALYSIS OF DATA
Overview
Problem of Practice
After four years of teaching College Prep (CP) biology, the teacher-researcher felt
that her students were not performing at their optimal ability on the state-mandated
standardized test for biology. The teacher-researcher observed that her students often
found it very difficult to learn and retain the concepts taught in the high school biology
classroom because of a lack of science literacy skills. Science literacy skills refer to a
student’s ability to read and interpret scientific text and write about science-related
concepts. To address these concerns, the teacher-researcher utilized Larson’s (2014b)
Generative Vocabulary Matrix (GVM) as a literacy strategy to determine the relationship
between integrating literacy strategies in the biology classroom and performance on the
South Carolina End-of-Course Examination Program (EOCEP) for biology. The teacher-
researcher implemented Larson’s (2014b) GVM as a literacy strategy with ninth-grade
biology students in the spring of 2018.
The SC EOCEP for biology is a high-stakes test which accounts for 20% of each
student’s overall course average and consequently has the potential to impact students’
overall grade point averages (GPA). Additionally, the passage rate on this test is
published in the public domain on the SC Department of Education’s website. This
59
information can be used by parents and community members to evaluate a school’s merit
and achievement level. Based on these factors, the Problem of Practice (PoP) is identified
as a need for increased student achievement on the SC EOCEP for biology due to the
potential impact this test has on students’ overall course averages, their grade point
averages (GPA), and the consequences these results may have on public opinion of the
present school. This identified PoP is the subject of the present action research study.
Significance of Study
The teacher-researcher developed the present action research study with the goal
of providing students with science instruction that supports students in achieving an
optimal score on the South Carolina End-of-Course Examination Program (EOCEP). The
present action research study seeks to produce statistical relevance related to improving
standardized test scores by increasing scientific literacy skills using Larson’s (2014b)
Generative Vocabulary Matrix.
Data Collection Methods
The data collection for this action research study was both qualitative and
quantitative. The quantitative data are presented using descriptive statistics to analyze the
results. The qualitative data are presented in a narrative format. In this study, the scores
of the teacher-researcher’s students on the South Carolina End-of-Course Examination
Program (EOCEP) for biology are compared to the results of similar students from the
previous year. The scores from the 2017 and 2018 administrations of the SC EOCEP are
reported for all ninth-grade students enrolled in College Prep (CP) biology at Rushmore
High School (RHS) and used as comparison data. The teacher-researcher categorized this
data into subpopulations to examine potential correlations. The core data for this study
60
comes from the SC EOCEP for biology but is supported by data from other sources
including a benchmark test, unit tests, and the teacher-researcher’s observation journal.
Additionally, the SC state averages on the SC EOCEP for biology for the 2016-2017 and
2017-2018 academic years are reported to show the variances across the state between
the two administrations of this examination.
Sample Characteristics
The research site is a public high school that enrolled approximately 2350
students, grades nine through twelve during the 2017-2018 school year. Table 3.1 in
Chapter 3 provides detailed demographic information for the participants from each of
the teacher-researcher’s College Prep (CP) biology classes during the 2017-2018 school
year. The teacher-researcher’s third-period class was a traditional CP biology class, and
her fourth-period class was an inclusion CP biology class.
Intervention Strategy
Larson’s (2014b) Generative Vocabulary Matrix (GVM) was implemented as the
foundation for literacy instruction in both teacher-researcher’s classes. Larson (2014b)
suggests a specific protocol for implementing the GVM (see Figure 1). This protocol was
implemented in two cycles throughout five weeks.
General Findings and Results
The following tables, graphs, and narratives summarize the data collected for the
present action research study. This study seeks to answer the research question:
61
1. What is the impact of Larson’s (2014b) Generative Vocabulary Matrix (GVM) in
a high school biology course as demonstrated by students’ performance on the SC
End-of-Course Examination Program?
The teacher-researcher established three purposes for conducting the present action
research study. The primary purpose was to integrate literacy strategies into the biology
classroom using Larson’s (2014b) Generative Vocabulary Matrix (GVM). The secondary
purpose was to develop an action plan based on the use of the GVM and the South
Carolina biology standards for instruction. The tertiary purpose was to describe the
relationship between science literacy skills and performance on the SC End-of-Course
Examination Program for biology. The primary and secondary purposes were addressed
in Chapter 3, and the tertiary purpose is discussed in this chapter.
Comprehensive Benchmark Assessment
The comprehensive benchmark assessment served as the baseline measure for this
study. The teacher-researcher used this measurement to compare her students’
performance to all Rushmore High School (RHS) students enrolled in CP biology during
the 2017-2018 school year. The comprehensive benchmark assessment was administered
to biology students in the teacher-researcher’s classes on March 19th-20th, 2018, before
the implementation of Larson’s (2014b) Generative Vocabulary Matrix (GVM). The
comprehensive benchmark assessment was composed of 60 selected-response questions
and was designed to evaluate students’ understanding of all Biology I standards.
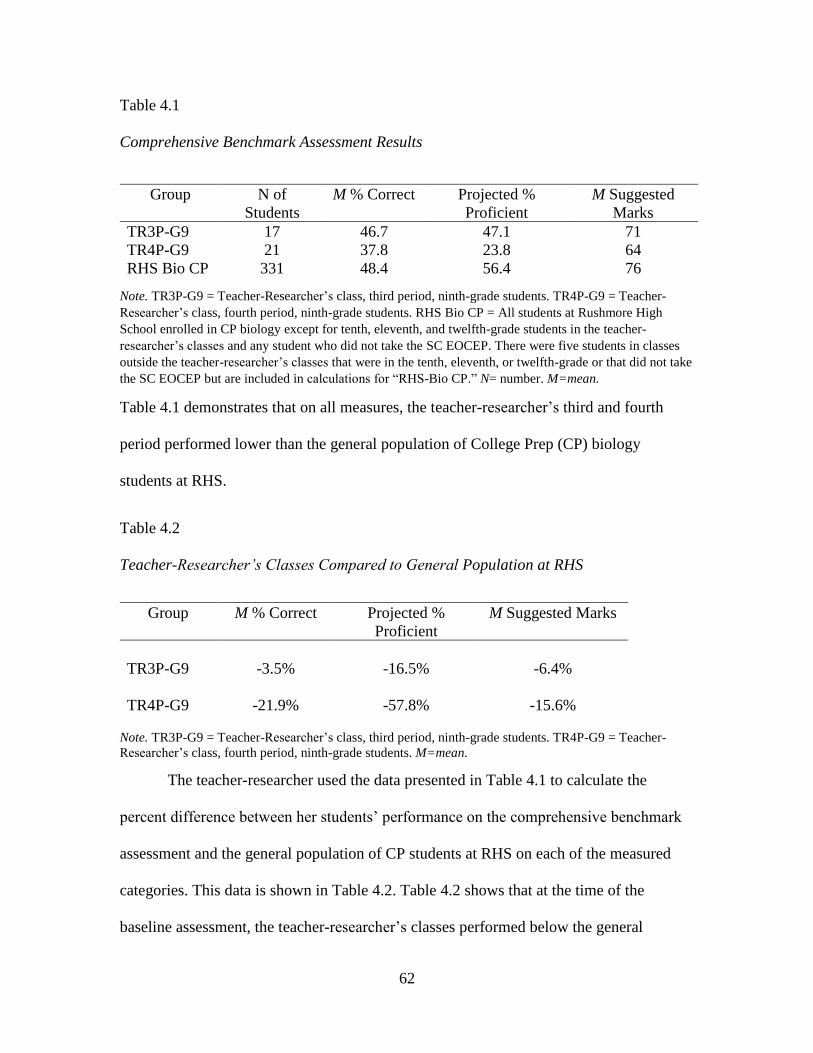
62
Table 4.1
Comprehensive Benchmark Assessment Results
Group N of
Students
M % Correct Projected %
Proficient
M Suggested
Marks
TR3P-G9 17 46.7 47.1 71 TR4P-G9 21 37.8 23.8 64 RHS Bio CP 331 48.4 56.4 76
Note. TR3P-G9 = Teacher-Researcher’s class, third period, ninth-grade students. TR4P-G9 = Teacher-
Researcher’s class, fourth period, ninth-grade students. RHS Bio CP = All students at Rushmore High
School enrolled in CP biology except for tenth, eleventh, and twelfth-grade students in the teacher-
researcher’s classes and any student who did not take the SC EOCEP. There were five students in classes
outside the teacher-researcher’s classes that were in the tenth, eleventh, or twelfth-grade or that did not take
the SC EOCEP but are included in calculations for “RHS-Bio CP.” N= number. M=mean.
Table 4.1 demonstrates that on all measures, the teacher-researcher’s third and fourth
period performed lower than the general population of College Prep (CP) biology
students at RHS.
Table 4.2
Teacher-Researcher’s Classes Compared to General Population at RHS
Group M % Correct Projected %
Proficient
M Suggested Marks
TR3P-G9 -3.5% -16.5% -6.4%
TR4P-G9 -21.9% -57.8% -15.6%
Note. TR3P-G9 = Teacher-Researcher’s class, third period, ninth-grade students. TR4P-G9 = Teacher-
Researcher’s class, fourth period, ninth-grade students. M=mean.
The teacher-researcher used the data presented in Table 4.1 to calculate the
percent difference between her students’ performance on the comprehensive benchmark
assessment and the general population of CP students at RHS on each of the measured
categories. This data is shown in Table 4.2. Table 4.2 shows that at the time of the
baseline assessment, the teacher-researcher’s classes performed below the general
63
population in all measures. Based on the design of the data provided by the education
company that created the benchmark test, the measure that most closely aligns with the
mean score on the South Carolina End-of-Course Examination Program is “M Suggested
Marks” on the comprehensive benchmark assessment. The data in Table 4.2 indicates that
prior to the implementation of Larson’s (2014b) Generative Vocabulary Matrix in the
category of “M Suggested Marks”, the teacher-researcher’s third period traditional CP
biology class performed 6.4% below the general population of ninth-grade students at
Rushmore High School (RHS) and the teacher-researcher’s fourth period inclusion CP
biology class performed 15.6% below the general population of ninth-grade students at
RHS.
Unit Tests
The unit tests administered as part of the present action research study served to
demonstrate the growth of each teacher-researcher’s classes from the time of the
comprehensive benchmark assessment to the administration of the unit tests. The
administration of each unit test followed the implementation of Larson’s (2014b)
Generative Vocabulary Matrix (GVM). The Biological Evolution unit test (Performance
Indicators 1-5) was administered on April 10th, 2018. The Ecosystem Dynamics unit test,
(Performance Indicators A1, A2, and C1) was administered on May 1st, 2018.
Biological Evolution
There were nine questions on the comprehensive benchmark assessment that
addressed the standard and performance indicators evaluated on the Biological Evolution
unit test. The percent correct for these nine questions was calculated for each student.
Each student’s percent correct on their unit test was also recorded. The individual student

64
data was used to calculate average scores for each of the teacher-researcher’s class
periods on each measure.
Table 4.3
Biological Evolution (Performance Indicators 1-5) Benchmark and Unit Test
Group Comprehensive
Benchmark M Score
Unit Test M Score % Growth
TR3P-G9 52 64 23%
TR4P-G9
35 52 48%
Note. TR3P-G9 = Teacher-Researcher’s class, third period, ninth-grade students. TR4P-G9 = Teacher-
Researcher’s class, fourth period, ninth-grade students. M=mean.
Table 4.3 shows the average growth of students in each of the teacher-researcher’s
classes from the comprehensive benchmark assessment to the Biological Evolution unit
test. Both class periods demonstrated growth after the implementation of Larson’s
(2014b) Generative Vocabulary Matrix (GVM). The data indicates that the
implementation of Larson’s (2014b) GVM resulted in more growth in the teacher-
researcher’s fourth-period class than the teacher-researcher’s third-period class.
Ecosystem Dynamics
There were five questions on the comprehensive benchmark assessment that
addressed the standard and performance indicators evaluated on the Ecosystem Dynamics
unit test. The percent correct for these five questions was calculated for each student.
Each student’s percent correct on their unit test was also recorded. The individual student
data was used to calculate average scores for each of the teacher-researcher’s class
periods on each measure.
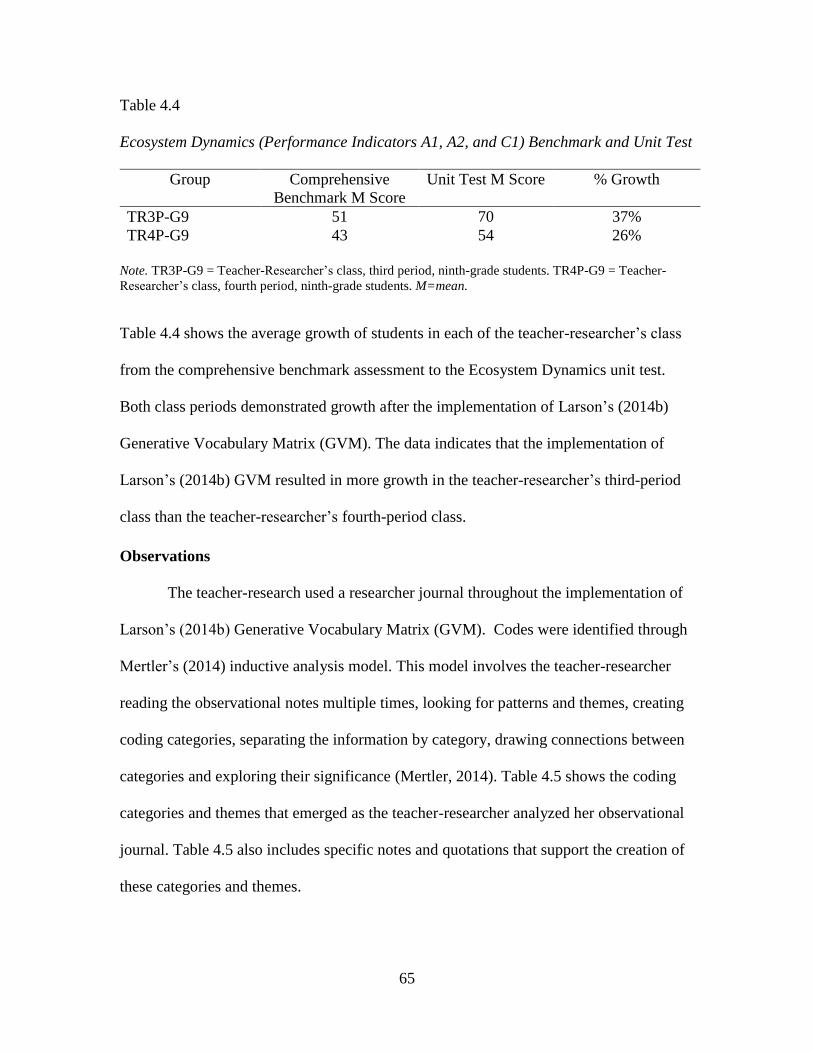
65
Table 4.4
Ecosystem Dynamics (Performance Indicators A1, A2, and C1) Benchmark and Unit Test
Group Comprehensive
Benchmark M Score
Unit Test M Score % Growth
TR3P-G9 51 70 37%
TR4P-G9
43 54 26%
Note. TR3P-G9 = Teacher-Researcher’s class, third period, ninth-grade students. TR4P-G9 = Teacher-
Researcher’s class, fourth period, ninth-grade students. M=mean.
Table 4.4 shows the average growth of students in each of the teacher-researcher’s class
from the comprehensive benchmark assessment to the Ecosystem Dynamics unit test.
Both class periods demonstrated growth after the implementation of Larson’s (2014b)
Generative Vocabulary Matrix (GVM). The data indicates that the implementation of
Larson’s (2014b) GVM resulted in more growth in the teacher-researcher’s third-period
class than the teacher-researcher’s fourth-period class.
Observations
The teacher-research used a researcher journal throughout the implementation of
Larson’s (2014b) Generative Vocabulary Matrix (GVM). Codes were identified through
Mertler’s (2014) inductive analysis model. This model involves the teacher-researcher
reading the observational notes multiple times, looking for patterns and themes, creating
coding categories, separating the information by category, drawing connections between
categories and exploring their significance (Mertler, 2014). Table 4.5 shows the coding
categories and themes that emerged as the teacher-researcher analyzed her observational
journal. Table 4.5 also includes specific notes and quotations that support the creation of
these categories and themes.
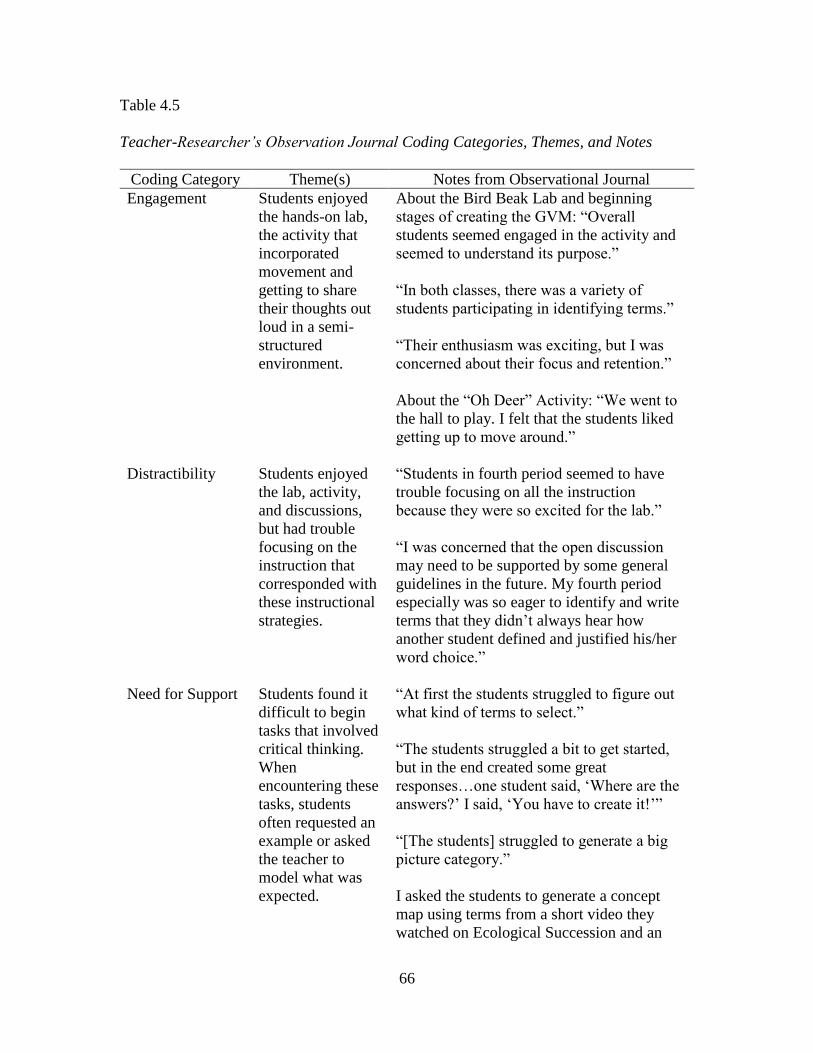
66
Table 4.5
Teacher-Researcher’s Observation Journal Coding Categories, Themes, and Notes
Coding Category Theme(s) Notes from Observational Journal
Engagement Students enjoyed
the hands-on lab,
the activity that
incorporated
movement and
getting to share
their thoughts out
loud in a semi-
structured
environment.
About the Bird Beak Lab and beginning
stages of creating the GVM: “Overall
students seemed engaged in the activity and
seemed to understand its purpose.”
“In both classes, there was a variety of
students participating in identifying terms.”
“Their enthusiasm was exciting, but I was
concerned about their focus and retention.”
About the “Oh Deer” Activity: “We went to
the hall to play. I felt that the students liked
getting up to move around.”
Distractibility Students enjoyed
the lab, activity,
and discussions,
but had trouble
focusing on the
instruction that
corresponded with
these instructional
strategies.
“Students in fourth period seemed to have
trouble focusing on all the instruction
because they were so excited for the lab.”
“I was concerned that the open discussion
may need to be supported by some general
guidelines in the future. My fourth period
especially was so eager to identify and write
terms that they didn’t always hear how
another student defined and justified his/her
word choice.”
Need for Support Students found it
difficult to begin
tasks that involved
critical thinking.
When
encountering these
tasks, students
often requested an
example or asked
the teacher to
model what was
expected.
“At first the students struggled to figure out
what kind of terms to select.”
“The students struggled a bit to get started,
but in the end created some great
responses…one student said, ‘Where are the
answers?’ I said, ‘You have to create it!’”
“[The students] struggled to generate a big
picture category.”
I asked the students to generate a concept
map using terms from a short video they
watched on Ecological Succession and an
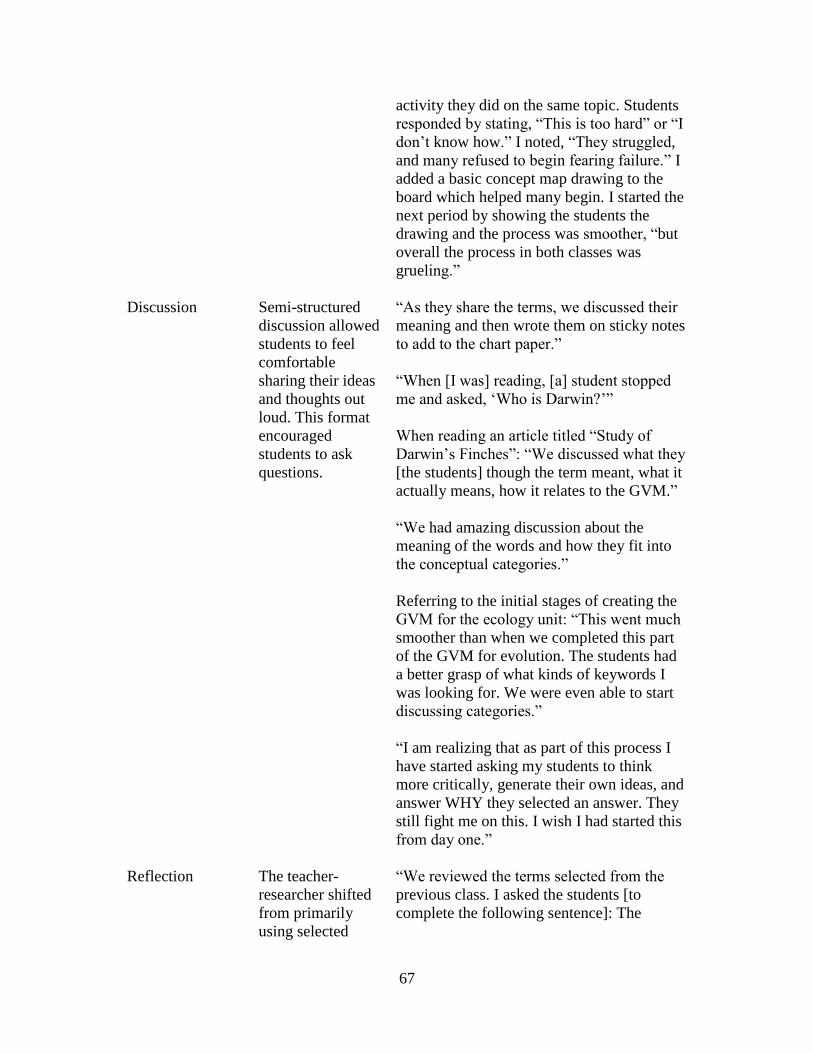
67
activity they did on the same topic. Students
responded by stating, “This is too hard” or “I
don’t know how.” I noted, “They struggled,
and many refused to begin fearing failure.” I
added a basic concept map drawing to the
board which helped many begin. I started the
next period by showing the students the
drawing and the process was smoother, “but
overall the process in both classes was
grueling.”
Discussion Semi-structured
discussion allowed
students to feel
comfortable
sharing their ideas
and thoughts out
loud. This format
encouraged
students to ask
questions.
“As they share the terms, we discussed their
meaning and then wrote them on sticky notes
to add to the chart paper.”
“When [I was] reading, [a] student stopped
me and asked, ‘Who is Darwin?’”
When reading an article titled “Study of
Darwin’s Finches”: “We discussed what they
[the students] though the term meant, what it
actually means, how it relates to the GVM.”
“We had amazing discussion about the
meaning of the words and how they fit into
the conceptual categories.”
Referring to the initial stages of creating the
GVM for the ecology unit: “This went much
smoother than when we completed this part
of the GVM for evolution. The students had
a better grasp of what kinds of keywords I
was looking for. We were even able to start
discussing categories.”
“I am realizing that as part of this process I
have started asking my students to think
more critically, generate their own ideas, and
answer WHY they selected an answer. They
still fight me on this. I wish I had started this
from day one.”
Reflection The teacher-
researcher shifted
from primarily
using selected
“We reviewed the terms selected from the
previous class. I asked the students [to
complete the following sentence]: The
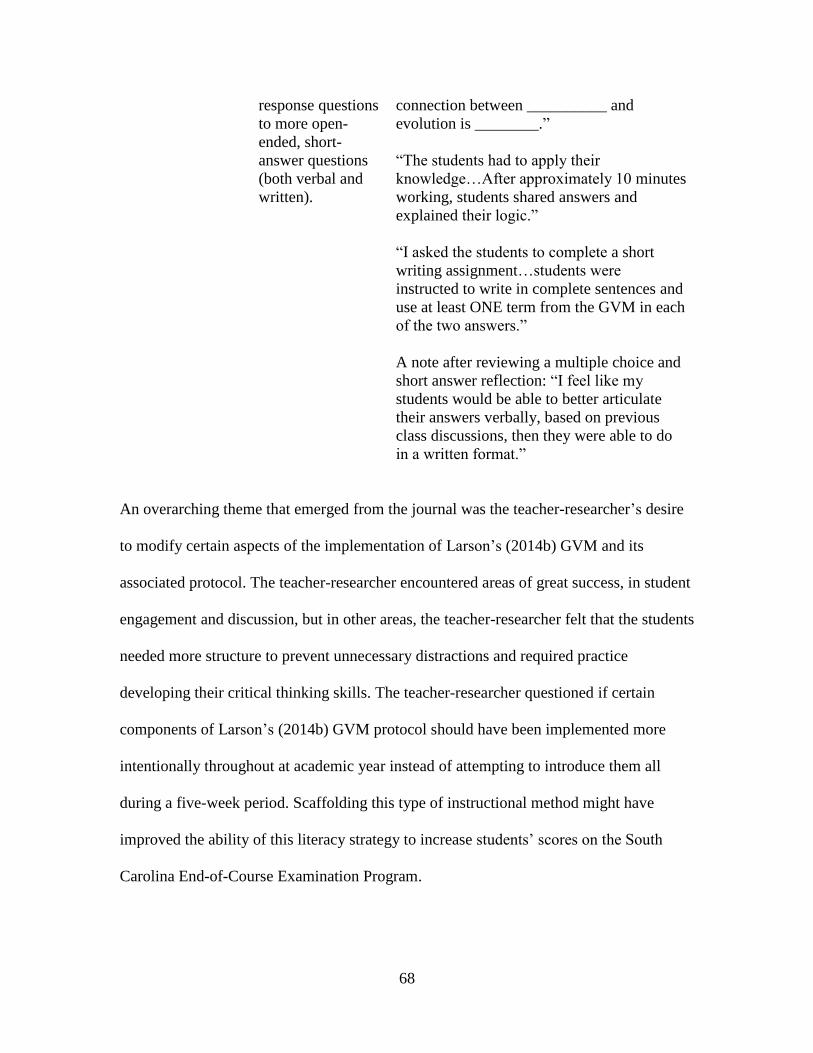
68
response questions
to more open-
ended, short-
answer questions
(both verbal and
written).
connection between __________ and
evolution is ________.”
“The students had to apply their
knowledge…After approximately 10 minutes
working, students shared answers and
explained their logic.”
“I asked the students to complete a short
writing assignment…students were
instructed to write in complete sentences and
use at least ONE term from the GVM in each
of the two answers.”
A note after reviewing a multiple choice and
short answer reflection: “I feel like my
students would be able to better articulate
their answers verbally, based on previous
class discussions, then they were able to do
in a written format.”
An overarching theme that emerged from the journal was the teacher-researcher’s desire
to modify certain aspects of the implementation of Larson’s (2014b) GVM and its
associated protocol. The teacher-researcher encountered areas of great success, in student
engagement and discussion, but in other areas, the teacher-researcher felt that the students
needed more structure to prevent unnecessary distractions and required practice
developing their critical thinking skills. The teacher-researcher questioned if certain
components of Larson’s (2014b) GVM protocol should have been implemented more
intentionally throughout at academic year instead of attempting to introduce them all
during a five-week period. Scaffolding this type of instructional method might have
improved the ability of this literacy strategy to increase students’ scores on the South
Carolina End-of-Course Examination Program.
69
South Carolina End-of-Course Examination Program
The South Carolina End-of-Course Examination Program (EOCEP) for biology
provides the data central to this study. The SC EOCEP was created by the SC Department
of Education and addressed content related to all the SC Biology 1 Standards. The 2017
SC EOCEP was administered May 15th through May 18th, 2017. The 2018 SC EOCEP
was given to the teacher-researcher’s third-period class on May 23rd and her fourth-period
class on May 24th, 2018. Some students took the exam on make-up days after these
assigned dates.
Table 4.6 displays the mean scores for all ninth-grade students enrolled in College
Prep (CP) biology at Rushmore High School at the time of the 2017 and 2018
administration of the SC EOCEP and the mean scores for all ninth-grade students
enrolled in the teacher-researcher’s CP biology classes during the 2017 and 2018
administration of the SC EOCEP. The mean scores were calculated for whole groups and
four subpopulations.
The teacher-researcher’s hypothesis for the present action research study was that
the biology classes at Rushmore High School (RHS) where students used Larson’s
(2014b) Generative Vocabulary Matrix would have higher average scores on the SC End-
of-Course Examination Program than the scores of similar students from the previous
year. The teacher-researcher’s hypothesis was supported in two subcategories in specific
class periods. Table 4.6 shows that the teacher-researcher’s fourth-period students in the
2017-2018 school year performed higher than similar students from the previous year in
the subpopulation “Limited English Proficient.” The sample size was n=8 for the
teacher-researcher’s subpopulation “Limited English Proficient” in the 2016-2017 school
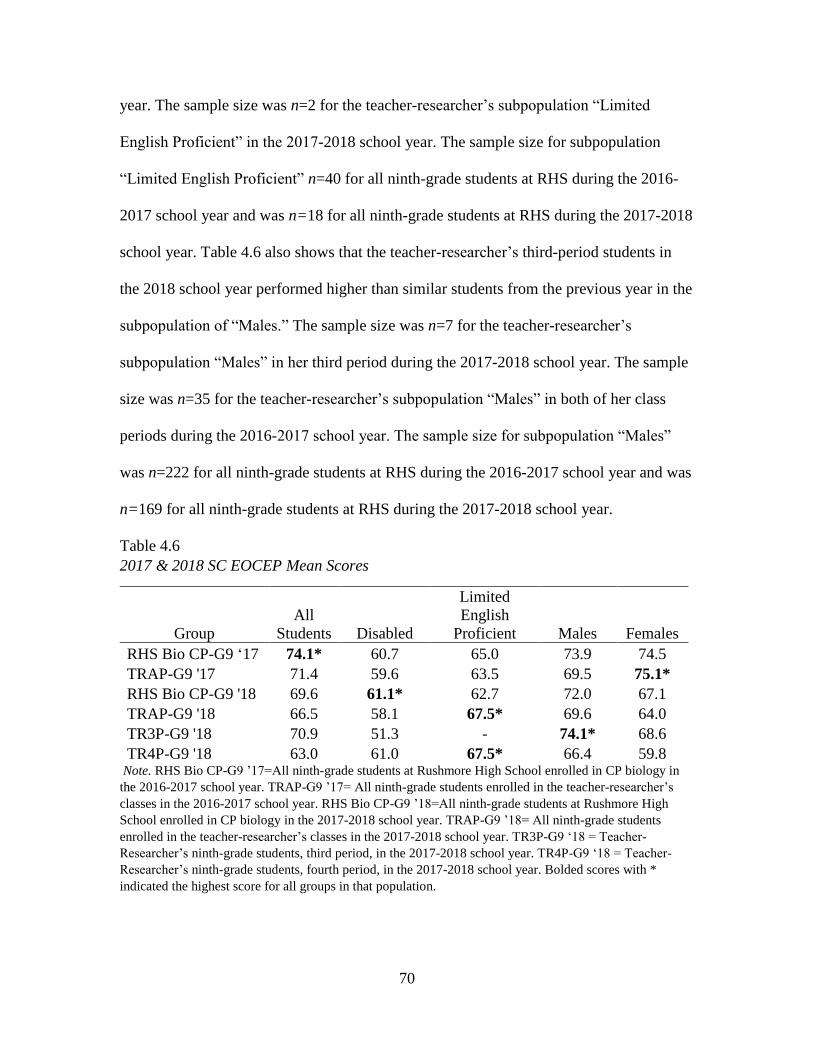
70
year. The sample size was n=2 for the teacher-researcher’s subpopulation “Limited
English Proficient” in the 2017-2018 school year. The sample size for subpopulation
“Limited English Proficient” n=40 for all ninth-grade students at RHS during the 2016-
2017 school year and was n=18 for all ninth-grade students at RHS during the 2017-2018
school year. Table 4.6 also shows that the teacher-researcher’s third-period students in
the 2018 school year performed higher than similar students from the previous year in the
subpopulation of “Males.” The sample size was n=7 for the teacher-researcher’s
subpopulation “Males” in her third period during the 2017-2018 school year. The sample
size was n=35 for the teacher-researcher’s subpopulation “Males” in both of her class
periods during the 2016-2017 school year. The sample size for subpopulation “Males”
was n=222 for all ninth-grade students at RHS during the 2016-2017 school year and was
n=169 for all ninth-grade students at RHS during the 2017-2018 school year.
Table 4.6
2017 & 2018 SC EOCEP Mean Scores
Group
All
Students Disabled
Limited
English
Proficient Males Females
RHS Bio CP-G9 ‘17 74.1* 60.7 65.0 73.9 74.5
TRAP-G9 '17 71.4 59.6 63.5 69.5 75.1*
RHS Bio CP-G9 '18 69.6 61.1* 62.7 72.0 67.1
TRAP-G9 '18 66.5 58.1 67.5* 69.6 64.0
TR3P-G9 '18 70.9 51.3 - 74.1* 68.6
TR4P-G9 '18 63.0 61.0 67.5* 66.4 59.8 Note. RHS Bio CP-G9 ’17=All ninth-grade students at Rushmore High School enrolled in CP biology in
the 2016-2017 school year. TRAP-G9 ’17= All ninth-grade students enrolled in the teacher-researcher’s
classes in the 2016-2017 school year. RHS Bio CP-G9 ’18=All ninth-grade students at Rushmore High
School enrolled in CP biology in the 2017-2018 school year. TRAP-G9 ’18= All ninth-grade students
enrolled in the teacher-researcher’s classes in the 2017-2018 school year. TR3P-G9 ‘18 = Teacher-
Researcher’s ninth-grade students, third period, in the 2017-2018 school year. TR4P-G9 ‘18 = Teacher-
Researcher’s ninth-grade students, fourth period, in the 2017-2018 school year. Bolded scores with *
indicated the highest score for all groups in that population.
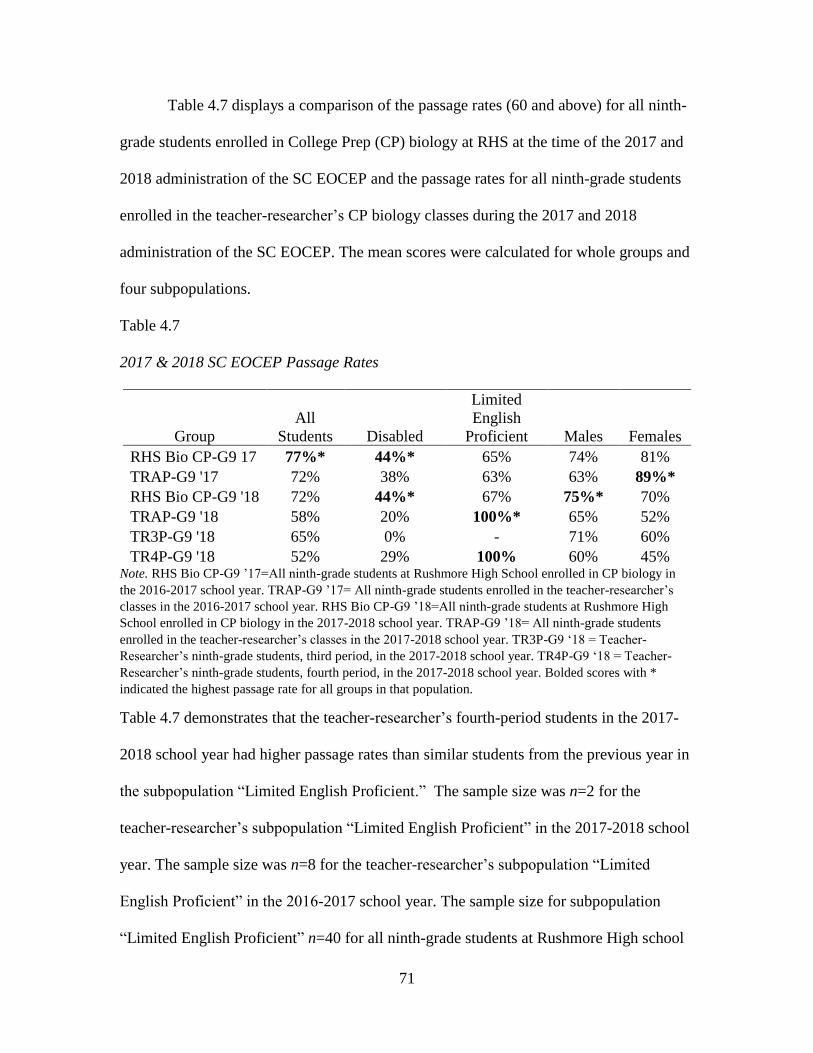
71
Table 4.7 displays a comparison of the passage rates (60 and above) for all ninth-
grade students enrolled in College Prep (CP) biology at RHS at the time of the 2017 and
2018 administration of the SC EOCEP and the passage rates for all ninth-grade students
enrolled in the teacher-researcher’s CP biology classes during the 2017 and 2018
administration of the SC EOCEP. The mean scores were calculated for whole groups and
four subpopulations.
Table 4.7
2017 & 2018 SC EOCEP Passage Rates
Group
All
Students Disabled
Limited
English
Proficient Males Females
RHS Bio CP-G9 17 77%* 44%* 65% 74% 81%
TRAP-G9 '17 72% 38% 63% 63% 89%*
RHS Bio CP-G9 '18 72% 44%* 67% 75%* 70%
TRAP-G9 '18 58% 20% 100%* 65% 52%
TR3P-G9 '18 65% 0% - 71% 60%
TR4P-G9 '18 52% 29% 100% 60% 45% Note. RHS Bio CP-G9 ’17=All ninth-grade students at Rushmore High School enrolled in CP biology in
the 2016-2017 school year. TRAP-G9 ’17= All ninth-grade students enrolled in the teacher-researcher’s
classes in the 2016-2017 school year. RHS Bio CP-G9 ’18=All ninth-grade students at Rushmore High
School enrolled in CP biology in the 2017-2018 school year. TRAP-G9 ’18= All ninth-grade students
enrolled in the teacher-researcher’s classes in the 2017-2018 school year. TR3P-G9 ‘18 = Teacher-
Researcher’s ninth-grade students, third period, in the 2017-2018 school year. TR4P-G9 ‘18 = Teacher-
Researcher’s ninth-grade students, fourth period, in the 2017-2018 school year. Bolded scores with *
indicated the highest passage rate for all groups in that population.
Table 4.7 demonstrates that the teacher-researcher’s fourth-period students in the 2017-
2018 school year had higher passage rates than similar students from the previous year in
the subpopulation “Limited English Proficient.” The sample size was n=2 for the
teacher-researcher’s subpopulation “Limited English Proficient” in the 2017-2018 school
year. The sample size was n=8 for the teacher-researcher’s subpopulation “Limited
English Proficient” in the 2016-2017 school year. The sample size for subpopulation
“Limited English Proficient” n=40 for all ninth-grade students at Rushmore High school
72
during the 2016-2017 school year and was n=18 for all ninth-grade students at Rushmore
High school during the 2017-2018 school year. Table 4.7 also shows that the teacher-
researcher’s students in the 2017-2018 school year performed higher than similar
students from the previous year in the subpopulation of “Males.” The sample size was
n=17 for the teacher-researcher’s subpopulation “Males” during the 2017-2018 school
year. The sample size was n=35 for the teacher-researcher’s subpopulation “Males”
during the 2016-2017 school year. The sample size for subpopulation “Males” was n=222
for all ninth-grade students at Rushmore High school during the 2016-2017 school year
and was n=169 for all ninth-grade students at Rushmore High school during the 2017-
2018 school year.
Table 4.8 shows a comparison of South Carolina State End-of-Course
Examination Program (EOCEP) mean scores from the 2016-2017 and 2017-2018
administrations. These two exam administrations are central to the data collection for the
present action research study. Table 4.8 also shows the difference in the teacher-
researcher mean scores for the same populations from the 2016-2017 and 2017-2018
school years. The data shown in Table 4.8 help to explain trends seen in Table 4.6.
Table 4.8 shows that the SC statewide scores dropped in all five noted categories
from the 2016-2017 administration to the 2017-2018 administration of the SC EOCEP.
The teacher-researcher’s class data showed decreased mean scores in three of the five
noted categories and an increase in mean scores in two categories, “Limited English
Proficient” and “Male.” In two of the categories where the teacher-researcher’s classes
had decreased mean scores, the difference was less than what was seen at the state level.

73
The categories where the teacher-researcher’s students show a smaller decrease in mean
scores than the state were “All students” and “Disabled.”
Table 4.8
South Carolina Statewide EOCEP Mean Scores
Group 2016-2017 2017-2018 Difference in
statewide M
scores
Difference in
TRAP-G9 M
scores
All Students 75.3 69.5 -5.8 -4.9
Disabled 54.8 52.0 -2.8 -1.5
Limited English Proficient 67.3 54.3 -13.0 4.0
Male 74.2 68.7 -5.5 0.1
Female 76.4 70.3 -6.1 -11.1
Note. TRAP-G9= All ninth-grade students enrolled in the teacher-researcher’s classes during the 2016-
2017 and 2017-2018 school years. Data files retrieved from the South Carolina Department of Education
(2017) and the South Carolina Department of Education (2018).
Supplemental Analysis
The teacher-researcher’s original hypothesis and associated data provided in
Table 4.6 and Table 4.7 focused on the comparison between the teacher-researcher’s
students from the 2017-2018 school year and similar students from the previous school
year. After analyzing the results of the four assessments for the present action research
study, the teacher-researcher determined that additional analysis was warranted. The data
in Table 4.9 and analysis that follows examines the teacher-researcher’s students’
performance on the South Carolina End-of-Course Examination Program (EOCEP)
compared to similar students at Rushmore High School (RHS) who took the examination
in the same year. This analysis method eliminates the necessity of looking at differences
between the two administrations of the SC EOCEP and looks solely at how the teacher-
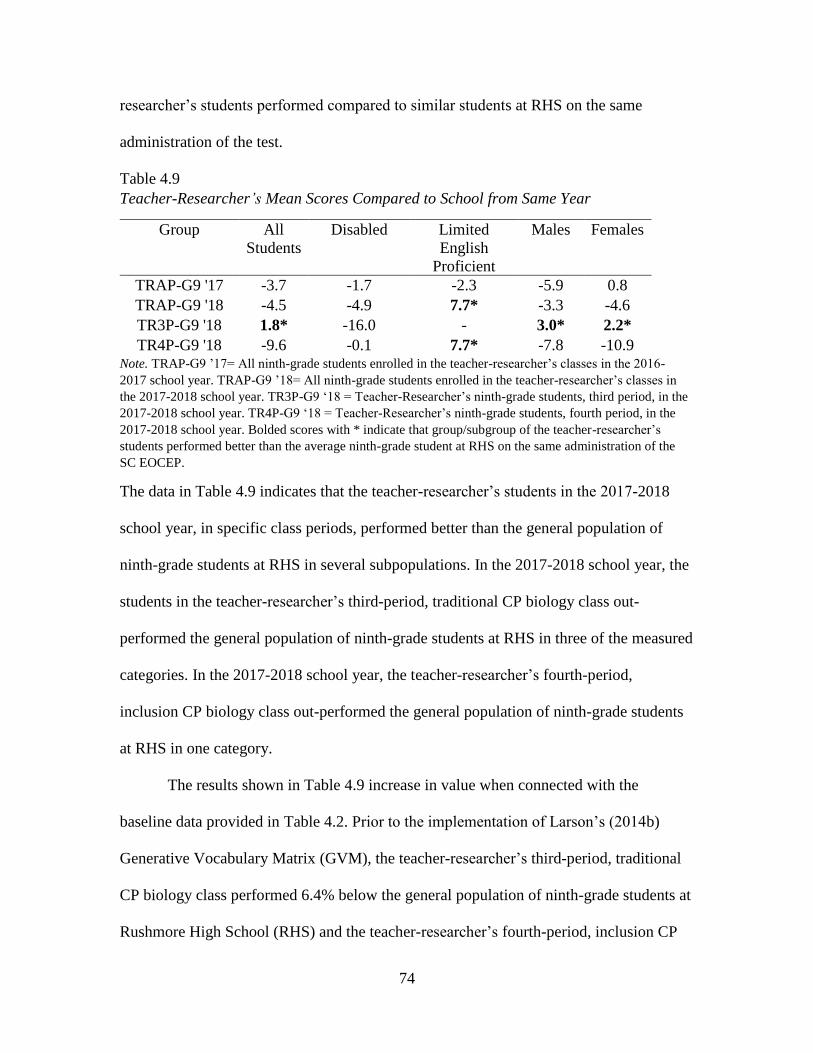
74
researcher’s students performed compared to similar students at RHS on the same
administration of the test.
Table 4.9
Teacher-Researcher’s Mean Scores Compared to School from Same Year
Group All
Students
Disabled Limited
English
Proficient
Males Females
TRAP-G9 '17 -3.7 -1.7 -2.3 -5.9 0.8
TRAP-G9 '18 -4.5 -4.9 7.7* -3.3 -4.6
TR3P-G9 '18 1.8* -16.0 - 3.0* 2.2*
TR4P-G9 '18 -9.6 -0.1 7.7* -7.8 -10.9 Note. TRAP-G9 ’17= All ninth-grade students enrolled in the teacher-researcher’s classes in the 2016-
2017 school year. TRAP-G9 ’18= All ninth-grade students enrolled in the teacher-researcher’s classes in
the 2017-2018 school year. TR3P-G9 ‘18 = Teacher-Researcher’s ninth-grade students, third period, in the
2017-2018 school year. TR4P-G9 ‘18 = Teacher-Researcher’s ninth-grade students, fourth period, in the
2017-2018 school year. Bolded scores with * indicate that group/subgroup of the teacher-researcher’s
students performed better than the average ninth-grade student at RHS on the same administration of the
SC EOCEP.
The data in Table 4.9 indicates that the teacher-researcher’s students in the 2017-2018
school year, in specific class periods, performed better than the general population of
ninth-grade students at RHS in several subpopulations. In the 2017-2018 school year, the
students in the teacher-researcher’s third-period, traditional CP biology class out-
performed the general population of ninth-grade students at RHS in three of the measured
categories. In the 2017-2018 school year, the teacher-researcher’s fourth-period,
inclusion CP biology class out-performed the general population of ninth-grade students
at RHS in one category.
The results shown in Table 4.9 increase in value when connected with the
baseline data provided in Table 4.2. Prior to the implementation of Larson’s (2014b)
Generative Vocabulary Matrix (GVM), the teacher-researcher’s third-period, traditional
CP biology class performed 6.4% below the general population of ninth-grade students at
Rushmore High School (RHS) and the teacher-researcher’s fourth-period, inclusion CP

75
biology class performed 15.6% below the general population of ninth-grade students at
RHS. After the implementation of Larson’s (2014b) GVM, the teacher-researcher’s third
period, traditional CP biology class performed 1.8% higher than the general population of
ninth-grade students at RHS and the teacher-researcher’s fourth period, inclusion CP
biology class only performed 9.6% below the general population of ninth-grade students
at RHS. Both classes demonstrated improved performance compared to the general
population of ninth-grade students at RHS after the implementation of Larson’s (2014b)
GVM.
Summary
The teacher-researcher used four assessments to evaluate the impact of Larson’s
(2014b) Generative Vocabulary Matrix (GVM) on students’ scores on the South Carolina
End-of-Course Examination Program (EOCEP). The comprehensive benchmark
assessment results provided a baseline measurement that demonstrated that both teacher-
researcher’s classes were performing below the general population at Rushmore High
School (RHS) before the implementation of Larson’s (2014b) GVM. The unit tests
demonstrated that both classes demonstrated growth in knowledge related to the
standards on Biological Evolution and Ecosystem Dynamics after the instruction that
included the use of Larson’s (2014b) GVM. The teacher-researcher’s observational
journal reflected two keys areas of success, student engagement and discussion, with the
use of Larson’s (2014b) GVM, but also indicated a desire to modify some aspects of the
protocol and scaffold and extend its implementation over a longer instructional period.
The teacher-researcher hypothesized that the biology classes at RHS where
students use Larson’s (2014b) GVM would have higher average scores on the SC
76
EOCEP than the scores of similar students from the previous year. The hypothesis was
only supported in two subpopulations within specific class periods: the mean scores for
the teacher-researchers fourth-period students in the subpopulation “Limited English
Proficient” and the mean scores for the teacher-researcher’s third-period students in the
subpopulation “Males.” The data also reflected that the teacher-researchers fourth-period
students in the subpopulation “Limited English Proficient” during the 2017-2018 school
year had higher passage rates than similar students of the previous year. It is important to
note that these two subpopulations both had small sample sizes (Limited English
Proficient, N=2, and Males, N=7). Due to the small sample size of these two
subpopulations, the teacher-researcher determined that the data is inconclusive regarding
the effectiveness of Larson’s (2014b) GVM with these students and further research was
warranted.
The teacher-researcher determined there was a need for supplemental analysis of
the results from the SC End-of-Course Examination Program. This analysis method
examined how the teacher-researcher’s students performed compared to similar students
at RHS on the same administration of the test. The results of this analysis demonstrated
the teacher-researcher’s third-period class’ mean SC EOCEP scores were 1.8% higher
than all ninth-grade students at RHS during the 2017-2018 school year and her fourth-
period class’ mean SC EOCEP scores were 9.6% below all ninth-grade students at RHS
during the 2017-2018 school year. This information was compared to the baseline
measurement which showed that the teacher-researcher’s students in both classes showed
improved performance compared to the general population of ninth-grade students at
RHS after the implementation of Larson’s (2014b) GVM.
77
The results of this study provide support for further research using Larson’s
(2014b) Generative Vocabulary Matrix (GVM) in CP biology classes. The data analysis
of the four measures in the present action research study demonstrate areas of success in
improving standardized test scores, but also illuminate areas of weakness which warrant
further examination and research. The teacher-researcher plans to explore the strengths
and weaknesses of this implementation of Larson’s (2014b) GVM and make necessary
adjustments to the protocol before future implementations. The teacher-researcher hopes
that these adjustments will continue to improve the efficacy of this tool and provide more
conclusive evidence of the ability of Larson’s (2014b) GVM to improve students’ scores
on the SC End-of-Course Examination Program.
78
CHAPTER 5
CONCLUSIONS AND RECOMMENDATIONS
Overview of Study
Problem of Practice
After four years of teaching biology, the teacher-researcher felt that her students
were not performing at their optimal ability on the state-mandated standardized test for
biology. The teacher-researcher observed that her students often found it very difficult to
learn and retain the concepts taught in the high school biology classroom because of a
lack of science literacy skills. Science literacy skills refer to a student’s ability to read and
interpret scientific text and write about science-related concepts. To address these
concerns, the teacher-researcher utilized Larson’s (2014b) Generative Vocabulary Matrix
(GVM) as a literacy strategy to determine the relationship between integrating literacy
strategies in the biology classroom and performance on the South Carolina End-of-
Course Examination Program (EOCEP) for biology. The teacher-researcher implemented
Larson’s (2014b) GVM as a literacy strategy with ninth-grade biology students in the
spring of 2018.
The SC EOCEP for biology is a high-stakes test which accounts for 20% of each
student’s overall course average and consequently has the potential to impact students’
overall grade point averages (GPA). Additionally, the passage rate on this test is
published in the public domain on the SC Department of Education’s website. This

79
information can be used by parents and community members to evaluate a school’s merit
and achievement level. Based on these factors, the Problem of Practice (PoP) is identified
as a need for increased student achievement on the SC EOCEP for biology due to the
potential impact this test has on students’ overall course averages, their grade point
averages (GPA), and the consequences these results may have on public opinion of the
present school. This identified PoP is the subject of the present action research study.
Significance of Study
The teacher-researcher developed the present action research study with the goal
of providing students with science instruction that supports students in achieving an
optimal score on the South Carolina End-of-Course Examination Program (EOCEP). The
present action research study sought to produce statistical relevance related to improving
standardized test scores by increasing scientific literacy skills using Larson’s (2014b)
Generative Vocabulary Matrix.
Theoretical Framework
The present action research study drew from the theories of Franklin Bobbitt,
William F. Pinar, and Wayne Au. Franklin Bobbitt’s (2013) work emphasizes the
importance of integrating “actual life-situations” when delivering instructional content (p.
11). He proposes that educators should combine experiences with content instead of
solely requiring students to memorize isolated facts and processes. William Pinar (2013)
writes about the importance of blending various educational ideologies in the pursuit of
developing curriculum. Pinar (2013) believes in the necessity of looking to traditionalist,
conceptual-empiricists, and reconceptualists to devise the best way to educate students.
Pinar (2013) states that each type of curricularist “is reliant upon the other” and no
80
philosophy must be eliminated in the exploration of another (p. 155). Wayne Au (2013)
seeks to combat unwelcome instructional trends associated with the increase of high-
stakes testing such as the “contracting [of] curricular content, fragmentation of the
structure of knowledge, and increasing teacher-centered pedagogy” (p. 245). The theories
of all three individuals were central to the development of the research design for the
present action research study.
Research Site and Participant Selection
The present action research study took place at Rushmore High School (RHS), a
public high school that enrolled approximately 2350 students, grades nine through
twelve, during the 2017-2018 school year. The demographic breakdown of the RHS
student body during the 2017-2018 school year was approximately: 61.7% Caucasian,
20.6% African-American, 9.6% Hispanic, 3.3% Asian, 0.2% American Indian/Alaskan
Native, 0.1% Hawaiian Native/Pacific Islander, and 4.6% Multi-Racial. Approximately
25.7% of the student body was enrolled in the free and reduced lunch program, 9.7% of
the student body had an Individualized Education Plan (IEP), and 4.0% had a 504 plan.
The participants in the present action research study were biology students of the
teacher-researcher at RHS during the 2017-2018 school year. The students selected for
this study were classified as ninth-grade students at the high school level. There was no
recruitment process for this study. The participants were placed in one of two of the
teacher-researcher’s classes by the school’s guidance department. The participants in the
teacher-researcher’s classes were enrolled in College Prep (CP) biology. The teacher-
researcher’s third-period class was a traditional CP biology course, and the fourth-period
class was an inclusion CP biology course. Larson’s (2014b) Generative Vocabulary

81
Matrix (GVM) was used in both teacher-researcher’s biology classes during the 2017-
2018 school year.
Data Collection Methods
The data collection for this action research study was both qualitative and
quantitative. The quantitative data are presented using descriptive statistics to analyze the
results. The qualitative data is presented in a narrative format. In this study, the scores of
the teacher-researcher’s students on the South Carolina End-of-Course Examination
Program (EOCEP) for biology are compared to the results of similar students from the
previous year. The scores from the 2017 and 2018 administrations of the SC EOCEP are
reported for all ninth-grade students enrolled in College Prep biology at Rushmore High
School (RHS) and used as comparison data. The teacher-researcher categorized this data
into subpopulations to examine potential correlations. The core data for this study comes
from the SC EOCEP for biology but is supported by data from other sources including a
benchmark test, unit tests, and a teacher-researcher observation journal. Additionally, the
SC state averages on the SC EOCEP for biology for the 2016-2017 and 2017-2018
academic years are reported to show the variances across the state between the two
administrations of this examination.
Results
The teacher-researcher used four assessments to evaluate the impact of Larson’s
(2014b) Generative Vocabulary Matrix (GVM) on students’ scores on the South Carolina
End-of-Course Examination Program (EOCEP). The comprehensive benchmark
assessment results provided a baseline measurement that demonstrated that both teacher-
researcher’s classes were performing below the general population at Rushmore High
82
School (RHS) before the implementation of Larson’s (2014b) GVM. The unit tests
showed that both classes demonstrated growth in knowledge related to the standards on
Biological Evolution and Ecosystem Dynamics after the instruction that included the use
of Larson’s (2014b) GVM. The teacher-researcher’s observational journal reflected two
keys areas of success with the use of Larson’s (2014b) GVM, student engagement and
discussion, but also indicated a desire to modify some aspects of the protocol and
scaffold and extend its implementation over a longer instructional period.
This study sought to answer the research question:
1. What is the impact of Larson’s (2014b) Generative Vocabulary Matrix (GVM) in
a high school biology course as demonstrated by students’ performance on the SC
End-of-Course Examination Program?
The teacher-researcher hypothesized that the biology classes at RHS where
students used Larson’s (2014b) Generative Vocabulary Matrix would have higher
average scores on the SC End-of-Course Examination Program than the scores of similar
students from the previous year. The hypothesis was only supported in two
subpopulations within specific class periods: the mean scores for the teacher-researcher’s
fourth-period students in the subpopulation “Limited English Proficient” and the mean
scores for the teacher-researcher’s third-period students in the subpopulation “Males.” It
is important to note that these two subpopulations both had small sample sizes (Limited
English Proficient, N=2, and Males, N=7). As stated in Chapter 4, due to the small
sample size of these two subpopulations, the teacher-researcher believes that the data is
inconclusive regarding the effectiveness of Larson’s (2014b) GVM with these
subpopulations and further research is warranted.
83
The teacher-researcher determined there was a need for supplemental analysis of
the results from the SC End-of-Course Examination Program. This analysis method
examined how the teacher-researcher’s students performed compared to similar students
at RHS on the same administration of the test. The results of this analysis demonstrated
the teacher-researcher’s third-period’s mean SC EOCEP scores were 1.8% higher than all
ninth-grade students at RHS during the 2017-2018 school year and her fourth-period’s
mean SC EOCEP scores were 9.6% below all ninth-grade students at RHS during the
2017-2018 school year. This information was compared to the baseline measurement
which showed that the teacher-researcher’s students in both classes showed improved
performance compared to the general population of ninth-grade students at RHS after the
implementation of Larson’s (2014b) GVM.
Results Related to Existing Literature
The following section serves as an opportunity to share the results from the
present action research study as they relate to the teacher-researcher’s findings in the
existing literature that formed the framework for this study.
Comprehensive Benchmark Assessment
The comprehensive benchmark assessment served as the baseline measure for this
study. The teacher-researcher used this measurement to compare her students’
performance to all Rushmore High School (RHS) students enrolled in College Prep (CP)
biology during the 2017-2018 school year. The comprehensive benchmark assessment
was administered to biology students in the teacher-researcher’s classes before the
implementation of Larson’s (2014b) Generative Vocabulary Matrix (GVM). The
84
comprehensive benchmark assessment was composed of 60 selected-response questions
and was designed to evaluate students’ understanding of all Biology I standards.
The results in Chapter 4, Table 4.1, show that on all measures (mean percent
correct, projected percent proficient, and mean suggested marks) the teacher-researcher’s
third and fourth-period classes performed lower than the general population of CP
biology students at RHS. The teacher-researcher’s fourth-period inclusion class, which
had nine students with IEPs, 504 plans, or ELL plans, showed more significant
deficiencies in content knowledge when compared to the general population of students
at RHS than the teacher-researcher’s third-period traditional CP biology class. Table 4.2
in Chapter 4 shows that in the category “Mean Suggested Marks”, which most closely
aligns with the predicted South Carolina End-of-Course Examination Program (EOCEP)
test score, the teacher researcher’s third-period class was 6.4% below the general
population of CP students at RHS, and her fourth-period class was 15.6% below the
general population of CP students at RHS.
The teacher-research has a vested interest in the impact of Larson’s (2014b) GVM
for students that fall within specific subpopulations, students with IEPs, 504s, and ELL
plans. The subpopulation labels for these students assigned by the South Carolina
Department of Education are “Disabled” and “Limited English Proficient” respectively.
In Chapter 2, the teacher-researcher cited studies conducted by Buckingham (2012) and
Westover and Martin (2014) regarding the insufficient use of effective instructional
strategies to assist diverse student groups, such as students English Language Learners
(ELL) and students with disabilities, in mastering scientific content. The baseline
measures for the study indicate that the class with a high population of students with
85
IEPs, 504s, and ELL plans performed significantly below the general population of CP
biology students at RHS.
Unit Tests
The unit tests served to demonstrate the growth of each of the teacher-researcher’s
classes from the time of the comprehensive benchmark assessment to the administration
of the unit test. The administration of each unit test followed the implementation of
Larson’s (2014b) Generative Vocabulary Matrix (GVM). There were nine questions on
the comprehensive benchmark assessment that addressed the standard and performance
indicators evaluated on the Biological Evolution unit test. The percent correct for each of
these nine questions was calculated for each student. Each students’ percent correct on
their unit test was also recorded. The individual student data was used to calculate
average scores for each of the teacher-researcher’s class periods on each measure.
Table 4.3 in Chapter 4 indicates that the teacher-researcher’s third-period class
showed 23% growth from the baseline measure to the unit test and the teacher-
researcher’s fourth-period class showed 48% growth. The amount of growth that the
fourth-period inclusion CP biology class accomplished from the time of the baseline
assessment to the administration of the unit test is significant. The fourth period class,
with a high percentage of students with IEPs, 504 plans, and ELL plans, grew two times
as much as the teacher-researcher’s traditional CP biology class. This data provides
evidence of the effectiveness of using Larson’s (2014b) GVM with this specific
population on this specific content.
There were five questions on the comprehensive benchmark assessment that
addressed the standard and performance indicators evaluated on the Ecosystem Dynamics
86
unit test. The percent correct for these five questions was calculated for each student.
Each students’ percent correct on their unit test was also recorded. The individual student
data was used to calculate average scores for each of the teacher-researcher’s class
periods on each measure. Table 4.4 in Chapter 4 indicates that the teacher-researcher’s
third-period class showed 37% growth from the baseline measure to the unit test and the
teacher-researcher’s fourth-period class showed 26% growth.
This data provides evidence that both class periods demonstrated measurable
growth on both unit tests after the implementation of Larson’s (2014b) Generative
Vocabulary Matrix (GVM). The teacher-researcher believes that the amount of growth
shown in both classes can be contributed in part to the common experiences provided at
the onset of each unit, a strategy that is outlined as part of the “initiate” phase of Larson’s
(2014b) GVM. This common experience provides a level of equity to each student in the
class which has been a goal of public schools since the Common School Movement in the
early 1800s (Spring, 2014).
Observations
The teacher-research kept a researcher journal throughout the implementation of
Larson’s (2014b) GVM. Codes were identified through Mertler’s (2014) inductive
analysis model. This model involves the teacher-researcher reading the observational
notes multiple times, looking for patterns and themes, creating coding categories,
separating the information by category, drawing connections between categories and
exploring their significance (Mertler, 2014). There were five coding categories that
emerged: engagement, distractibility, need for support, discussion, and reflection. Each
category had associated themes generated by the notes taken in the observation journal.

87
Coding categories, themes, specific notes and quotations that support the creation of these
categories and themes are included in Chapter 4, Table 4.5.
The teacher-researcher noted that in the category “engagement” the students
enjoyed the hands-on lab, the activity that incorporated movement and getting to share
their thoughts out loud in a semi-structured environment. This instructional strategy is
supported by the theories of Franklin Bobbitt (2013) who was cited in Chapter 1 as part
of the teacher-researcher’s theoretic framework. Bobbitt (2013) proposes that education
should be relatable to real life situations instead of simply asking students to memorize
facts and procedures. The teacher-researcher observed in her previous years of teaching
biology that her male students tended to be more vocal about their appreciation of labs,
activities involving movement, and class discussion. The teacher-researcher questions if
the intentional integration of this type of activity as part of Larson’s (2014b) GVM
contributed to her male students receiving higher scores than her female students on the
South Carolina End-of-Course Examination Program (EOCEP). Further exploration of
the causes of differences in achievement between males and females on the SC EOCEP is
an area of future research interest for the teacher-researcher, specifically as it relates to
the use of Larson’s (2014b) GVM.
In the category “distractibility,” the theme emerged that students enjoyed the lab,
activity, and discussions, but had trouble focusing on the instruction that corresponded
with these instructional strategies. The theme in the category “need for support” showed
that students found it difficult to begin tasks that involved critical thinking. When
encountering these tasks, students often requested an example or asked the teacher to
model what was expected.

88
The theme for the category “discussion” showed that semi-structured discussion
allowed students to feel comfortable sharing their ideas and thoughts out loud. This
format encouraged students to ask questions. The discussion portion of the
implementation of Larson’s (2014b) GVM aligns with Templeton’s (2012) theory that
instructional techniques can facilitate the expansion of a student’s vocabulary. In one of
the discussion sessions, the teacher-researcher used an instructional format similar to an
example Templeton (2012) includes in his writing. Templeton (2012) shares a strategy
where a teacher used a book to engage students in guided questions where the students
ultimately define a key term before the teacher even shares the term with the class. Stahl
and Vancil (1986) provide evidence that students who were given instruction that paired
discussion with semantic maps scored slightly higher than groups with only the semantic
map or only discussion. The teacher-researcher believes that in her study, the discussion
component was an important part of the implementation of Larson’s (2014b) GVM.
Lastly, in the category “reflection,” the theme showed that the teacher-researcher
shifted from primarily using selected response questions to more open-ended, short-
answer questions (both verbal and written). Wittrock (2010) noted the importance of
pairing instructional organizers with discussion. As stated in Chapter 2, Wittrock (2010)
states, “the notion that human learning with understanding involves the process of
generating and transferring meaning for stimuli and events from one’s background,
attitudes, abilities, and experiences” (p. 43).
South Carolina End-of-Course Examination Program
The teacher-researcher stated in the review of literature that the goal of utilizing
Larson’s (2014b) Generative Vocabulary Matrix (GVM) as the literature strategy for the
89
present action research study was to help students be successful within the current
educational system without losing the benefits of an academically rich and student-
centered instructional method. The teacher-researcher stated that this format provided the
opportunity to weave together student experience and perspective within the framework
that is currently in place at the school and district of interest for this study. This
methodology sought to combat the concerns presented in Au’s (2013) study, which stated
that, “overwhelmingly, the prevalent theme triplet in the qualitative research was the
combination of contracting curricular content, fragmentation of the structure of
knowledge, and increasing teacher-centered pedagogy in response to high stakes testing”
(p. 245).
Additionally, the teacher-researcher sought to investigate the relevance of this
instructional strategy on specific subpopulations: disabled, Limited English Proficient,
and between genders. In Chapter 2, the teacher-researcher reported that in South Carolina
(SC), the 2017 End-of-Course Examination Program (EOCEP) scores show that the mean
score for males was 74.2% and for females, it was 76.4% (South Carolina Department of
Education, 2017). A more significant difference was shown in the mean scores for
disabled students. The mean score for disabled students was 54.8% compared to 77.8%
for non-disabled students (South Carolina Department of Education, 2017). Looking at
Limited English Proficient (LEP) students, the mean score for LEP students in SC was
67.3% while non-LEP students had a mean score of 75.7% (South Carolina Department
of Education, 2017). At Rushmore High School (RHS), the location of the present action
research study, data shows that the mean score for males was 79.0% versus 80.7% for
females (South Carolina Department of Education, 2017). Looking at students with
90
disabilities, the mean score was 55.5% versus 82.9% for non-disabled students (South
Carolina Department of Education, 2017). Data on Limited English Proficient (LEP)
students shows a mean score of 67.5% versus 80.9% for non-LEP students (South
Carolina Department of Education, 2017).
Table 4.6 in Chapter 4 displays a comparison between the teacher-researcher’s
South Carolina End-of-Course Examination Program (EOCEP) scores from the 2016-
2017 and 2017-2018 school years. The data shows that the teacher-researchers students
performed better on the SC EOCEP after the implementation of Larson’s (2014b)
Generative Vocabulary Matrix (GVM) in the subcategories of Limited English Proficient
(LEP) and Males. Table 4.8 in Chapter 4 shows that the statewide scores in these
categories decreased across the two administration of the exam. In the present action
research study, the sample size for students identified as Limited English Proficient was
small (n=2); however, it is notable that both students passed the South Carolina End-of-
Course Examination Program after implementation of Larson’s (2014b) GVM. The
teacher-researcher believes that the generative structure, which is a key component of
Larson’s (2014b) GVM, provided the necessary scaffolding for her LEP students to
comprehend and retain information related to the Biology 1 standards. The teacher-
researcher supports further exploration of the correlation between the scores of LEP
students on the SC EOCEP and the use of Larson’s (2014b) GVM.
Limitations of Study
In the present action research study, there were three key limitations. While all the
limitations were beyond the teacher-researcher’s control in the present action research
study, it is possible that one limitation be resolved in future studies. The three key

91
limitations for this study were: variability in comparisons groups, access to the South
Carolina End-of-Course Examination Program (EOCEP), and sample size.
In educational research, it is unethical to establish a true control group. The
teacher-researcher could not select one of the class periods in which to implement
Larson’s (2014b) Generative Vocabulary Matrix (GVM) and not the other if the teacher-
researcher believed that the implemented strategy would help improve the standardized
test scores of the students. Therefore, the comparison groups from the same year were
students taught by teachers other than the teacher-researcher. The comparison group from
the previous year included students taught by the teacher-researcher, but those students
may have had different experiences due to a variety of factors such as classroom location,
number of days the teacher was absent, or school events. This limitation cannot be
eliminated, but in the future, the teacher-researcher recommends limiting data collection
to a single-year to minimize variables.
The second limitation for the present study is the lack of transparency provided by
the South Caroline Department of Education regarding the SC EOCEP. The SC
Department of Education does not release any previously administered EOCEPs to the
public, unlike other states such as New York. Due to this policy, the teacher-researcher
does not definitively know how many questions on the 2018 SC EOCEP were directly
related to the units taught using Larson’s (2014b) GVM or their levels of difficulty. The
SC Department of Education releases a blueprint with ranges regarding the number of
questions on the examination for each Biology 1 standard, but there is no item analysis
released after the examination dates with exact details. This information could have
92
improved the teacher-researcher’s ability to evaluate possible correlations between the
implementation of Larson’s (2014b) GVM and improved scores on the SC EOCEP.
The final limitation for this study was the small sample size, specifically for some
subpopulations including students with disabilities and students who are labeled “Limited
English Proficient.” The teacher-researcher serves both as a school-based instructional
coach and a biology teacher. Due to this dual role, she only teaches two periods a day and
only had these two class periods for which to implement the use of the Larson’s (2014b)
GVM. The small sample size, especially for certain subpopulations, limits the weight that
is placed on the conclusions drawn from this study; therefore, the teacher-researcher feels
that future research is warranted. This limitation could be minimized if the teacher-
researcher returned to the classroom full time and taught more sections of CP biology or
continued to collect data related to these subpopulations over multiple years.
Action Plan
The teacher-researcher developed an action plan based on her results and analysis
of the data. The teacher-researcher plans to implement the use of Larson’s (2014b) GVM
with her CP biology classes in the future. As part of this implementation, the teacher-
researcher intends to integrate semi-structured discussion during class instruction
regularly. The teacher-researcher’s observational journal notes reflected that this
component of Larson’s (2014b) GVM played a central role in the students’ learning
processes. The teacher-researcher believes that asking students follow-up questions, such
as “why” and “expand on your response,” should be a practice integrated throughout the
academic year to enhance the effectiveness of class discussion and to improve students’
ability to generate meaningful connections between concepts. This practice should also

93
be implemented in other core content areas, specifically English and Social Studies, to
reinforce the proper ways to have a discussion, which includes citing evidence and using
critical thinking skills to explore new ideas.
The teacher-researcher also plans to integrate Larson’s (2014b) GVM throughout
an entire academic year instead of limiting it to two units as done in the present action
research study. The teacher-researcher believes that this year-long implementation will
increase student comfort levels with the process and increase the potential for raising
standardized test scores. Part of the year-long implementation process should include
scaffolding the introduction of semantic maps and free response writing. Semantic map
scaffolding can be accomplished by sharing completed semantic maps with the students,
followed by the teacher and students working together to fill in a pre-made blank
semantic map, then having students fill-in a semantic map template, and ultimately
leading to students generating their semantic maps from scratch. Free response writing
can be scaffolded as well. At the start of the year, the teacher should provide sentence
stems that teach students how to connect ideas and concepts effectively. As the year
progresses, the teacher should ask for short writing samples without providing sentence
stems. At the end of the year, the expectation is that students should be able to write
extended responses that communicate the linkage of concepts and ideas without support.
The teacher-researcher believes that these action plans can be accommodated at the
present research site and other high schools in the United States.
Recommendations for Future Research
The present study is classified as an action research study and was conducted by
the teacher-researcher. The action research design for this study was outlined by Mertler
94
(2014). The action research design had four-stages: planning, acting, developing, and
reflecting (Mertler, 2014). The teacher-researcher recommends the use of Mertler’s
action research design for future research on this topic. The instructional framework for
this study also had four stages: initiate, conceptualize, enrich and access (Larson, 2014b).
These stages were central to the effectiveness of this study and crucial to the instructional
planning needed to implement the Generative Vocabulary Matrix (GVM).
One of the key components of this study is the blending of experiences and
education. Teachers of science often begin new units by presenting facts and then they
follow up these presentations with practice problems, formative assessments, labs, and
other activities. Based on this study’s findings, the teacher-researcher recommends
starting each new unit of study with a unifying experience, such as a lab, game,
demonstration, or story, that the teacher can reference during the lesson and which all
students understand. Teaching can be thought of like a play. If actors started a play in the
middle with all the details and no context, the viewers would be lost. It is necessary to
start the play with an introduction to set the stage for the detailed information that will
follow. The actors would not want to assume that the viewers had read the plot of the
play before arrival or had seen the play before. It is crucial that all viewers have a
common experience at the beginning of the production, so they can all understand the
whole story. This principle holds when delivering information to students.
The teacher-researcher also recommends the development and use of in-house
measures (pre-test, mid-year, post-test) given at the beginning, middle, and end of the
school year to be used by all college-prep (CP) biology teachers at the school of study.
This structure would provide the opportunity to show year-long growth of students in
95
comparison to other students at the same school during the same school year instead of
only focusing on a five-week period. This method would provide a more comprehensive
picture of the effectiveness of Larson’s (2014b) Generative Vocabulary Matrix (GVM) in
the biology classroom and ultimately, on the South Carolina End-of-Course Examination
Program (EOCEP), than shown in the present action research study.
The teacher-researcher strongly suggests shifting to a single-year comparison of
results of the SC EOCEP instead of evaluating change across two different administration
years. Single-year data was provided for the present action research study in the
supplemental analysis portion of Chapter 4. This suggestion is made based on the
understanding that evaluating differences between two different administrations of the
exam can introduce variables that would be eliminated by shifting to a single-year
structure.
The teacher-researcher advocates for the implementation of the Larson (2014b)
GVM, especially with these recommendations, in other tested areas in South Carolina
that involve a significant amount of reading and writing. Additionally, the teacher-
researcher recommends the use of Larson’s (2014b) GVM be extended to subject areas
that require students to synthesize large amounts of information, such as Social Studies
and English courses. The teacher-researcher also suggests implementing Larson’s
(2014b) GVM in educational support classes for students with learning disabilities to help
scaffold reading and writing principles associated with specific content-area classes.
Implementation of Larson’s (2014b) GVM in these areas would increase the opportunity
for collecting subpopulation data and establishing more concrete conclusions.
96
Summary
This summative chapter provides an overview of the present action research
study, the results of this study as they relate to existing literature, limitations of the study,
and recommendations for future research. In the present action research study, the
teacher-researcher evaluated the relationship between integrating literacy strategies in the
biology classroom and performance on the South Carolina End-of-Course Examination
Program for biology. The data related to the effectiveness of Larson’s (2014b) Generative
Vocabulary Matrix as a literacy strategy to improve standardized test scores shows areas
of strength and weakness. The teacher-researcher deems the results of this study
inconclusive, but firmly supports further research and data collection using this
methodology with the recommendations from this chapter taken into consideration.
97
REFERENCES
Au, W. (2013). High-stakes testing and curriculum control. In D.J. Flinders & S.J.
Thornton (Eds.), The curriculum studies reader (pp. 235-251). New York:
Routledge.
Balfanz, R. & Legters, N. (2006). Closing “dropout factories”: The graduation rate crisis
we now and what can be done about it. Education Week, 25(42), 42-43.
Bobbitt, F. (2013). Scientific method in curriculum-making. In D.J. Flinders & S.J.
Thornton (Eds.), The curriculum studies reader. New York: Routledge.
Buckingham, T. (2012). Every teacher and English teacher? Literacy strategy teaching
and research in the content area of science education. Retrieved from ProQuest
Digital Dissertations. (AAT 3509894)
Carlson, C.L. (2014). Dropout factories and the vaccination approach: the impact of the
dropout rate on the economy and the need for effective literacy instruction.
SRATE Journal, 23(2), 1-7.
Common Core State Standards Initiative. (2012). Common Core State Standards for
English language arts and literacy in history/social studies, science and technical
subjects. Retrieved from http://www.core standards.org/
Eisner, E. (2013). What does it mean to say a school is doing well? In D.J. Flinders &
S.J. Thornton (Eds.), The curriculum studies reader (pp. 279-287). New York:
Routledge.
98
Jackson, J., Tripp, S., & Cox, K. (2011, May). Interactive word walls: Transforming
content vocabulary instruction. Science Scope, 35(3), 45-49.
Johnson, D. I., & Mrowka, K. (2010). Generative Learning, Quizzing and Cognitive
Learning: An Experimental Study in the Communication Classroom.
Communication Education, 59(2), 107-123.
Kerr, A. (2015, May 14). How will learning change in S.C.?. The Post and Courier.
Retrieved from http://www.postandcourier.com/politics/how-will-learning-
change-in-s-c/article_2d78ec99-b226-57d1-8624-a328b5457f9e.html
Larson, S. C. (2014a). Exploring the roles of the generative vocabulary matrix and
academic literacy engagement of ninth-grade biology students. Literacy Research
and Instruction, 53(4), 287-325.
Larson, S. C. (2014b). Using a generative vocabulary matrix in the learning workshop.
The Reading Teacher, 68(2), 113–125.
Mantsios, G. (2013). Class in America-2006. In M. Adams, W. J. Blumenfeld, C.
Castañeda, H. W. Hackman, M. L. Peters, & X. Zúñiga (Eds.), Readings for
diversity and social justice (3rd ed., pp. 150-156). New York, NY: Routledge.
Mertler, C.A. (2014). Action research: Improving schools and empowering educators.
Thousand Oaks, California: Sage Publication, Inc.
Moe, T. M. (2003). Politics, control, and the future of school accountability. In P.E.
Peterson & M.R. West (Eds.), No child left behind? The politics and practice of
school accountability (pp. 80-106). Washington, DC: Brookings Institution Press.
National Center for Education Statistics (2010). The nation's report card: Grade 12
reading and mathematics 2009 national and pilot state results (NCES 2011-455).
99
National Center for Education Statistics, Institute of Education Sciences, U.S.
Department of Education, Washington, D.C
National Commission on Excellence in Education. (1983). A nation at risk: The
imperative for educational reform: a report to the Nation and the Secretary of
Education, United States Department of Education. Washington, D.C.: The
Commission.
Pinar, W. (2013). The reconceptualization of curriculum studies. In D.J. Flinders & S.J.
Thornton (Eds.), The curriculum studies reader. New York: Routledge.
Powell, T. (2008). Willie Lee Buffington and Faith Cabin Libraries. In S. Schramm-Pate
& R. B. Jeffries (Eds.), Grappling with diversity: Readings on civil rights
pedagogy and critical multiculturalism (pp. 75-95). Albany, NY: State University
of New York Press.
South Carolina Department of Education. (2014a). South Carolina biology 1 standards
[PDF]. Retrieved from South Carolina Department of Education website:
http://ed.sc.gov/scdoe/assets/File/instruction/standards/Science/Biology1-
Standards-Printable%20.pdf
South Carolina Department of Education. (2014b). Support guide for biology 1 South
Carolina academic standards and performance indicators for science [PDF].
Retrieved from South Carolina Department of Education website:
http://ed.sc.gov/scdoe/assets/File/instruction/standards/Science/Support%20Docu
ments/Science_Biology1Support.pdf
South Carolina Department of Education. (2016). South Carolina end-of-course
examination: Test blueprint for biology [PDF]. Retrieved from South Carolina

100
Department of Education website: http://ed.sc.gov/tests/tests-files/eocep-
files/2016-17-biology1-test-blueprint/
South Carolina Department of Education. (2017). End-of-Course Examination Program
(EOCEP) 2016-17 [Data file]. Retrieved from https://ed.sc.gov/data/test-
scores/state-assessments/end-of-course-examination-program-eocep/
South Carolina Department of Education. (2018). End-of-Course Examination Program
(EOCEP) 2017-18 [Data file]. Retrieved from https://ed.sc.gov/data/test-
scores/state-assessments/end-of-course-examination-program-eocep/
Spring, J. (2014). The American school, a global context: From the Puritans to the
Obama administration (9th ed.). New York: McGraw-Hill Education.
Stahl, S. & Vancil, S. (1986). Discussion is what makes semantic maps work in
vocabulary instruction. The Reading Teacher, 40(1), 62-67.
Templeton, S. (2012). Teaching and Learning Morphology: A Reflection on Generative
Vocabulary Instruction. Journal of Education, 192(2-3), 101-107.
Westover, J. M., & Martin, E. J. (2014). Performance feedback, paraeducators, and
literacy instruction for students with significant disabilities. Journal of Intellectual
Disabilities, 18(4), 364-381.
Wittrock, M.C. (2010). Learning as a generative process. Educational Psychologist,
45(1), 40-45. Au, W. (2013). High-stakes testing and curriculum control. In D.J.
Flinders & S.J. Thornton (Eds.), The curriculum studies reader (pp. 235-251).
New York: Routledge.

101
APPENDIX A
RESEARCH DESIGN FLOWCHART
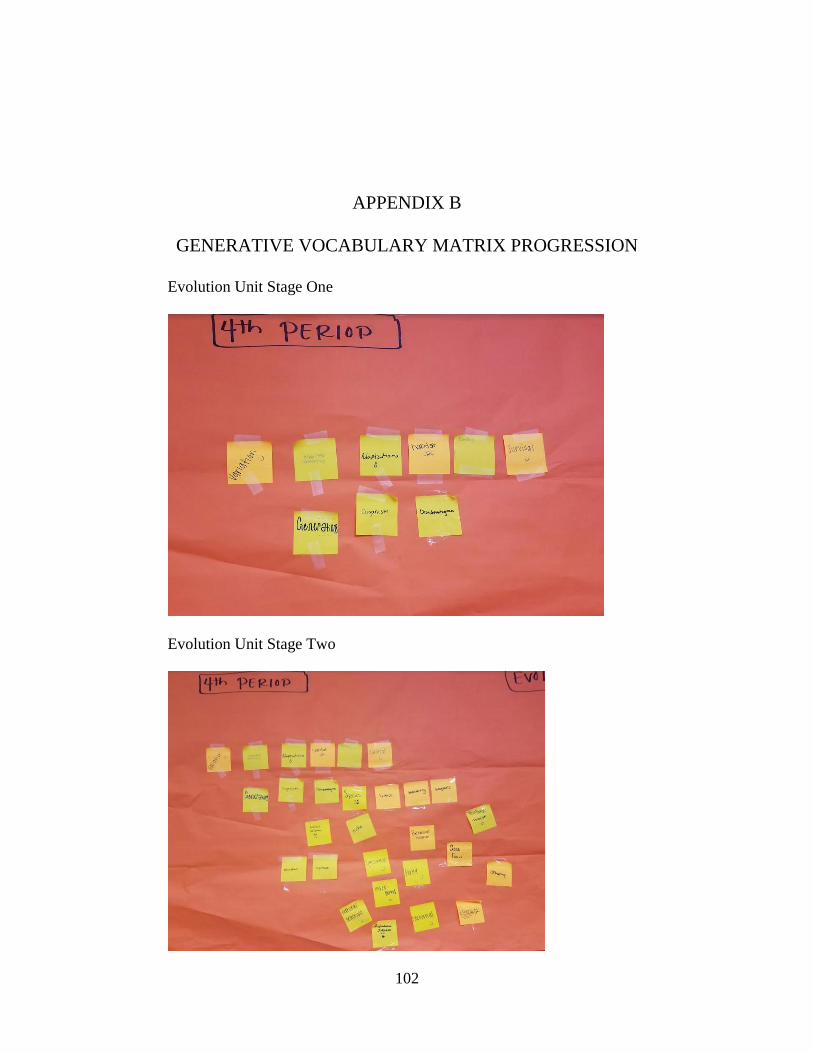
102
APPENDIX B
GENERATIVE VOCABULARY MATRIX PROGRESSION
Evolution Unit Stage One
Evolution Unit Stage Two

103
Evolution Unit Stage Three
Evolution Unit Stage Four

104
Ecology Unit Stage One
Ecology Unit Stage Two
105
APPENDIX C
PARENT NOTIFICATION LETTER
Parents and Guardians,
My name is Anna Morrison and I am your student’s biology teacher this year.
This year, I am conducting a research study in your student’s class as part of my doctoral
dissertation process as I pursue my EdD in Curriculum and Instruction at the University
of South Carolina. I am interested in studying the impact of integrating literacy strategies
in the biology classroom. This research study will span seven to eight weeks starting in
March. As part of this research study, the class will use a generative vocabulary matrix
(interactive word wall) to connect terms and concepts to experiences (labs, demos, etc.)
with the goal of increasing understanding and retention of biology concepts.
I have noticed that students often find it very difficult to learn and retain the
concepts taught in the high school biology classroom because of a lack of science literacy
skills. Students think of literacy and science as separate entities, never overlapping, while
in reality the two are permanently intertwined. I believe that to increase student
achievement in the sciences, science educators must begin integrating literacy
fundamentals into their lessons and build on those principles regularly. This study will
evaluate the importance of integrating literacy instruction in the science classroom on
student performance on the South Carolina End-of-Course Examination Program for
biology.
The potential risks for the participants in this study are the same as they would be
whenever a teacher introduces a new strategy in the classroom. It is always possible that
the new strategy, although well-researched, will be less successful than the previously
used method. However, I have selected this instructional method after extensive research
and firmly believe this strategy will be in the best interest of my students and will
ultimately improve their scores on the SC EOCEP examination for biology.
The potential benefits for the participants in this study are that the students may
improve their science literacy skills which may result in improved test scores on the SC
EOCEP examination for biology. Since this test accounts for twenty percent of students’
overall course averages, their course average and possibly also their grade point average
(GPA) could improve over the outcome with traditional instructional methods. There is
no guarantee of this outcome.
The data collected during this study will be benchmark and test data, student
surveys, a teacher observational journal (during class activities), and EOCEP test scores.

106
The data collected from this study will be included in my dissertation proposal and will
be submitted to a committee at the Education Department at the University of South
Carolina. Your student will have anonymity and personal identifiers will not be published
as part of this research study.
University of South Carolina Sponsor
Dr. Leigh D’Amico
Research Assistant Professor
803-777-8072
There is no penalty for not participating in this study. The school’s and
individual’s identities will remain strictly anonymous and confidential. Participants may
withdraw from the study at any time without penalty. If you would like to withdraw your
student at this time, please check on the line below, fill in your student’s name, and have
your student return this form to me or scan and email me the document.
______ I do not wish my student (__________________________) to participate.
If you have any questions or concerns about the study, please contact me.
Sincerely,
Anna Morrison
![Classroom Assessment: Every Student a LearnerChapter 1 • Classroom Assessment: Every Student a Learner [ 2 ] CLASSROOM ASSESSMENT LITERACY We define classroom assessment literacy](https://img.pdfslide.net/doc/110x75/5e2c1e27b7168d19a5615ed2/classroom-assessment-every-student-a-learner-chapter-1-a-classroom-assessment.jpg)