Embed Size (px)
Citation preview

Integrating Resource Management in Service Network Design for Bike Sharing Systems Bruno Albert Neumann-Saavedra Teodor Gabriel Crainic Bernard Gendron Dirk Christian Mattfeld Michael Römer March 2018
CIRRELT-2018-17

Integrating Resource Management in Service Network Design for Bike Sharing Systems
Bruno Albert Neumann-Saavedra1, Teodor Gabriel Crainic2,3,*, Bernard Gendron2,4, Dirk Christian Mattfeld1, Michael Römer5
1 Decision Support Group, University of Braunschweig, Mülehnpfordtstraβe 23, 38106 Braunschweig, Germany
2 Interuniversity Research Centre on Enterprise Networks, Logistics and Transportation (CIRRELT) 3 Department of Management and Technology, Université du Québec à Montréal, P.O. Box 8888,
Station Centre-Ville, Montréal, Canada H3C 3P8 4 Department of Computer Science and Operations Research, Université de Montréal, P.O. Box
6128, Station Centre-Ville, Montréal, Canada H3C 3J7 5 Institute of Business Information Systems and Operations Research, Martin Luther University,
Halle-Wittenberg, Universitätsring 3, 06108 Halle (Saale), Germany
Abstract. Station-based bike sharing systems rely on an intra-day redistribution process to provide bikes for rentals and free racks for returns whenever demanded by users. Tactical planning of bike sharing systems aims to answer service level expectations of users through a cost-efficient use of redistribution vehicles. In this paper, we propose a novel service network design formulation that coordinates redistribution and vehicle routing decisions in space and time, thus producing master tours. This formulation explicitly integrates resource management decisions into master tours by including both the rational use of limited resources as well as an accurate time representation of pickups and deliveries of bikes at station visits. We propose a matheuristic which relies on neighborhood search to obtain good-quality solutions for large problem instances in reasonable time. To produce starting solutions, we propose a construction heuristic. The construction heuristic decomposes the redistribution process into three phases: determine pickup and delivery operations, link pickups and deliveries of bikes into transport services, and assign transport services to master tours. Our computational study provides evidence that the proposed solution methodology produces solutions of high quality for real-world sized problem instances. Finally, we evaluate the trade-of between resource usage and service level expectations.
Keywords: Bike sharing systems, intra-day bike redistribution, service network design, matheuristic.
Acknowledgements. This research has been supported by the German Research Foundation (DFG) through the Research Training Group SocialCars (GRK 1931). The focus of the SocialCars Research Training Group is on significantly improving the city’s future road traffic, through cooperative approaches. This support is gratefully acknowledged. Partial funding for this project also comes from the Discovery Grant and the Discovery Accelerator Supplements Programs of the Natural Science and Engineering Research Council of Canada (NSERC), and the Strategic Clusters program of the Fonds québécois de la recherche sur la nature et les technologies (FQRNT). The authors thank the two institutions for supporting this research. While working on this project, the second author was Adjunct Professor with the Department of Computer Science and Operations Research, Université de Montréal.
Results and views expressed in this publication are the sole responsibility of the authors and do not necessarily reflect those of CIRRELT.
Les résultats et opinions contenus dans cette publication ne reflètent pas nécessairement la position du CIRRELT et n'engagent pas sa responsabilité. _____________________________
* Corresponding author: [email protected]
Dépôt légal – Bibliothèque et Archives nationales du Québec Bibliothèque et Archives Canada, 2018
© Neumann-Saavedra, Crainic, Gendron, Mattfeld, Römer and CIRRELT, 2018

1 Introduction
Municipalities are striving towards enhancing urban mobility with environmental andterritorial impact as small as possible (Mrkajic and Anguelovski, 2016). Station-basedbike sharing systems (BSSs) have emerged as an inexpensive and sustainable complementto traditional public transport (Ricci, 2015). BSSs saturate urban areas with stationsproviding two assets: bikes for rentals and racks for returns. Users can thus performone-way bike trips between any station pair. In order to encourage a high use of bikesduring the day, these bike trips are typically free within a short time span, e.g., the firsthalf hour (Martinez et al., 2012). In particular, BSSs provide a suitable solution formid-term distances as well as for the “first and last mile” between transport hubs andpoints of interest (Kumar et al., 2016).
The long-term viability of a BSS strongly depends on the service level offered to users.The service level reports how many users perform trips as demanded. Providing a highservice level is challenging because the provision of bikes is subject to the number of bikeracks at stations. In this paper, we define a station’s fill level as the ratio between thenumber of provided bikes and its capacity. Unfortunately, one-way trips in combinationwith spatial and temporal characteristics of mobility patterns lead to stations that reg-ularly run full or empty during the day (Datner et al., 2017). One important mobilitypattern is induced by commuters who ride to working districts in the morning and toresidential areas in the afternoon (O’Brien et al., 2014). In the districts, users competefor the bikes and free racks depending on the time of day. Asset shortages lead to failedrequests if either a user cannot rent a bike at an empty station, or if a user cannot returna bike to a full station.
To mitigate the number of failed requests, operators employ resources such as vehi-cles and driving staff for redistributing bikes among stations (Shu et al., 2013). In theredistribution process, operators pick up and deliver bikes at stations with shortages ofassets. We call these pickup and delivery operations fill level alterations (FLAs). EachFLA involves a bike volume and a time window for visiting the respective station. Moststate-of-the-art studies addressing the redistribution process focus on the overnight case,assuming that users do not request assets within the redistribution process (Raviv et al.,2013). Although the overnight redistribution process is interesting from an academicperspective, in practice it does not suffice to significantly reduce failed requests over thecourse of the day (de Chardon et al., 2016). Therefore, this work focuses on intra-dayredistribution process, where both users and vehicles move bikes within the underlyingstation network.
An efficient intra-day redistribution process relies on insights about mobility patternsto anticipate when and where users demand assets. Several research studies provideevidence that mobility patterns are stable and predictable (O’Brien et al., 2014; Vogelet al., 2011). For example, stations close to working districts typically suffer from several
Integrating Resource Management in Service Network Design for Bike Sharing Systems
CIRRELT-2018-17

(a) morning (b) evening
Figure 1: Number of bikes in racks at stations in New York’s Citi Bike, reflecting mobilitypatterns in a summer season’s weekday (http://bikes.oobrien.com/)
return requests in the morning and rental requests in the evening. The opposite behavioris typically observed at stations close to residential districts. These mobility patterns leadto accumulations of bikes in different districts of the city according to the time of day. ForNew York’s City Bike BSS, Figure 1 shows the number of bikes in racks at stations in themorning (on the left chart) and evening (on the right chart) for one summer weekday.Each circle depicts a single station: the bigger the circle, the more bikes in racks atthe respective station. We observe that bikes are accumulated in different areas in themorning and evening, coinciding with the working and residential districts, respectively.Actually, we would note a similar distribution for every weekday over a season.
This regularity of mobility patterns provides the basis for tactical planning in theredistribution process. Tactical planning aims to meet service level expectations in acost-efficient way. To this end, tactical planning determines regular master tours fordaily redistribution operations. We believe that tactical planning for bike redistributioncomes with several advantages. Exploiting mobility patterns should reduce pitfalls inredistribution operations, e.g., placing bikes where they are not requested. Operatorsshould become more efficient over time as they gain experience and knowledge in per-forming the regular tours, compare Bard and Jarrah (2009). Besides, tactical planningshould seemingly increase the reliability of service since users learn when and whereoperators increase the asset provision of stations.
Achieving a suitable trade-off between costs and service level involves a complex syn-chronization of redistribution and vehicle routing decisions in space and time that we canmodel as a service network design problem. The resulting service network design for bike
2
Integrating Resource Management in Service Network Design for Bike Sharing Systems
CIRRELT-2018-17

sharing system (SNDBSS) determines 1) FLAs counteracting expected user demand, 2)transport services pairing pickups with deliveries of FLAs, and 3) master tours sequenc-ing FLAs to implement the selected transport services within the underlying stationinfrastructure.
Operators must allocate resources to implement master tours at the operational phase.Therefore, integrating resource management decisions in SNDBSS is crucial to obtain re-liable master tours that require few adjustments within the operational phase. Resourcemanagement decisions consider the rational use of vehicles with respect to given bud-get limitation as well as the necessary handling time to perform pickup and deliveryoperations. According to de Chardon et al. (2016), operators spend a significant partof their workday in handling bikes. Therefore, a master tour does not only consider atime-ordered sequence of station visits but also indicates handling time at each of suchvisits. Although the relevance of resource management suggests itself, state-of-art formu-lations addressing the tactical planning process of BSSs either neglect or make simplifiedassumptions of at least one of these decisions. In fact, de Chardon et al. (2016) putemphasis on the minor success of such formulations in practice as operators outperformthem by their own collected experience. This clearly reflects the need for more researchefforts to integrate resource management at the tactical planning level.
The contribution of this work is twofold. First, we introduce a new and compre-hensible formulation of SNDBSS which integrates resource management decisions at thecore of the tactical planning process. The SNDBSS is formulated as a time-expandednetwork describing redistribution and vehicle routing decisions. This time-expanded net-work takes the form of a mixed-integer programming (MIP) problem. Second, we presenta solution methodology to deal with real-world sized problem instances of the MIP prob-lem. This methodology relies on a neighborhood search based matheuristic to producesolutions of near-optimal quality. The matheuristic carefully chooses and fixes variablesassociated with vehicle routing decisions thus defining reduced MIP problems which canbe solved using exact methods. To speed up the search for high-quality solutions, wepropose a construction heuristic for feasible starting solutions of reasonable quality. Theconstruction heuristic breaks down the decision-making process into three steps: thegeneration of FLAs, the pairing of FLAs, and the sequencing of FLAs. While the con-struction heuristic drastically reduces computational effort, it also suggests a reasonablenumber of redistribution vehicles. Computational experiments provide evidence aboutthe efficiency of the proposed solution methodology.
The paper is organized as follows. Section 2 introduces business models adopted formost BSSs. In Section 3, we describe the scope of the tactical planning process for BSSs.Section 4 briefly reviews the existing literature in bike redistribution and service networkdesign. In Section 5, we introduce the time-expanded network formulation. The solutionmethodology is presented in Section 6. In Section 7, we report on the computationalexperiments. Finally, conclusions are given in Section 8.
3
Integrating Resource Management in Service Network Design for Bike Sharing Systems
CIRRELT-2018-17

2 Business Models
In particular, BSSs adopt user-based business models which have a major impact on theredistribution process. Since most BSSs aim to enhance mobility in urban areas insteadof generating profits, bike rentals are typically inexpensive or even free for short traveltimes. These scarce revenue obtained through bike rentals limit the budget for bikeredistribution.
The business model establishes both the organizational and contracting structure ofa BSS (Institute for Transportation and Development Policy, 2014). The organizationalstructure defines tasks and responsibilities of each entity involved in the project. Thecontracting structure formalizes the relationships between such entities. In particular,the organizational structure is conformed of the municipality, contractors, and operators.The municipality is the public entity that supports the planning and implementation ofa BSS. Contractors are the entities which participate in the ownership, financing, andoperation of a BSS. Finally, the operator is the entity responsible for daily operators.
The contracting structure specifies which entities own the assets of the BSSs andwhich entities are responsible for operations. Typically, BSSs are owned by municipal-ities but are operated by private operators. According to Institute for Transportationand Development Policy (2014), a major part of BSSs follows this contracting struc-ture. Hence, municipalities do not depend on third parties to make decisions, while theydelegate critical processes (like bike redistribution) to efficient operators. We note thatthe contracting structure influences the objectives of a BSS: while public owners aim atenhancing public transport, private owners usually follow profit-oriented basis. In thispaper, we focus on the public-ownership-and-private-operated contracting structure.
In principle, the municipalities and operator negotiate the monetary budget to per-form redistribution as well as service level expectations. Although this negotiation pro-cess is out the scope of this paper, it is clear that the redistribution process suffers froma trade-off between the achieved level of service and the given budget. If the budgetis scarce, operators should focus on high-demanded stations where each redistributionoperation has a major impact on the level of service. By enlarging the budget, operatorsmay increase their operational flexibility by addressing low-demanded stations as well.
In Figure 2, we illustrate aspects influencing the bike redistribution process. In-creasing the monetary budget permits more redistribution as operators can acquire morevehicles. In turn, this permits to increase the asset provision at stations. Thus, theservice level is the result of successful and failing user requests given the asset provision.Although It would be expected that a high level of service leads to more revenues theyare scarce in BSSs because of most trips are free-of-charge. Finally, the revenues can beinvested in additional redistribution resources.
4
Integrating Resource Management in Service Network Design for Bike Sharing Systems
CIRRELT-2018-17

redistribution
provision service level
revenue
budget
requests
+
+
+
x
+
+
Figure 2: Aspects influencing the redistribution process.
3 Tactical Planning Process
The redistribution process involves logistical challenges associated with trade-offs amongstakeholder objectives related to resource usage and service level. Therefore, we considerconvenient to frame tactical planning decisions in management processes which aid thedecision-making in bike redistribution. We identify four processes: data acquisition aswell as demand, service, and resource management. In the following, we sketch each ofthese management processes.
3.1 Data Acquisition
Tactical planning relies on a suitable prediction of expected demand to produce reliablemaster tours. We understand expected demand in terms of users’ desired trips betweenstations during the day. Predicting expected demand is nowadays possible by analyzingoperational data recorded by information systems (O’Brien et al., 2014; Vogel et al.,2011). Operational data include the asset provision at each station and time of day,together with recorded bike trips characterized by rental and return stations with theirrespective timestamps (see Table 1). Research studies provide evidence that the spatialand temporal characteristics of trips strongly depends on mobility patterns. Mobilitypatterns answer when, where, and for which purpose users perform trips. Trip purposesinclude commuting, tourist, leisure, errands, sport, and so on. Weather conditions havean influence on trips since users prefer cycling in warm and dry days (Corcoran et al.,2014; Faghih-Imani et al., 2014). To generate input data for tactical planning, we ag-
5
Integrating Resource Management in Service Network Design for Bike Sharing Systems
CIRRELT-2018-17

gregate recorded trip data into ride flows as an abstract representation of user’s desiredtrips.
Table 1: Exemplary bike trip data.
id rental station id return station rental timestamp return timestamp78 176 08 Jun 2015 19:51 08 Jun 2015 20:00
We recognize some limitations in deriving expected demand from operational data.Since only successfully rental and return requests are recorded, information about cen-sored demand is not available, e.g., we do not know if a user roams to another stationif the targeted station is empty or full. Although more research efforts and data sourcesare necessary to yield a more reliable representation of expected demand, this is outthe scope of this paper. In this paper, we assume that expected demand derived fromoperational data is a suitable input for the tactical planning process.
3.2 Demand Management
Demand management aims to synchronize expected user demand with bike redistribu-tion at stations. Expected user demand is used to predict shortages of assets over theday. Demand management determines the necessary FLAs to counteract the expecteduser demand. Demand management also designs time windows where FLAs should beperformed. Time windows tell limited daily periods where FLAs have a major impactin reducing failed requests at the targeted stations. Certainly, the time window lengthstrongly depends on the station’s fill level. On the one hand, an FLA should occur be-fore the station becomes full or empty to avoid failed requests. On the other hand, atime window aims to avoid pitfalls by visiting a station too early, where the target bikevolume to pick up or delivery is not yet available. In addition, time windows impact onthe operational flexibility to coordinate station visits within the day.
The upper chart of Figure 3 illustrates the demand management process at a singlestation. The solid line shows the number of bikes in racks over time if no redistributionis performed. Notice that at some point in time this station becomes imbalanced afterseveral return requests. An FLA picks up bikes to avoid failed return requests, see thedashed line. The given time window suggests the earliest and latest time where this FLAshould take place. If the FLA occurs later than the given time windows, there existsfailed return requests because of a full station. If the FLA is performed before this timewindow, it will lead to an insufficient bike volume for avoiding that the station becomesfull later on. In the same way, a delivery FLA is depicted for the second station in thelower chart of Figure 3.
6
Integrating Resource Management in Service Network Design for Bike Sharing Systems
CIRRELT-2018-17
time
time
bik
esin
rac
ksat
sta
tio
n1
bik
esin
rac
ksat
sta
tio
n2
FLA
(p
icku
p)
FLA
(d
eliv
ery)
failed return requests
failed rental requests
capacity
capacity
Figure 3: Redistribution process between two stations.
3.3 Service Management
Service management deals with spatial and temporal interdependencies between stationswithin the redistribution process. Notice that bike redistribution takes place in a closedsystem wherein users and vehicles can move a single bike several times per day. Hence,bikes that are picked up at one station must be delivered to another station later on. Ser-vice management relies on an assignment problem to determine time-dependent transportservices, thus pairing pickups and deliveries of bikes.
The interplay of upper and lower charts of Figure 3 illustrates the service managementprocess at two stations with monotone demand patterns. Here, the solution is to pick upbikes at station 1 and deliver them to station 2. We observe interdependencies regardingthe time, space as well as and bike volume. On the one hand, if the pickup of bikesoccurs too early at station 1, the redistribution volume does not suffice to significantlyreduce failed rental requests at station 2. On the other hand, delivering bikes too early at
7
Integrating Resource Management in Service Network Design for Bike Sharing Systems
CIRRELT-2018-17
station 2 is not possible due to insufficient free racks. This is clearly a trivial example: inreal-world sized BSS, the number of stations is usually in the hundreds while monotonedemand patterns at stations are rarely observed. Hence, determining adequate transportservices in practice is challenging.
3.4 Resource Management
This management process aims to use resources in a cost-efficient manner. Since resourcemanagement permits the implementation of transport services within the operationalprocess, its integration at the tactical planning is of utmost importance. Notice that theredistribution process is one of the most costly operations in BSSs (Intelligent EnergyEurope, 2011).
Resource management considers fixed costs for acquiring vehicles as well as fuel costsfor operating them. Driving staff is paid according to either the working time or thenumber of bikes redistributed per day (de Chardon et al., 2016). Each vehicle is assignedto a master tour. A master tour is a time-ordered sequence of stations visited, starting andending at the depot. Apart from the necessary driving time for station visits, consideringhandling time for picking up or delivering bikes is crucial to obtain reliable master tours.Notice that driving staff spends a significant part of their workday on handling operationsat each station visit (de Chardon et al., 2016). The task of generating master tours canbe addressed as a pick-up and delivery problem where service times are related to theduration of handling operations at stations.
3.5 Interdependencies within Management Processes
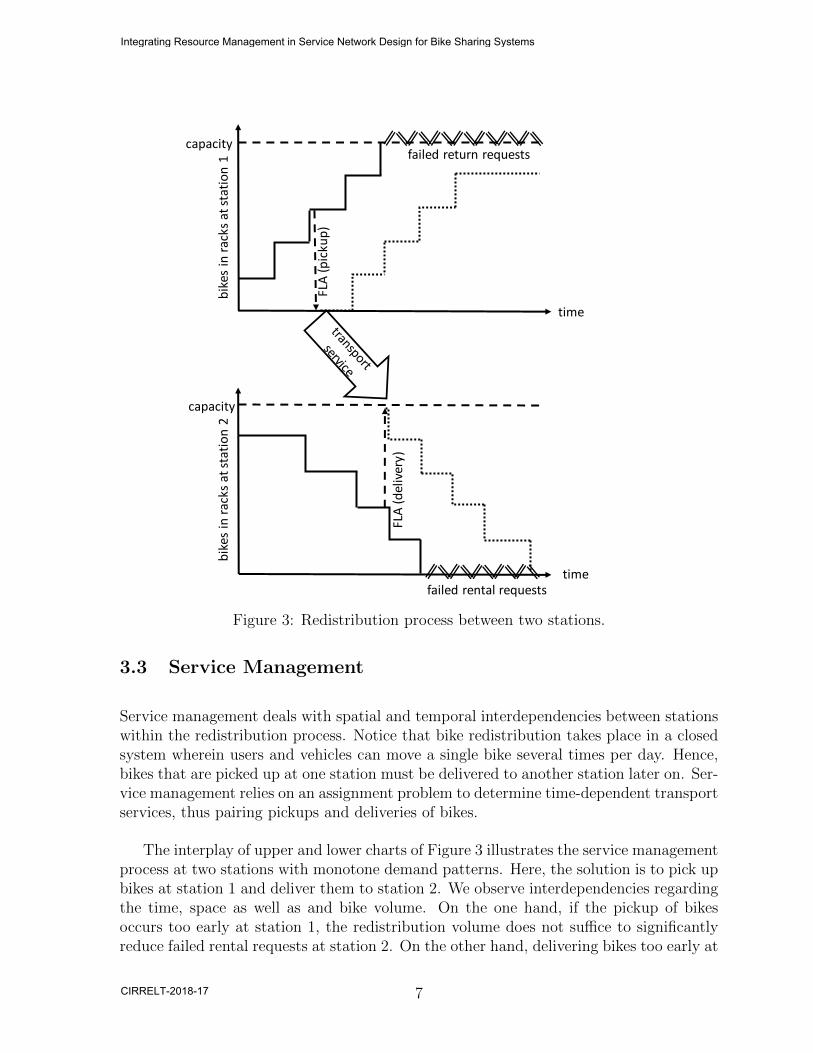
The management processes comprising tactical planning of BSSs are strongly interwoven.This implies that decisions determined at one management process may have a majorimpact on the other processes. Figure 4 shows the interdependencies between manage-ment processes. Each square frames a management process. An arrow relates a decisionwith two management processes: each arrow comes from the management process wherethe respective decision takes place and ends at the management process which is affectedby this decision. Ovals depict synchronization concerns within pairs of managementprocesses.
The relation between demand and service management mainly concerns with timesynchronization. The design of time windows for performing FLAs plays a fundamentalrole. The tighter the time windows, the more lack of synchronization between the pickupand delivery FLAs are expected since there is less operational flexibility for establishingtransport services. Enlarging time windows increases the operational flexibility at the
8
Integrating Resource Management in Service Network Design for Bike Sharing Systems
CIRRELT-2018-17

resource management
service management
demand management
redistribution volumes
driving times
volumesynchronization
spatialsynchronization
time synchronization
Figure 4: Interdependencies of redistribution decisions between management processes.
expense of reducing the bike volume to pick up or deliver at FLAs.
The relation between demand and resource management mainly impacts on volumesynchronization. Given certain provision of resources, adding FLAs to the redistributionplan leads to less time for handling bikes because vehicles must spend more time forvisiting stations. Therefore, rationalizing the number of FLAs is crucial for an efficientuse of resources.
The interdependencies between service and resource management are described interms of space synchronization. A transport service with its respective redistributionvolume implies that a vehicle drives between two stations. This means that the distancecovered by transport services must be reasonable to avoid excessive driving time.
To produce a reliable redistribution plan, we must consider all these aspects when de-signing a formulation of SNDBSS. In the next section, we show that existing formulationsneglect or made simplifying assumptions to represent these aspects and their interdepen-dencies. In addition, we give a sound basis for catching the redistribution aspects into aservice network design problem.
9
Integrating Resource Management in Service Network Design for Bike Sharing Systems
CIRRELT-2018-17

4 Literature Review
First, we review the literature on bike redistribution in BSSs. Then, we highlight the roleof service network design in transport planning as well as current advances to integrateresource management decisions.
4.1 Redistribution in Bike Sharing Systems
In recent years, shared mobility systems have been a source of intensive research. Laporteet al. (2015) provide a rich review of related literature over the past ten years on car-and bike sharing systems. These studies include size and location of stations, number ofshared vehicles in the system as well as redistribution to mitigate failed requests.
We notice that a major part of these studies focuses on overnight redistribution,where the demand management is omitted since user demand is assumed as negligiblewhen vehicles are operating (Raviv et al., 2013). In overnight redistribution, the maingoal is to achieve target station’s fill levels. There is a wide range of solution methodsaddressing formulations of the static case including among others neighborhood-searchbased schemes (Rainer-Harbach et al., 2015), tabu search (Ho and Szeto, 2014), exactmethods based on Bender cuts (Erdogan et al., 2015), and decomposition schemes (Formaet al., 2015). The reader is referred to Espegren et al. (2016) for a more extensiveliterature review. Nevertheless, overnight redistribution does not suffice to achieve ahigh quality of service. In practice, high-demanded BSSs require redistribution over theday (de Chardon et al., 2016).
In comparison with the static case, there exist few studies addressing intra-day redis-tribution. Although this paper focuses on the tactical planning process, we recognize thatbike redistribution constitutes an operational process as well. In the operational process,short-term decisions are made in a dynamic and stochastic environment, where vehiclerouting decisions and individual trips must be accurately represented in time and space.Instead of tactical planning, operational decisions are subject to day-to-day informationwith respect to weather as well as traffic and special events.
Regarding literature addressing the operational process, Brinkmann et al. (2015) pro-pose a single-vehicle, stochastic inventory routing problem, where the objective is tominimize the gap between the number of bikes in racks at stations and a certain safetystock of assets. Pfrommer et al. (2014) investigate the trade-off between the costs ofoffering incentives for returning shared vehicles at low-demanded stations and the costsof redistributing bikes. Kloimullner et al. (2015) introduce a cluster-first route-secondapproach with the strong assumption that operators only address full and empty stations.The approach relies on a Benders decomposition scheme. The master problem takes the
10
Integrating Resource Management in Service Network Design for Bike Sharing Systems
CIRRELT-2018-17

form of an assignment problem that links stations with vehicles, whereas subproblemstake the form of traveling salesman problems. Solutions of the subproblems are usedto generate Benders cuts for the master problem. Zhang et al. (2017) introduce a non-linear formulation to take redistribution decisions based on a short-term forecast of userdemand. The authors linearize the underlying formulation for addressing large probleminstances. In addition, they propose a methodology which solves the linear relaxationin a first step and solves set covering problems to assign given vehicles to routes in asecond step. This paper also recognizes the existence of pitfalls in short-term decisionsbecause of forecasting errors. These errors are reduced by embedding the formulationinto a rolling horizon approach. Although research efforts can be devoted to mitigatethese pitfalls in the operational process, we believe that the generation of redistributionplans at the tactical planning is highly beneficial.
Existing tactical formulations make simplifying assumptions with respect to one orseveral management processes that were highlighted in Section 3. For example, Contardoet al. (2012) present a MIP formulation over a time-expanded network, where nodesencode station and time period. Each of such nodes involves a demand in terms ofrental or return requests. Service management is neglected because the MIP formulationassumes that bikes are artificially added or removed from the BSS if assets do not sufficeto meet demand at nodes. The objective function minimizes such artificial operations,whereas costs related to resource management are not taken into account. To addressthe formulation, Dantzig-Wolfe and Benders decomposition is used to derive lower andupper bounds.
Kloimullner et al. (2014) adapt the formulation of the static case presented in Rainer-Harbach et al. (2015) in order to cope with intra-day redistribution at the tactical plan-ning. Given a certain provision of vehicles as input data, the objective function relies ondifferent weights to minimize (1) failed requests, (2) the difference between achieved andfinal number of bikes in racks at stations at the end of the redistribution time, (3) driv-ing time, and (4) redistributed bikes. Resource management decisions associated withdriving and handling time are not accurately represented since the workday is discretizedinto hourly time periods.
Vogel et al. (2014) propose a resource allocation problem that produces time-dependenttransport services with the aim of minimizing shortage of assets at stations. The underly-ing MIP formulation neglects resource management since it does not take vehicle routingdecisions into account. Therefore, the resulting redistribution plan suffers from a lack ofsynchronization of the transport services (Neumann-Saavedra et al., 2015).
Brinkmann et al. (2016) propose a multi-vehicle inventory routing problem assumingperfect demand knowledge over the target planning horizon. The authors propose thenotion of fill level intervals at stations. A fill level interval indicates a desired numberof bikes in racks at the respective time. They assume that such intervals are given by
11
Integrating Resource Management in Service Network Design for Bike Sharing Systems
CIRRELT-2018-17

external decision support systems. Costs associated with resource management are nottaken into account. The aim of redistribution bikes is to minimize the gap between actualfill levels and the desired intervals. Solution methodology combines spatial and temporaldecomposition of redistribution decisions. At each time period, the network infrastructureis geographically partitioned, where each partition is served by one vehicle.
In Angeloudis et al. (2014), the redistribution plan is produced in two steps. Thefirst step yields tours by solving a multi-vehicle traveling salesman problem. Then, thesecond step relies on a flow assignment model for determining redistribution volumes.The goal is to achieve a target number of bikes at racks at stations as close as possible.Regarding resource management, this work does not consider an accurate representationof handling time, whereas redistribution costs are not taken into account.
4.2 The Role of Service Network Design in Transport Planning
Service network design has its roots in the tactical planning of transport carriers. Tobe competitive in the growing market, less-than-load carriers must transport goods suchthat they ensure a reliable service while rationalizing transport activities. As the volumeof goods requested by a customer is typically small with respect to the capacities of ve-hicles, consolidated transport is crucial to operate in a cost-efficient manner. The role ofservice network design is to coordinate consolidated transports in space and time. Theresult is a service network, that is, services that route demand among a network of ter-minals according to policies and guidelines established at the tactical planning (Crainicand Laporte, 1997). Service network design have been used in maritime transport (Chris-tiansen et al., 2007), rail transport (Cordeau et al., 1998), intermodal transport (Crainicand Kim, 2007), and freight transport (Crainic, 2000), among others.
Implementing the service network requires resources like vehicles, drivers, and powerunits. Therefore, integrating resource management decisions in service network designhave become an issue of utmost relevance in the research community. In recent years,service network design has been extended to coordinate vehicle movements with theservice network (Andersen et al., 2009) and to recognize that resources to route demandat terminals are limited and involve fixed costs (Crainic et al., 2014b). Integrating theseresource-management decisions to service network design leads to more consistent planswhich require minor adjustments within the operational process.
Time-expanded network formulations are extensively used to represent time-dependentdecisions. In this way, terminals are replicated once per each discretized time period,whereas flows connect these time-dependent nodes. Hence, nodes encode terminal andtime period, whereas flows encode decisions with respect to the service network and useof resources. This time-expanded network typically takes the form of MIP formulationswhich, in most cases, are computationally intractable using exact methods. Sophisticated
12
Integrating Resource Management in Service Network Design for Bike Sharing Systems
CIRRELT-2018-17

solution methods are necessary to produce solutions of good quality in a reasonable run-time. The literature reports solution methodologies based on tabu search (Pedersen et al.,2009; Vu et al., 2013), cutting-plane methods (Chouman and Crainic, 2014), decompo-sition schemes (Teypaz et al., 2010), and scope scaling (Crainic et al., 2014a), amongothers.
In this paper, we consider a service network design problem to support the bikesharing redistribution process. We follow advances in transport planning to adequatelydepict master tours by means of a time-expanded network formulation. Advances intransport planning lay the foundations to integrate resource management decisions inSNDBSS. For the intra-day redistribution process, however, we require a more sophisti-cated time-expanded network formulation to accurately represent management processesat the tactical planning level.
5 Time-Expanded Network Formulation
We embed the decision-making process of bike redistribution in a time-expanded net-work formulation. We start defining notation for the physical nodes (vehicle depot andstations) of the BSS infrastructure. Let S0 = S ∪ {0} be the set of physical nodes. Theset S = {i} = {1, 2.., |S|} represents stations, whereas the physical node {0} representsthe vehicle depot. Each station i ∈ S has a capacity of ci racks. The vehicle depot hasno capacity to place bikes, meaning that c0 = 0.
We state that the redistribution process occurs within a defined workday length, whichis divided into chronologically and equal-length time periods T = {t} = {0, 1, ..., T }. Theworkday length is cyclic assuming that time period 0 follows time period T .
We define the time-expanded network G as follows. We represent each station i ∈ Sand time period t ∈ T by two node types: 1) the rack node (i, t) ∈ NS, and 2) the vehicle
node ˆ(i, t) ∈ NV . A rack node encodes the number of bikes in racks at the respectivestation and time period. A vehicle node encodes the number of loaded bikes in a vehicleif it parks at the respective station and time period. Then, we also replicate the depotover the time periods. The joint of the rack node set NS with the depot replications intime represents the node set N0. With this notation, we can depict the interplay betweenvehicles and stations in a clear and consistent manner.
Let b denote the size of the bike fleet. We assume that the same number of bikes areplaced at stations both at the beginning and end of the workday length. In time period0, empty vehicles park in the depot. Within the workday length, the number of bikesin racks and vehicle at the respective nodes are updated at the end of each time periodaccording to the inflows and outflows of bikes.
13
Integrating Resource Management in Service Network Design for Bike Sharing Systems
CIRRELT-2018-17

Table 2: Flow definition in the time-expanded network.
source node destination node flow layer process decision
vehicle vehicle redistribution service management transport servicerack rack vehicle resource management master tourrack vehicle redistribution resource management (pickup) FLAvehicle rack redistribution resource management (delivery) FLA
Let A represent the set of links connecting nodes of the time-expanded network.We characterize each link a ∈ A by a origin-destination node pair. In this way, linksencode time-dependent flows. These flows are grouped in three layers representing aspectsassociated with demand, service, and resource management. In this work, they are calledride, vehicle, and redistribution flow layer, respectively. Table 2 shows the definition ofeach flow according to source and destination nodes. In the following, we describe eachflow layer in more detail.
Ride Flow Layer consists of flows between rack nodes, where each ride (bike) flowencodes expected demand. Notice that a ride flow unit obeys to an abstract representa-tion of a user’s desired trip at the demand management process. Let AU be the ride linkset. A ride link a ∈ AU indicates the existence of ride flow units ζa. These ride flows aregiven by input data.
Vehicle Flow Layer connects rack nodes depicting master tour decisions associatedwith the resource management process. The vehicle link set AV permits decisions withrespect to vehicle movements and duration of station visits within the workday length.This set is comprised by the vehicle movement link set AVM , the holding link set AHO,and the handling link set AHA. A vehicle movement link e ∈ AVM allows the decisionthat one vehicle moves between two nodes. A holding arc link e ∈ AHO permits that oneor more vehicles park at the depot during one time period. A handling link e ∈ AHA
permits that one loaded vehicle stays at a station to either pick-up or deliver bikes duringone time period. The vehicle flows are scheduled such that they represent feasible mastertours.
Redistribution Flow Layer encodes either transport services between two vehiclenodes, or FLAs as an interplay between rack and vehicle nodes (pickup) or vice versa(delivery). In this way, this layer is associated with service and resource managementdecisions. We denote the redistribution link set by AR to represent bike transportationand handling operations. A transportation link a ∈ AT permits the movement of acertain bike volume only if the corresponding transport service is set. A transportationlink connects two vehicle nodes from different stations to move the redistribution volume
14
Integrating Resource Management in Service Network Design for Bike Sharing Systems
CIRRELT-2018-17

rack
dep
ot
workday length
0 1 2 3 4 5 6
stat
ion
1
vehicle
rack
stat
ion
2
vehicle
redistribution flowvehicle flow
Figure 5: The cyclic time-expanded network of SNDBSS.
from one station to another. Handling operations are depicted by links representing theinterplay between rack and vehicle nodes. To this end, we define the pick-up link setAP and the delivery set AD. If a handling link e ∈ AHA is set, either the correspondingpick-up link a ∈ AP allows pick-up flow units of bikes from a rack node to a vehicle nodeduring one time period, or the delivery flow of bikes is permitted by the correspondingdelivery link a ∈ AD from a vehicle node to a rack node. We denote the pick-up anddelivery link associated by a handling link e by P(e) and D(e), respectively.
Notice that pickup and delivery activities must not simultaneously occur if the corre-sponding handling link is set. If the formulation considers handling costs in the objectivefunction, simultaneous pickup and delivery activities will never occur in an optimal so-lution. Nevertheless, if handling costs are excluded from the objective function, thetopology of the search space must generate consistent solutions with respect to such abehavior as well. Therefore, to obtain the desired behavior regardless of the objectivefunction, the formulation presented below considers the binary variable αe ∈ AHA. Thisbinary variable equals one if pick-up bike flows though a ∈ P(e) are permitted, otherwisethe delivery of bikes though D(e) is permitted.
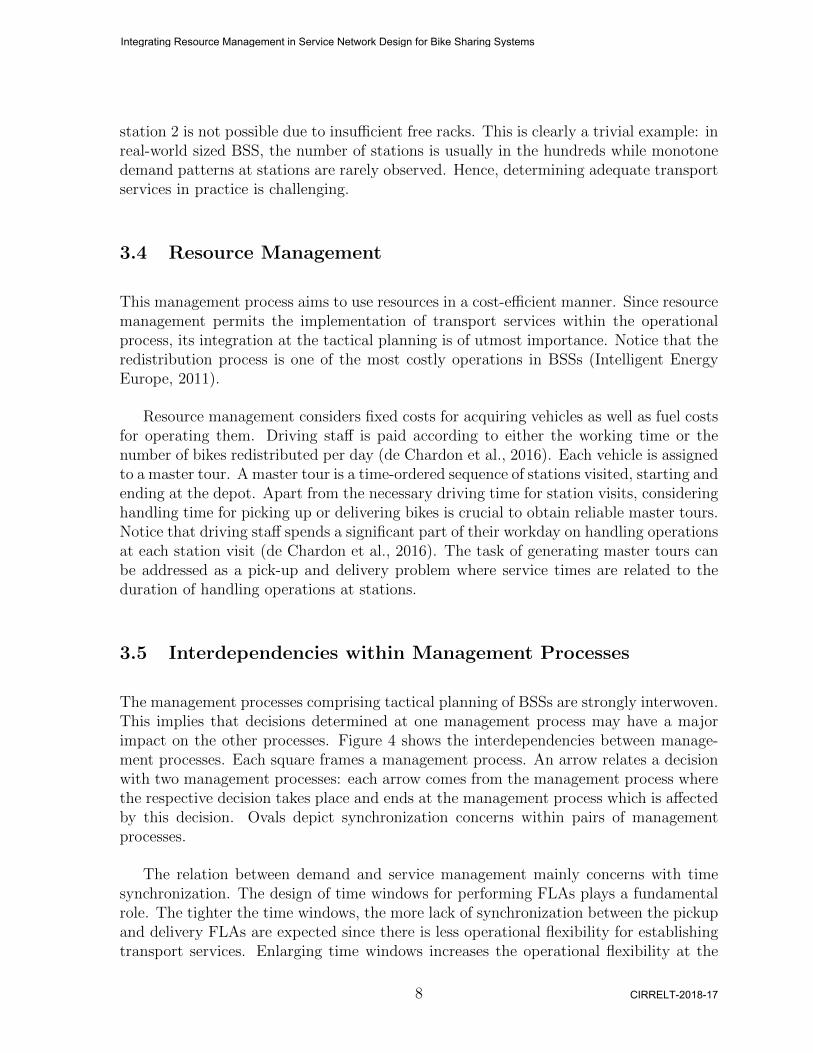
In Figure 5, we show a time-expanded network with two stations and seven timeperiods. The y-axis represents physical nodes of a BSS infrastructure, whereas the x-axisrepresents the workday length by time periods. The black fill of each node depicts thestation’s fill level or vehicle load, accordingly. Hence, a completely white node meansthat the station (or vehicle) is empty, whereas a completely black node tells that thestation is full. We observe that stations 1 and 2 becomes respectively full and empty dueto ride flows that are not shown for the sake of illustration. A master tour is depicted
15
Integrating Resource Management in Service Network Design for Bike Sharing Systems
CIRRELT-2018-17

Table 3: Variables and parameters for the MIP formulation of SNDBSS.
variable type description
v integer vehicle fleet sizexa real bike flow units though link a ∈ A
za real unmet ride flow units though link a ∈ AU
ye integer vehicle flow units though link e ∈ AV
I ti real bikes at rack node (i, t) ∈ NS
ωti real bikes at vehicle node ˆ(i, t) ∈ NV
αe binary one if pick-up flow unites are permitted though link a ∈ P(e) , zero otherwise
parameter type description
ci integer capacity of station i ∈ Sb integer total number of bikes in the BSSζa integer demand of ride flow units though link a ∈ AU
VMAX integer maximal size of the vehicle fleetC integer vehicle capacityµe integer maximal bike flow capacity through the link a ∈ Re
F real fix cost per vehicle usedqa real cost per pick up o deliver flow unit though link a ∈ AP ∪AD
ke real fix cost per vehicle flow unit through link e ∈ AVM ∪AHA
βa real penalization cost per unmet ride flow unit
as a schedule of vehicle flows. First, the vehicle stays at the depot one period, whichis represented by a holding vehicle link. Then, the vehicle requires one time period forarriving at station 1. Notice that the vehicle parks at station 1 for one time period. Here,a pickup flow tells that bikes are moved from the station to the vehicle, thus varying thefill of the respective rack and vehicle nodes. After that, the loaded vehicle drives tostation 2. Again, the vehicle stays there one time period to move bikes from the vehicleto the station. Finally, the vehicle must return to the depot.
We now defines variables of the formulation. Let I ti and wti represent the number of
bikes at nodes (i, t) ∈ NS and ˆ(i, t) ∈ NV , respectively. Each vehicle has a load capacityof C bikes. Let v be the vehicle fleet size. The maximal vehicle fleet size is defined byVMAX
Let ye represent the design decision determining the vehicle flow units assigned to thelink e ∈ AV . The variable xa represents the bike flow units through the link a ∈ A∩AV .We represent unmet ride flow units using the flow variable za, ∀a ∈ AU . If a handlinglink e ∈ AHA is set, a maximal of µe bikes can be picked up or delivered through link e.Additionally, let R(e) be the set of redistribution links that can generate bike flows whenthe vehicle link e ∈ AV is set.
We consider the following redistribution costs. Let F represent the fixed cost for usingone vehicle. We define ke as the fixed costs to set a link e ∈ AM ∪AHA. Finally qa is cost
16
Integrating Resource Management in Service Network Design for Bike Sharing Systems
CIRRELT-2018-17

per handled bike with a ∈ AP ∪ AD. Let A+(i, t) and A−(i, t) represent the outgoingand incoming link set at node (i, t) ∈ N0, respectively. Variables and parameters of theformulation are summarized in Table 3. With the notation described before, the MIPformulation reads as follows:
min{Fv +
∑e∈AV M∪AHA
keye +∑
a∈AP∪AD
qaxa +∑a∈AU
βaza}
(1)
s.t.xa + za = ζa, ∀a ∈ AU (2)
Iti ≤ ci, ∀(i, t) ∈ NS (3)∑i∈S
I0i = b (4)
It+1i = Iti −
∑a∈A+
U (i,t)∪A+P (i,t)
xa +∑
a∈A−U (i,t+1)∪A−
D(i,t+1)
xa, ∀(i, t) ∈ NS : t < T(5)
∑a∈A+
U (i,t)∪A+P (i,t)
xa ≤ Iti , ∀(i, t) ∈ NS : t < T(6)
ωt+1i = ωti −
∑a∈A+
Tˆ(i,t)∪A+
Dˆ(i,t)
xa +∑
a∈A−T
ˆ(i,t+1)∪A−P
ˆ(i,t+1)
xa, ∀ ˆ(i, t) ∈ NV : t < T(7)
ωti = 0, ∀i ∈ S,∀t ∈ {0, T } (8)∑a∈A+
V Mˆ(i,t)∪A+
Dˆ(i,t)
xa ≤ ωti , ∀ ˆ(i, t) ∈ NV : t 6= {0, T }(9)
ωti ≤ C∑
e∈A−V (i,t)
ye, ∀ ˆ(i, t) ∈ NS , : t 6= {0, T } (10)
∑a∈R(e)
xa ≤ Cye, ∀e ∈ AVM ∪AHA (11)
xa = 0, ∀a ∈ AVM : i(a) = 0 ∨ j(a) = 0 (12)
xa ≤ µe(1− αe), ∀e ∈ AHA : a ∈ P(e) (13)
xa ≤ µeαe, ∀e ∈ AHA : a ∈ D(e) (14)∑e∈A+
Vˆ(i,t)
ye =∑
p∈A−V
ˆ(i,t)
ye, ∀ ˆ(i, t) ∈ N0 : t 6= {0, T } (15)
∑e∈A+
V (0,0)
ye =∑
p∈A−V (0,T )
ye = v (16)
v ≤ VMAX (17)
Iti ≥ 0. ∀(i, t) ∈ NS (18)
ωti ≥ 0. ∀ ˆ(i, t) ∈ NV (19)
17
Integrating Resource Management in Service Network Design for Bike Sharing Systems
CIRRELT-2018-17
xe ≥ 0, ∀a ∈ A\AHO (20)
za ≥ 0, ∀a ∈ AU (21)
ye ≥ Z+, ∀e ∈ AHO (22)
ye ≥ {0, 1}, ∀e ∈ AV \AHO (23)
v ∈ Z+ (24)
The objective function (1) minimizes the sum of costs associated with the redistri-bution plan and the demand of ride flows that are not met. Equation (2) determineswhether the ride flow demand are met. Equation (3) ensures that the number of bikes ata rack node cannot exceed the station capacity. Equation (4) ensures that all bikes areplaced at some station at the beginning of the workday length. The flow conservationof bikes at rack nodes is ensured by Equation (5). Equation (6) imposes that the bikeoutgoings from a rack node do not exceed the number of bikes that are currently placedat the station. Equation (7) ensures the flow conservation of bikes at vehicle nodes.Equation (8) enforces that vehicles are empty at the beginning and end of the workdaylength. Equation (9) ensures that the bike outgoings from a vehicle node do not exceedthe number of bikes of the vehicle load. Equation (10) determines that the vehicle nodecan have bikes only if it is visited by a vehicle. Equation (11) connects the vehicle linkswith the possibility to move bike. Bikes can be moved neither from nor to the depot(12). Equations (13) and (14) ensures that bikes are not simultaneously picked-up anddelivered at a station and time period. The vehicle-balance constraints are establishedin (15). Equation (16) ensures that all vehicles start and end master tours at the de-pot. The vehicle fleet size is bounded by Equation (17). Finally, the variable domain isestablished in (18 - 24).
6 Solution Methodology
By integrating resource management decisions to SNDBSS, even moderately-sized prob-lem instances become computationally prohibitive with the sole use of exact techniques.Since commercial solver must balance vehicle flows at nodes, they slowly converge tofeasible solutions, compare Andersen et al. (2009). However, we note that by fixing amajor part of vehicle flow variables, a solver can find the optimal solution of the result-ing reduced MIP problem quickly. We take advantage of this observation to design amatheuristic. The matheuristic relies on a neighborhood-search scheme that iterativelybuilds and solves reduced MIP problems to exploit areas of the search space efficiently,see for example Hewitt et al. (2010).
It is a matter of experience that neighborhood-search schemes require some startingsolution of reasonable quality to speed up the exploration process. In addition, we note
18
Integrating Resource Management in Service Network Design for Bike Sharing Systems
CIRRELT-2018-17

that for service network design models, neighborhood-search schemes cannot adequatelybalance fixed costs of using vehicles with other costs associated with the problem. Inother words, such schemes have cannot adequately determine the vehicle fleet size (Hoffet al., 2010). Therefore, we propose a construction heuristic which breaks down thedecision-making process of bike redistribution into three phases: the generation of FLA(demand management), the pairing of FLA into transport services (service management),and the sequence of transport services into master tours (resource management).
6.1 Matheuristic
Given a starting solution, the matheuristic successively builds and solves neighborhoodsuntil it reaches a termination criterion. A neighborhood comprises a set of variables: allvariables outside the neighborhood are fixed, whereas the variables inside the neighbor-hood define a reduced MIP problem.
To obtain feasible solutions with respect to the vehicle-balance constraints, the matheuris-tic carefully chooses vehicle flow variables depicting vehicle detours. Given master toursof the incumbent solution, a feasible detour tells the time period where the vehicle leavesits assigned master tour, a time-ordered sequence of station visits within the detour, thehandling time at each station visit, and the time period when the vehicle returns to theoriginal master tour.
A neighborhood contains all vehicle flow variables that define master tours in theincumbent solution, as well as all vehicle flow variables that defines detours opportu-nities chosen by the matheuristic. All vehicle flow variables outside the neighborhoodare fixed. Other continuous variables comprising the SNDBSS instance are part of theneighborhood. Hence, a solver determines which set of vehicle flow variables inside theneighborhood yields the lowest objective value, while satisfying the constraints sets ofthe reduced MIP problem. Notice, that the matheuristic can address very large prob-lem instances of SNDBSS since it does not require the full problem instance to be incomputational memory.
It is well-known that neighborhood-search schemes require a suitable calibration ofsize and structure of neighborhoods for a reasonable trade-off between solution qualityand computational efforts (Hewitt et al., 2010; Ahuja et al., 2002). In the following, weintroduce neighborhood operators that carefully choose a promising and reasonably-sizedset of detours to define reduced MIP problems.
19
Integrating Resource Management in Service Network Design for Bike Sharing Systems
CIRRELT-2018-17

6.2 Neighborhood Operators
To design the neighborhood operators, we follow Hoff et al. (2010) who introduce a vari-able neighborhood search (VNS) for stochastic service network design problems in freighttransportation. Their VNS regularly swaps apriori-defined neighborhoods within itera-tions. The authors propose two neighborhood structures: the first one exploits promisingareas of the search space, that is, vehicle movements that involve a high transport volumeof commodities between location pairs, whereas the second one allows random moves toexplore solutions that the first structure cannot reach. Although the idea behind bothstructures can be adapted to address the SNDBSS, defining neighborhoods a priori seemsan inferior strategy because of strongly interdependencies between flow layers and sta-tion’s fill levels. Therefore, the proposed matheuristic dynamically builds neighborhoodsaccording to the incumbent solution.
We define a vehicle link to be “active” if the respective vehicle flow variable takes apositive value in the incumbent solution. A rack node is active in the case of a vehiclevisits it. A vehicle link becomes “candidate” if a neighborhood operator chooses it. In oneiteration, both candidate and active vehicle flow variables comprise the neighborhood.
Neighborhood operators choose candidate vehicle links so that feasible detours areobtained with respect to the design-balance constraints. Figure 6 shows in a portion ofa time-expanded network how a neighborhood can look like. For the sake of simplicity,vehicle nodes and redistribution flows are not depicted. Solid lines depict active vehiclelinks, whereas dashed lines depict candidate vehicle links. We observe that candidatevehicle links define two possible detours. Notice, that a detour may involve two stationvisits as long as the detour returns somewhere to the original master tour. Certainly,there exist more detour possibilities that can be derived from the incumbent solution.
Each detour is suggested as follows. First a sub-path connecting non-active racknodes is chosen. The sub-path involves one or two stations within the detour. Weassign handling time at each station by a certain number of successive handling links.The maximal number of time periods that a vehicle stays at a station cannot exceedthe number of time periods required to completely load a vehicle. To respect the design-balance constraints, we finally determine candidate vehicle links to connect the generatedsub-path with one of the vehicle tours in the incumbent solution. Notice that connectingthe generated sub-path with all master tours is possible but may lead to very largeneighborhood sizes. Therefore, the sub-path is assigned to a master tour according tothe driving cost of leaving and returning to the original master tour based on the buildsub-path. With a roulette wheel selection criteria, we establish that the lower vehiclemovement costs, the higher probability that the corresponding detour is chosen. Allowingcostly vehicle movements allows for exploring detours which may generate good decisionsfrom the service level point of view.
20
Integrating Resource Management in Service Network Design for Bike Sharing Systems
CIRRELT-2018-17

1
2
3
4
timest
atio
ns
candidate vehicle linkactive vehicle link
Figure 6: Feasible detours derived from an incumbent solution.
The way how sub-paths are chosen is crucial to conduct promising neighborhoods.Three neighborhood operators are proposed with the following criteria:
� Random-period operator (RPO): detours through different stations in one timeperiod.
� Random-station operator (RSO): detours through one station for different timeperiods.
� Fill-level based operator (FBO): detours whose corresponding redistribution deci-sions probably involve a high number of bikes.
In the following, we describe these neighborhood operators in detail.
RPO permits vehicle detours through different stations in a randomly chosen timepoint trandom. Each vehicle detour consists of: 1) one candidate vehicle movement linkconnecting one active rack node with one non-active rack node (i, t) ∈ NS | t = trandom,2) a randomly chosen number of candidate handling links to allow pick-up or delivery ofbikes, and 3) a vehicle movement link to return to one active rack node of the originalvehicle tour. Since the number of vehicle detour possibilities can get very large, thenumber of detours chosen in an iteration is limited by parameter $.
21
Integrating Resource Management in Service Network Design for Bike Sharing Systems
CIRRELT-2018-17
RSO explores several detours through a randomly chosen target station irandom overdifferent time periods. The way how vehicle detours are composed only differs from theRPO in that one candidate vehicle movement link connects one active rack node to onenon-active rack node (i, t) ∈ NS | i = irandom. Similarly to RPO, a maximal number of ϕare chosen.
FBO relies on the intuitive idea that stations with a deficit of bikes may receive themfrom a station with a surplus of bikes. FBO chooses a maximal of % vehicle detourpossibilities. The FBO conducts a vehicle detour as follows. First, the neighborhoodoperator generates a sub-path connecting non-active rack nodes. The sub-path repre-sents a transport service, together with the corresponding handling time at each station.Stations are chosen in the hope that a large bike volume between the origin and des-tination station is redistributed. FBO tries to connect the generated sub-path with anexisting vehicle tour in order to yield the detour. If this connection fails because no fea-sible detour is obtained with respect to the design-balanced constraints, the sub-path isdiscarded. The rack nodes associated with the origin and destination stations are chosenusing roulette wheel selection. The selection of the first rack node is based on the filllevel I ti/ci, ∀(i, t) ∈ NS, whereas the second rack node is based on the ratio between thenumber of free bike racks and the station capacity, i.e., (1− I ti )/ci, ∀(i, t) ∈ NS.
6.3 Defining a Suitable Mix of Neighborhood Operators
Given the characteristics of the neighborhood operators, FBO outperforms RPO and RSOthe first iterations of the matheuristic since it can identify promising transport services.However, FBO loses its effectiveness in later iterations because it easily stagnates in alocal optimum. Randomization provided by RPO and RSO helps in escaping from localoptima. Thus, there still exists the option that FBO contribute to find solutions of goodquality after escaping from local optima. We make use of these observations to determinea suitable combination of the neighborhood operators for each iteration.
Combining the above neighborhood operators to build neighborhoods permits to takeadvantage of their outstanding features. A suitable mix of neighborhood operators canguide an effective exploration of the search space even with small neighborhoods, thusreducing the computational effort. Let n denote the total number of detours chosen tobuild a neighborhood, that is, n = $ + ϕ + %. Given a value of n, we dynamicallyadjust $, ϕ, and % according to the performance of neighborhood operations in previousiterations.
Changing the relative frequency of applying neighborhood operators increases theefficiency of the matheuristic. To this end, we derive probabilities that control the numberof vehicle detours chosen by each neighborhood operator. The probabilities depend on
22
Integrating Resource Management in Service Network Design for Bike Sharing Systems
CIRRELT-2018-17

the success of the corresponding neighborhood operator, that is, the number of vehicleflow variables chosen by the neighborhood operator that comprises a new solution. Afterdefining the probabilities, a roulette wheel selection determines how many detours areallowed by each neighborhood operator in the next iteration. We spin the roulette wheeln times. The value of a detour parameter is the number of wins of the correspondingneighborhood operator in the roulette wheel. We determine a high probability of FBOagainst RPO and RSO in early iterations while decreasing the usage of FBO in furtheriterations. The decrease rate of the FBO probability depends on its contribution findingsolutions of improved quality.
Let {o} = {RPO,RSO,FBO} define the set of neighborhood operators. We definethe probability πo ∈ [0, 1] for choosing a detour using the neighborhood operator o. Initeration p, the neighborhood operator o chooses a number of co candidate vehicle links tobuild the neighborhood. The number of candidate vehicle links co the solver sets to one
is denoted by so. Based on these definitions, we define the success ratio ro = (so)2
co� 0.
Notice, that we use the squared term (so)2 to determine the ratio in order to preventthat the respective probability πo quickly decreases fast. In addition, let Θo ∈ [0, 1] be aparameter that avoids that the probability of neighborhood operator o decreases to zero.
Thus, at each iteration p, we calculate the probability πFBO for choosing a detourusing the FBS with the following equation:
πFBO := 1− ΘFBOp
rFBO + p(25)
In Equation (7), probability πFBO approximates 1−ΘFBO over iterations. ParameterrFBO controls how quick πFBO converges. The higher the value of πFBO, the slower theprobability converges to 1− ΘFBO. Figure 7 illustrates curves depicting values of πFBO
within iterations for different values of rFBO with ΘFBO = 0.7.
Regarding the probability of RPO and RSO, we follow Niehaus and Banzhaf (2001)to define the following equation:
πo = (1− πFBO)(Θo + ro
1− 2Θo
Γ
), ∀o ∈ {RPO,RSO} (26)
In Equation (26), we define Γ = rRPO+rRSO and ΘRPO = ΘRSO. On the right side ofthis equation, the first term indicates that the sum of πRPO and πRPO equals (1−πFBO).The second term adjusts the probability with respect to the success of the respectiveneighborhood operator.
23
Integrating Resource Management in Service Network Design for Bike Sharing Systems
CIRRELT-2018-17

Figure 7: Behavior of πFBO for different values rFBO, with (1−ΘFBO) = 0.3.
6.4 Construction Heuristic
The construction heuristic splits the redistribution process into three phases. Figure 8sketches the information flow between phases: each box represents a phase, whereas uni-directional information flows depict the mechanism to coordinate phases. Outputs of onephase are used as input for the next phase. This top-to-bottom coordination mechanismbreaks down interdependencies of management processes highlighted in Figure 4 sincethere is no information flow between resource and demand management. On the onehand, neglecting some of these interdependencies deteriorates time, space, and volumesynchronization throughout phases. On the other hand, breaking down these interdepen-dencies allows for substitute problems that are easier to solve than the original probleminstance of SNDBSS.
The first phase determines the maximal FLAs, that is, the necessary FLAs to fulfillgiven ride flows. This phase concerns with the demand management process determiningFLAs according to the needs of every single station. We depict FLAs by black circleswith a “P” and “D” inside for pickups and deliveries of bikes, respectively. The maximalFLAs feed the second phase of the construction heuristic.
The second phase is concerned with service management decisions within the scopeof the redistribution flow layer. The aim is to perform as many FLAs determined in thefirst phase as possible. Notice that it is possible that we cannot fulfill the maximal FLAsbecause of a volume discordance between the bikes to pick up and deliver over time, as
24
Integrating Resource Management in Service Network Design for Bike Sharing Systems
CIRRELT-2018-17

handling timesbudget
demand management
service management
resourcemanagement
P
D
P
D
time windows
pairing of FLA
sequence of FLA
ride flows
maximum FLA
Figure 8: Framework of the construction heuristic.
well as a weak time synchronization to redistribute the desired bike volumes betweenstations. To alleviate these deficiencies, we design time windows where FLAs can beperformed. Time windows increase the operational flexibility for station visits. Noticethat time windows involve tradeoffs between time and volume synchronization becausestation’s fill levels vary over time. This phase obtains pairs of FLAs defining transportservices.
Finally, the third phase addresses resource management decisions by determiningmaster tours, that is, a sequence of FLAs assigned to vehicles. In this phase, we considerhandling times as well as resource limitations when determining master tours. In princi-ple, the problem to solve takes the form of the pick-up and delivery problem with timewindows (PDPTW) presented in Ropke and Pisinger (2006).
To produce a solution of SNDBSS, we derive vehicle flow variables that depict mastertours obtained from the PDPTW instance. Then, we just need to fix the respective vehicleflow variables such that we can obtain these master tours for the problem instance ofSNDBSS. Thus, a solver can quickly determine the redistribution flows and met rideflows. In the following, we proceed to describe formally each phase of the constructionheuristic.
6.4.1 First Phase: Determining Maximal FLA.
We define a procedural approach to determine FLAs at stations. The procedural ap-proach relies on recursively equations to trigger an FLA each time period that a stationdoes not provide sufficient assets as a consequence of bike rentals and returns. In thisway, failed requests are avoided on a per station consideration.
25
Integrating Resource Management in Service Network Design for Bike Sharing Systems
CIRRELT-2018-17

time
bik
esin
rac
ks
Pcapacity P
time
bik
esin
rac
ks
Pcapacity
(a) increasing the bike volume of an FLA.
time
bik
esin
rac
ks
capacity
D
P
time
bik
esin
rac
ks
capacity P
(b) decreasing the bike volume of an FLA.
Figure 9: Adjusting bike volumes to rationalize FLAs.
Clearly, the number of FLAs to be performed impacts on the redistribution costs:the more FLAs, the more station visits and driving time is required within the workdaylength. Therefore, we aim to rationalize the number of FLA to be performed such thatfailed requests are avoided. Consider first the case depicted in Figure 9a. On the leftside, we observe that two pickup FLAs are triggered each time that the station runs full.On the right side, we note that we can omit the second FLA if we increase the pickupvolume of the first FLA because we avoid that this station becomes full or empty infurther time periods. In Figure 9b, we observe on the left side that a pickup FLA isfirstly triggered at one station, followed by a delivery FLA later. On the right side, wenote that the delivery FLA can be omitted if we decrease the pickup volume of the firstFLA such that the station does not suffer from failed requests. We observe the followingfour cases:
1. Increasing the volume in a pick-up FLA may avoid further pick-up FLAs.
2. Increasing the volume in a delivery FLA may avoid further delivery FLAs.
3. Decreasing the volume in a pick-up FLA may avoid further delivery FLAs.
4. Decreasing the volume in a FLA operation may avoid further pick-up FLAs.
26
Integrating Resource Management in Service Network Design for Bike Sharing Systems
CIRRELT-2018-17
We consider these cases to design a procedural approach with the aim of rationalizingFLAs. First, we introduce the recursive equations to obtain FLAs. Then, we describethe mechanism to adjust pickup and delivery volumes for reducing the number of FLAper station. Finally, the procedural approach is introduced.
Recursive Equations. Let I ti be the number of bikes in racks at station i and timeperiod t. We assume a given number of bikes I0
i on station i and time period 0. In furthertime periods, the value of I ti depends on the number of bikes in station i and time periodt− 1, as well as bike rentals and returns. Let f t+1
i be the difference between bike returnsin time period t + 1 and the bike rentals in time period t. Such difference is computedby
f t+1i = −
∑a∈A+
U (i,t)
ζa +∑
a∈A−U (i,t+1)
ζa, ∀i ∈ S, t < T(27)
Recall, that ζa indicates the ride flow demand on the link a ∈ AU in the time-expanded network of SNDBSS. A positive value of f ti says that expected ride flows leadto an increase of the number of bikes in racks on station i and time period t, whereas anegative value represents a decrease of bikes. If f ti equals zero, there is no variation inthe number of bikes in racks. For time period 0, the value of f 0
i is zero.
If the number of bike in racks at station i is out [0, ci], we trigger an FLA picking upor delivering a certain bike volume. We denote the volume of handled bikes in station iand time period t by rti . A negative value of rti means that a pick-up of bikes is required,whereas a positive value indicates the volume of bikes to deliver. In the case that rtiequals zero, no FLA is necessary. Notice, that this phase does not consider resourcelimitations to perform FLA over time. Let θti be the target number of bikes in racks onstation i and time period t if a FLA is performed.
We determine the number of bikes in racks at a station over time periods with
I ti =
I0t , if t = 0
I t−1i + f ti , if I t−1
i + f ti ∈ [0, ci]
max{0,min{ci, I t−1i + f ti + rti}}, otherwise
(28)
I0t denotes the number of bikes in racks of station i in time period zero. If the number
of bikes in racks stay in the interval [0, ci] in subsequent time periods, no FLA is required.Otherwise, an FLA is triggered. In this case, the pick-up or delivery volume is determinedby
27
Integrating Resource Management in Service Network Design for Bike Sharing Systems
CIRRELT-2018-17

rti =
0, if t = 0
min{C, θti − [I t−1i + f ti ]}, if I t−1
i + f ti /∈ [0, ci]
0, otherwise
(29)
No FLA is required the first time period. In subsequent time periods, a pick-up ordelivery volume is triggered if required, considering that this bike volume cannot exceedthe vehicle load capacity C. If no FLA is necessary, the bike volume rti is zero.
Adjusting FLA. Now, we formally describe the procedure to adjust one FLA basedon the next FLA performed at the same station. Let rti and rti bike volumes for FLA onstation i, with t < t. No FLA occurs between this time interval. In addition, we definethe minimum and maximum number of bikes in racks between time periods t and t byIMIN and IMAX , respectively. In the following, we define how to adjust rti according tothe four aforementioned cases:
1. This case involves two pickup FLAs. The bike volume to pick up |rti | may increaseup to IMIN units.
2. This is the case if both FLAs delivers bike volumes at station i. Now, the bikevolume to deliver |rti | may increase up to ci − IMAX units.
3. This case first involves a pickup FLA and then a delivery FLA. Thus, the bikevolume to pick up |rti | may decrease to min{IMIN , ci − IMAX} units.
4. Finally, first a delivery FLA and then a pickup FLA occurs. The procedure todefine the decrease in volume of bikes to deliver |rti | is the same that we considerfor case 3.
Initial Number of Bikes on Stations. The procedural approach requires as inputthe number of bikes in racks I0
i at station i as input. Certainly, the value of I0i has an
impact in the time period where the first FLA occurs, depending if it involves a pick-upor delivery of bikes.
In order to adjust I0i , we proceed as follows. Let t the time period when the first FLA
occurs. Two cases are distinguished:
� If the first FLA involves a bike volume to pick up, I0i decreases until IMIN .
� If the first FLA involves a bike volume to deliver, I0i increases until IMAX .
28
Integrating Resource Management in Service Network Design for Bike Sharing Systems
CIRRELT-2018-17

The Procedural Approach starts with an initial fill level of 50% in time period 0,that is, I0
i := b ci2c. Then, we determine the initial setting of FLAs in the time interval
[0, T ] using the recursive equations. We stop if no FLA is triggered at station i. If at leastone FLA is triggered, we adjust I0
i and determine FLAs using the recursive equations,now in the interval [1, T ].
After that, if two or more FLA are triggered at station i, we proceed as follows. Let[tINIT , T ] be the target time interval where the recursive equations trigger FLAs. Let tand t be the time periods where the first and second FLAs are triggered in this targettime interval, respectively. We adjust the bike volume of FLA in time period t accordingto the four cases presented above. Then, we set tINIT := tINIT + 1 run the recursiveequations in the time interval [tINIT + 1, T ], fixing all FLAs defined in previous timeperiods.
Then, if two or more FLAs are triggered in the time interval [tINIT , T ], we repeatthe procedure described in the previous paragraph in the remaining time interval. Theprocedure terminates if less than two FLA are triggered within the target time interval.
6.4.2 Determining Time Windows for FLAs.
Since station interdependencies are neglected in the first phase, there is no time synchro-nization between pickup and delivery FLAs.
For each FLA (i, t), t represents the latest time period where the FLA must occur toavoid failed requests. However, the FLA may certainly occur earlier than t. Although thiscan lead to a smaller bike volume since the number of bikes in racks at station i variatesover time, designing time windows for FLAs may enhance the time synchronization forlinking pickup and delivery FLAs into transport services.
We design time windows for every FLA as follows. Given an FLA (i, t), the timewindow is generated by replicating nodes on the corresponding station i for a certainnumber of previous δ time periods. Thus, δ defines the time window length. Thus, allnodes {(i, t− δ), (i, t− δ + 1), ..., (i, t)} constitutes a request.
For each request, we determine the parameter δ as follows. We firstly set δ := 1.Then, we check if the number of bikes in racks I t−δi – which is given from phase one –permits that at least a certain percentage of the desired bikes volume to pick up or deliveris available. If so, the node (i, t − δ) is included to constitute the time window. Afterthat, we set δ := δ − 1. We repeat the procedure again until: a maximal time windowlength δMAX is achieved, the minimal bike volume to pick up or deliver is not availablein node (i, t− δ), or if there already exist a pick-up or delivery FLA in node (i, t− δ) toavoid the time overlapping of requests. FLA generated in this phase are used as inputs
29
Integrating Resource Management in Service Network Design for Bike Sharing Systems
CIRRELT-2018-17

for the second phase, where the transport services are determined.
6.5 Second Phase: Determining Pairs of FLAs
The second phase relies on a transportation problem to pair pickup and delivery FLAs.The transportation problem aims to redistribute as much bike volume as possible withrespect to the maximal FLA defined in the first phase. Recall, that FLAs are given by allvariables rti that take negative (pick-up) or positive (delivery) values in the first phase.Thus, we define nodes (i, t) representing the station i, time period t, and bike volume |rti |to pick-up or deliver.
We denote the set of pick-up and delivery nodes by NP and ND, respectively. Theavailable bike volume to pick-up at node nP ∈ NP is denoted by anP
, whereas the bikevolume to delivery at node nD ∈ ND is bnD
. Since we consider homogeneous bikes, adelivery node may receive bikes from any pick-up node. We refer to these nodes as pickupand delivery requests.
We denote pick-up and delivery requests by RP and RD, respectively. The availablebike volume to pick-up at request rp ∈ RP is denoted by Arp , whereas bike volumerequired at delivery node rd ∈ RD is Brd . As aforementioned, each request is defined bya set of nodes. Let NP (rD) and ND(rD) the node sets which belong to the pick-up requestrP and rD, respectively. Since the first phase do not establish station interdependencieswhen defining FLA, it is possible that the total bike volume to pick up is not equal tothe bike volume to deliver, i.e.,
∑rp∈RP
Arp 6=∑
rd∈RDBrd . For this reason, we introduce
the non-negative variables αrP and βrD indicating dummy bike volume, i.e., volume thatis not picked-up or delivered from requests rP ∈ RP and rD ∈ RD, respectively. Eachlost bike volume unit is penalized with a cost θ.
Figure 10 shows a solution of the transportation problem and the benefits of timewindows. The y-axis represents stations, whereas the y-axis represents time periods.FLAs are depicted by black nodes (i, t) representing station i and time period t. Weobserve that the alternatives to pair FLAs are limited to the way in which they arespread over time. Incorporating time windows alleviates this timing deficiency. Graycircles depict replications of the given FLAs in previous time periods thus defining timewindows. Each dashed oval wraps a certain number of nodes thus depicting a request.Black lines represent transport services involving a certain volume of bikes from a pick-upnode to a delivery node.
The decision of establishing a redistribution request between two nodes is modeled bythe binary variable ykl, k ∈ NP , l ∈ ND, whereas the respective redistribution volume isrepresented by the non-negative continuous variable xkl, k ∈ NP , l ∈ ND. The volume toredistribute is bounded by the capacity of the redistribution request Ckl, k ∈ NP , l ∈ ND.
30
Integrating Resource Management in Service Network Design for Bike Sharing Systems
CIRRELT-2018-17

Stations
Time
1
2
3
4
P
D
P
D
P
D
P
PP
DD
PP
D
P
D
Figure 10: Exemplary solution of the transportation problem.
The allowed volume for a redistribution request depends on the minimum bike volumeof the corresponding pick-up and delivery node, i.e., min{ak, bl}, the number of availabletime periods to perform the redistribution between the targeted stations, and the vehicleload capacity C. To avoid excessive driving time for performing redistribution, a fix costfkl is considered if the redistribution request ykl is set.
With the aforementioned notation, the transportation problem reads as follows:
min z =∑k∈NP
∑l∈ND
fklykl + θ( ∑rP∈RP
αrP +∑
rD∈RD
βrD)
(30)
s.t. ∑k∈NP (rP )
∑l∈ND
xkl + αrP = ArP , ∀rP ∈ RP (31)
∑k∈NP
∑l∈ND(rD)
xkl + βd = BrD , ∀rD ∈ RD (32)
∑k∈NP (rP )
∑l∈ND
ykl ≤ 1, ∀rP ∈ RP (33)
∑k∈NP
∑l∈ND(rD)
ykl ≤ 1, ∀rD ∈ RD (34)
xkl ≤ Cklykl, ∀k ∈ NP , l ∈ ND (35)
xkl ≥ 0, ∀k ∈ NP , l ∈ ND (36)
ykl ≥ {0, 1}, ∀k ∈ NP , l ∈ ND (37)
αrP ≥ 0, ∀rP ∈ RP (38)
βrD ≥ 0, ∀rD ∈ RD (39)
The objective function (30) minimizes the fixed costs redistribution requests and thepenalty cost associated with lost volumes of bikes that cannot be picked up or delivered
31
Integrating Resource Management in Service Network Design for Bike Sharing Systems
CIRRELT-2018-17
by the requests. Equation (32) indicates that the sum of all redistributed bikes froma pick-up request plus the unmet bike volume is equal to the expected bike volume topick up. In the same way, Equation (33) says that the sum of all redistributed bikes toa delivery request plus the unmet bike volume is equal to the expected bike volume todeliver. Equations (34-35) enforce that only one redistribution decision can be establishedfrom or to a request. Finally, Equations (36-39) indicate the domain of the variables.
Clearly, each redistribution decision obtained from the transportation model involvesthe minimum bike volume between the respective pick-up and delivery requests. Noticethat at each of such requests, we can actually pick-up or deliver this minor volume inan earlier time period than established by the respective time window. This means thatwe are able to enlarge time windows to perform the obtained volumes. This increase thetiming flexibility for assigning vehicles to redistribution decisions in the third step. Forthis purpose, we determine the length of the enlarged time windows in the same way weproceed toward defining the transportation problem.
6.6 Third Phase: Determining Sequences of FLAs
In the third phase, a PDPTW assigns vehicles to transport services, thus obtaining mastertours for the redistribution process. The follow the large neighborhood search of Ropkeand Pisinger (2006) to solve problem instances. In this work, the LNS uses a combinationof greedy insertion and shaw removal. The reader is referred to the respective paper formore detail. To depict feasible master tour decisions, the LNS builds solutions whichrespect the operational policy that two vehicles cannot park at one station at the sametime.
7 Computational experiments
We report the effectiveness of our solution methods as well as the trade-off between servicelevel and resources suggested by SNDBSS. All the algorithms were implemented in C++using ILOG Concert Technology to access CPLEX 12.5 as MIP solver. Experiments areperformed on a computer cluster with Intel Xeon 2.6 GHz processors and 64 GB of RAMthat operate under SuSe Linux Enterprise Server version 11.
32
Integrating Resource Management in Service Network Design for Bike Sharing Systems
CIRRELT-2018-17

Table 4: Description of input data after filtering.
Bay Area Nice Ride Hubway Capital Bikeshare
city San Francisco Minneapolis Boston Washingtonnumber of stations 35 190 140 354min - Max - Avg. bike racks per station 15 - 27 - 19 15 - 35 - 18 11 - 46 -17 8 - 40 - 17year period 01 Mai - 31 Aug. 01 Mai - 31 Aug. 01 Mai - 31 Aug. 01 Jul. - 30 Sep.avg. trips per day 1,167 2,305 4,551 10,946
7.1 Input Data
We generate problem instances of SNDBSS using the 2015 free available data of fourBSS located in the USA: San Francisco’s Bay Area (BA)1, Minneapolis’s Nice Ride (NR),Boston’s Hubway (HU), and Washington’s Capital Bikeshare (CA). Available data includesize and location of stations, together with recorded user trips. We assume Euclideandistances between physical nodes. The reader is referred to the respective website of eachBSS for a more detailed description of the system.
We remove unintended trips, that is, recorded trips whose duration is less than 5minutes. Weekend and holiday trips are also removed because they present different userbehavior in contrast to workdays. In addition, we exclude stations that operate less thanone month. Recorded trips related to these stations are removed as well.
Table 4 provides a general description of the filtered data. In terms of average dailytrips and number of stations, BA is the smallest and CA the largest BSS. We note that theaverage number of bikes in racks per station does not exceed the value of 20. In termsof user demand, we note that HU almost doubles the average daily trips compared to NR,although both BSS have a similar number of stations. Furthermore, NR only generatesaround 12 trips per station, whereas all other BSS exceed 30 trips per station. This can beexplained by the usage patterns of NR which do not depict a clear commuter dominance,but users mainly perform trips for leisure purposes. For an extensive analysis of trip datain several cities, the reader is referred to O’Brien et al. (2014).
7.2 Design of Problem Instances
Problem instances are defined in terms of the network infrastructure, ride flow demand,and all candidate redistribution and master tour decisions. To obtain a detailed represen-tation of time for the redistribution decisions, we split the workday length into 5-minutestime periods.
The network infrastructure includes the vehicle depot, which is artificially located in
1In 2017, San Francisco’s Bay Area changed its name to Ford GoBike.
33
Integrating Resource Management in Service Network Design for Bike Sharing Systems
CIRRELT-2018-17
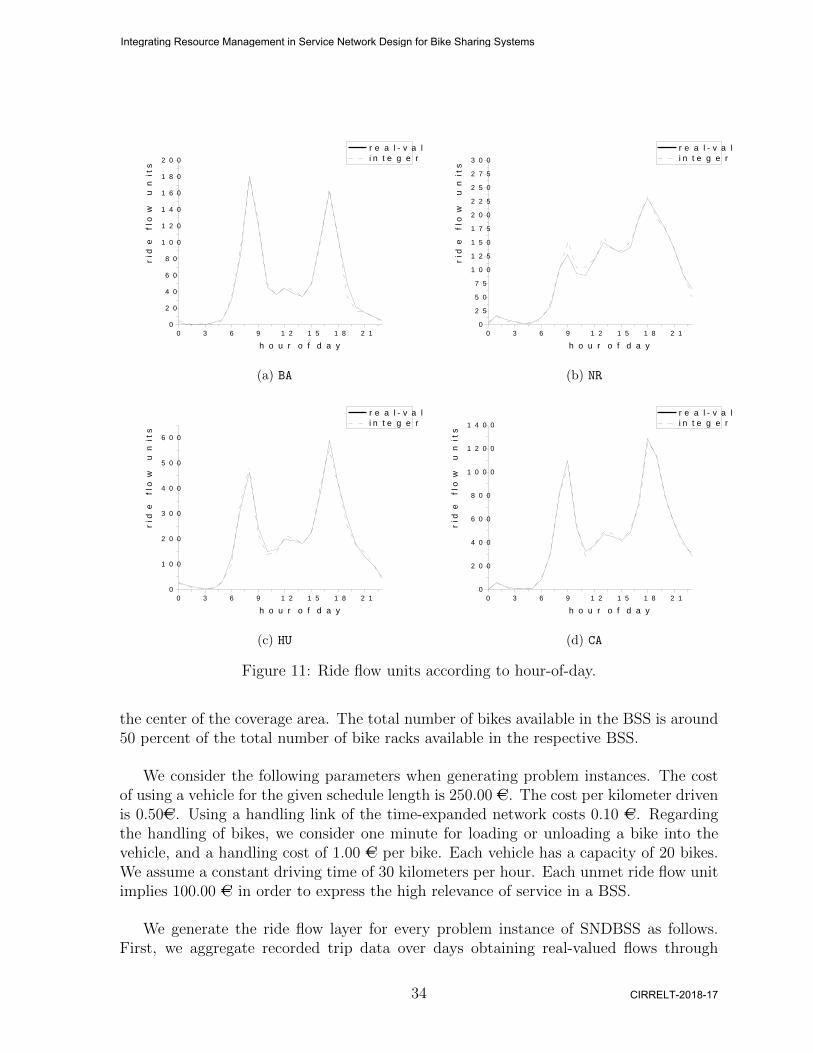
0 3 6 9 1 2 1 5 1 8 2 10
2 04 06 08 0
1 0 01 2 01 4 01 6 01 8 02 0 0
ride f
low un
its
h o u r o f d a y
r e a l - v a l u e d i n t e g e r
(a) BA
0 3 6 9 1 2 1 5 1 8 2 10
2 55 07 5
1 0 01 2 51 5 01 7 52 0 02 2 52 5 02 7 53 0 0
ride f
low un
its
h o u r o f d a y
r e a l - v a l u e d i n t e g e r
(b) NR
0 3 6 9 1 2 1 5 1 8 2 10
1 0 0
2 0 0
3 0 0
4 0 0
5 0 0
6 0 0
ride f
low un
its
h o u r o f d a y
r e a l - v a l u e d i n t e g e r
(c) HU
0 3 6 9 1 2 1 5 1 8 2 10
2 0 0
4 0 0
6 0 0
8 0 0
1 0 0 0
1 2 0 0
1 4 0 0
ride f
low un
its
h o u r o f d a y
r e a l - v a l u e d i n t e g e r
(d) CA
Figure 11: Ride flow units according to hour-of-day.
the center of the coverage area. The total number of bikes available in the BSS is around50 percent of the total number of bike racks available in the respective BSS.
We consider the following parameters when generating problem instances. The costof using a vehicle for the given schedule length is 250.00 AC. The cost per kilometer drivenis 0.50AC. Using a handling link of the time-expanded network costs 0.10 AC. Regardingthe handling of bikes, we consider one minute for loading or unloading a bike into thevehicle, and a handling cost of 1.00 AC per bike. Each vehicle has a capacity of 20 bikes.We assume a constant driving time of 30 kilometers per hour. Each unmet ride flow unitimplies 100.00 AC in order to express the high relevance of service in a BSS.
We generate the ride flow layer for every problem instance of SNDBSS as follows.First, we aggregate recorded trip data over days obtaining real-valued flows through
34
Integrating Resource Management in Service Network Design for Bike Sharing Systems
CIRRELT-2018-17

every possible ride link of the time-expanded network. Then, real-valued ride flows arediscretized by a Poisson distribution process. Figure 11 depicts the sum of real-valuedand integer ride flows departing at each time period. We observe that both lines runalmost parallel to each other. As expected, hour-of-day flow curves depict morning andafternoon peaks whereas minor BSS use is observed during the nighttime. Since we areinterested in the intra-day redistribution process, we consider a workday length of 16hours starting at 6:00 AM.
7.3 Performance of the Construction Heuristic
We investigate whether the construction heuristic can obtain feasible solutions in rea-sonable runtime. We consider the improvement ratio as a measure of comparison. Theimprovement ratio is defined as the percentage reduction of unmet ride flow units inrelation to no redistribution carried out. An improvement ratio of 1.0 indicates that rideflow demand is completely satisfied.
In the first phase, the procedural approach requires no parameters. We consider atime windows length of three hours, i.e., δMAX = 36 In the second phase, transportproblems of the second phase are solved using CPLEX. In the third phase, the LNSalgorithm used to address instances of PDPTW stops after either 5,000 iterations or30 minutes runtime. In this experiment, we run the construction heuristic assuming nolimits on resources to obtain an upper bound of the number of vehicles.
Table 5 shows for each BSS the improvement ratio, vehicles, as well as runtime inseconds for each phase. For the third phase, we report the time at which the bestsolution of the respective PDPTW instance is obtained. We observe that the constructionheuristic obtains improvement ratios between 0.60 and 0.70 for all BSS except for of NR,where the improvement ratio is 0.86. We observe a relationship between the number ofvehicles and the size of the BSS. For instance, we note that CA requires the largest numberof vehicles. This was expected since CA approximately doubles the number of stationsand daily trips compared with the other BSS. Regarding runtime, we note that the firsttwo phases consume relatively small computational effort only. The first phase onlytakes 6.42 seconds in average, which was expected since no optimization takes place.The transportation problem defined in the second phase is solved to optimality usingCPLEX after few seconds even for the largest BSS. The third phase is, in general, moretime-consuming: for HU and CA, the best solution is obtained after several iterations ofthe LNS algorithm. We conclude that the construction heuristic produces good startingsolutions for the matheuristic.
35
Integrating Resource Management in Service Network Design for Bike Sharing Systems
CIRRELT-2018-17

Table 5: Results of the construction heuristic.
runtime in seconds
BSS imp. ratio vehicles 1st phase 2nd phase 3rd phase total
BA 0.61 2 1.33 0.21 0.11 1.65NR 0.86 3 6.17 0.12 0.18 6.47HU 0.61 4 5.65 1.05 65.73 51.43CA 0.66 9 12.54 8.98 875.21 676.73
7.4 Performance of the Matheuristic
I We follow the guidelines of Section 6.3 to build neighborhoods. Regarding the neigh-borhood sizes, we test on each BSS for n = 50; 100; and 200 to define the neighborhoodsize. Recall, that the parameter n indicates the number of vehicle detours consideredin a neighborhood. We set the maximal time for exploring a neighborhood by 600.00seconds. The matheuristic stops after 10 iterations without improvement by CPLEX, orif it exceeds the runtime limit of 10 hours.
7.4.1 Starting Solution
We investigate whether the construction heuristic is actually needed. Therefore, weevaluate the performance of starting the matheuristic from a solution in which all vehiclesare parked, that is, no redistribution occurs. Then, we run the matheuristic five timesfor each BSS and value of n until 1) it reaches the value of improvement ratio obtainedfrom the construction heuristic or 2) it does not find solutions of better quality after 10iterations. Table 6 displays the required iterations to the target improvement ratio aswell as the average runtime per iteration. Bolded numbers indicate that the at least onerun of the matheuristic did not reach the target improvement ratio.
Table 6: Computational efforts devoted by matheuristic to reach improvement ratiosobtained from the construction heuristic.
BSS iterations runtime in secondsn = 50 n = 100 n = 200 n = 50 n = 100 n = 200
BA 12 5 2 490 101 306NR 46 32 5 2,076 1,875 787HU 17 8 4 2,084 1,760 1,984CA 32 15 8 10,582 8,518 6,367average 27 15 5 3,808 3,064 2,361
36
Integrating Resource Management in Service Network Design for Bike Sharing Systems
CIRRELT-2018-17

We note that the matheuristic reaches the target improvement ratio in almost allcases. Although it is not shown in Table 6, we remark that for NR and n equals 50, thematheuristic early stagnates three times to a solution of minor quality. In general, thematheuristic requires fewer iterations and less runtime to obtain the desired improvementratio by increasing the value of n. As expected, large neighborhoods provide a widerexploration of the search space at each iteration.
In average, the construction heuristic is at least 10 times faster compared to thematheuristic. To sum up, we can save computational efforts by producing a solutionfrom the construction heuristic. Therefore, we use starting solutions obtained from theconstruction heuristic for the following experiments.
7.4.2 Neighborhood Operators
Next, we study the performance of neighborhood operators over iterations with respectto the neighborhood size. The results for HU are shown in Figure 12. In all graphs, the x-axis represents iterations of the matheuristic. On the left side of each figure, the stackedarea graphs indicate the application of each neighborhood operator over iterations. Thegraphs on the right side show how many candidate vehicle flow variables are accepted ineach iteration, i.e. the success rate. As expected, we observe that the application of FBOquickly decreases within the first iterations since the proposed equations which deriveprobabilities encourage this behavior. Nevertheless, the decay of application is slightlyslower if n equals 200 because a large portion of vehicle flow variables are accepted withinthe first iterations. As a consequence, the success rate keeps high the application of FBOkeeps close to one. In later iterations, no major variations in the application of FBOare observed. Meanwhile, we do not identify a clear superiority of one operator overthe other one. However, variations of these applications over iterations indicate that thematheuristic finds solution of better quality on later phases of search.
We note that the number vehicle flow variables accepted by FBO quickly decreases.However, this neighborhood operator is able to improve the incumbent solution evenin later phases of search. Interesting, we observe a higher success rate of RSO thanfor RPO in improving the incumbent solution. Since RPO conducts at each iterationvehicle detours through different stations in one time interval, a vehicle can just acceptone of such detours. RSO allows detours through one station in different time intervals,and therefore one vehicle may select more than one possible detour. Nevertheless, bothneighborhood operators are beneficial to escape from local optimums.
37
Integrating Resource Management in Service Network Design for Bike Sharing Systems
CIRRELT-2018-17

if n equals 50
2 0 4 0 6 0 8 0 1 0 0 1 2 0 1 4 0 1 6 00 , 00 , 10 , 20 , 30 , 40 , 50 , 60 , 70 , 80 , 91 , 0
proba
bility
i t e r a t i o n
R P O R S O F B O
(a) application
2 0 4 0 6 0 8 0 1 0 0 1 2 0 1 4 0 1 6 00
2 0
4 0
6 0
8 0
1 0 0
1 2 0
acce
pted v
ehicle
flow v
ariab
lesi t e r a t i o n
R P O R S O F B O
(b) success
if n equals 200
2 0 4 0 6 0 8 0 1 0 0 1 2 00 , 00 , 10 , 20 , 30 , 40 , 50 , 60 , 70 , 80 , 91 , 0
proba
bility
i t e r a t i o n
R P O R S O F B O
(c) application
2 0 4 0 6 0 8 0 1 0 0 1 2 00
2 0
4 0
6 0
8 0
1 0 0
1 2 0
acce
pted v
ehicle
flow v
ariab
les
i t e r a t i o n
R P O R S O F B O
(d) success
Figure 12: Performance of neighborhood operators for HU.
38
Integrating Resource Management in Service Network Design for Bike Sharing Systems
CIRRELT-2018-17

7.4.3 Numerical Results
Table 7 shows the average of 5 runs for each input setting including BSS, vehicles, andvalue of n. We report improvement ratio, redistribution costs, number of iterations, andruntime in seconds. We observe that an improvement ratio of 1.0 is obtained at eight oftwelve input settings. CA is the only BSS for which an improvement ratio of 1.0 is notachieved. Comparing solutions whose improvement ratio is 1.0, we note that increasingthe value of n leads to a slight reduction of redistribution costs. This suggests thatapplying large neighborhoods leads to solutions of better quality. However, we observefor CA that solutions of minor improvement ratio are obtained if n equals 200.
Table 7: Numerical results of matheuristic.
input setting resultsBSS vehicles n imp. ratio costs iterations runtime
BA 2 50 1.00 733.68 118 596100 1.00 726.54 180 1,551200 1.00 724.21 124 4,206
NR 3 50 1.00 889.89 53 307100 1.00 885.73 72 1,130200 1.00 881.76 116 7,042
HU 4 50 0.99 1,604.97 204 31,056100 1.00 1,588.16 201 35,330200 1.00 1,581.37 144 36,062
CA 9 50 0.95 3,803.34 92 35,961100 0.95 3,873.01 55 35,947200 0.93 3,863.90 46 36,184
Regarding computational efforts, we note for BA and NR that the runtime increasesaccording to the value of n. For these BSSs, n equals 50 leads to a quick convergence atearly iterations. Enlarging the value of n avoids that the matheuristic quickly stagnatesat a local optimum and therefore more iterations are conducted in general. We note thatfor BA, setting n = 200 is more time-consuming than n = 100, but reaches solutions ofminor costs. For HU and CA, we observe that more runtime is required to obtain solutionsof good quality. In turn, the number of iterations decreases by increasing the value ofn since more neighborhoods become more and more time-consuming. To sum up, thematheuristic is able to find solutions of high quality in a reasonable runtime.
39
Integrating Resource Management in Service Network Design for Bike Sharing Systems
CIRRELT-2018-17
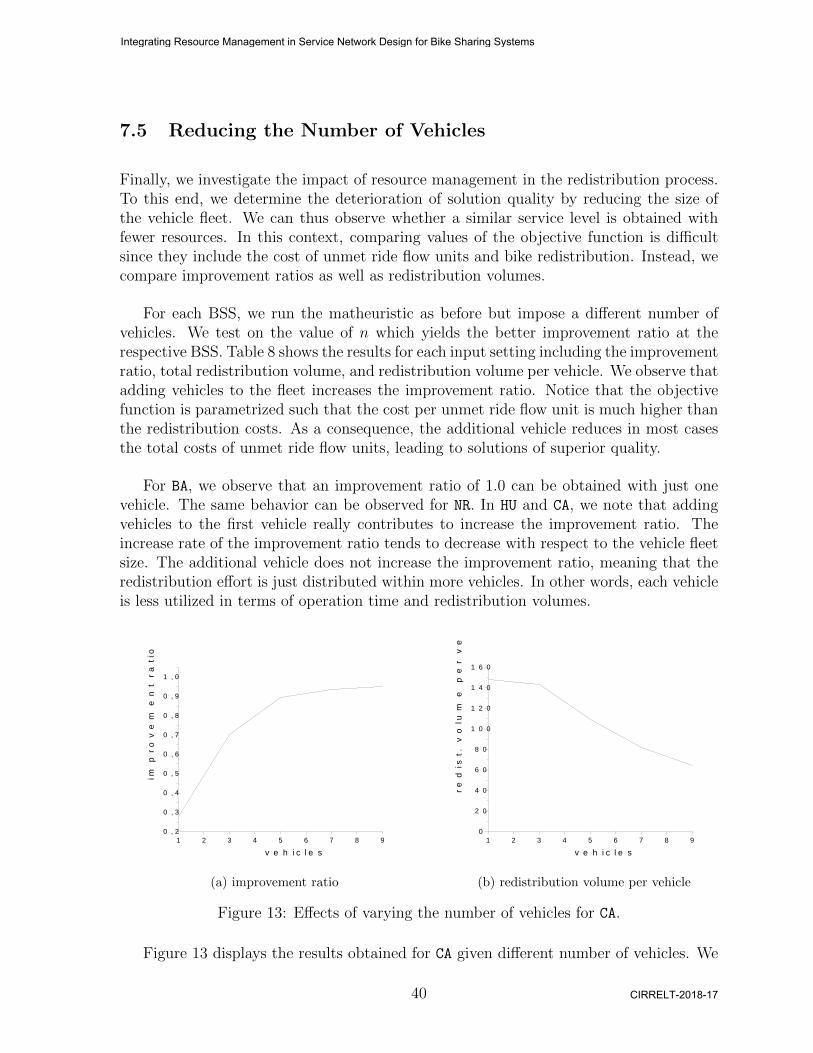
7.5 Reducing the Number of Vehicles
Finally, we investigate the impact of resource management in the redistribution process.To this end, we determine the deterioration of solution quality by reducing the size ofthe vehicle fleet. We can thus observe whether a similar service level is obtained withfewer resources. In this context, comparing values of the objective function is difficultsince they include the cost of unmet ride flow units and bike redistribution. Instead, wecompare improvement ratios as well as redistribution volumes.
For each BSS, we run the matheuristic as before but impose a different number ofvehicles. We test on the value of n which yields the better improvement ratio at therespective BSS. Table 8 shows the results for each input setting including the improvementratio, total redistribution volume, and redistribution volume per vehicle. We observe thatadding vehicles to the fleet increases the improvement ratio. Notice that the objectivefunction is parametrized such that the cost per unmet ride flow unit is much higher thanthe redistribution costs. As a consequence, the additional vehicle reduces in most casesthe total costs of unmet ride flow units, leading to solutions of superior quality.
For BA, we observe that an improvement ratio of 1.0 can be obtained with just onevehicle. The same behavior can be observed for NR. In HU and CA, we note that addingvehicles to the first vehicle really contributes to increase the improvement ratio. Theincrease rate of the improvement ratio tends to decrease with respect to the vehicle fleetsize. The additional vehicle does not increase the improvement ratio, meaning that theredistribution effort is just distributed within more vehicles. In other words, each vehicleis less utilized in terms of operation time and redistribution volumes.
1 2 3 4 5 6 7 8 90 , 2
0 , 3
0 , 4
0 , 5
0 , 6
0 , 7
0 , 8
0 , 9
1 , 0
impro
veme
nt rat
io
v e h i c l e s
(a) improvement ratio
1 2 3 4 5 6 7 8 90
2 0
4 0
6 0
8 0
1 0 0
1 2 0
1 4 0
1 6 0
redist.
volum
e per
vehic
le
v e h i c l e s
(b) redistribution volume per vehicle
Figure 13: Effects of varying the number of vehicles for CA.
Figure 13 displays the results obtained for CA given different number of vehicles. We
40
Integrating Resource Management in Service Network Design for Bike Sharing Systems
CIRRELT-2018-17
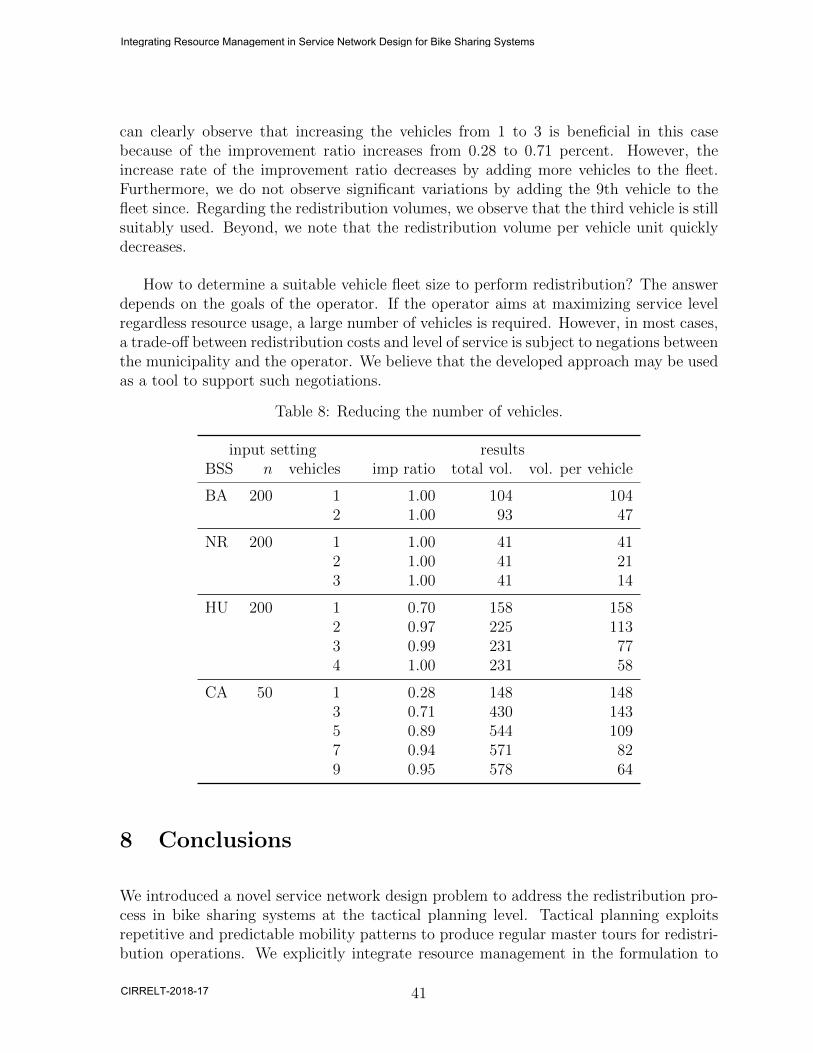
can clearly observe that increasing the vehicles from 1 to 3 is beneficial in this casebecause of the improvement ratio increases from 0.28 to 0.71 percent. However, theincrease rate of the improvement ratio decreases by adding more vehicles to the fleet.Furthermore, we do not observe significant variations by adding the 9th vehicle to thefleet since. Regarding the redistribution volumes, we observe that the third vehicle is stillsuitably used. Beyond, we note that the redistribution volume per vehicle unit quicklydecreases.
How to determine a suitable vehicle fleet size to perform redistribution? The answerdepends on the goals of the operator. If the operator aims at maximizing service levelregardless resource usage, a large number of vehicles is required. However, in most cases,a trade-off between redistribution costs and level of service is subject to negations betweenthe municipality and the operator. We believe that the developed approach may be usedas a tool to support such negotiations.
Table 8: Reducing the number of vehicles.
input setting resultsBSS n vehicles imp ratio total vol. vol. per vehicle
BA 200 1 1.00 104 1042 1.00 93 47
NR 200 1 1.00 41 412 1.00 41 213 1.00 41 14
HU 200 1 0.70 158 1582 0.97 225 1133 0.99 231 774 1.00 231 58
CA 50 1 0.28 148 1483 0.71 430 1435 0.89 544 1097 0.94 571 829 0.95 578 64
8 Conclusions
We introduced a novel service network design problem to address the redistribution pro-cess in bike sharing systems at the tactical planning level. Tactical planning exploitsrepetitive and predictable mobility patterns to produce regular master tours for redistri-bution operations. We explicitly integrate resource management in the formulation to
41
Integrating Resource Management in Service Network Design for Bike Sharing Systems
CIRRELT-2018-17
produce an accurate representation of routing decisions, putting special emphasis on thenecessary handling time at each station visit, as well as resource limitations to acquireand operate vehicles within the day.
The proposed MIP formulation is based on a time-expanded network representing re-distribution and vehicle routing decisions in terms of flows. Addressing problem instancesof this rich formulation is very challenging given the complex interplay between coexist-ing flows in the time-expanded network, the incorporation of vehicle-balance constraintsto generate feasible master tours, and the fine time granularity required to representhandling operations.
Therefore, we propose two solution methods to address large problem instances. Thefirst one is a construction heuristic which breaks down the decision-making process ofbike redistribution into three phases. The respective phases successively determine FLAs,transport services, and master tours. The main virtue of the construction heuristic isthat it quickly produces a good starting solution for the proposed matheuristic. Thus,the second solution method is a matheuristic which relies on a neighborhood-searchscheme to find qualitative solutions within iterations. A neighborhood takes the formof a reduced MIP problem which involves a minor number of vehicle flow variables ofthe original problem instance. In this way, we can solve such reduced MIP problemsusing a solver. We introduced neighborhood operators which carefully choose promisingtransport services while considering randomization to diversify the search.
We provided evidence the proposed solution methods are able to produce solutionsof good quality in a reasonable runtime. In addition, we have shown that the marginalbenefits and utilization of vehicles decrease by enlarging the vehicle fleet size. In principle,fulfilling expected user demand is theoretically possible with a large number of vehicles,but impracticable due to excessive redistribution costs. We claim that service networkdesign supports decision-makers to find an adequate trade-off between service level andresource usage.
Acknowledgements
This research has been supported by the German Research Foundation (DFG) throughthe Research Training Group SocialCars (GRK 1931). The focus of the SocialCars Re-search Training Group is on significantly improving the citys future road traffic, throughcooperative approaches. This support is gratefully acknowledged. Partial funding for thisproject also comes from the Discovery Grant and the Discovery Accelerator SupplementsPrograms of the Natural Science and Engineering Research Council of Canada, and theStrategic Clusters program of the Fonds quebecois de la recherche sur la nature et lestechnologies. The authors thank the two institutions for supporting this research. While
42
Integrating Resource Management in Service Network Design for Bike Sharing Systems
CIRRELT-2018-17

working on this project, the second author was Adjunct Professor with the Departmentof Computer Science and Operations Research, Universite de Montreal.
43
Integrating Resource Management in Service Network Design for Bike Sharing Systems
CIRRELT-2018-17

References
R. K. Ahuja, O. Ergun, J. B. Orlin, and A. P. Punnen. A survey of very large-scaleneighborhood search techniques. Discrete Applied Mathematics, 123(1):75–102, 2002.
J. Andersen, T. G. Crainic, and M. Christiansen. Service network design with manage-ment and coordination of multiple fleets. European Journal of Operational Research,193(2):377–389, 2009.
P. Angeloudis, J. Hu, and M. G. Bell. A strategic repositioning algorithm for bicycle-sharing schemes. Transportmetrica A: Transport Science, 10(8):759–774, 2014.
J. F. Bard and A. I. Jarrah. Large-scale constrained clustering for rationalizing pickupand delivery operations. Transportation Research Part B: Methodological, 43(5):542–561, 2009.
J. Brinkmann, M. W. Ulmer, and D. C. Mattfeld. Short-term strategies for stochasticinventory routing in bike sharing systems. Transportation Research Procedia, 10:364–373, 2015.
J. Brinkmann, M. W. Ulmer, and D. C. Mattfeld. Inventory routing for bike sharingsystems. Transportation Research Procedia, 19:316–327, 2016.
M. Chouman and T. G. Crainic. Cutting-plane matheuristic for service network designwith design-balanced requirements. Transportation Science, 49(1):99–113, 2014.
M. Christiansen, K. Fagerholt, B. Nygreen, and D. Ronen. Maritime transportation.In C. Barnhart and G. Laporte, editors, Transportation, volume 14 of Handbooks inOperations Research and Management Science, pages 189 – 284. North-Holland, Am-sterdam, 2007.
C. Contardo, C. Morency, and L.-M. Rousseau. Balancing a dynamic public bike-sharingsystem. Publication CIRRELT-2012-09, Centre interuniversitaire de recherche sur lesreseaux d’entreprise, la logistique et le transport, Universite de Montreal, Montreal,QC, Canada, 2012.
J. Corcoran, T. Li, D. Rohde, E. Charles-Edwards, and D. Mateo-Babiano. Spatio-temporal patterns of a public bicycle sharing program: the effect of weather and cal-endar events. Journal of Transport Geography, 41:292–305, 2014.
J.-F. Cordeau, P. Toth, and D. Vigo. A survey of optimization models for train routingand scheduling. Transportation Science, 32(4):380–404, 1998.
T. G. Crainic. Service network design in freight transportation. European Journal ofOperational Research, 122(2):272–288, 2000.
44
Integrating Resource Management in Service Network Design for Bike Sharing Systems
CIRRELT-2018-17
T. G. Crainic and K. H. Kim. Intermodal transportation. In C. Barnhart and G. La-porte, editors, Transportation, volume 14 of Handbooks in Operations Research andManagement Science, pages 467 – 537. North-Holland, Amsterdam, 2007.
T. G. Crainic and G. Laporte. Planning models for freight transportation. EuropeanJournal of Operational Research, 97(3):409–438, 1997.
T. G. Crainic, M. Hewitt, and W. Rei. Scenario grouping in a progressive hedging-basedmeta-heuristic for stochastic network design. Computers & Operations Research, 43(2):90–99, 2014a.
T. G. Crainic, M. Hewitt, M. Toulouse, and D. M. Vu. Service network design withresource constraints. Transportation Science, 50(4):1380–1393, 2014b.
S. Datner, T. Raviv, M. Tzur, and D. Chemla. Setting inventory levels in a bike sharingnetwork. Transportation Science, 2017. (article in advance).
C. M. de Chardon, G. Caruso, and I. Thomas. Bike-share rebalancing strategies, patterns,and purpose. Journal of Transport Geography, 55:22–39, 2016.
G. Erdogan, M. Battarra, and R. W. Calvo. An exact algorithm for the static rebalancingproblem arising in bicycle sharing systems. European Journal of Operational Research,245(3):667–679, 2015.
H. M. Espegren, J. Kristianslund, H. Andersson, and K. Fagerholt. The static bicyclerepositioning problem-literature survey and new formulation. In A. Paias, M. Ruth-mair, and S. Voß, editors, Computational Logistics, pages 337–351, Cham, 2016.Springer International Publishing.
A. Faghih-Imani, N. Eluru, A. M. El-Geneidy, M. Rabbat, and U. Haq. How land-useand urban form impact bicycle flows: evidence from the bicycle-sharing system (BIXI)in montreal. Journal of Transport Geography, 41:306–314, 2014.
I. A. Forma, T. Raviv, and M. Tzur. A 3-step math heuristic for the static repositioningproblem in bike-sharing systems. Transportation Research Part B: Methodological, 71:230–247, 2015.
M. Hewitt, G. L. Nemhauser, and M. W. Savelsbergh. Combining exact and heuristicapproaches for the capacitated fixed-charge network flow problem. INFORMS Journalon Computing, 22(2):314–325, 2010.
S. C. Ho and W. Szeto. Solving a static repositioning problem in bike-sharing systems us-ing iterated tabu search. Transportation Research Part E: Logistics and TransportationReview, 69:180–198, 2014.
A. Hoff, A.-G. Lium, A. Løkketangen, and T. G. Crainic. A metaheuristic for stochasticservice network design. Journal of Heuristics, 16(5):653–679, 2010.
45
Integrating Resource Management in Service Network Design for Bike Sharing Systems
CIRRELT-2018-17
Institute for Transportation and Development Policy. The bike-sharing plan-ning guide, 2014. Accessed November 15, 2017, https://www.itdp.org/wp-content/uploads/2014/07/ITDP Bike Share Planning Guide.pdf.
Intelligent Energy Europe. Optimising bike sharing in eu-ropean cities-a handbook., 2011. Accessed November 15,2017, https://ec.europa.eu/energy/intelligent/projects/sites/iee-projects/files/projects/documents/obis handbook en.pdf.
C. Kloimullner, P. Papazek, B. Hu, and G. R. Raidl. Balancing bicycle sharing systems:An approach for the dynamic case. In C. Blum and G. Ochoa, editors, EvolutionaryComputation in Combinatorial Optimisation, pages 73–84, Berlin, Heidelberg, 2014.Springer Berlin Heidelberg.
C. Kloimullner, P. Papazek, B. Hu, and G. R. Raidl. A cluster-first route-second approachfor balancing bicycle sharing systems. In R. Moreno-Dıaz, F. Pichler, and A. Quesada-Arencibia, editors, Computer Aided Systems Theory – EUROCAST 2015, pages 439–446, Cham, 2015. Springer International Publishing.
A. A. Kumar, J. E. Kang, C. Kwon, and A. Nikolaev. Inferring origin-destination pairsand utility-based travel preferences of shared mobility system users in a multi-modalenvironment. Transportation Research Part B: Methodological, 91:270–291, 2016.
G. Laporte, F. Meunier, and R. Wolfler Calvo. Shared mobility systems. 4OR, 13(4):341–360, Dec 2015.
L. M. Martinez, L. Caetano, T. Eir, and F. Cruz. An optimisation algorithm to establishthe location of stations of a mixed fleet biking system: An application to the city ofLisbon. Procedia - Social and Behavioral Sciences, 54:513 – 524, 2012.
V. Mrkajic and I. Anguelovski. Planning for sustainable mobility in transition cities:Cycling losses and hopes of revival in Novi Sad, Serbia. Cities, 52:66–78, 2016.
B. A. Neumann-Saavedra, P. Vogel, and D. C. Mattfeld. Anticipatory service networkdesign of bike sharing systems. Transportation Research Procedia, 10:355–363, 2015.
J. Niehaus and W. Banzhaf. Adaption of operator probabilities in genetic programming.In J. Miller, M. Tomassini, P. L. Lanzi, C. Ryan, A. G. B. Tettamanzi, and W. B. Lang-don, editors, Genetic Programming, pages 325–336, Berlin, Heidelberg, 2001. SpringerBerlin Heidelberg.
O. O’Brien, J. Cheshire, and M. Batty. Mining bicycle sharing data for generatinginsights into sustainable transport systems. Journal of Transport Geography, 34:262 –273, 2014.
M. B. Pedersen, T. G. Crainic, and O. B. Madsen. Models and tabu search metaheuristicsfor service network design with asset-balance requirements. Transportation Science, 43(2):158–177, 2009.
46
Integrating Resource Management in Service Network Design for Bike Sharing Systems
CIRRELT-2018-17

J. Pfrommer, J. Warrington, G. Schildbach, and M. Morari. Dynamic vehicle redistri-bution and online price incentives in shared mobility systems. IEEE Transactions onIntelligent Transportation Systems, 15(4):1567–1578, 2014.
M. Rainer-Harbach, P. Papazek, G. R. Raidl, B. Hu, and C. Kloimullner. Pilot, grasp,and vns approaches for the static balancing of bicycle sharing systems. Journal ofGlobal Optimization, 63(3):597–629, 2015.
T. Raviv, M. Tzur, and I. A. Forma. Static repositioning in a bike-sharing system:models and solution approaches. EURO Journal on Transportation and Logistics, 2(3):187–229, 2013.
M. Ricci. Bike sharing: A review of evidence on impacts and processes of implementationand operation. Research in Transportation Business & Management, 15:28–38, 2015.
S. Ropke and D. Pisinger. An adaptive large neighborhood search heuristic for the pickupand delivery problem with time windows. Transportation Science, 40(4):455–472, 2006.
J. Shu, M. C. Chou, Q. Liu, C.-P. Teo, and I.-L. Wang. Models for effective deploy-ment and redistribution of bicycles within public bicycle-sharing systems. OperationsResearch, 61(6):1346–1359, 2013.
N. Teypaz, S. Schrenk, and V.-D. Cung. A decomposition scheme for large-scale servicenetwork design with asset management. Transportation Research Part E: Logistics andTransportation Review, 46(1):156–170, 2010.
P. Vogel, T. Greiser, and D. C. Mattfeld. Understanding bike-sharing systems usingdata mining: Exploring activity patterns. Procedia-Social and Behavioral Sciences, 20:514–523, 2011.
P. Vogel, B. A. Neumann Saavedra, and D. C. Mattfeld. A hybrid metaheuristic to solvethe resource allocation problem in bike sharing systems. In M. J. Blesa, C. Blum, andS. Voß, editors, Hybrid Metaheuristics, pages 16–29, Cham, 2014. Springer Interna-tional Publishing.
D. M. Vu, T. G. Crainic, and M. Toulouse. A three-phase matheuristic for capacitatedmulti-commodity fixed-cost network design with design-balance constraints. Journalof Heuristics, 19(5):757–795, 2013.
D. Zhang, C. Yu, J. Desai, H. Lau, and S. Srivathsan. A time-space network flow approachto dynamic repositioning in bicycle sharing systems. Transportation Research Part B:Methodological, 103:188 – 207, 2017.
47
Integrating Resource Management in Service Network Design for Bike Sharing Systems
CIRRELT-2018-17