Embed Size (px)
Citation preview
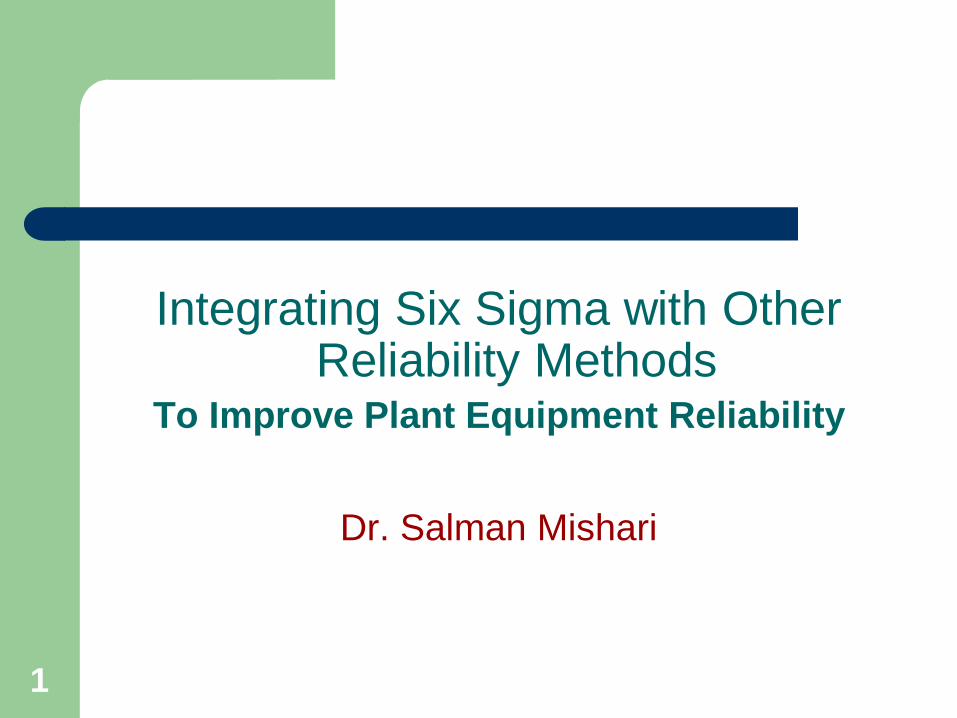
1
Integrating Six Sigma with Other Reliability Methods
To Improve Plant Equipment Reliability
Dr. Salman Mishari

2
Presenter Introduction
Salman Mishari Education
B.S. in ME (USA) M.S in Engrg. Mgt (KFUPM) PhD in Reliability (UOB) Black belt certification in Six Sigma Certified TapRoot RCA instuctor
3
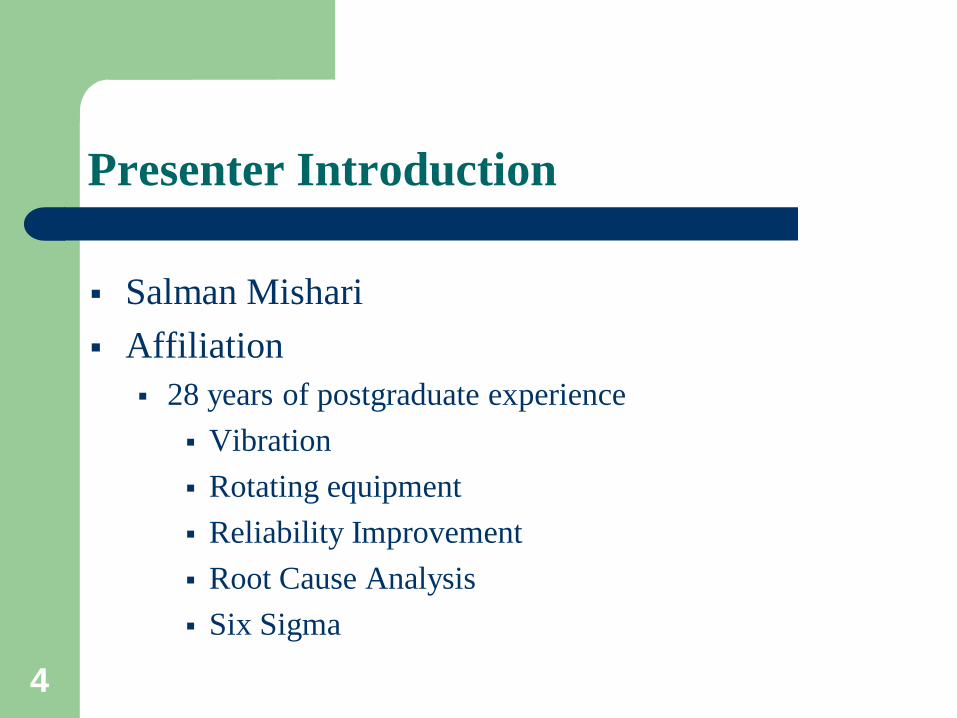
Presenter Introduction
Salman Mishari Affiliation
Independent Reliability Consultant Reliability Specialist in S. Aramco Part-time Facult at KFUPM
4
Presenter Introduction
Salman Mishari Affiliation
28 years of postgraduate experience Vibration Rotating equipment Reliability Improvement Root Cause Analysis Six Sigma
5
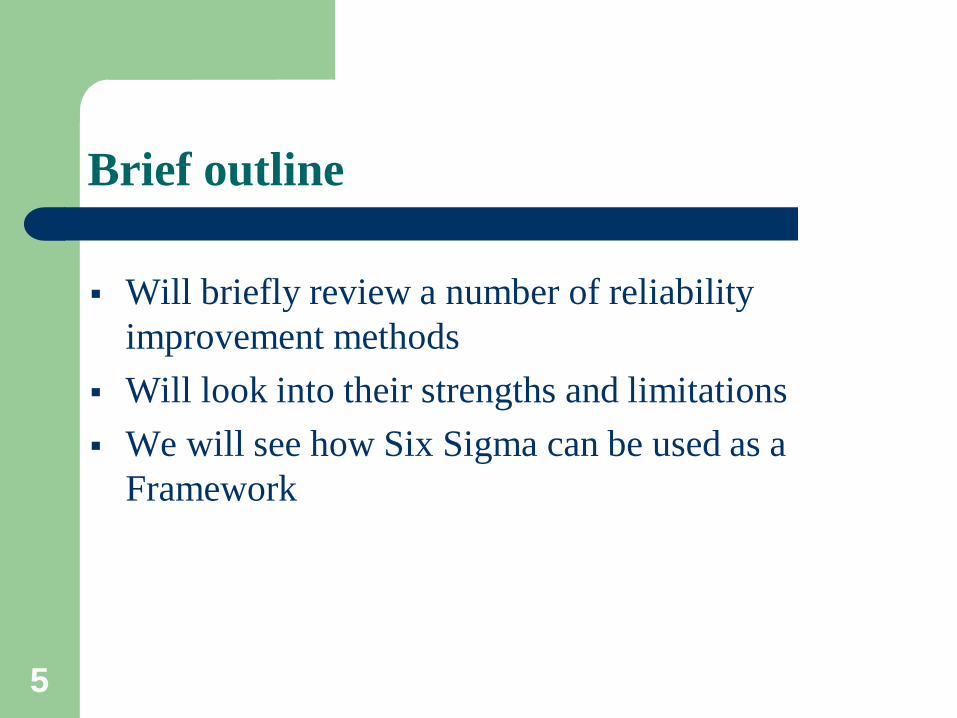
Brief outline
Will briefly review a number of reliability improvement methods
Will look into their strengths and limitations We will see how Six Sigma can be used as a
Framework

6
Let’s start with a story
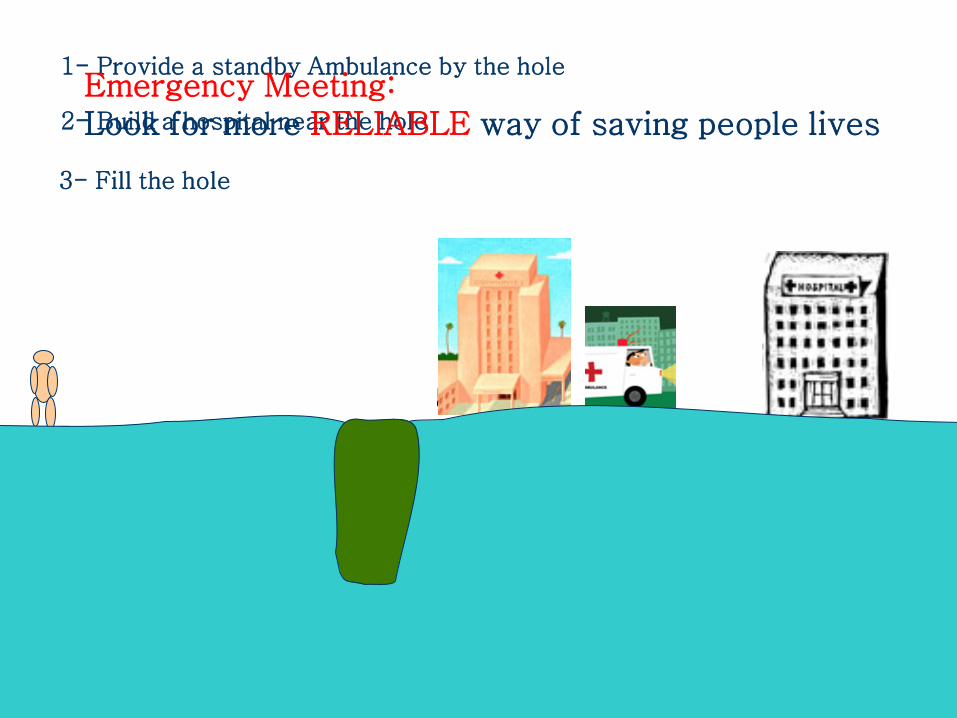
1- Provide a standby Ambulance by the hole
2- Build a hospital near the hole
Emergency Meeting: Look for more RELIABLE way of saving people lives
3- Fill the hole
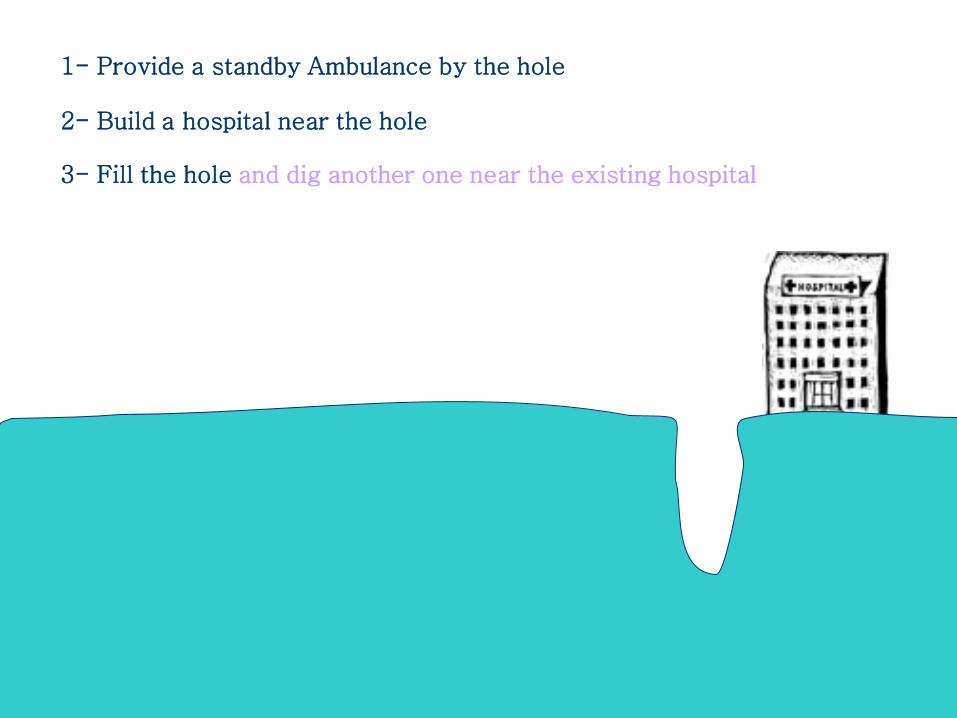
1- Provide a standby Ambulance by the hole
2- Build a hospital near the hole
3- Fill the hole and dig another one near the existing hospital
9
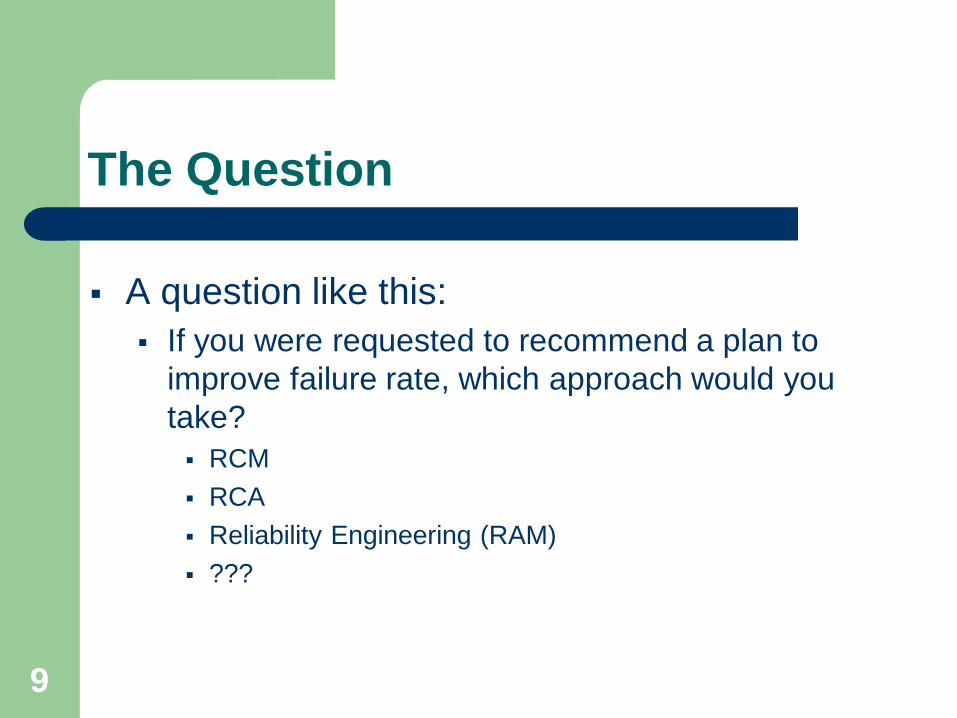
The Question
A question like this: If you were requested to recommend a plan to
improve failure rate, which approach would you take? RCM RCA Reliability Engineering (RAM) ???
10
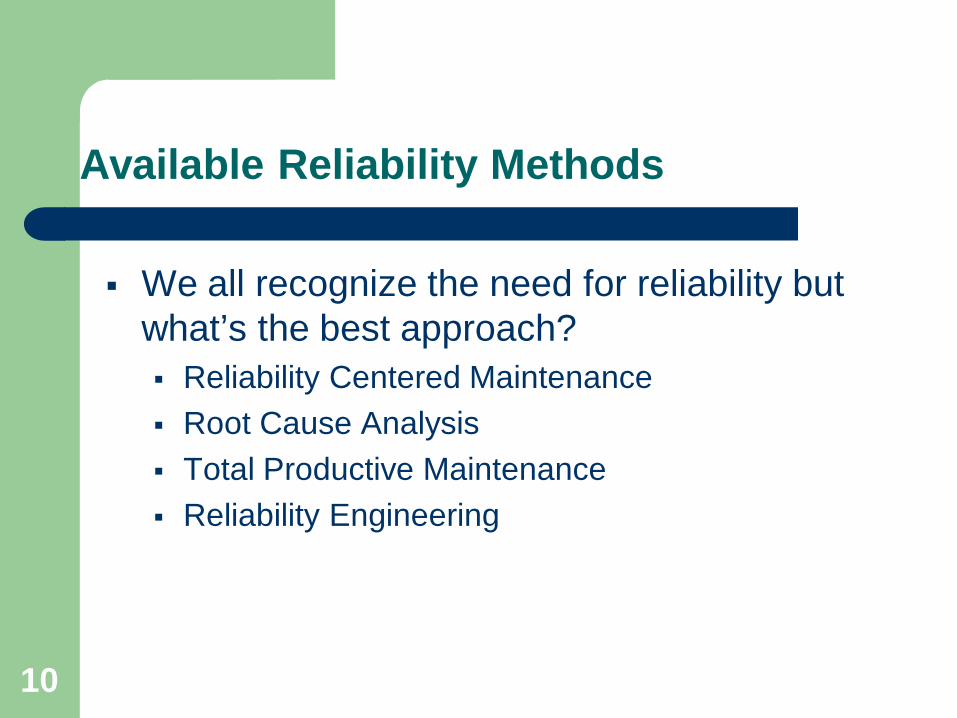
Available Reliability Methods
We all recognize the need for reliability but what’s the best approach? Reliability Centered Maintenance Root Cause Analysis Total Productive Maintenance Reliability Engineering
11
Available Reliability Methods
We will try to go over some of these methods See how Six sigma can be used as a frame
work to integrate them together.
12
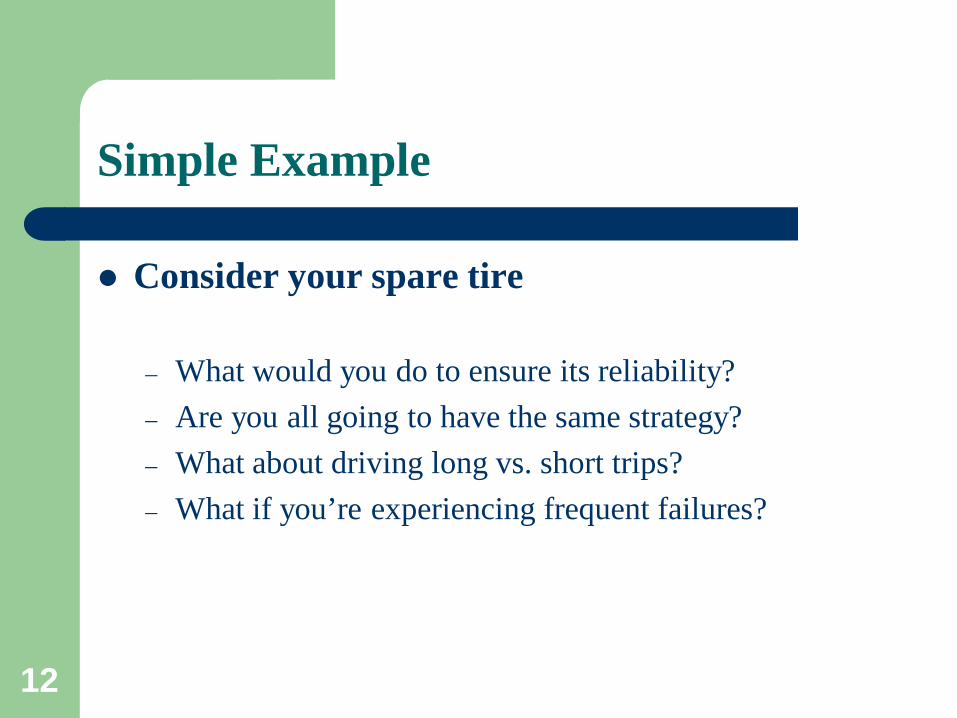
Simple Example
Consider your spare tire
– What would you do to ensure its reliability? – Are you all going to have the same strategy? – What about driving long vs. short trips? – What if you’re experiencing frequent failures?
13
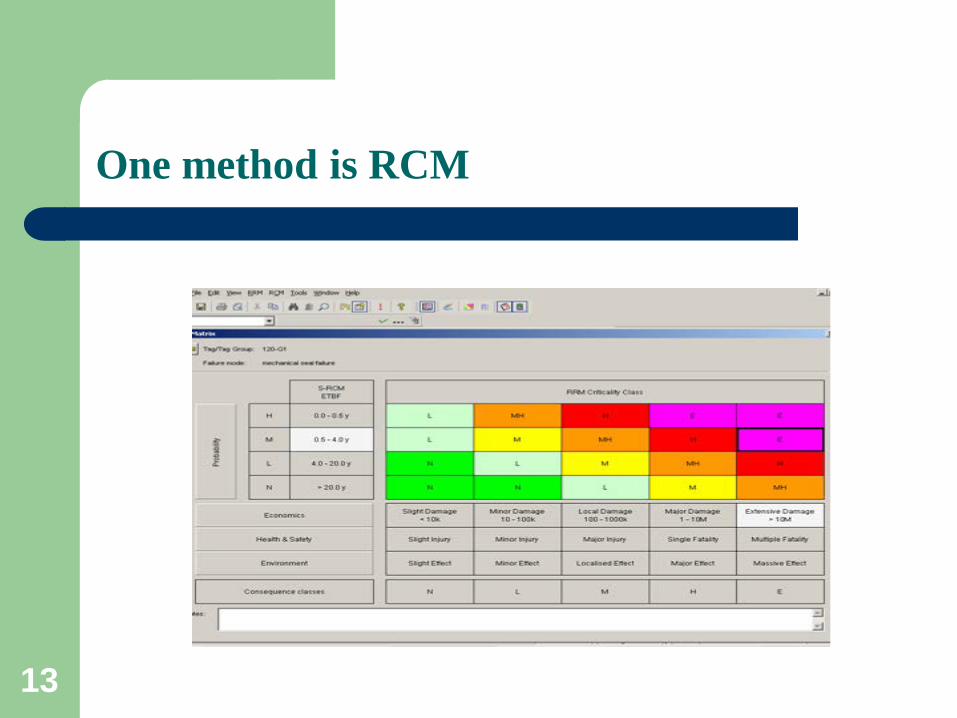
One method is RCM
14
Introduction to RCM
RCM is a process used to determine what must be done to ensure that any physical asset continues to do what its users want it to do in its present operating contest ( John Moubray, RCM II)
15
Introduction to RCM
What do you want your car to do? Take you from point A to point B
– Safely – With Luxury
16
Introduction to RCM
If someone suggests to do a complete overhaul on your car every year. – Check every sensor – Check every bolt – Check the timing chain
Do you think reliability will increase?
17
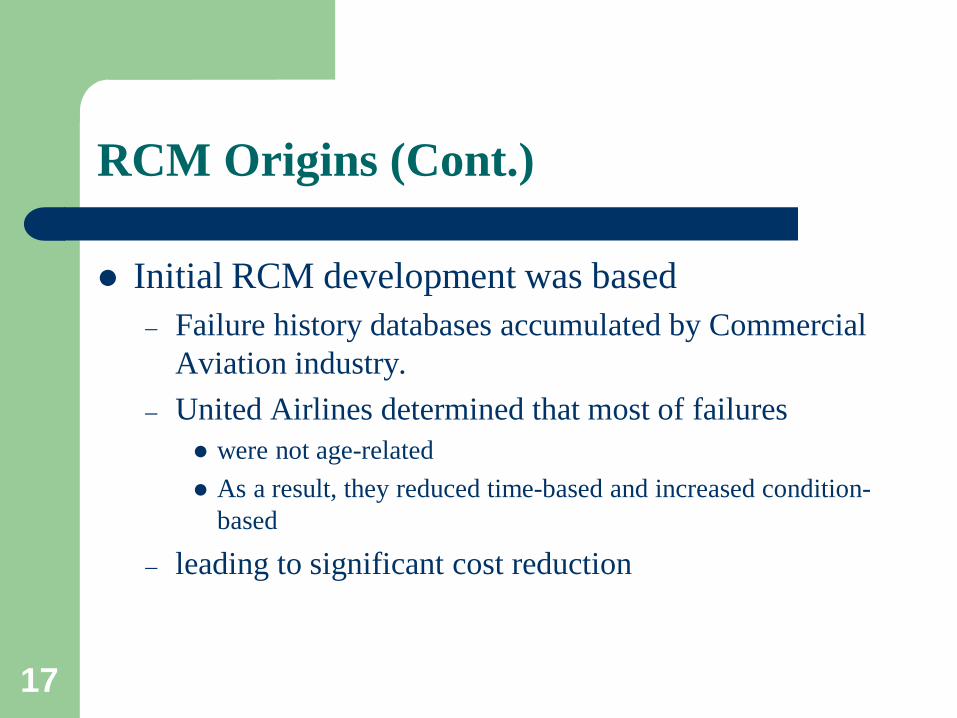
RCM Origins (Cont.)
Initial RCM development was based – Failure history databases accumulated by Commercial
Aviation industry. – United Airlines determined that most of failures
were not age-related As a result, they reduced time-based and increased condition-
based
– leading to significant cost reduction
18
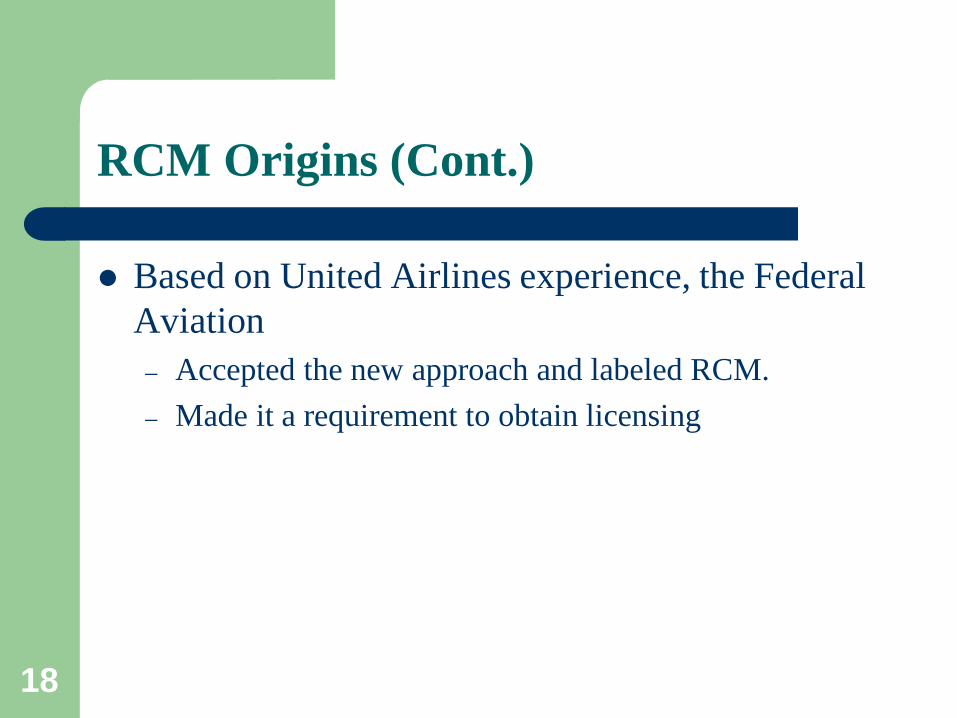
RCM Origins (Cont.)
Based on United Airlines experience, the Federal Aviation – Accepted the new approach and labeled RCM. – Made it a requirement to obtain licensing
19
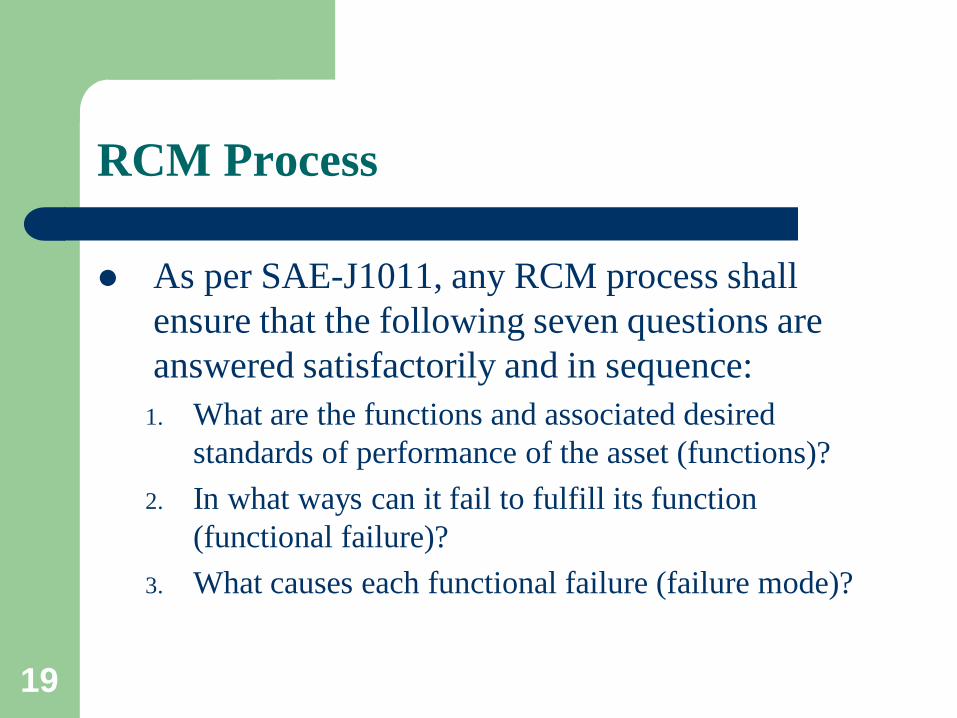
RCM Process
As per SAE-J1011, any RCM process shall ensure that the following seven questions are answered satisfactorily and in sequence:
1. What are the functions and associated desired standards of performance of the asset (functions)?
2. In what ways can it fail to fulfill its function (functional failure)?
3. What causes each functional failure (failure mode)?
20
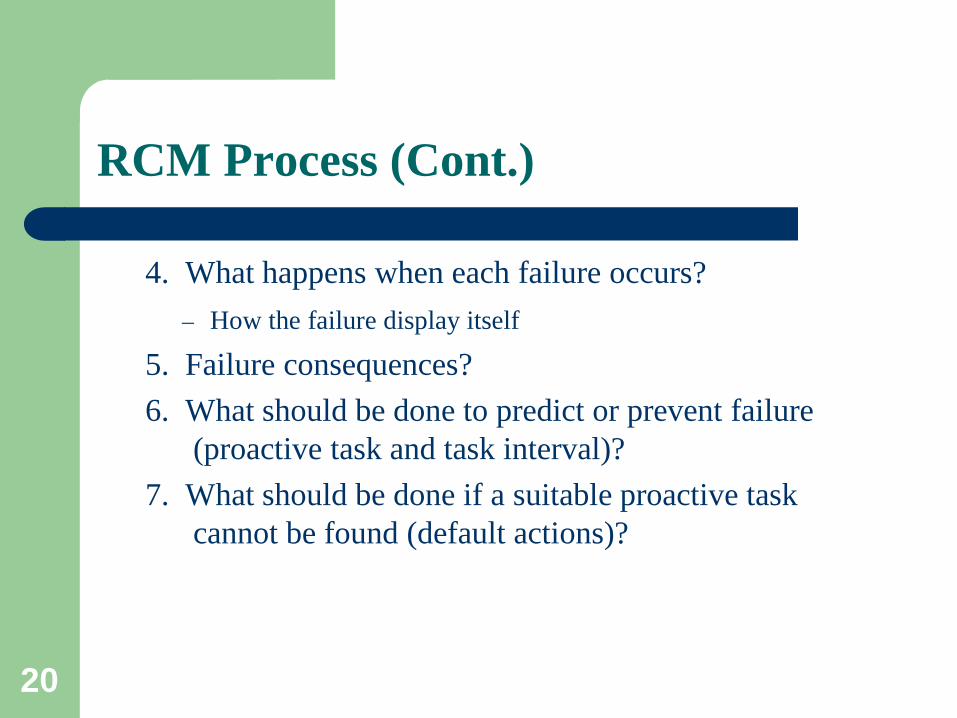
RCM Process (Cont.)
4. What happens when each failure occurs? – How the failure display itself
5. Failure consequences? 6. What should be done to predict or prevent failure
(proactive task and task interval)? 7. What should be done if a suitable proactive task
cannot be found (default actions)?
21
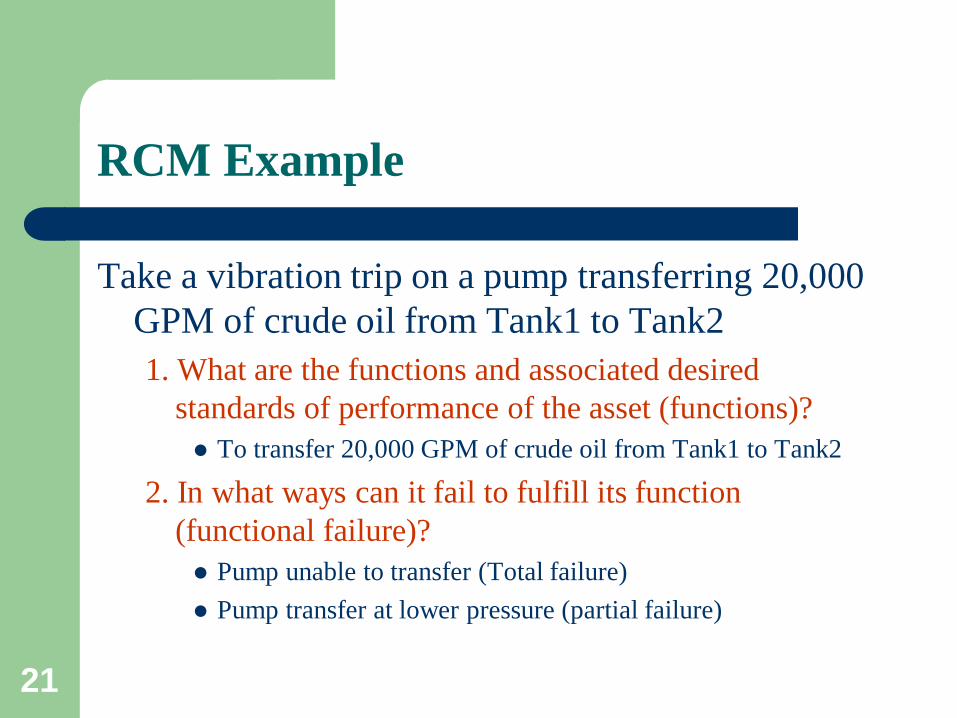
RCM Example
Take a vibration trip on a pump transferring 20,000 GPM of crude oil from Tank1 to Tank2 1. What are the functions and associated desired
standards of performance of the asset (functions)? To transfer 20,000 GPM of crude oil from Tank1 to Tank2
2. In what ways can it fail to fulfill its function (functional failure)? Pump unable to transfer (Total failure) Pump transfer at lower pressure (partial failure)
22
RCM Example (Cont.)
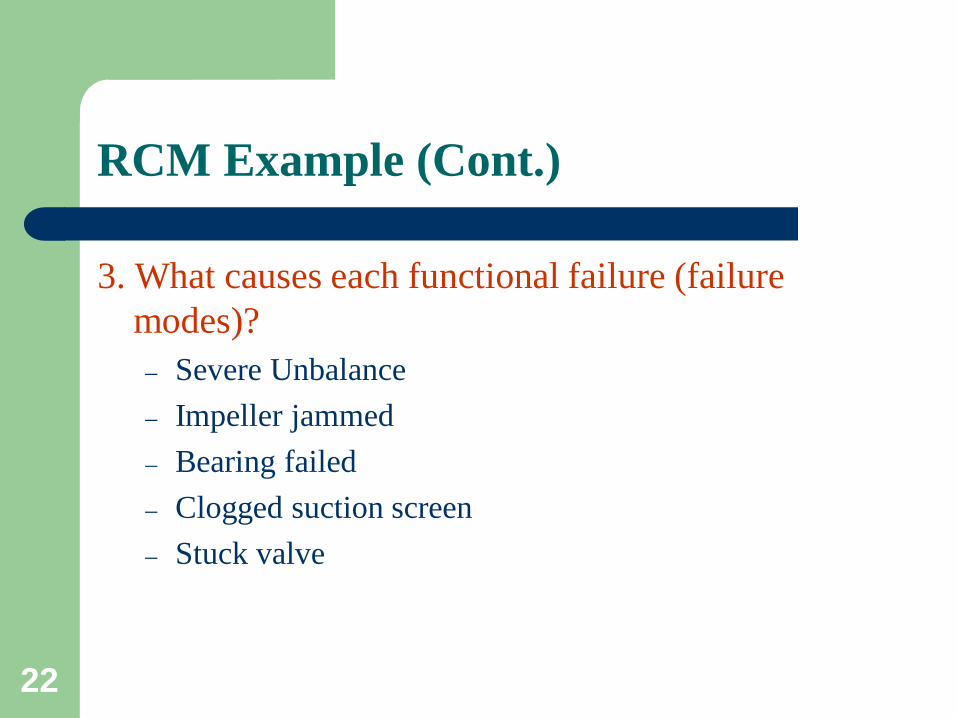
3. What causes each functional failure (failure modes)? – Severe Unbalance – Impeller jammed – Bearing failed – Clogged suction screen – Stuck valve
23
RCM Example (Cont.)
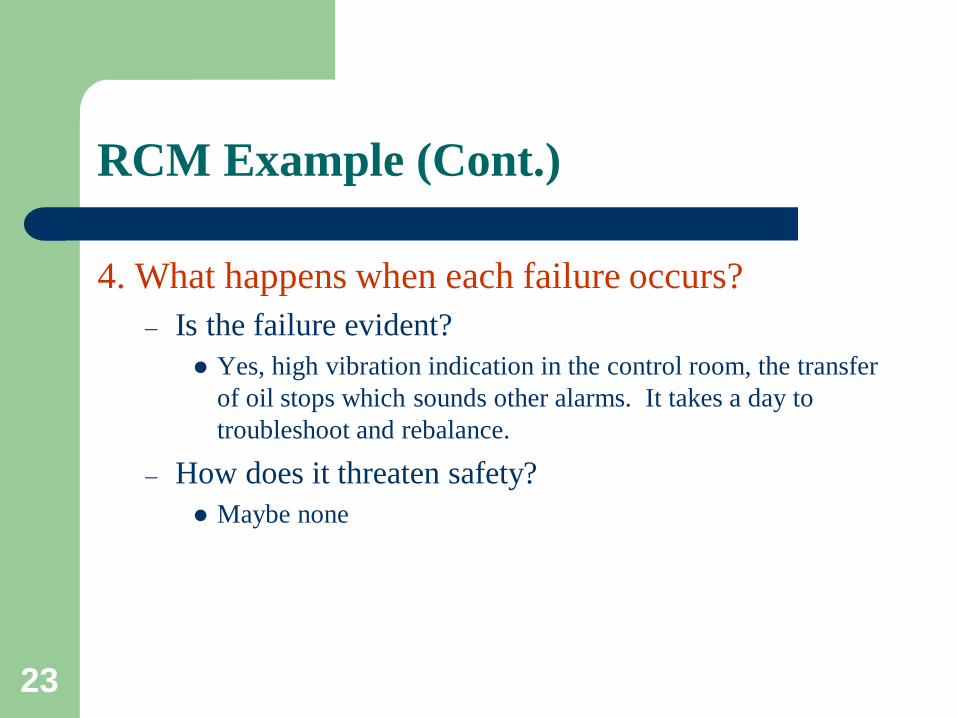
4. What happens when each failure occurs? – Is the failure evident?
Yes, high vibration indication in the control room, the transfer of oil stops which sounds other alarms. It takes a day to troubleshoot and rebalance.
– How does it threaten safety? Maybe none
24
RCM Example
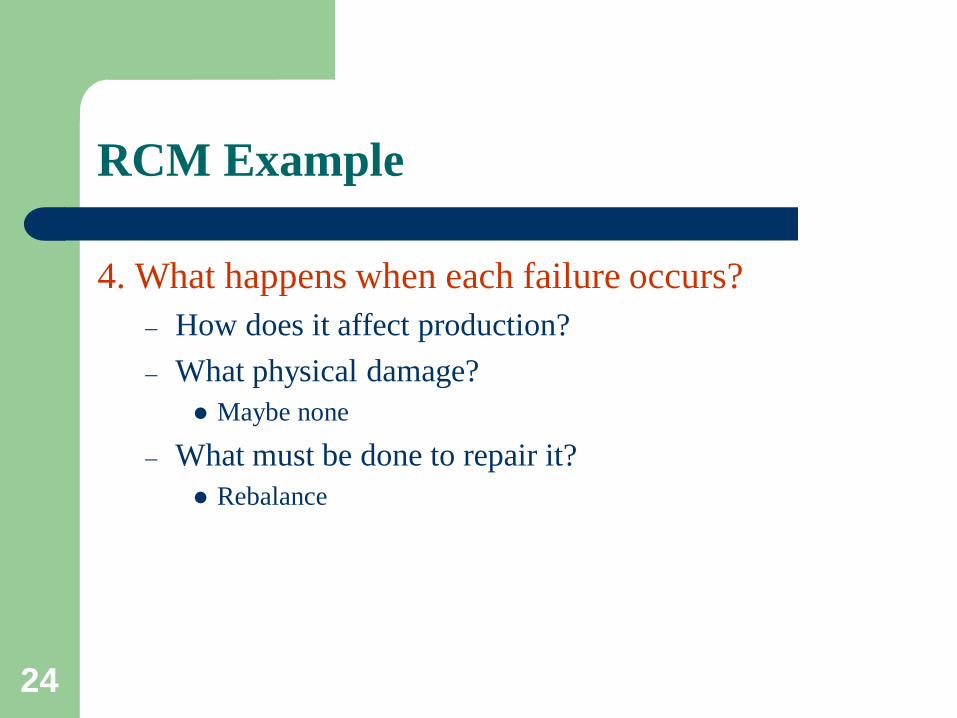
4. What happens when each failure occurs? – How does it affect production? – What physical damage?
Maybe none
– What must be done to repair it? Rebalance
25
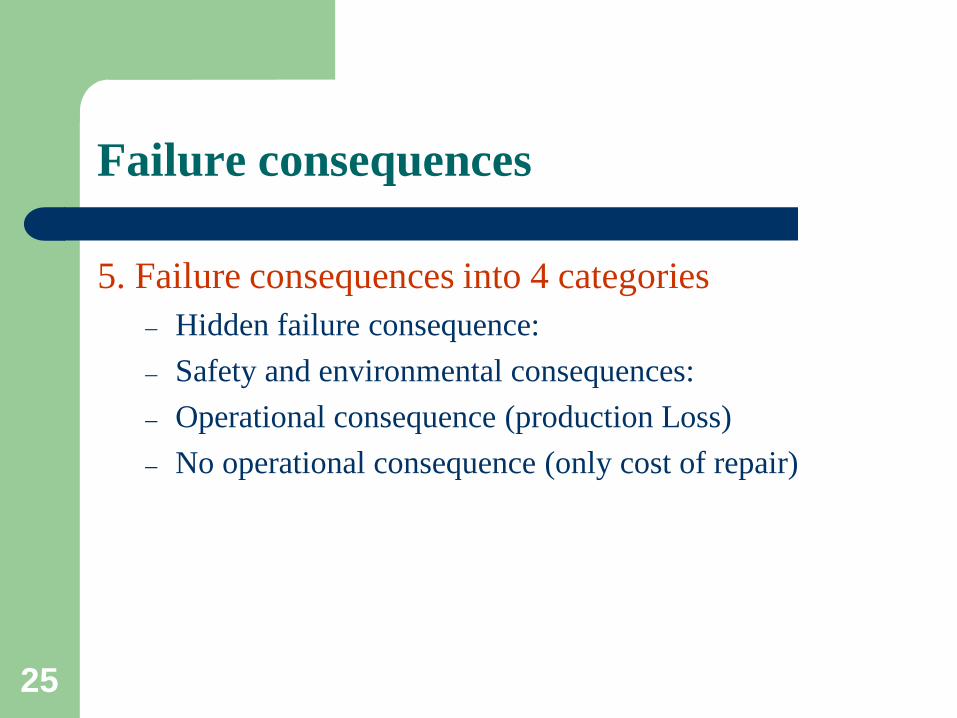
Failure consequences
5. Failure consequences into 4 categories – Hidden failure consequence: – Safety and environmental consequences: – Operational consequence (production Loss) – No operational consequence (only cost of repair)
26
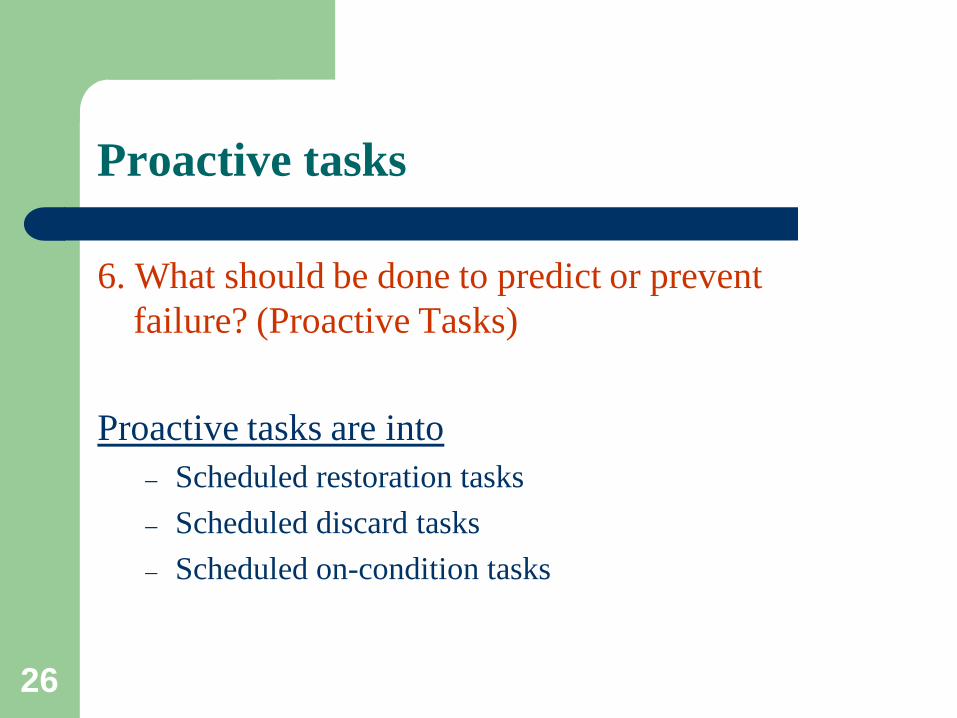
Proactive tasks
6. What should be done to predict or prevent failure? (Proactive Tasks)
Proactive tasks are into
– Scheduled restoration tasks – Scheduled discard tasks – Scheduled on-condition tasks
27
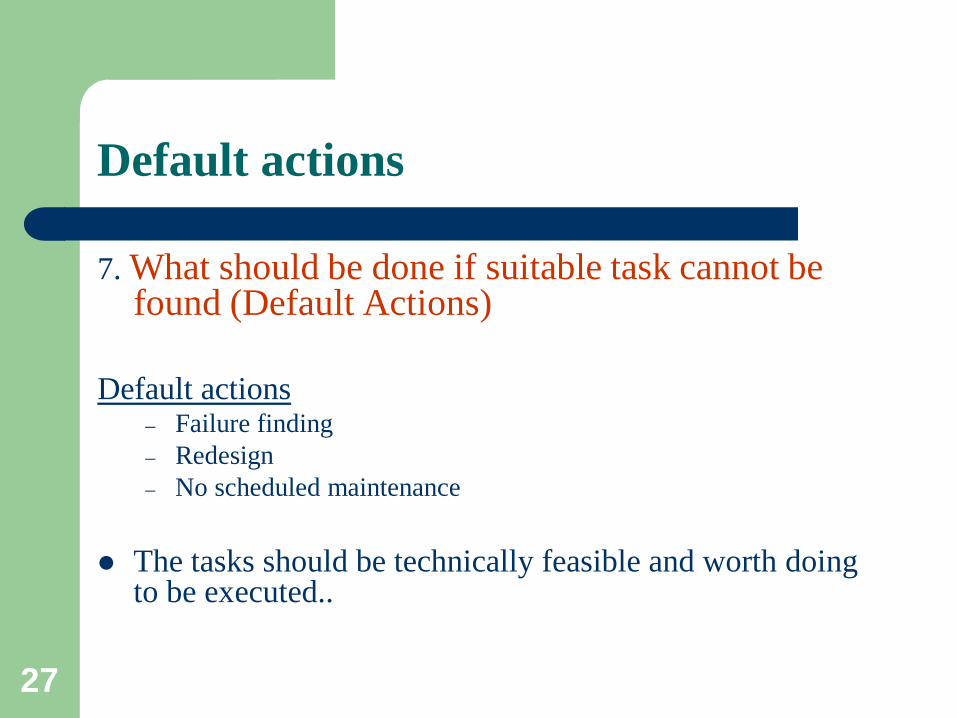
Default actions
7. What should be done if suitable task cannot be found (Default Actions)
Default actions
– Failure finding – Redesign – No scheduled maintenance
The tasks should be technically feasible and worth doing
to be executed..
28
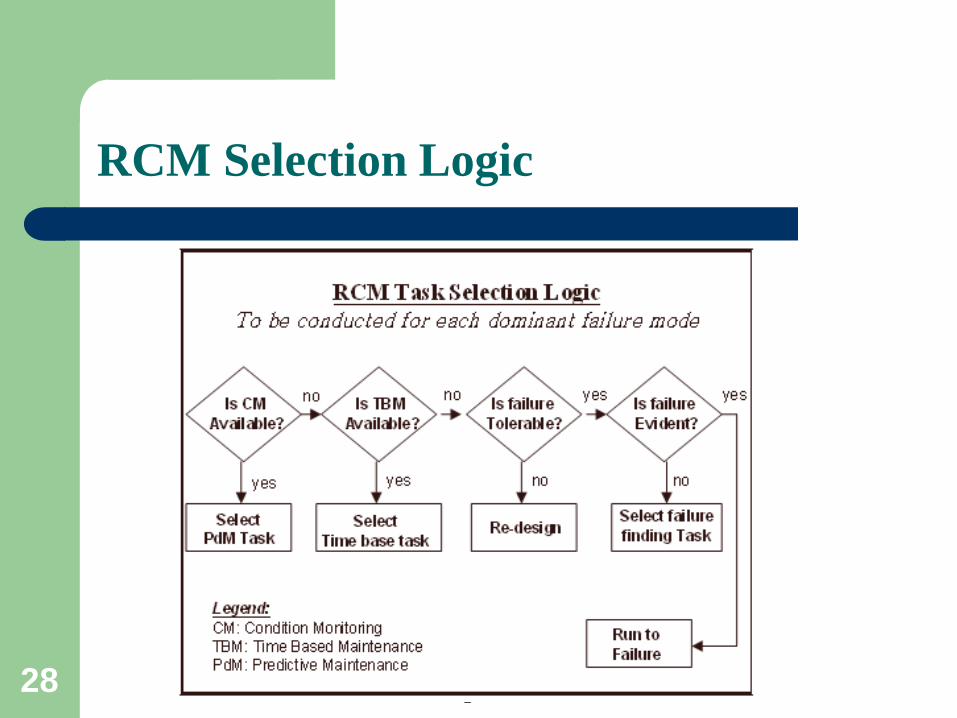
RCM Selection Logic
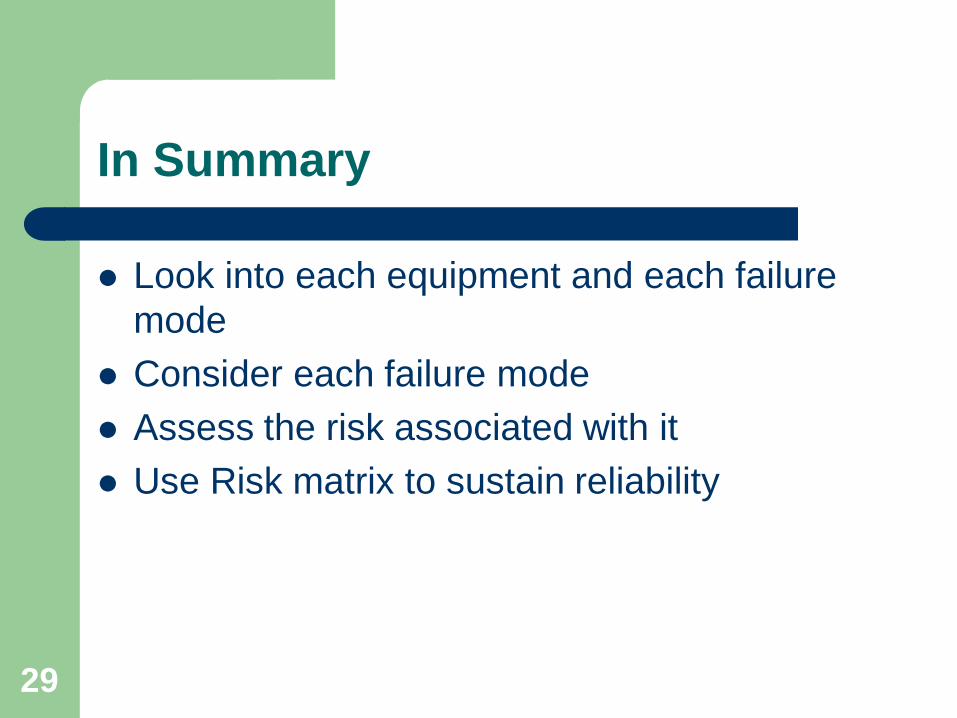
In Summary
Look into each equipment and each failure mode
Consider each failure mode Assess the risk associated with it Use Risk matrix to sustain reliability
29
30
Streamlined RCM Approaches
Classical RCM is very time consuming and labor intensive
Theretofore, shortened versions emerged to speed up process
31
Retroactive Approach
Starts with existing maintenance tasks. Assumes the current maintenance program is a
good one and it only needs optimization. Argument: Traditional RCM for new designs of
maintenance programs
32
Retroactive Approach (Cont.)
Generates a list of failure modes from the current program
It starts with all performed tasks and which failure modes they’re intended to deal with and then optimize them.
It’s claimed to achieve 80% of RCM results with a fraction of the cost.
33
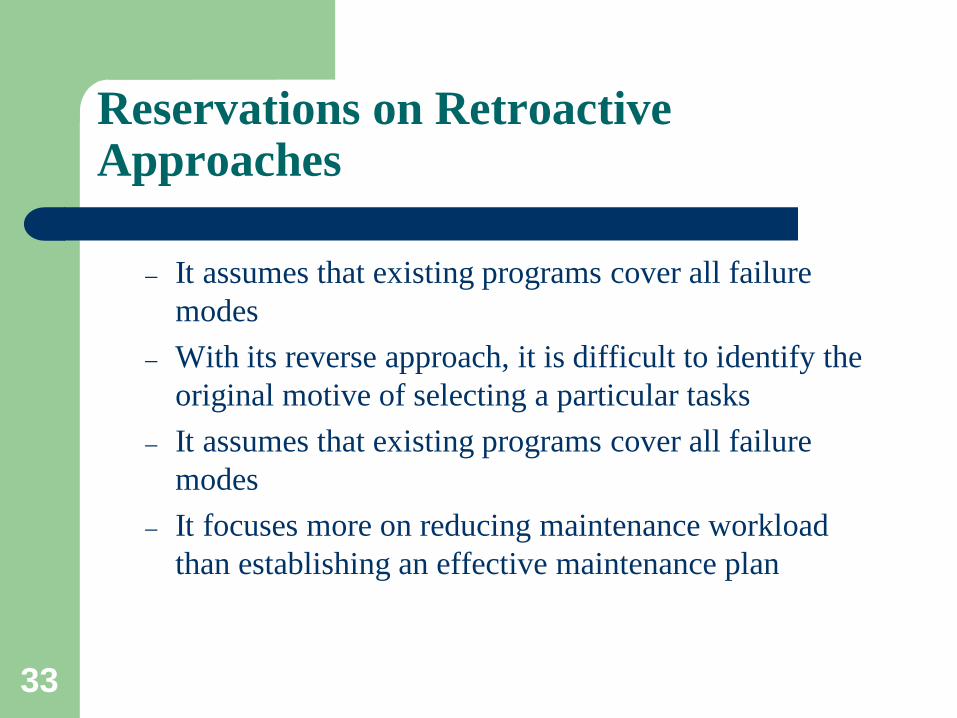
Reservations on Retroactive Approaches
– It assumes that existing programs cover all failure modes
– With its reverse approach, it is difficult to identify the original motive of selecting a particular tasks
– It assumes that existing programs cover all failure modes
– It focuses more on reducing maintenance workload than establishing an effective maintenance plan
34
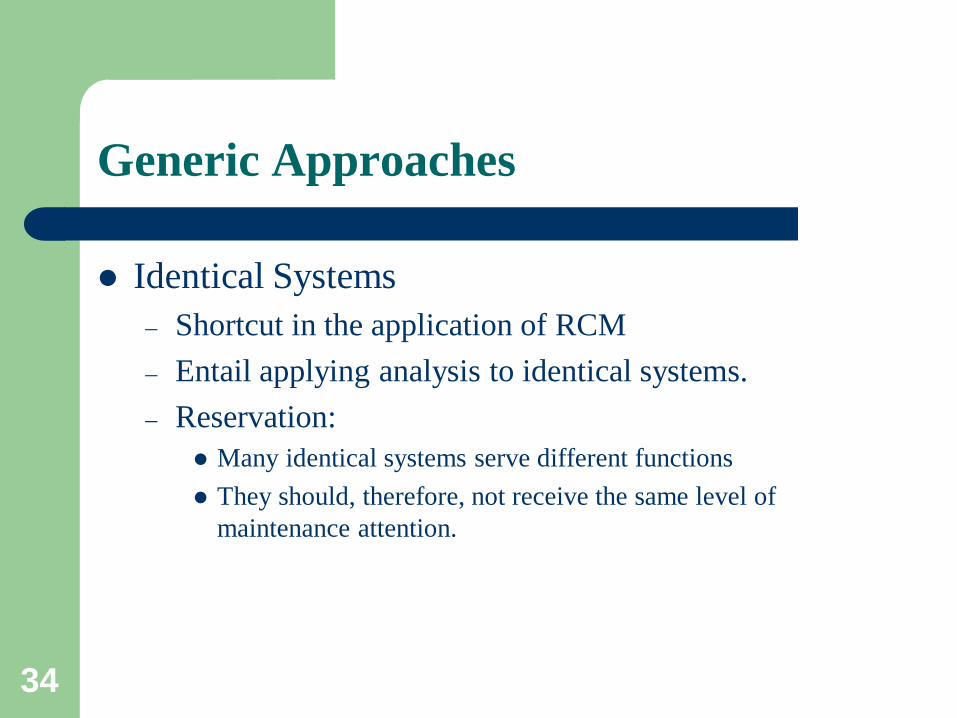
Generic Approaches
Identical Systems – Shortcut in the application of RCM – Entail applying analysis to identical systems. – Reservation:
Many identical systems serve different functions They should, therefore, not receive the same level of
maintenance attention.
35
Generic Approaches
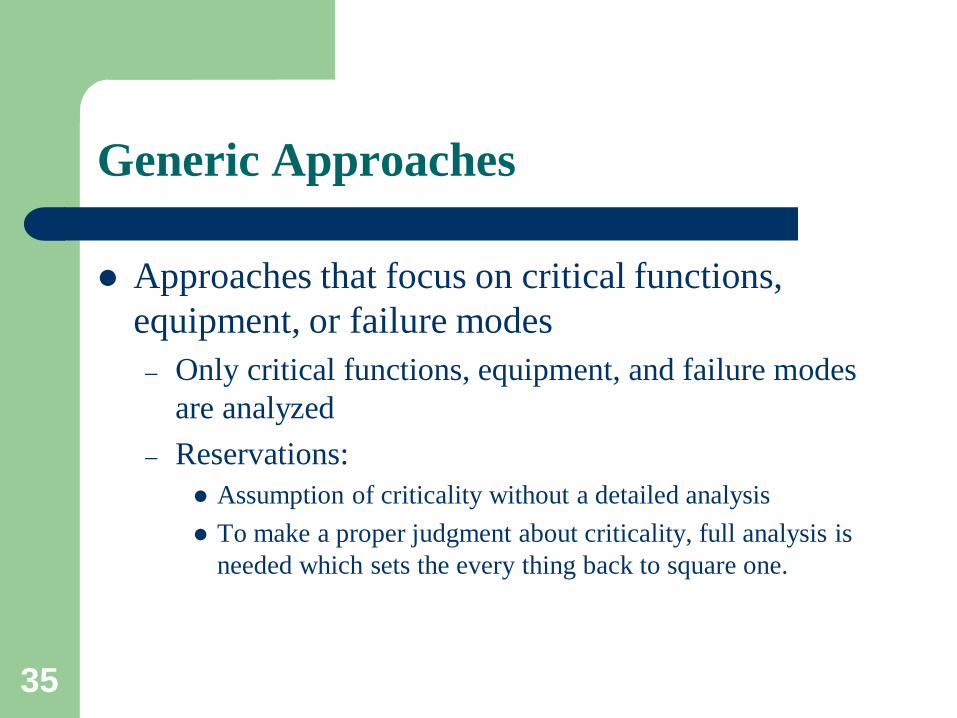
Approaches that focus on critical functions, equipment, or failure modes – Only critical functions, equipment, and failure modes
are analyzed – Reservations:
Assumption of criticality without a detailed analysis To make a proper judgment about criticality, full analysis is
needed which sets the every thing back to square one.
36
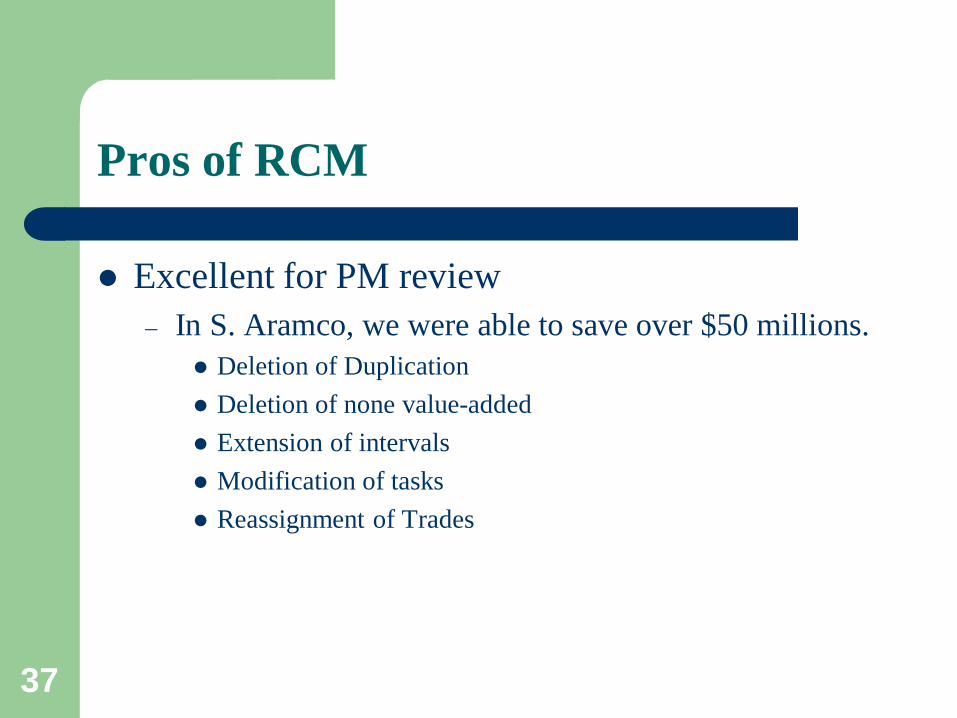
Pros of RCM
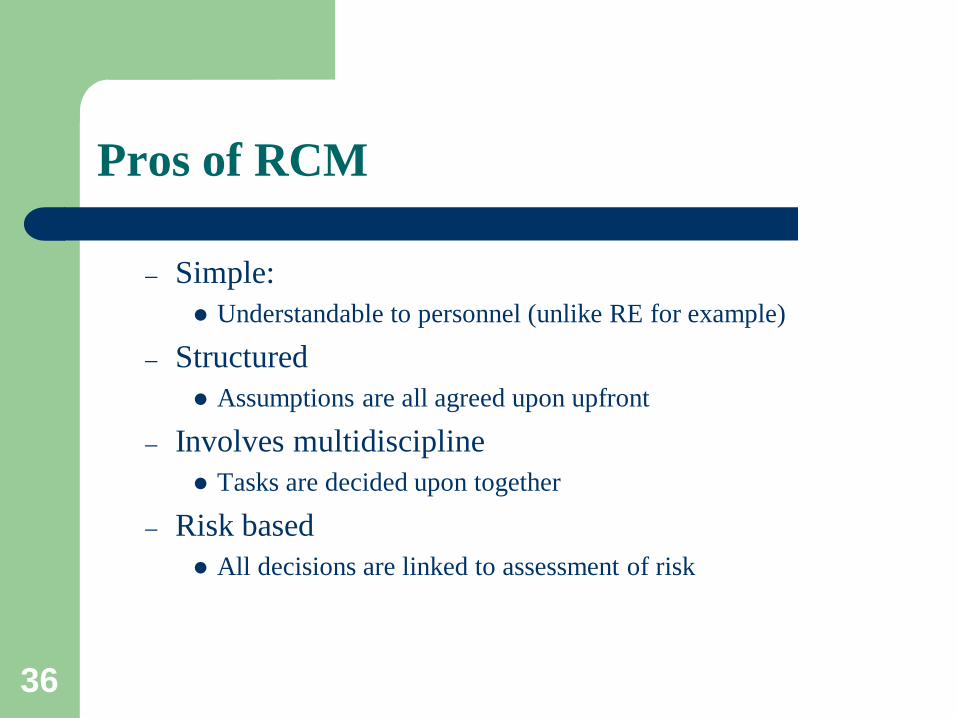
– Simple: Understandable to personnel (unlike RE for example)
– Structured Assumptions are all agreed upon upfront
– Involves multidiscipline Tasks are decided upon together
– Risk based All decisions are linked to assessment of risk
37
Pros of RCM
Excellent for PM review – In S. Aramco, we were able to save over $50 millions.
Deletion of Duplication Deletion of none value-added Extension of intervals Modification of tasks Reassignment of Trades
38
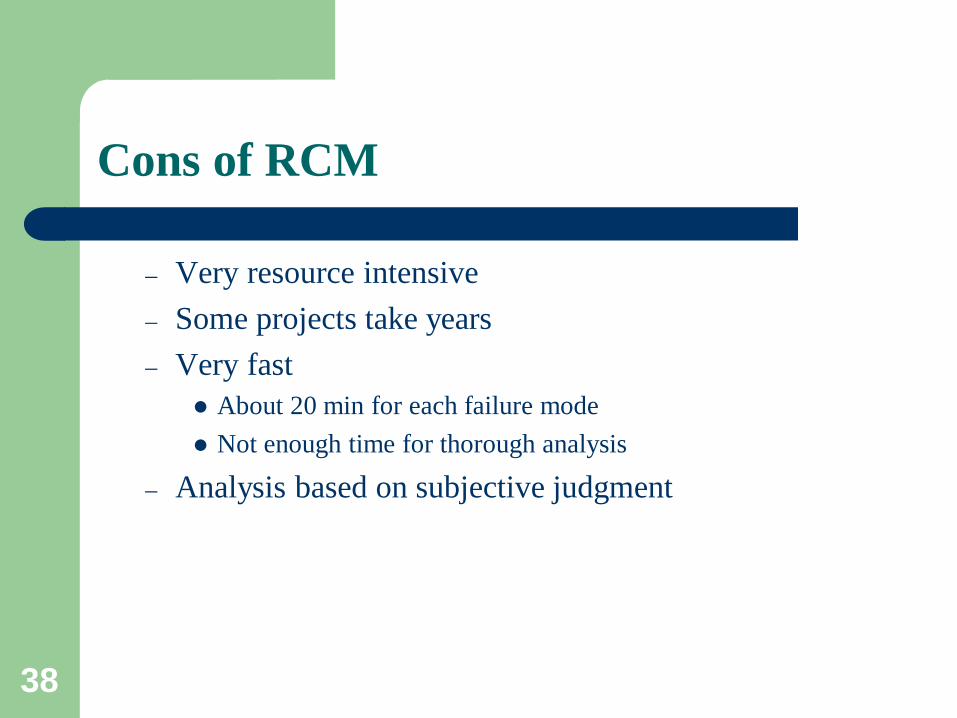
Cons of RCM
– Very resource intensive – Some projects take years – Very fast
About 20 min for each failure mode Not enough time for thorough analysis
– Analysis based on subjective judgment

39
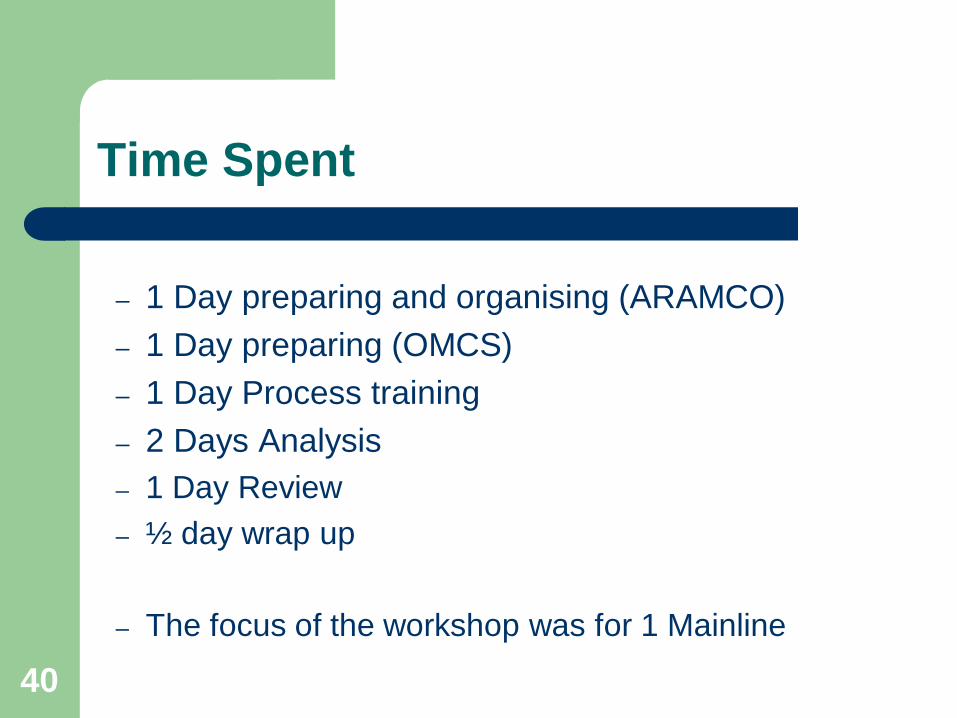
PMO Experience
Pilot conducted for Gas Turbine Driven Mainline Units
40
Time Spent
– 1 Day preparing and organising (ARAMCO) – 1 Day preparing (OMCS) – 1 Day Process training – 2 Days Analysis – 1 Day Review – ½ day wrap up
– The focus of the workshop was for 1 Mainline
41
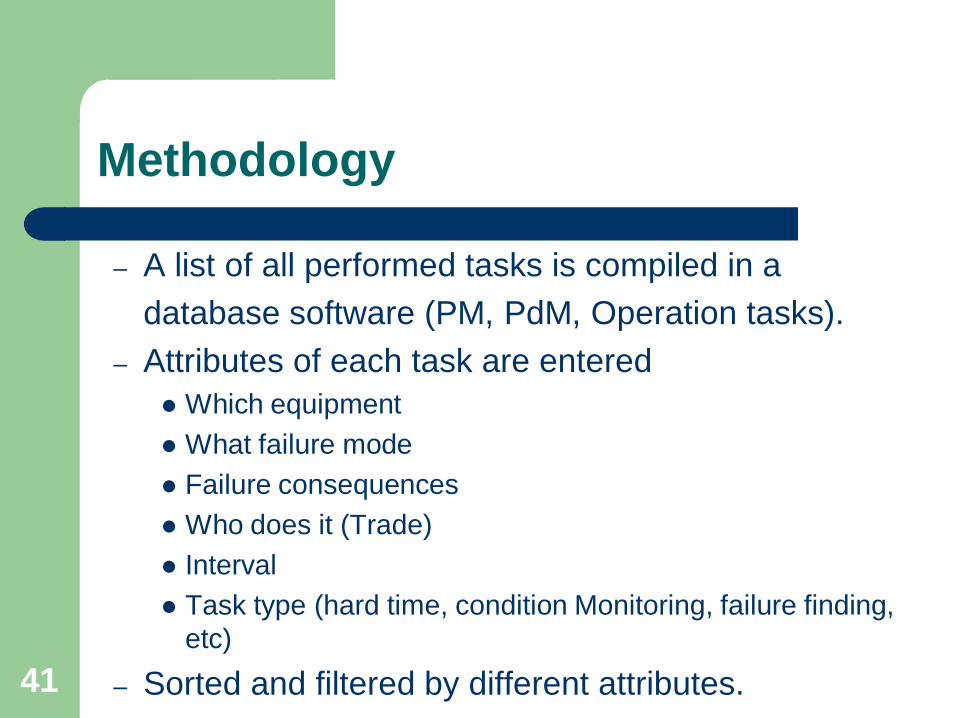
Methodology
– A list of all performed tasks is compiled in a database software (PM, PdM, Operation tasks). – Attributes of each task are entered
Which equipment What failure mode Failure consequences Who does it (Trade) Interval Task type (hard time, condition Monitoring, failure finding,
etc) – Sorted and filtered by different attributes.
42
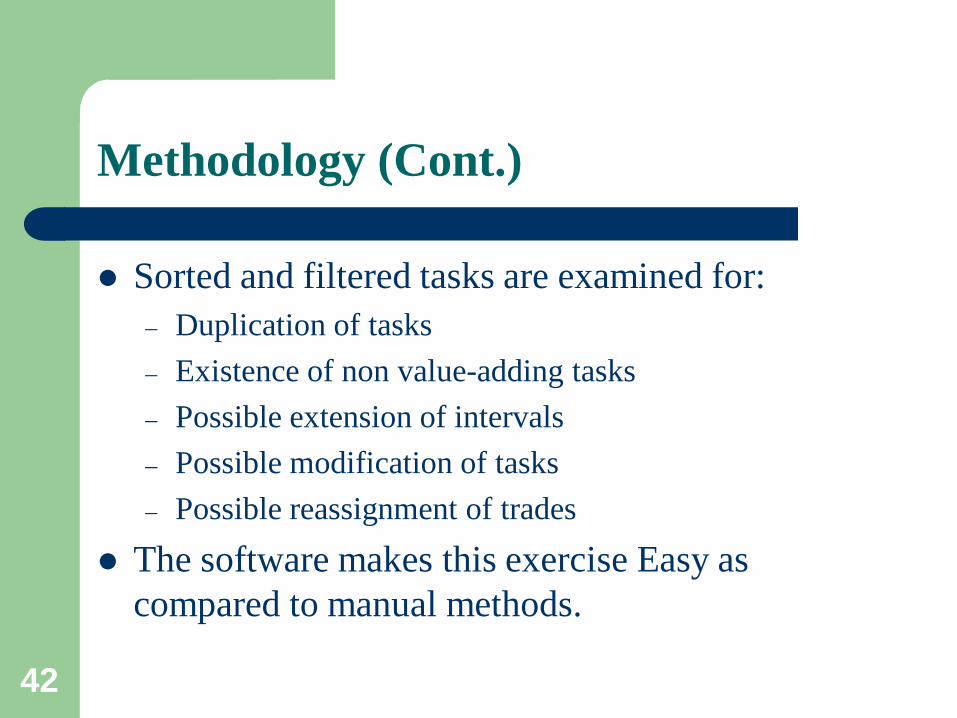
Methodology (Cont.)
Sorted and filtered tasks are examined for: – Duplication of tasks – Existence of non value-adding tasks – Possible extension of intervals – Possible modification of tasks – Possible reassignment of trades
The software makes this exercise Easy as compared to manual methods.
43
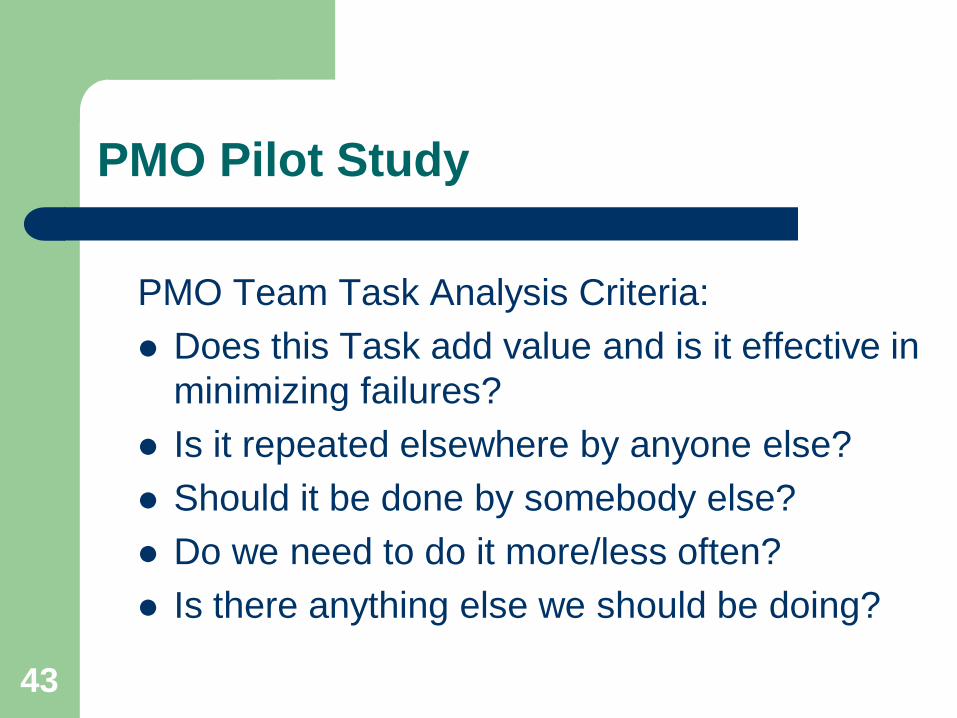
PMO Pilot Study
PMO Team Task Analysis Criteria: Does this Task add value and is it effective in
minimizing failures? Is it repeated elsewhere by anyone else? Should it be done by somebody else? Do we need to do it more/less often? Is there anything else we should be doing?
44
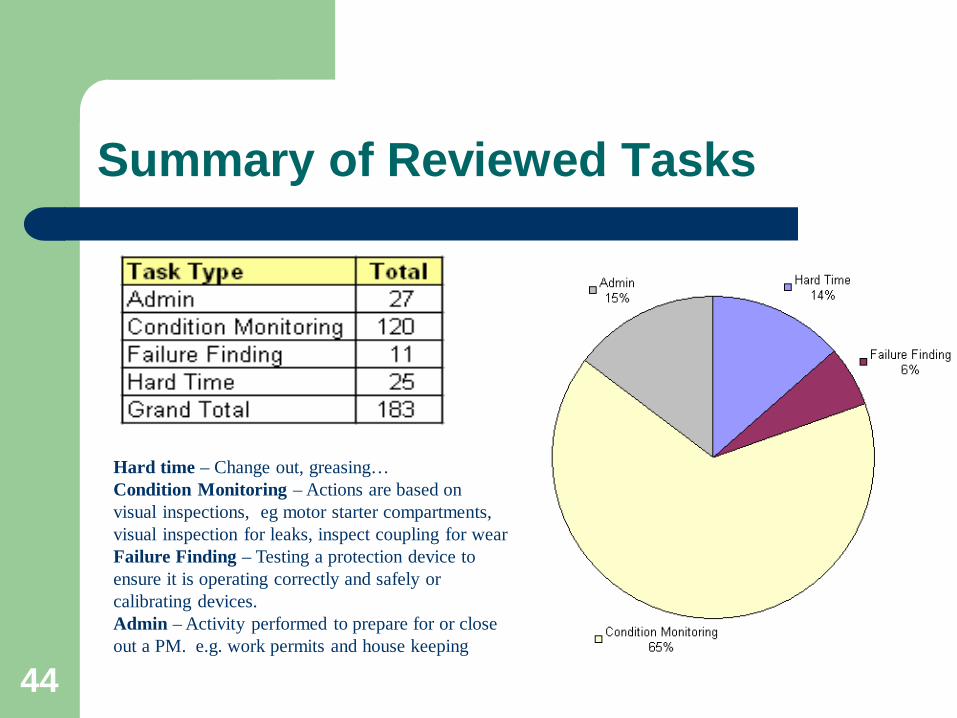
Summary of Reviewed Tasks
Hard time – Change out, greasing… Condition Monitoring – Actions are based on visual inspections, eg motor starter compartments, visual inspection for leaks, inspect coupling for wear Failure Finding – Testing a protection device to ensure it is operating correctly and safely or calibrating devices. Admin – Activity performed to prepare for or close out a PM. e.g. work permits and house keeping
45
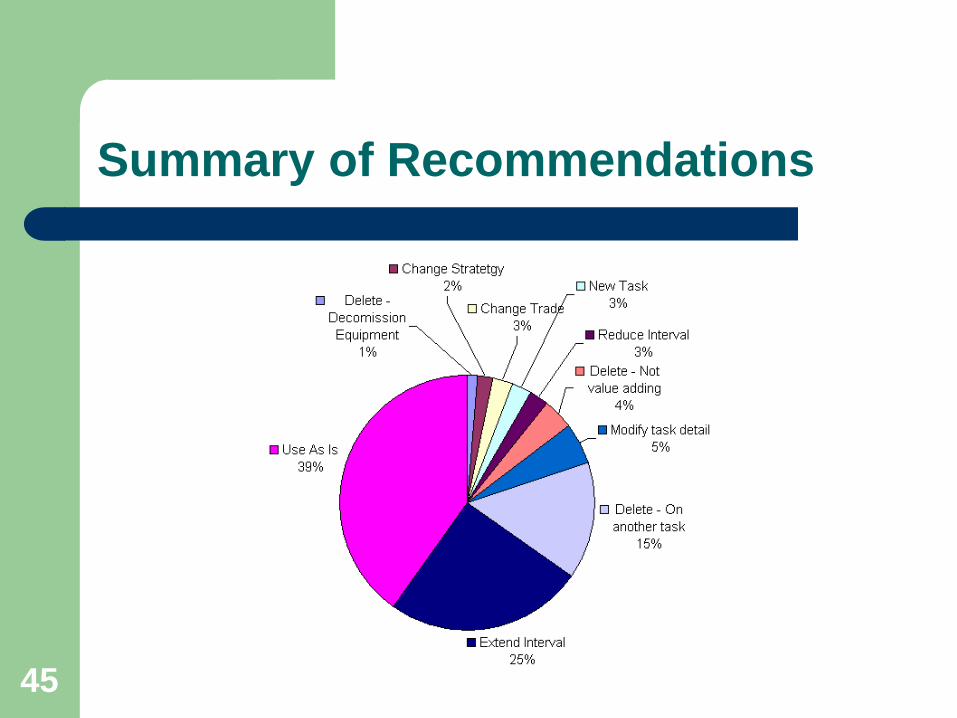
Summary of Recommendations
46
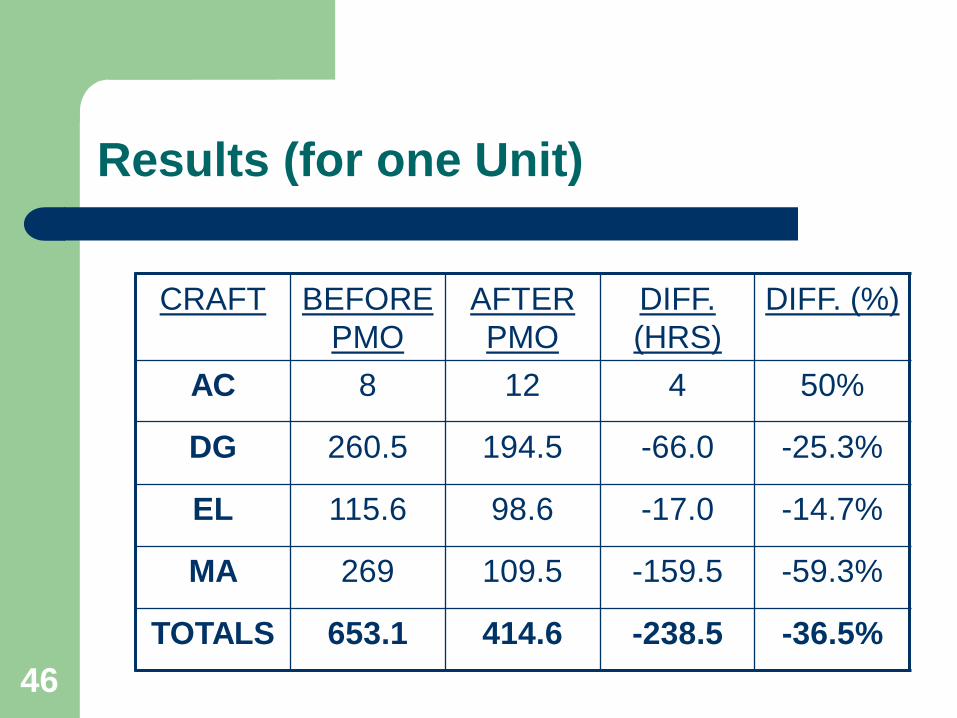
Results (for one Unit)
CRAFT BEFORE PMO
AFTER PMO
DIFF. (HRS)
DIFF. (%)
AC 8 12 4 50%
DG 260.5 194.5 -66.0 -25.3%
EL 115.6 98.6 -17.0 -14.7%
MA 269 109.5 -159.5 -59.3%
TOTALS 653.1 414.6 -238.5 -36.5%
47
Total PM Reduction
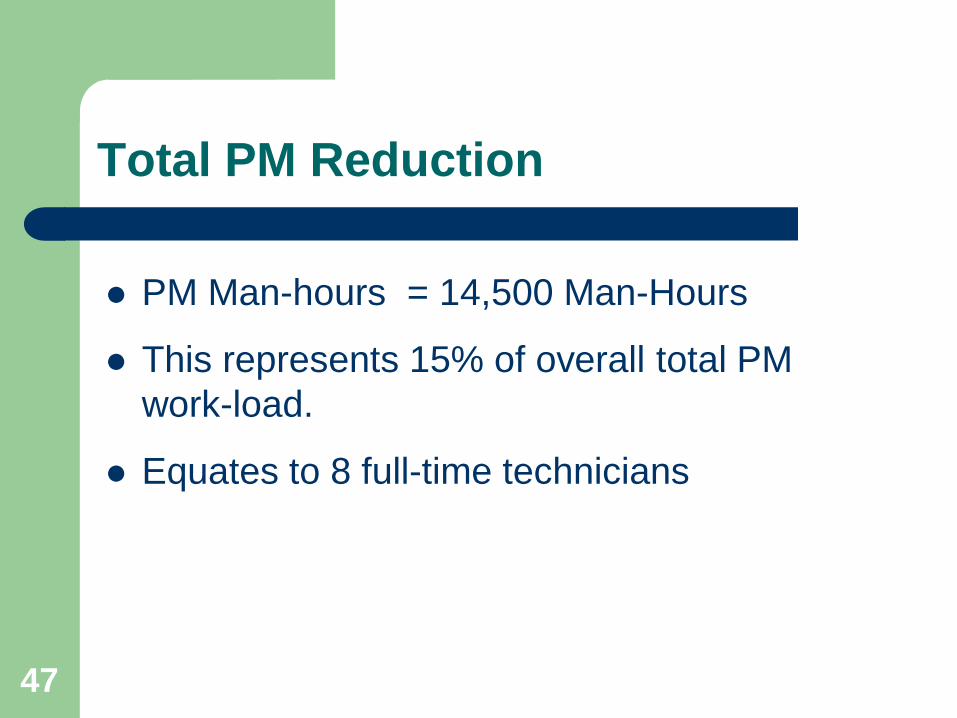
PM Man-hours = 14,500 Man-Hours
This represents 15% of overall total PM work-load.
Equates to 8 full-time technicians
48
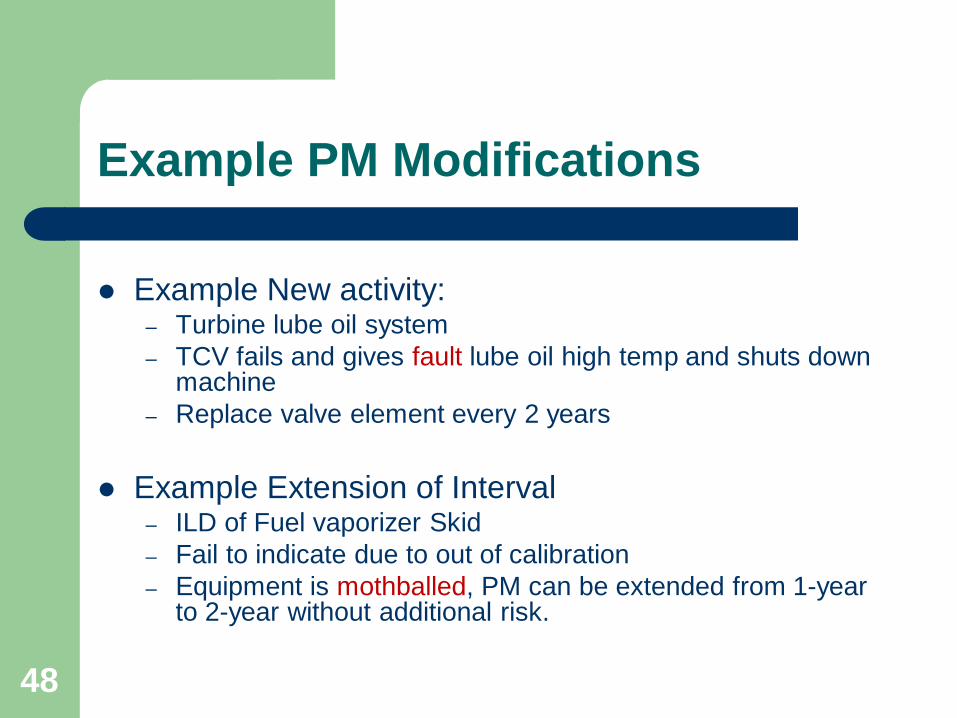
Example PM Modifications
Example New activity: – Turbine lube oil system – TCV fails and gives fault lube oil high temp and shuts down
machine – Replace valve element every 2 years
Example Extension of Interval
– ILD of Fuel vaporizer Skid – Fail to indicate due to out of calibration – Equipment is mothballed, PM can be extended from 1-year
to 2-year without additional risk.
49
Example PM Modifications
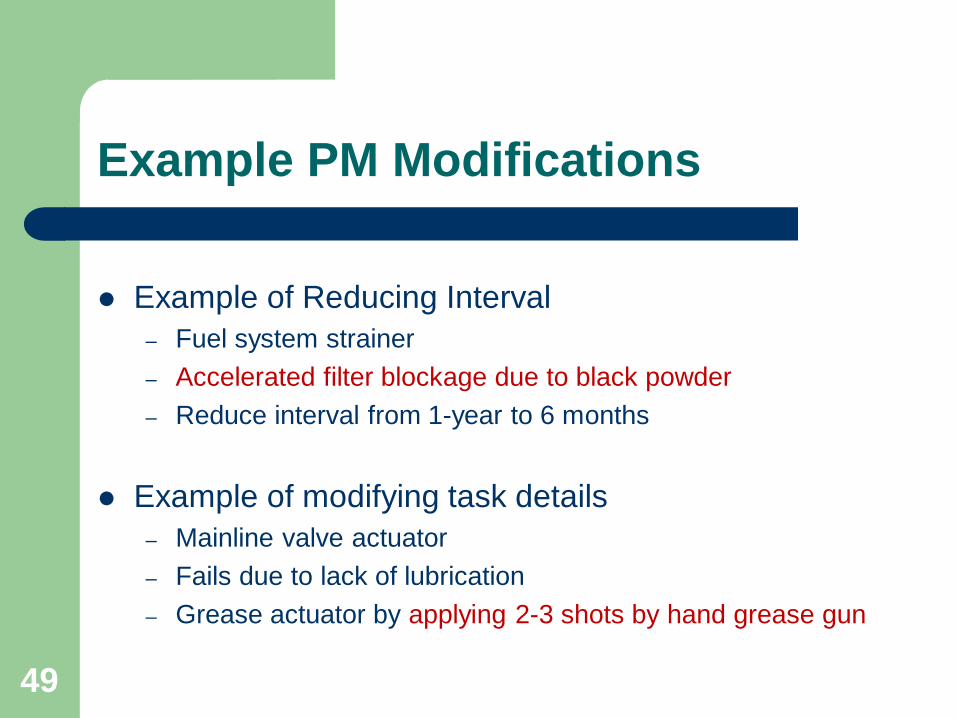
Example of Reducing Interval – Fuel system strainer – Accelerated filter blockage due to black powder – Reduce interval from 1-year to 6 months
Example of modifying task details – Mainline valve actuator – Fails due to lack of lubrication – Grease actuator by applying 2-3 shots by hand grease gun
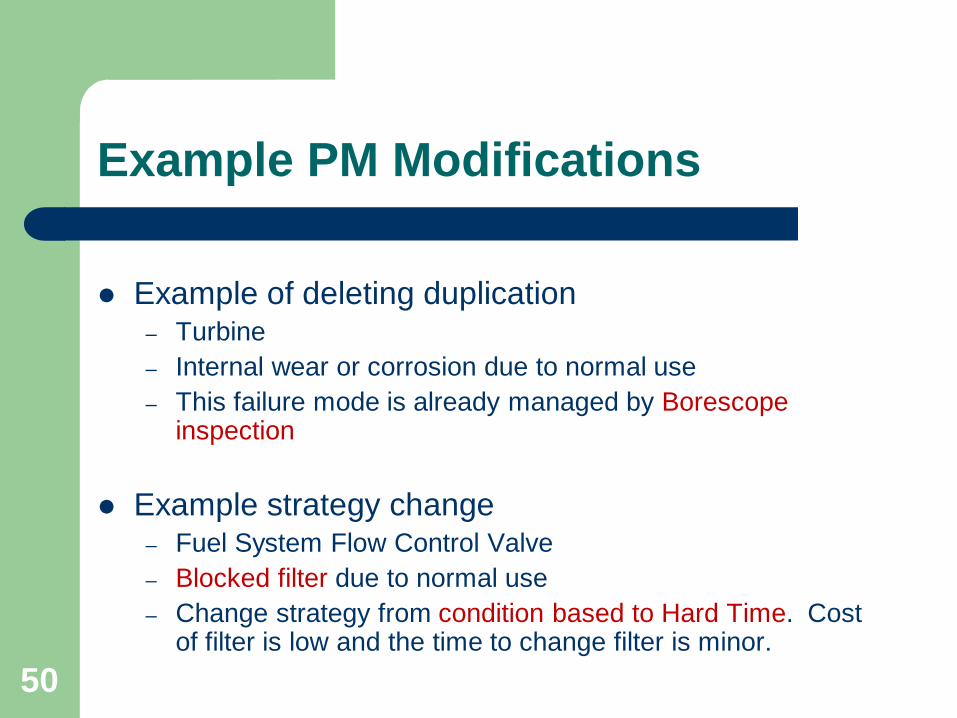
50
Example PM Modifications
Example of deleting duplication – Turbine – Internal wear or corrosion due to normal use – This failure mode is already managed by Borescope
inspection
Example strategy change – Fuel System Flow Control Valve – Blocked filter due to normal use – Change strategy from condition based to Hard Time. Cost
of filter is low and the time to change filter is minor.
51
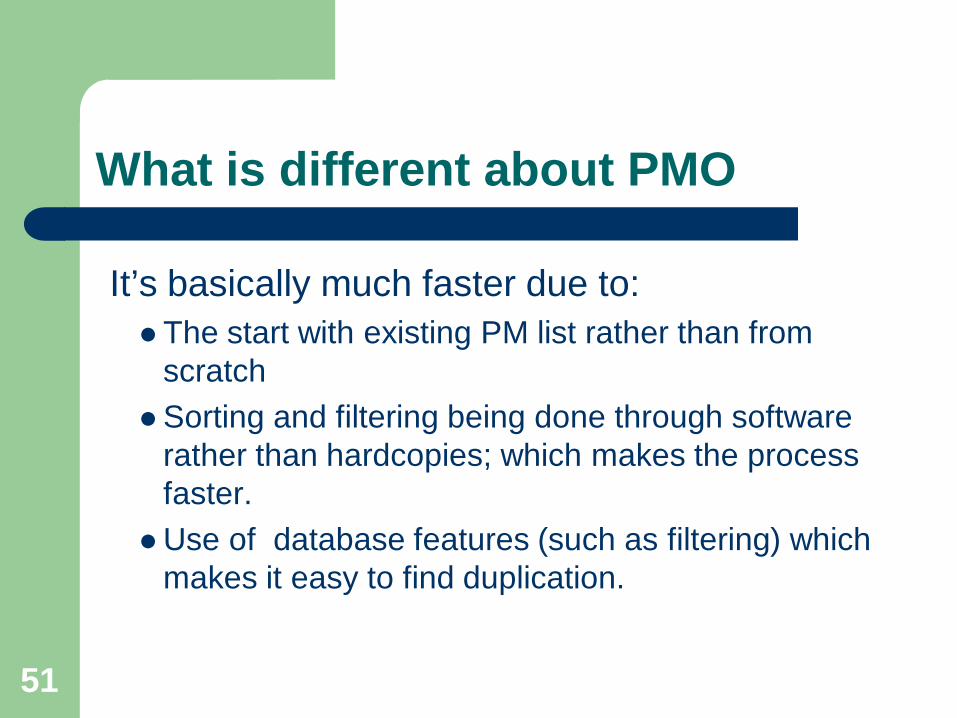
What is different about PMO
It’s basically much faster due to: The start with existing PM list rather than from
scratch Sorting and filtering being done through software
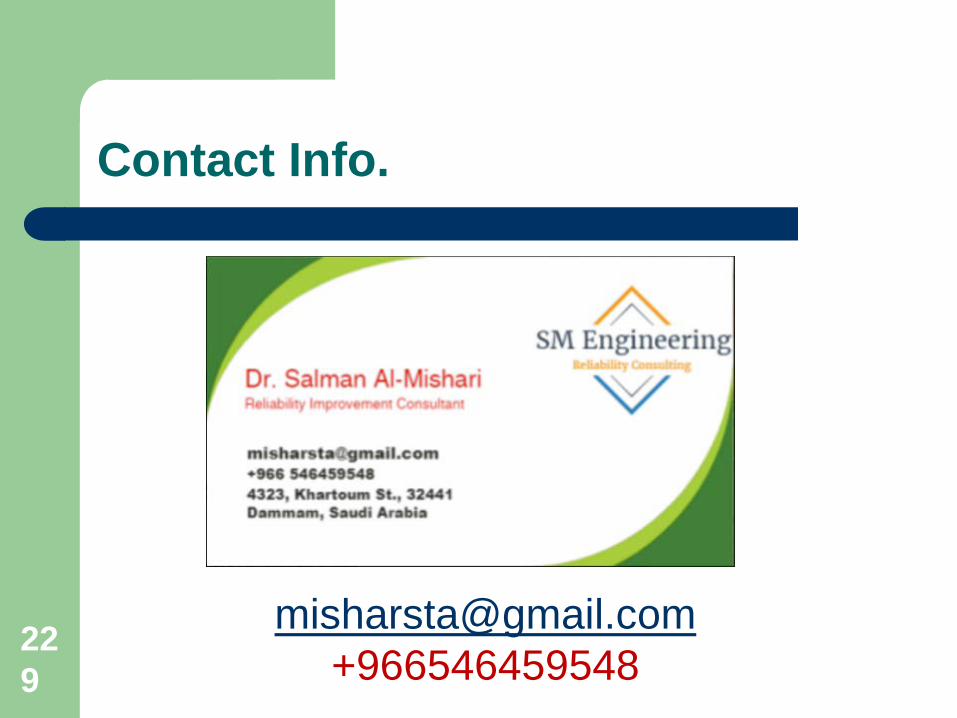
rather than hardcopies; which makes the process faster.
Use of database features (such as filtering) which makes it easy to find duplication.
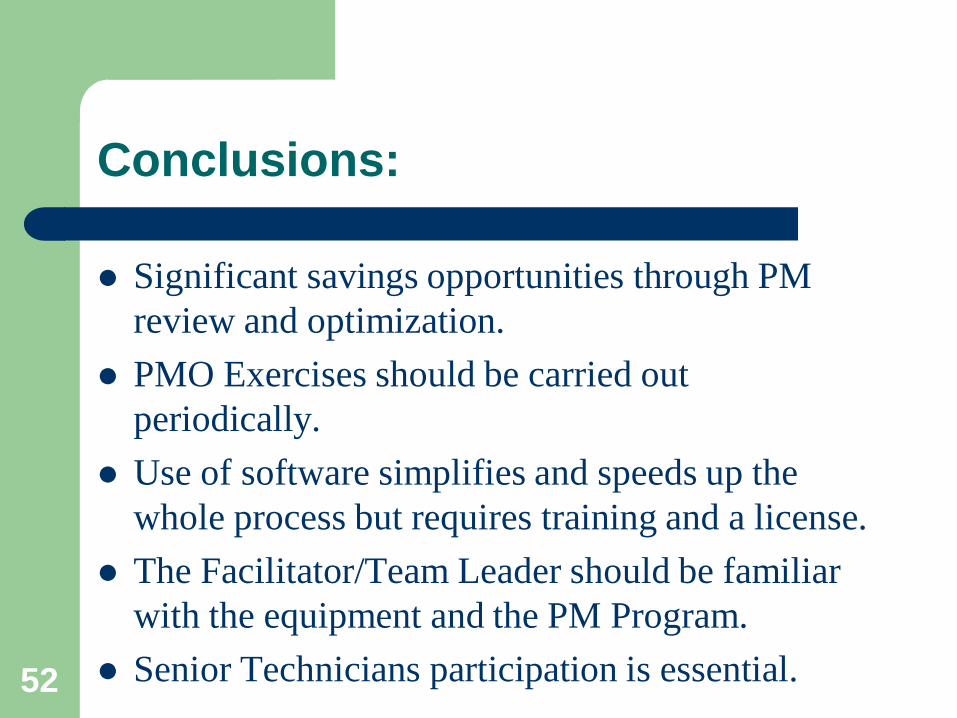
Conclusions:
Significant savings opportunities through PM review and optimization.
PMO Exercises should be carried out periodically.
Use of software simplifies and speeds up the whole process but requires training and a license.
The Facilitator/Team Leader should be familiar with the equipment and the PM Program.
Senior Technicians participation is essential. 52
53
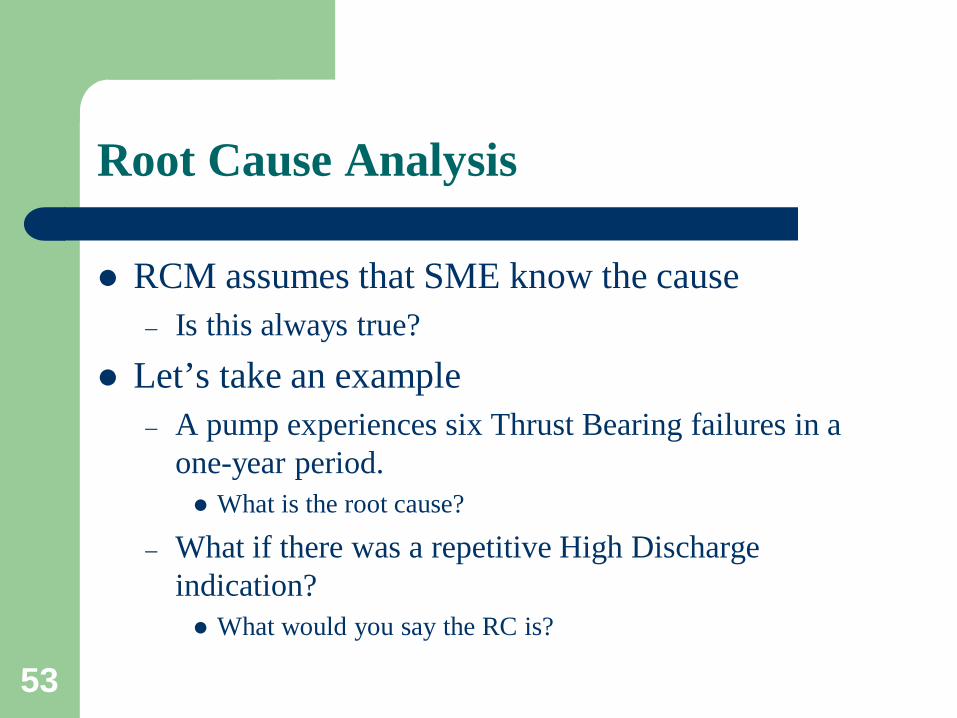
Root Cause Analysis
RCM assumes that SME know the cause – Is this always true?
Let’s take an example – A pump experiences six Thrust Bearing failures in a
one-year period. What is the root cause?
– What if there was a repetitive High Discharge indication? What would you say the RC is?
54
Root Cause Analysis
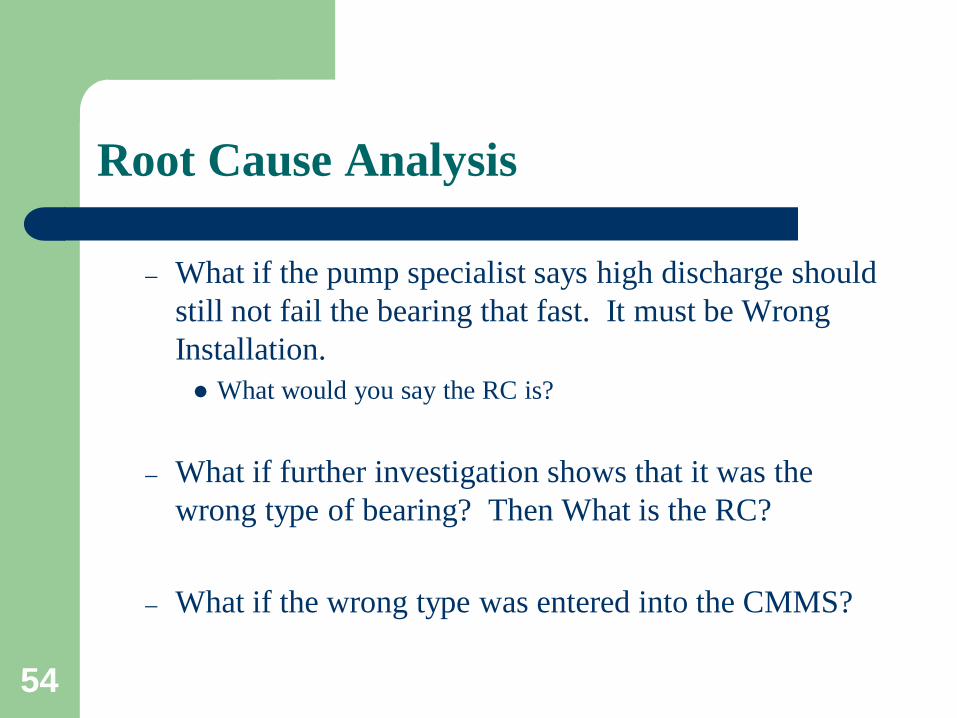
– What if the pump specialist says high discharge should still not fail the bearing that fast. It must be Wrong Installation. What would you say the RC is?
– What if further investigation shows that it was the wrong type of bearing? Then What is the RC?
– What if the wrong type was entered into the CMMS?
55
Root Cause Analysis
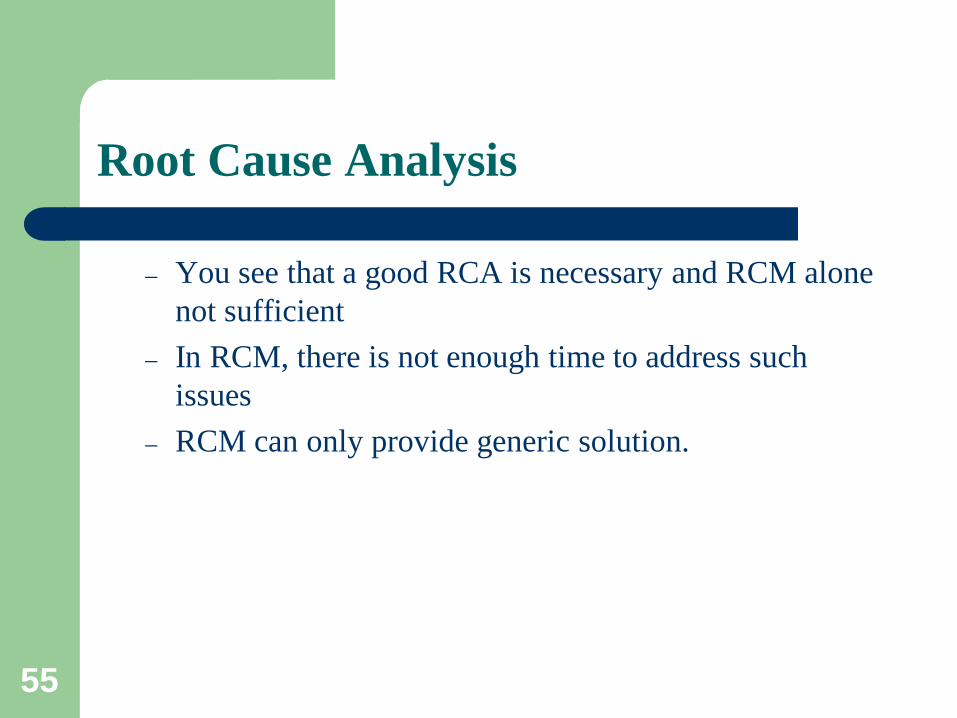
– You see that a good RCA is necessary and RCM alone not sufficient
– In RCM, there is not enough time to address such issues
– RCM can only provide generic solution.

56
What is Root Cause Analysis
A method to find out why a particular failure exists and to effectively correct it.
57
Linear Method (5 whys)
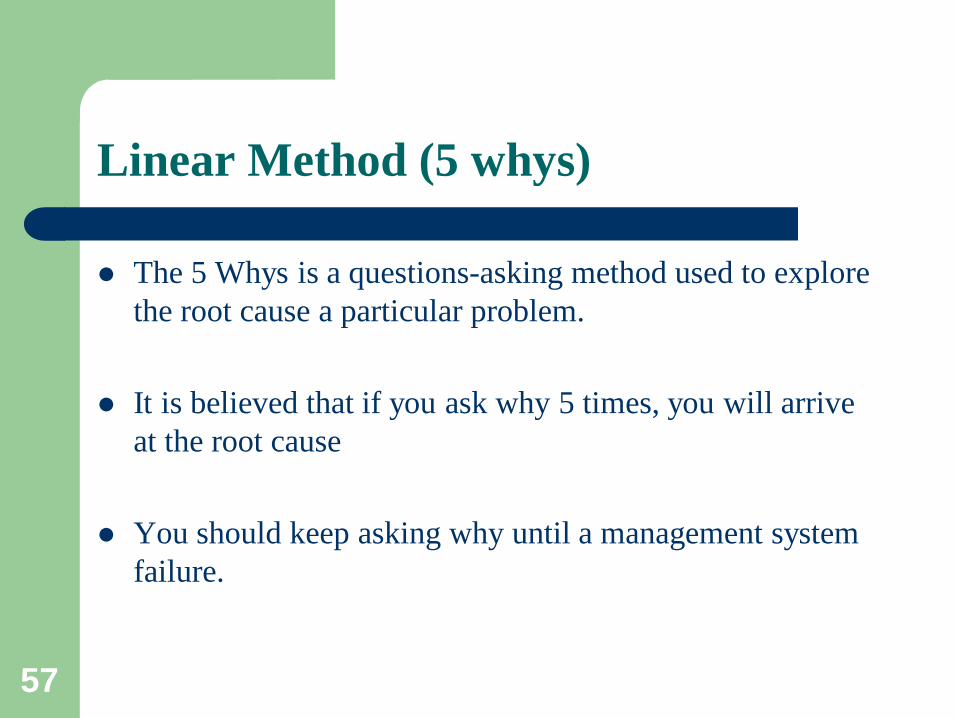
The 5 Whys is a questions-asking method used to explore the root cause a particular problem.
It is believed that if you ask why 5 times, you will arrive at the root cause
You should keep asking why until a management system failure.
58
Linear Method (5 whys)
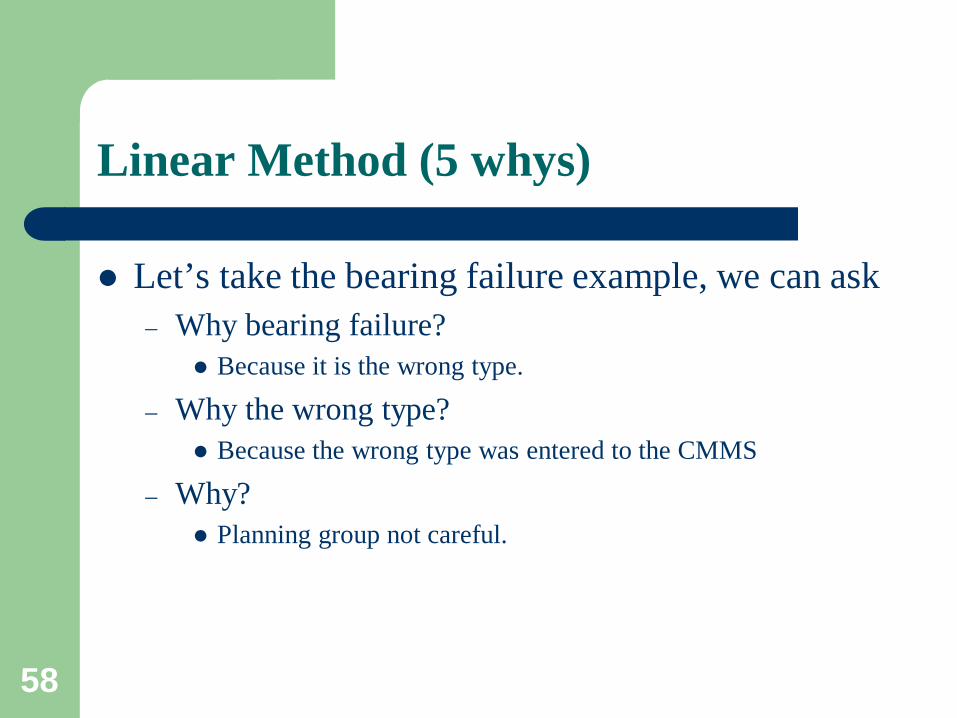
Let’s take the bearing failure example, we can ask – Why bearing failure?
Because it is the wrong type.
– Why the wrong type? Because the wrong type was entered to the CMMS
– Why? Planning group not careful.
59
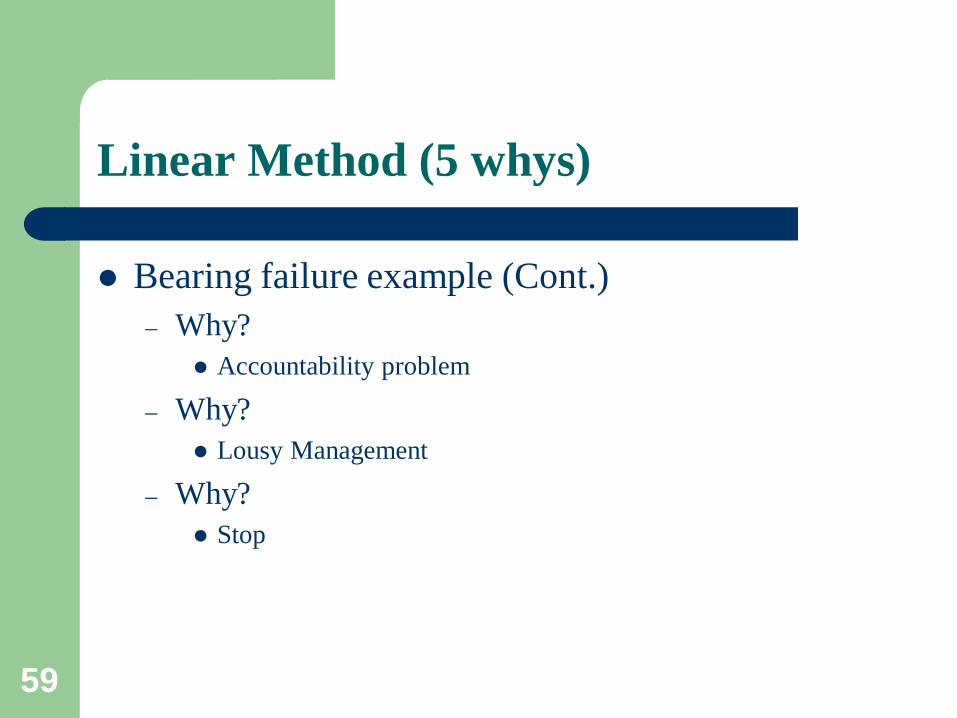
Linear Method (5 whys)
Bearing failure example (Cont.) – Why?
Accountability problem
– Why? Lousy Management
– Why? Stop
60
Linear Method (5 whys)
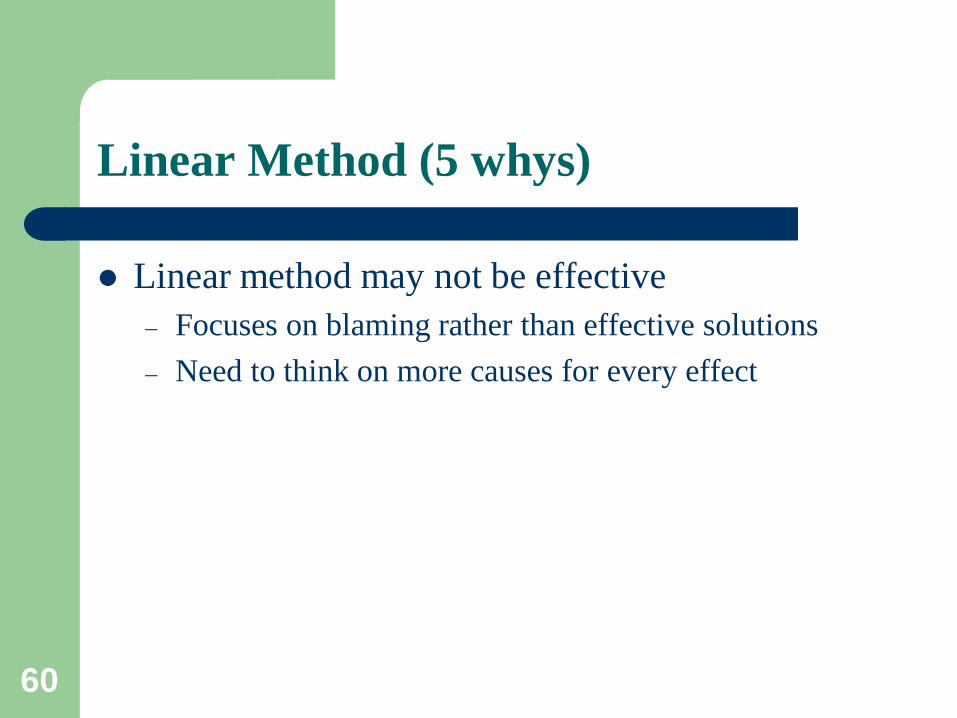
Linear method may not be effective – Focuses on blaming rather than effective solutions – Need to think on more causes for every effect
61
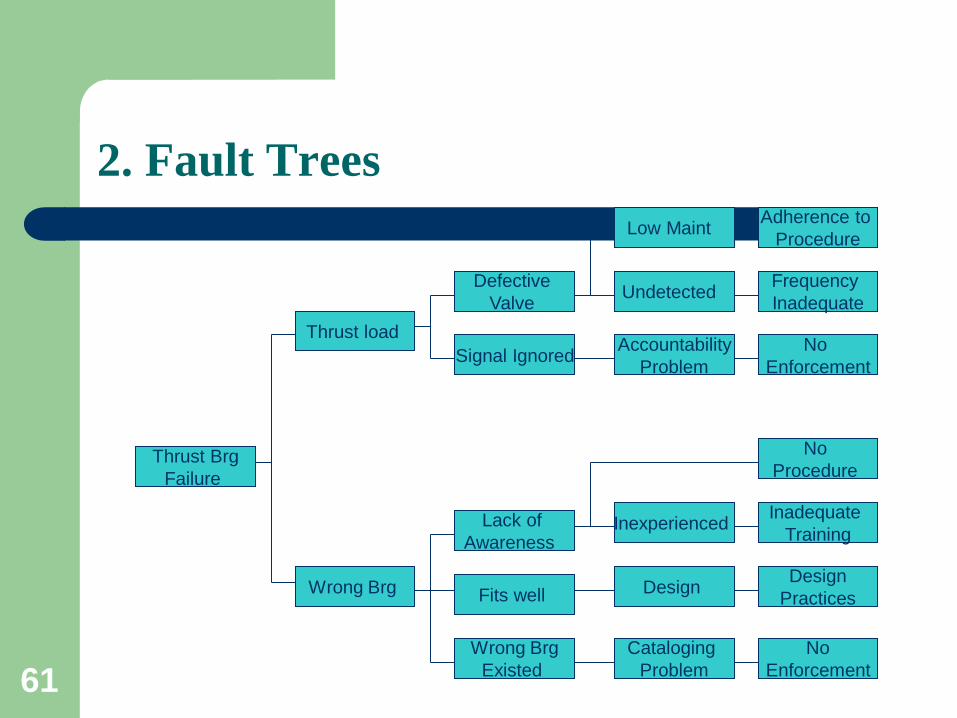
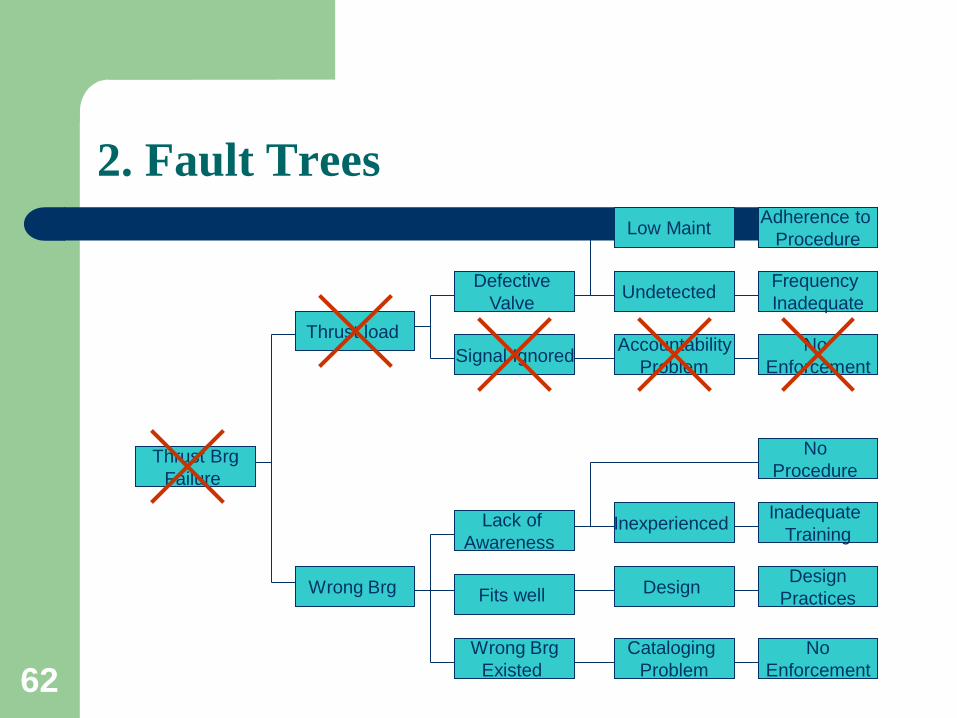
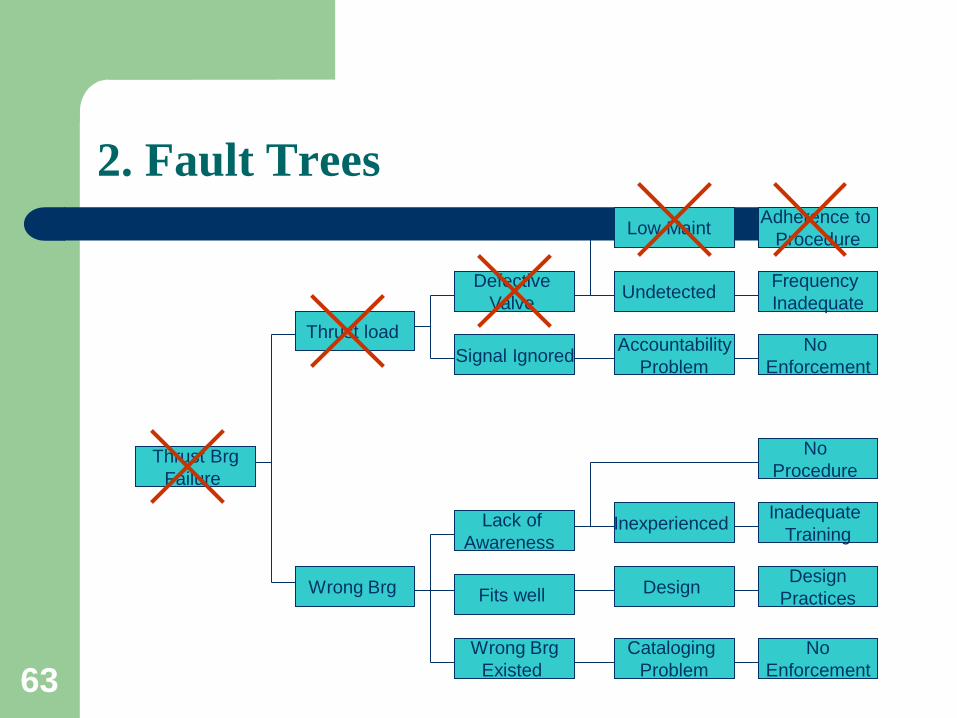
2. Fault Trees
Thrust Brg Failure
Thrust load
Wrong Brg
Lack of Awareness
Wrong Brg Existed
Fits well
Defective Valve
Signal Ignored
Low Maint
No Procedure
Inexperienced
Undetected
Accountability Problem
Design Design Practices
Cataloging Problem
No Enforcement
Inadequate Training
No Enforcement
Frequency Inadequate
Adherence to Procedure
62
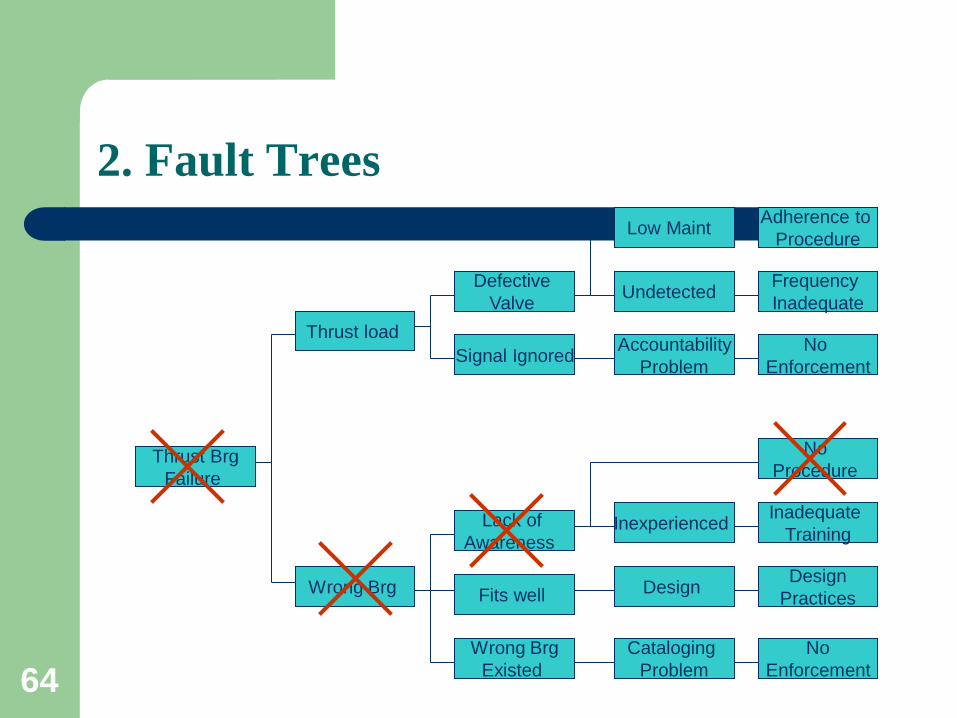
2. Fault Trees
Thrust Brg Failure
Thrust load
Wrong Brg
Lack of Awareness
Wrong Brg Existed
Fits well
Defective Valve
Signal Ignored
Low Maint
No Procedure
Inexperienced
Undetected
Accountability Problem
Design Design Practices
Cataloging Problem
No Enforcement
Inadequate Training
No Enforcement
Frequency Inadequate
Adherence to Procedure
63
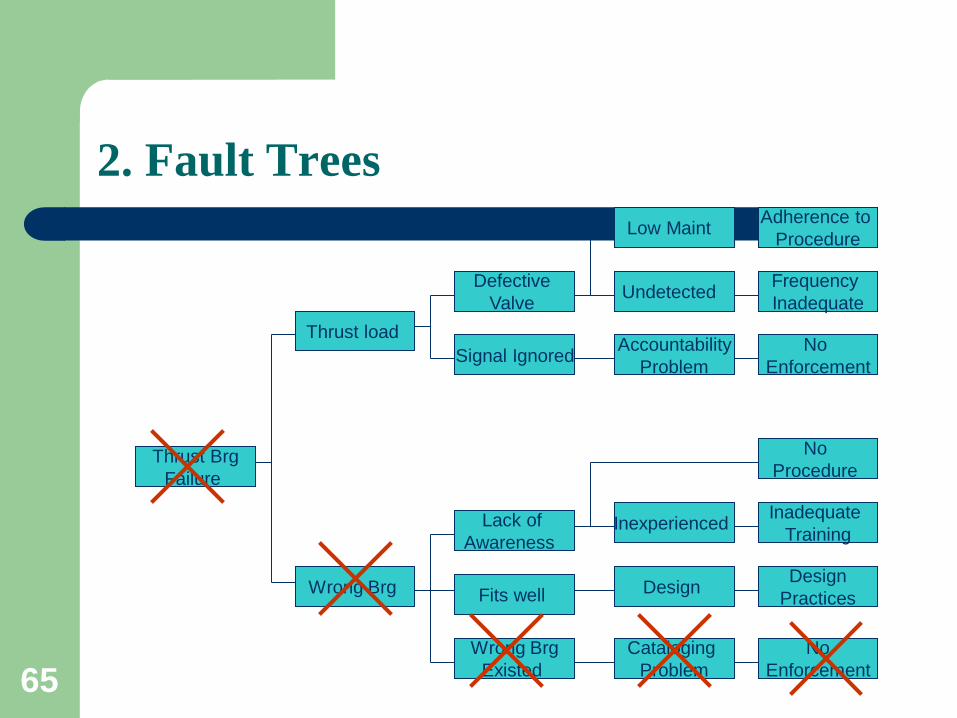
2. Fault Trees
Thrust Brg Failure
Thrust load
Wrong Brg
Lack of Awareness
Wrong Brg Existed
Fits well
Defective Valve
Signal Ignored
Low Maint
No Procedure
Inexperienced
Undetected
Accountability Problem
Design Design Practices
Cataloging Problem
No Enforcement
Inadequate Training
No Enforcement
Frequency Inadequate
Adherence to Procedure
64
2. Fault Trees
Thrust Brg Failure
Thrust load
Wrong Brg
Lack of Awareness
Wrong Brg Existed
Fits well
Defective Valve
Signal Ignored
Low Maint
No Procedure
Inexperienced
Undetected
Accountability Problem
Design Design Practices
Cataloging Problem
No Enforcement
Inadequate Training
No Enforcement
Frequency Inadequate
Adherence to Procedure
65
2. Fault Trees
Thrust Brg Failure
Thrust load
Wrong Brg
Lack of Awareness
Wrong Brg Existed
Fits well
Defective Valve
Signal Ignored
Low Maint
No Procedure
Inexperienced
Undetected
Accountability Problem
Design Design Practices
Cataloging Problem
No Enforcement
Inadequate Training
No Enforcement
Frequency Inadequate
Adherence to Procedure
66
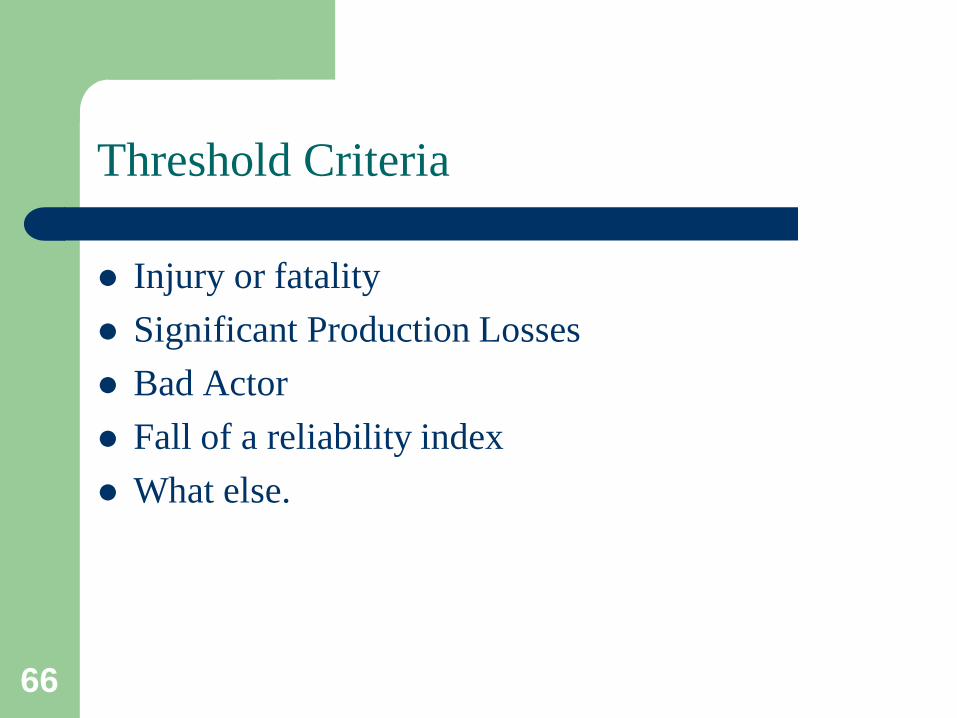
Threshold Criteria
Injury or fatality Significant Production Losses Bad Actor Fall of a reliability index What else.

67

68

69

70

71
72
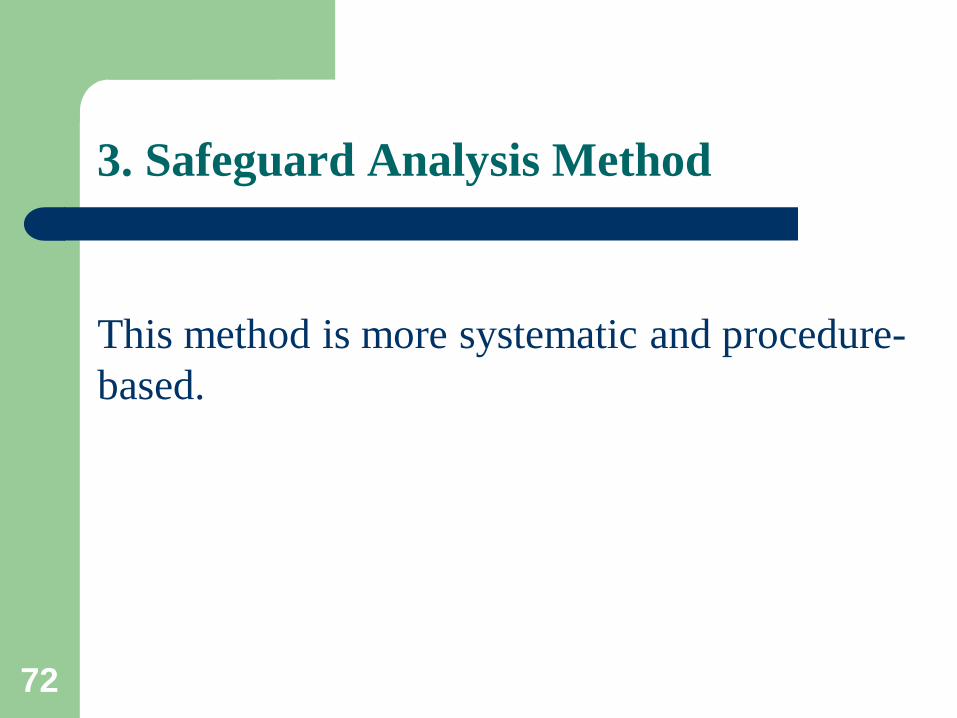
3. Safeguard Analysis Method
This method is more systematic and procedure-based.
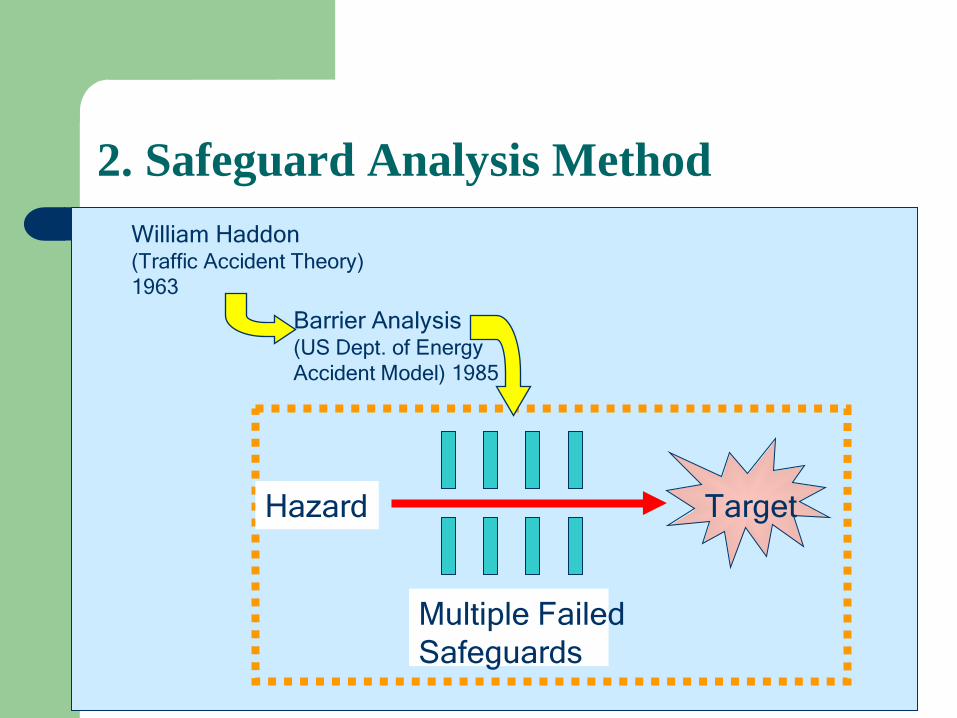
Hazard Target
Multiple Failed Safeguards
Barrier Analysis (US Dept. of Energy Accident Model) 1985
William Haddon (Traffic Accident Theory) 1963
2. Safeguard Analysis Method
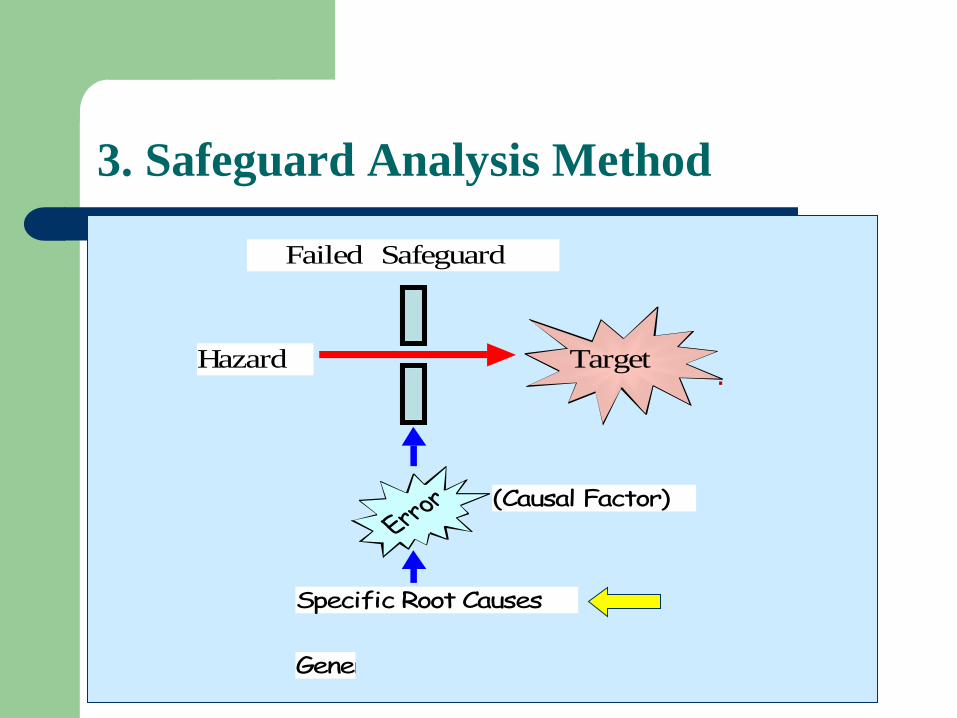
Hazard Target
Failed Safeguard
Error (Causal Factor)
Specific Root Causes
Generic Root Causes
.
3. Safeguard Analysis Method
3. Safeguard Analysis Method
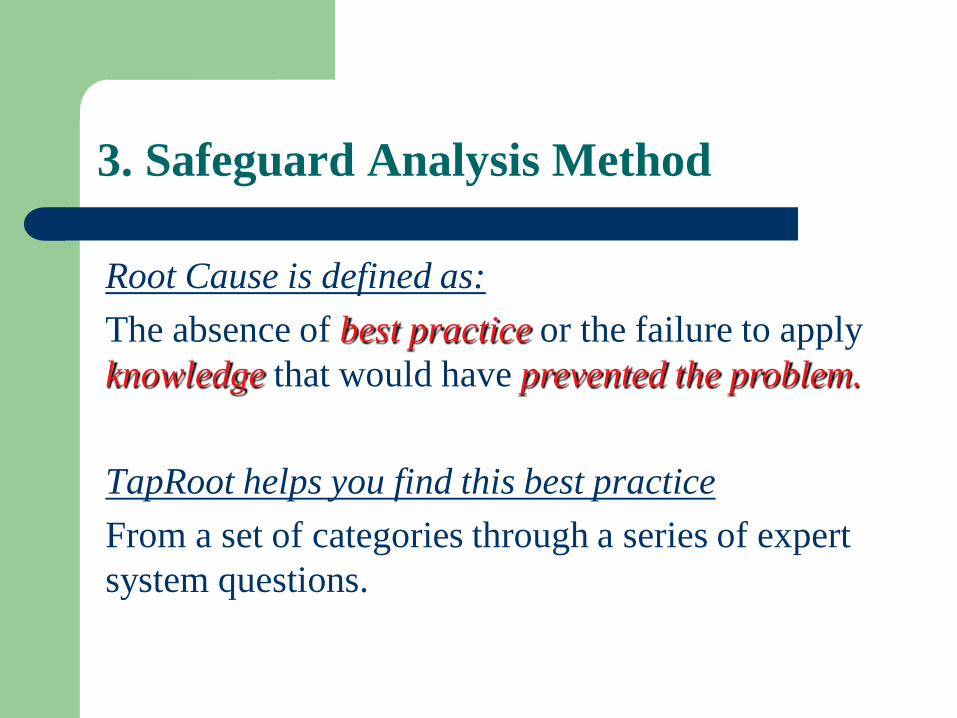
Root Cause is defined as: The absence of best practice or the failure to apply knowledge that would have prevented the problem. TapRoot helps you find this best practice From a set of categories through a series of expert system questions.
3. Safeguard Analysis Method
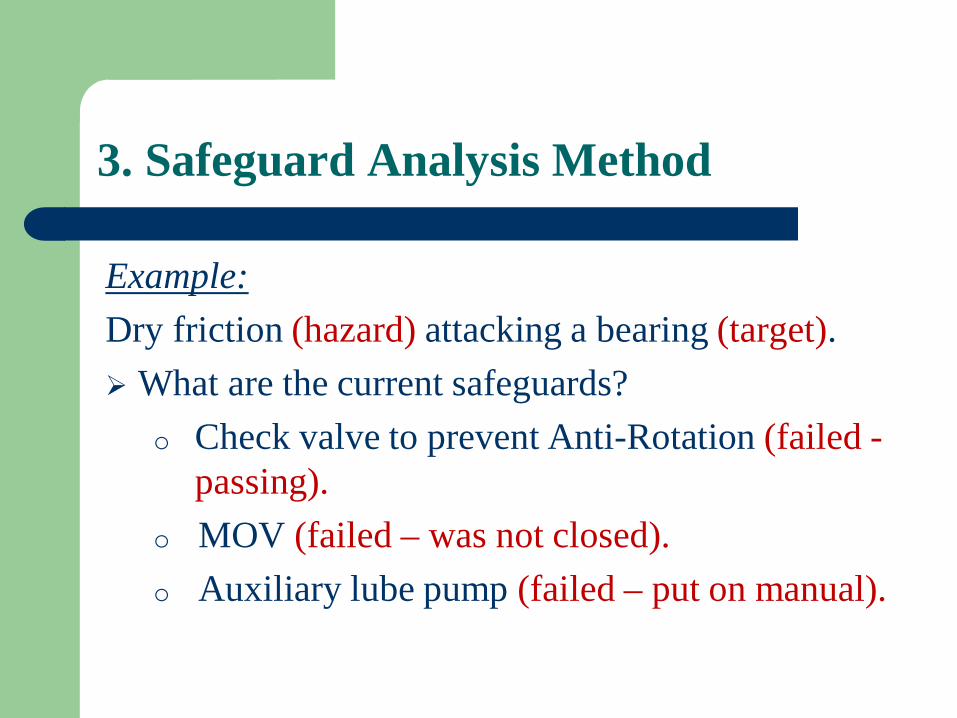
Example: Dry friction (hazard) attacking a bearing (target). What are the current safeguards?
o Check valve to prevent Anti-Rotation (failed - passing).
o MOV (failed – was not closed). o Auxiliary lube pump (failed – put on manual).
3. Safeguard Analysis Method
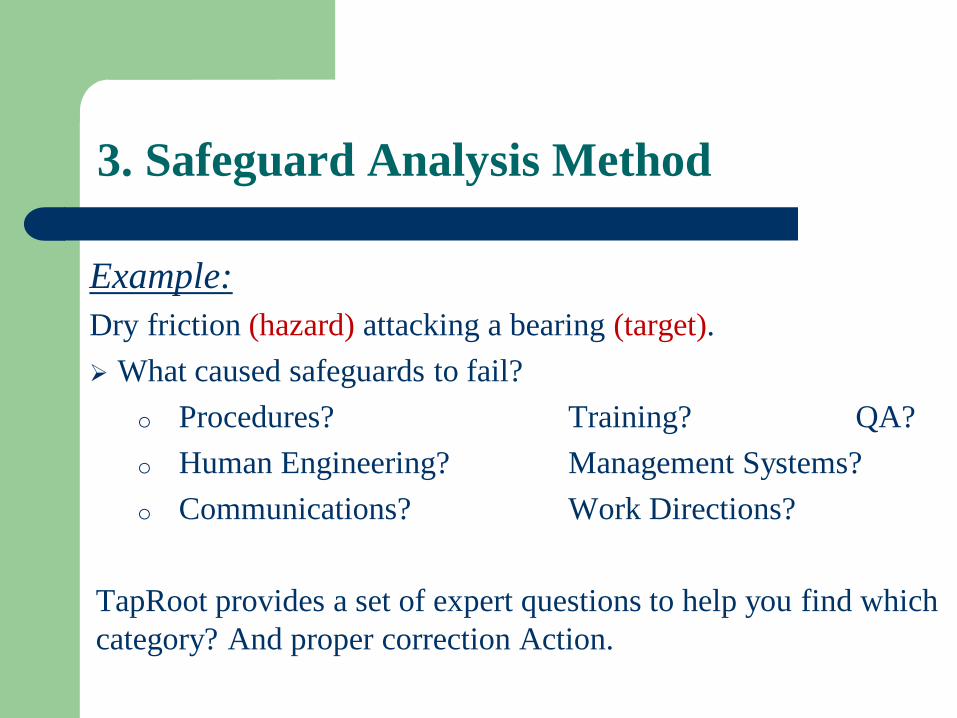
Example: Dry friction (hazard) attacking a bearing (target). What caused safeguards to fail?
o Procedures? Training? QA? o Human Engineering? Management Systems? o Communications? Work Directions?
TapRoot provides a set of expert questions to help you find which category? And proper correction Action.
78
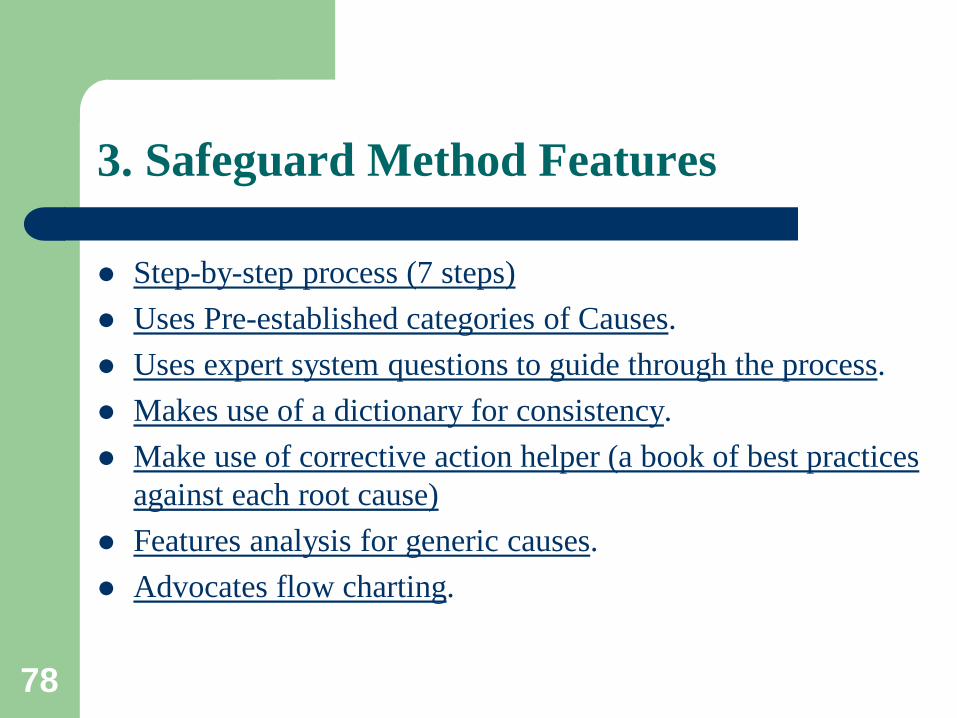
3. Safeguard Method Features
Step-by-step process (7 steps) Uses Pre-established categories of Causes. Uses expert system questions to guide through the process. Makes use of a dictionary for consistency. Make use of corrective action helper (a book of best practices
against each root cause) Features analysis for generic causes. Advocates flow charting.
79
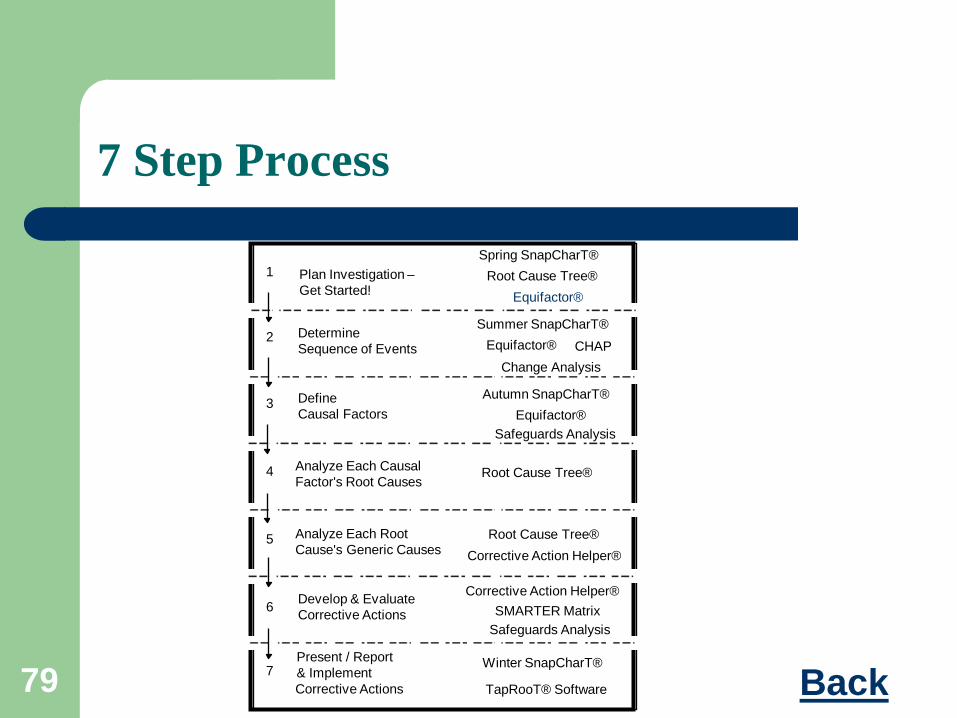
Plan Investigation – Get Started!
Determine Sequence of Events
Define Causal Factors
Analyze Each Causal Factor's Root Causes
Analyze Each Root Cause's Generic Causes
Develop & Evaluate Corrective Actions
Present / Report & Implement Corrective Actions
1
2
3
4
5
6
7
Root Cause Tree®
Equifactor® Safeguards Analysis
Corrective Action Helper® SMARTER Matrix
TapRooT® Software
Spring SnapCharT® Root Cause Tree®
Summer SnapCharT® Equifactor® CHAP
Change Analysis
Safeguards Analysis
Root Cause Tree®
Corrective Action Helper®
Winter SnapCharT®
Equifactor®
Autumn SnapCharT®
7 Step Process
Back
80
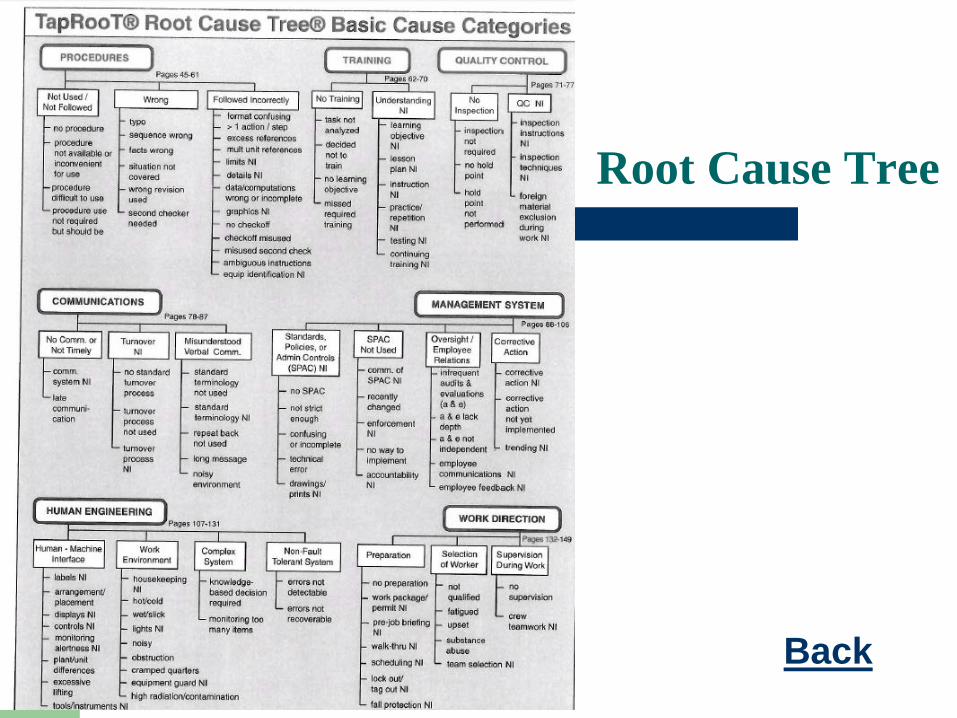
Root Cause Tree
Back
81
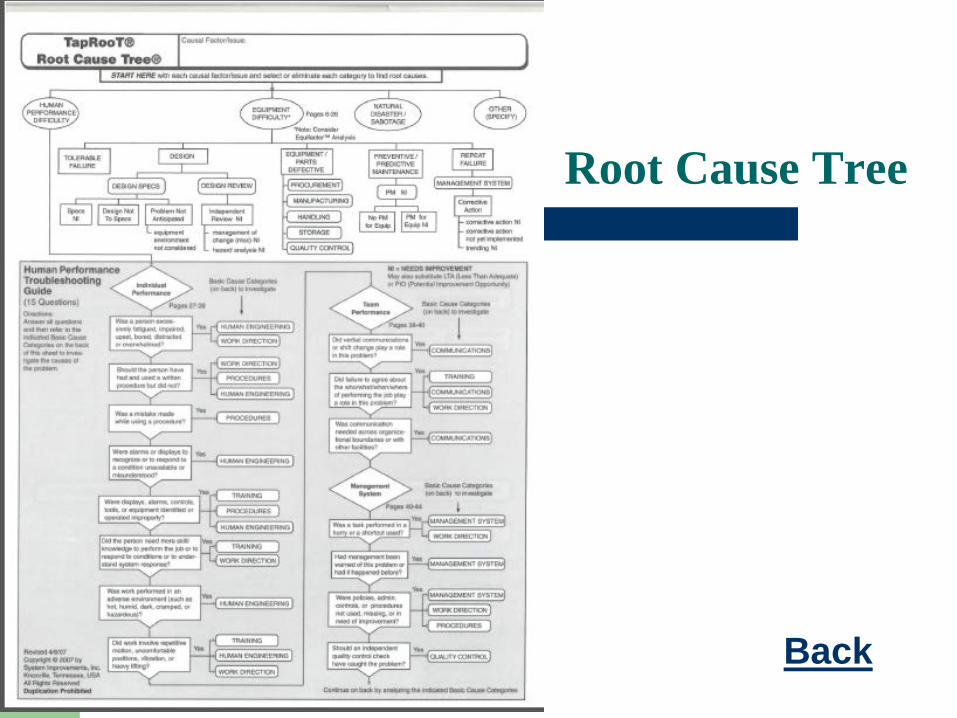
Root Cause Tree
Back

82
Dictionary
Back

83
Corrective Action Helper
Back
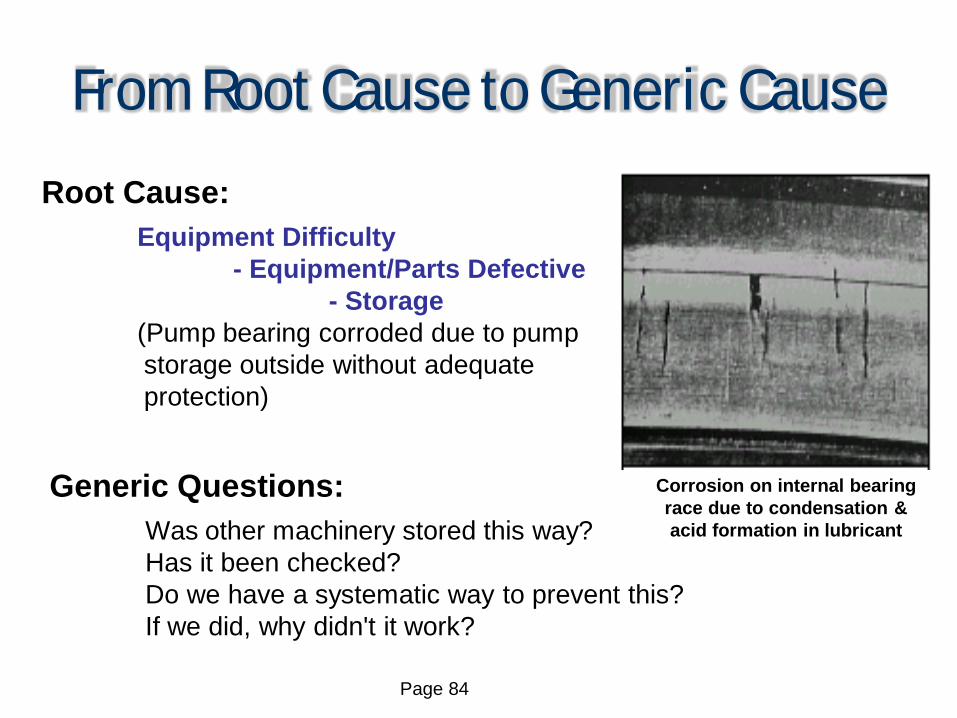
Page 84
Root Cause:
Equipment Difficulty - Equipment/Parts Defective - Storage (Pump bearing corroded due to pump storage outside without adequate protection)
Generic Questions:
Was other machinery stored this way? Has it been checked? Do we have a systematic way to prevent this? If we did, why didn't it work?
Corrosion on internal bearing race due to condensation & acid formation in lubricant
From Root Cause to Generic Cause
Page 85
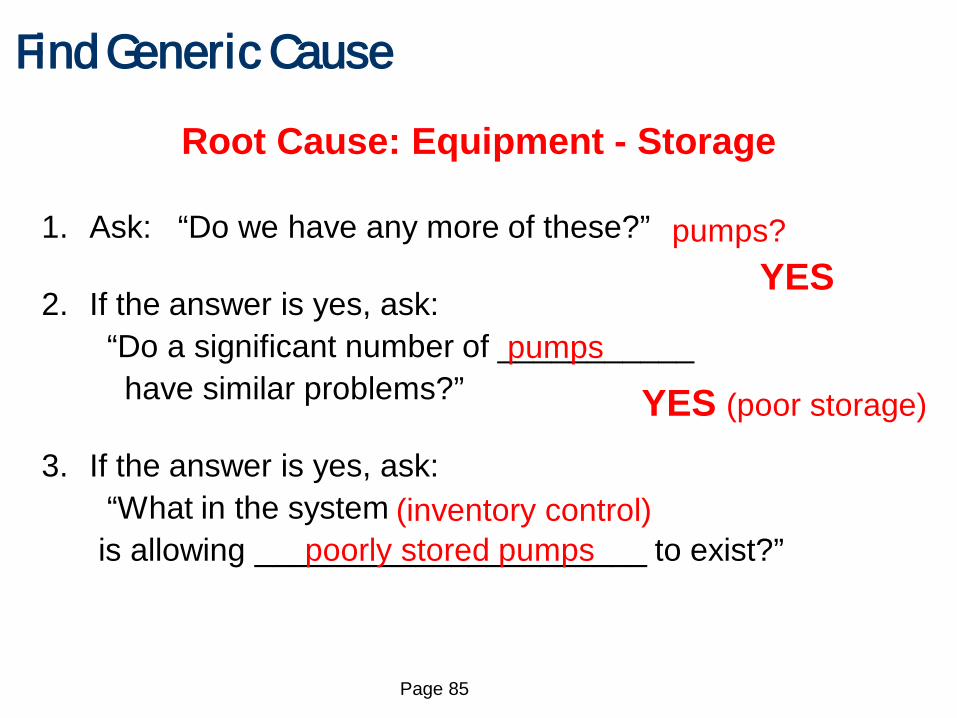
Find Generic Cause
1. Ask: “Do we have any more of these?” 2. If the answer is yes, ask: “Do a significant number of ___________ have similar problems?” 3. If the answer is yes, ask: “What in the system is allowing ______________________ to exist?”
Root Cause: Equipment - Storage
pumps?
pumps
YES (poor storage)
poorly stored pumps
YES
(inventory control)
Page 86
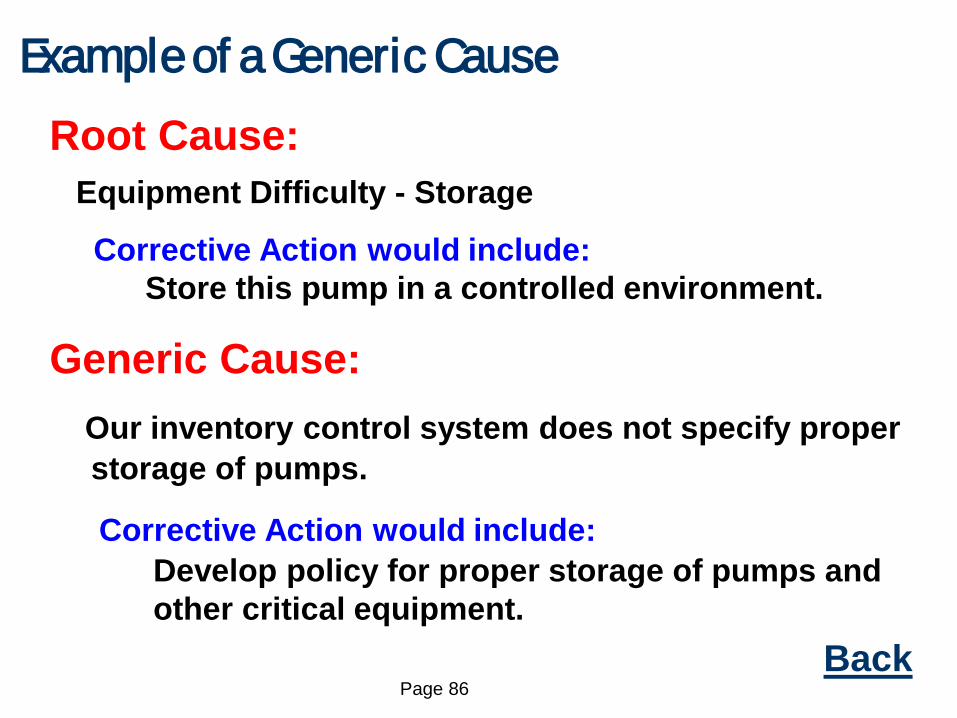
Example of a Generic Cause Root Cause:
Equipment Difficulty - Storage
Corrective Action would include: Store this pump in a controlled environment.
Generic Cause:
Our inventory control system does not specify proper storage of pumps.
Corrective Action would include: Develop policy for proper storage of pumps and other critical equipment.
Back
Page 87
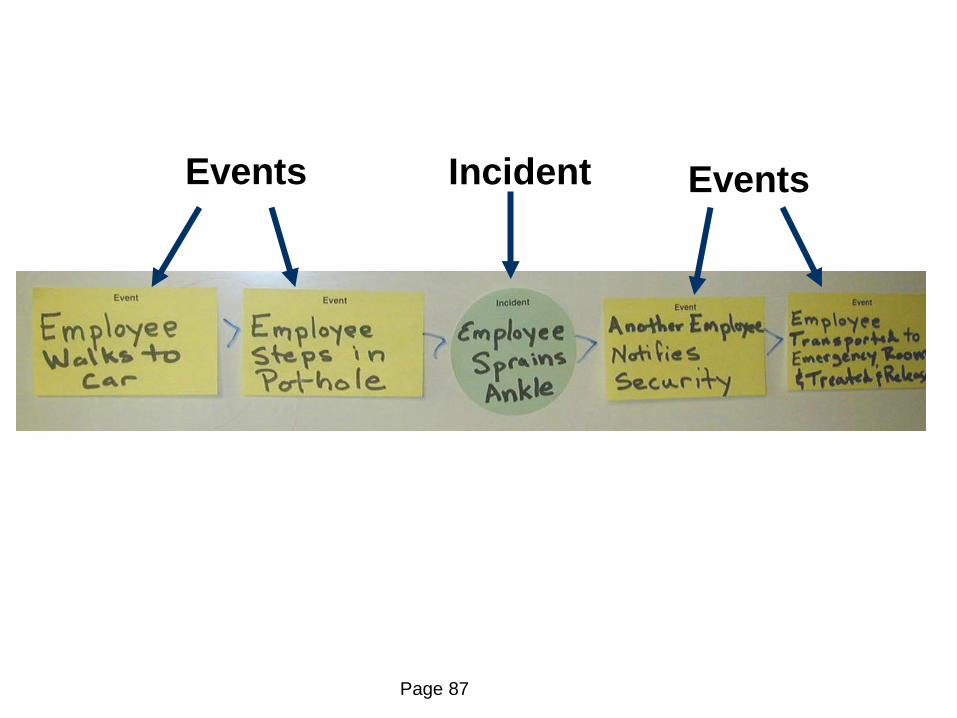
Incident Events Events
Page 88
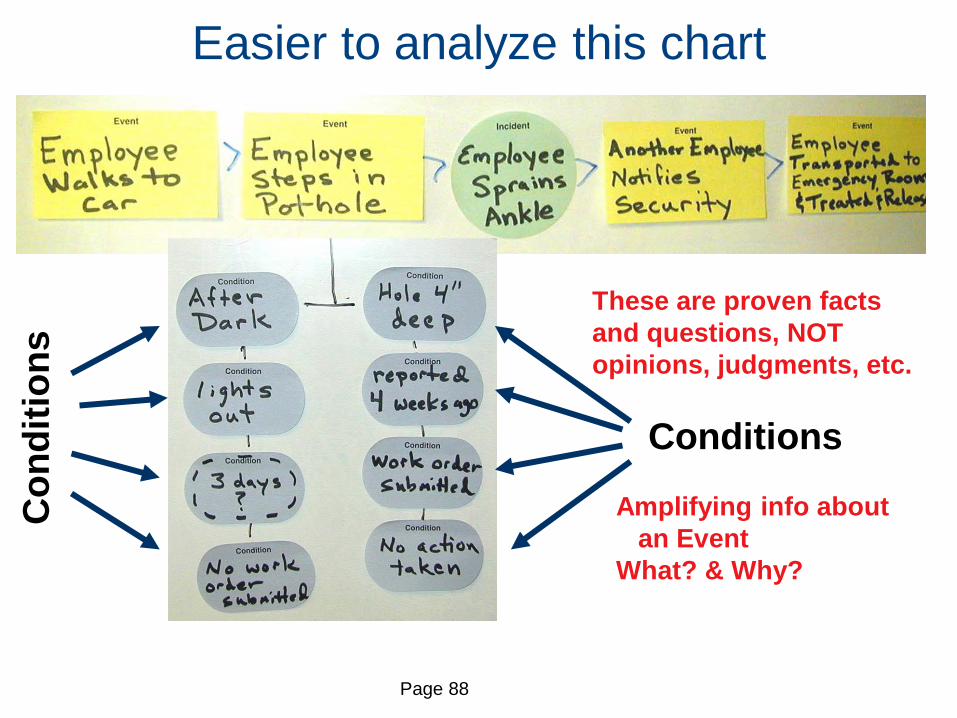
Conditions
Con
ditio
ns
Amplifying info about an Event What? & Why?
Easier to analyze this chart
These are proven facts and questions, NOT opinions, judgments, etc.
Than a written report
Page 89
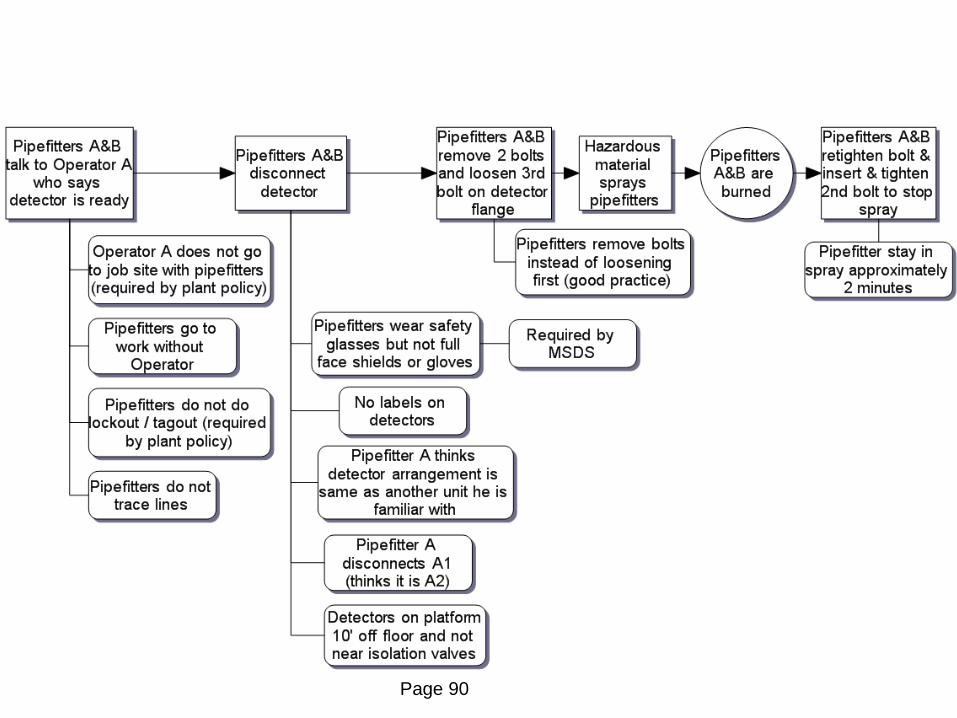
Easier to Analyze Chart
Page 90
91
3. Software
Software – To speed up the process – To document completed cases. – To use for trending purposes.
Certification Program
Specific to Equipment Reliability Application.
Objective of Certification Program
To provide the Company with a sufficient number of qualified RCA practitioners who can successful complete RCA projects relating to plant equipment reliability.
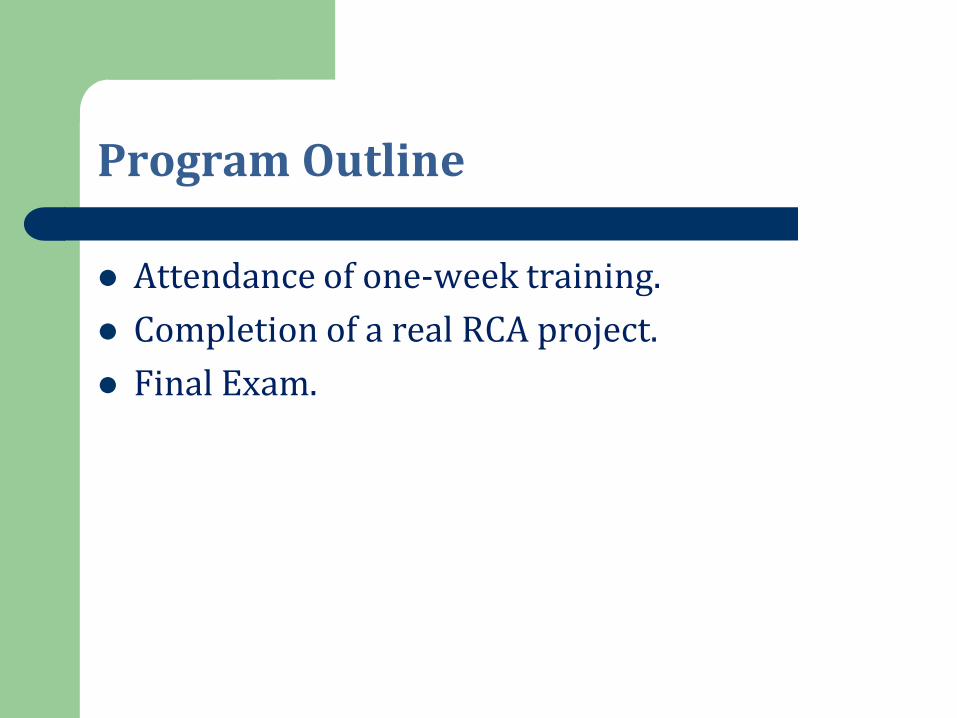
Program Outline
Attendance of one-week training. Completion of a real RCA project. Final Exam.
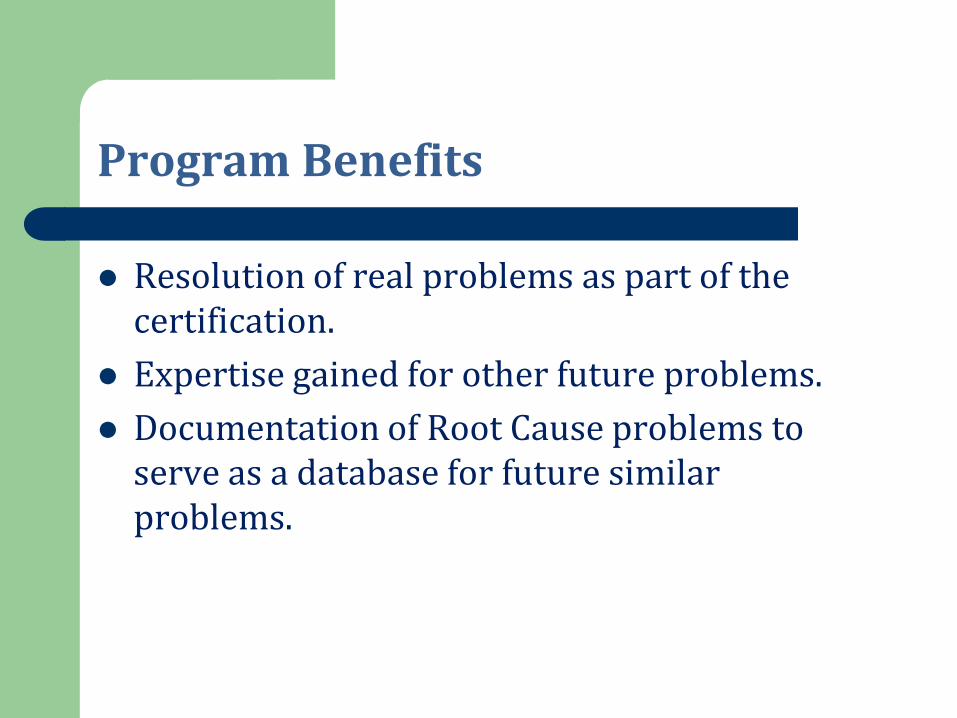
Program Benefits
Resolution of real problems as part of the certification.
Expertise gained for other future problems. Documentation of Root Cause problems to
serve as a database for future similar problems.
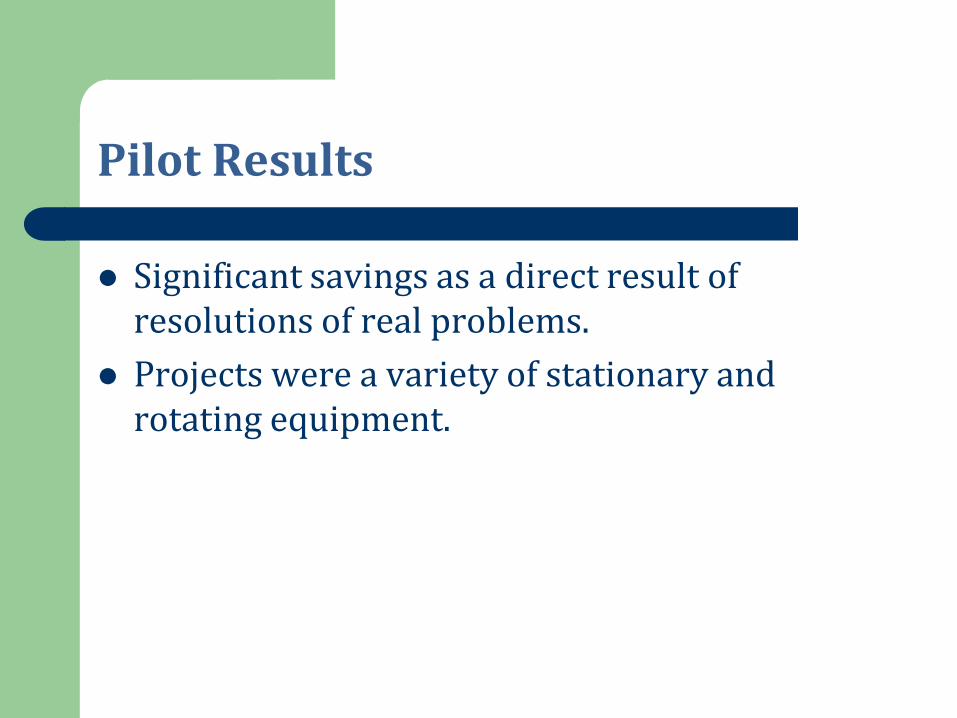
Pilot Results
Significant savings as a direct result of resolutions of real problems.
Projects were a variety of stationary and rotating equipment.
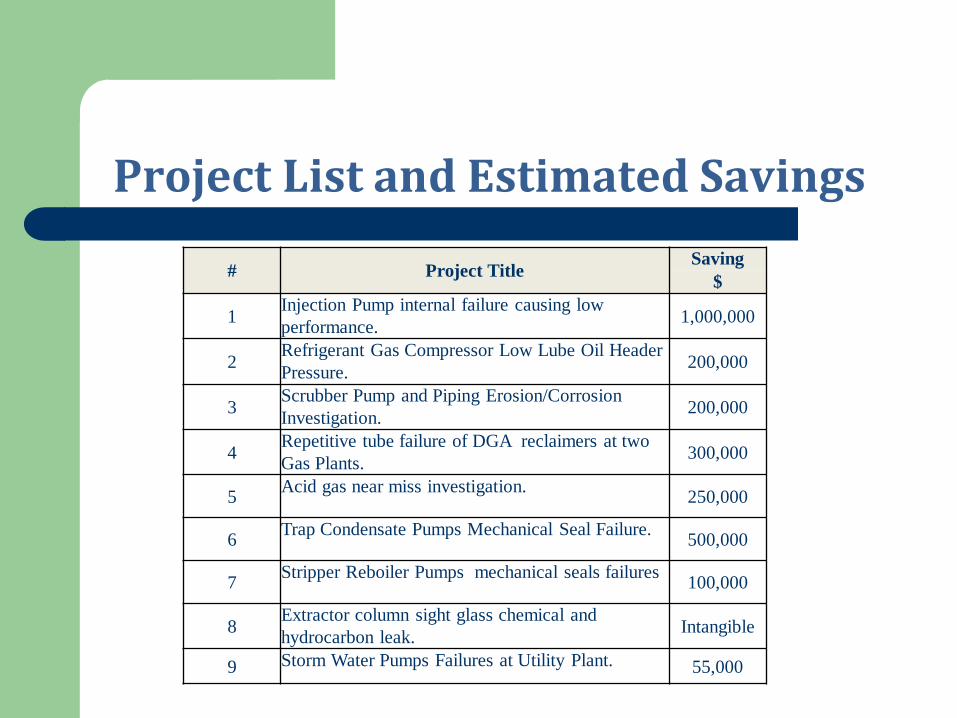
# Project Title Saving $
1 Injection Pump internal failure causing low performance. 1,000,000
2 Refrigerant Gas Compressor Low Lube Oil Header Pressure. 200,000
3 Scrubber Pump and Piping Erosion/Corrosion Investigation. 200,000
4 Repetitive tube failure of DGA reclaimers at two Gas Plants. 300,000
5 Acid gas near miss investigation. 250,000
6 Trap Condensate Pumps Mechanical Seal Failure. 500,000
7 Stripper Reboiler Pumps mechanical seals failures 100,000
8 Extractor column sight glass chemical and hydrocarbon leak. Intangible
9 Storm Water Pumps Failures at Utility Plant. 55,000
Project List and Estimated Savings
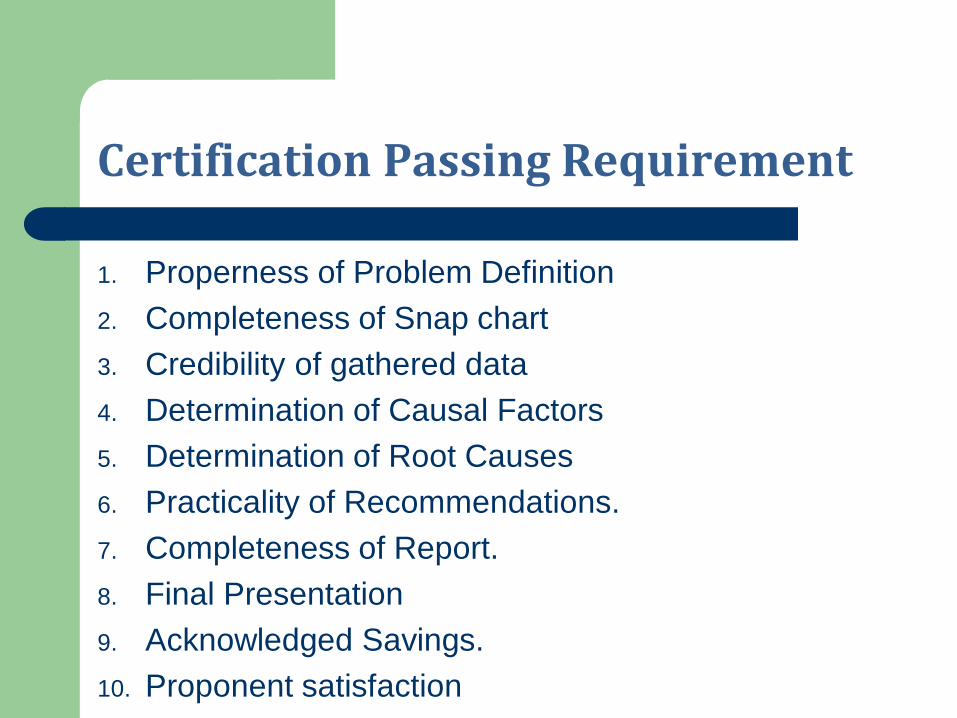
Certification Passing Requirement
1. Properness of Problem Definition 2. Completeness of Snap chart 3. Credibility of gathered data 4. Determination of Causal Factors 5. Determination of Root Causes 6. Practicality of Recommendations. 7. Completeness of Report. 8. Final Presentation 9. Acknowledged Savings. 10. Proponent satisfaction

Lessons Learned
A significant gap to be bridged between attending a course and the application of knowledge learned during that course.
Close mentorship and group discussions are invaluable toward mastering the know-how especially for first timers.
It makes a big difference in participant attitude and momentum when the work is toward a certification or a degree.
100
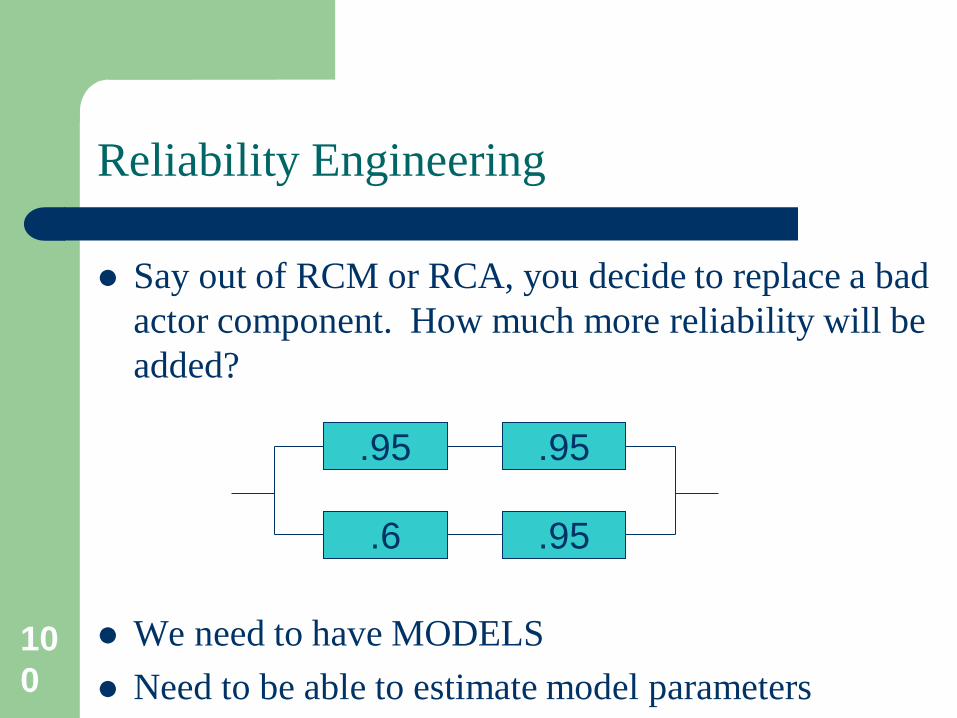
Reliability Engineering
Say out of RCM or RCA, you decide to replace a bad actor component. How much more reliability will be added?
We need to have MODELS Need to be able to estimate model parameters
.95 .95
.6 .95
101
Engineering Reliability Approach
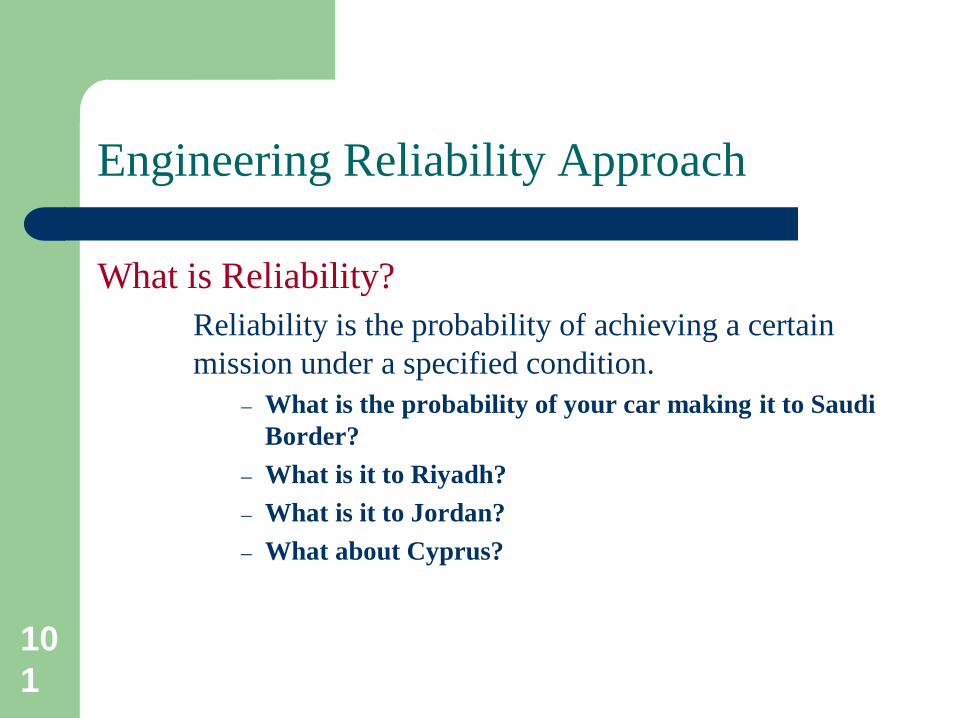
What is Reliability? Reliability is the probability of achieving a certain mission under a specified condition.
– What is the probability of your car making it to Saudi Border?
– What is it to Riyadh? – What is it to Jordan? – What about Cyprus?
102
Reliability
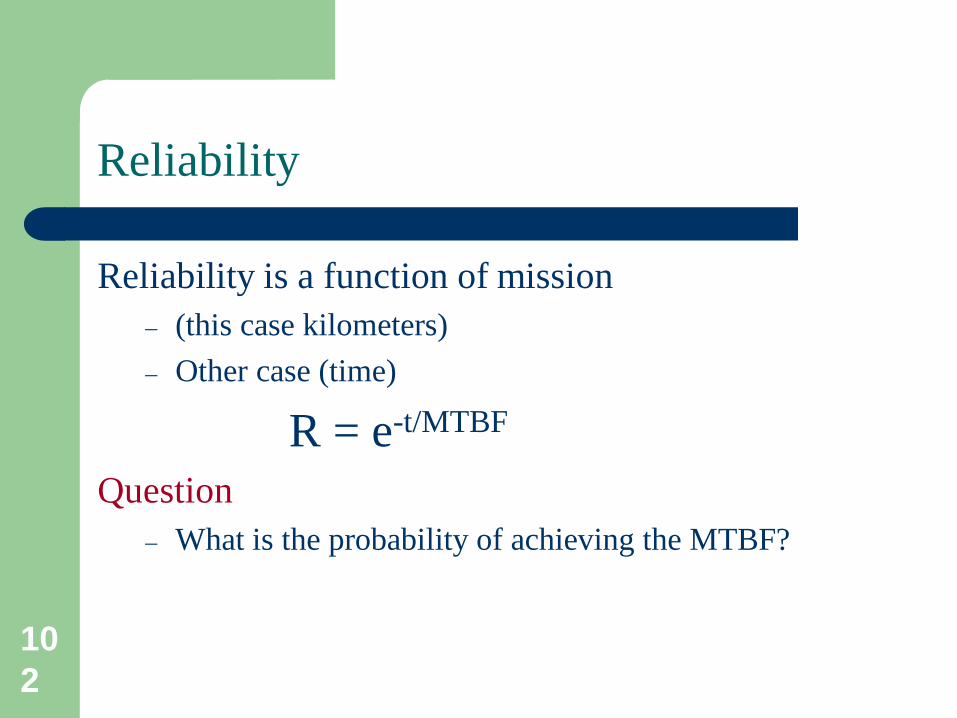
Reliability is a function of mission – (this case kilometers) – Other case (time)
R = e-t/MTBF Question
– What is the probability of achieving the MTBF?
103
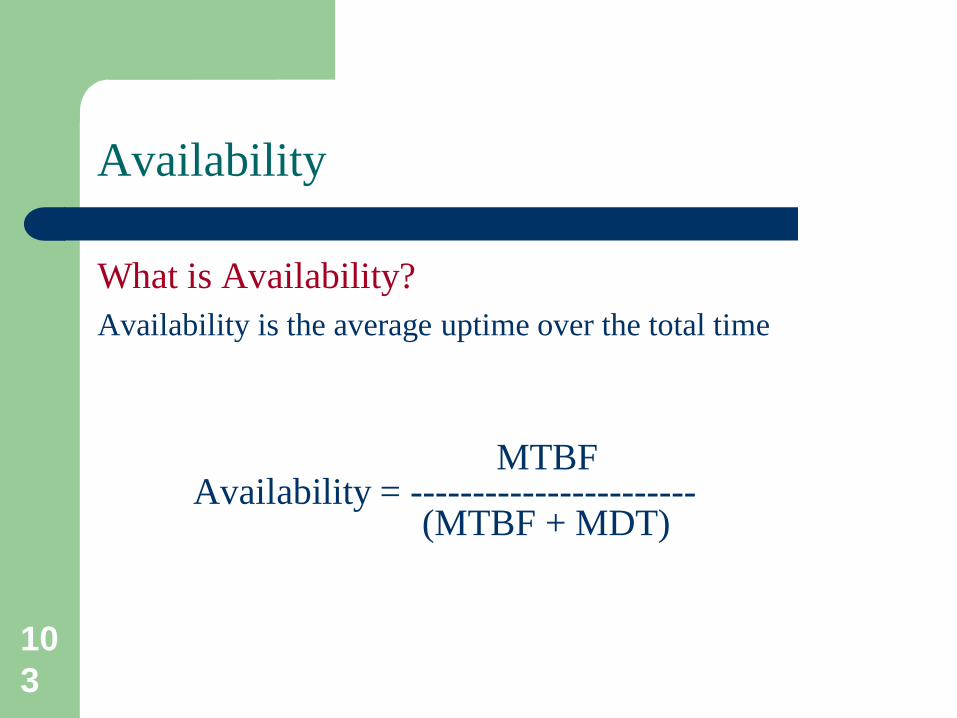
Availability
What is Availability? Availability is the average uptime over the total time MTBF Availability = ----------------------- (MTBF + MDT)
104
MTBF & MDT
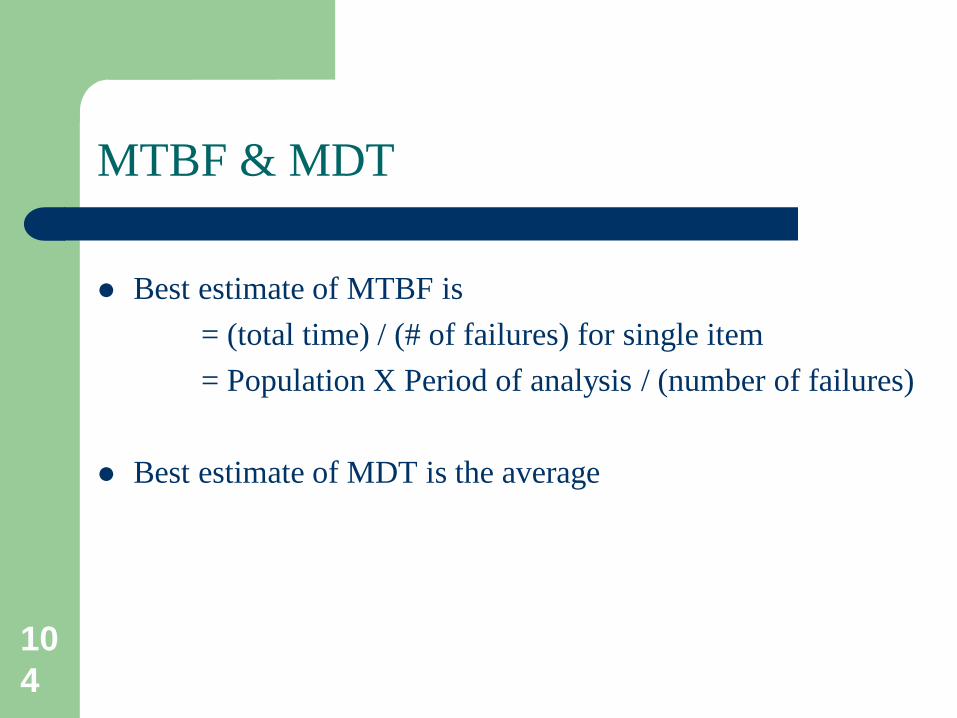
Best estimate of MTBF is = (total time) / (# of failures) for single item = Population X Period of analysis / (number of failures)
Best estimate of MDT is the average
105
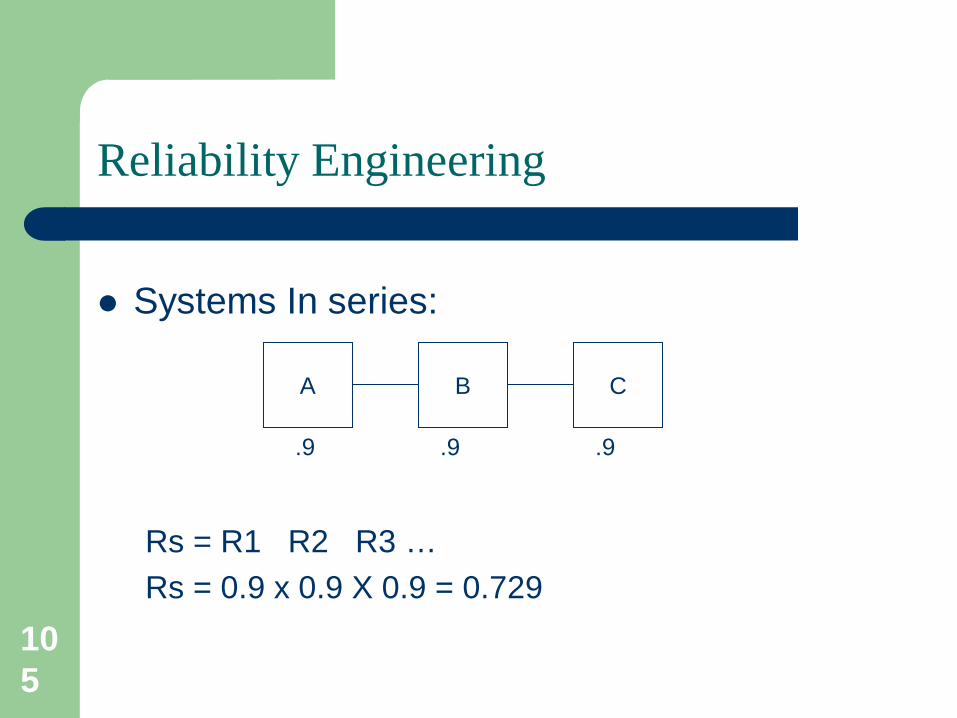
Systems In series: Rs = R1 R2 R3 … Rs = 0.9 x 0.9 X 0.9 = 0.729
Reliability Engineering
A B C
.9 .9 .9
106
Reliability Engineering
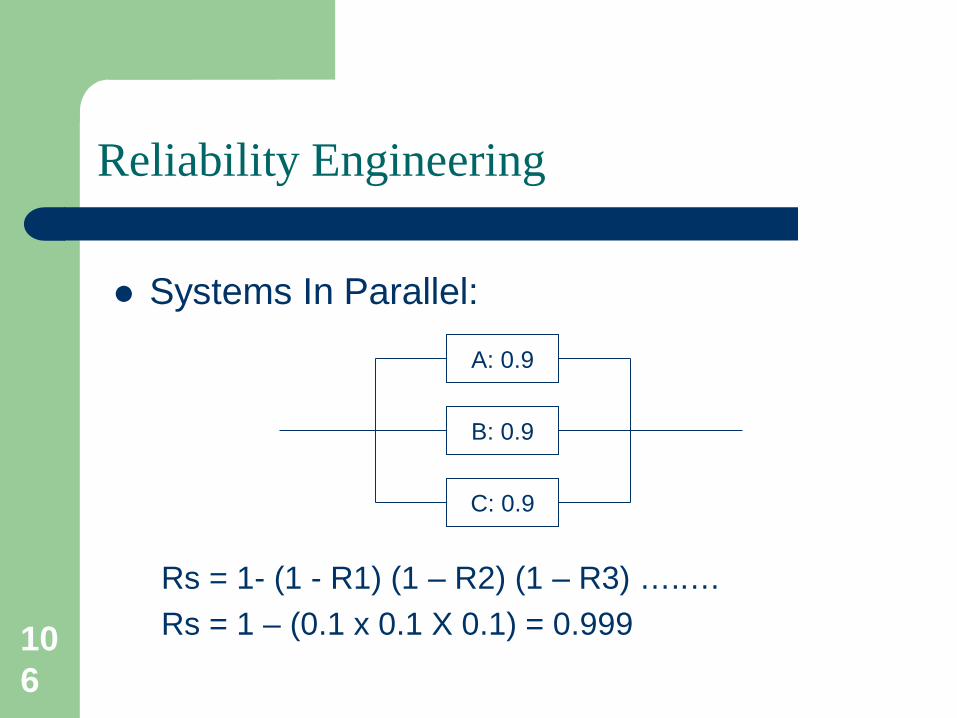
Systems In Parallel: Rs = 1- (1 - R1) (1 – R2) (1 – R3) …..… Rs = 1 – (0.1 x 0.1 X 0.1) = 0.999
B: 0.9
A: 0.9
C: 0.9
107
.95 .95
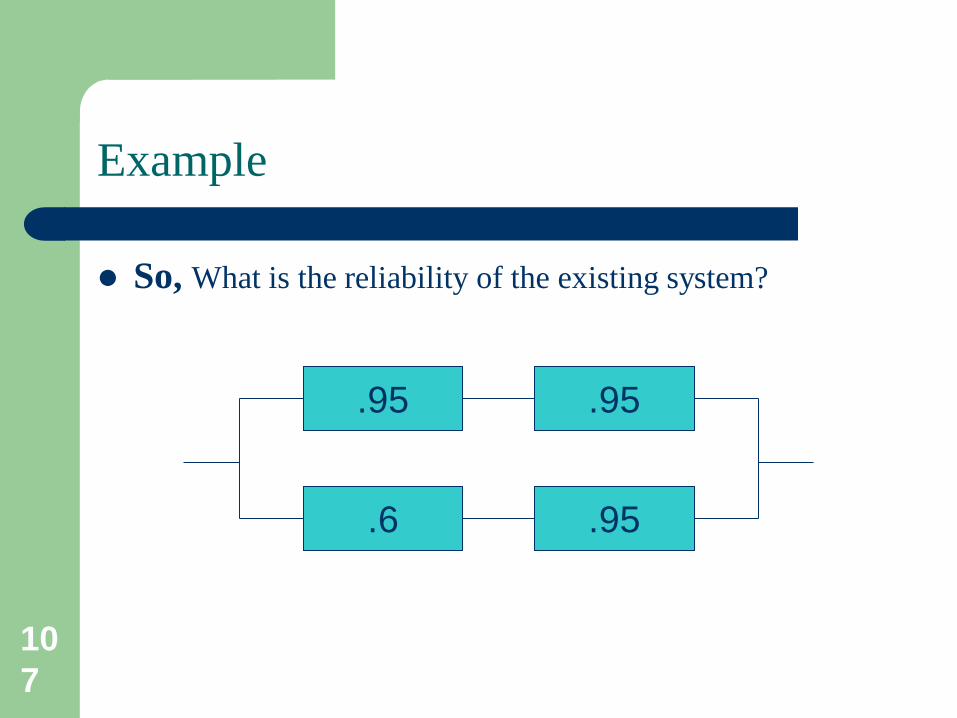
.6 .95
Example
So, What is the reliability of the existing system?
108
Reliability Engineering Example
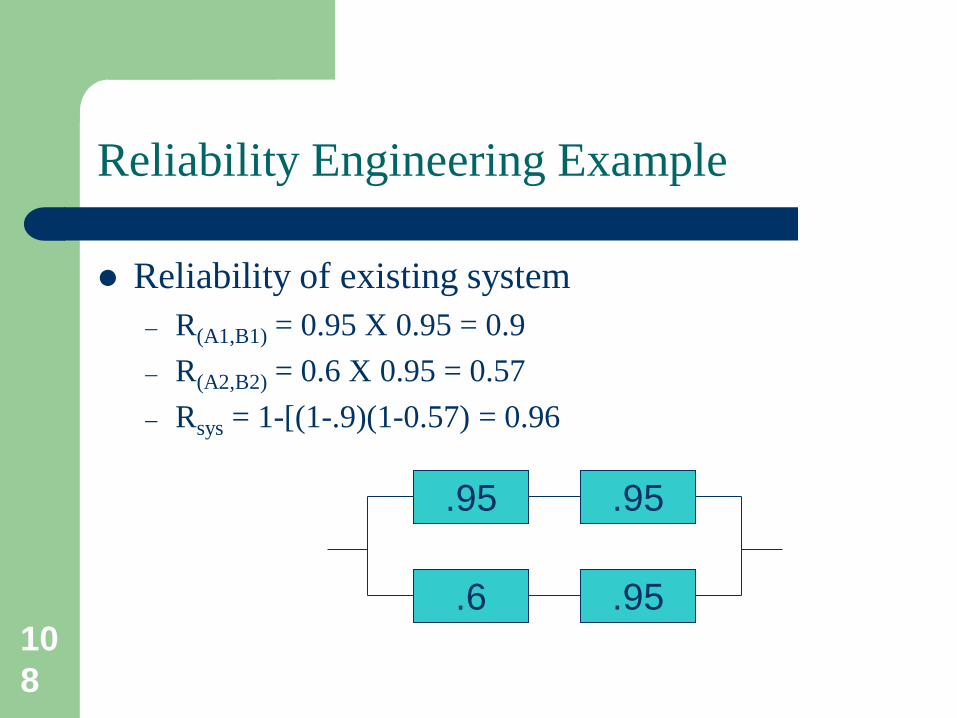
Reliability of existing system – R(A1,B1) = 0.95 X 0.95 = 0.9 – R(A2,B2) = 0.6 X 0.95 = 0.57 – Rsys = 1-[(1-.9)(1-0.57) = 0.96
.95 .95
.6 .95
109
Reliability Engineering Example
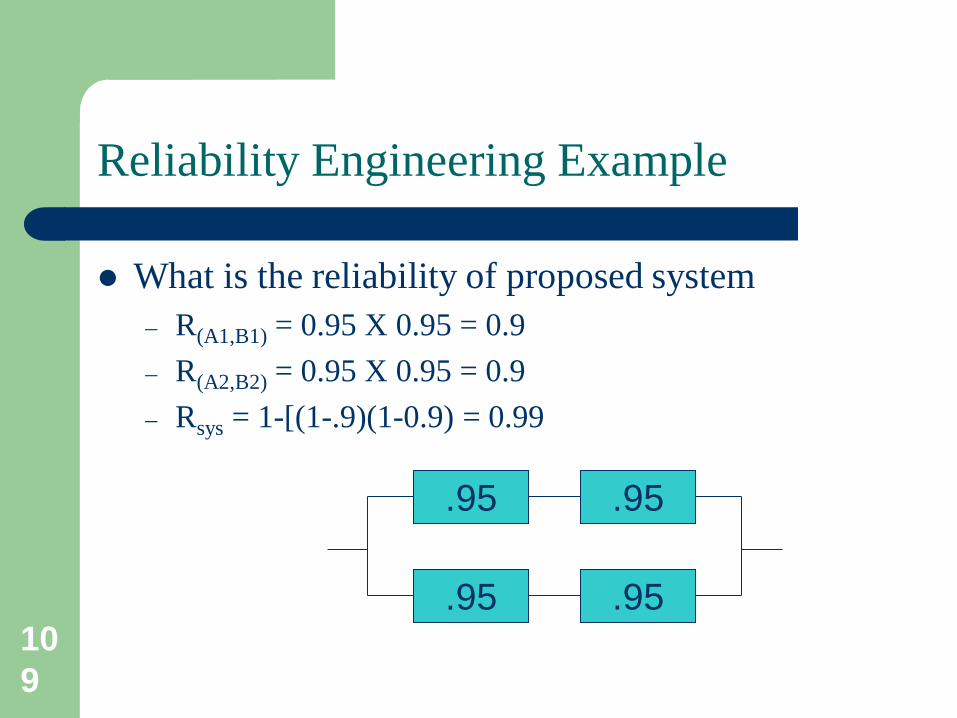
What is the reliability of proposed system – R(A1,B1) = 0.95 X 0.95 = 0.9 – R(A2,B2) = 0.95 X 0.95 = 0.9 – Rsys = 1-[(1-.9)(1-0.9) = 0.99
.95 .95
.95 .95
110
Example
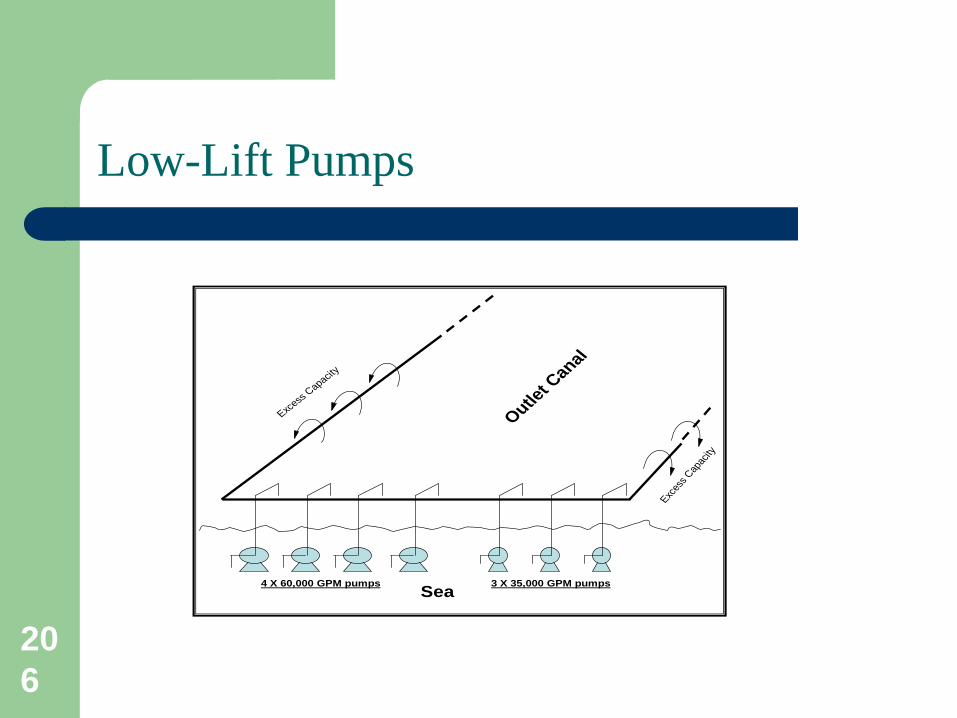
Example – Seven low left pumps running in parallel are used to
pump sea water to inlet canal – Water in inlet canal is picked up by high lift pumps to
provide cooling for whole plant – Four have a flow rate of 35,000 GPM – Three are rated at 60,000 GPM.

111
Sea
Outlet C
anal
4 X 60,000 GPM pumps 3 X 35,000 GPM pumps
Excess
Capacity
Exces
s Cap
acity
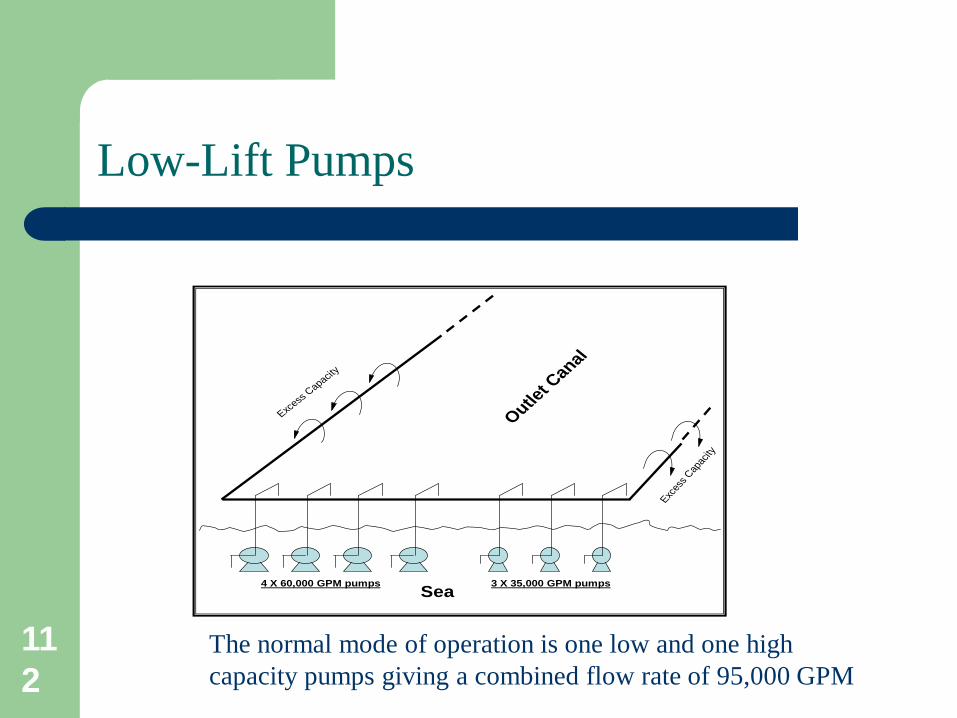
Low-Lift Pumps
Two or three pumps are normally needed depending on the capacities of the available pumps.
112
Sea
Outlet C
anal
4 X 60,000 GPM pumps 3 X 35,000 GPM pumps
Excess
Capacity
Exces
s Cap
acity
Low-Lift Pumps
The normal mode of operation is one low and one high capacity pumps giving a combined flow rate of 95,000 GPM
113
Sea
Outlet C
anal
4 X 60,000 GPM pumps 3 X 35,000 GPM pumps
Excess
Capacity
Exces
s Cap
acity
Low-Lift Pumps
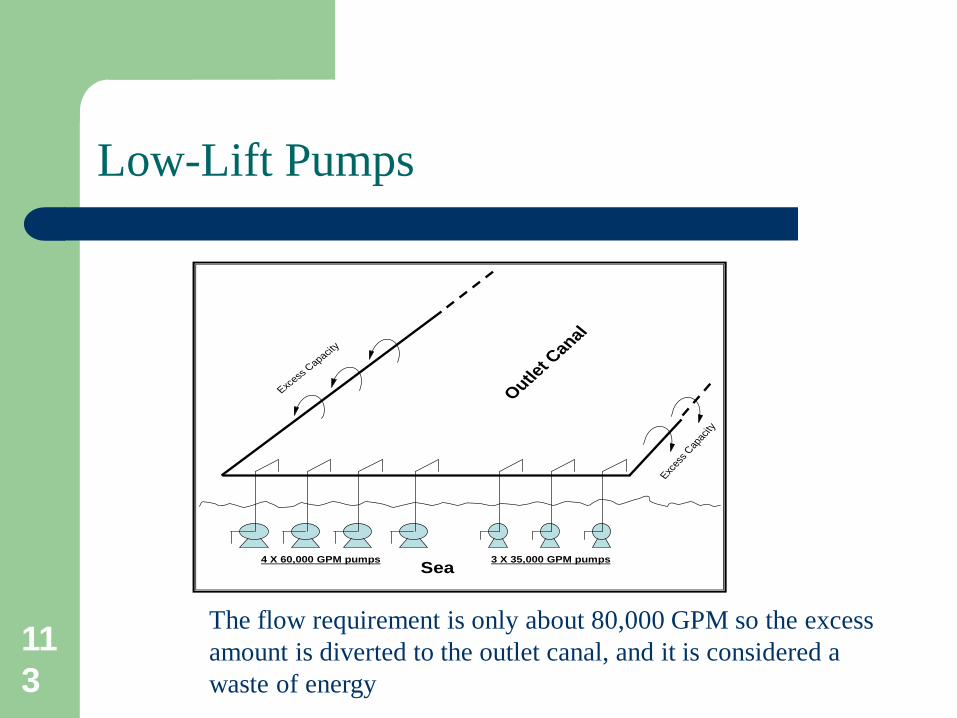
The flow requirement is only about 80,000 GPM so the excess amount is diverted to the outlet canal, and it is considered a waste of energy

114
Sea
Outlet C
anal
4 X 60,000 GPM pumps 3 X 35,000 GPM pumps
Excess
Capacity
Exces
s Cap
acity
Low-Lift Pumps
Two or three pumps are normally needed depending on the capacities of the available pumps.
115
Reliability Engineering
Background – The pumps are very old with some being over 50 years
of age. – Time spent to repair has been very long due to major
component failures and waiting for custom-made spare parts.
– All of this raised concerns about their future capability to sustain the required level of availability.
116
Reliability Engineering
Data Gathering And Analysis – Six-year worth of failure data history was collected
from the Company computerized maintenance management system (CMMS).
– They all averaged about five-year MTBF and one-year MDT.
– The current MTBF value of five years was considered acceptable.
– The MDT of one year was, however, considered to be on the high side.

117
Reliability Engineering
Alternative – As per Company design practice, the replacement
alternative, if found necessary, is three 50% pumps
118
Reliability Engineering
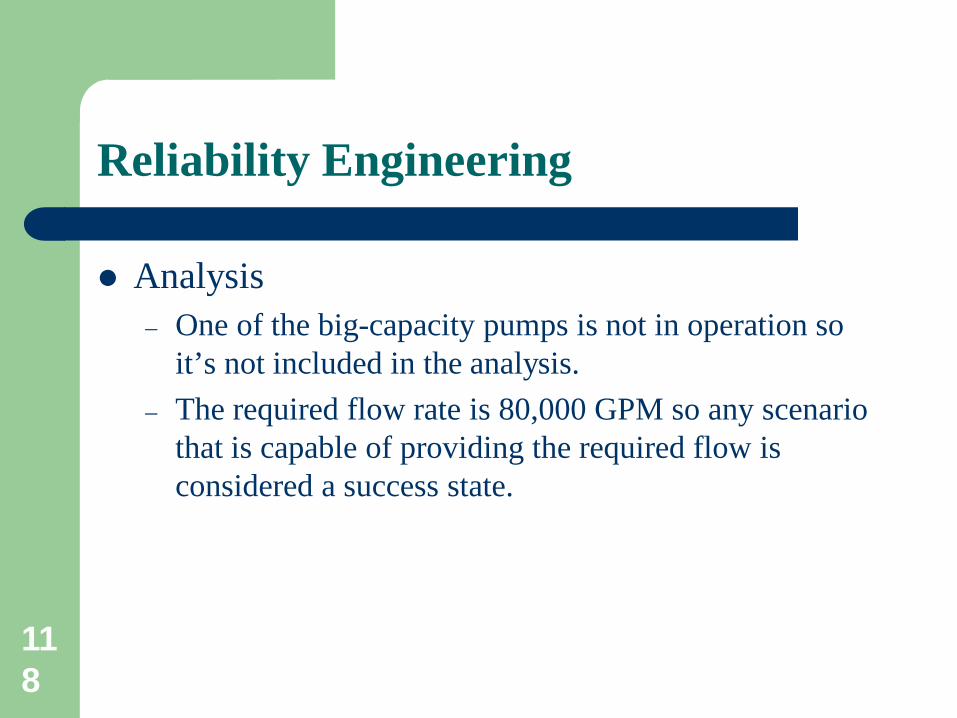
Analysis – One of the big-capacity pumps is not in operation so
it’s not included in the analysis. – The required flow rate is 80,000 GPM so any scenario
that is capable of providing the required flow is considered a success state.
119
Reliability Engineering
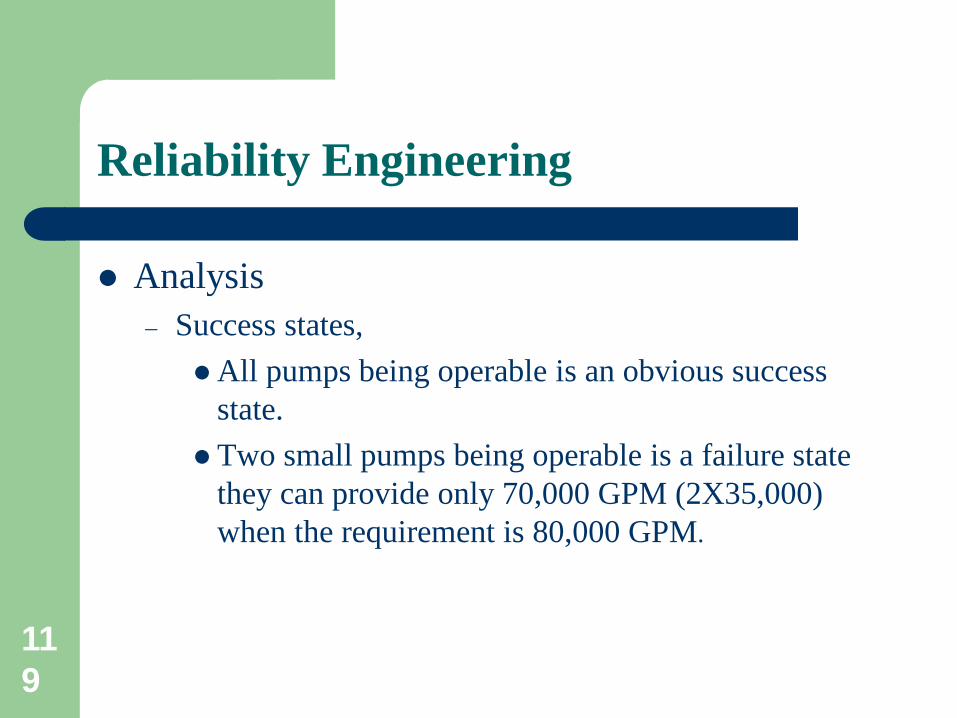
Analysis – Success states,
All pumps being operable is an obvious success state.
Two small pumps being operable is a failure state they can provide only 70,000 GPM (2X35,000) when the requirement is 80,000 GPM.
120
Reliability Engineering
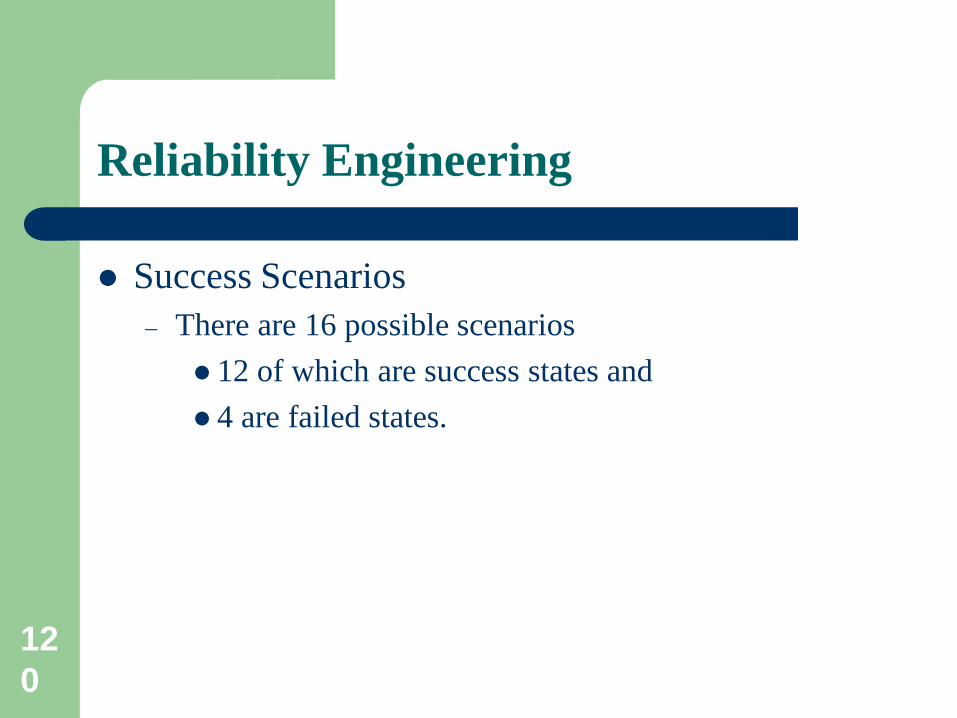
Success Scenarios – There are 16 possible scenarios
12 of which are success states and 4 are failed states.
121
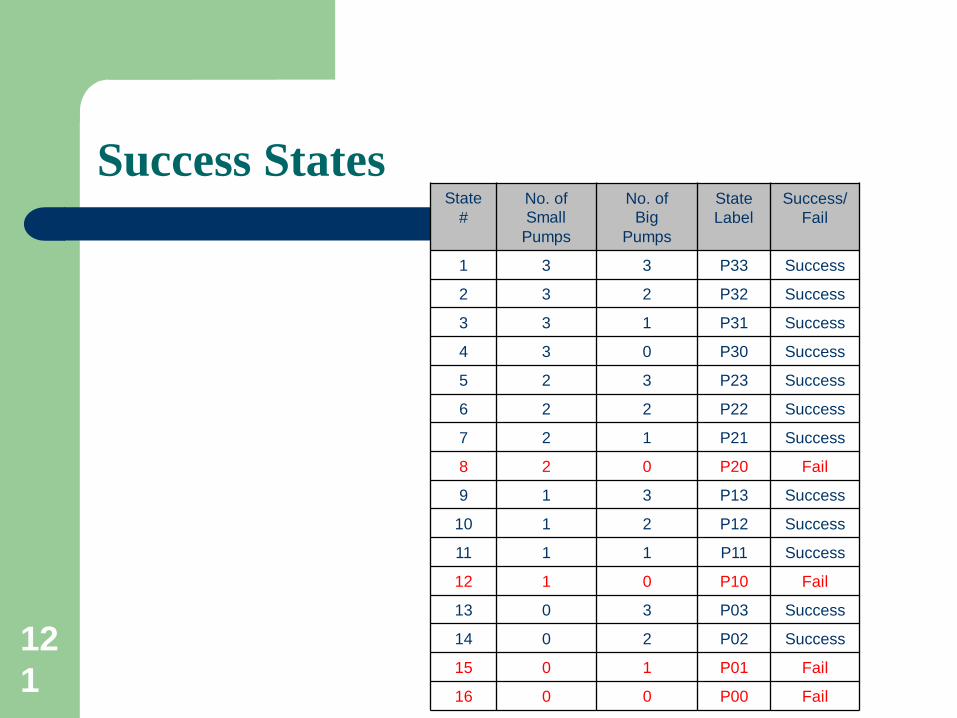
State #
No. of Small
Pumps
No. of Big
Pumps
State Label
Success/Fail
1 3 3 P33 Success
2 3 2 P32 Success
3 3 1 P31 Success
4 3 0 P30 Success
5 2 3 P23 Success
6 2 2 P22 Success
7 2 1 P21 Success
8 2 0 P20 Fail
9 1 3 P13 Success
10 1 2 P12 Success
11 1 1 P11 Success
12 1 0 P10 Fail
13 0 3 P03 Success
14 0 2 P02 Success
15 0 1 P01 Fail
16 0 0 P00 Fail
Success States
122
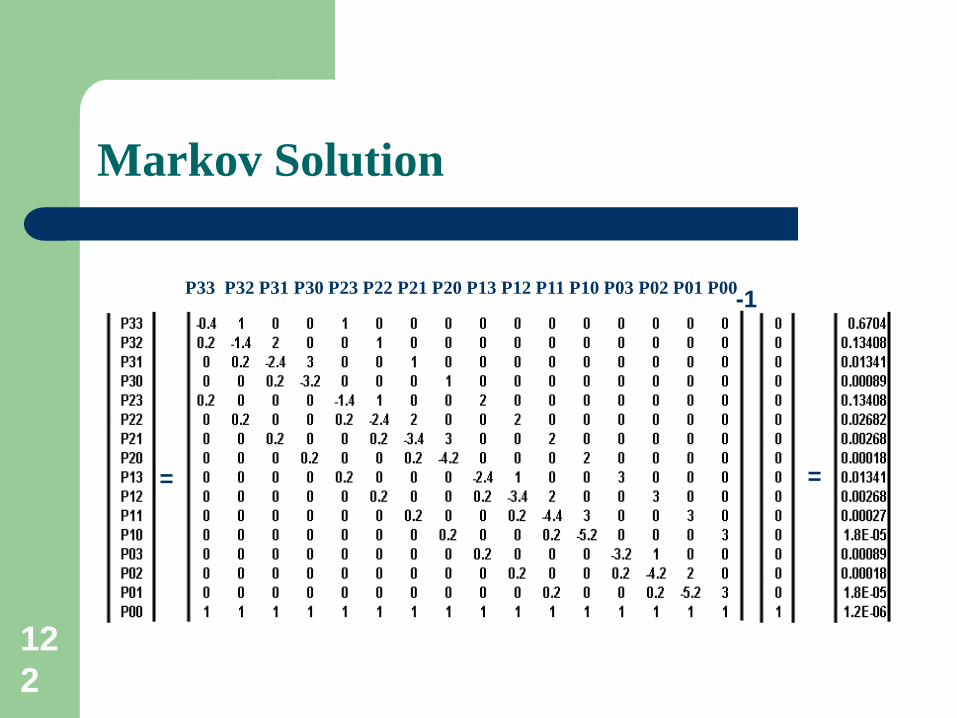
= =
-1
Markov Solution
P33 P32 P31 P30 P23 P22 P21 P20 P13 P12 P11 P10 P03 P02 P01 P00
123
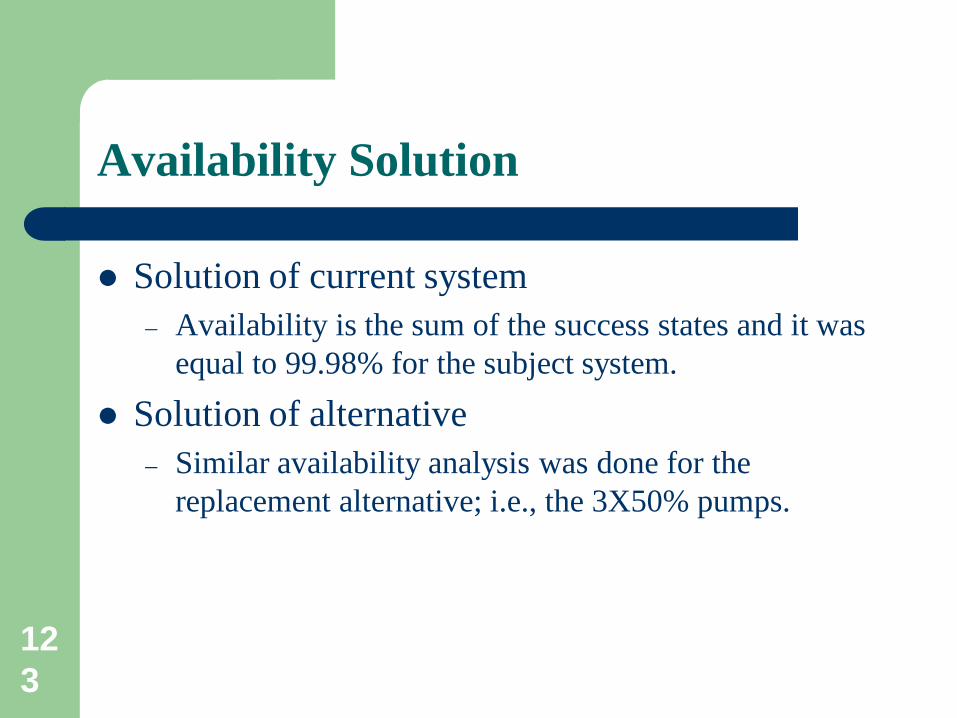
Availability Solution
Solution of current system – Availability is the sum of the success states and it was
equal to 99.98% for the subject system. Solution of alternative
– Similar availability analysis was done for the replacement alternative; i.e., the 3X50% pumps.
124
Feasibility Assessment
The result was a similar level of availability (99.98%).
It was, therefore, concluded that replacement on the basis of availability was not economically feasible
125
Economic Replacement Analysis
So, Availability is not a feasible basis for replacement What about other factors
– Unnecessary Extra Capacity – Maintaining 3 pumps instead of 7
All this savings need to be assessed against Capital investment. The engineering economic approach is used to evaluate the economic feasibility.

126
Economic Replacement Analysis
Estimated replacement capital investment – This cost was estimated to be $1000,000
Return on investment – Return on investment is realized through savings of:
Unnecessary Extra Capacity Maintaining 3 pumps instead of 7
127
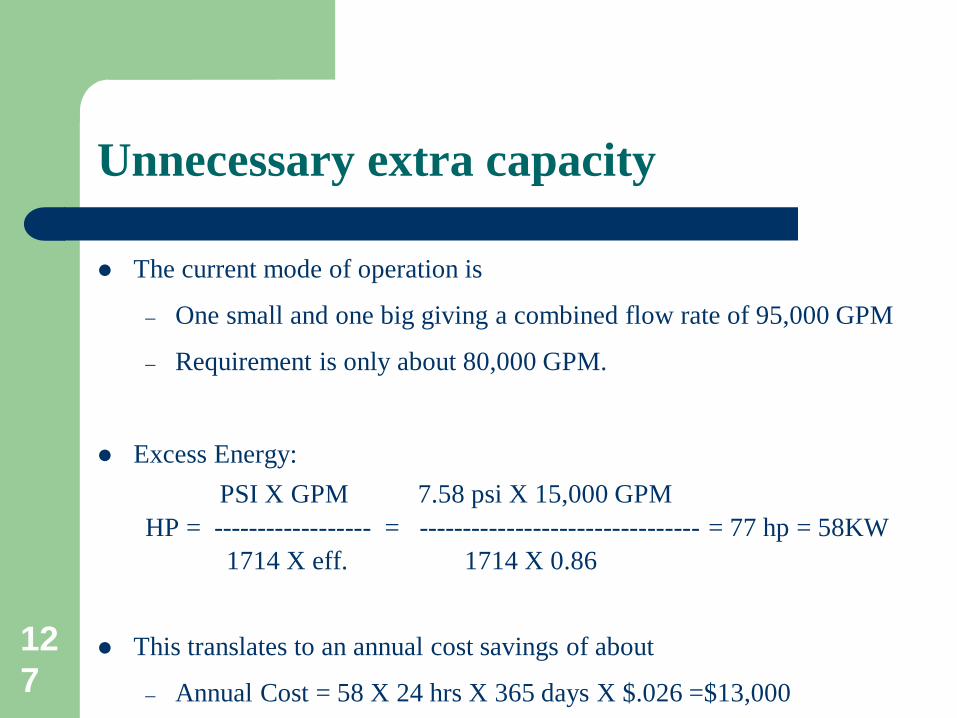
Unnecessary extra capacity
The current mode of operation is
– One small and one big giving a combined flow rate of 95,000 GPM
– Requirement is only about 80,000 GPM.
Excess Energy: PSI X GPM 7.58 psi X 15,000 GPM HP = ------------------ = -------------------------------- = 77 hp = 58KW 1714 X eff. 1714 X 0.86
This translates to an annual cost savings of about
– Annual Cost = 58 X 24 hrs X 365 days X $.026 =$13,000
128
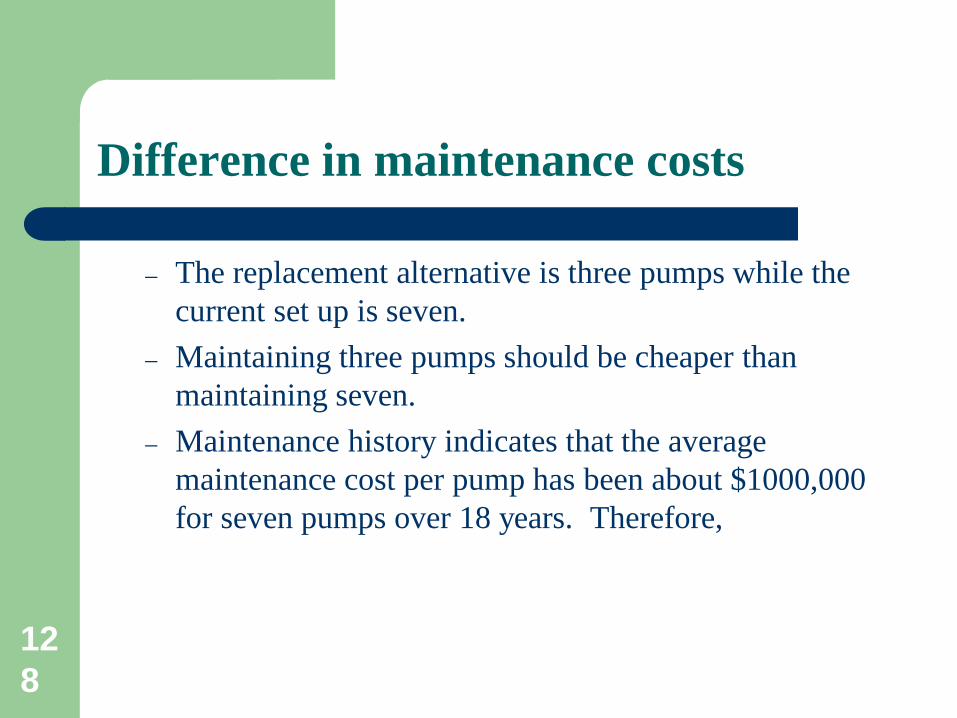
Difference in maintenance costs
– The replacement alternative is three pumps while the current set up is seven.
– Maintaining three pumps should be cheaper than maintaining seven.
– Maintenance history indicates that the average maintenance cost per pump has been about $1000,000 for seven pumps over 18 years. Therefore,

129
Difference in maintenance costs
– Annual maintenance cost = ($1,000,000 ÷ 7 pumps) ÷ 18 years = $8,000/pump
– Alternative is four pumps less, Maintenance savings = 4 X $8,000 = $32,000
– Total return on investment = $13,000 + 32,000 = $45,000
What do you think? Is this attractive?
130
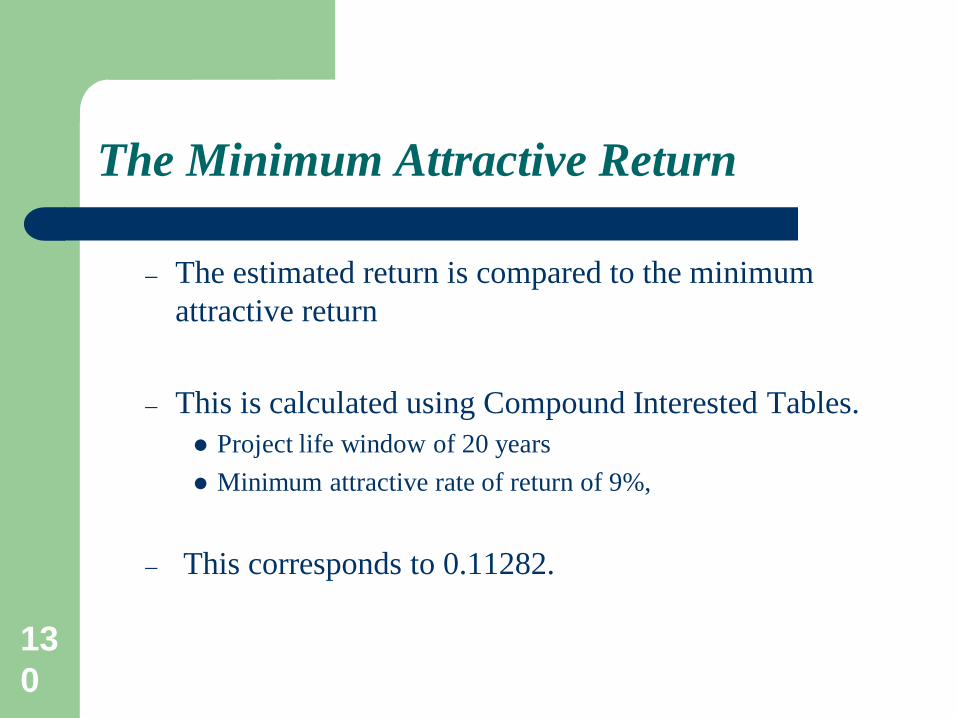
The Minimum Attractive Return
– The estimated return is compared to the minimum attractive return
– This is calculated using Compound Interested Tables.
Project life window of 20 years Minimum attractive rate of return of 9%,
– This corresponds to 0.11282.

131
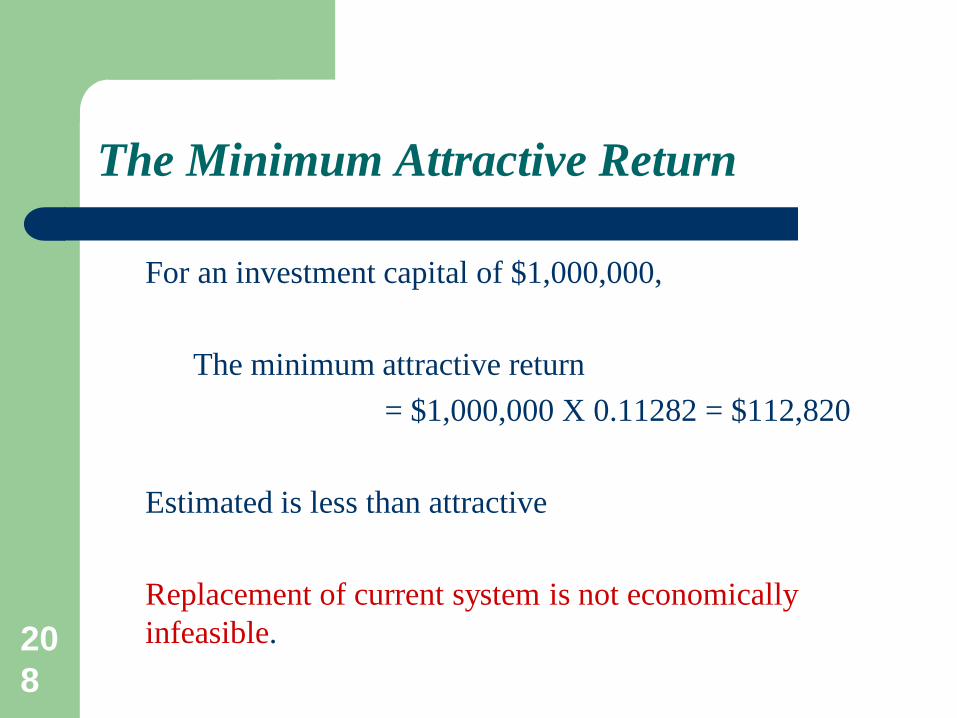
The Minimum Attractive Return
For an investment capital of $1,000,000, The minimum attractive return = $1,000,000 X 0.11282 = $112,820
Estimated is less than attractive Replacement of current system is not economically infeasible.
132
Six Sigma as Framework
133
Six Sigma as Framework
We reviewed a number of reliability improvement approaches (What are they?): – Reliability Centered Maintenance – Root Cause Analysis – Reliability Engineering
If you had a mechanical seal, which one would you chose?
134
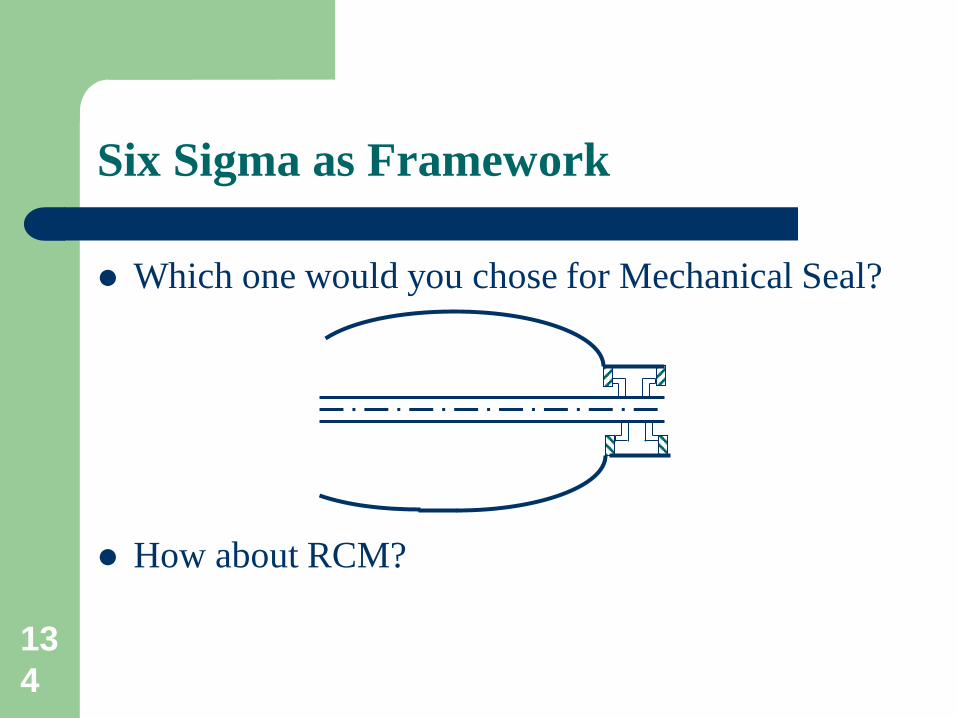
Six Sigma as Framework
Which one would you chose for Mechanical Seal?
How about RCM?
135
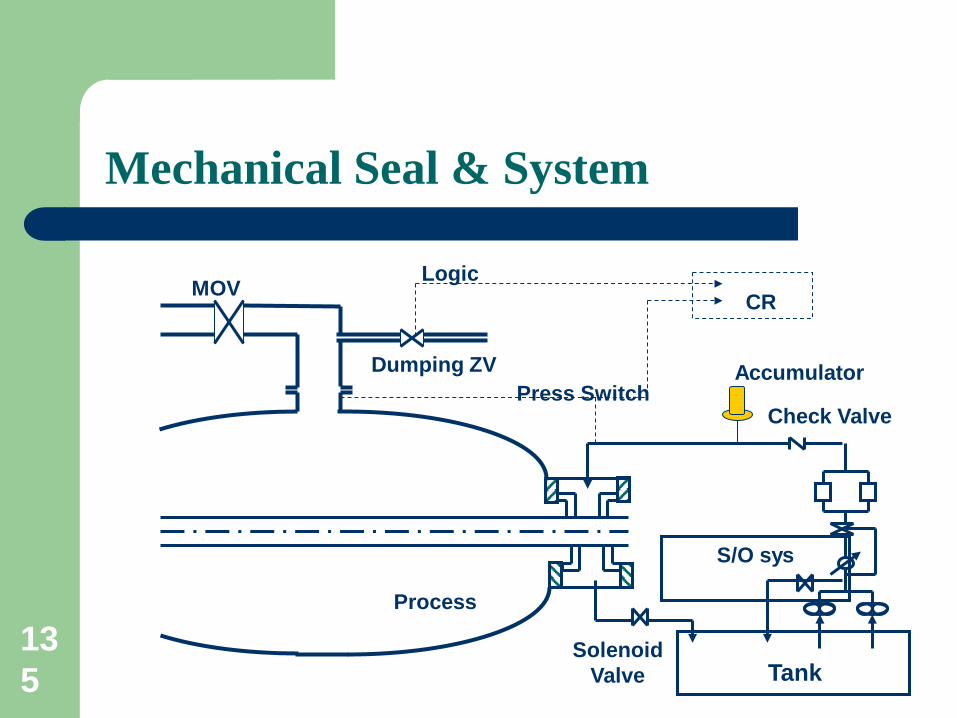
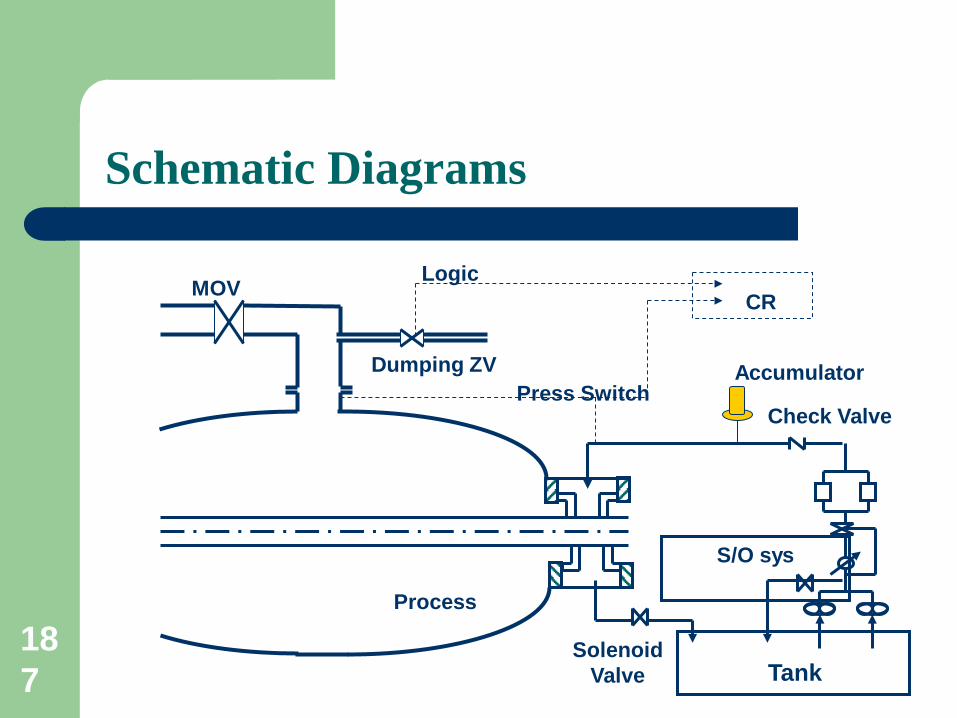
MOV
Press Switch Dumping ZV
Logic
Check Valve
CR
Accumulator
Process
Solenoid Valve Tank
S/O sys
Mechanical Seal & System
136
Six Sigma as Framework
What about RCA?
137
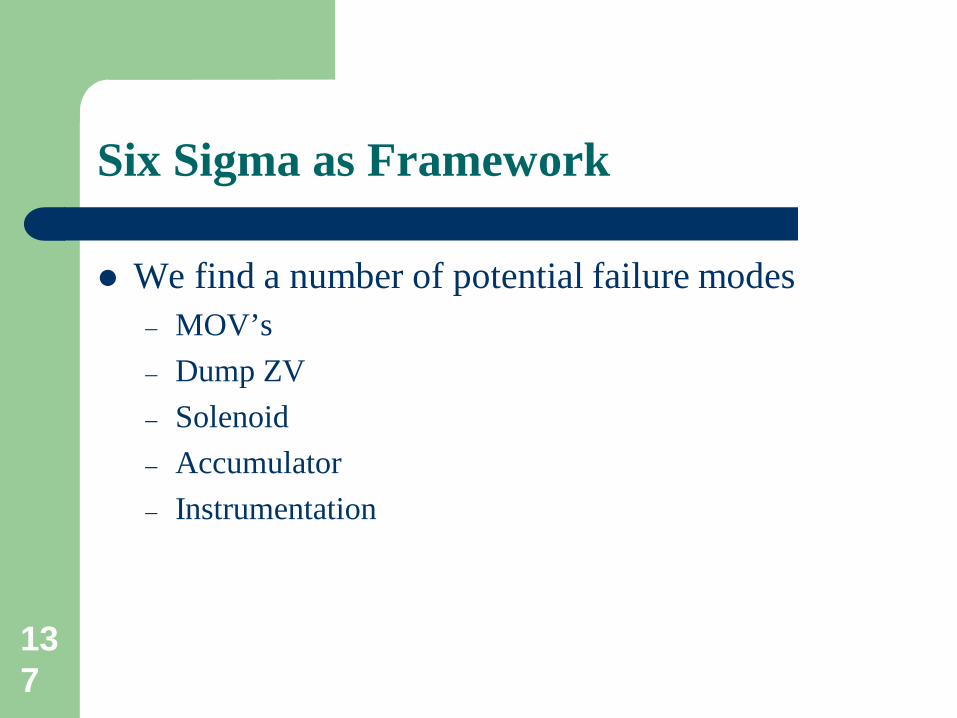
Six Sigma as Framework
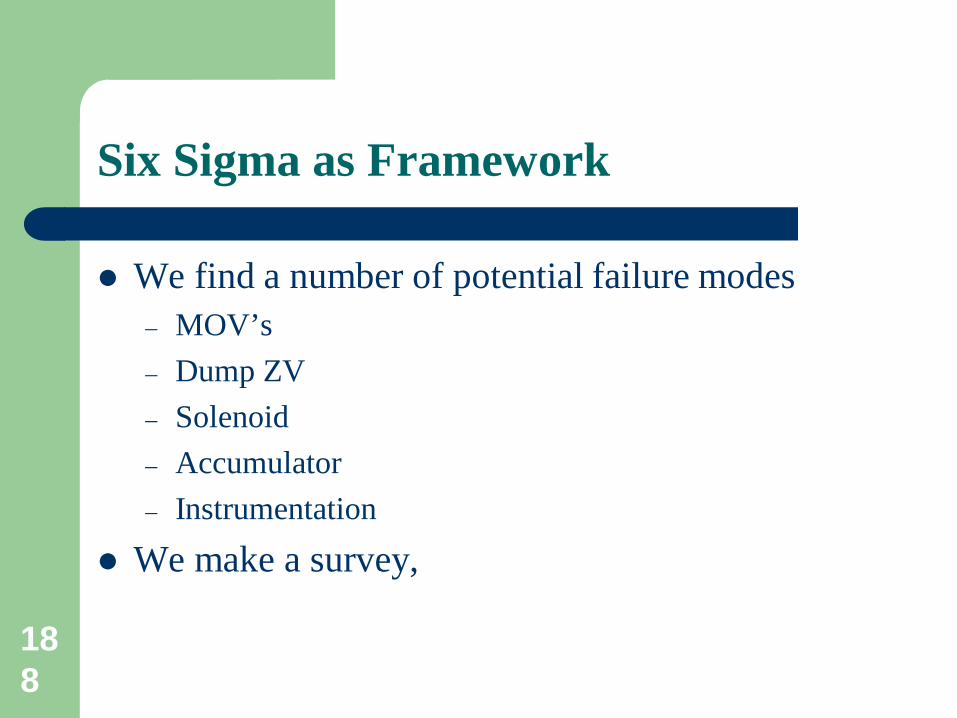
We find a number of potential failure modes – MOV’s – Dump ZV – Solenoid – Accumulator – Instrumentation
138
Six Sigma as Framework
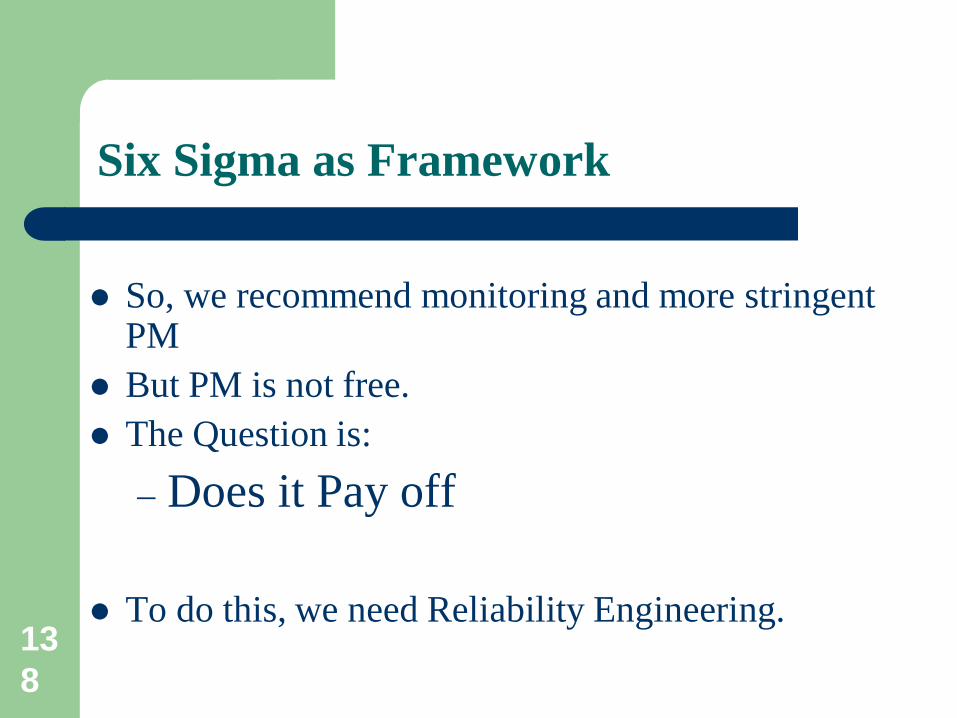
So, we recommend monitoring and more stringent PM
But PM is not free. The Question is:
– Does it Pay off
To do this, we need Reliability Engineering.
139
Reliability Engineering
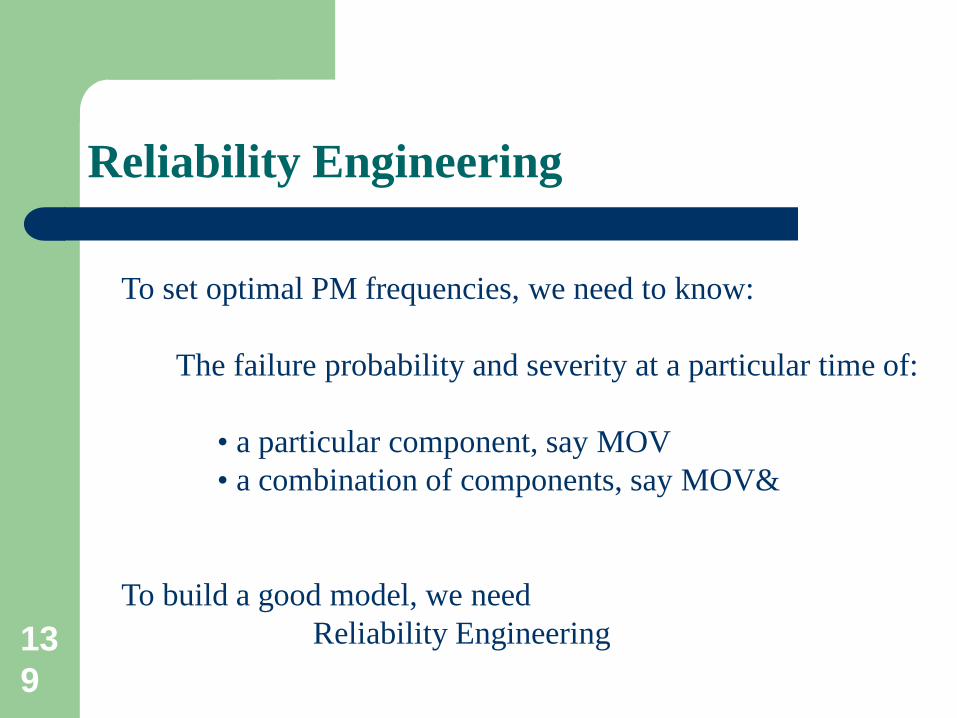
To set optimal PM frequencies, we need to know:
The failure probability and severity at a particular time of:
• a particular component, say MOV • a combination of components, say MOV&
To build a good model, we need Reliability Engineering
140
Need for a framework
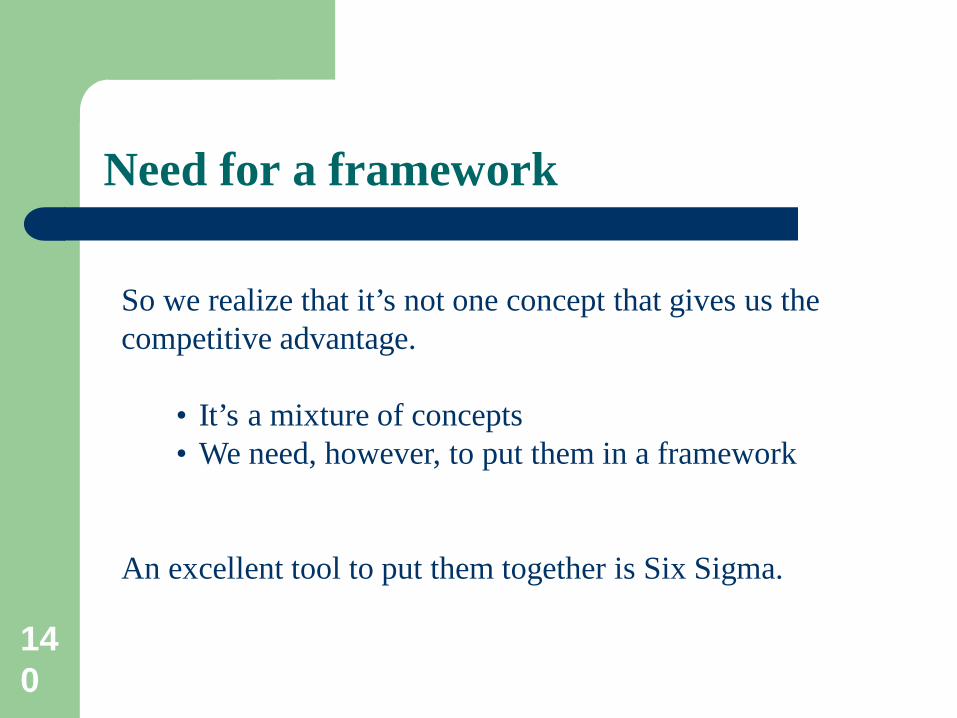
So we realize that it’s not one concept that gives us the competitive advantage.
• It’s a mixture of concepts • We need, however, to put them in a framework
An excellent tool to put them together is Six Sigma.
141
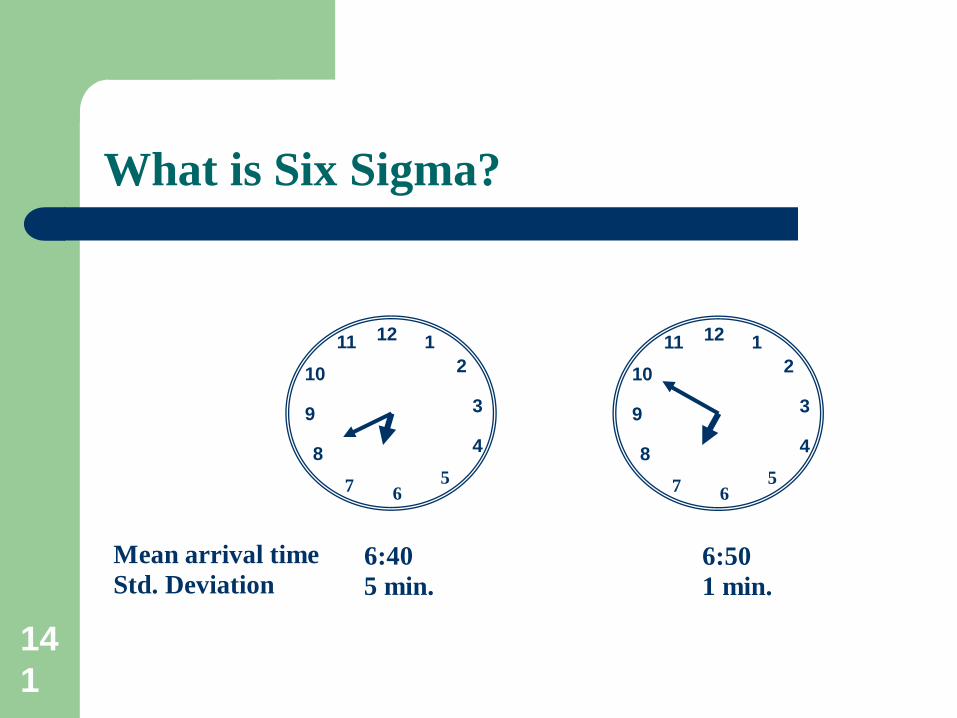
What is Six Sigma?
1 2
3
4 5
6 7
8
9
10 11 12
Mean arrival time 6:40 Std. Deviation 5 min.
1 2
3
4 5
6 7
8
9
10 11 12
6:50 1 min.
142
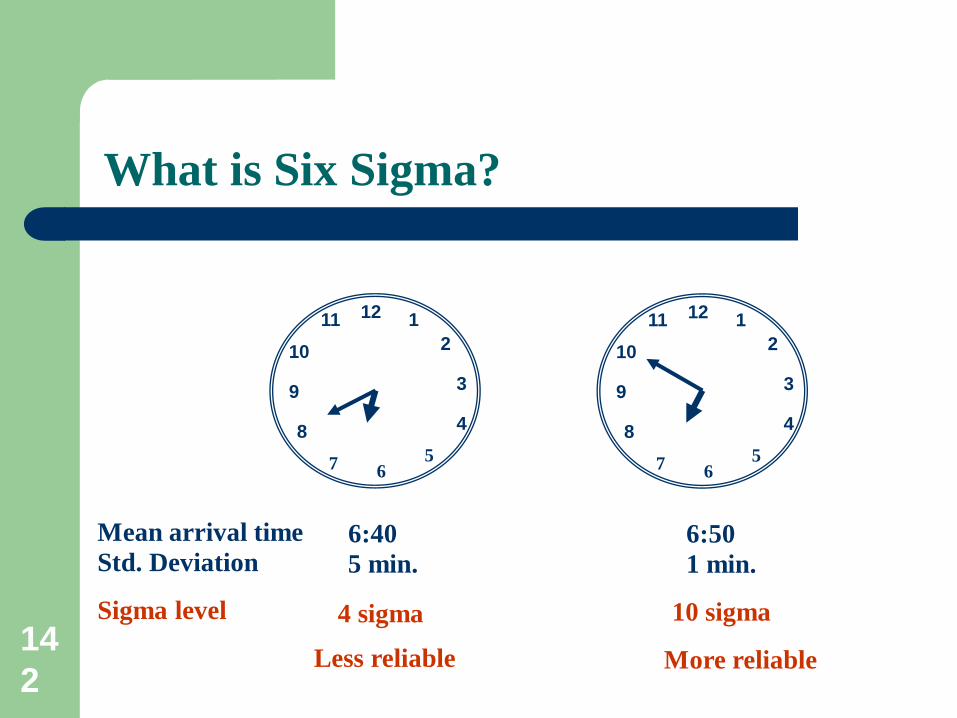
What is Six Sigma?
1 2
3
4 5
6 7
8
9
10 11 12
Mean arrival time 6:40 Std. Deviation 5 min.
1 2
3
4 5
6 7
8
9
10 11 12
6:50 1 min.
Sigma level 4 sigma 10 sigma
Less reliable More reliable
143
What is Six Sigma?
• Based on SPC concept • Uses Sigma (std dev) measurement
144
What is Six Sigma?
What is Sigma? What does it mean?
145
What is Sigma?
0.00
1.00
2.00
3.00
1 3 5 7 9 11 13 15 17 19 21 23 25 27 29
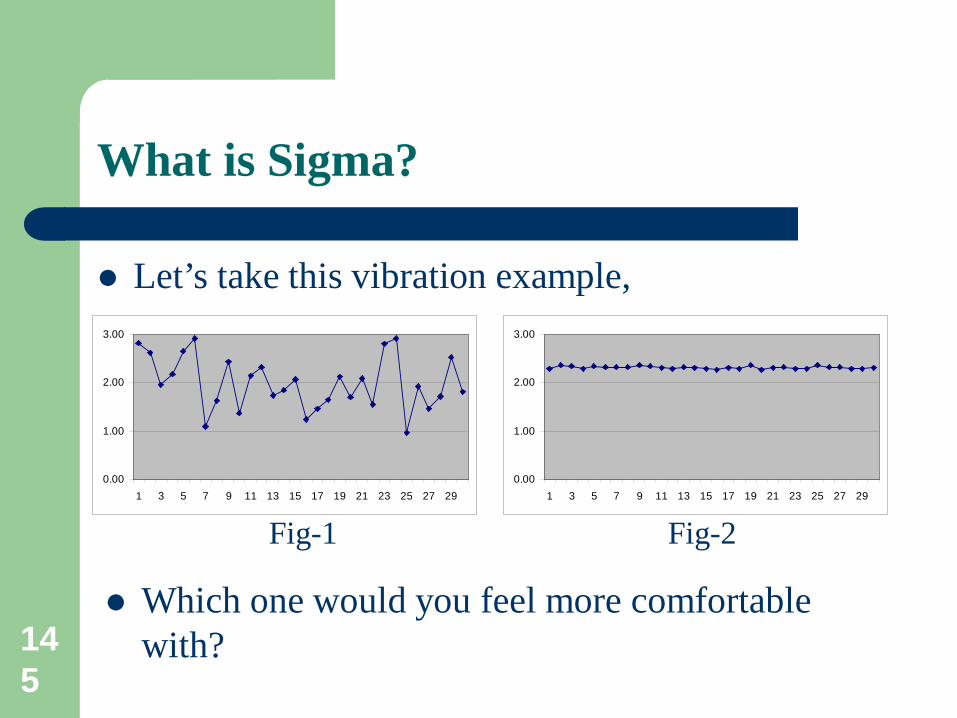
Let’s take this vibration example,
0.00
1.00
2.00
3.00
1 3 5 7 9 11 13 15 17 19 21 23 25 27 29
Which one would you feel more comfortable with?
Fig-1 Fig-2
146
What is Sigma?
0.00
1.00
2.00
3.00
1 3 5 7 9 11 13 15 17 19 21 23 25 27 29
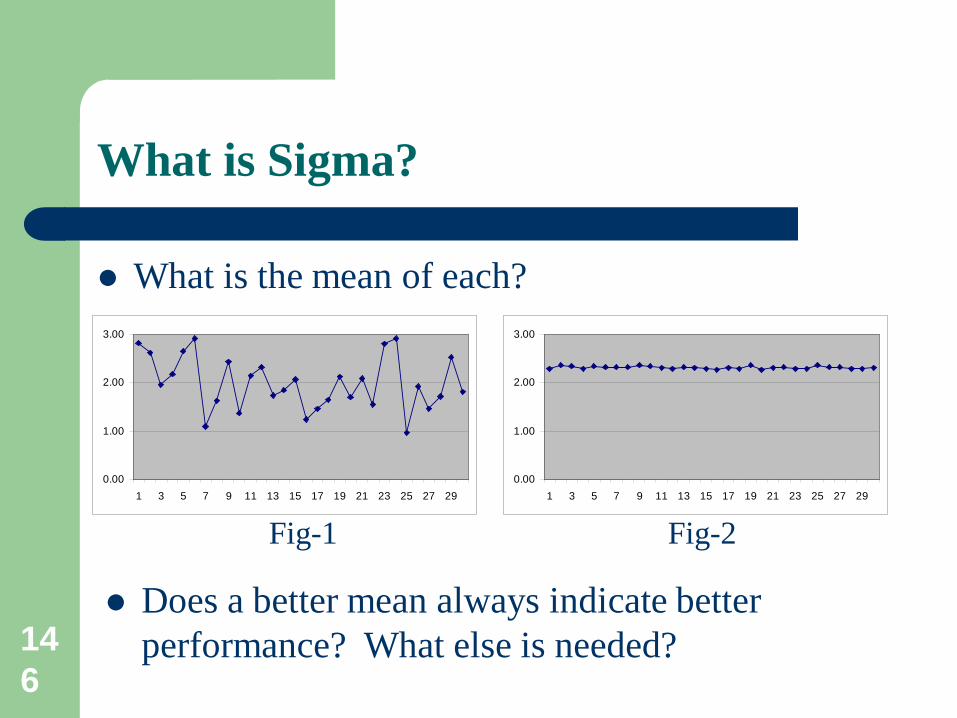
What is the mean of each?
0.00
1.00
2.00
3.00
1 3 5 7 9 11 13 15 17 19 21 23 25 27 29
Does a better mean always indicate better performance? What else is needed?
Fig-1 Fig-2
147
What is Sigma?
0.00
1.00
2.00
3.00
1 3 5 7 9 11 13 15 17 19 21 23 25 27 29
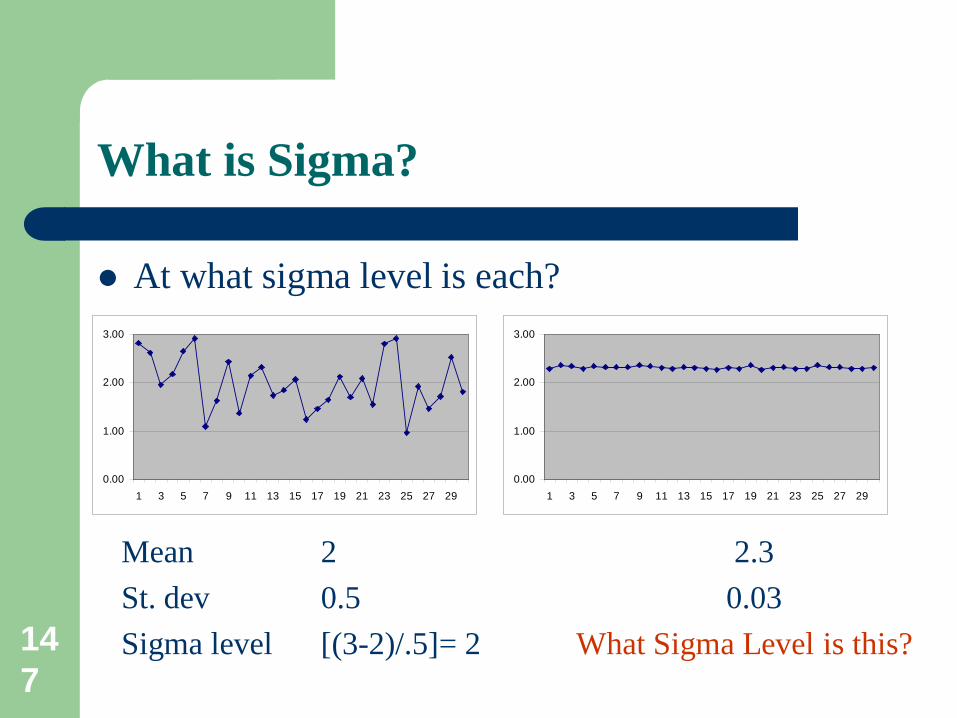
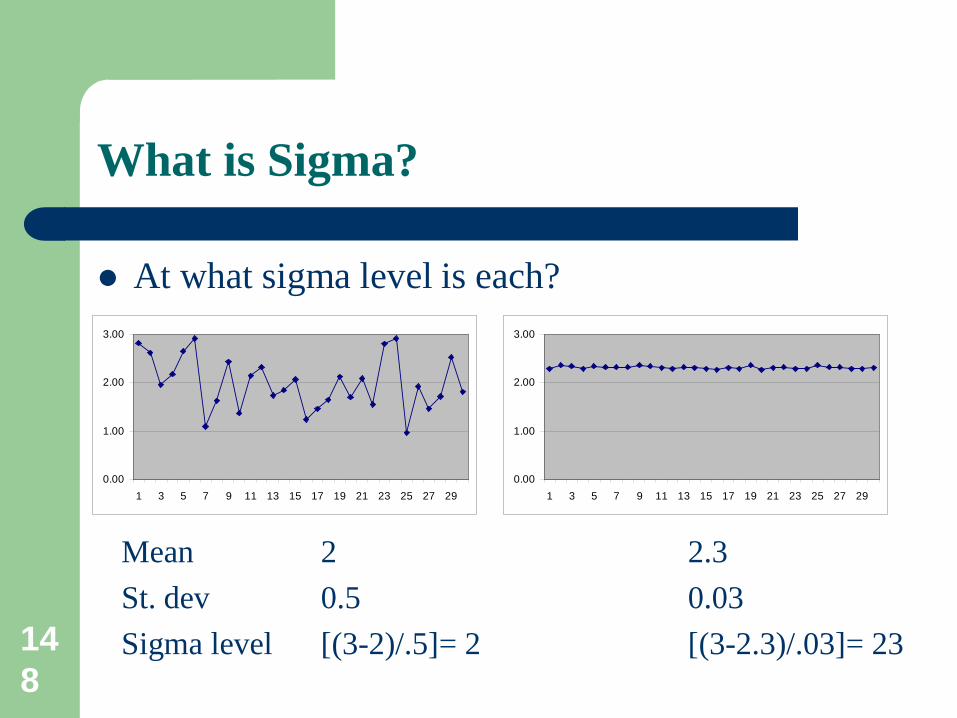
At what sigma level is each?
0.00
1.00
2.00
3.00
1 3 5 7 9 11 13 15 17 19 21 23 25 27 29
Mean St. dev Sigma level
2 0.5 [(3-2)/.5]= 2
2.3 0.03
What Sigma Level is this?
148
What is Sigma?
0.00
1.00
2.00
3.00
1 3 5 7 9 11 13 15 17 19 21 23 25 27 29
At what sigma level is each?
0.00
1.00
2.00
3.00
1 3 5 7 9 11 13 15 17 19 21 23 25 27 29
Mean St. dev Sigma level
2 0.5 [(3-2)/.5]= 2
2.3 0.03 [(3-2.3)/.03]= 23
149
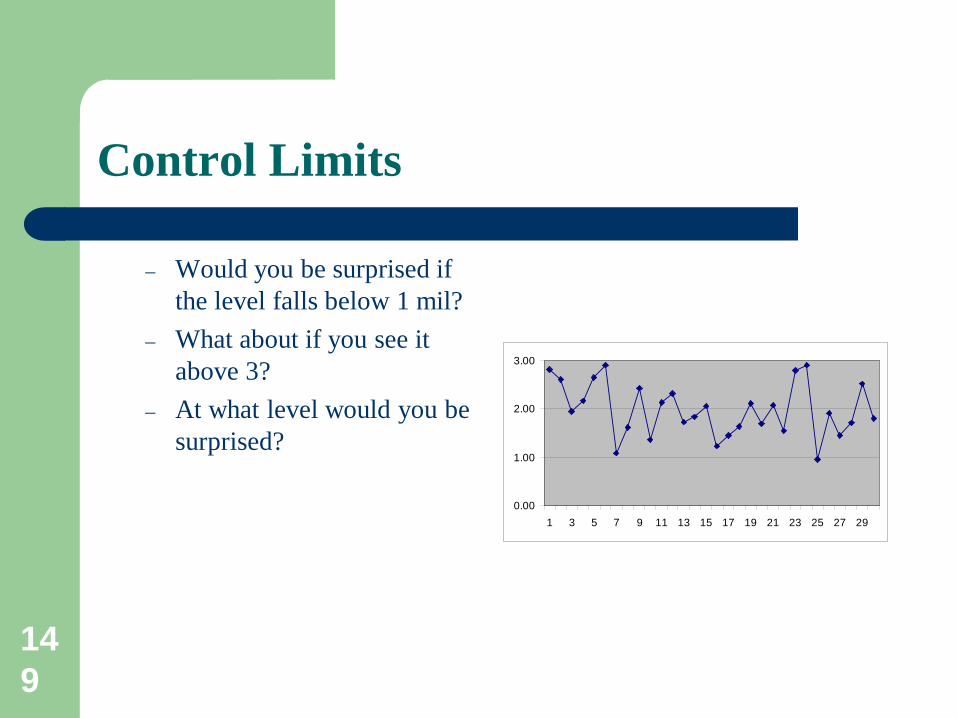
Control Limits
– Would you be surprised if the level falls below 1 mil?
– What about if you see it above 3?
– At what level would you be surprised?
0.00
1.00
2.00
3.00
1 3 5 7 9 11 13 15 17 19 21 23 25 27 29
150
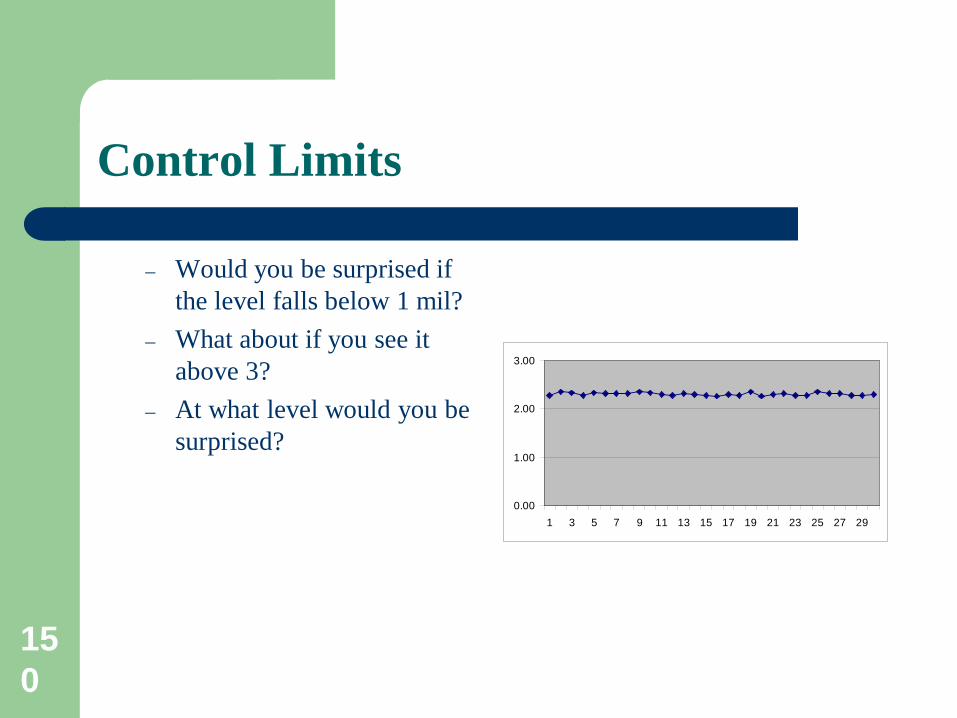
Control Limits
– Would you be surprised if the level falls below 1 mil?
– What about if you see it above 3?
– At what level would you be surprised?
0.00
1.00
2.00
3.00
1 3 5 7 9 11 13 15 17 19 21 23 25 27 29
151
Why Six Sigma?
What are Control limits – What levels make you surprised? – Statisticians say it should be +/-3 sigma – So, what is it for the first and the second figures?
152
Why Six Sigma?
Why 2X? – Founders of Six Sigma decided they want
a double car garage.
Do we need to achieve Six – In some situations yes.
Flight accidents Medical surgeries
– In plant equipment Why not? Need to work on both
– Performance – Expectation
153
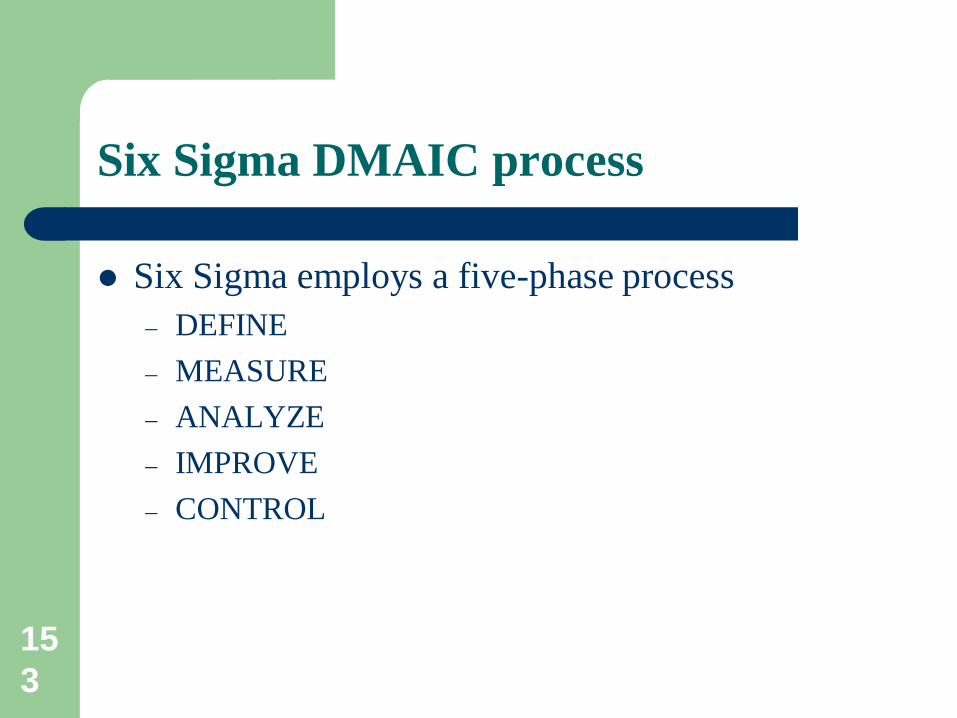
Six Sigma DMAIC process
Six Sigma employs a five-phase process – DEFINE – MEASURE – ANALYZE – IMPROVE – CONTROL

154
Define Phase
155
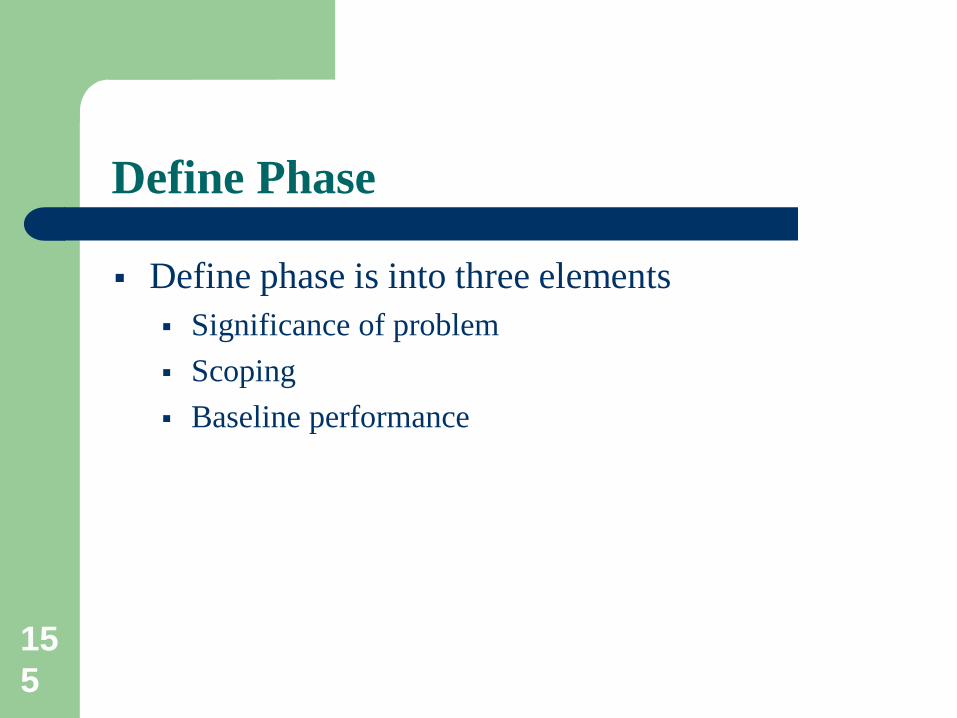
Define Phase
Define phase is into three elements Significance of problem Scoping Baseline performance
156
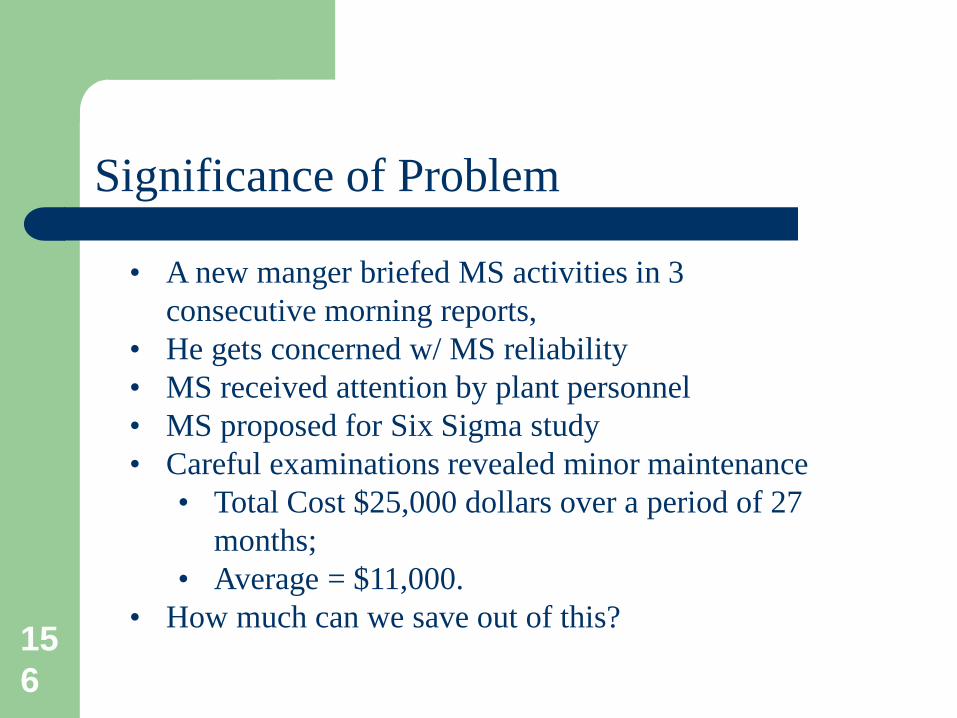
• A new manger briefed MS activities in 3 consecutive morning reports,
• He gets concerned w/ MS reliability • MS received attention by plant personnel • MS proposed for Six Sigma study • Careful examinations revealed minor maintenance
• Total Cost $25,000 dollars over a period of 27 months;
• Average = $11,000. • How much can we save out of this?
Significance of Problem
157
Significance of Problem
Can you think of any other stories to support this.
158
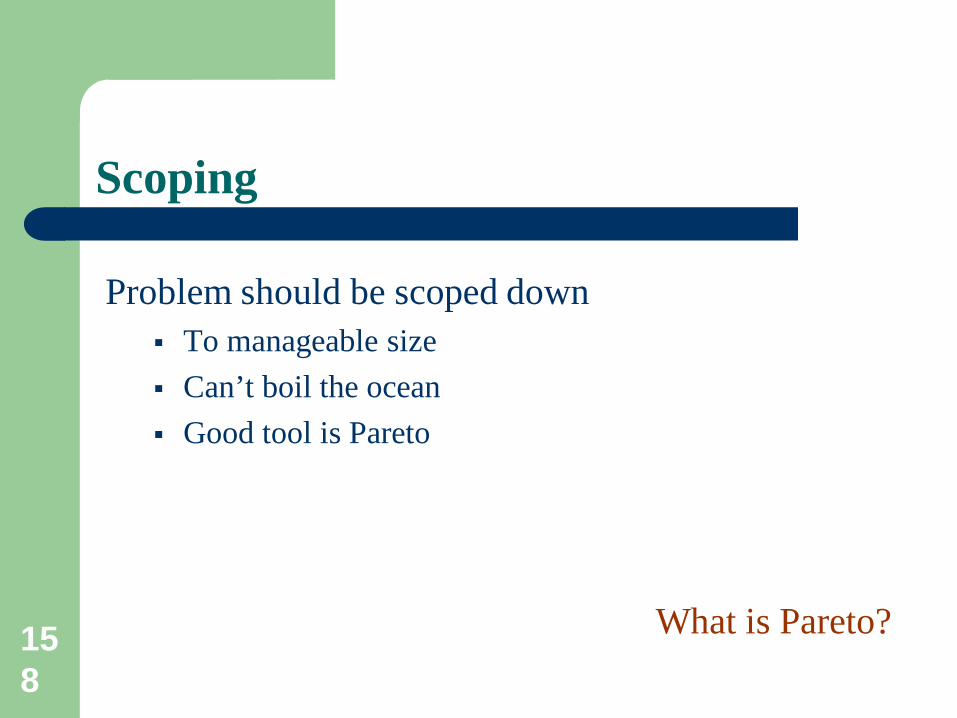
Scoping
Problem should be scoped down To manageable size Can’t boil the ocean Good tool is Pareto
What is Pareto?
159
Coun
t
Perc
ent
ComponentCount
70.1 90.2 100.0
150 43 21Percent 70.1 20.1 9.8Cum %
OthersBearingsSeals
200
150
100
50
0
100
80
60
40
20
0
Pareto Chart of Component
Example Pareto Chart
What are the features of a Pareto Chart?
160
The above chart is a Pareto of total number of failures by motor type. The charts shows that the Type-A motors have the highest number of failures.
Coun
t
Perc
ent
TypeCount
62.8 83.7 100.0
27 9 7Percent 62.8 20.9 16.3Cum %
Type-BType-CType-A
40
30
20
10
0
100
80
60
40
20
0
Pareto By Count of failures
Scoping Example
Is Pareto by Count enough?
161
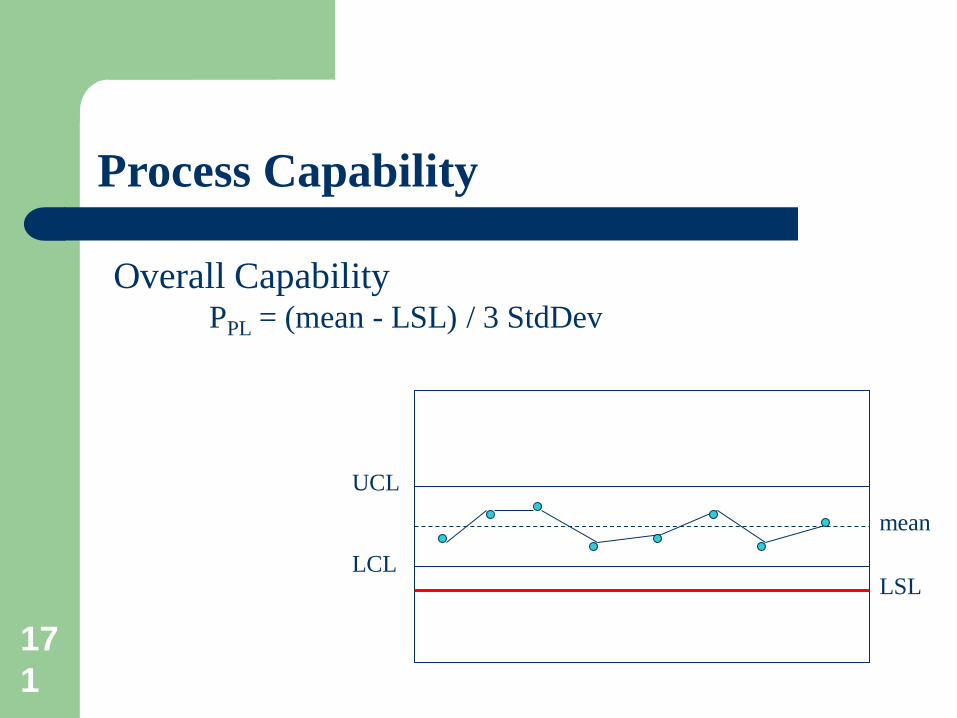
Process Capability
PC is based on two things Performance Customer Specs
Need to ask Customer What he expects or what’s bothering him
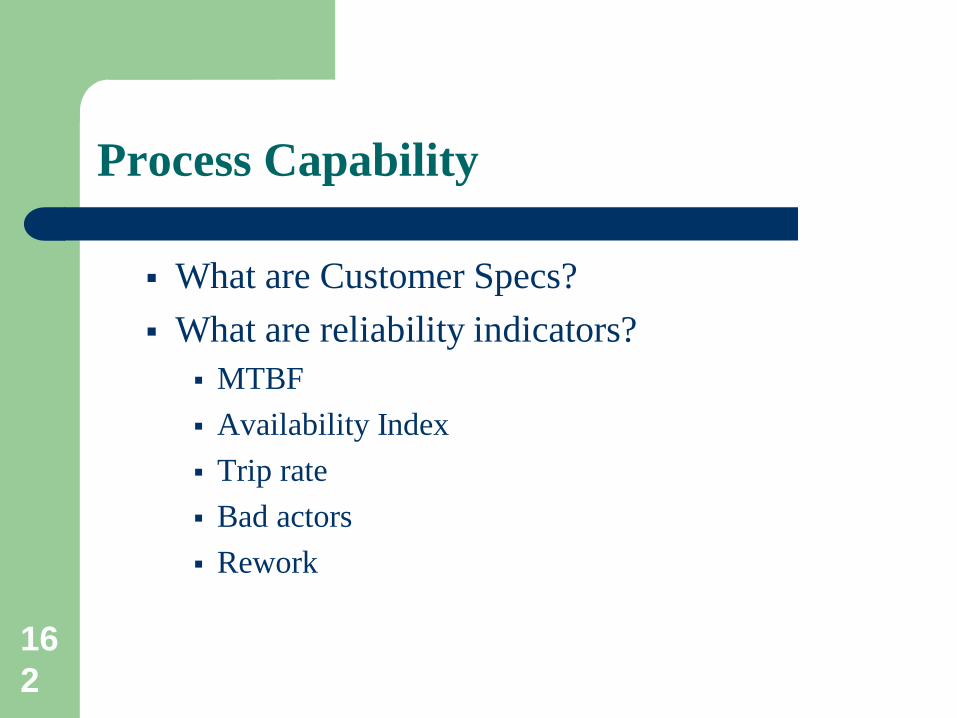
162
Process Capability
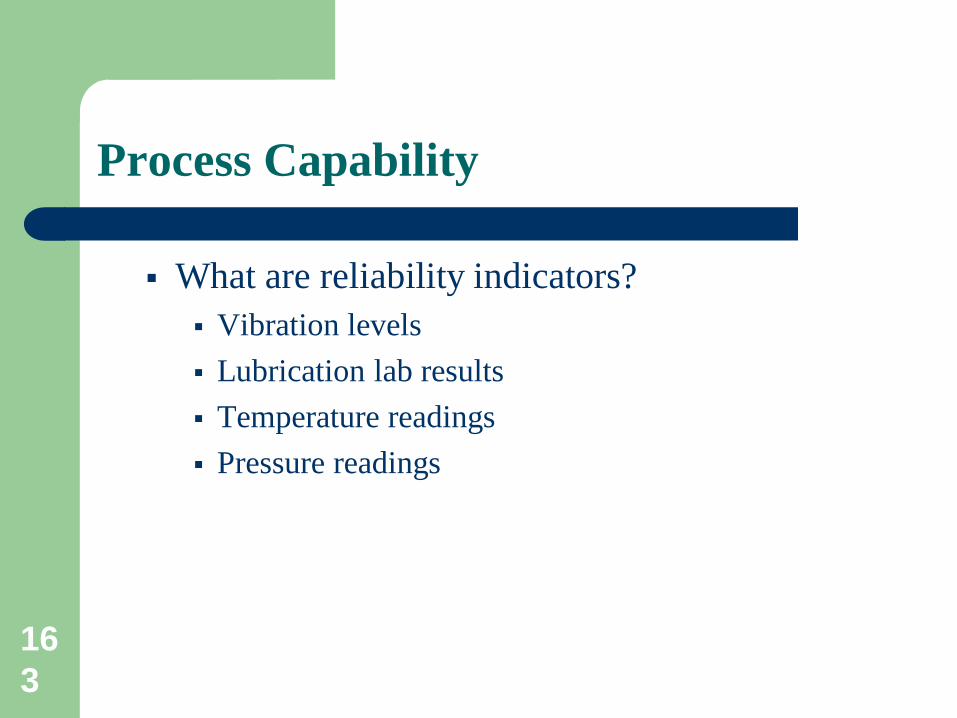
What are Customer Specs? What are reliability indicators?
MTBF Availability Index Trip rate Bad actors Rework
163
Process Capability
What are reliability indicators? Vibration levels Lubrication lab results Temperature readings Pressure readings
164
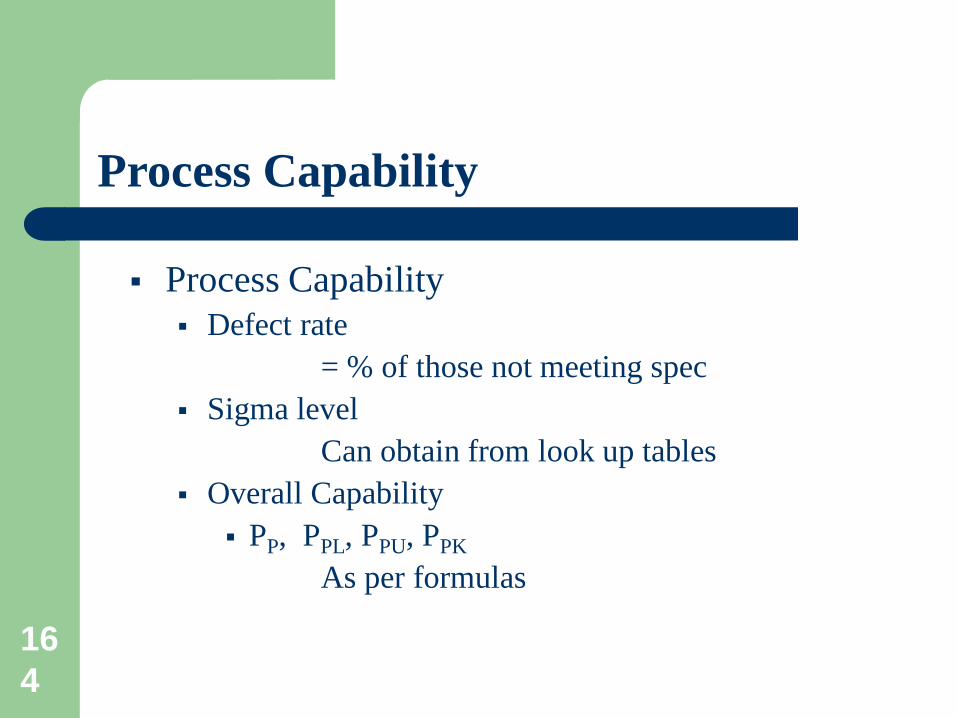
Process Capability Defect rate = % of those not meeting spec Sigma level
Can obtain from look up tables Overall Capability
PP, PPL, PPU, PPK As per formulas
Process Capability
165
0.00
1.00
2.00
3.00
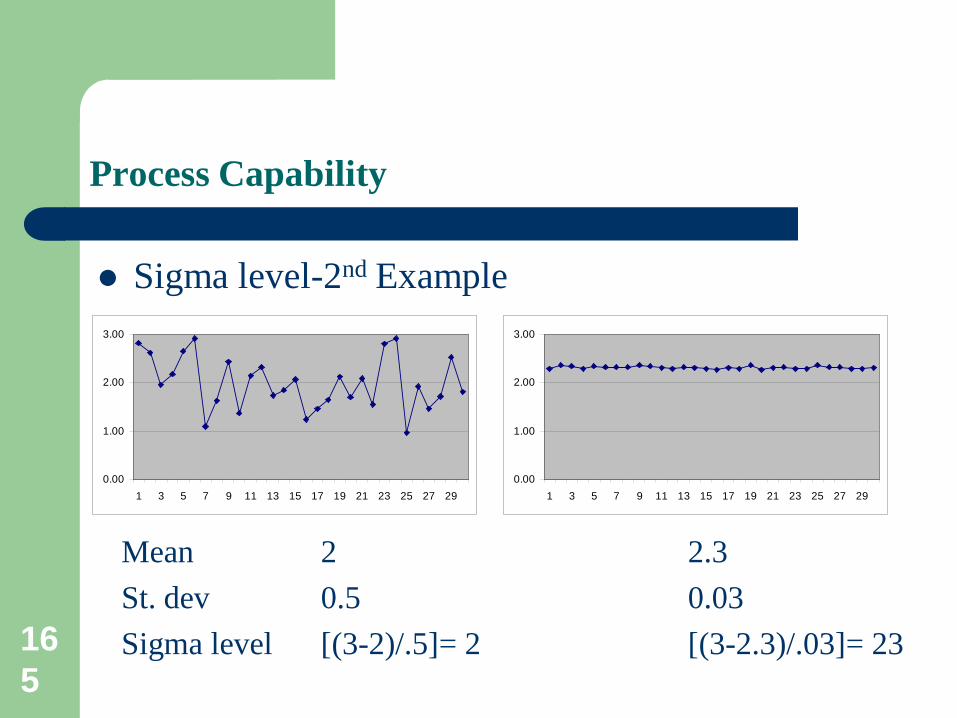
1 3 5 7 9 11 13 15 17 19 21 23 25 27 29
Sigma level-2nd Example
0.00
1.00
2.00
3.00
1 3 5 7 9 11 13 15 17 19 21 23 25 27 29
Mean St. dev Sigma level
2 0.5 [(3-2)/.5]= 2
2.3 0.03 [(3-2.3)/.03]= 23
Process Capability
166
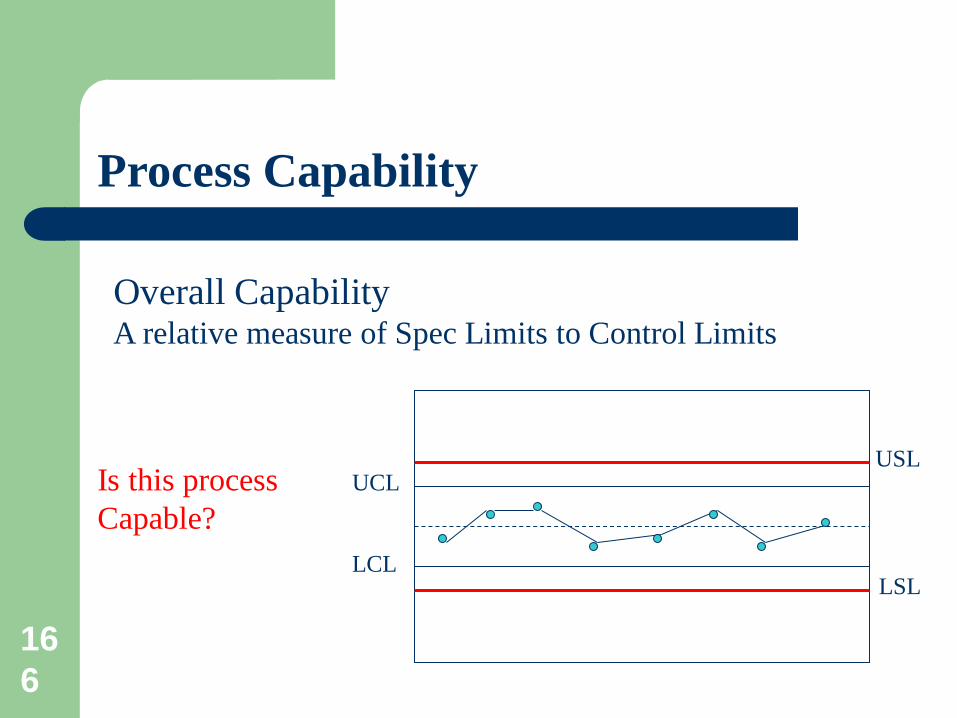
Overall Capability A relative measure of Spec Limits to Control Limits
Process Capability
UCL
LCL
USL
LSL
Is this process Capable?
167
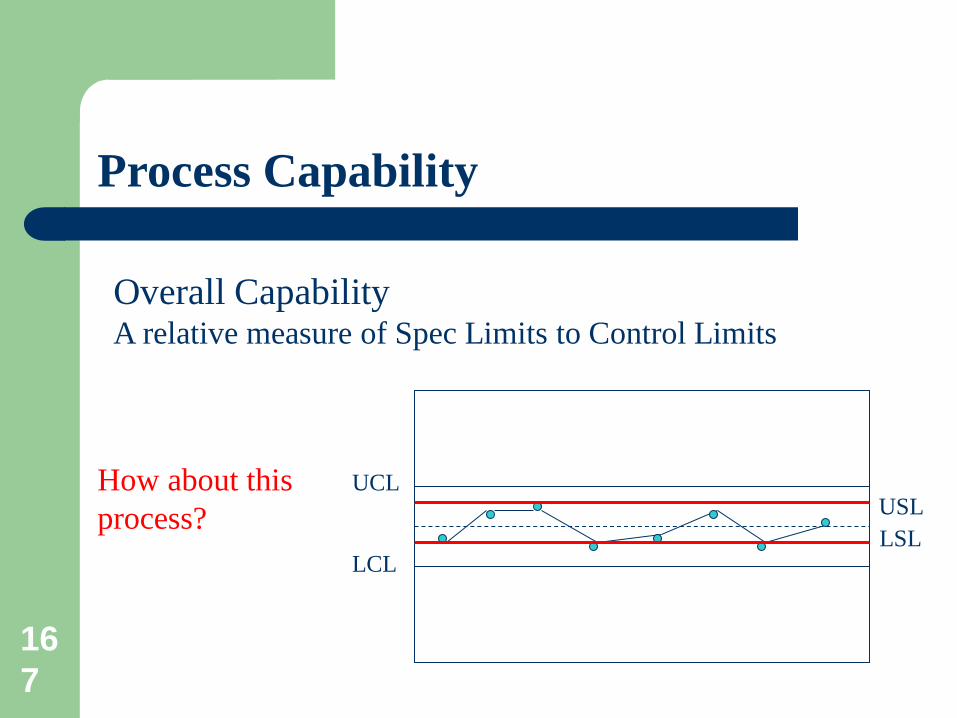
Overall Capability A relative measure of Spec Limits to Control Limits
Process Capability
UCL
LCL
USL LSL
How about this process?
168
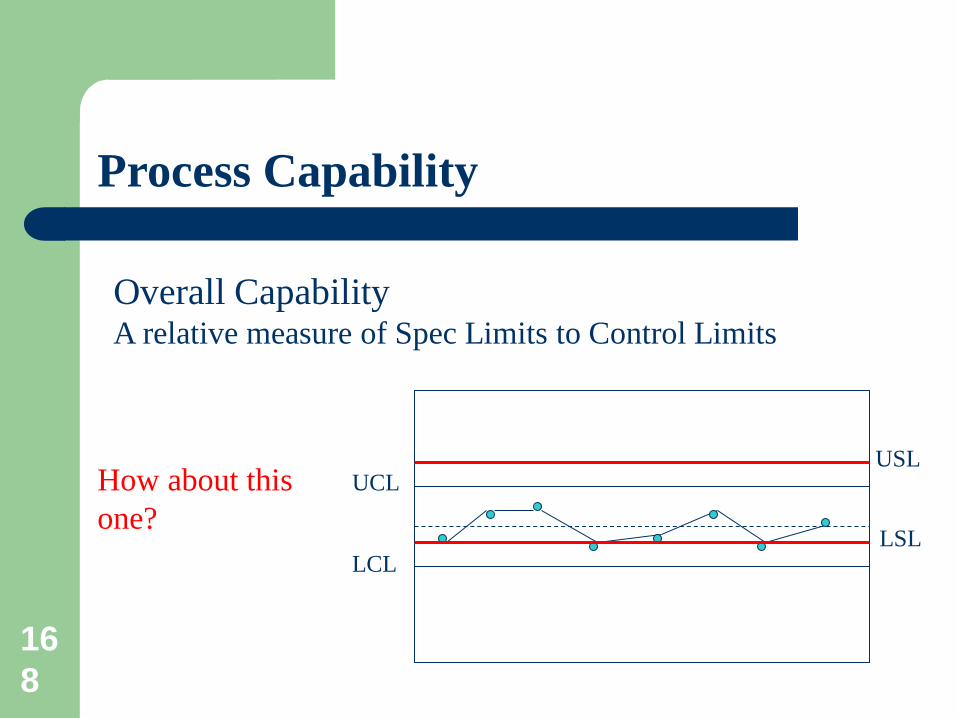
Overall Capability A relative measure of Spec Limits to Control Limits
Process Capability
UCL
LCL
USL
LSL
How about this one?
169
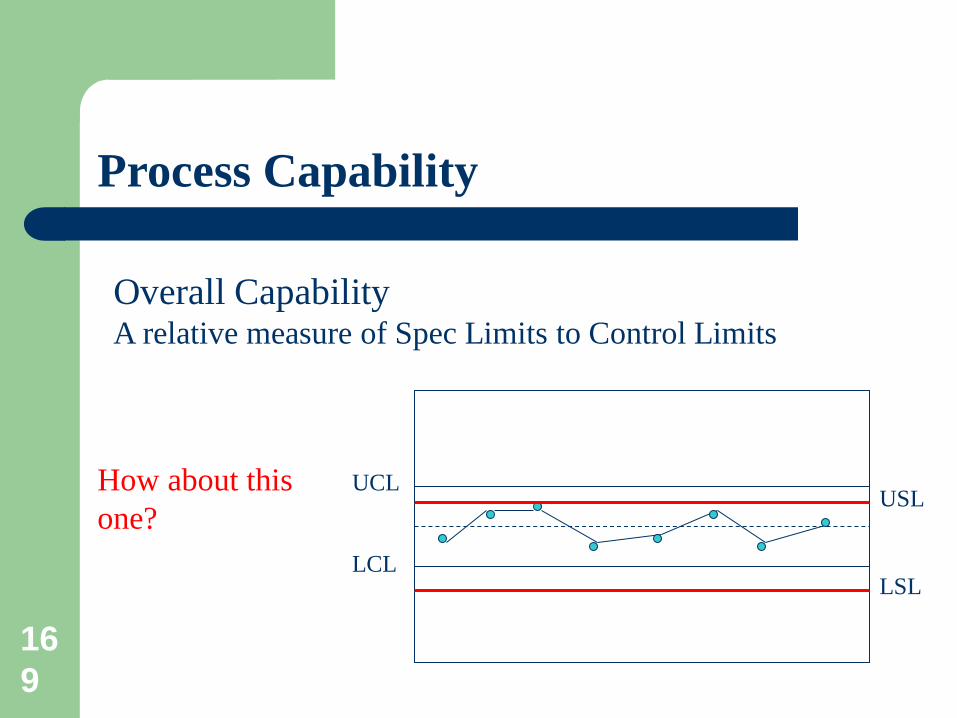
Overall Capability A relative measure of Spec Limits to Control Limits
Process Capability
UCL
LCL
USL
LSL
How about this one?

170
Overall Capability PPU = (USL - mean) / 3 StdDev
Process Capability
UCL
LCL
USL
mean
171
Overall Capability PPL = (mean - LSL) / 3 StdDev
Process Capability
UCL
LCL LSL
mean

172
Overall Capability PP = (USL - LSL) / 6 StdDev
PPK = minimum (PPU, PPL)
Process Capability
UCL
LCL LSL
mean
USL
173
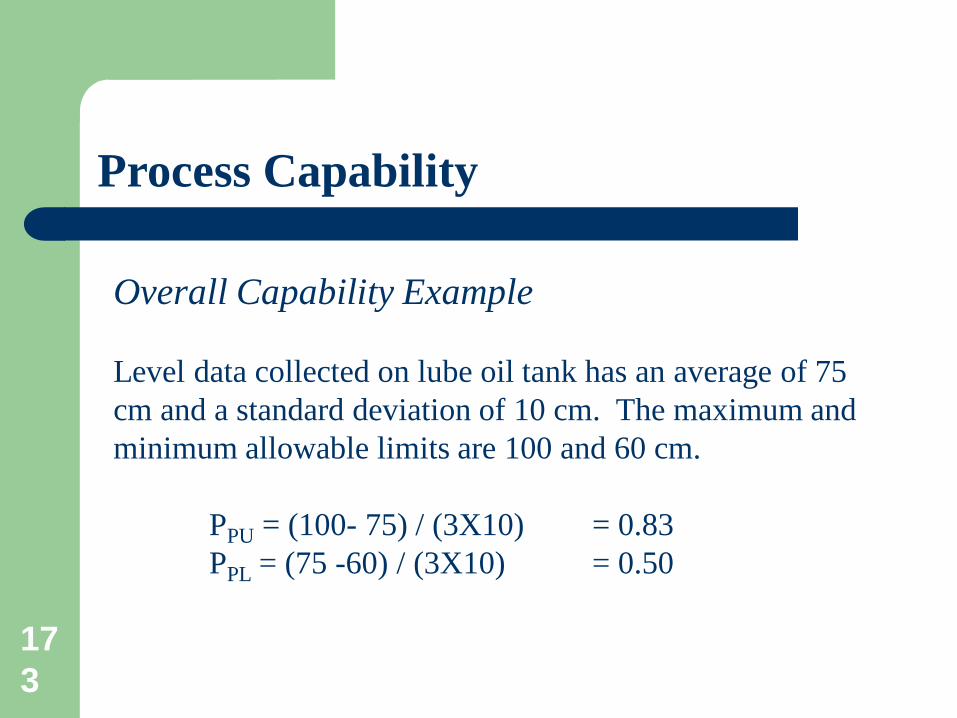
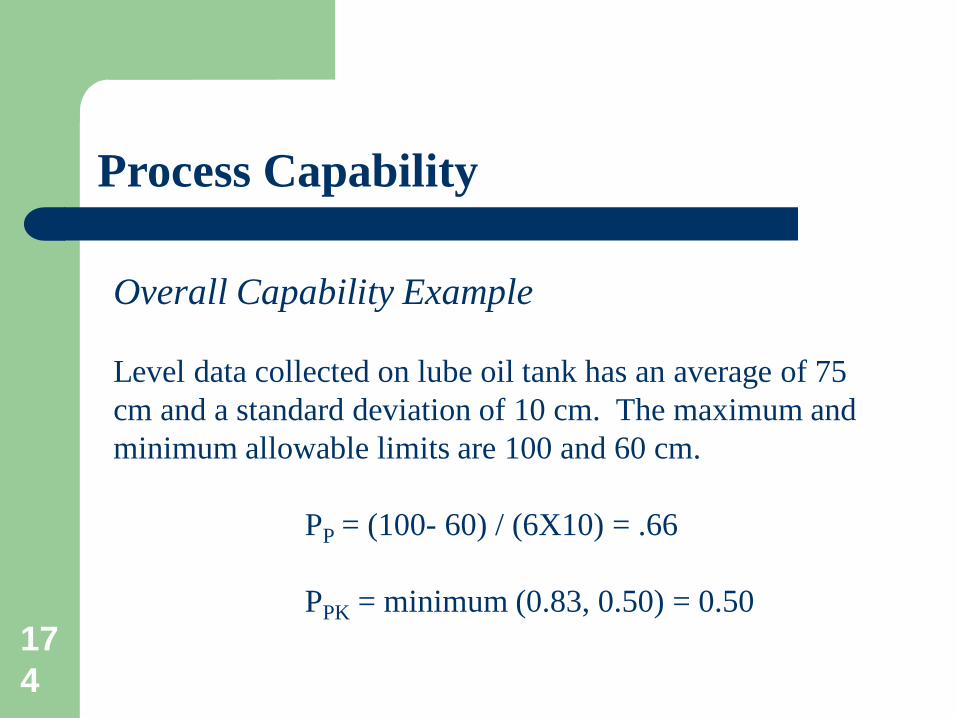
Overall Capability Example Level data collected on lube oil tank has an average of 75 cm and a standard deviation of 10 cm. The maximum and minimum allowable limits are 100 and 60 cm.
PPU = (100- 75) / (3X10) = 0.83 PPL = (75 -60) / (3X10) = 0.50
Process Capability
174
Overall Capability Example Level data collected on lube oil tank has an average of 75 cm and a standard deviation of 10 cm. The maximum and minimum allowable limits are 100 and 60 cm.
PP = (100- 60) / (6X10) = .66 PPK = minimum (0.83, 0.50) = 0.50
Process Capability

175
Measure Phase
176
Elements of Measure
Measure is into two elements Ensuring Good Data Measuring the Factors
177
Integrity of Data
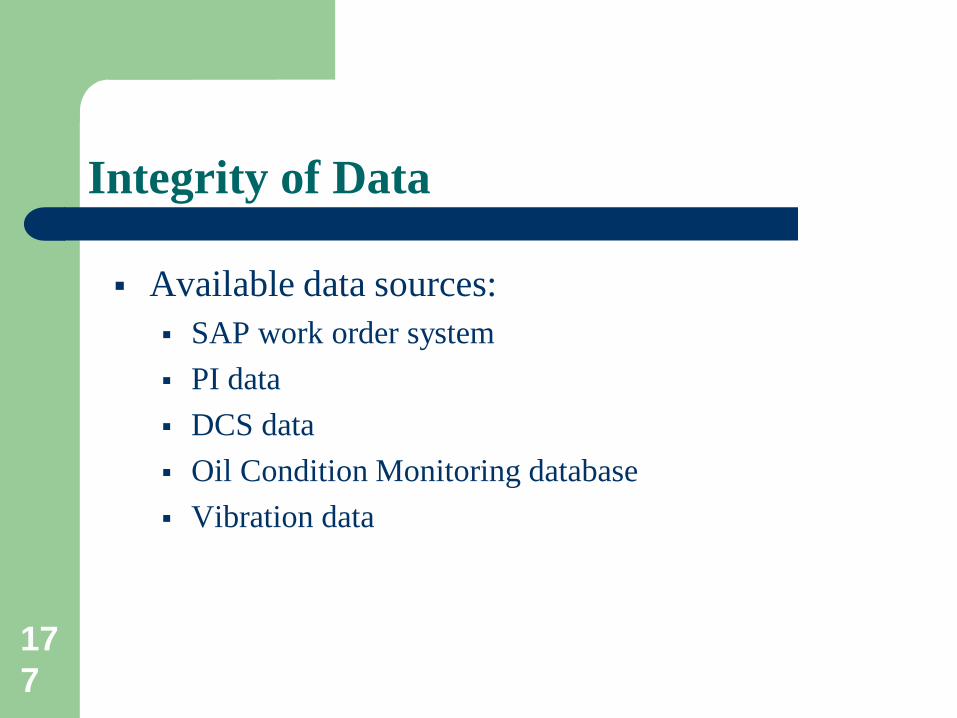
Available data sources: SAP work order system PI data DCS data Oil Condition Monitoring database Vibration data
178
Ensuring Good Data
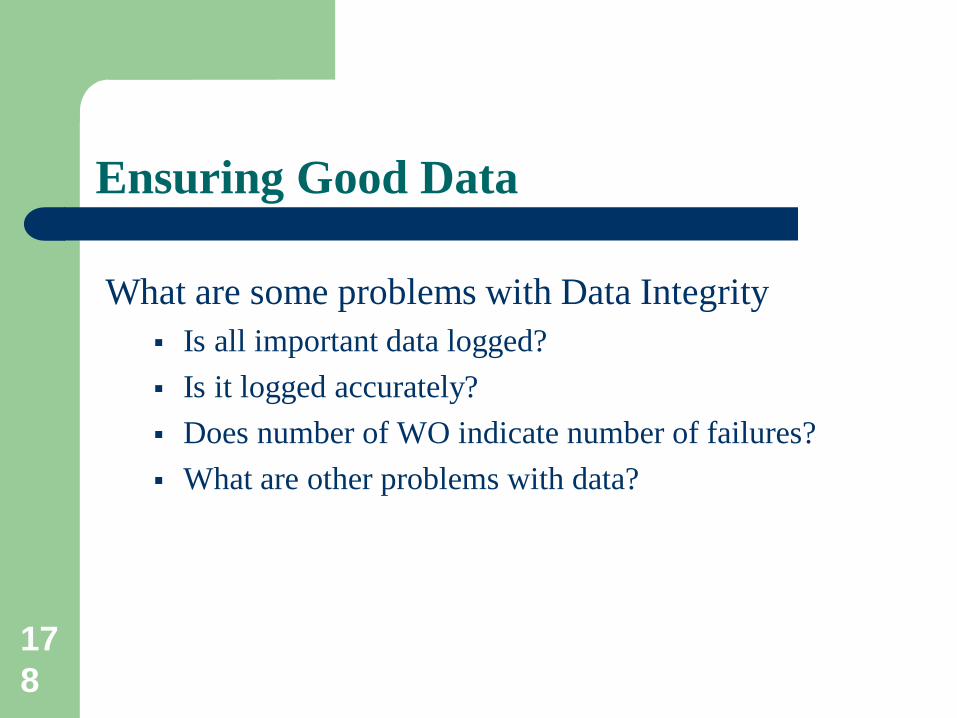
What are some problems with Data Integrity Is all important data logged? Is it logged accurately? Does number of WO indicate number of failures? What are other problems with data?
179
Measure Phase
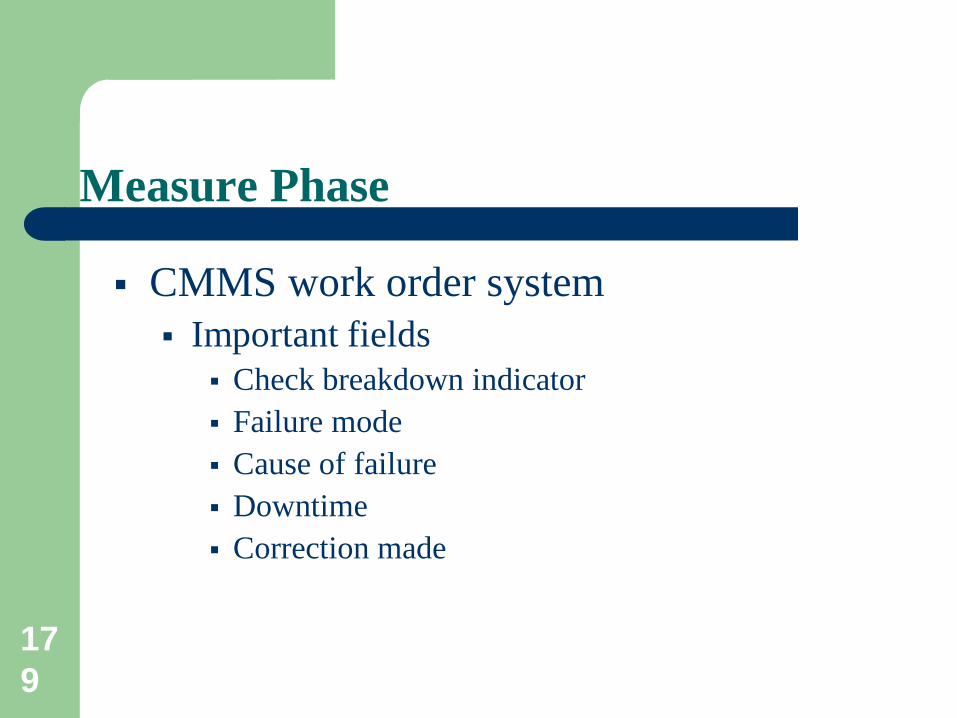
CMMS work order system Important fields
Check breakdown indicator Failure mode Cause of failure Downtime Correction made
180
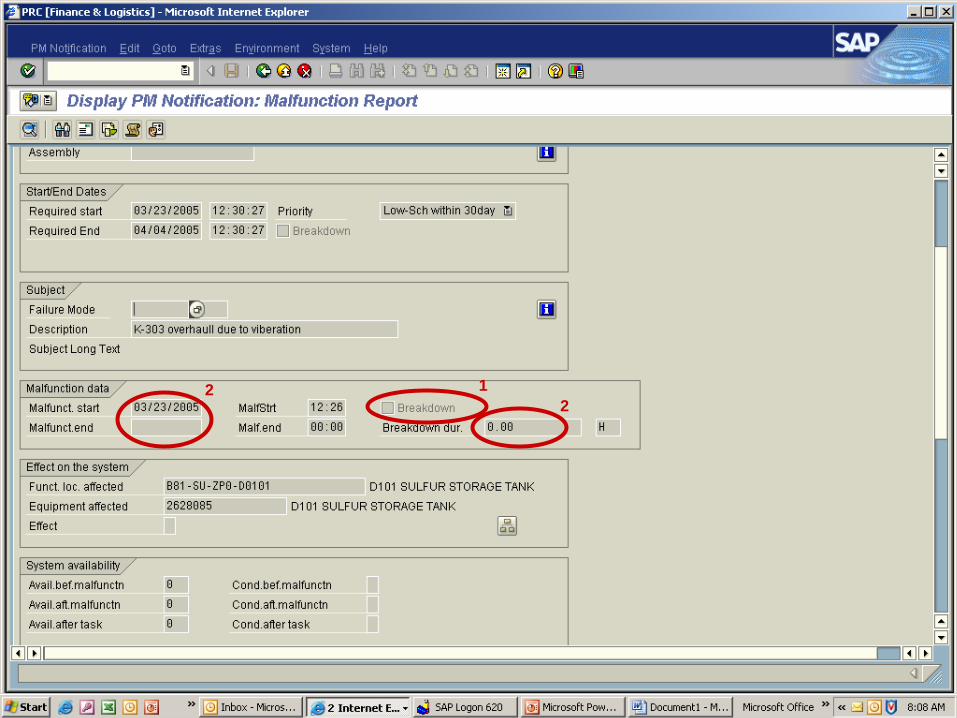
1 2
2
181
182
183
184
185

186
Measuring the Factors
Soft Tools: Brainstorming Old reports Shop visits Can you think of others?
187
MOV
Press Switch Dumping ZV
Logic
Check Valve
CR
Accumulator
Process
Solenoid Valve Tank
S/O sys
Schematic Diagrams
188
Six Sigma as Framework
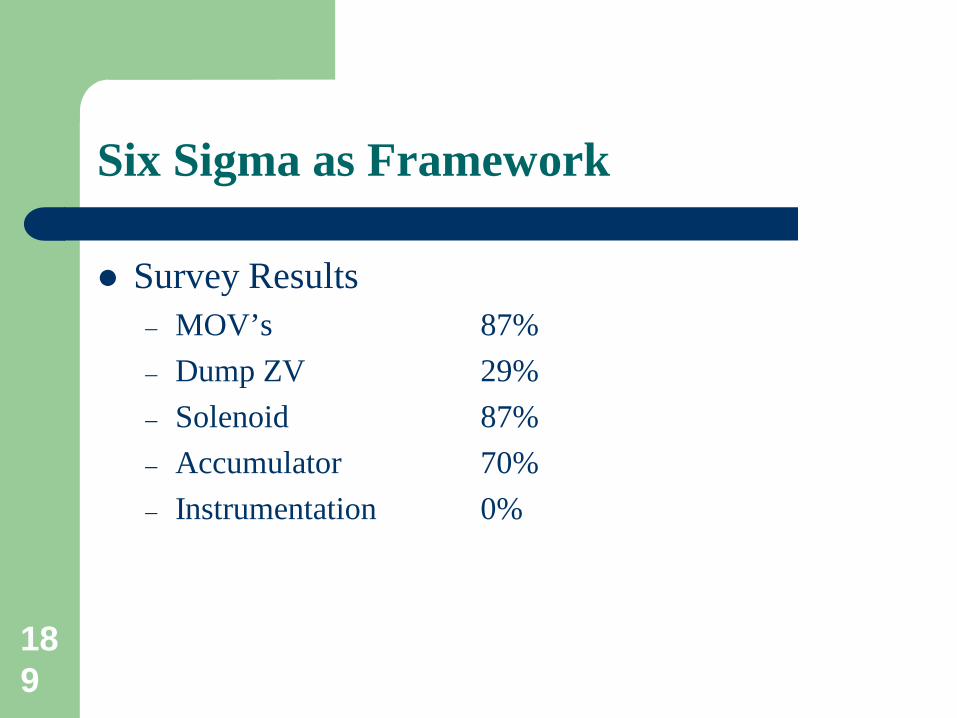
We find a number of potential failure modes – MOV’s – Dump ZV – Solenoid – Accumulator – Instrumentation
We make a survey,
189
Six Sigma as Framework
Survey Results – MOV’s 87% – Dump ZV 29% – Solenoid 87% – Accumulator 70% – Instrumentation 0%
190
Analyze Phase

191
Analyze Phase
In Six Sigma, we rely heavily in statistics as possible. We trust SME but we like to verify. If told that a specific bearing has a better life, we like
statistical proof if possible. If data is not available, then we may have to depend solely
in SME

192
Analyze Phase
We, therefore, need some good background in Statistics.
193
Probability Distribution
8765432
0
50%
-1
16%
-2
2%
1
84%
2
98%
Years Z-score Area
A piece of equipment has a mean life of 5 years & Std Dev of 1 year
194
Probability Distribution
8765432
0
50%
-1
16%
-2
2%
1
84%
2
98%
Years Z-score Area
If we take a new data point and find it above 5 years, Can we say we improved?
No, because there is a 50/50 chance to be above 5yr any way

195
Probability Distribution
8765432
0
50%
-1
16%
-2
2%
1
84%
2
98%
Years Z-score Area
What about if we find it above 6 years, Can we say we improved?
Maybe, but we’re only 84% confident
196
Probability Distribution
8765432
0
50%
-1
16%
-2
2%
1
84%
2
98%
Years Z-score Area
What if we want to be 95% confident?

197
Improve Phase
198
Improve Phase
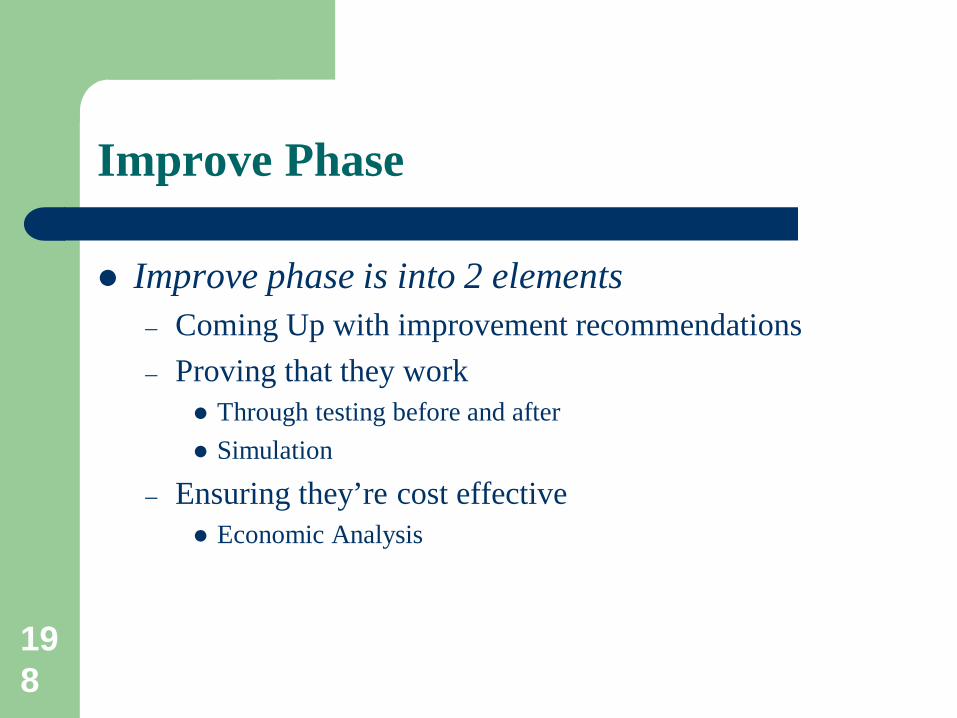
Improve phase is into 2 elements – Coming Up with improvement recommendations – Proving that they work
Through testing before and after Simulation
– Ensuring they’re cost effective Economic Analysis
199
Improve Phase
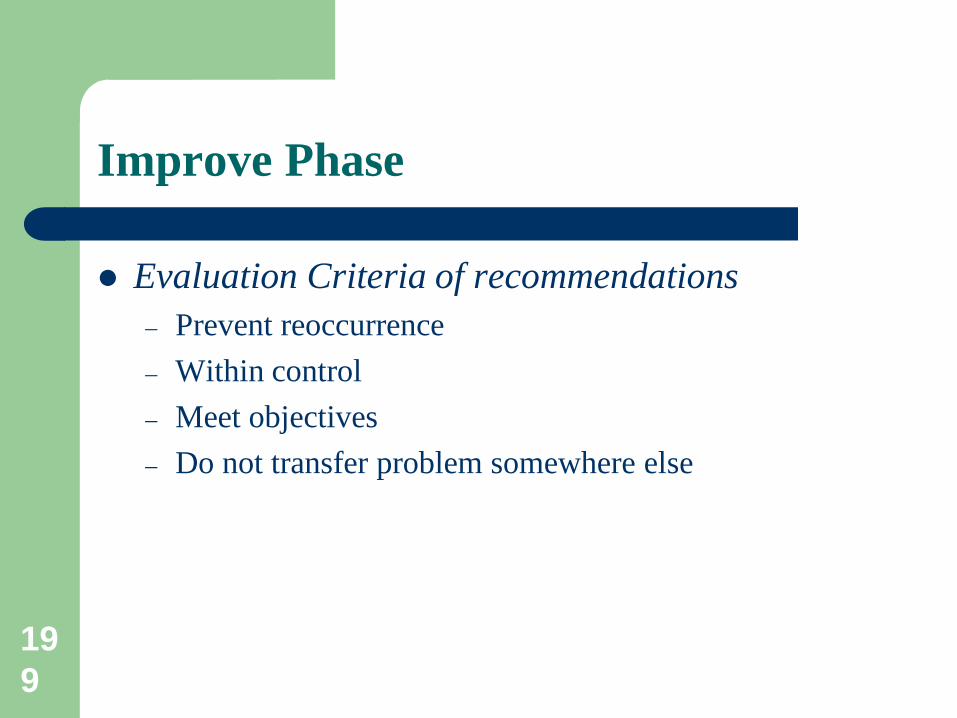
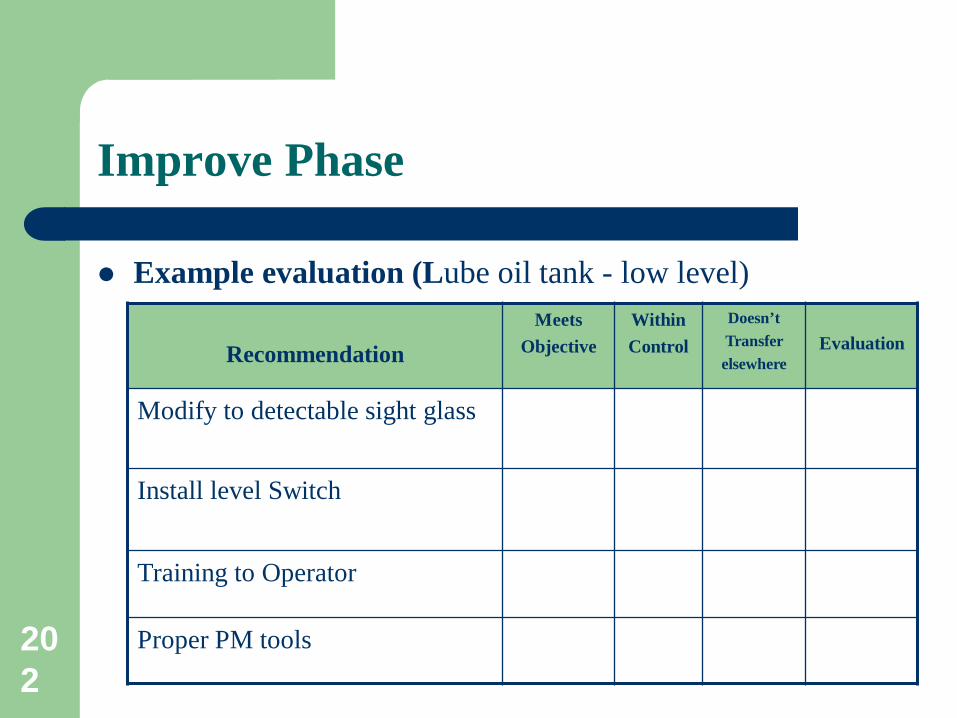
Evaluation Criteria of recommendations – Prevent reoccurrence – Within control – Meet objectives – Do not transfer problem somewhere else
200
Tank
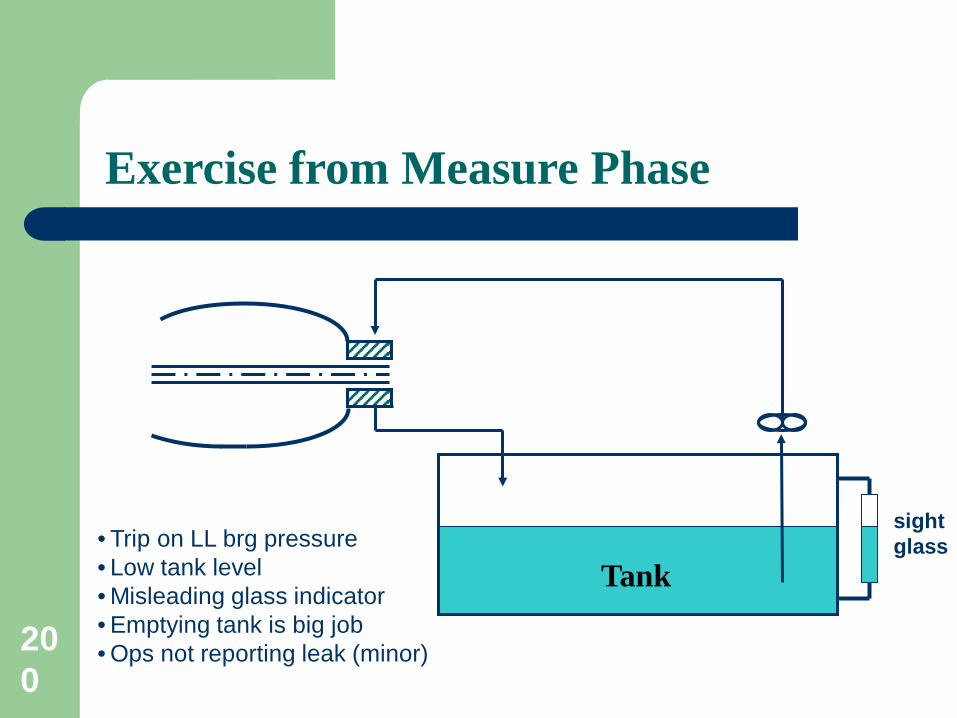
Exercise from Measure Phase
sight glass • Trip on LL brg pressure
• Low tank level • Misleading glass indicator • Emptying tank is big job • Ops not reporting leak (minor)
201
A critical pump experienced a number of trips caused by low bearing oil pressure. Investigation showed it was due to low level in the lube tank. The Operator said he was misled by oil build up on glass indicator. PM technician was not cleaning the glass indicator because that required emptying the tank which is a major job. When Operator blamed for not reporting leaking bearing, he advised it’s only a minor one.
Exercise
202
Improve Phase
Example evaluation (Lube oil tank - low level)
Recommendation Meets
Objective
Within Control
Doesn’t Transfer elsewhere
Evaluation
Modify to detectable sight glass Install level Switch
Training to Operator
Proper PM tools
203
Improve Phase
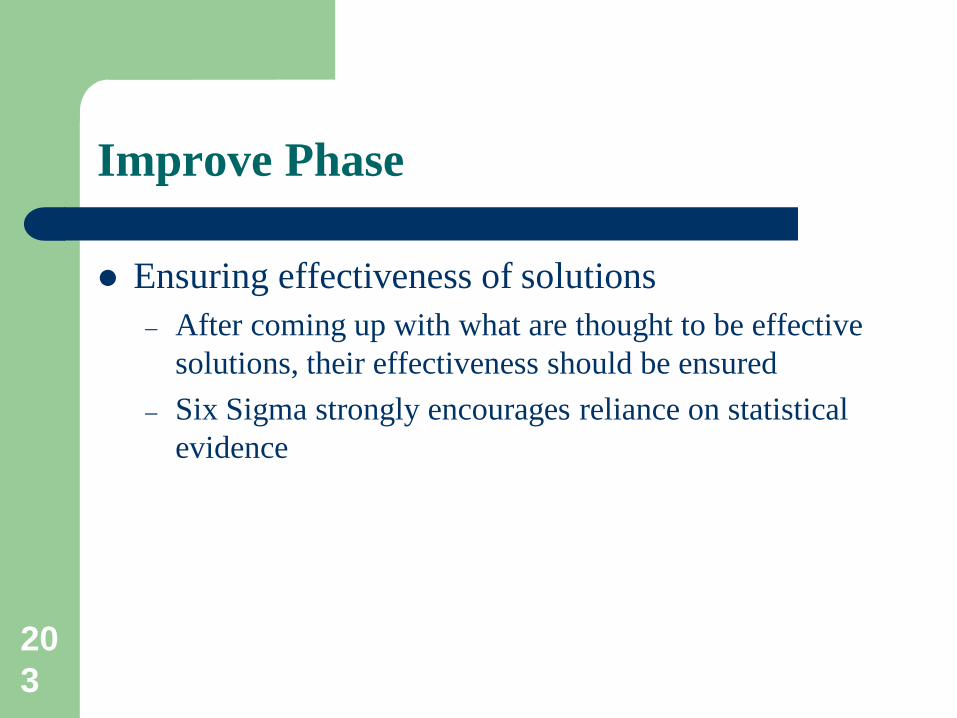
Ensuring effectiveness of solutions – After coming up with what are thought to be effective
solutions, their effectiveness should be ensured – Six Sigma strongly encourages reliance on statistical
evidence
204
Improve Phase
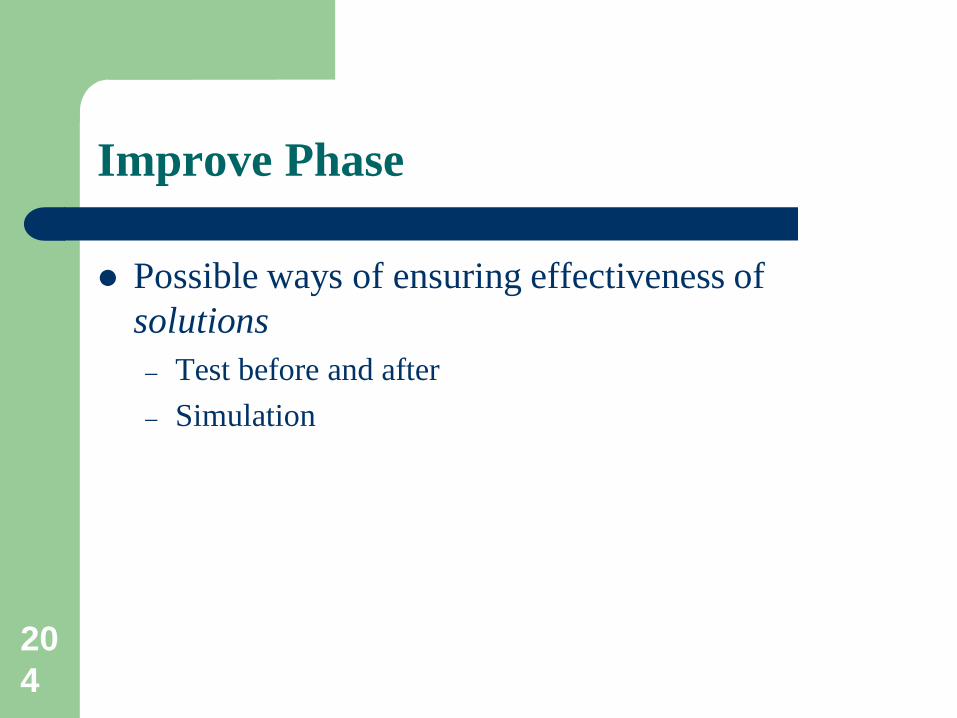
Possible ways of ensuring effectiveness of solutions – Test before and after – Simulation
205
Simulation
Simulation simply means simulating the solutions before implementation
206
Sea
Outlet C
anal
4 X 60,000 GPM pumps 3 X 35,000 GPM pumps
Excess
Capacity
Exces
s Cap
acity
Low-Lift Pumps

207
Feasibility Assessment
The result was a similar level of availability (99.98%).
It was, therefore, concluded that replacement on the basis of availability was not economically feasible
208
The Minimum Attractive Return
For an investment capital of $1,000,000, The minimum attractive return = $1,000,000 X 0.11282 = $112,820
Estimated is less than attractive Replacement of current system is not economically infeasible.
209
End of Improve Phase
210
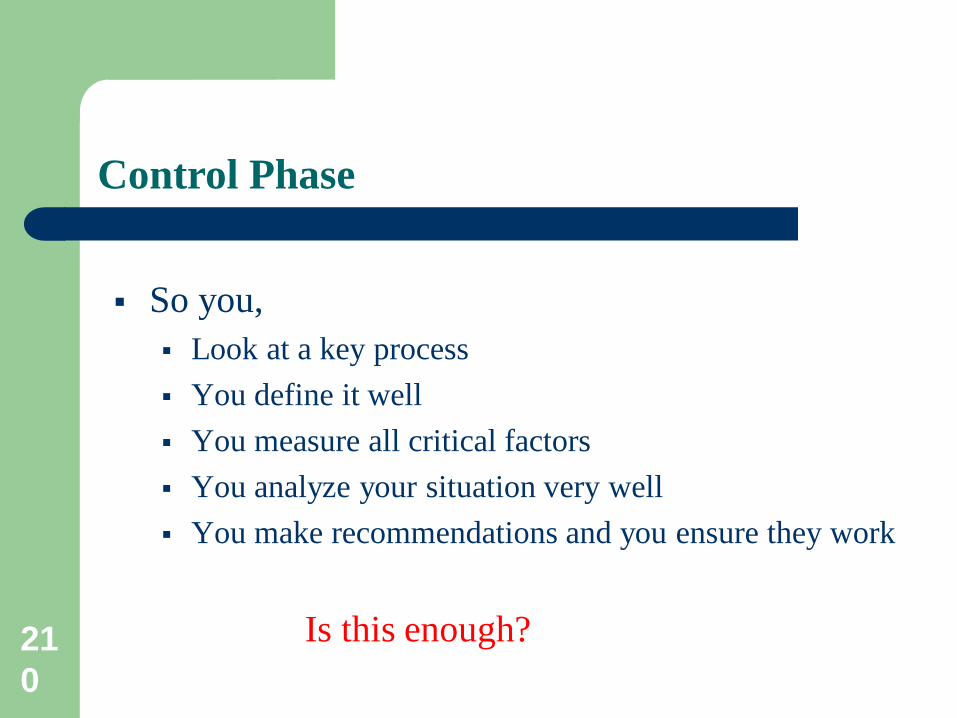
So you, Look at a key process You define it well You measure all critical factors You analyze your situation very well You make recommendations and you ensure they work
Is this enough?
Control Phase
211
Things often go back to where they were. It’s important to sustain the improvement. This is why we need good CONTROL
Control Phase
212
For good Control, we need to understand The Capability of our system Monitor this capability for shifts and drifts
Control Phase
213
Control charts
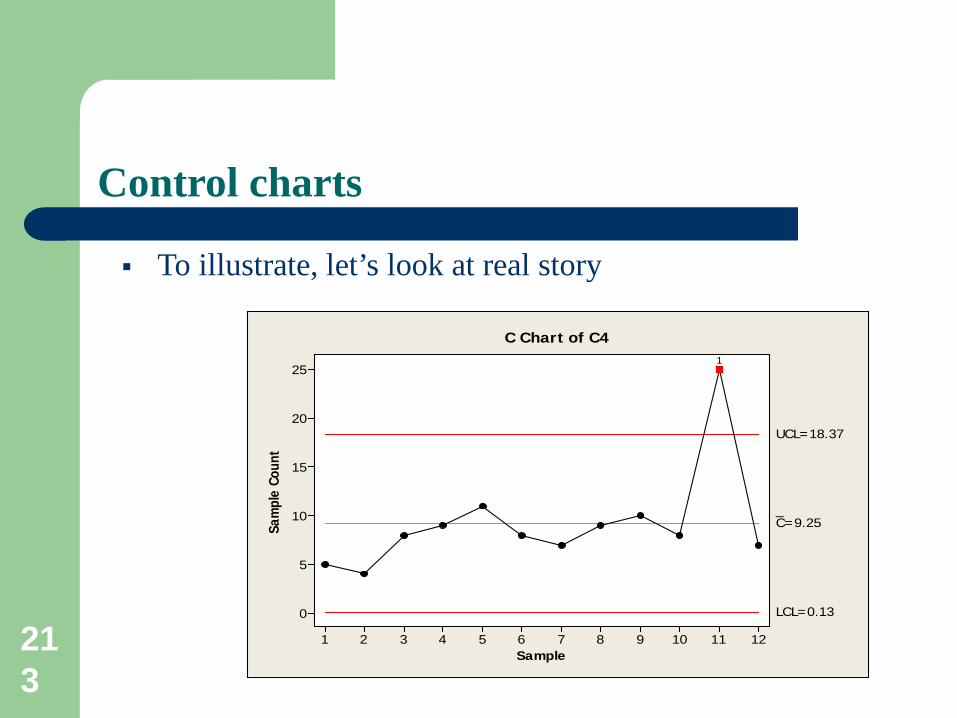
To illustrate, let’s look at real story
Sample
Sam
ple
Coun
t
121110987654321
25
20
15
10
5
0
_C=9.25
UCL=18.37
LCL=0.13
1
C Chart of C4
214
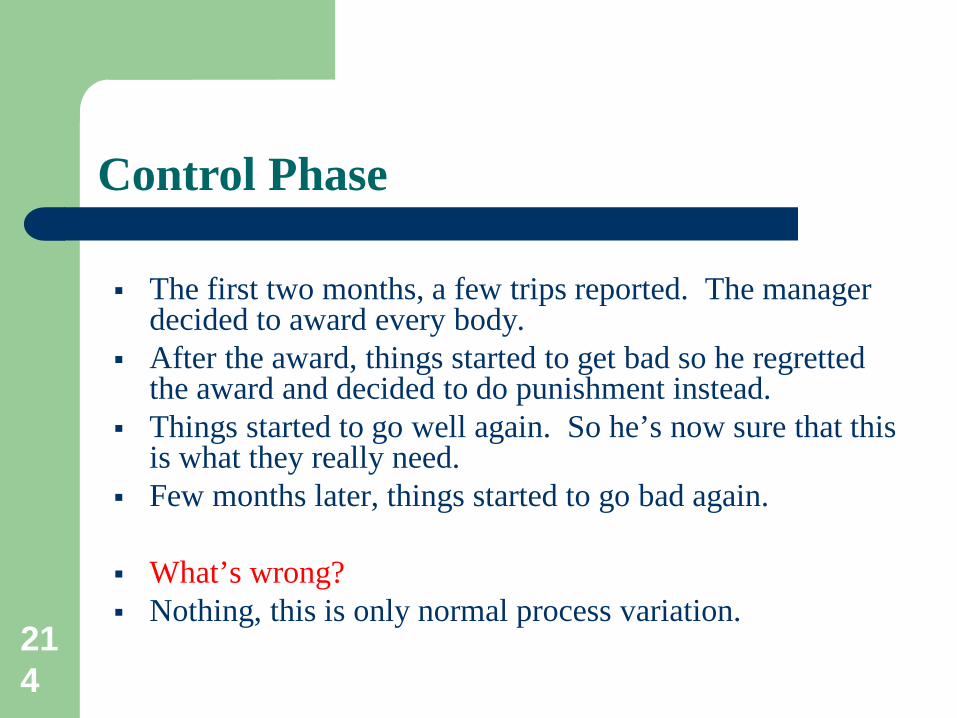
The first two months, a few trips reported. The manager decided to award every body.
After the award, things started to get bad so he regretted the award and decided to do punishment instead.
Things started to go well again. So he’s now sure that this is what they really need.
Few months later, things started to go bad again. What’s wrong? Nothing, this is only normal process variation.
Control Phase
215
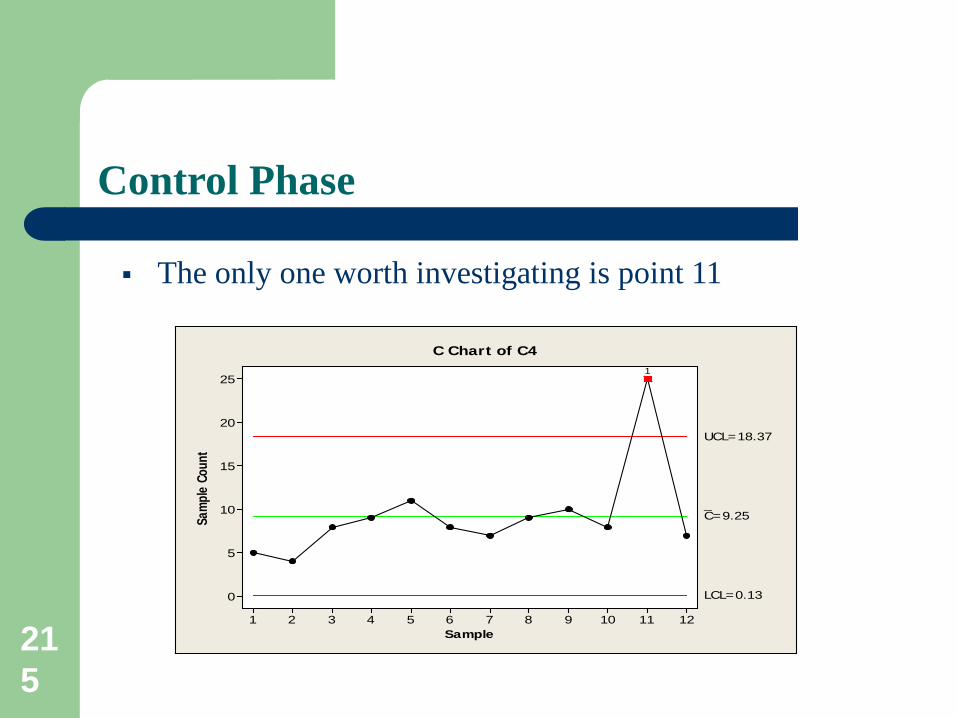
Control Phase
The only one worth investigating is point 11
Sample
Sam
ple
Coun
t
121110987654321
25
20
15
10
5
0
_C=9.25
UCL=18.37
LCL=0.13
1
C Chart of C4
216
After knowing the process capability, We need to put a control plan to ensure: Sustainability Controllable shifts and drifts
Control Phase
217
Control is into two elements Control Plan Control Charts
Control Phase
218
Control Plan: Provides Memory and a reference point to what is
being controlled Provides timely troubleshooting of process Documents project action items Control plan is a living document It ensures that a Six Sigma project is ready to be
implemented
Control Plan
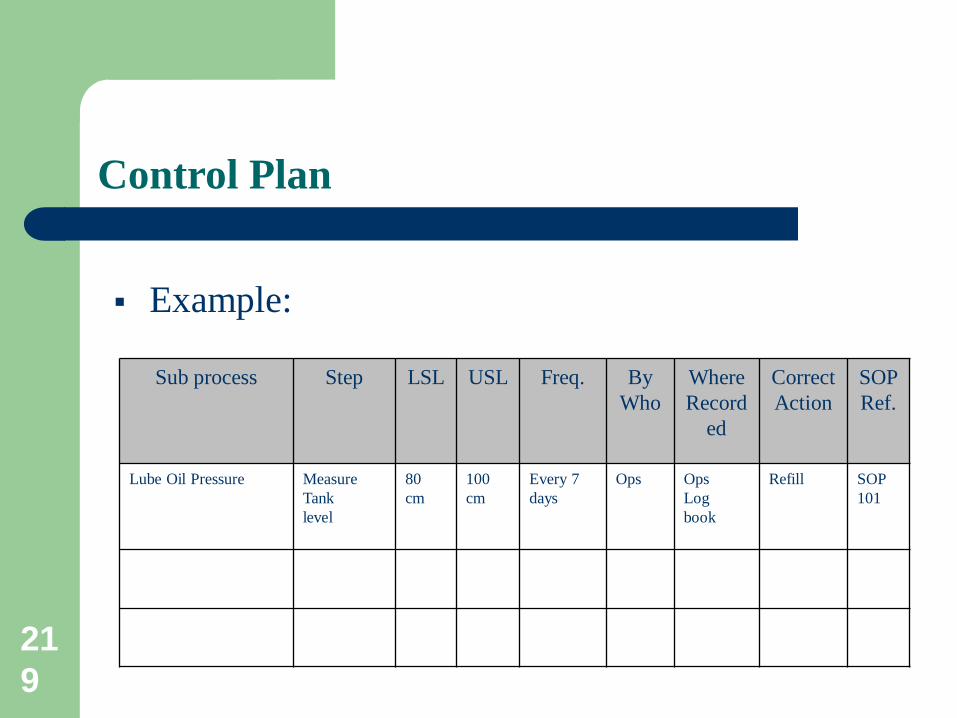
219
Sub process Step LSL USL Freq. By Who
Where Record
ed
Correct Action
SOP Ref.
Lube Oil Pressure Measure Tank level
80 cm
100 cm
Every 7 days
Ops Ops Log book
Refill SOP 101
Control Plan
Example:
220
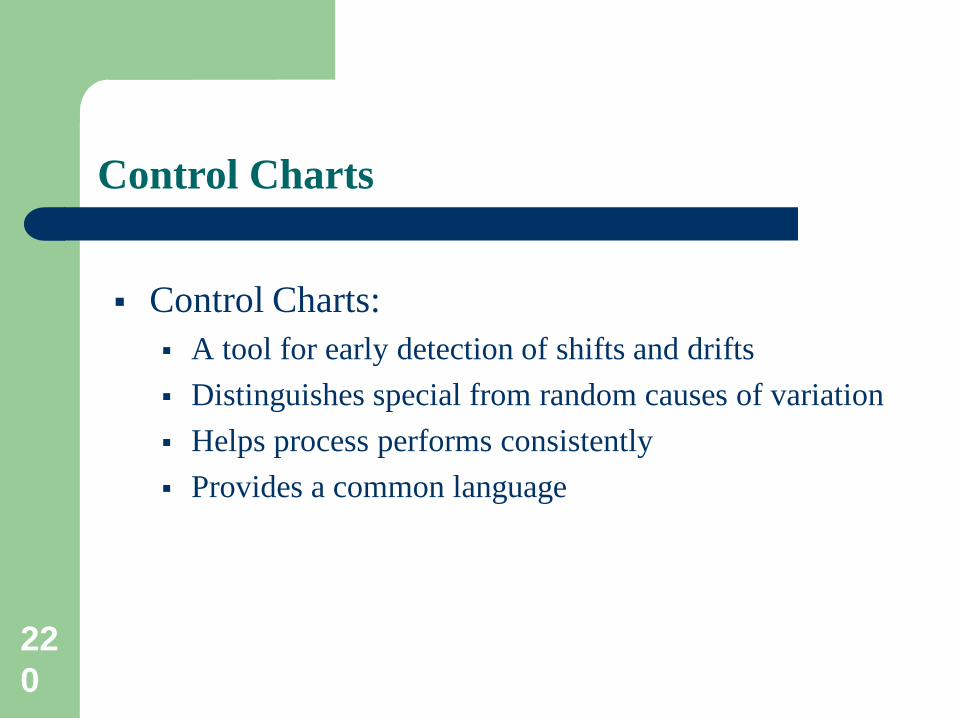
Control Charts: A tool for early detection of shifts and drifts Distinguishes special from random causes of variation Helps process performs consistently Provides a common language
Control Charts
221
Types of Control Charts: Many types We’ll discuss two
Control Charts
222
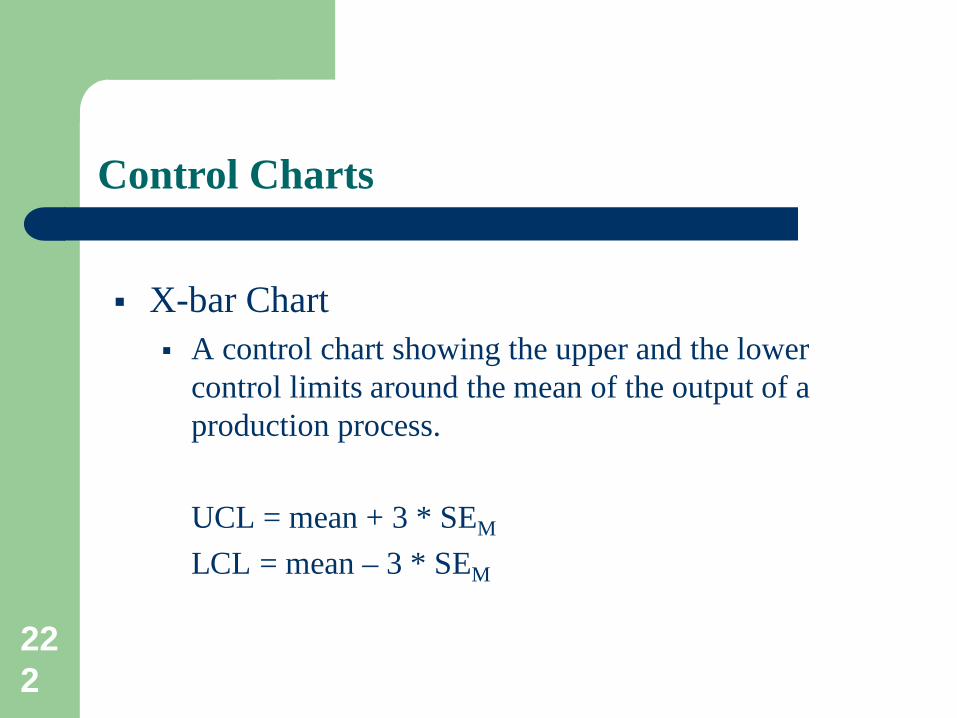
X-bar Chart A control chart showing the upper and the lower
control limits around the mean of the output of a production process.
UCL = mean + 3 * SEM
LCL = mean – 3 * SEM
Control Charts
223
Example The vibration levels at the inboard bearing have been
known to be 0.12 ips with a standard deviation of 0.04 ips. The reliability engineer collected a sample of 24 readings (every hour) for 7days.
What are the UCL and LCL.
X-bar Chart

224
Solution SE = 0.04/Sqrt(24) = 0.008 ips
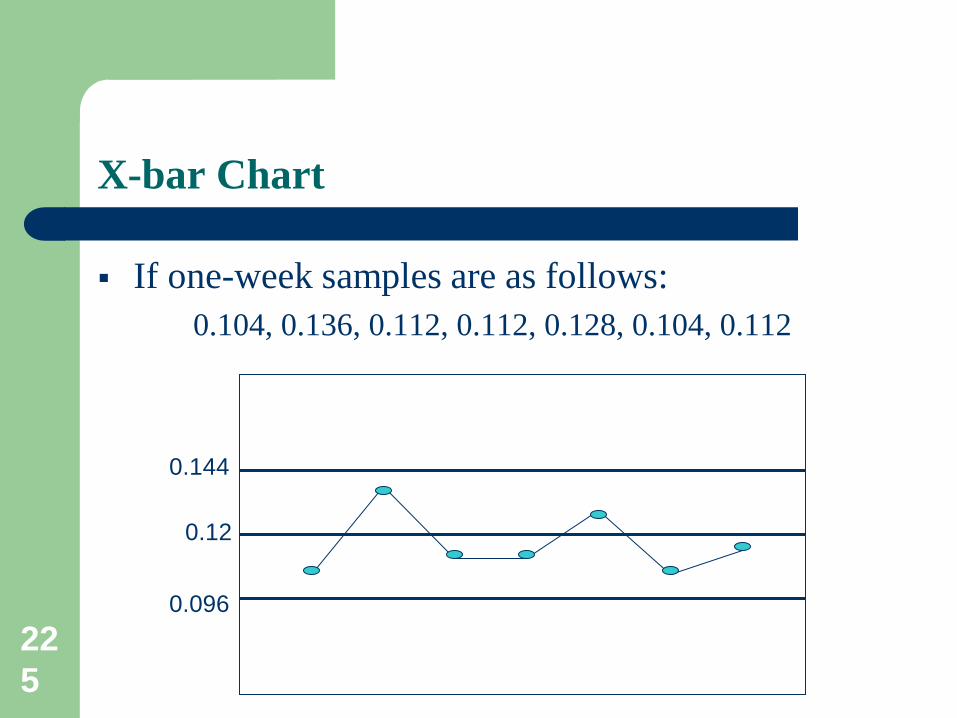
UCL = 0.12 + 3 * 0.008 = 0.144
LCL = 0.12 - 3 * 0.008 = 0.096
X-bar Chart
225
If one-week samples are as follows: 0.104, 0.136, 0.112, 0.112, 0.128, 0.104, 0.112
X-bar Chart
0.12
0.144
0.096
226
Six Sigma Infrastructure
Three possible ramps Business Transformation Approach
Full Scale and examines all key processes Break away from old habits Regain lost customers and heal from heavy losses
Strategic Improvement Approach Addressing a couple of key processes
Problem Solving Approach Tap into benefits without major change. Wherever
there is an opportunity, we will grab it.
227
Six Sigma Infrastructure
Once an approach is selected, collection of key personnel is charted Black Belts are responsible for leading the projects Green Belts are trained in a subset of the methodology Master BBs are experts and they coach BBs and GBs Champions select the projects and provide logistic Support &
sustain momentum Process owners take ownership of completed projects & maintain
gains Finance champions establish clear financial criteria and certify
savings. Tap into benefits without major change.
228
Six Sigma Infrastructure
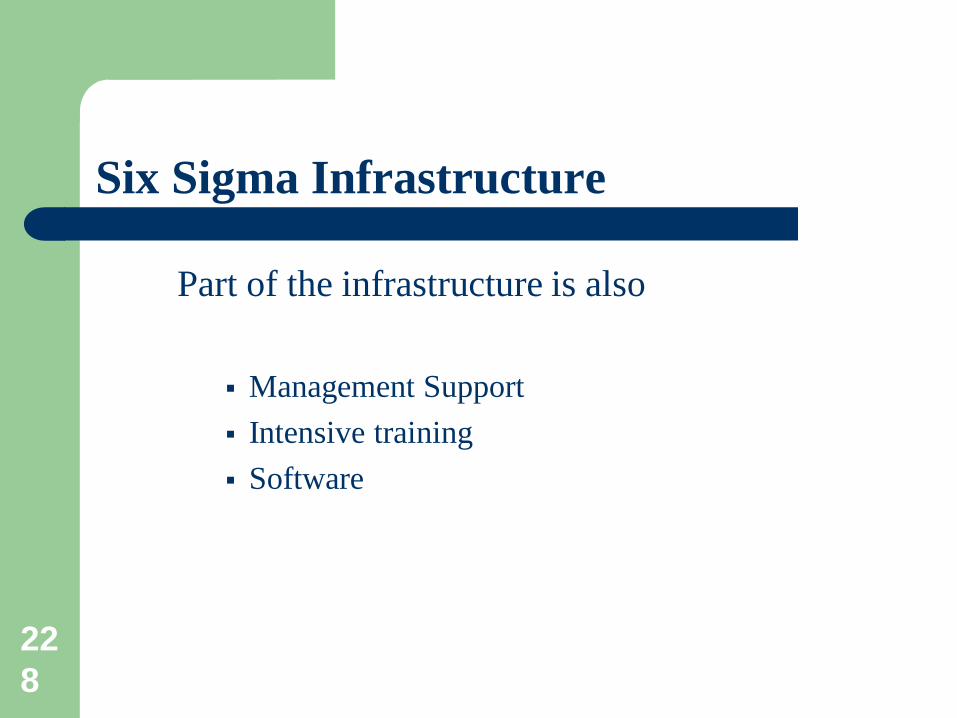
Part of the infrastructure is also
Management Support Intensive training Software