Embed Size (px)
Citation preview
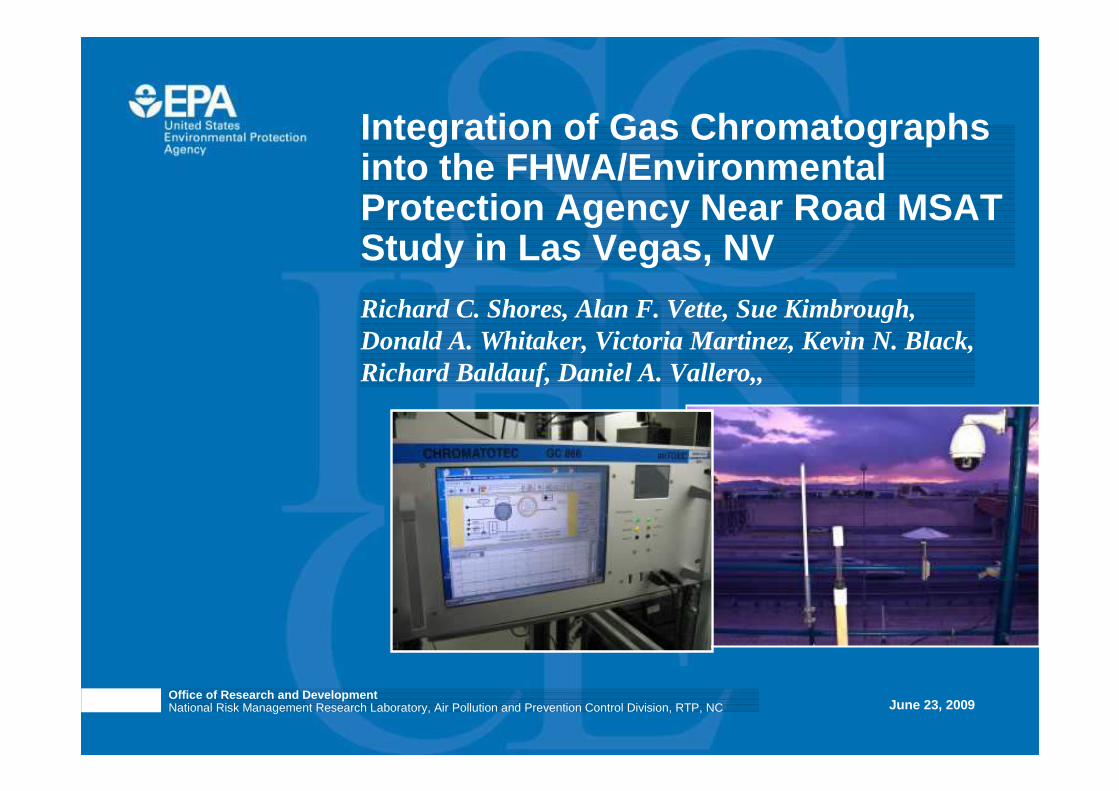
June 23, 2009Office of Research and DevelopmentNational Risk Management Research Laboratory, Air Pollution and Prevention Control Division, RTP, NC
Photo image area measures 2” H x 6.93” W and can be masked by a collage strip of one, two or three images.
The photo image area is located 3.19” from left and 3.81” from top of page.
Each image used in collage should be reduced or cropped to a maximum of 2” high, stroked with a 1.5 pt white frame and positioned edge-to-edge with accompanying images.
Richard C. Shores, Alan F. Vette, Sue Kimbrough, Donald A. Whitaker, Victoria Martinez, Kevin N. Black, Richard Baldauf, Daniel A. Vallero,,
Integration of Gas Chromatographs into the FHWA/Environmental Protection Agency Near Road MSAT Study in Las Vegas, NV
1
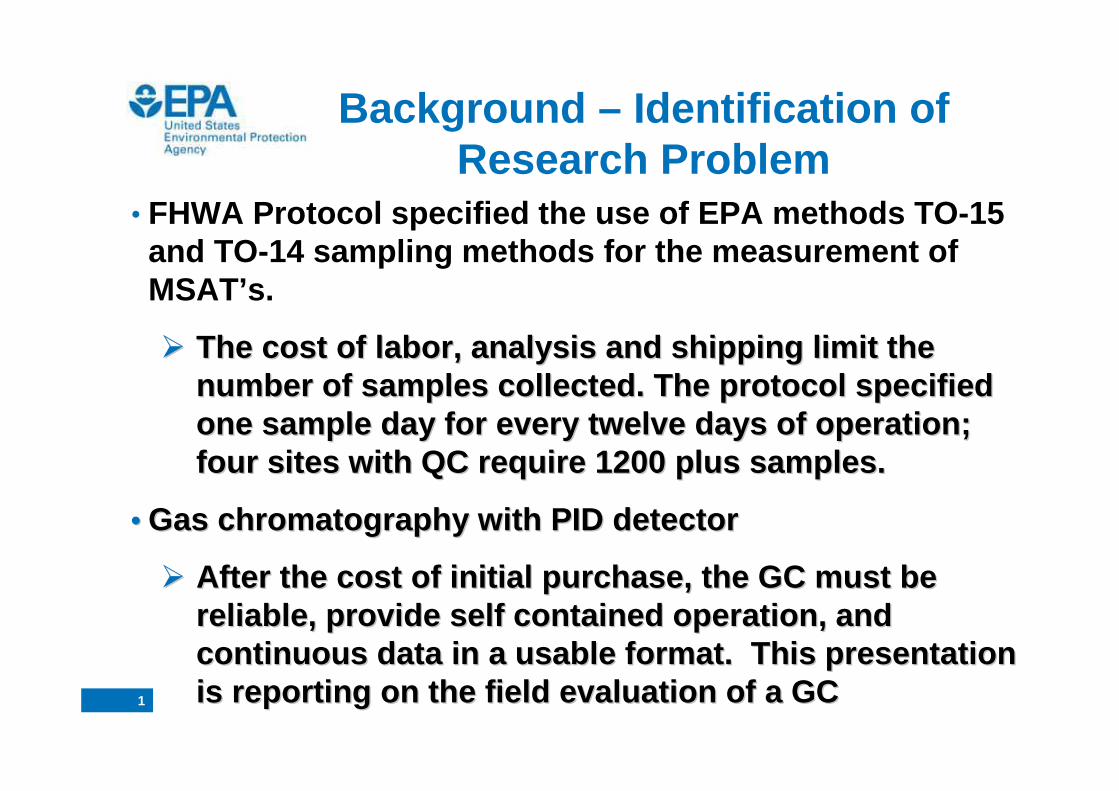
Background – Identification of Research Problem
• FHWA Protocol specified the use of EPA methods TO-1 5 and TO-14 sampling methods for the measurement of MSAT’s.
�� The cost of labor, analysis and shipping limit the The cost of labor, analysis and shipping limit the number of samples collected. The protocol specified number of samples collected. The protocol specified one sample day for every twelve days of operation; one sample day for every twelve days of operation; four sites with QC require 1200 plus samples.four sites with QC require 1200 plus samples.
•• Gas chromatography with Gas chromatography with PIDPID detector detector
�� After the cost of initial purchase, the GC must be After the cost of initial purchase, the GC must be reliable, provide self contained operation, and reliable, provide self contained operation, and continuous data in a usable format. This presentat ion continuous data in a usable format. This presentat ion is reporting on the field evaluation of a GCis reporting on the field evaluation of a GC
2
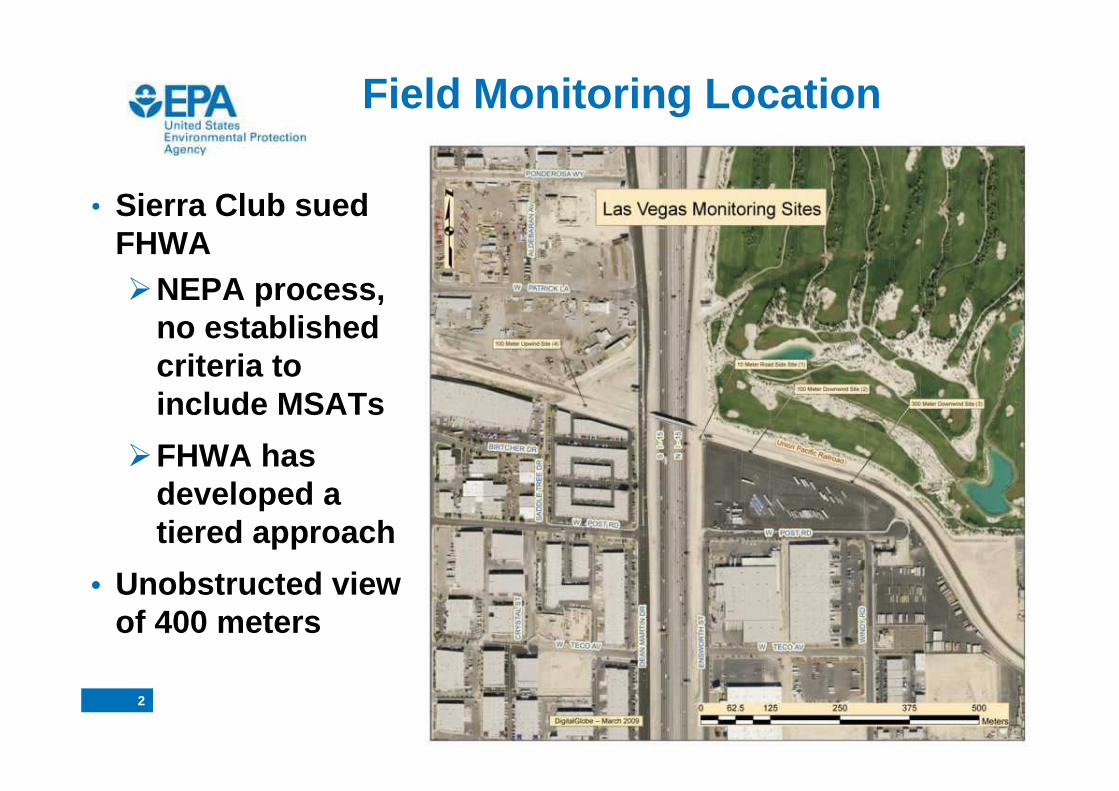
Field Monitoring Location
• Sierra Club sued FHWA�NEPA process,
no established criteria to include MSATs
�FHWA has developed a tiered approach
• Unobstructed view of 400 meters
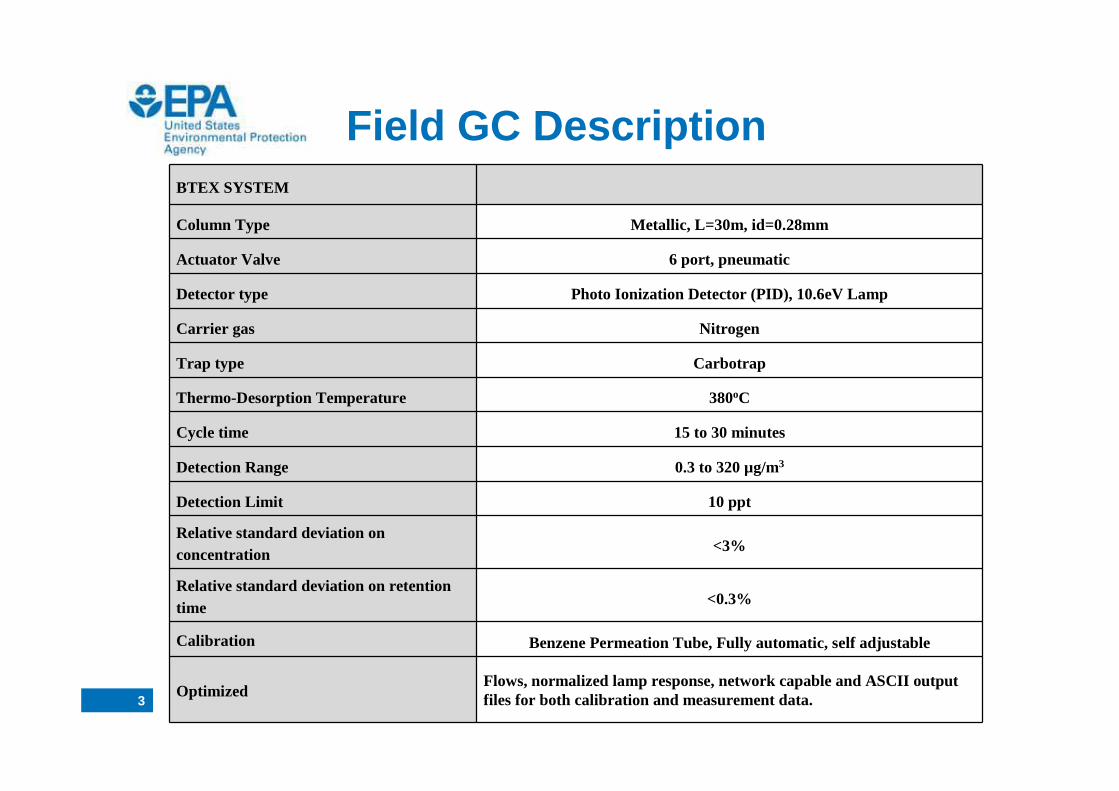
3Flows, normalized lamp response, network capable and ASCII output files for both calibration and measurement data. Optimized
BTEX SYSTEM
Column Type Metallic, L=30m, id=0.28mm
Actuator Valve 6 port, pneumatic
Detector type Photo Ionization Detector (PID), 10.6eV Lamp
Carrier gas Nitrogen
Trap type Carbotrap
Thermo-Desorption Temperature 380oC
Cycle time 15 to 30 minutes
Detection Range 0.3 to 320 µg/m3
Detection Limit 10 ppt
Relative standard deviation on concentration <3%
Relative standard deviation on retention time <0.3%
Calibration Benzene Permeation Tube, Fully automatic, self adjustable
Field GC Description
4
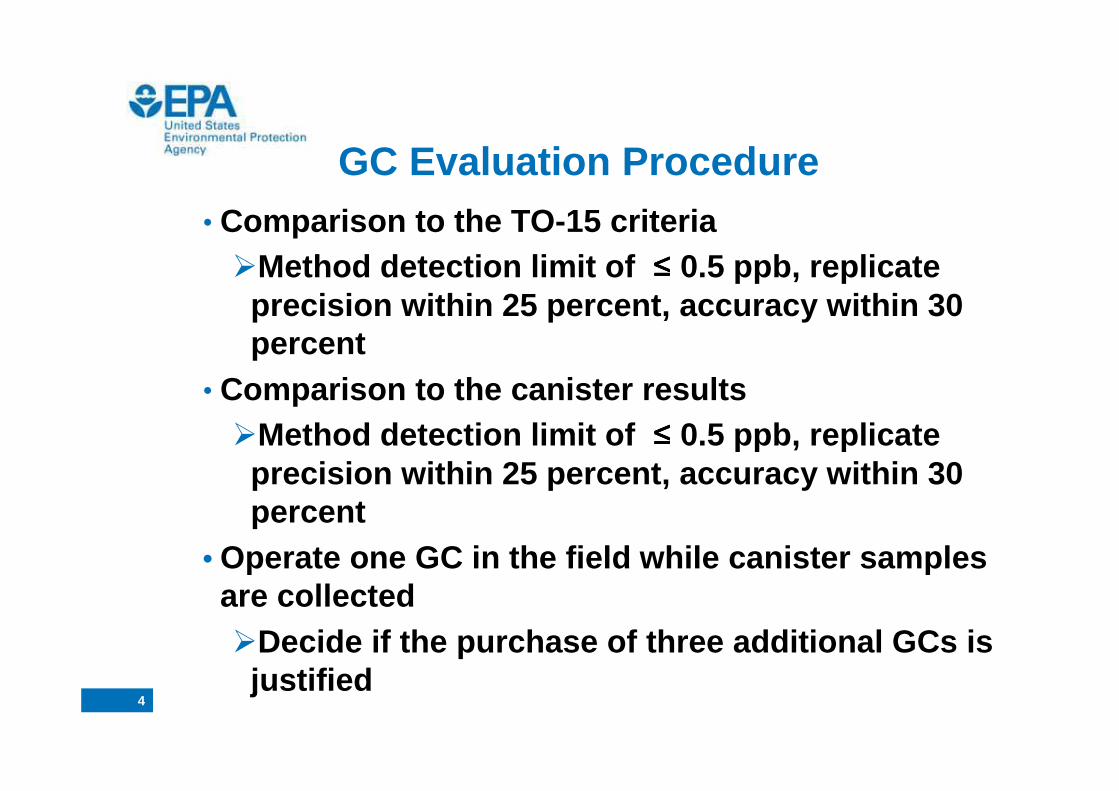
GC Evaluation Procedure• Comparison to the TO-15 criteria�Method detection limit of ≤≤≤≤ 0.5 ppb, replicate
precision within 25 percent, accuracy within 30 percent
• Comparison to the canister results�Method detection limit of ≤≤≤≤ 0.5 ppb, replicate
precision within 25 percent, accuracy within 30 percent
• Operate one GC in the field while canister samples are collected�Decide if the purchase of three additional GCs is
justified
5
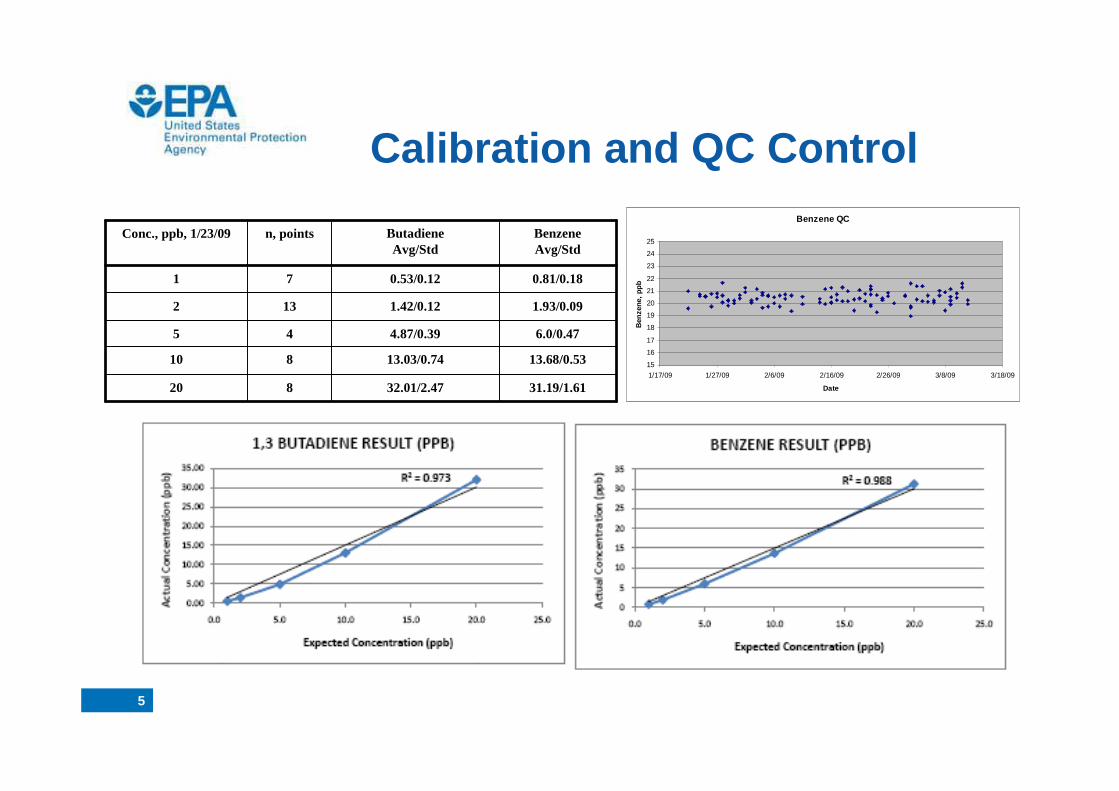
31.19/1.6132.01/2.47820
13.68/0.5313.03/0.74810
6.0/0.474.87/0.3945
1.93/0.091.42/0.12132
0.81/0.180.53/0.1271
BenzeneAvg/Std
ButadieneAvg/Std
n, pointsConc., ppb, 1/23/09Benzene QC
15
16
17
18
19
20
21
22
23
24
25
1/17/09 1/27/09 2/6/09 2/16/09 2/26/09 3/8/09 3/18/09
Date
Ben
zene
, pp
b
Calibration and QC Control
6
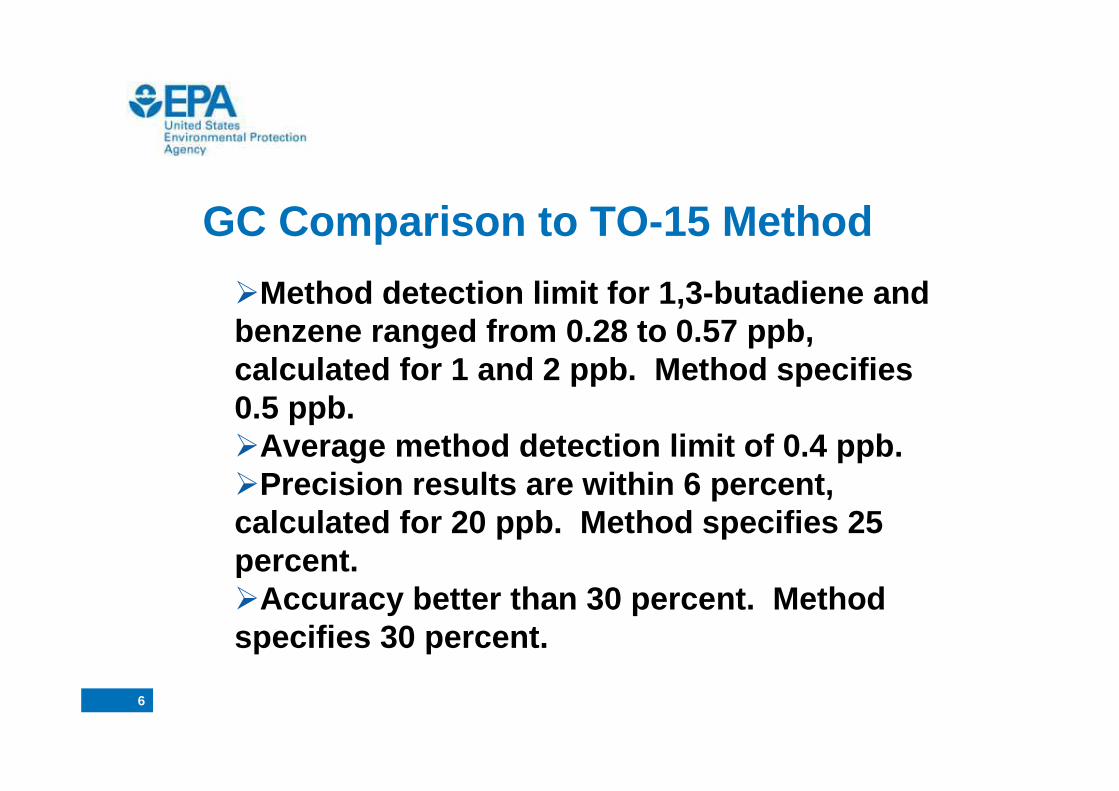
GC Comparison to TO-15 Method
�Method detection limit for 1,3-butadiene and benzene ranged from 0.28 to 0.57 ppb, calculated for 1 and 2 ppb. Method specifies 0.5 ppb.�Average method detection limit of 0.4 ppb.�Precision results are within 6 percent, calculated for 20 ppb. Method specifies 25 percent.�Accuracy better than 30 percent. Method specifies 30 percent.
7
0
200
400
600
800
1000
1200
1400
1600
1800
2000
01/1
5/09
01/2
7/09
02/0
8/09
02/2
0/09
03/0
4/09
03/1
6/09
03/2
8/09
04/0
9/09
04/2
1/09
05/0
3/09
05/1
5/09
Date
But
adie
ne, B
enze
ne,S
tyre
ne C
onc,
ppt
0.00
2.00
4.00
6.00
8.00
10.00
12.00
Tol
uene
, m- ,
p- ,
o-xy
lene
Con
c, p
pb
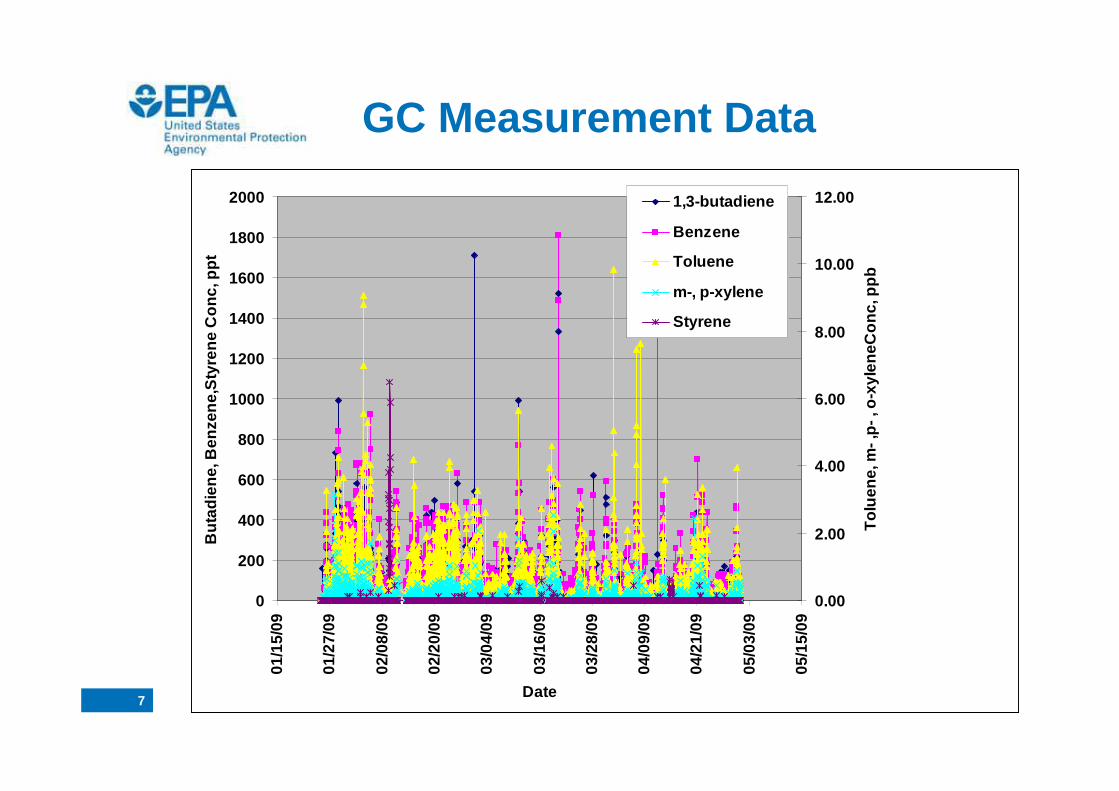
1,3-butadiene
Benzene
Toluene
m-, p-xylene
Styrene
GC Measurement Data
8
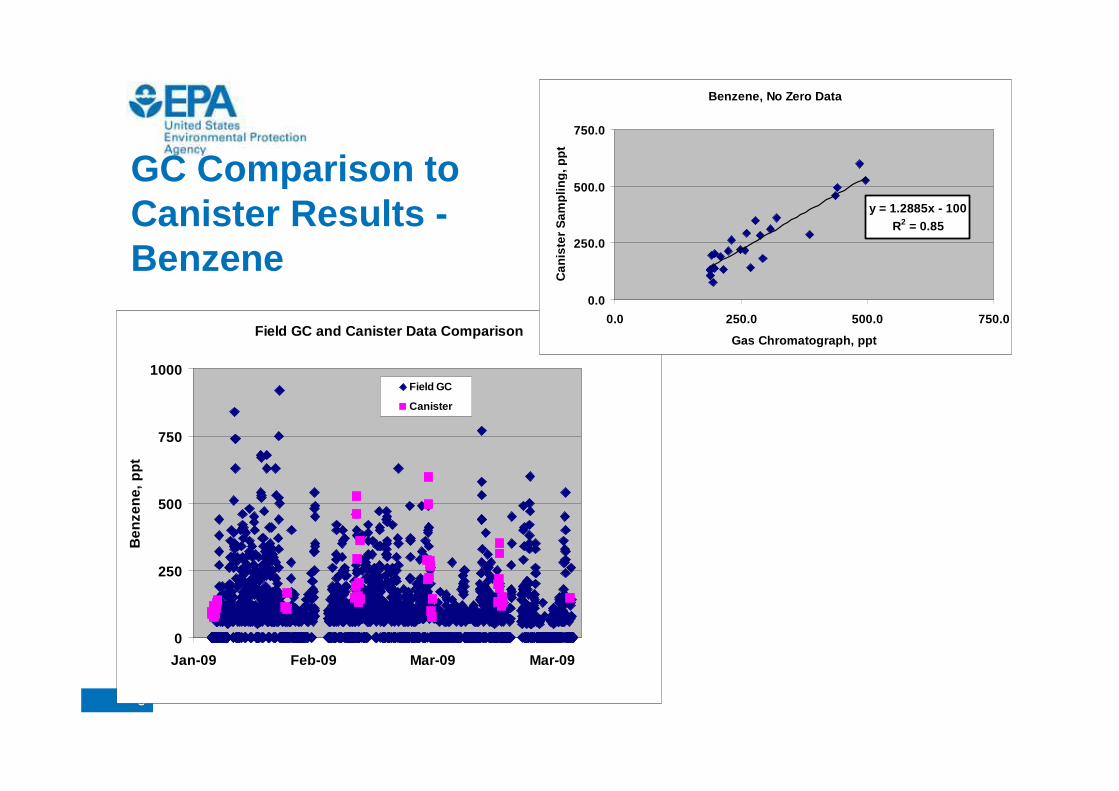
Field GC and Canister Data Comparison
0
250
500
750
1000
Jan-09 Feb-09 Mar-09 Mar-09
Ben
zene
, ppt
Field GC
Canister
Benzene, No Zero Data
y = 1.2885x - 100R2 = 0.85
0.0
250.0
500.0
750.0
0.0 250.0 500.0 750.0
Gas Chromatograph, ppt
Can
iste
r S
ampl
ing,
pptGC Comparison to
Canister Results -Benzene
9
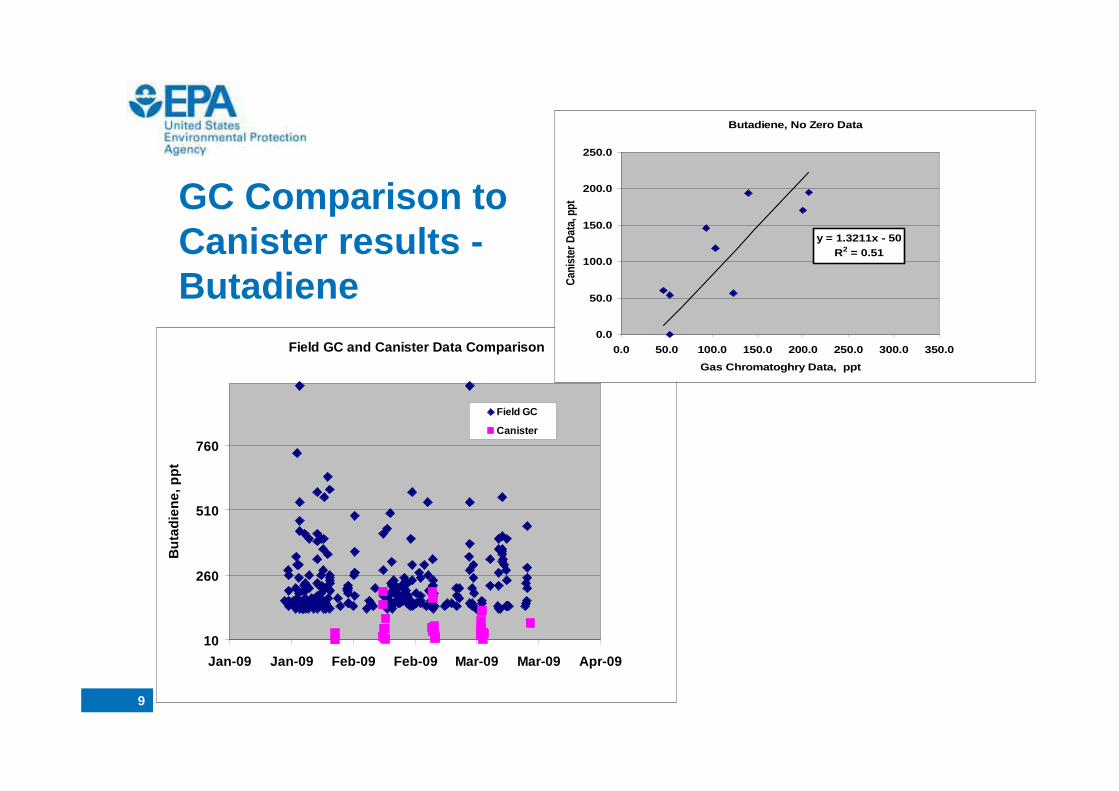
Field GC and Canister Data Comparison
10
260
510
760
Jan-09 Jan-09 Feb-09 Feb-09 Mar-09 Mar-09 Apr-09
But
adie
ne, p
pt
Field GC
Canister
GC Comparison to Canister results -Butadiene
Butadiene, No Zero Data
y = 1.3211x - 50R2 = 0.51
0.0
50.0
100.0
150.0
200.0
250.0
0.0 50.0 100.0 150.0 200.0 250.0 300.0 350.0
Gas Chromatoghry Data, ppt
Can
iste
r Dat
a, p
pt
10
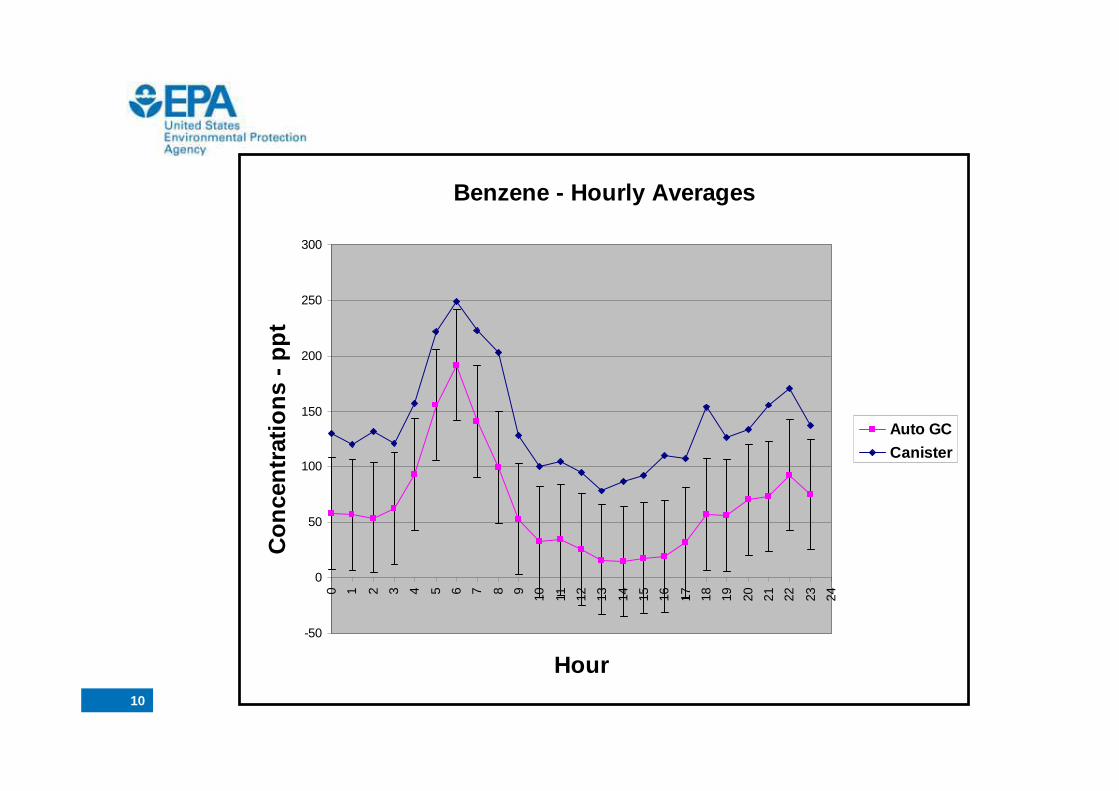
Benzene - Hourly Averages
-50
0
50
100
150
200
250
300
0 1 2 3 4 5 6 7 8 9 10 11 12 13 14 15 16 17 18 19 20 21 22 23 24
Hour
Con
cent
ratio
ns -
ppt
Auto GC
Canister
11
Canister Results Evaluation�Majority of the 1,3-butadiene and benzene concentrations have been less than 2 ppb
�Accuracy on average 30% for both butadiene and benzene
�Significantly more data, 43 canister samples versus 1200 benzene concentrations from the GC
�Canister method detection limit ~40 ppt and GC method detection limit ~ 100 ppt
�The GC has been operating for the past six months, unattended, data is down loaded remotely
�Three more GC’s are being purchased to install in the remaining three sites
12
• Acceptable comparison to the TO-15 method.• Acceptable comparison to the canister results.• Significant operational savings.• Continuous data – 30 min cycles.• Purchase and install GCs in the additional shelters.
• Continue canister sampling for QA/QC verification but reduce the number of samples taken.
GC Evaluation Summary
13
Acknowledgements
We thank Brian Schumacher and Jeffery Lantz of the EPA Las Vegas Facility for their continuing support of this project. We thank Michal Derlickiand the other ARCADIS staff along with the staff of Alion Science and Technology .


![[MS-RTP]: Real-time Transport Protocol (RTP) ExtensionsMS-RTP... · The Real-Time Transport Protocol (RTP) Extensions specifies a set of proprietary extensions to the base Real-Time](https://img.pdfslide.net/doc/110x75/5fcb11338738b8501a5201b4/ms-rtp-real-time-transport-protocol-rtp-extensions-ms-rtp-the-real-time.jpg)