Embed Size (px)
Citation preview

Integration of Legacy Appliances into Home
Energy Management Systems
Dominik Egarter, Andrea Monacchi, Tamer Khatib,and Wilfried Elmenreich
Institute of Networked and Embedded Systems
Alpen-Adria-Universitat Klagenfurt, Austria
{name.surname}@aau.at
June 13, 2014
Abstract
The progressive installation of renewable energy sources requires thecoordination of energy consuming devices. At consumer level, this coor-dination can be done by a home energy management system (HEMS).Interoperability issues need to be solved among smart appliances as wellas between smart and non-smart, i.e., legacy devices. We expect cur-rent standardization efforts to soon provide technologies to design smartappliances in order to cope with the current interoperability issues. Never-theless, common electrical devices affect energy consumption significantlyand therefore deserve consideration within energy management applica-tions. This paper discusses the integration of smart and legacy devices intoa generic system architecture and, subsequently, elaborates the require-ments and components which are necessary to realize such an architectureincluding an application of load detection for the identification of runningloads and their integration into existing HEM systems. We assess thefeasibility of such an approach with a case study based on a measurementcampaign on real households. We show how the information of detectedappliances can be extracted in order to create device profiles allowing fortheir integration and management within a HEMS.
1 Introduction
The transition of our energy system from non-renewable energy to sustainableand renewable energy sources takes place at various levels in the grid, includingconsumers at household level. Here, energy might be generated locally (e.g., viaa photovoltaic system) or usage can be optimized, reduced or shifted in order tomatch the energy demand to the current grid situation [1]. Therefore, the usageof devices with significant energy consumption must be coordinated. Carlson[2] shows that in American households 12 appliance types are responsible for
1
arX
iv:1
406.
3252
v1 [
cs.O
H]
12
Jun
2014

2 THE HEMS AT A GLANCE 2
80% of household electricity consumption, where white goods such as refrigera-tor, dishwasher and washing machine demand a higher amount of energy thanbrown goods (e.g., TV). At household level, this demands for a better coordi-nation of energy resources, aiming at lowering overall energy consumption andthus costs. To handle the coordination effort for a number of household deviceswith significant energy consumption, there is a need for a home energy man-agement system (HEMS) to automatically manage energy resources in buildingenvironments. Networking and operating the components of such a HEMS canbe difficult, since we have to cope with (i) smart appliances [3] from differentvendors, (ii) legacy appliances, i.e., non-smart, legacy devices without a controlor communication interface, and (iii) potential changes in the system due toaddition or replacement of devices.
This paper describes an open architecture for the integration of differentdevice types. In particular, we propose a layered model that allows to inte-grate legacy and smart devices and to represent them with an ontology-basedappliance and usage model. By adding a non-intrusive load monitoring (NILM)mechanism we approach the problem of legacy device integration with a detec-tion approach based on power measurements. This way, we present a completeand extendable HEMS solution providing the basis for energy management ap-plications such as advanced monitoring to increase energy awareness, insert-coinapplications to reduce energy consumption, and load shifting approaches to bet-ter utilize renewable energy sources or to take advantage of time-based tariffs.
Section 2 presents a system architecture describing the different interactingcomponents and mechanisms in a five-layer model, from electric layer up toapplication layer. Smart and legacy devices are handled by driver componentsthat provide a unified mapping of these devices to the upper layers. Section 3addresses privacy aspects within this architecture. Section 4 describes datamodeling and management within the architecture. The concept for a unifiedmodeling and representation of smart and legacy devices is explained in Sec-tion 5. Section 6 explains how a NILM approach allows for the identificationof legacy devices. Section 7 describes implementation experiences on the pre-sented approaches. Section 8 summarizes the main contributions to our HEMSarchitecture and concludes the paper.
2 The HEMS at a glance
A HEMS is a system of computing components that can be employed for op-timizing energy resources in building environments. Typically, a HEMS shouldbe able to collect consumption information of devices, as well as monitoringlocal production from renewable energy sources (e.g., photovoltaics). This sec-tion provides an overview of common components in a HEMS and introduces anovel HEMS architecture allowing for the seamless integration of heterogeneouscomponents.

2 THE HEMS AT A GLANCE 3
2.1 Components of a HEMS
Typical building blocks of home energy management systems are:
• Smart meter: The presence of a smart meter results in the possibility toincrease the resolution of consumption data. On one hand, this offers afeedback mechanisms to residents, who can get a better understandingof energy use in the building environment. Furthermore, energy can beprovisioned under adaptive prices, which can reflect the energy availablein the grid in order to keep the grid balanced. On the other hand, utilitiescan use demand data to improve the pricing and billing mechanism, aswell as to monitor the status of the grid and extract valuable knowledgethat can improve decision making.
• Smart appliances: A smart appliance is a device that embeds a computingunit and a network interface, which allows for the interaction with usersand other appliances. Smart appliances are aware of consumed power,based on local measurement units or built-in profiles [3]. In order to inter-operate with other devices in the network, smart devices need to providea machine-readable description of their features and properties. This way,smart building applications can be realized controlling distributed digitalsensors and actuators, which can dynamically join and leave the network.To cope with mobility and volatility of nodes, service discovery mecha-nisms are necessary A typical example is given by electric vehicles, whichare disconnected for use and eventually reconnected for charging.
• Legacy electrical devices: Although a smart building can be realized fromthe composition of intelligent devices, building management systems needto consider the presence of non-smart devices. A possible solution is toconnect sensing units to loads and track their consumption. So-calledsmart outlets and smart plugs form a network of distributed sensingnodes, which normally provide also the possibility to remotely switch loads(on/off). Since current market solutions do not support identification ofconnected loads, any processing of consumption data has to be done atapplication level.
• Home gateway: A residential gateway is used in building automation sys-tems to bridge the home network to the wide-area network. Thus, thegateway represents the connection point between the private network andthe internet, and as such, it plays a crucial role in ensuring security andprivacy. In addition, the gateway is also the point where interconnectionand interoperation between heterogeneous technologies takes place. Sub-networks using specific technologies, such as automation fieldbuses andZigbee networks, can be managed from the gateway in order to provide auniform interface to access resources. Beside the integration of networkeddevices working under different technologies and standards, the gatewayshould also allow for the integration of legacy devices.

2 THE HEMS AT A GLANCE 4
2.2 HEMS architecture
Figure 1 sketches an architectural model of a HEMS that integrates a loaddisaggregation unit to detect legacy appliances. In the architecture, specific
Application Application API
Device Stub
Context Device Profiles Environmental
Model
Driver1: Smart Appliance
Driver2: Smart Meter
Driver3: NILM
Service Interface
Network API
Power Line
Legacy Device
Supervisor Information flow
Logical connection
Power flow
Applica'on Layer
Data Layer
Service Layer
Network Layer
Electric Layer
Driver4: Smart Outlet
Network API
Data Manager
Figure 1: Overview of the HEMS architecture
driver components allows for the detection and management of sub-networks,thus acting as a proxy to integrate networked devices, smart devices and legacydevices. The model is implemented over the following 5 layers:
1. Electrical layer: Electrical devices are connected to a common local powerdistribution network. This layer allows devices to deal with electricalpower measurements. A classic meter works at this level.
2. Network layer: This layer provides network connectivity to embeddeddevices. A typical example is given by automation field-buses and wirelesssensor networks, such as building automation systems and wireless smartoutlets (e.g., ZigBee and WiFi). Management of the sub-network requiresa specific driver to interface it to the HEMS.
3. Service layer: In order to be automatically usable by other devices inthe network, smart devices are required to provide a machine-readabledescription of their features and properties. The service layer includes themechanisms by which devices can describe and advertise their features, sothat functionalities can be discovered and exploited by other devices [4].
4. Data layer: The data layer provides an abstract representation of data andfunctionalities managed by the individual drivers, by providing a homoge-neous interface to access this resource. This also includes the management

2 THE HEMS AT A GLANCE 5
of the device profiles, which are datasheets reporting static information ofdevices (e.g., sensor accuracy, type) and could be stored on the manufac-turer’s servers. In addition, a data model could be employed to perform abasic processing of raw data collected from the drivers, so as to produce amore abstract context representation, which can be stored in a knowledgebase.
5. Application layer: User applications are run in the application layer. Forinstance a decision maker might rely on the context representation storedin the data layer to react to environment changes. A query engine pro-vides an interface between the data and the application layer. On theother hand, the network API provides application-level interoperabilityto the architecture, thus representing a communication interface betweenapplications running on different computing environments.
With exception of the electrical layer, all layers could be implemented locally tothe building environment or on remote servers. For instance, a smart applianceis a device that embeds a computing unit and a network interface. In order tobe integrated in a HEMS a smart appliance should implement the first threelayers (electrical, network and service), although the device could scale to theapplication layer in case data management and decision making at appliancelevel were necessary.
A HEMS is required to deal with distributed resources, built by differentmanufacturers using different technologies. As seen, component-level interop-erability of networked devices can be achieved by separating the componentinterface from implemented functionalities. To achieve such a loose couplingbetween components in the architecture it is necessary to provide means for:
• Service discovery: A service is a self-contained collection of functional-ities that is homogeneously provided to users and applications. Servicediscovery concerns the discovery and naming of network entities so as toenable resource sharing. Generally, service advertisement can be done us-ing broadcast and multicast (e.g., ARP, UPnP), using centralised serviceregistries (e.g., DNS, LDAP, UDDI) or exploiting logical overlays suchas with distributed hash tables (e.g., Chord, Kademlia) [5]. An exten-sive overview of service discovery mechanisms for embedded systems isprovided in [6].
• Service description: Providing a simple interface to the service allowsfor encapsulation of the service complexity and operation. Services aredescribed in terms of their I/O interface: i) possible operations, ii) con-straints on data given and iii) communication protocol. To ensure formatinteroperability, service descriptions can rely on formats such as XML orJSON.
• Service coordination: Complex services can be built by combining indi-vidual services. The two main service composition approaches are service

3 PRIVACY ASPECTS 6
orchestration and service choreography. In the former, the overall dynam-ics are defined by an orchestrator component which controls the specificservice components. In the choreography approach the global goal of thesystem is implemented as local rules in the individual services. Choreog-raphy definition languages can be used to automatically generate rules forindividual services given the overall business process.
• Resource description: While the plug&play property [7] can be achievedfrom the description of computing components, data interoperability isstill an open issue. [8, 9, 10] suggest to semantically annotate sensor datausing principles of the semantic web and the linked data initiative. Besidethe Internet of linked documents, the initiative proposes the use of theResource Description Framework (RDF) to describe data in terms of rela-tionships. Specifically, in the RDF data model, the basic information unitis a 〈subject, predicate, object〉 triple. Data can be related to concepts de-fined in well-defined vocabularies (i.e., ontologies) so as to be interpretableby all entities sharing the same definition. The semantic sensor networkontology (SSN-XG) represents a step to this end. Ontologies for datamodeling in HEMS are presented in Section 4.1.
3 Privacy aspects
Privacy concerns arise from handling private information, as it might results intheft and alteration. Appliances act in a private environment and alteration ofconsumption and price information in demand response scenarios would entailmore than just discomfort on residents activities. Moreover, smart appliancesmight be delegated tasks from users to act on their behalf, for instance a smartfridge might be allowed to directly buy goods using a credit card. Besides, pri-vacy concerns arise from the increasing availability of fine-grained power con-sumption data in the context of smart metering. [11] reviews the impact onprivacy of different stakeholders, such as the energy utility, marketing/adver-tisement partners, creditors, the press, and criminals [12]. Energy consumptiondata allows for the extraction of usage patterns, describing time of use of devices,and leading to activity recognition and user profiling [13, 14]. An extreme ex-ample of the power of smart metering data analysis was shown in [15]. Therein,the authors have shown the possibility to identify multimedia content, such asthe program currently watched on the TV.
Load hiding techniques were presented to alter device operation so as to pre-serve privacy in households and ensure ownership of energy information. Thesetechniques can be divided into battery load hiding (BLH) and load based loadhiding (LLH) approaches [16]. BLH approaches obfuscates metering data usinga controllable battery. The battery is charged and discharged at strategic timesto flatten the household’s energy demand. In contrast, LLH uses controllableenergy-intensive loads to introduce noise in the daily overall household powerdraw and obfuscate metering data. For the purpose, devices used daily and

4 DATA MANAGEMENT 7
not directly operated by users are favoured in order to minimize the discomfortproduced by their altered operation.
4 Data Management
As seen in Sect. 2.2, HEMS can benefit of a data-driven abstraction. A datamanager is intended to provide a homogeneous interface to access static anddynamic data describing the environment (see Fig.1). This requires modelingthe environment in which the system operates, using a shared vocabulary toprovide semantics. Static information includes device profiles, reporting char-acteristics and functionalities, as well as usage models that can be exploited atapplication level. Dynamic information represents the environment state. Sen-sor measurements are represented abstract context representation that can beutilized by decision makers in a unified way.
4.1 Data Modeling
To achieve data interoperability between data producers and consumers it isnecessary to model both data and environment dynamics. Ontologies can beemployed as a unified approach to the semantic annotation of devices, processes,user preferences and activities. Typically, a HEMS requires the specification ofthe following domains:
• Building information: This includes modeling of the dwelling, such asbuilding geometry and insulation information [17].
• Building automation and device description: This includes service orien-tation [18, 19] and building automation [20].
• User information and preferences This includes living processes in termsof appliance operation and system settings (e.g., for thermal comfort) [21].
• Energy management: This includes modeling of energy generation, man-agement [22] and optimization through rule-based reasoning [23].
• Weather and climate modeling: This includes modeling of both climateand weather conditions, as well as weather forecasts [24].
• Measurement units and sensors: This includes sensor modeling [25], phys-ical phenomena [26], measurement units [27], as well as geographic infor-mation [28].
The use of an ontologies for interpretation of data reuse and integration ofexisting ontologies to extend the ontological framework to a large scale.

5 INTEGRATION OF LEGACY AND SMART APPLIANCES 8
4.2 Interfaces and Query Languages
The use of knowledge representation technologies in the semantic web con-text made tools for the description and retrieval of data widely available. TheSPARQL Protocol and RDF Query Language (SPARQL) is a query language tohandle data within the RDF framework, allowing for the addition, deletion, andmodification of data triples. As triples can be added or modified as consequenceto the arrival of specific events, SPARQL can also be used to perform complexevent processing, by defining rules and constraints over data using the SPARQLInferencing Notation (SPIN). While SPARQL was designed for static networks,such as the web, data collected in real environments tend to be high dynamicand demand for different query languages able to tackle such a volatily. Variousalternatives have been proposed: C-SPARQL, SPARQLstream, EP-SPARQL,and CQELS.
5 Integration of Legacy and Smart Appliances
In this section we identify the main requirements for the integration of electricaldevices within a HEMS. This includes the detection of operating loads and thedescription of sensed and inferred information using the technologies identifiedin the previous section.
5.1 Appliance proxy in the HEMS
The component providing a uniform representation of physical devices is theDevice Stub. The Stub acts as a proxy for remote devices, which are monitoredthrough NILM, sub-metered methods or directly connected through specificnetwork interfaces (e.g., smart appliances). This allows for keeping a locallymapped representation of remote objects, describing their characteristics andstatus. In this way, the information can be provided to the upper data manage-ment layer and combined to the environmental data (i.e., context) to be usedby applications. Information of smart devices can be directly retrieved throughthe network, whereas legacy devices need i) to be detected and distinguishedfrom the smart devices already known and ii) to be described in terms of adevice profile (static information) and status. At a service level, the applianceproxy can act as a collection of dummy smart appliances, by modeling theirinterface definition using a predefined structure, and making it available withinthe network.
5.2 Inferring appliance information from consumption data
Consumption data allows for the extraction of status information of electricalloads, thus giving the possibility to track consumption and build basic profiles.For instance, a profile could gather data representing operational states of thedevice, which can be characterized by the energy demanded. In addition, the

5 INTEGRATION OF LEGACY AND SMART APPLIANCES 9
Parameter Smart NILM ILMID 3 3 3
Type 3 ∼ 3Controllable 3 7 ∼
Current power 3 ∼ 3Energy per day 3 ∼ 3Appliance usage 3 ∼ 3
Table 1: Appliance parameters for smart and legacy appliances.
profile could also keep track of appliance usage in order to extract a model ofinhabitants to be used for energy management applications.
Modern HEMS can be equipped with appliance-level sensing units measur-ing consumption of connected loads. Another possibility to collect consumptiondata is provided by the increasing availability of smart meters. NILM is theproblem of identifying individual loads from the overall household power draw.Table 1 shows aspects that can be extracted using NILM compared to the onesexplicitly provided by smart appliances. In the table, intrusive load monitor-ing (ILM) represents the case in which a monitoring unit is connected to eachload. Clearly, the complexity of the ILM problem scales to a NILM problemwhen groups of devices (e.g., circuits) are monitored using the same unit. Whilea smart appliance can provide a complete description (3), load disaggregationcan only infer information related to the operation of appliances, with an un-certainty that depends on the used technology (∼). Moreover, NILM does notallow for appliance control. While a smart appliance can provide full control-lability, a smart outlet/plug (ILM) can provide only partial controllability ofloads. As indicated in [2] on American households, white goods are critical forthe success of demand response programmes. In order to tailor this approach tothe Central European area, the considered appliances are based on an analysisof Austrian and Italian households [29], which identified typical consumptionscenarios and formulated conservation strategies tailored to the region. Basedon these data, Table 2 lists important appliances that should be identified andintegrated in a HEMS, including smart and legacy devices detected throughNILM and ILM approaches. Devices are classified according to their control-lability and the presence of a user. Another aspect considered in the table isthe extent to which the device should be controlled within energy managementapplications. Many legacy devices such as stove, water kettle or microwave areuser-driven appliances and therefore, they are not good candidates for load con-trol. Furthermore, the possibility to switch on/off devices is not sufficient formanaging appliances where the starting point has to be scheduled, as smartoutlets/plugs cannot pause connected devices. For instance a washing machinecan not be controlled via a smart outlet because of its multiple operation states,that is, the device would stay in stop mode or start from the beginning whenthe power is restored. In conclusion, to optimize development and energy coststhe design of home energy management systems should consider the necessity

5 INTEGRATION OF LEGACY AND SMART APPLIANCES 10
Type Controllable User-dr. Tested Power [W]Fridge 3 - 3 {8, 80, 230}
Lightning 3 3 - -Dishwasher 3 3 3 {1900}
Oven - 3 - -Microwave - 3 - -
Hob - 3 - -Washing mach. 3 3 3 {190, 420, 1900}
TV - 3 3 {10, 160}Computer - 3 - -
Water Kettle - 3 3 {1750}Coffee Mach. - 3 3 {1280}Vacuum Clea. - 3 3 {1200}
Table 2: Relevant devices to be included into a HEMS.
of smart appliances. Selected appliances are the ones responsible for most ofdemand, as presented in Table 2.
5.3 Management and representation of appliance data
The proposed approach considers the management of contextual information,which encompasses both static and dynamic data, such as appliance models andsensor data collected across the physical environment. A first aspect to consideris the format and locality of such data, in order to provide applications with aunique representation for data access. Context information can be maintainedlocally to the building or managed by a context provider acting as trustworthyintermediator to application providers [10]. As shown in 4.1, ontologies canbe used as shared vocabularies to model data and allow for interoperabilitybetween different entities. This means that the agreement of shared vocabulariesis fundamental to extend the data management framework to a wide scale. Weare focusing on the integration of legacy and smart electrical devices, and tothis end it is necessary to model the following aspects:
• Measurement values: Dynamic data includes time varying information,such as measurement data collected from the physical environment. Man-aging this kind of data requires copying with different requirements. Firstof all, the load disaggregation component deals with time series repre-senting power profiles. As the memory required is directly proportionalto the sampling frequency, alternative representations such as event-basedmodels should be considered. For example, storing edges of the signal,i.e. changes of power exceeding a device-dependent threshold helps re-ducing the memory consumption to handle time series where the highestfrequencies are sparsely present However, introducing a threshold con-stitutes a trade-off between information and memory used, as selectinga large threshold leads to coarse grained data and high information loss

5 INTEGRATION OF LEGACY AND SMART APPLIANCES 11
which complicates the reconstruction of the signal. Consequently, thethreshold impacts the effectiveness of NILM algorithms and therefore ofthe whole interoperability process.
• Appliance profiles: Appliance characteristics are critical for the integra-tion of devices, including both interface description and load disaggrega-tion. Manufacturers of smart appliances could provide appliance profiles(i.e., datasheets) describing the device within the communication network.Information such as manufacturer, type, energy rating and user control-lability can be provided beforehand. As an alternative, profiles could beprovided by a certified trustworthy entity (e.g., profile provider) or anno-tated by residents and shared via a common platform
An appliance profile (see Fig. 2) describes the operation of an electricaldevice, by defining its electrical characteristics. Electrical devices oper-ate in the physical environment, offering a physical service. A physicalservice defines the operation of the device for a specific task, such as acertain washing cycle for a washing machine. This includes the signaturedescribing the operation of the device, as well as the energy demandedand the current status. Here we distinguish between devices with perma-nent consumption, such as fire alarms, and devices, which can operate inmultiple states. It is important to remark that device profiles allow forthe management of appliances. Accordingly, a state is defined in termsof peak active power, tolerance to power variations, duration, and twodiscomfort factors: i) a delay sensitivity (in seconds) determining the re-sponsiveness of the device and ii) an interruption sensitivity (in seconds)describing the tolerance to interruptions of the state. For instance, thestart of a coffee machine should not be postponed from its request becauseof an extremely low delay sensitivity, while its water heating state shouldnot be interrupted because of a low interruption sensitivity. The statusof a service describes the operation (i.e., on, off, or paused), as well as itsprogress in terms of start time and elapsed duration.
Furthermore, smart appliances might expose a virtual service within anetwork, for instance to retrieve temperature values. A virtual service ishence described as a reference to a machine-readable interface. A smartappliance may implement various M2M technologies to provide both phys-ical, virtual and smart services.
As seen in Section 5.2, a load disaggregation unit can extract informationof detected appliances in order to build appliance profiles. In this way,applications can seamlessy access device information for both smart andlegacy devices.
• Appliance identification models: In order to detect running devices, theload identification component needs to deal with appliance models describ-ing the behavior of devices through a set of observable states. For instance,an appliance model can be defined using state-based representations suchas Finite State Machine (FSM) and Hidden Markov Model (HMM), which

5 INTEGRATION OF LEGACY AND SMART APPLIANCES 12
Appliance Type
Cleaning Device
Entertainment Device
Kitchen Device
Office Appliance
Cool Appliance
Transporta:on Device
Laundry Appliance
Energy Ra:ng
Energy Ra:ng US Energy Ra:ng Oceania
Energy Ra:ng Europe
Energy Ra:ng Canada
State
Signature
Permanent Device Signature
Model Based Device Signature
Service Physical Service
Virtual Service Smart Service
Status
Appliance Smart Appliance Transi:on
Load Iden:fica:on Model
Observa:on
Feature
Steady State Feature
Voltage
Current
Power
Ac:ve Power
Reac:ve Power
Apparent Power
Appliance Model
Appliance Profile
Figure 2: Taxonomy of appliance description and model
model the appliance dynamics as a trajectory of state transitions over time.Specifically, each device observation is described by a set of features, suchas current and power, as well as outgoing transitions to other observablestates. In addition, certain models can also express the typical durationof a device observation (e.g., Hidden Semi-Markov Models (HSMM)). Tomodel device dynamics, transitions connecting two observations are gener-ally associated to a transition probability. Fig. 3 reports the ontology forelectrical appliances, showing both the device profile and the load identi-fication model.
• Appliance usage models: The problem of mining appliance usage patternsconcerns the extraction of models of how appliances are used by residents,given a sequence describing changes on their operational state. Givenlogged data describing status changes of appliances, representing relation-ships between the usage of different devices can be solved by data miningalgorithms. In [30], we apply Bayesian network to learn the usage modelof a coffee machine based on real consumption data. As models strictly de-pend on end-user applications, their construction and management needsto be done at application level. The details of applying data mining forgenerating appliance usage models is beyond the scope of this paper.

6 APPLIANCE DETECTION AND CLASSIFICATION 13
Appliance Type
Energy Ra0ng
Appliance
Load Iden0fica0on Model
Service
Virtual Service
Physical Service Signature
Model based Signature
Status
State
Observa0on
Feature
Transi0on
hasType
hasEnergyRating hasLoadIdentificationModel
hasS
ervic
e
string
Boolean
hasManufacturer
Boolean
isUserDriven
isControllable
string
hasDescription
string
hasName
string
hasM2MInterfaceLocation
double
hasConsumption
hasStatus
hasStatus
hasStateModel
int
hasDelaySensitivity
int
hasOrder int
hasInterruptionSensitivity
double
hasPeakPower
int
hasS
tate
Dur
atio
n int
hasWorkingPowerTolerance
int
Integer hasUnixStartTime
hasElapsedDuration
hasCurrentState
hasInitialObservation
hasFeature
string
double
hasObservedValue
hasMeasurementUnit
hasTransition hasNextObservation
double
hasTransitionProbability
int
hasObservationDuration
class
property
subclass
Object property
Datatype property
Figure 3: Ontology of appliance description and model
6 Appliance detection and classification
To monitor and integrate legacy devices into a HEMS, we can distinguish threemonitoring and detection possibilities: a single meter approach (NILM), a mul-tiple meter approach at device level (ILM) and a multiple meter approach fordevice groups.
6.1 Non-intrusive load monitoring - NILM
NILM is the problem of disaggregating running loads from overall consumptiondata. NILM is a single-meter approach. The approach was first introduced byHart [31]. The method detects running appliances according to specific char-acteristics of their power signature. State-of-the-art NILM algorithms can bedistinguished into supervised and unsupervised approaches. Supervised tech-niques are based on labeled data and can be divided into optimization andpattern recognition based algorithms. In the latter case, the NILM problemis considered as an optimization problem: a total power consumption and adatabase of known power profiles of appliances are given. A composition ofdevices’ power profiles are chosen from the database to approximate the to-tal power consumption with minimal error [32, 33, 34]. Pattern recognitiontechniques include clustering approaches [31], Bayesian approaches [35], neuralnetworks algorithms [36] and support vector machines [36, 37]. The disadvan-

6 APPLIANCE DETECTION AND CLASSIFICATION 14
tage of supervised learning and classification is the need of labeled data duringa training phase, which implies greater development costs and effort. Lately,recent research in load disaggregation is focusing on unsupervised algorithms.Unsupervised algorithms are not using any labeled data and consequently, notraining phase. Recent NILM algorithms are based on k-means clustering [38],Fractional Hidden Markov Model (FHMM), and its variants [39, 40, 41, 42].State-of-the-art NILM approaches are highly dependent on the used samplingfrequency and have several limitations. According to [43], it is possible to de-tect approximately 10 different appliances with a sampling frequency of seconds.The higher the sampling frequency, the more meaningful are the device featuresand the more accurate is the appliance classification. Currently, there exists noload disaggregation technology which can solve the problem in all its aspects.Open challenges and limitations are:
1. Noise interference: presence of noise, which is typical to a measurementprocess, affects the quality of extracted device features;
2. Appliance modelling: differences in type, characteristics and manufacturermake the modeling of devices more complex. This means that a modelof a washing machine does not allow a load disaggregation algorithm tocorrectly detect another type of washing machine with different charac-teristics.
3. The quality of extracted features is directly proportional to the samplingfrequency [43].
4. Similar appliance features: different appliance types can behave in a sim-ilar way which makes it difficult to distinguish between them. Therefore,more advanced appliance characteristic features are needed.
5. Unknown appliances in the power draw add uncertainty to the disaggre-gation process.
6. Degree of overlapping power draws: concurrently operating devices im-ply overlapping power profiles. Therefore, their number determines thecomplexity of the classification process.
7. Unpredictable appliance usage: user behaviour introduces further uncer-tainty to the disaggregation process. Resident’s habits, such as time ofuse and typical duration, tend to be user specific.
8. Unknown number of appliances: the number and types of appliances usedvary from home to home.
9. Computational complexity: Each approach has different computationaland complexity costs, which have to be considered for the specific appli-cation purpose [44].

6 APPLIANCE DETECTION AND CLASSIFICATION 15
A disaggregation technique should be selected considering both application andhardware costs, as depending on the selected technique, different limitations andrestrictions arise. Zeifman suggests in [35] that a load disaggregation solutionshould fulfill the following requirements:
• Power measurements with 1 Hz sampling frequency;
• The minimum acceptable accuracy is 80 to 90%;
• No training should be necessary;
• Real-time capability should be provided;
• 20 to 30 appliances should be detectable;
• It should work with different appliance types, such as on/off appliances,multi-state appliances, continuous appliances, as well as permanently op-erating ones [45].
6.2 Multiple-meter load monitoring
The sub-metered approach is intrusive (ILM) as it requires the connection toeach device of a monitoring unit, such as a smart outlet/smart plug. Device iden-tification can be performed both by humans, who can specify the type of eachconnected device, as well as inferred from collected data using the techniquespresented in Section 6.1. The presence of device-level consumption informationfacilitates the appliance classification problem, as the search space is reducedto fewer connected devices [46, 47]. This allows for a hierarchical load disag-gregation, where results of load disaggregation on appliance groups monitoredwith ILM can be combined to obtain the overall solution to device classification[48]. The disadvantage of using multiple meters is the resulting cost for thesensing units, which add an overhead for the collection of the data, as well asmaintenance costs.
6.3 Extracting load identification models
The load identification component requires models describing the operation dy-namics of electrical devices. Models can be obtained based on a priori informa-tion or can be extracted online from measurements. An example for buildingappliance models was firstly presented in [31]. This approach clusters applianceevents according to active and reactive power to build a finite state machine ofthe appliances. Another approach was presented by Dong [49]. Major residen-tial load signatures are extracted and can be used for NILM and load conditionmonitoring. Beside extracting load signatures and building appliance models,Parson [50] uses a general appliance knowledge to disaggregate appliances fromthe metering data. Recent research on appliance modeling is based on proba-bilistic graphical models, as they are able to capture both appliance bahaviors,structures and features (e.g.: on/off appliances or multi-stat appliances) as well
7 IMPLEMENTATION EXPERIENCES 16
as user’s behavior expressed in a probabilistic way. The HMM is commonlyused to model appliances, while variants are employed to incorporate time andother elements. For example [51] uses a semi-HMM to represent more realisticappliance usage models, whose transitions are not geometrically distributed.
7 Implementation experiences
7.1 Particle Filter based Load Disaggregator
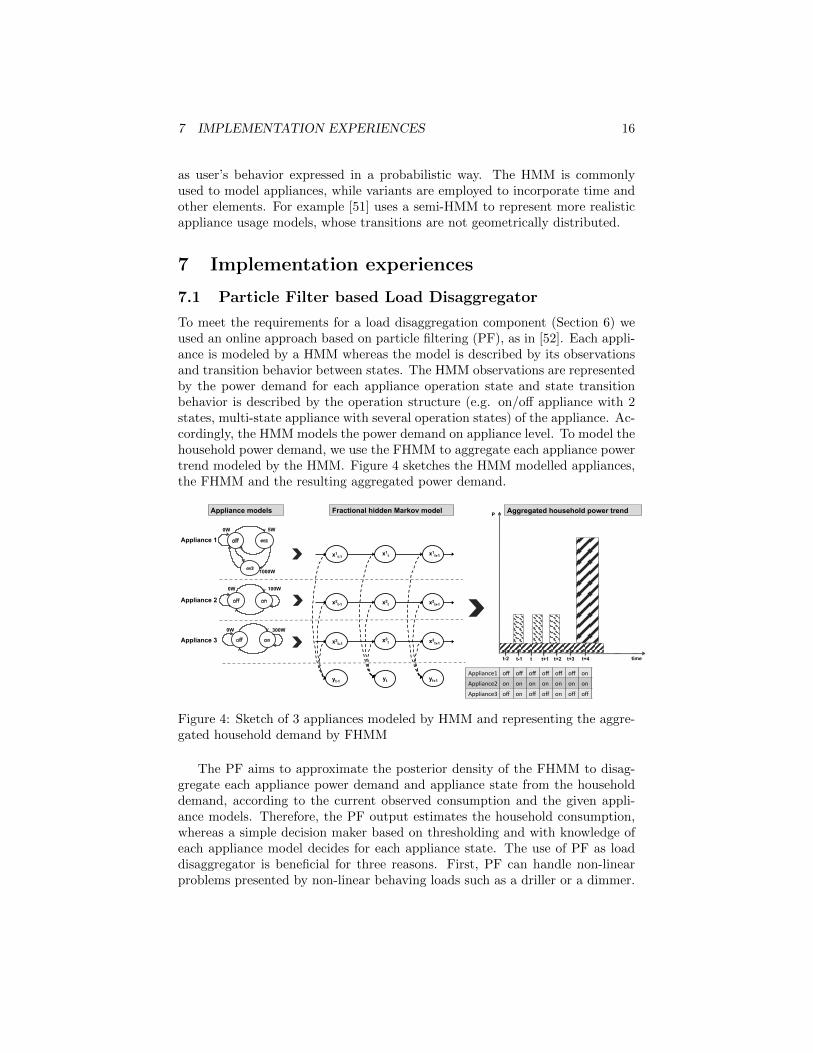
To meet the requirements for a load disaggregation component (Section 6) weused an online approach based on particle filtering (PF), as in [52]. Each appli-ance is modeled by a HMM whereas the model is described by its observationsand transition behavior between states. The HMM observations are representedby the power demand for each appliance operation state and state transitionbehavior is described by the operation structure (e.g. on/off appliance with 2states, multi-state appliance with several operation states) of the appliance. Ac-cordingly, the HMM models the power demand on appliance level. To model thehousehold power demand, we use the FHMM to aggregate each appliance powertrend modeled by the HMM. Figure 4 sketches the HMM modelled appliances,the FHMM and the resulting aggregated power demand.
100W 0W
300W 0W
5W 0W
1000W
x1t-1! x1t! x1t+1!
yt-1! yt! yt+1!
x2t-1!
x3t-1!
x2t!
x3t!
x2t+1!
x3t+1!
P
time t-2 t-1 t t+1 t+2 t+3 t+4
Appliance 1
Appliance 2
Appliance 3
Appliance1 off off off off off off on
Appliance2 on on on on on on on
Appliance3 off on off off on off off
Appliance models Fractional hidden Markov model Aggregated household power trend
Figure 4: Sketch of 3 appliances modeled by HMM and representing the aggre-gated household demand by FHMM
The PF aims to approximate the posterior density of the FHMM to disag-gregate each appliance power demand and appliance state from the householddemand, according to the current observed consumption and the given appli-ance models. Therefore, the PF output estimates the household consumption,whereas a simple decision maker based on thresholding and with knowledge ofeach appliance model decides for each appliance state. The use of PF as loaddisaggregator is beneficial for three reasons. First, PF can handle non-linearproblems presented by non-linear behaving loads such as a driller or a dimmer.

7 IMPLEMENTATION EXPERIENCES 17
Second, it can handle non-Gaussian noise influences resulting from uncertaintyin power trends and consumption data. Third, PF and its performance can beadjusted by the number of used particles. The more particles the PF considers,the better the estimated posterior density. Nevertheless, we want to point thatthe number of particles can not be chosen arbitrarily due to the computationaleffort of the approximation process. We empirically identified 1000 particlesas an appropriate number balancing the trade-off between the context of com-putational effort and detection performance for a typical household with ∼ 20relevant devices. In the following evaluations, on/off and multi-state appliancesare considered whereas the PF has the knowledge of the model structure (two ormore operating states) and the expected power demand as observation for eachstate. Knowledge of the transition matrix values is not necessary since the PFis independently estimating the appliance states with an appropriate number ofused particles.
7.1.1 Dataset
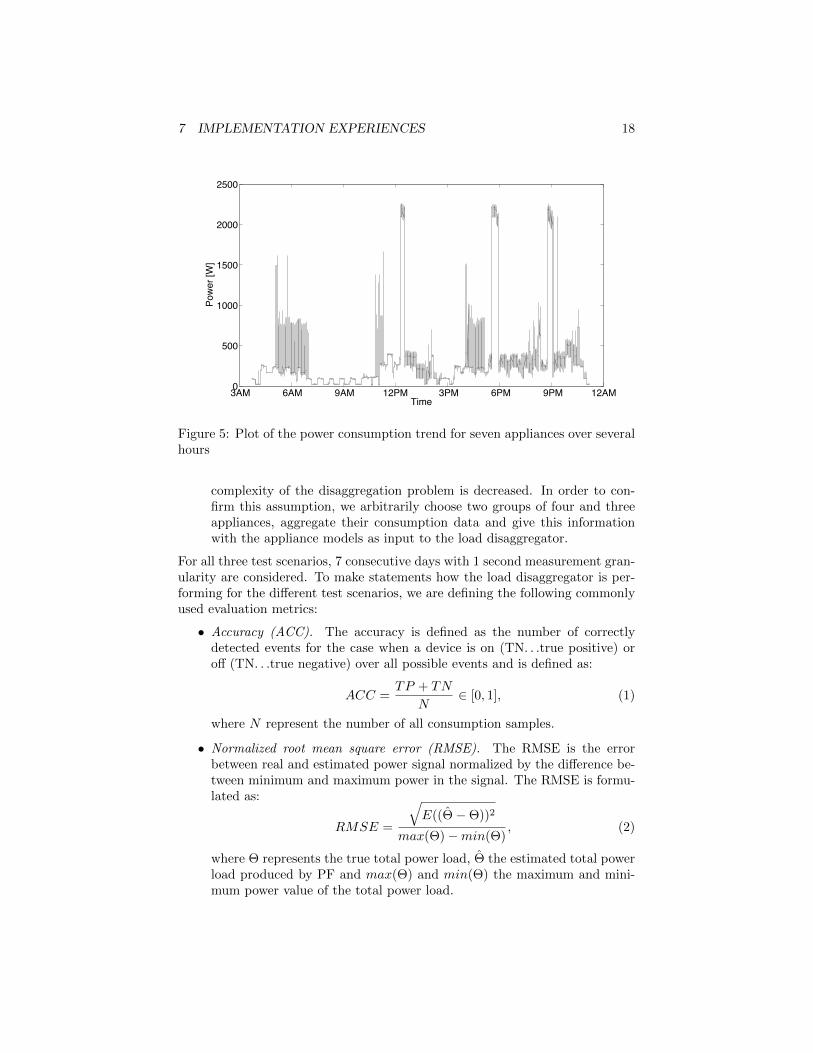
An appropriate power consumption dataset has to be used to evaluate our testscenario. There exists several publicly available datasets, for example the REDDdataset [53], the AMPds dataset [54], and the Smart* dataset [55]. In order toaddress power consumption in Austria and Italy, we use the GREEND dataset[30] containing appliance level power measurements of Austrian and Italianhouseholds. The dataset offers appliance-level active power measurements at1Hz resolution. In total 9 houses with 9 typical household appliance were mon-itored, although our evaluations relies on 7 appliances in house 0 (Table 2). Wehave chosen the devices according to their contribution to the household powerdemand as in [2]. Figure 5 presents a plot of the aggregated power demand ofseven appliances.
7.1.2 Test Scenarios
To show how the selected load disaggregator could be used to integrate legacyappliances we defined three different test scenarios:
1. Disaggregation of overall household (NILM). To simulate an approxi-mated overall household demand, the power consumption for each ap-pliance listed in Table 2 is aggregated over time. The load disaggregatoraims to disaggregate the appliance level consumption data based on pre-defined appliances models (HMM). This test scenario should depict thecommon household case where one energy meter with corresponding ag-gregated consumption data is available.
2. Appliance groups. It is conceivable that more than one energy meter inform of smart plugs/ smart sockets are available in a household. Thesemeters are monitoring a group of connected appliances. Therefore, theenergy demand of appliances are monitored in groups resulting in a re-duction of the appliance number aggregating their power demand. The
7 IMPLEMENTATION EXPERIENCES 18
3AM 6AM 9AM 12PM 3PM 6PM 9PM 12AM0
500
1000
1500
2000
2500
Time
Pow
er [W
]
Figure 5: Plot of the power consumption trend for seven appliances over severalhours
complexity of the disaggregation problem is decreased. In order to con-firm this assumption, we arbitrarily choose two groups of four and threeappliances, aggregate their consumption data and give this informationwith the appliance models as input to the load disaggregator.
For all three test scenarios, 7 consecutive days with 1 second measurement gran-ularity are considered. To make statements how the load disaggregator is per-forming for the different test scenarios, we are defining the following commonlyused evaluation metrics:
• Accuracy (ACC). The accuracy is defined as the number of correctlydetected events for the case when a device is on (TN. . .true positive) oroff (TN. . .true negative) over all possible events and is defined as:
ACC =TP + TN
N∈ [0, 1], (1)
where N represent the number of all consumption samples.
• Normalized root mean square error (RMSE). The RMSE is the errorbetween real and estimated power signal normalized by the difference be-tween minimum and maximum power in the signal. The RMSE is formu-lated as:
RMSE =
√E((Θ−Θ))2
max(Θ)−min(Θ), (2)
where Θ represents the true total power load, Θ the estimated total powerload produced by PF and max(Θ) and min(Θ) the maximum and mini-mum power value of the total power load.

7 IMPLEMENTATION EXPERIENCES 19
Real Estimated
TV
Coffee machine
Dishwasher
Fridge
Vacuum cleaner
Water kettle
Washing machine
22%
4%
18%25%
2%
6%
23% 15%3%
17%
30%3%
12%
21%
Figure 6: Sketch of the household energy partition on appliance level for themeasured and estimated case are shown
• Energy disaggregation error The percentage error of the estimated energywith respect to the real consumed energy, over the duration of the exper-iment.
7.1.3 Results
As described before, we considered different test scenarios for our evaluations.The first one deals with the aggregated power demand of seven applianceslisted in Table 2. In Table 3 the evaluation results are presented. The reachedACC, RMSE and disaggregation error depend on the complexity of devices (e.g.:on/off or multi-state appliances) and the similarity of devices regarding theirpower demand. For example, the set of TV, fridge and washing machine yieldsa decreased ACC and RMSE due to their appliance type and their similarity ofconsuming power.
In Figure 6 the energy partition on the real and the estimated energy com-putation on appliance level is shown. The estimated energy values and theircorresponding percentages on the overall energy demand show again the depen-dence of the load disaggregator on the appliance type and the similarity betweenappliances.
In the second test scenario appliances are grouped to decrease the numberof appliances. The results of ACC and RMSE are shown in Table 4 and areimproved compared to Table 3. As reason we assume the decreased number ofappliances and the corresponding decreased probability to have similar appli-

7 IMPLEMENTATION EXPERIENCES 20
Real Estimated
TV Vaccuum cleaner Washing machine
47%
3%
50%43%
4%
53%
Figure 7: Sketch of the household energy partition on appliance level for themeasured and estimated case are shown in which appliances are formed intogroup 0 (TV, vacuum cleaner, washing machine)
Real Estimated
Coffee machine Dishwasher Fridge Water kettle
8%
35%
46%
11%7%
21%
50%
23%
Figure 8: A Sketch of the household energy partition on appliance level for themeasured and estimated case are shown in which appliances are formed intogroup 1 (coffee machine, dishwasher, fridge, water kettle)

7 IMPLEMENTATION EXPERIENCES 21
ACC RMSE
TV 0.8705 0.2995Coffee machine 0.9901 0.0673
Dishwasher 0.9549 0.1263Fridge 0.8992 0.2095Hoover 0.9952 0.0649
Water kettle 0.9827 0.1131Washing machine 0.8826 0.1251
Total 0.9393 0.051
Table 3: Results for test scenario 1
ACC RMSE
Group 1Coffee machine 0.994 0.0332
Dishwasher 0.9626 0.0941Fridge 0.994 0,0742
Water kettle 0.9889 0.0948Total 0.9849 0.0091
Group 2Vacuum cleaner 0.9643 0.1548
Washing machine 0.997 0.152TV 0.9456 0.0186
Total 0.9699 0.0101
Table 4: Results for test scenario 2
ances in the same appliance group. Figure 7 and 8 show the energy partitions ofthe submetered demand for the real and the estimated energy values. As in theprevious test scenario, similar appliances influence the result of the disaggrega-tor. In summary, a load disaggregator could be used to disaggregate appliancesfrom the aggregated household power demand. The performance is mainly af-fected by the number of considered appliances, the type of appliances and theirsimilarity. Note that the presented load disaggregator is aware of the appli-ance type/model and the number of appliances. Although it is one of numerousNILM approaches applicable for this problem, the presented approach appearsto be a good choice fulfilling the requirements given by Zeifman. Nevertheless,to achieve full integration of legacy devices in a HEMS, a load disaggregatorhas to combine appliance detection with signature extraction approaches. Whileappliance detection provides information of appliance status and allows for theinference of device profiles (see Sect. 5.3), signature extraction allows for theinference of device models, to be used for improving the appliance detectionprocess.

8 CONCLUSIONS 22
7.2 Annotation of inferred information
In order to model device profiles and device models, we used the the opensource tool Protege1 to build models in the ontology web language (OWL).The resulting ontology is available for use at the MONERGY project webpage2.Fig. 9 shows an example profile for a water kettle. The device is user drivenand has a physical service to heat water. The service demands 0.03 KWhand is currently in the OFF status. The service takes place over one state,requiring 1800 W with 5% tolerance being insensitive to interruption and startdelay. Fig. 10 reports the load identification model for the water kettle. To
Appliance WaterKe.le
Physical Service
Status
Model Based Device Signature
Device 0WaterKe.leType
hasIndividual
hasIndividual
ServiceHeatWater
Ke.leStatusOn
Ke.leStatusOff
Ke.leStatusPaused
hasService
Ke.leState0
hasCurrentState
hasStatus hasIndividual
hasIndividual Ke.leSignaturehasSignature
hasIndividual
hasIndividual hasIndividual
State hasIndividual
Lakeside Labs
hasManufacturer
False
True
isControllable
isUserDriven
60
0
5
1800
0 0
hasDuration
hasOrder
hasWorkingPowerTolerance
hasPeakPower
hasInterruptionSensitivity hasDelaySensitivity
0.03
Water heating Service
This is the water heating functionality of the kettle
hasConsumption
hasSeviceName
hasDescr
iption
class
individuals
hasIndividual
Object property
Datatype property
Figure 9: Device profile for the water kettle
identify the device, this model describes OFF and ON observations, using activepower as a feature. As noticeable, device dynamics are captured using transitionprobabilities.
8 Conclusions
This paper addressed the problem of device and data interoperability in HEMS.In particular we analyzed building blocks of a HEMS to identify main challenges.
1http://protege.stanford.edu2http://www.monergy-project.eu/appliance-ontology/

8 CONCLUSIONS 23
Observa(on Transi(on
hasObservation
hasTransition
Transi(onKe/le OnOff
Transi(onKe/le OffOff
Transi(onKe/le OnOn
Transi(onKe/le OffOonIni(alObserva(on
Ke/le
SecondObserva(on Ke/le
hasNextObservation
hasNextObservation
hasIndividual
hasIn
dividu
al
hasIndividual
hasIndividual
hasI
ndivi
dual
hasIndividual
Ac(ve Power
ObservedFeature Ke/le1
ObservedFeature Ke/le0
hasFeature
hasF
eatu
re
hasIndividual
hasIndividual
1800
hasObservedValue
0
hasObservedValue
0.4
hasFeature
hasFeature
0.9 0.6 0.1
hasTransitionProbability hasTransitionProbability hasTransitionProbability hasTransitionProbability
class
individuals
hasIndividual
Object property
Datatype property
Figure 10: Load identification model for the water kettle
We put ahead a general architecture for HEMS, where requirements and char-acteristics are presented. Although the current standardization effort will soonprovide technologies to design smart appliances, many energy consuming andproducing devices will be non-smart. Replacing all legacy devices by smartdevices would be economically infeasible in many situations. Therefore, suchlegacy devices are assumed to have a significant impact on the energy consump-tion and thus, deserve consideration within energy management applications.We discussed the application of load detection for the identification of runningloads, as well as the integration of inferred information into HEM systems. Weadvocate for a common description for smart and legacy devices, as it wouldoffer a uniform interface to access features and data, with consequent complex-ity reduction for application developers. A case study is provided to show theeffectiveness of a load disaggregation algorithm on real data collected from aliving environment. We carried out two different approaches to monitoring anddisaggregating appliances where the load disaggregator inputs the aggregatedpower profile of i) all appliances and ii) grouped devices. A state-of-the-artload detection algorithm was applied to identify which monitoring approach issuitable to integrate legacy appliances into a HEMS. Our results demonstratethat each monitoring approach allows for the correct detection and thereforeintegration of appliances, according to the requirements defined. We pointedout different advantages and disadvantages of these approaches, which shouldbe considered during the design of the HEMS. We also showed how similaritiesbetween electrical devices affect the disaggregation process negatively. Finally,we exercise how information from detected appliances can be annotated to beexchanged within a HEMS. To the best of our knowledge, this is the first papershowing how the integration of legacy devices into the HEMS could take place,what requirements should be fulfilled and which limitations and challenges needto be considered.

9 ACKNOWLEDGMENTS 24
9 Acknowledgments
This work was supported by Lakeside Labs GmbH, Klagenfurt, Austria andfunding from the European Regional Development Fund and the CarinthianEconomic Promotion Fund (KWF) under grant KWF-20214 | 22935 | 24445.
References
[1] P. Palensky, D. Dietrich, Demand side management: Demand response, in-telligent energy systems, and smart loads, IEEE Transactions on IndustrialInformatics 7 (3) (2011) 381–388.
[2] D. R. Carlson, H. S. Matthews, M. Berges, One size does not fit all: Av-eraged data on household electricity is inadequate for residential energypolicy and decisions, Energy and Buildings 64 (0) (2013) 132 – 144.
[3] W. Elmenreich, D. Egarter, Design guidelines for smart appliances, in:Proceedings of the 10th International Workshop on Intelligent Solutions inEmbedded Systems, 2012, pp. 76 – 82.
[4] F. Jammes, H. Smit, Service-oriented paradigms in industrial automation,IEEE Transactions on Industrial Informatics 1 (1) (2005) 62–70.
[5] W. Dargie, Context-Aware Computing and Self-Managing Systems, 1stEdition, Chapman & Hall/CRC, 2009.
[6] B. Villaverde, R. Alberola, A. Jara, S. Fedor, S. Das, D. Pesch, Servicediscovery protocols for constrained machine-to-machine communications,Communications Surveys Tutorials, IEEE PP (99) (2013) 1–20. doi:10.
1109/SURV.2013.102213.00229.
[7] S. Pitzek, W. Elmenreich, Plug-and-play: Bridging the semantic gap be-tween application and transducers, in: Proceedings of the 10th IEEE Inter-national Conference on Emerging Technologies and Factory Automation,2005.
[8] T. Heath, C. Bizer, Linked Data: Evolving the Web into a Global DataSpace, Morgan & Claypool, 2011.
[9] D. Pfisterer, K. Romer, D. Bimschas, O. Kleine, R. Mietz, C. Truong,H. Hasemann, A. Kro andller, M. Pagel, M. Hauswirth, M. Karnstedt,M. Leggieri, A. Passant, R. Richardson, Spitfire: toward a semantic webof things, IEEE Communications Magazine 49 (11) (2011) 40 –48. doi:
10.1109/MCOM.2011.6069708.
[10] A. Monacchi, D. Egarter, W. Elmenreich, Integrating households into thesmart grid, in: Proceedings of the IEEE Workshop on Modeling and Sim-ulation of Cyber-Physical Energy Systems, 2013.

REFERENCES 25
[11] A. Molina-Markham, P. Shenoy, K. Fu, E. Cecchet, D. Irwin, Private mem-oirs of a smart meter, in: Proceedings of 2nd ACM Workshop on EmbeddedSensing Systems for Energy-Efficiency in Building, 2010.
[12] F. Skopik, Security is not enough! On privacy challenges in smart grids,International Journal on Smart Grid and Clean Energy 1 (1) (2012) 7–14.
[13] T. A. Nguyen, M. Aiello, Energy intelligent buildings based on user activity:A survey, Energy and Buildings 56 (0) (2013) 244 – 257.
[14] M. Lisovich, D. Mulligan, S. Wicker, Inferring personal information fromdemand-response systems, IEEE Security Privacy 8 (1) (2010) 11–20.
[15] B. J. Ulrich Greveler, D. Loehr, Multimedia content identification throughsmart meter power usage profiles, in: Proceedings of the International Con-ference on Information and Knowledge Engineering IKE’12, 2012.
[16] D. Egarter, C. Prokop, W. Elmenreich, Load hiding of household’s powerdemand, in: Arxiv e-Prints 1406.2534, 2014.
[17] M. J. Kofler, W. Kastner, Towards an ontology representing buildingphysics parameters for increased energy efficiency in smart home opera-tion, in: Proceedings of the 2nd Central European Symposium on BuildingPhysic (CESBP2013), Vienna, Austria, 2013.
[18] T. G. Stavropoulos, D. Vrakas, D. Vlachava, N. Bassiliades, Bonsai: Asmart building ontology for ambient intelligence, in: Proceedings of the2nd International Conference on Web Intelligence, Mining and Semantics,2012.
[19] D. Preuveneers, J. V. D. Bergh, D. Wagelaar, A. Georges, P. Rigole,T. Clerckx, E. Berbers, K. Coninx, K. D. Bosschere, Towards an extensiblecontext ontology for ambient intelligence, in: Proceedings of the SecondEuropean Symposium on Ambient Intelligence, 2004.
[20] D. Bonino, F. Corno, Dogont - ontology modeling for intelligent domoticenvironments, in: The Semantic Web - ISWC 2008, Vol. 5318 of LectureNotes in Computer Science, Springer Berlin Heidelberg, 2008, pp. 790–803.
[21] M. J. Kofler, F. I. Vazquez, W. Kastner, An Ontology for Representationof User Habits and Building Context in Future Smart Homes, in: Pro-ceedings of the 20th Workshop on Intelligent Computing in Engineering(EG-ICE2013), Vienna, Austria, 2013.
[22] C. Reinisch, M. J. Kofler, F. Iglesias, W. Kastner, Thinkhome energy ef-ficiency in future smart homes, EURASIP Journal Embedded Syst. 2011(2011) 1:1–1:18. doi:10.1155/2011/104617.
[23] S. Tomic, A. Fensel, T. Pellegrini, Sesame demonstrator: Ontologies, ser-vices and policies for energy efficiency, in: Proceedings of the 6th Interna-tional Conference on Semantic Systems (I-SEMANTICS), 2010.

REFERENCES 26
[24] M. J. Kofler, C. Reinisch, W. Kastner, An Ontological Weather Repre-sentation for Improving Energy-Efficiency in Interconnected Smart HomeSystems, in: Proceedings of Applied Simulation and Modelling/ArtificialIntelligence and Soft Computing (ASC2012), Napoli, Italy, 2012.
[25] M. Compton, P. Barnaghi, L. Bermudez, R. Garca-Castro, O. Corcho,S. Cox, J. Graybeal, M. Hauswirth, C. Henson, A. Herzog, V. Huang,K. Janowicz, W. D. Kelsey, D. L. Phuoc, L. Lefort, M. Leggieri,H. Neuhaus, A. Nikolov, K. Page, A. Passant, A. Sheth, K. Taylor, Thessn ontology of the w3c semantic sensor network incubator group, WebSemantics: Science, Services and Agents on the World Wide Web 17 (0).
[26] R. G. Raskin, Enabling semantic interoperability for earth science data.,http://sweet.jpl.nasa.gov (2004).
[27] E. Willighagen, Encoding units and unit types in RDF using QUDT, Tech.rep. (Jun. 2013).
[28] W3C, WGS84 geo positioning, http://www.w3.org/2003/01/geo/wgs84 pos(2006).
[29] A. Monacchi, W. Elmenreich, S. D’Alessandro, A. M. Tonello, Strategies forenergy conservation in Carinthia and Friuli-Venezia Giulia, in: Proceedingsof the 39th Annual Conference of the IEEE Industrial Electronics Society,2013.
[30] A. Monacchi, D. Egarter, W. Elmenreich, S. D’Alessandro, A. M. Tonello,GREEND: an energy consumption dataset of households in Italy and Aus-tria, in: Arxiv e-Prints 1405.3100, 2014.
[31] G. Hart, Nonintrusive appliance load monitoring, Proceedings of the IEEE80 (12) (1992) 1870–1891.
[32] J. Liang, S. Ng, G. Kendall, J. Cheng, Load signature study, part i: Basicconcept, structure, and methodology, IEEE Transactions on Power Delivery25 (2) (2010) 551–560.
[33] D. Egarter, A. Sobe, W. Elmenreich, Evolving non-intrusive load moni-toring, in: Proceedings of the Applications of Evolutionary ComputationConference, 2013, pp. 182–191.
[34] K. Suzuki, S. Inagaki, T. Suzuki, H. Nakamura, K. Ito, Nonintrusive ap-pliance load monitoring based on integer programming, in: Proceedings ofInternational conference on Instrumentation, Control, Information Tech-nology and System Integration (SICE), 2008.
[35] M. Zeifman, Disaggregation of home energy display data using probabilisticapproach, IEEE Transactions on Consumer Electronics 58 (1) (2012) 23–31.

REFERENCES 27
[36] D. Srinivasan, W. S. Ng, A. Liew, Neural-network-based signature recog-nition for harmonic source identification, IEEE Transactions on Power De-livery 21 (1) (2006) 398–405.
[37] G. Lin, S. Lee, J.-J. Hsu, W. Jih, Applying power meters for appliancerecognition on the electric panel, in: Proceedings of IEEE Conference onIndustrial Electronics and Applications (ICIEA), 2010.
[38] H. Goncalves, A. Ocneanu, M. Berges, Unsupervised disaggregation ofappliances using aggregated consumption data, in: Proceedings of KDDWorkshop on Data Mining Applications in Sustainability (SustKDD), 2011.
[39] Z. Kolter, T. Jaakkola, Approximate inference in additive factorial HMMswith application to energy disaggregation, in: Proceedings of the Interna-tional Conference on Artifical Intelligence and Statistics, 2012.
[40] A. A. Zaidi, F. Kupzog, T. Zia, P. Palensky, Load recognition for auto-mated demand response in microgrids, in: Proceedings of the 36th IEEEConference on Industrial Electronics (IECON), 2010.
[41] H. Kim, M. Marwah, M. F. Arlitt, G. Lyon, J. Han, Unsupervised Disag-gregation of Low Frequency Power Measurements, in: Proceedings of the11th SIAM International Conference on Data Mining, 2011.
[42] A. Zoha, A. Gluhak, M. Nati, M. Imran, Low-power appliance monitor-ing using factorial hidden markov models, in: Proceedings of IEEE EighthInternational Conference on Intelligent Sensors, Sensor Networks and In-formation Processing, 2013.
[43] K. C. Armel, A. Gupta, G. Shrimali, A. Albert, Is disaggregation the holygrail of energy efficiency? the case of electricity, Energy Policy 52 (0) (2013)213 – 234.
[44] S. Makonin, F. Popowich, B. Gill, The cognitive power meter: Lookingbeyond the smart meter., in: Proceedings of the 26th IEEE CanadianConference on Electrical and Computer Engineering CCECE, 2013.
[45] M. Zeifman, K. Roth, Nonintrusive appliance load monitoring: Review andoutlook, IEEE Transactions on Consumer Electronics 57 (1) (2011) 76 –84.
[46] A. Reinhardt, P. Baumann, D. Burgstahler, M. Hollick, H. Chonov,M. Werner, R. Steinmetz, On the Accuracy of Appliance IdentificationBased on Distributed Load Metering Data, in: Proceedings of the 2nd IFIPConference on Sustainable Internet and ICT for Sustainability (SustainIT),2012.
[47] F. Englert, T. Schmitt, S. Kossler, A. Reinhardt, R. Steinmetz, How toautoconfigure your smart home? high resolution power measurements tothe rescue., in: Proceeding of the 4th International Conference on FutureEnergy Systems, 2013.

REFERENCES 28
[48] D. Bergman, D. Jin, J. Juen, N. Tanaka, C. Gunter, A. Wright, Nonin-trusive load-shed verification, Pervasive Computing, IEEE 10 (1) (2011)49–57.
[49] M. Dong, P. C. M. Meira, W. Xu, C. Y. Chung, Non-intrusive signatureextraction for major residential loads, IEEE Transactions on Smart GridPP (99) (2013) 1 –10.
[50] O. Parson, S. Ghosh, M. Weal, A. Rogers, Non-intrusive load monitor-ing using prior models of general appliance types, in: Proceedings of theTwenty-Sixth Conference on Artificial Intelligence (AAAI-12), 2012.
[51] Y. F. Wong, Real-time load disaggregation algorithm using particle-baseddistribution truncation with state occupancy model, Electronics Letters 50(2014) 697–699(2).
[52] D. Egarter, V. P. Bhuvana, W. Elmenreich, Appliance state estimationbased on particle filtering, in: Proceedings of the 5th ACM Workshop onEmbedded Systems For Energy-Efficient Buildings, 2013.
[53] J. Z. Kolter, M. J. Johnson, REDD: A Public Data Set for Energy Dis-aggregation Research, in: Proceeding of the SustKDD Workshop on DataMining Applications in Sustainability, 2011.
[54] S. Makonin, F. Popowich, L. Bartram, B. Gill, I. V. Bajic, AMPds: A Pub-lic Dataset for Load Disaggregation and Eco-Feedback Research, in: Pro-ceeding of the IEEE Conference on Electrical Power and Energy (EPEC),2013.
[55] S. Barker, A. Mishra, D. Irwin, E. Cecchet, P. Shenoy, J. Albrecht, Smart*:An open data set and tools for enabling research in sustainable homes, in:Proceedings of KDD Workshop on Data Mining Applications in Sustain-ability (SustKDD), 2012.