Embed Size (px)
Citation preview

iNtEGratioN of StratiGraPHiC data WitH HVSr mEaSurES for StudiES of SEiSmiC miCroZoNatioN: tHE CaSE of oliVEri (mE)P. di Stefano, d. luzio, P. renda, r. martorana, P. Capizzi, a. d’alessandro, N. messina, G. Napoli, m. Perricone, S. todaro, G. ZarconeDiSTeM Department, University of Palermo, Italy
Introduction. The seismic microzoning is a technique of analysis of a territory which aims to recognize, at a small scale, the local geological and geomorphologic conditions that may significantly affect the characteristics of the seismic motion, generating stress on structures that could produce permanent and critical effects. In other words, this technique has the objective to predict and evaluate possible site effects as a result of an earthquake. The first phase of the seismic microzoning is the detailed partition of the territory in homogeneous areas with respect to the expected behavior of soils during an earthquake. The seismic micro-zoning is a tool for prevention and reduction of seismic risk particularly effective when used already in the process of planning. The present paper focus on a recent study applied to the Oliveri, a coastal village settled on a coastal plain in north-eastern Sicily.
Geological setting (Tectonic outline of the urban area of Oliveri). The area of Oliveri is part of the Peloritani Mountains, a segment of the Maghrebian chain that is mainly constituted by a pile of tectonic units consisting of Hercynian metamorphic rocks and their Meso-Cenozoic sedimentary covers. According to Giunta et al. (1998), the tectonic pile of the Peloritani Mountains is formed by the Longi-Taormina Unit, Fondachelli Unit, Mandanici Unit, Mela Unit and Aspromonte Unit. These units are overlapped by Oligo-Miocene siliciclastic turbidites pertaining to the Stilo-Capo d’Orlando Fm. upward follow, by a tectonic contact, the Antisicilide Units, represented by the Argille Variegate, that are capped unconformably in turn by the Floresta Calcarenites (Lower Miocene).
In the Peloritani Mountains different deformation steps related to the Alpine orogeny follow the Hercynian ductile deformations. The Oligo-Miocene contraction has been characterized by
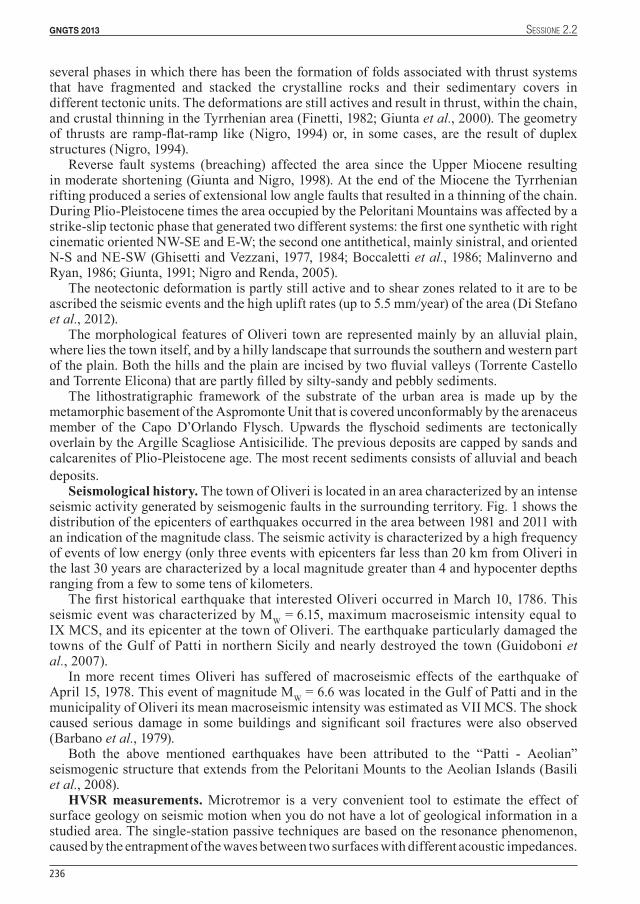
Fig. 1 – Distribution of epicenters of instrumental earthquakes located by the INGV between 1981 and 2011.
235
GNGTS 2013 SeSSione 2.2
131218 - OGS.Atti.32_vol.2.sez.2.20.indd 235 07/11/13 08.37
several phases in which there has been the formation of folds associated with thrust systems that have fragmented and stacked the crystalline rocks and their sedimentary covers in different tectonic units. The deformations are still actives and result in thrust, within the chain, and crustal thinning in the Tyrrhenian area (Finetti, 1982; Giunta et al., 2000). The geometry of thrusts are ramp-flat-ramp like (Nigro, 1994) or, in some cases, are the result of duplex structures (Nigro, 1994).
Reverse fault systems (breaching) affected the area since the Upper Miocene resulting in moderate shortening (Giunta and Nigro, 1998). At the end of the Miocene the Tyrrhenian rifting produced a series of extensional low angle faults that resulted in a thinning of the chain. During Plio-Pleistocene times the area occupied by the Peloritani Mountains was affected by a strike-slip tectonic phase that generated two different systems: the first one synthetic with right cinematic oriented NW-SE and E-W; the second one antithetical, mainly sinistral, and oriented N-S and NE-SW (Ghisetti and Vezzani, 1977, 1984; Boccaletti et al., 1986; Malinverno and Ryan, 1986; Giunta, 1991; Nigro and Renda, 2005).
The neotectonic deformation is partly still active and to shear zones related to it are to be ascribed the seismic events and the high uplift rates (up to 5.5 mm/year) of the area (Di Stefano et al., 2012).
The morphological features of Oliveri town are represented mainly by an alluvial plain, where lies the town itself, and by a hilly landscape that surrounds the southern and western part of the plain. Both the hills and the plain are incised by two fluvial valleys (Torrente Castello and Torrente Elicona) that are partly filled by silty-sandy and pebbly sediments.
The lithostratigraphic framework of the substrate of the urban area is made up by the metamorphic basement of the Aspromonte Unit that is covered unconformably by the arenaceus member of the Capo D’Orlando Flysch. Upwards the flyschoid sediments are tectonically overlain by the Argille Scagliose Antisicilide. The previous deposits are capped by sands and calcarenites of Plio-Pleistocene age. The most recent sediments consists of alluvial and beach deposits.
Seismological history. The town of Oliveri is located in an area characterized by an intense seismic activity generated by seismogenic faults in the surrounding territory. Fig. 1 shows the distribution of the epicenters of earthquakes occurred in the area between 1981 and 2011 with an indication of the magnitude class. The seismic activity is characterized by a high frequency of events of low energy (only three events with epicenters far less than 20 km from Oliveri in the last 30 years are characterized by a local magnitude greater than 4 and hypocenter depths ranging from a few to some tens of kilometers.
The first historical earthquake that interested Oliveri occurred in March 10, 1786. This seismic event was characterized by MW = 6.15, maximum macroseismic intensity equal to IX MCS, and its epicenter at the town of Oliveri. The earthquake particularly damaged the towns of the Gulf of Patti in northern Sicily and nearly destroyed the town (Guidoboni et al., 2007).
In more recent times Oliveri has suffered of macroseismic effects of the earthquake of April 15, 1978. This event of magnitude MW = 6.6 was located in the Gulf of Patti and in the municipality of Oliveri its mean macroseismic intensity was estimated as VII MCS. The shock caused serious damage in some buildings and significant soil fractures were also observed (Barbano et al., 1979).
Both the above mentioned earthquakes have been attributed to the “Patti - Aeolian” seismogenic structure that extends from the Peloritani Mounts to the Aeolian Islands (Basili et al., 2008).
HVSR measurements. Microtremor is a very convenient tool to estimate the effect of surface geology on seismic motion when you do not have a lot of geological information in a studied area. The single-station passive techniques are based on the resonance phenomenon, caused by the entrapment of the waves between two surfaces with different acoustic impedances.
236
GNGTS 2013 SeSSione 2.2
131218 - OGS.Atti.32_vol.2.sez.2.20.indd 236 07/11/13 08.37

The HVSR technique was made popular at the end of the 80s by Nakamura (1989). They discovered that the relationship between the horizontal components H and the vertical compo-nents V of the ground motion, i.e. HVSR (Horizontal to Vertical Spectral Ratio), highlights the resonance frequencies of soil. Afterwards, theoretic explanation of the phenomenon given by the first authors, in which the resonance was caused only by the body waves, was abandoned in favor of theories that surface waves (Rayleigh and Love waves, and to a lesser shear waves) plays a key role in the phenomenon (Lachet and Bard, 1994; Konno and Ohmachi, 1998). Many researchers (e.g. Ohmachi et al., 1991; Lermo et al., 1992; Field and Jacob, 1993, 1995) showed that H/V ratio of noise can be used to identify the fundamental resonant frequency of a sed-imentary layer. Besides the amplification factors are more realistic than those obtained from sediment to rock site ratios (Nakamura, 2000).
In order to define a preliminary subsurface model for the first level of microzonation, we performed 23 HVSR measurements, quite uniformly distributed in the area with a minimum spacing of 250 m. For each measurement 46 min of noise was registered using a sampling frequency of 256 Hz and processed using a cluster analysis technique (D’Alessandro et al., 2013), in order to identify all the significant peaks of the H/V spectra in the frequency range 0.1-20 Hz. Their attribution to resonance phenomena of buried structures has been validated in agreement with SESAME criteria (2005), by analyzing standard deviation of the spectral coefficients and independence from the azimuth. The HVSR measurements have revealed the presence of amplification of ground motion probably due to resonance phenomena over a large part of the urban area.
A simplified interpretation of the HVSR techniques can be made by assuming that the fundamental resonance frequency f of the overburden depends on its thickness h and on average shear-wave velocity V as follow: f = V / (4h). This interpretation can be made only in cases of homogeneous two-layered media. It also requires during the acquisition and the analysis to comply with certain criteria listed in the guidelines of the European SESAME project (2005).
Using an appropriate inversion method the relationship between f and vs permits to estimate the value of vs versus depth from a H/V curve provided the inversion is constrained by information on a depth of a layer whose effect is recognizable in the H/V curve (Fäh et al. 2002; Bonnefoy-Claudet et al., 2006). The limits of this procedure reside in the still not clear and debated composition of microtremor. Furthermore, the amplitude of the H/V peaks depends on numerous factors and it is not always possible to identify the constraints on the H/V curve, especially in complex cases of velocity inversion.
Unfortunately, the limited number of boreholes and laboratory tests, useful to characterize in detail the stratigraphy and geometry of the bodies buried in the plain of Oliveri, did not allow to derive a detailed model of the subsurface. Consequently only a single borehole carried out to the eastern boundary of the municipality was used to constrain the HVSR inversions.
Peak frequency maps. Peak frequency maps, obtained from seismic microtremor measures, were performed considering the multiplicity of causes of HVSR amplification, in an attempt to discriminate peaks caused by different phenomena (seismic interfaces at various depths, high topographic gradients, anthropogenic causes). In this way, different frequency maps can be developed, each of them grouping and separately representing amplifications probably caused by the same source. Below are described the criteria used and the processing steps.
In each graph of HVSR spectral ratio all the significant peaks were identified and characterized by their center frequency and amplitude. The whole dataset of HVSR amplitude versus peak frequency was used to statistically identify clusters of points probably having a homogeneous source (D’Alessandro et al., 2013). Those clusters related to sets of points with significant coverage of the investigated zone can be used for the construction of a frequency map. This implies that for each area of investigation can be built from zero (e.g.. absence of peaks for substrate outcropping) to three maps, considering that the detection of a greater
237
GNGTS 2013 SeSSione 2.2
131218 - OGS.Atti.32_vol.2.sez.2.20.indd 237 07/11/13 08.37

number of clusters is not significant. The kriging algorithm applied to logarithms of the peak frequencies was used for the interpolation, obtaining a lattice of interpolated frequency values in which the equidistance between nodes is equal to 10 m. The frequency maps are plotted using a contour of logarithmic equidistance equal to eight contour lines per decade.
Considering these evaluations, clusters related to datasets of HVSR measurements with significant coverage compared to the studied area were used for the construction of two different maps (Fig. 2) of the resonance frequency of the urban area of Oliveri. The frequency of 2.5 Hz that separates the two clusters was chosen taking into account also the lithological correlations of the examined area.
For each measurement the amplitude of the HVSR peak is represented, if present, by means of circles of radius proportional to the owner amplitude class.
Authors also chosen not to extend the interpolation (and therefore the representation for contour lines) to those areas in which measures have no significant amplitude peaks in the frequency range represented by the map. Most of the measurement points show amplification of the seismic soil motion at low frequencies (0.7 - 2.2 Hz) and therefore of negligible engineering interest if not for very big buildings. A large area (south of the town) was also highlighted, characterized by amplification at higher frequencies (greater than 2.5 Hz) more interesting for the spatial planning. Finally some measurements does not show peaks in the range 0.1 - 20 Hz, confirming the basement outcropping in the area.
Seismic bedrock mapping. In almost all the HVSR measurements carried out on the alluvial material a maximum peak is evident in the range 0.7 - 1.4 Hz. This, by the inversions results, seems to be related to a variation of the shear-wave velocities that, under a depth of 40-60 meters reach values attributable to a seismic bedrock (about 800 m/s).
Analyzing the 1D inverse models derived by inverting HVSR measurements, estimates of the depth of the seismic bedrock have been obtained. These, together with other reliable data like drilling and other geophysical surveys, were used to construct the map of the thickness of the sedimentary cover (Fig. 3, left) and the map of the altitude of the top of seismic bedrock above sea level (Fig. 3, right). The estimates of the depth of the bedrock were interpolated by
Fig. 2 – HVSR peak frequency maps for 0.1 Hz < f < 2.5 Hz (left) and for 2.5 Hz < f < 20 Hz (right).
238
GNGTS 2013 SeSSione 2.2
131218 - OGS.Atti.32_vol.2.sez.2.20.indd 238 07/11/13 08.37

imposing a constraint of a depth equal to zero in areas where geological strata with elastic characteristics of seismic bedrock outcrop. The kriging interpolation algorithm was used, obtaining a lattice with equidistance between nodes equal to 10 m.
The map of the bedrock depth contours was obtained by extracting from the Digital Elevation Model of the area a grid of points equidistant 50 m. From these the corresponding lattice of the depth of the bedrock were subtracted. This choice was made in order to obtain a trend of the isobaths that was not excessively tied to topographic detail but which, however, did not present unrealistic areas with higher elevations of the topographic surface. It should however emphasize that the real detail of the maps can’t be higher than the sampling density of the HVSR measurements, which generally is not less than 300 m.
Considering the geological configuration of the subsoil and the values of shear-wave velocity (deduced from direct bore-hole measurements) a preliminary identification was made of the geological structures that can cause seismic resonance.
For the above mentioned reasons the inversion of HVSR curves and evaluation of the thickness of the cover did not take into account the available seismic down-hole data and instead, the mean values of shear-wave velocity of the cover, available in literature, were considered. In particular, we considered about 200 to 250 m/s for alluvium and about 350 to 400 m/s in correspondence of silty sands.
Geological-technical model. The geological-technical model of Oliveri plain’s subsoil foresees the presence of a surface layer of clastic deposits consisting of incoherent sands with variable levels of gravels and silts. The thickness is defined only in the proximity of the Torrente Elicona, where is 16 - 17 m. In this area, below the alluvial layer, there are mixtures of fine sands and silts with bivalves. The groundwater level is placed in the borehole at a depth of 7.5 m. In the wide area of the plain which extends to the west of the Torrente Elicona data from direct tests are not available. However, based on hydrological maps added to municipality building plane, the presence of the groundwater level is attested at depths less than 15 m across the floodplain. The HVSR show the presence of a seismic bedrock at depths up to 70 m near the outfall of the Torrente Elicona.
Fig. 3 – Oliveri. Map of the thickness of the sedimentary cover (left) and map of the altitude of the seismic bedrock above sea level (right).
239
GNGTS 2013 SeSSione 2.2
131218 - OGS.Atti.32_vol.2.sez.2.20.indd 239 07/11/13 08.37

references Barbano M.S., Bottari A., Carveni P., Cosentino M., Federico B., Fonte G., Lo Giudice E., Lombardo G., Patanè G. (1979).
Macroseismc study of the gulf of Patti earthquake in the geostructural frame of the North-Eastern Sicily. Bollettino della Società Geologica Italiana, 98, 155-174.
Basili R.G., Valensise P., Vannoli P., Burrato U., Fracassi S., Mariano M.M., Tiberti E., Boschi E. (2008). The Database of Individual Seismogenic Sources (DISS), version 3: summarizing 20 years of research on Italy’s earthquake geology. Tectonophysics, doi: 10.1016/j.tecto.2007.04.014.
Boccaletti M., Tortorici L., Ferrini G. L. (1986). The Calabrian Arc in the frame of the evolution of the Tyrrhenian Basin. In: Boccaletti M., Gelati R. & Ricci Lucchi F. Eds. Pepe F.; “Paleogeography and geodynamics of the Perityrrhenian Area”, Giorn. Geol., 3a, 48 (1/2): 113-120.
Bonnefoy-Claudet S., Cornou C., Bard P.-Y., Cotton F., Moczo P., Kristek J., Fäh D. (2006). H/V ratio: a tool for site effects evaluation. Results from 1-D noise simulations, Geophys. J. Int., 167, 827-837.
D’Alessandro A., Capizzi P., Luzio D., Martorana R., Messina N. (2013). Improvement of HVSR technique by cluster analysis. Geoitalia 2013, IX FIST, Pisa, 16-18 Settembre 2013.
Di Stefano E., Agate M., Incarbona A., Russo F., Sprovieri R., Bonomo S. (2012). Late Quaternary high uplift rates in northeastern Sicily: evidence from calcareous nannofossils and benthic and planktonic foraminifera. Facies, volume 58, issue 1, pag 1-15.
Fäh D., Kind F., Giardini D. (2002). Inversion of local S-wave velocity structures from average H/V ratios, and their use for the estimation of site effects. Journal of Seismology, 7, 449-467.
Field E.H. & Jacob K.H. (1993). The Theoretical Response of Sedimentary Layers to Ambient Seismic Noise, Geophys. Res. Let., 20, 2925-2928.
Field E.H. & Jacob K.H. (1995). A Comparison and Test of Various Site Response Estimation Techniques, Including Three That Are Not Reference Site Dependent, Bull. Seism. Soc. Am., 85:4, 1127-1143.
Finetti I., (1982). Structural, stratigraphy and evolution of central Mediterranean. Boll. Geof. Teor. Apll., 24 (96): 247-312.
Giunta G. (1991). Elementi per un modello cinematico delle maghrebidi siciliane. Mem. Soc. Geol. It. 47: 297-311.Giunta G. & Nigro F. (1998). Some tectono-sedimentary constraints to Oligo-Miocene evolution of the Peloritani Thrust
Belt. Tectonophysics, 315: 287-299.Giunta G., Nigro F., Renda P. & Giorgianni A. (2000). The Sicilian-Maghrebides Tyrrhenian Margin: a neotectonic
evolutionary model. Mem. Soc. Geol. It., 119: 553-565.Ghisetti F. & Vezzani L. (1977). Evidenze di linee di dislocazione sul versante meridionale dei Monti Nebrodi e Madonie
e loro significato neotettonico. Boll. Geodesia e Sc. affini, 36 (4): 411-437.Ghisetti F. & Vezzani L. (1984). Thin-skinned deformations of the western Sicily thrust belt and relationships with crustal
shortening: Mesostructural data on the Mt. Kumeta-Alcantara Fault Zone and related structures. Boll. Soc. Geol. It., 103: 129-157.
Guidoboni, E., Ferrari, G., Mariotti, D., Comastri, A., Tarabusi, G., Valensise, G. (2007). Catalogue of Strong Earthquakes in Italy (CFTI), 461 B.C. - 1997 and Mediterranean Area 760 B.C. - 1500, http://storing.ingv.it/cfti4med/.
Konno K. & Ohmachi, T. (1998). Ground-Motion Characteristics Estimated from Spectral Ratio between Horizontal and Vertical Components of Microtremor, Bull. Seism. Soc. Am., 88:1, 228-241.
Lachet C. & Bard P.Y. (1994). Numerical and Theoretical Investigations on the Possibilities and Limitations of Nakamura’s Technique, J. Phys. Earth, 42, 377-397.
Lermo J., Francisco S. & Chavez-Garcia J. (1992). Site Effect Evaluation using microtremors: a review (abstract), EOS 73, 352.
Malinverno A. & Ryan W. B. F. (1986). Extension in the Tyrrhenian Sea and shortening in the Apennines as results of arc migration driven by sinking of the lithosphere. Tectonics, 5: 227-245.
Nakamura Y. (1989), A Method for Dynamic Characteristics Estimation of Subsurface using Microtremor on the Ground Surface, Quarterly Report of Railway Technical Research Institute (RTRI), Vol. 30, No.1.
Nakamura Y. (2000). Clear Identification of Fundamental Idea of Nakamura’s Technique and its Applications, 12WCEE, 2656.
Nigro F. (1994). L’Unità Longi-Taormina. Stratigrafia e tettonica delle coperture mesozoico-terziarie dell’elemento peloritano occidentale. Tesi di Dottorato, Palermo, 276 pp.
Nigro F. & Renda P. (2005). Plio-Pleistocene strike-slip deformation in NE Sicily:the example of the area between Capo Calavà and Capo Tindari. Bollettino della Società Geologica Italiana, 124(2), 2005, pp. 377-394
Ohmachi T., Nakamura Y. &Toshinawa, T. (1991). Ground Motion Characteristics in the San Francisco Bay Area detected by Microtremor Measurements, Proc. 2nd. Int. Conf. on Recent Adv. In Geot. Earth. Eng. And Soil Dyn., 11-15 March, St. Louis, Missouri, 1643-1648.
SESAME Project (2005). Guidelines for the implementation of the H/V spectral ratio technique on ambient vibrations. Measurements, processing and interpretation, WP12, deliverable no. D23.12, http:// sesame-fp5.obs.ujf-grenoble.fr/Papers/HV_User_Guidelines.pdf.
240
GNGTS 2013 SeSSione 2.2
131218 - OGS.Atti.32_vol.2.sez.2.20.indd 240 07/11/13 08.37
![Application of Microtremor HVSR Method for Assessing … · computed. Overall HVSR analysis performed using GEOPSY Software [9]. HVSR analyses of 55 free-field microtremor measurements](https://img.pdfslide.net/doc/110x75/5b8d65dc09d3f2c65c8bf18c/application-of-microtremor-hvsr-method-for-assessing-computed-overall-hvsr.jpg)