Embed Size (px)
Citation preview

International Journal of Basic & Applied Sciences IJBAS-IJENS Vol: 11 No: 04 73
118804-9393 IJBAS-IJENS © August 2011 IJENS I J E N S
Abstract— This paper investigates the local site effect of the
earthquake induced slope instabilities using microtremor
horizontal- to-vertical ratio (HVSR) method. It is accepted that
soil effects (soil thickness and variation of surface soil parameter)
and topographic effects namely local site effects, is considered
having a significant effect on the seismic amplifications. However
the understanding of seismic slope response is still limited. The
research was carried out in a residual soil slope near Batu town,
Malang District–Indonesia. The microtremor investigation had
been conducted on 54 free-field measurements having 20 x 20 m
dense grid. The HVSR analysis has been carried out using
Geopsy Software. The predominant frequency (f0) ranges
between 1 and 5.5 Hz and amplification factor (Am) varies from
2.5 to 10 though most of the areas having 4 to 5 Am value. The
topographic patterns are identified by the fo value as related to
bedrock depth. Variations of both parameters are indicated as a
result of variations in surface soil parameters. Surface soil
parameters are considered having more significant effect
comparing to those of topographic effects. The vulnerability
index (Kg) is indicated the soil damage level due to ground
motions. The weak zone, failed during earthquake on the
Southern slopes was identified by the highest Kg value.
Index Term— Site effects, the predominant frequency,
amplification factor, vulnerability index, microtremor HVSR,
residual soil slope, Malang.
I. INTRODUCTION It is now well known that local site characteristics may
produce large ground motion amplifications during
earthquakes. This issue can be investigated by means of the
analysis of actual seismic records and the study of synthetic
seismogram as well. By last century‟s middle years, effects of
local soil and geological condition were studied mainly in
terms of peak accelerations or peak velocities and the effects
of topography on surface ground motion have been observed
and studied from field experiments [1]. In last decade the
microtremor method has been widely used for site effect
studies (e.g. [2], [3], [4]).
Dwa Desa Warnana is with Civil engineering department, Institut
Teknologi Sepuluh Nopember (ITS), Surabaya, Indonesia. Formerly is Physics Department, Institut Teknologi Sepuluh Nopember (ITS), Surabaya,
Indonesia- 6011. (E-mail: dwa_desa@ physiscs.its.ac.id).
Ria Asih Aryani Soemitro is with Civil engineering department, Institut Teknologi Sepuluh Nopember (ITS), Surabaya, Indonesia - 6011.
(E-mail: [email protected]).
Widya Utama is with Physics Department, Institut Teknologi Sepuluh Nopember (ITS), Surabaya, Indonesia- 6011.
(E-mail: [email protected]).
In fact, even though the knowledge on local site effects have
been historically improved, the understanding of seismic slope
response is still limited due to of the scarcity of ground motion
recordings on landslide-prone slopes. Furthermore, numerical
modeling of slope behavior under earthquake shaking is not
easy because the acquisition of relevant geotechnical
parameters of slope materials is difficult in sites characterized
by rough topography and sharp lateral lithological and/or
physical heterogeneities. The assessment of subsurface
geology through borehole or “active” geophysical surveying is
expensive and is typically limited to post-factum (post-failure)
local scale investigations. Then, exploring the capability of
microtremor is interesting as it is considered as cheaper and
quicker geophysical.
The present paper is attempted to investigate the local site
effects of the earthquake induced slope instabilities in residual
slope at site near Batu Town, malang District – Indonesia
(Figure 1). This site is located in the Southern part of Java
Island, a region undergoing a recent increase in seismic
activity. According to the seismic hazard map of java,
Indonesia for a 475-year return period a design ground
acceleration value for a rock site in site location ranges from
0.2 g to 0.25 g [5].
The Nakamura technique has been adopted for the
microtremor measurements analysis (HVSR) (e.g. [6], [7]) to
determine the predominant frequency (f0), amplification factor
(Am). Reference [7] also proposed the vulnerability index „Kg
value‟ (Kg = A2/F) as a means to determine the extent of
seismic hazard. In this study, we determined the site
characteristics of the slope area using the HVSR of
microtremors and the Kg values to predict the potential for
slope instabilities at the sites.
.
II. LOCATION AND GEOLOGICAL SETTING
The research site is located on the hills of Tunggangan
Mountain, Sumber berantas village, Batu Town, Malang
District (S70 45‟ 18.80‟‟ and E112
0 31‟ 45.83‟‟). The site is at a
distance of approximately 15 km from Batu Town (Figure 1).
The topography in the site is of moderately steep in the range
20-25o. The elevation ranges between 1650 m and 1730 m.
Based on the Malang geological map, the location of site
investigation is a part of Young Anjasmara volcanic
sedimentary [8]. The rock units are dominated by the volcanic
breccias, lava, tuff and lahars (Figure 2). The geotechnical
investigation were drilling to 5 m depth. The drilling data
indicated that the soil is brownish black and mainly consisted
of sandy silt. Because no deep boreholes have been drilled at
site, the thickness of residual soil is completely unknown.
Dwa Desa Warnana, Ria Asih Aryani Soemitro, and Widya Utama
Application of Microtremor HVSR Method for
Assessing Site Effect in Residual Soil Slope

International Journal of Basic & Applied Sciences IJBAS-IJENS Vol: 11 No: 04 74
118804-9393 IJBAS-IJENS © August 2011 IJENS I J E N S
Based on general geological knowledge of the area and the
climate changes are intense with a predominance of chemical
weathering over other process of weathering, thus resulting in
deep weathering profiles and soil thickness often exceeding 30
m.
Fig. 1. Location map of study area
Fig. 2. Simplified geological map of Batu town (Site area is shown by black
box)
III. MICROTREMOR MEASUREMENT AND ANALYSIS
Measurement microtremor data was conducted by 20 x 20 m
in grid arround of slope area with the number of points are 55
points on August 2010 (Figure 3). For each point of
measurement 15 minutes of ambient noise were recorded at
the sampling rate of 100 Hz. Their locations were carefully
selected to avoid the influence of trees, sources of
monochromatic noise and strong topographic features (edges
of terraces).
The data processing to obtain the HVSR at each site was
performed in the following way: the data was filtered between
0.2 and 25 Hz by a band-pass 4 poles Butterworth filter after
the mean and a linear trend were removed; then each
component of the recorded signal was windowed in a time
series of 20 sec length (cosine taper 5%) and for each time
window an FFT was calculated and smoothed using the Konno
and Ohmachi logarithmic window function. For each time
window the spectral ratio between the root-mean square
average spectrums of the horizontal components over the
spectrum of the vertical component was calculated and,
finally, the average HVSR and the standard deviation were
computed. Overall HVSR analysis performed using GEOPSY
Software [9].
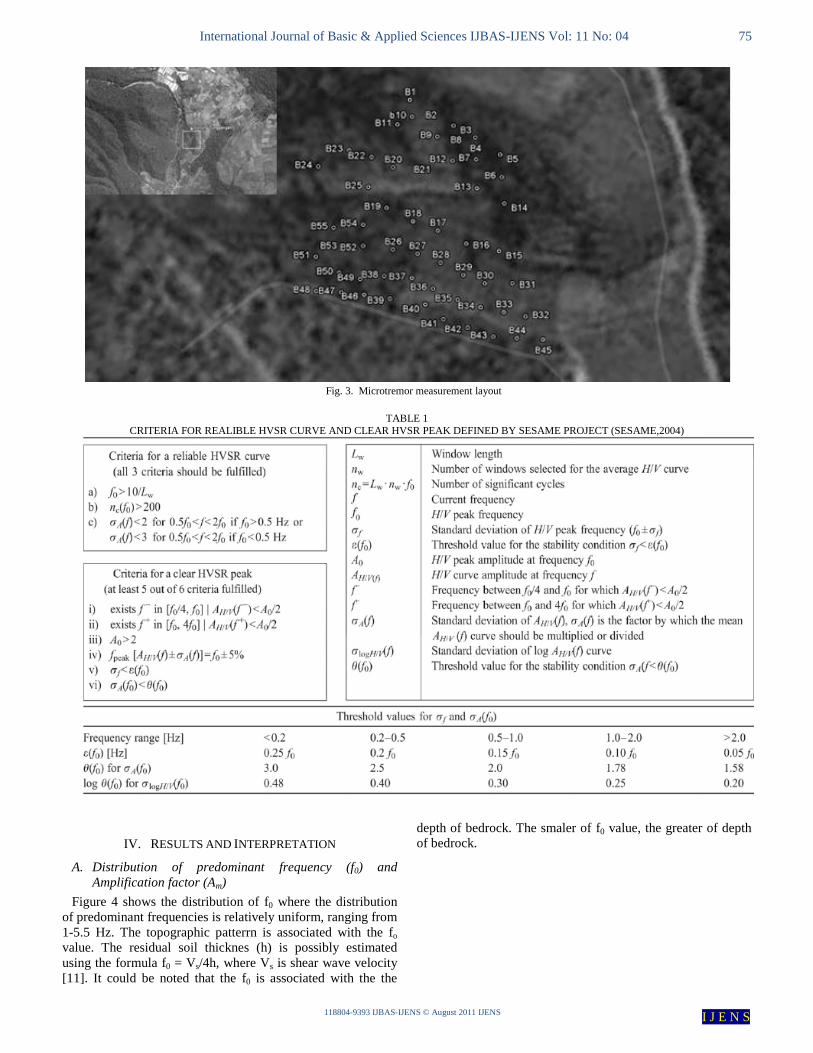
HVSR analyses of 55 free-field microtremor measurements
in the site showed that most of them (90%) fulfill the criteria
defined by SESAME project (Table 1) for reliable
measurements [10]. Three criteria for a reliable HVSR curve
are based on the relation of a peak frequency to the window
length, number of significant cycles and standard deviation of
a peak amplitude. Six criteria for a clear peak are based on the
relation of the peak amplitude to the level of the HVSR curve
elsewhere, and standard deviations of the peak frequency and
of its amplitude (the amplitude should decrease rapidly on
each side). If all three criteria for reliable curve and at least
five criteria for a clear peak are fulfilled, the frequency of the
peak is considered to be the fundamental frequency of
sediments.
International Journal of Basic & Applied Sciences IJBAS-IJENS Vol: 11 No: 04 75
118804-9393 IJBAS-IJENS © August 2011 IJENS I J E N S
Fig. 3. Microtremor measurement layout
TABLE 1
CRITERIA FOR REALIBLE HVSR CURVE AND CLEAR HVSR PEAK DEFINED BY SESAME PROJECT (SESAME,2004)
IV. RESULTS AND INTERPRETATION
A. Distribution of predominant frequency (f0) and
Amplification factor (Am)
Figure 4 shows the distribution of f0 where the distribution
of predominant frequencies is relatively uniform, ranging from
1-5.5 Hz. The topographic patterrn is associated with the fo
value. The residual soil thicknes (h) is possibly estimated
using the formula f0 = Vs/4h, where Vs is shear wave velocity
[11]. It could be noted that the f0 is associated with the the
depth of bedrock. The smaler of f0 value, the greater of depth
of bedrock.

International Journal of Basic & Applied Sciences IJBAS-IJENS Vol: 11 No: 04 76
118804-9393 IJBAS-IJENS © August 2011 IJENS I J E N S
Fig. 4. Distribution map of the fo value, a predominant frequency of a site, at
the 55 measured points.
Figure 5 represents the amplification factor (Am) or peak
ratio HVSR spectrum in investigation sites ranging from 2.5 to
10. High amplification factor (Am>4) was found almost all
area and the highest amplification factor just found at a top of
the hill (point B1). Distribution of the high amplification
factor in whole area measurements showed that the
topographic effect is not the only one factor controlling the
amplification factor.
Different value of Am might be found in the same value of
the predominant frequency (Figure 6). No correlation between
predominant frequency and its amplitude (Am) was
established. It can be noted that the variation of Am value is
not strongly effected by the soil depth. Reference [12]
explained that the variation of soil parameters (shear modulus,
damping ratio and density) influenced the amplification factor.
Reference [13] explained that the influence of the saturation
state of the bedrock is insignificant; a change of the saturation
state of the soil layer may have a marked impact on the
amplification factor. It can be clearly stated that the geological
factors are more dominant to the Am variation.
Fig. 5. Distribution map of the Am value, a amplification factor of a site, at the
55 measured points.
Fig. 6. Peak ratio vs. predominant frequency graph of HVSR peak.
At present, using the Am as site amplification parameter is
still a hot debate among the experts [14]. There is no ultimate
correlation between the Am and the maximum spectral
amplification of the site from strong motion. There might be
some local relationships for a limited area and should only be
regarded as a relative indicator of local site amplification since
applied instruments or instrumental settings may also exert
influence [11]. Reference [15] explained that amplitude/
amplification factor depends mainly on the impedance contrast
and HVSR also does not provide any estimate of the actual
bandwidth over which the ground motion is amplified. On the
other hand, it is widely accepted in the scientific community
that the predominant frequency (f0) reflects the fundamental
frequency of the site [11], [16], [17], [6].

International Journal of Basic & Applied Sciences IJBAS-IJENS Vol: 11 No: 04 77
118804-9393 IJBAS-IJENS © August 2011 IJENS I J E N S
B. Distribution of Soil vulnerability index (Kg)
Reference [7] introduced a vulnerability index parameter
(Kg), which combined Am and fo to identify areas where
greater seismic hazards and damage may be expected using
HVSR technique. Previous studies ([18], [19], [20]) had
showed that distribution form of Kg; very well correspond
with damage due to more recent earthquake. Thus, Kg value
reflect local site effect and can be considered as an indicator
which might be useful in selecting weak point of ground
especially in slope areas.
To estimate soil vulnerability index (Kg), the value of shear
strain () need to be considered [14]. According to Ishihara
[21] ground soil becomes plastic state at about 1000 x 10-6
; and for > 10,000 x 10-6
catastrophic landslide or very large
deformation will be occured. Reference [7] had outlined the
formulation in detail, but in summary it can be written as
follows:
(1)
In this equation, (Am)2/f0 is called soil vulnerability index (Kg),
a is the ground acceleration and vb is the shear wave velocity
of bedrock.
Figure 7, shows the distribution of vulnerability index (kg)
having values ranging from 2 to 32. Assuming a = 0.2 g and vb
= 600 m/s, for >1000 x 10-6
then the kg value > 3; and for
> 10,000 x 10-6
the kg value > 30. Based on the above criteria,
for the value of Kg> 3 was found spread throughout research
areas and for the value of Kg> 30 was found only at several
points the southern hills. Reference [20] reported that Kg> 14
in Central Java was caused deformation of the soil and
destroyed buildings on it. Thus, the higher Kg value (Kg> 14)
in the site areas spread over the southern area. These zones
were considered as weak zones which may fail during the
earthquake.
Fig. 7. Contour map of the Kg value, refer to (1), in the site areas. The higher Kg values appear in the southern area.
V. DISCUSION AND CONCLUSION
Geotechnical investigation (boreholes, penetrometic tests,
etc), local instrumentation placed in boreholes (piezometers,
inclinometers) are generally employed for assessing site effect
in slope instabilities. Even though these studies provide direct
information on the slope material, except by multiplying the
number of tests, these methods are not able to image the
lateral variability of slope characteristics [22].
Microtremor investigations have proved to be an effective
tool for assessment of site effects in the case of residual soil
slope. In such conditions, the microtremor HVSR method is
very useful for quantitative seismic microzonation and
assessment of earthquake induced slope instabilities. At the
same time, the costs of measurements and processing are kept
low, because no active source is needed.
Microtremor performed in residual soil slope at site near
Batu town, showed that the predominant frequencies are
concentrated at about 1- 5.5 Hz (Figure 4) and amplification
factor varied from 2.5 -10 (Figure 5). An important remark
should be noticed that the geological factors are more
dominant rather than topographic effects to the Am variation.
Based on the predominant frequencies and their
amplification factors, one important parameter, Kg, could be
determined to assess the local site effects. In this study, the Kg
values in the southern areas are higher than the northern areas,
as indicated as weak zones which may fail during earthquake.
Nevertheless, before more general conclusion can be made
and to find out the origin of the difference between the
southern and the northern area, microtremor modeling which
inverts observed HVSR to find soil model should be
performed, including analysis of their dynamic physical
behavior.
ACKNOWLEDGMENT
The authors are indebted to R. kiswanto, Irma Novalita, S.Si
and Yedi Darmadi, S.Si for their help in field measurements.
They also extended their gratitude to the Meteorological,
Climatological and Geophysical Agency (BMKG) for
providing the microtremor equipment.
REFERENCES [1] Sanchez-Sesma, F.J, Victor J. Palenzia, Francisco Luzon , Estimation of
Local Site Effects During earthquake: An overview. ISET Journal of
EarthquakeTtechnology, vol. 39, no.3, 2002, pp. 167 -193.
[2] Nakamura, Y., Gurler, E.D., Saita, J., Rovelli, A., Donati, Vulnerability investigation of roman colosseum using Microtremor. 12th WCEE 2000
in Auckland, NZ 2660/6/A.
[3] Gosar, A., Microtremor HVSR study for assessing site effects in the Bovec basin (NW Slovenia) related to 1998 Mw5.6 and 2004 Mw5.2
earthquakes. Engineering Geology 91 (2007), pp. 178–193.
[4] Herak, M,, Allegretti, I., Herak, D., Kuk, K., Kuk, V., Mari´c, K., Markuši´c, S., Stipˇcevi´c, J., HVSR of ambient noise in Ston (Croatia):
comparison with theoretical spectra and with the damage distribution
after the 1996 Ston-Slano earthquake. Bull Earthquake Eng , 2009, DOI 10.1007/s10518-009-9121-x
[5] Asrurifak M., Irsyam M., Budiono B., Triyoso W., Hendriyawan
Hendriyawan, Development of Spectral Hazard Map for Indonesia with

International Journal of Basic & Applied Sciences IJBAS-IJENS Vol: 11 No: 04 78
118804-9393 IJBAS-IJENS © August 2011 IJENS I J E N S
a Return Period of 2500 Years using Probabilistic Method, Civil
Engineering Dimension,2009, 12(1),2010: 52 – 62. [6] Nakamura, Y., A Method for Dynamic Characteristics Estimation of
Subsurface using Microtremor on the Ground Surface, Quarterly Report
of RTRI, Railway Technical Research Institute(RTRI), 1989,Vol. 30, No.1.
[7] Nakamura, Y., Seismic Vulnerability Indices For Ground and Structures
Using Microtremor, World Congress on Railway Research in Florence, Italy, November, 1997.
[8] Santosa S dan T. Sukarti, Peta Geologi Lembar Malang, Jawa, Pusat
Penelitian dan Pengembangan Geologi,Bandung, 1992. [9] Geopsy (Geophysical Signal Database for Noise Array Processing),
www.geopsy.org ,1997.
[10] SESAME, Guidelines for the implementation of the H/V spectral ratio technique on ambient vibrations: measurements, processing and
interpretation.http://sesame.fp5.obs.ujf%1Egrenoble.fr/Delivrables/Del
%1ED23%1EHV_User_Guidelines.pdf, 2004, 62 pp. [11] Bard, P.Y., Microtremor measurements: A tool for site effect estimation?
, Second International Symposium on the Effects of Surface Geology on
seismic Motion - ESG98. Yokohama, Japan, December 1998. [12] Sheng Wang and Hong Hao, Effects of Random variations of Soil
Properties on Site Amplification of seismic Ground Motion, Soil
Dynamics and Earthquake Engineering, Vol 22, issue 7, September 2002, pp. 551-564
[13] Yang Jun, Frequency-Dependent Amplification of Unsaturated surface
Soil Layer, Journal Geotech and Geoenvironmental Engineering, Vol 132, issue 4, April 2006, pp. 526-531.
[14] Nguyen, F., Teerlynck, H., Van Rompaey, G., Van Camp, M., Jongmans, D. and Camelbeeck, T, Use of microtremor measurement for
assessing site effects in Northern Belgium-interpretation of the observed
intensity during the Ms5.0, June 11, 1938 Earthquake. Journal of Seismology, 8(1) 41-56, 2009.
[15] Gosar, A, Site effects and soil-structure resonance study in the Kobarid
basin (NW Slovenia) using microtremors. Nat. Hazards Earth Syst. Sci., 2010, 10, 761–772.
[16] Field, E.H. & K.H. JacobB , A comparison and test of various site-
response estimation techniques, including three that are not reference-site dependent. Bulletin of the Seismological Society of America 85, No.
4, pp. 1127-1143, August 1995.
[17] Lachet, C. & P.-Y. Bard , Numerical and theoretical investigations on the possibilities and limitations of Nakamura’s technique. J. Phys. Earth
42, pp. 377-397, 1994.
[18] Nakamura, Y, Clear identification of fundamental idea of nakamura’s technique and its applications, Proc. Of the 12th World Congress on
Earthquake Engineering, Auckland, New Zealand, 200.
[19] Huang H.C., and Tseng Y.S, Characteristics of soil liquiefaction using H/V of microtremors in Yuan-Lin area, Taiwan, TAO, 2002,Vol.13,
no.3, pp 271-280.
[20] Daryono, Sutikno, J. sartohadi, Dulbahri, K.S Brotopuspito, Efek tapak lokal di Graben bantul berdasarkan pengukuran mikrotremor,
International Conference Earth Science and Technology,Yogyakarta, 6-7
Agustus 2009. [21] Ishihara,Kenji, Introduction to Dnyamic Soil Mechanism, January, 1978.
[22] Ombeline meeric, Stephane garambois, Jean-Philippe Malet, Heloise
Cadet, Philippe Gueguen and Denis jongmans, Seismic noise-based methods for soft-rock landslide characterization. Bul.Soc.Geol.fr, 2007,
no.2, pp 137-148.