Embed Size (px)
Citation preview
Intellectual Property, the Immigration Backlog,and a Reverse Brain-Drain
A m e r i c a ’s N e w I m m i g r a n t E n t r e p r e n e u r s , Pa r t I I I
August 2007
1
Intellectual Property, the Immigration Backlog, and a Reverse BrainDrain
America’s New Immigrant Entrepreneurs, Part III
Vivek Wadhwa Executive in Residence
Pratt School of Engineering, Duke University Wertheim Fellow
Labor & Worklife Program, Harvard Law School
Guillermina Jasso Professor
Department of Sociology New York University
Ben Rissing
Research Scholar and Project Manager Pratt School of Engineering, Master Duke University
Gary Gereffi
Director, Center on Globalization, Governance & Competitiveness, Professor Sociology Department
Duke University
Richard Freeman Herbert Asherman Chair in Economics
Director, Labor and Worklife Program, Harvard Law School Director, Labor Studies Program, National Bureau of Economic Research
Harvard University
Student Research Team: Ramakrishnan Balasubramanian, Lokesh Mrig, Liayo Wan PartTime Student Researchers: Zikai Chang, Varadarajan Jagannathan, Chun‐Tat Tan, Zhenyu Yang Special Thanks: Aneesh Chopra, secretary of technology, Commonwealth of Virginia; Chmura Economics and Analytics; NeoPatents; Joseph M. Costanzo; B. Lindsay Lowell; Robert Warren
2
Introduction The founders of the United States considered intellectual property worthy of a special place in the Constitution—“To promote the Progress of Science and useful Arts, by securing for limited Times to Authors and Inventors the exclusive Right to their respective Writings and Discoveries.”1 In today’s knowledge‐based economy, capturing value from intellectual capital and knowledge‐based assets has gained even more importance. Global competition is no longer for the control of raw materials, but for this productive knowledge. This paper is the third in a series of studies focusing on immigrants’ contributions to the competitiveness of the U.S. economy. Earlier research revealed a dramatic increase in the contributions of foreign nationals to U.S. intellectual property over an eight‐year period. In this paper, we offer a more refined measure of this change and seek to explain this increase with an analysis of the immigrant‐visa backlog for skilled workers. The key finding from this research is that the number of skilled workers waiting for visas is significantly larger than the number that can be admitted to the United States. This imbalance creates the potential for a sizeable reverse brain‐drain from the United States to the skilled workers’ home countries.
Summary Our earlier papers, “America’s New Immigrant Entrepreneurs” and “Entrepreneurship, Education and Immigration: America’s New Immigrant Entrepreneurs, Part II,” documented that one in four engineering and technology companies founded between 1995 and 2005 had an immigrant founder. We found that these companies employed 450,000 workers and generated $52 billion in revenue in 2006. Indian immigrants founded more companies than the next four groups (from U.K., China, Taiwan, and Japan) combined. Furthermore, these companies’ founders were very highly educated in science, technology, math, and engineering‐related disciplines, with 96 percent holding bachelor’s degrees and 75 percent holding master’s or PhD degrees.2 The analysis of the World Intellectual Property Organization (WIPO) database in this earlier work revealed that the percentage of foreign nationals contributing to U.S. international patent applications increased from an estimated 7.3 percent in 1998 to 24.2 percent in 2006. The largest foreign‐born group was from China (mainland and Taiwan). Indian nationals were second, followed by Canadians and the British. As the WIPO database records inventor nationality at the time of filing, these numbers do not include the contributions of immigrants who became U.S. citizens before filing patent applications.3 In this paper, we expand on this earlier research to gain a more robust understanding of the impact of foreign‐born citizens to U.S. intellectual property and to explain the increasing numbers of foreign nationals contributing to U.S. international patent applications. First, our research team downloaded several years of additional data from the
3
WIPO database to refine our previous estimates and obtain demographic information. We inspected each record to identify inventors with Indian‐ and Chinese‐heritage names to identify and include foreign‐born citizens. In an effort to explain the increase in the contributions of foreign nationals, we examined extensive information published by the U.S. Departments of Homeland Security, Labor, and State. We used this information to create detailed estimates of the numbers of foreign nationals residing in the United States who are waiting for legal permanent resident status. We also reviewed the “New Immigrant Survey” to gain insight into the process of becoming a legal permanent resident and the potential that, even after becoming legal permanent residents, they might return home. Our key findings include:
ForeignNational Contributions to U.S. International Patent Applications
• Foreign nationals residing in the United States were named as inventors or co‐inventors in 25.6 percent of international patent applications filed from the United States in 2006. This represents an increase from 7.6 percent in 1998.
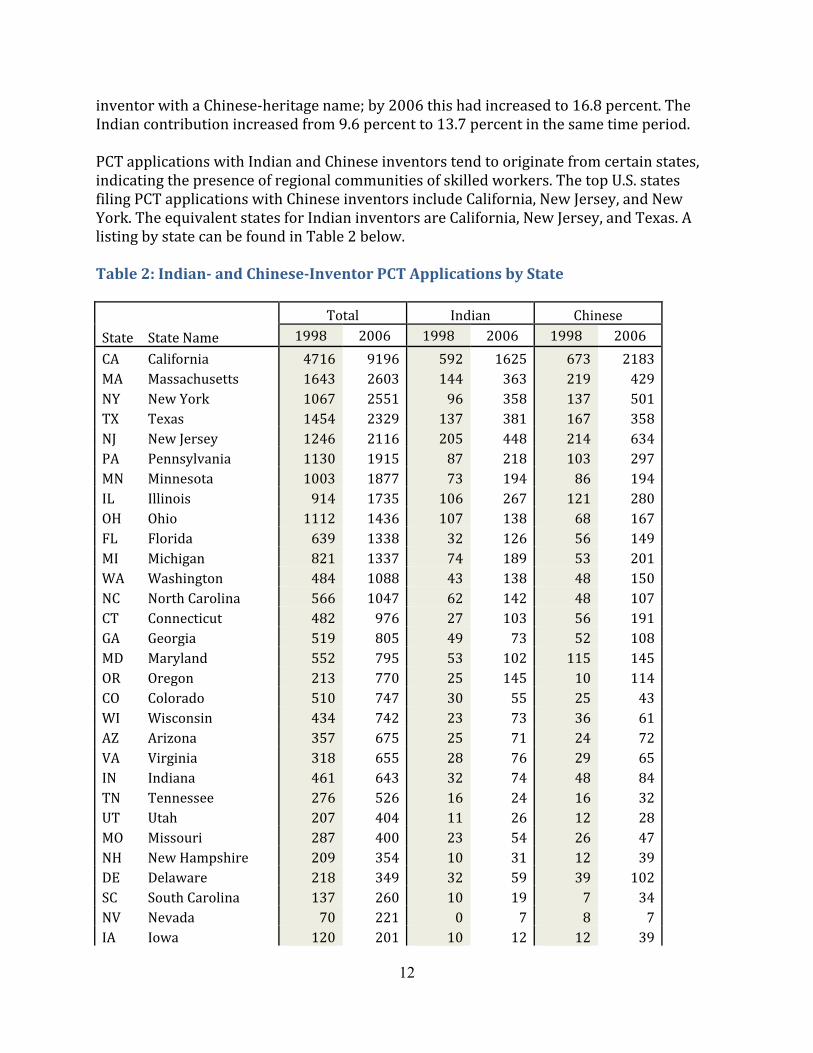
• Foreign‐national contributions to international patent applications were highest in California, Massachusetts, and New Jersey.
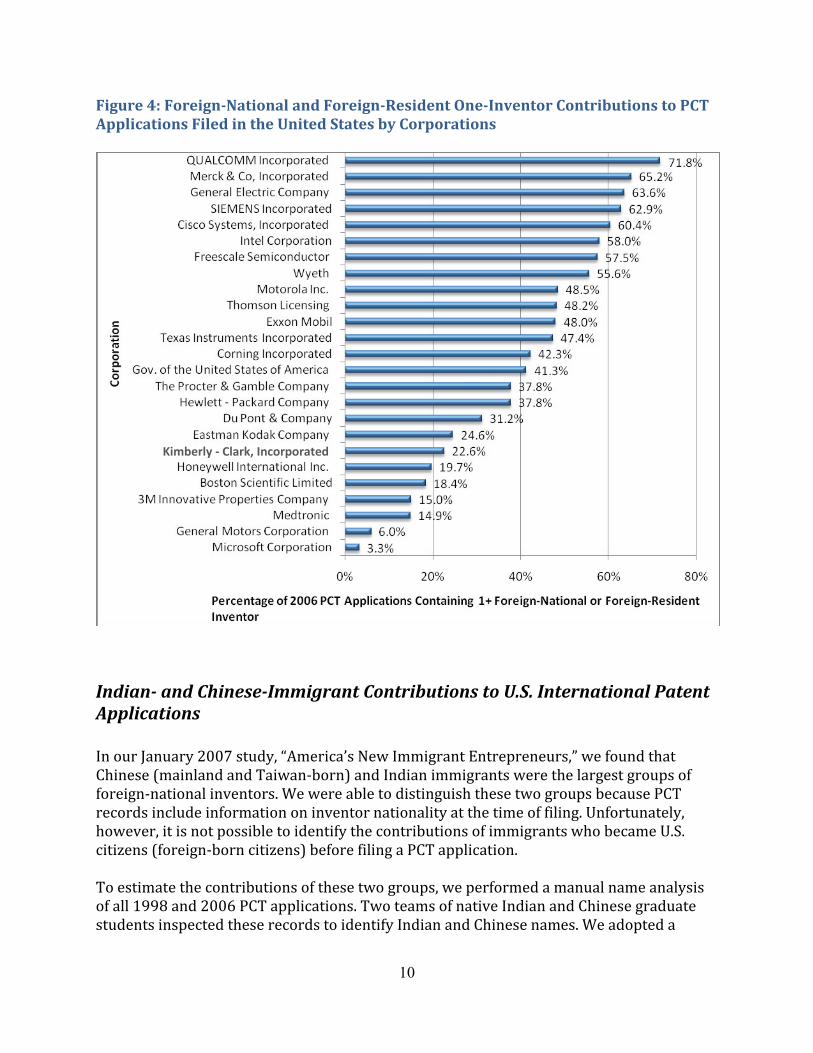
• Foreign nationals and foreign residents contributed to more than half of the international patents filed by a number of large, multi‐national companies, including Qualcomm (72 percent), Merck & Co. (65 percent), General Electric (64 percent), Siemens (63 percent), and Cisco (60 percent). Foreign nationals contributed to relatively smaller numbers of international patent applications at other firms, such as Microsoft (3 percent) and General Motors (6 percent). Forty‐one percent of the patents filed by the U.S. government had foreign nationals or foreign residents as inventors or co‐inventors. (Foreign‐national inventors are individuals with foreign citizenship working in the United States. Foreign resident inventors have foreign citizenship and are not based in the United States.)
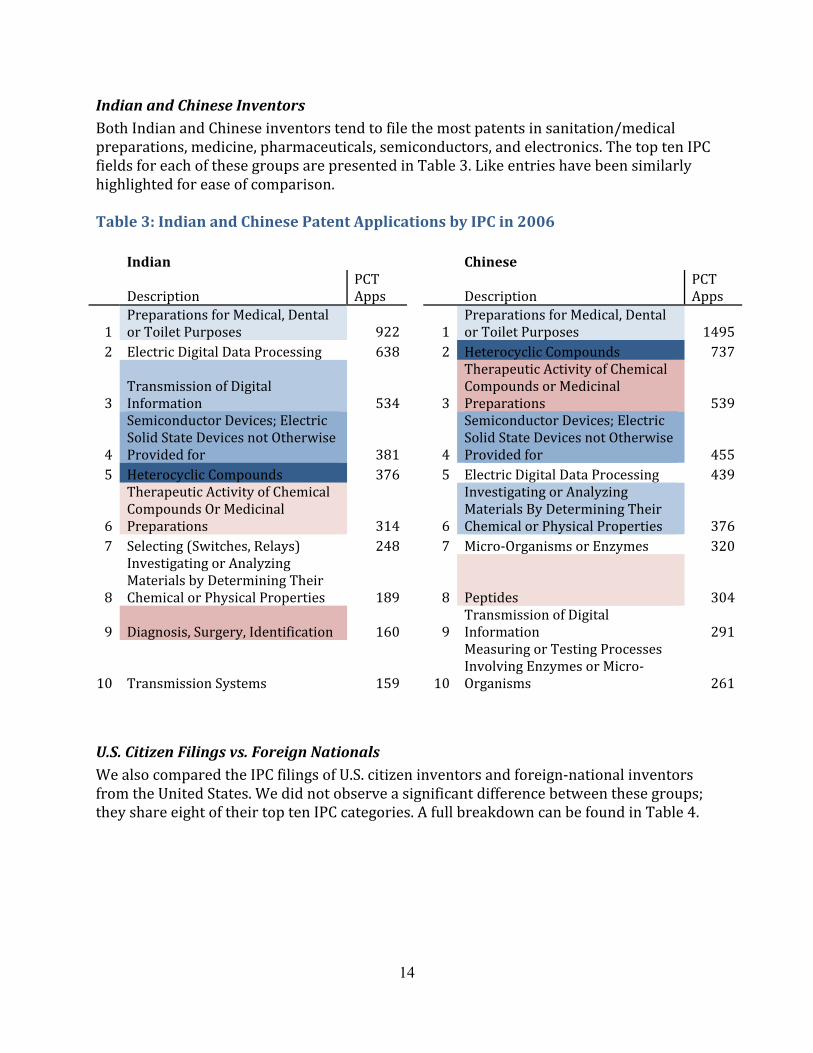
Indian and Chinese Inventors
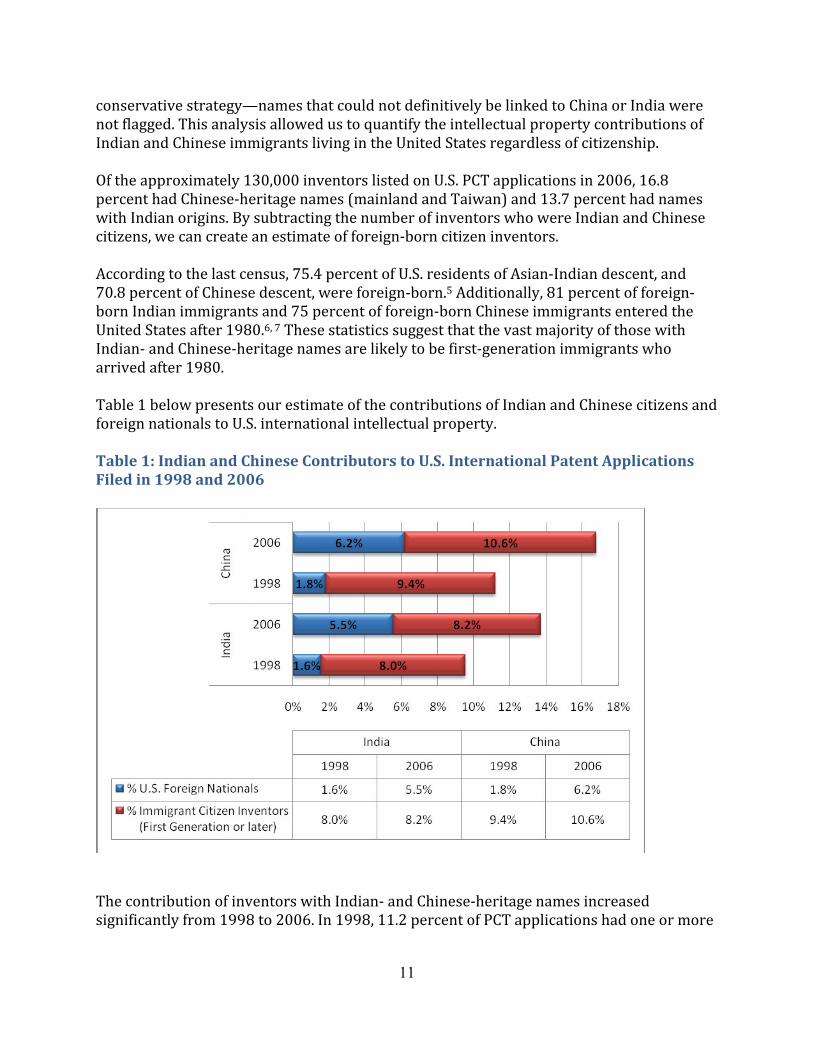
• In 2006, 16.8 percent of international patent applications from the United States had an inventor or co‐inventor with a Chinese‐heritage name, representing an increase from 11.2 percent in 1998. The contribution of inventors with Indian‐heritage names increased to 13.7 percent from 9.5 percent in the same period.
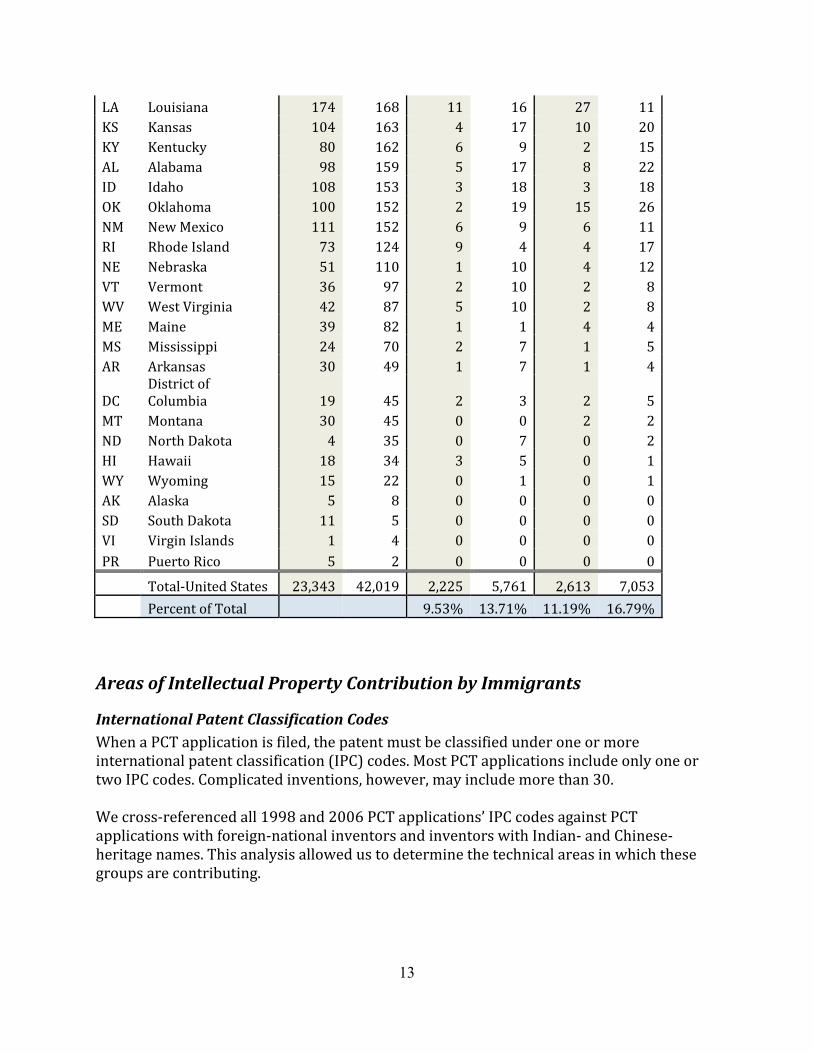
• Chinese inventors tended to reside in California, New Jersey, and New York. Indian inventors chose California, New Jersey, and Texas.
• Both Indian and Chinese inventors tended to file most patents in the fields of sanitation/medical preparations, pharmaceuticals, semiconductors, and electronics.

4
The Growing Immigration Backlog We estimate that as of 30 September 2006 there were 500,040 principals in the main employment‐based categories and an additional 555,044 family members awaiting legal permanent resident status in the United States.
• The number of employment‐based principals waiting for labor certification—the first step in the U.S. immigration process—was estimated at 200,000 in 2006.
• The number of pending I‐140 applications—the second step of the immigration process—stood at 50,132 in 2006. This was more than seven times the total in 1996 (6,743).
• The number of employment‐based principals with approved I‐140 applications and unfiled or pending I‐485s—the last step in the immigration process—was estimated at 309,823 in 2006, representing almost a three‐fold increase from the previous decade.
• Overall, we estimate that the number of employment‐based principals (in the three main employment visa categories—EB‐1, EB‐2, and EB‐3) waiting for legal permanent residence in the United States in 2006 was 500,040.
• The total number of employment‐based principals in the focal employment categories and their family members waiting for legal permanent residence in the United States in 2006 was estimated at 1,055,084. We further estimate that 126,421 residents abroad were also waiting for U.S. legal permanent residence, giving a worldwide total of 1,181,505.
We also gathered estimates of the numbers of students and skilled temporary workers. There is some overlap between this group and the estimates above; the two totals, therefore, cannot be added together.
• In the 2005‐2006 academic year, 259,717 international graduate students were studying in the United States. In addition, 38,096 were in practical training, and at least some of these individuals were likely to be postdoctoral scholars.
• A previous study estimated the 2004 population of all H and L workers (all Hs except H4 spouses, plus L1) at 704,000.
A Reverse BrainDrain? Approximately 120,120 permanent resident visas are available annually for employment‐based principals and their family members in the three main employment visa categories (EB‐1, EB‐2, and EB‐3). Additionally, the number of visas that can be issued to immigrants from any one of the major sending countries—China, India, Mexico, and Philippines—is less than 10,000 per year (7 percent of the total pool of 120,120 available visas per country). Our estimates indicate that there are more than 1 million individuals waiting in line for legal permanent resident status. The wait time for visas for countries with the largest populations, like India and China, ranged to four years in June—not counting visa
5
processing time – and may be even higher when visas are again available in October. This backlog is likely to increase substantially, given the limited number of visas available. Evidence from the “New Immigrant Survey” indicates that approximately one in five new legal immigrants and about one in three employment principals either plan to leave the United States or are uncertain about remaining. Moreover, media reports suggest that increasing numbers of skilled workers have begun to return home to countries like India and China where the economies are booming. Given the substantial role of foreign‐born residents in the United States in international patent creation, and the huge backlog in granting visas to employment‐based principals, the potential exists for a reverse brain‐drain of skilled workers who contribute to U.S. global competitiveness.
6
International Patents Before the era of globalization, patents filed with the U.S. Patent and Trademark Office (USPTO) were of principal importance to many corporations. Today, however, international patents are becoming increasingly important. The World Intellectual Property Organization (WIPO) is an international group that regulates and governs global intellectual property. One of the United Nations’ 16 special agencies, it has close to 200 member states. The first step toward obtaining intellectual property protection through WIPO is to file a Patent Cooperation Treaty (PCT) application. This treaty, an international agreement recognized by more than 125 countries, allows an individual or corporation to file a single application to seek simultaneous protection for an invention in a multitude of countries worldwide. This system allows inventors to bypass the time‐consuming process of applying for separate national or regional patent protection.4 In this paper, we focus on PCT applications filed though WIPO’s U.S. receiving office. These generally are a subset of patent applications filed with the U.S. Patent and Trademark Office (USPTO). The PCT applications, however, arguably represent some of the most sophisticated inventions originating in this country. Not only does the perceived need for international intellectual property protection indicate that the inventions are characterized by a higher level of sophistication than those only submitted to the USPTO, but also the costly and time‐intensive application process for PCT patents suggests that inventions described in PCT applications largely have market potential in multiple countries, global visibility, and diverse applications. Our original study, “America’s New Immigrant Entrepreneurs,” presented several estimates of foreign‐national inventor contributions to U.S. international patent applications. For this paper, we downloaded several years of complete WIPO data in order to refine these estimates and present concrete numbers. Appendix A details the methodology utilized in this analysis. In our previous work, we used the terms “immigrant citizens” and “immigrant non‐citizens” to differentiate between foreign nationals who had become citizens before filing PCT applications and those who had not. In this paper, we instead refer to these groups as “foreign‐born citizens” and “foreign nationals.”
ForeignNational Contributions to U.S. International Patent Applications In our January 2007 paper, “America’s New Immigrant Entrepreneurs,” we estimated foreign‐national contributions to PCT applications filed though the U.S. receiving office. These estimates were calculated by indexing inventor records from all countries that filed
7
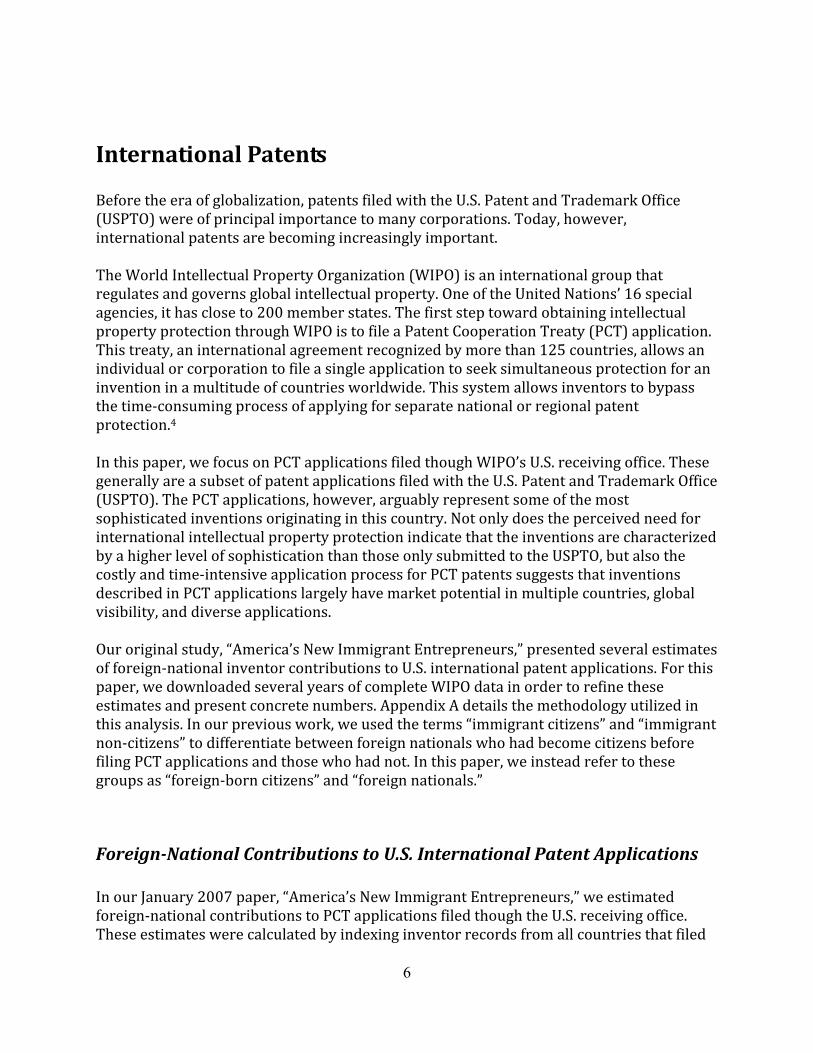
PCT applications in the United States. We then added each country’s PCT filing activity and applied a discount factor to compensate for PCT applications with inventors from multiple countries. For this paper, we reanalyze the full 1998 and 2006 WIPO records to produce an exact count of foreign‐national activities in these years. Foreign nationals residing in the United States were named as inventors or co‐inventors in 25.6 percent of international patent applications filed from the United States in 2006. This represented an increase from 7.6 percent in 1998. Figure 1 presents this change over time. Figure 1: ForeignNational Contribution to U.S. PCT Applications from 19982006*
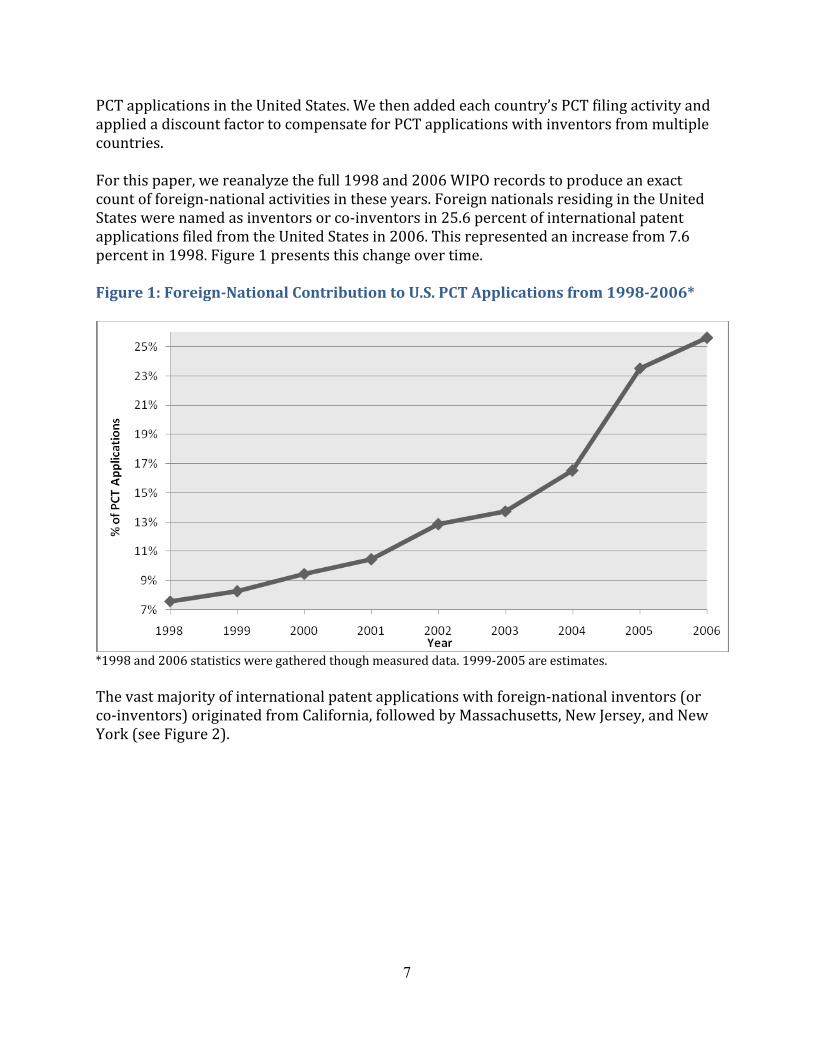
*1998 and 2006 statistics were gathered though measured data. 1999‐2005 are estimates. The vast majority of international patent applications with foreign‐national inventors (or co‐inventors) originated from California, followed by Massachusetts, New Jersey, and New York (see Figure 2).
8
Figure 2: U.S. International Patent Applications by State in 2006
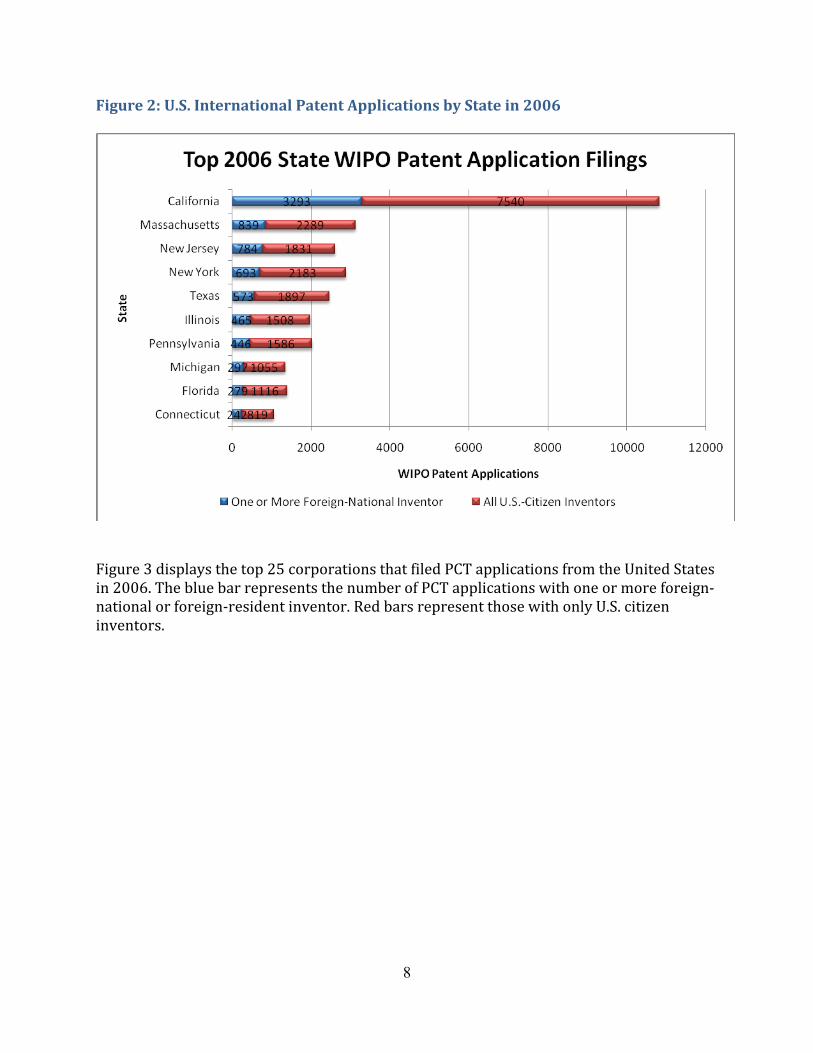
Figure 3 displays the top 25 corporations that filed PCT applications from the United States in 2006. The blue bar represents the number of PCT applications with one or more foreign‐national or foreign‐resident inventor. Red bars represent those with only U.S. citizen inventors.
9
Figure 3: 2006 U.S. International Patent Applications by Corporations
While each of these 25 corporations are actively involved in securing intellectual property protection, the breakdown of inventor nationality at these firms differs significantly. Figure 4 displays the percentage of all PCT applications filed by these corporations that contained one or more foreign‐national inventor.
10
Figure 4: ForeignNational and ForeignResident OneInventor Contributions to PCT Applications Filed in the United States by Corporations
Indian and ChineseImmigrant Contributions to U.S. International Patent Applications In our January 2007 study, “America’s New Immigrant Entrepreneurs,” we found that Chinese (mainland and Taiwan‐born) and Indian immigrants were the largest groups of foreign‐national inventors. We were able to distinguish these two groups because PCT records include information on inventor nationality at the time of filing. Unfortunately, however, it is not possible to identify the contributions of immigrants who became U.S. citizens (foreign‐born citizens) before filing a PCT application. To estimate the contributions of these two groups, we performed a manual name analysis of all 1998 and 2006 PCT applications. Two teams of native Indian and Chinese graduate students inspected these records to identify Indian and Chinese names. We adopted a
Kimberly ‐ Clark, Incorporated
11
conservative strategy—names that could not definitively be linked to China or India were not flagged. This analysis allowed us to quantify the intellectual property contributions of Indian and Chinese immigrants living in the United States regardless of citizenship. Of the approximately 130,000 inventors listed on U.S. PCT applications in 2006, 16.8 percent had Chinese‐heritage names (mainland and Taiwan) and 13.7 percent had names with Indian origins. By subtracting the number of inventors who were Indian and Chinese citizens, we can create an estimate of foreign‐born citizen inventors. According to the last census, 75.4 percent of U.S. residents of Asian‐Indian descent, and 70.8 percent of Chinese descent, were foreign‐born.5 Additionally, 81 percent of foreign‐born Indian immigrants and 75 percent of foreign‐born Chinese immigrants entered the United States after 1980.6, 7 These statistics suggest that the vast majority of those with Indian‐ and Chinese‐heritage names are likely to be first‐generation immigrants who arrived after 1980. Table 1 below presents our estimate of the contributions of Indian and Chinese citizens and foreign nationals to U.S. international intellectual property. Table 1: Indian and Chinese Contributors to U.S. International Patent Applications Filed in 1998 and 2006
The contribution of inventors with Indian‐ and Chinese‐heritage names increased significantly from 1998 to 2006. In 1998, 11.2 percent of PCT applications had one or more
12
inventor with a Chinese‐heritage name; by 2006 this had increased to 16.8 percent. The Indian contribution increased from 9.6 percent to 13.7 percent in the same time period. PCT applications with Indian and Chinese inventors tend to originate from certain states, indicating the presence of regional communities of skilled workers. The top U.S. states filing PCT applications with Chinese inventors include California, New Jersey, and New York. The equivalent states for Indian inventors are California, New Jersey, and Texas. A listing by state can be found in Table 2 below. Table 2: Indian and ChineseInventor PCT Applications by State Total Indian Chinese State State Name 1998 2006 1998 2006 1998 2006 CA California 4716 9196 592 1625 673 2183MA Massachusetts 1643 2603 144 363 219 429NY New York 1067 2551 96 358 137 501TX Texas 1454 2329 137 381 167 358NJ New Jersey 1246 2116 205 448 214 634PA Pennsylvania 1130 1915 87 218 103 297MN Minnesota 1003 1877 73 194 86 194IL Illinois 914 1735 106 267 121 280OH Ohio 1112 1436 107 138 68 167FL Florida 639 1338 32 126 56 149MI Michigan 821 1337 74 189 53 201WA Washington 484 1088 43 138 48 150NC North Carolina 566 1047 62 142 48 107CT Connecticut 482 976 27 103 56 191GA Georgia 519 805 49 73 52 108MD Maryland 552 795 53 102 115 145OR Oregon 213 770 25 145 10 114CO Colorado 510 747 30 55 25 43WI Wisconsin 434 742 23 73 36 61AZ Arizona 357 675 25 71 24 72VA Virginia 318 655 28 76 29 65IN Indiana 461 643 32 74 48 84TN Tennessee 276 526 16 24 16 32UT Utah 207 404 11 26 12 28MO Missouri 287 400 23 54 26 47NH New Hampshire 209 354 10 31 12 39DE Delaware 218 349 32 59 39 102SC South Carolina 137 260 10 19 7 34NV Nevada 70 221 0 7 8 7IA Iowa 120 201 10 12 12 39
13
LA Louisiana 174 168 11 16 27 11KS Kansas 104 163 4 17 10 20KY Kentucky 80 162 6 9 2 15AL Alabama 98 159 5 17 8 22ID Idaho 108 153 3 18 3 18OK Oklahoma 100 152 2 19 15 26NM New Mexico 111 152 6 9 6 11RI Rhode Island 73 124 9 4 4 17NE Nebraska 51 110 1 10 4 12VT Vermont 36 97 2 10 2 8WV West Virginia 42 87 5 10 2 8ME Maine 39 82 1 1 4 4MS Mississippi 24 70 2 7 1 5AR Arkansas 30 49 1 7 1 4
DC District of Columbia 19 45 2 3 2 5
MT Montana 30 45 0 0 2 2ND North Dakota 4 35 0 7 0 2HI Hawaii 18 34 3 5 0 1WY Wyoming 15 22 0 1 0 1AK Alaska 5 8 0 0 0 0SD South Dakota 11 5 0 0 0 0VI Virgin Islands 1 4 0 0 0 0PR Puerto Rico 5 2 0 0 0 0
Total‐United States 23,343 42,019 2,225 5,761 2,613 7,053 Percent of Total 9.53% 13.71% 11.19% 16.79%
Areas of Intellectual Property Contribution by Immigrants
International Patent Classification Codes When a PCT application is filed, the patent must be classified under one or more international patent classification (IPC) codes. Most PCT applications include only one or two IPC codes. Complicated inventions, however, may include more than 30. We cross‐referenced all 1998 and 2006 PCT applications’ IPC codes against PCT applications with foreign‐national inventors and inventors with Indian‐ and Chinese‐ heritage names. This analysis allowed us to determine the technical areas in which these groups are contributing.
14
Indian and Chinese Inventors Both Indian and Chinese inventors tend to file the most patents in sanitation/medical preparations, medicine, pharmaceuticals, semiconductors, and electronics. The top ten IPC fields for each of these groups are presented in Table 3. Like entries have been similarly highlighted for ease of comparison. Table 3: Indian and Chinese Patent Applications by IPC in 2006 Indian Chinese
Description PCT Apps Description
PCT Apps
1 Preparations for Medical, Dental or Toilet Purposes 922 1
Preparations for Medical, Dental or Toilet Purposes 1495
2 Electric Digital Data Processing 638 2 Heterocyclic Compounds 737
3 Transmission of Digital Information 534 3
Therapeutic Activity of Chemical Compounds or Medicinal Preparations 539
4
Semiconductor Devices; Electric Solid State Devices not Otherwise Provided for 381 4
Semiconductor Devices; Electric Solid State Devices not Otherwise Provided for 455
5 Heterocyclic Compounds 376 5 Electric Digital Data Processing 439
6
Therapeutic Activity of Chemical Compounds Or Medicinal Preparations 314 6
Investigating or Analyzing Materials By Determining Their Chemical or Physical Properties 376
7 Selecting (Switches, Relays) 248 7 Micro‐Organisms or Enzymes 320
8
Investigating or Analyzing Materials by Determining Their Chemical or Physical Properties 189 8 Peptides 304
9 Diagnosis, Surgery, Identification 160 9Transmission of Digital Information 291
10 Transmission Systems 159 10
Measuring or Testing Processes Involving Enzymes or Micro‐Organisms 261
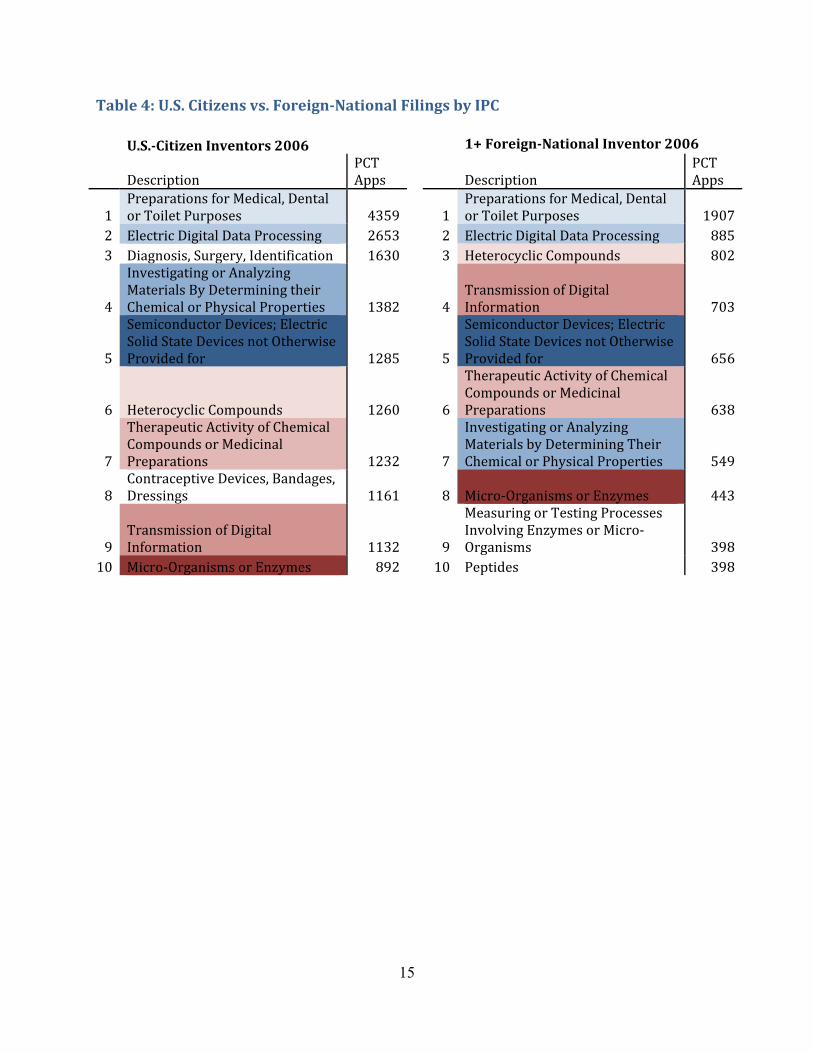
U.S. Citizen Filings vs. Foreign Nationals We also compared the IPC filings of U.S. citizen inventors and foreign‐national inventors from the United States. We did not observe a significant difference between these groups; they share eight of their top ten IPC categories. A full breakdown can be found in Table 4.
15
Table 4: U.S. Citizens vs. ForeignNational Filings by IPC U.S.Citizen Inventors 2006 1+ ForeignNational Inventor 2006
Description PCT Apps Description
PCT Apps
1 Preparations for Medical, Dental or Toilet Purposes 4359 1
Preparations for Medical, Dental or Toilet Purposes 1907
2 Electric Digital Data Processing 2653 2 Electric Digital Data Processing 8853 Diagnosis, Surgery, Identification 1630 3 Heterocyclic Compounds 802
4
Investigating or Analyzing Materials By Determining their Chemical or Physical Properties 1382 4
Transmission of Digital Information 703
5
Semiconductor Devices; Electric Solid State Devices not Otherwise Provided for 1285 5
Semiconductor Devices; Electric Solid State Devices not Otherwise Provided for 656
6 Heterocyclic Compounds 1260 6
Therapeutic Activity of Chemical Compounds or Medicinal Preparations 638
7
Therapeutic Activity of Chemical Compounds or Medicinal Preparations 1232 7
Investigating or Analyzing Materials by Determining Their Chemical or Physical Properties 549
8 Contraceptive Devices, Bandages, Dressings 1161 8 Micro‐Organisms or Enzymes 443
9 Transmission of Digital Information 1132 9
Measuring or Testing Processes Involving Enzymes or Micro‐Organisms 398
10 Micro‐Organisms or Enzymes 892 10 Peptides 398
16
The Growing Immigration Backlog As detailed earlier, the percentages of U.S. international patent applications with contributions from foreign nationals increased from 7.6 percent in 1998 to 25.6 percent in 2006. To explain this increase and understand the correlation with immigration trends, we developed a methodology to estimate the population of skilled immigrants from which such inventors may originate. No such data are available from the U.S. State Department or the Citizenship and Immigration Services (USCIS).
The basics
Process A skilled worker who wants to become a legal permanent resident (LPR) of the United States based on employment must, in most cases, have a permanent employment offer from a U.S.‐based firm. There are several steps in the immigration process:
1. The employer must, in most cases, file a labor certification request with the Department of Labor’s Employment and Training Administration.
2. Once the labor certification is approved (if needed), the employer must file a Petition for Alien Worker (Form I‐140) with the USCIS for the worker. The employer needs to demonstrate that the company is in a good financial position and capable of paying the salary advertised for the job. In some cases, the worker can self‐petition.
3. Once the I‐140 is approved, the employee must wait for the State Department to provide a visa number, which indicates that an immigrant visa is available for the applicant.
4. If already in the United States, the employee now must file for adjustment of status (I‐485) for himself/herself and family members.
Eligibility There are five categories for granting permanent residence to foreign nationals based on employment. We focus on the first three:
EB‐1 Priority workers
• Foreign nationals of extraordinary ability in the sciences, arts, education, business, or athletics
• Foreign nationals who are outstanding professors or researchers • Foreign nationals who are managers and executives subject to international
transfer to the United States
17
EB‐2 Professionals with advanced degrees or persons with exceptional ability
• Foreign nationals of exceptional ability in the sciences, arts, or business • Foreign nationals who are advanced‐degree professionals • Qualified alien physicians who will practice medicine in an underserved area of
the United States. EB‐3 Skilled or professional workers
• Foreign national professionals with bachelor’s degrees (not qualifying for a higher‐preference category)
• Foreign‐national skilled workers (minimum two years training and experience) • Foreign national unskilled workers
Other Visas Foreign nationals who file U.S. international patents also include persons who acquire LPR on family or diversity visas, as well as persons with temporary visas such as:
1. H‐1B temporary work visa for specialty occupations, which requires theoretical and practical application of a body of specialized knowledge along with at least a bachelor’s degree or its equivalent.
2. L‐1 visas for intra‐company transferees (foreign nationals employed by a company that has offices both in the United States and abroad).
3. F‐1 visas to study or conduct research at an accredited U.S. College or University.
Background and objectives Every year, approximately one million persons are admitted to LPR in the United States. More than half of them are already residing in the United States and adjust their status from a legal temporary visa or from undocumented status. Henceforth in this paper, these individuals will be referred to as ‘adjustees.’ For example, during the ten‐year period from 1996 to 2005, the number of adjustees exceeded that of new arrivals in every year except three (1998, 1999, and 2003—years in which administrative and staffing conditions produced large backlogs in immigrant visa processing in offices of the INS and its successor agency, CIS), and for the entire period, the proportion adjustee was 55.8 percent. Until recently, little was known about the adjustee subset of new LPRs, and even less after 2002. Traditionally, the INS and, subsequently, USCIS published tabulations in the Statistical Yearbook, which provided the immediately preceding nonimmigrant category of new adjustee LPRs and the year of admission to that nonimmigrant category (e.g., Tables 10 and 11 in the Statistical Yearbook of 2000). Fiscal Year 2002 was the last year for which
18
the Yearbooks provided this information. Since then, the Yearbook has included only the breakdown of adjustees and new arrivals for every immigrant visa category. Fortuitously, the “New Immigrant Survey,” the first nationally representative longitudinal study of new legal immigrants1, has collected extensive data on the immigrant cohort of 2003. More than 8,500 main sampled adult immigrants were interviewed at, on average, four‐and‐a‐half months after admission to LPR, and the second round of interviews began in June 2007. From these data we learn the following, for example:
1. For the 2003 cohort, the average time to LPR since filing of the first application that started the visa process was 4.4 years (4.2 for adjustees and also for adjustee employment principals).
2. The process of applying for an LPR visa is sufficiently arduous that approximately
17.4 percent of new legal immigrants became depressed as a result of the visa process (18.7 percent of adjustees and 21.9 percent of adjustee employment principals).
3. 21.7 percent of new legal immigrants either plan to leave the United States or are
uncertain about remaining (34.5 percent of both employment principals and adjustee employment principals).
Visa processing times have been increasing due, it is thought, to twin causes: the increase in applications and the post‐9/11 increase in background checks of applicants. These increases in visa processing times are distinct from the waiting times for numerically restricted visas, as will be discussed below. Concomitantly, the agencies involved have established aggressive plans to eliminate the ensuing backlogs. For example, the Department of Labor’s Employment and Training Administration, which adjudicates labor certification petitions, is scheduled to completely eliminate its backlog by the end of Fiscal Year 2007 (30 September 2007); the INS/CIS had special funds to reduce backlogs during the five‐year period Fiscal Year 2002‐2006, and in June 2007 adjudicated so many immigration applications that all employment‐based visas for Fiscal Year 2007 were used (Department of State 2007b). Waiting for visa processing makes a stressful time even more stressful, notwithstanding the relief available to some of those waiting for their visas in the United States while in a nonimmigrant status, notably in the form of employment authorization and travel permission for both principals and accompanying spouses and children. The question thus arises: How many persons are waiting to adjust to LPR in the United States? One important subset of what we may call the pre‐LPR population involves immigrants in line for employment‐based visas. Accordingly, the question addressed in this
1 For description of the “New Immigrant Survey” project, see Jasso, Massey, Rosenzweig, and Smith (in press), available online at http://nis.princeton.edu.
19
section is: How many employment principals are waiting to adjust to LPR in the United States? It is a pressing question and one for which there is no official answer, due, apparently, to technical constraints of the USCIS case processing system. As the CIS Ombudsman observed in the annual report to Congress, submitted in June (2007, p. 13):
Failing to correct the system annually results in hundreds, if not thousands, of wasted hours by all levels of USCIS leadership in trying to account for an often asked question by Congress, the Ombudsman, stakeholders, and others: “Exactly how many employmentbased green card applications does the agency have pending?” USCIS still cannot answer that question today with certainty.
To correctly pose the question, and thus to make progress in answering it, it is important to distinguish between two elements in the wait for adjustment to LPR. The first involves availability of numerically limited visas. The total number of visas available annually to principals and family members in EB‐1, EB‐2, and EB‐3 is approximately 120,120. The second element involves processing delays at each step of the visa process—in processing the labor certification application (ETA 9089), the employer’s (or, in some cases, self‐) petition for an alien worker (I‐140), and the prospective immigrant’s application to adjust status (I‐485). The two are interrelated. As the State Department has been noting in its monthly Visa Bulletins since June 2004 (but see especially the issue for January 2005) and as the CIS Ombudsman has been discussing, clearing I‐485 backlogs means that numerical caps are reached and employment visas are no longer available. Thus, prospective immigrants are stranded at the first or second step, unable to submit the I‐485. The impact of this intertwining of numerical limitations and visa processing is periodically felt, for example, in January 2005, when application cutoff dates of January 2002 were placed on the employment third preference category for nationals of China, India, and the Philippines, and most recently on 2 July 2007, when the State Department updated its previous Visa Bulletin for July and announced that all employment categories had become unavailable for the rest of the fiscal year (an announcement subsequently rescinded on 17 July, when the State Department and USCIS reinstated the original Visa Bulletin for July, in which all employment‐based categories except the subcategory of the third preference for “other workers” are current, and extended the filing period until 17 August).2 Notwithstanding their interrelatedness, it is of the utmost importance to distinguish between these two distinct elements of the wait for adjustment to LPR. Among other things, relief for the two is of very different kinds, as the numerical caps are governed by statute, while application processing is governed by agency management practices.
2 Of course, the impact of the numerical caps has long been felt in the family preference categories, where all categories have substantial backlogs and the extreme case is that of the 22‐year wait for nationals of the Philippines in the category for siblings of U.S. citizens.
20
At the outset, it also is useful to note that the current immigration debate has popularized a false dichotomy between skilled immigrants and family immigrants. In practice, many skilled immigrants acquire LPR as family immigrants, especially as spouses of U.S. citizens, as will be discussed below. It is not unusual for a prospective employer, upon learning of the principal’s marriage to a U.S. citizen, to suggest that he or she get the visa as a spouse rather than as an employee, for “the process is easier that way.” Moreover, even skilled immigrants who immigrate as workers have spouses and children, not all of whom work. Further, note that U.S. citizens may be superior to employers in screening future citizens, as they are thinking of the long term rather than the short term (Jasso and Rosenzweig 1995). In the following sections, we address the question of the size of the pre‐LPR population, refine it, note special subgroups of interest, consider estimation strategies, and provide a numerical estimate.
Preliminaries We focus on employment principals who are going through the visa process in the United States; specifically, on principals in the first, second, and third employment‐based immigrant visa categories EB‐1, EB‐2, and EB‐3. In the rest of this paper, we refer to this set as “employment principals.” For some purposes, the focus is on highly skilled employment‐based immigrants, and this set consists of the employment principals, as just defined, minus the small subcategory of EB‐3 reserved for “other workers.” However, much of the available information that will be used for estimating the pre‐LPR population pertains to the employment categories together and does not permit removing the “other workers.” Thus, we focus on the first, second, and third employment‐based visa categories.3 The visa process lasts from the filing of the first application to the date of admission to LPR. In general, the priority date for the case is assigned based on the first application filing. For EB‐2 and EB‐3 cases, the first application is the Application for Permanent Employment Certification (ETA Form 9089, formerly Form 750), and for EB‐1 cases, the first application is the Petition for Alien Worker (I‐140). EB‐2 and EB‐3 cases file the I‐140 after labor certification is obtained. Note that self‐petition on the I‐140 is permitted for one subcategory of EB‐1 cases (the first of three subcategories, viz., those with “extraordinary ability in the sciences, arts, education, business, or athletics which has been demonstrated by sustained national or international acclaim and whose achievements have been recognized in the field through extensive documentation”) and one subset of EB‐2 cases (those who obtain a national interest waiver).
3 The fourth and fifth employment categories are not of interest here; the fourth is largely for
ministers and other religious workers, and the fifth for investors. Moreover, note that these categories are quite small. For example, in Fiscal Year 2006, of the 159,081 immigrants admitted with employment visas, only 10,288 visas, or 6.5 percent, went to these categories.
21
Persons with temporary U.S. visas can file for adjustment of status if the visa for which they qualify is immediately available. In the employment sphere, this means that the visa category must be “current,” in State Department parlance. In this case, prospective immigrants submit the Application to Register Permanent Residence or Adjust Status (I‐485). The classical sequence of steps in the visa process for a prospective employment‐based immigrant already in the United States was, first, to file for labor certification (if needed); second, upon granting of labor certification, to file the I‐140; and third, upon approval of the I‐140, to file the I‐485 for adjustment of status if a visa number is available (or as soon as it becomes available). However, for the past five years (since 31 July 2002) immigrants have been permitted to file both the I‐140 and the I‐485 at the same time—a process known as concurrent filing—provided, of course, that a visa number is available. It is illuminating to track the availability of employment‐based visas. For example, in January 2007, EB‐1 visas were current, EB‐2 visas were current for everyone except nationals of China and India (whose cutoff dates were, respectively, 22 April 2005 and 8 January 2003), and EB‐3 had cutoff dates in place worldwide. In July, EB‐2 and EB‐3 (excepting the “other workers” subcategory, which was unavailable) were made current worldwide. As explained by the State Department (2007a) in its Visa Bulletin for July, posted on 12 June:
This has been done in an effort to generate increased demand by Citizenship and Immigration Services (CIS) for adjustment of status cases, and to maximize number use under the annual numerical limit. However, all readers should be alert to the possibility that not all Employment preferences will remain Current for the remainder of the fiscal year. Should the rate of demand for numbers be very heavy in the coming months, it could become necessary to retrogress some cutoff dates for September, most likely for Chinamainland born and India, but also possibly for Mexico and Philippines. Severe cutoff date retrogressions are likely to occur early in FY [Fiscal Year] 2008.
But the “current” designation was short‐lived. The State Department (2007b) issued an Update to the Visa Bulletin on 2 July stating that “sudden backlog reduction efforts by Citizenship and Immigration Services Offices during the past month have resulted in the use of almost 60,000 Employment numbers.” Thus, it was announced, all employment numbers had been used, the employment categories were no longer “current,” and prospective immigrants could not submit the I‐485 until 1 October 2007, the start of the next fiscal year . However, the State Department (2007c) and USCIS announced on 17 July that the rules in the original Visa Bulletin for July were being re‐instated and extended the filing period until 17 August. The August Visa Bulletin also said that, after 17 August, all employment‐based categories would be unavailable until the start of the new fiscal year. The population of interest thus consists of persons in the United States for whom the labor certification or I‐140 is filed, even if the visa is not currently available, plus persons filing to
22
adjust their status. As mentioned above, the wait for the immigrant visa consists of two kinds of waiting times, the first pertaining to the wait for a numerically limited visa (i.e., a “visa number”) and the second pertaining to visa processing, which is associated with all three applications. It may happen that visa processing for the labor certification and the I‐140 are completed before the visa number becomes available. For such cases, all the experience of visa processing delay pertains to the I‐485. Alternatively, it may happen that a visa number is available, but that there is a delay for processing the labor certification and a subsequent delay in processing the I‐140, which, in this case, can be filed concurrently with the I‐485. We may call the first kind of waiting time the visa number time and the second kind the visa processing time. Our objective, then, is to estimate the size of the population who (1) have a priority date, (2) are in line for a principal visa in EB‐1, EB‐2, or EB‐3, and (3) are in the United States. In principle, it would appear easy to construct an electronic database with a record for each such person in the visa process, and to store all relevant information such as origin country, immigrant visa category, and priority date, as has been proposed by the CIS Ombudsman (2007, p. 35). Indeed, any number of IT firms involved in the petitioning for workers could do it. But in practice, there appear to be many obstacles. For example, in the ideal database, the units would be persons—prospective immigrants—but part of the immigrant visa system is based on applications, not on persons.4 Additionally, while the labor certification and I‐140 applications cover only principals, the I‐485 covers both principals and family members. Further, the labor certification and I‐140 cover applicants worldwide, while the I‐485 covers only adjustment of status in the United States. Notwithstanding these challenges, it is earnestly hoped that (1) the data systems improve so that the number of pending applications can be generated at the end of each fiscal year (if not the end of each quarter), separately by visa category, and separately for principals and family members, and (2) the agencies publish the numbers pending. It would then become possible to compare the true numbers with the estimates we present below.
Estimation Strategies The basic premise for our estimation approach is a simple description of the population of interest, as follows: The population of employment principals who have a priority date and are waiting for LPR in the United States at any given time consists of six subsets:
4 For example, sometimes more than one application can be filed for the same person. In the labor
certification process, although an employer can no longer file more than one application for the same beneficiary, it is still possible for two employers to file for the same beneficiary. It also is the case that more than one I‐140 can be filed for the same beneficiary. And, finally, the same prospective immigrant may file more than one I‐485. The most common case of multiple I‐485s involves married couples in which each spouse is the principal on a separate application.
23
1. Those with pending labor certifications. 2. Those whose labor certification has been approved but whose I‐140 is not yet filed. 3. Those with a pending I‐140 who have not filed the I‐485 (in most cases, because a
visa number is not available). 4. Those with a pending I‐140 and a pending I‐485. 5. Those with an approved I‐140 who have not filed the I‐485 (again, in most cases,
because a visa number is not available). 6. Those with an approved I‐140 and a pending I‐485.
Obtaining direct figures for each subset is, in our view, an appropriate goal for the data systems architects in the Departments of Labor, State, and Homeland Security. For example, the State Department for many years provided counts of approved eligible prospective immigrants waiting for numerically limited visas. Such counts could be used to approximate the fifth subset. Unfortunately, however, the State Department discontinued publication of these figures after 1997 (it is not known whether the data continue to be compiled annually).
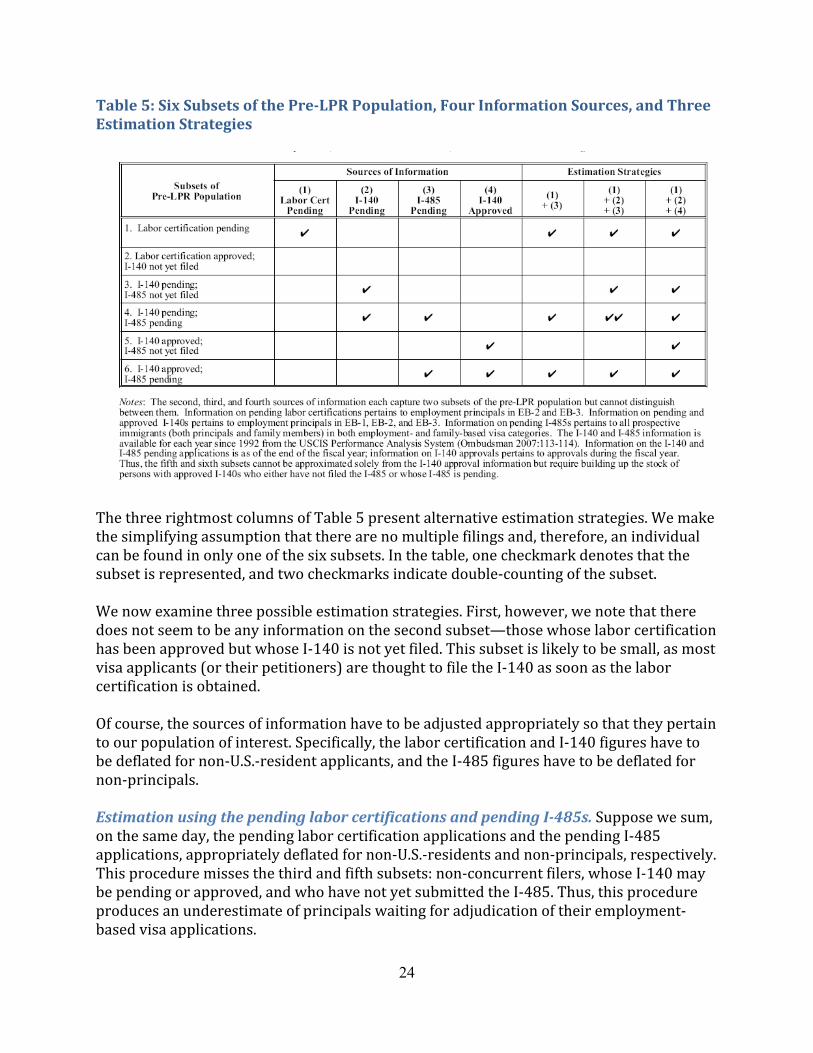
Note that, at each of the three steps (labor certification, I‐140, I‐485), some applications are denied. Thus, a fraction of the first subset disappears, as does a fraction of the third and fourth subsets. Similarly, not all of the sixth subset will proceed to LPR, as some will have their I‐485 applications denied. Moreover, a prospective immigrant also may leave the employment‐based pre‐LPR queue if, for example, marriage to a U.S. citizen provides a faster route to LPR. To develop an estimation strategy, we list in Table 5 the six subsets and examine four potential sources of information. The first piece of information is the number of pending labor certifications. Obviously, this exactly corresponds to the first subset, as indicated by the checkmark. The second indicates the number of pending I‐140 applications. This corresponds to the combined third and fourth subsets of the population. The third, the number of pending I‐485 applications, corresponds to the combined fourth and sixth subsets. Finally, the number of approved I‐140s corresponds to the combined fifth and sixth subsets.5
5 Note that the labor certification application and the I‐140 pertain to principals, while the I‐485
pertains to all prospective immigrants, including the spouses and children of the principals. Thus, figures on I‐485 applications must be deflated before use in estimating the population of pre‐LPR principals.
24
Table 5: Six Subsets of the PreLPR Population, Four Information Sources, and Three Estimation Strategies
The three rightmost columns of Table 5 present alternative estimation strategies. We make the simplifying assumption that there are no multiple filings and, therefore, an individual can be found in only one of the six subsets. In the table, one checkmark denotes that the subset is represented, and two checkmarks indicate double‐counting of the subset. We now examine three possible estimation strategies. First, however, we note that there does not seem to be any information on the second subset—those whose labor certification has been approved but whose I‐140 is not yet filed. This subset is likely to be small, as most visa applicants (or their petitioners) are thought to file the I‐140 as soon as the labor certification is obtained. Of course, the sources of information have to be adjusted appropriately so that they pertain to our population of interest. Specifically, the labor certification and I‐140 figures have to be deflated for non‐U.S.‐resident applicants, and the I‐485 figures have to be deflated for non‐principals. Estimation using the pending labor certifications and pending I485s. Suppose we sum, on the same day, the pending labor certification applications and the pending I‐485 applications, appropriately deflated for non‐U.S.‐residents and non‐principals, respectively. This procedure misses the third and fifth subsets: non‐concurrent filers, whose I‐140 may be pending or approved, and who have not yet submitted the I‐485. Thus, this procedure produces an underestimate of principals waiting for adjudication of their employment‐based visa applications.
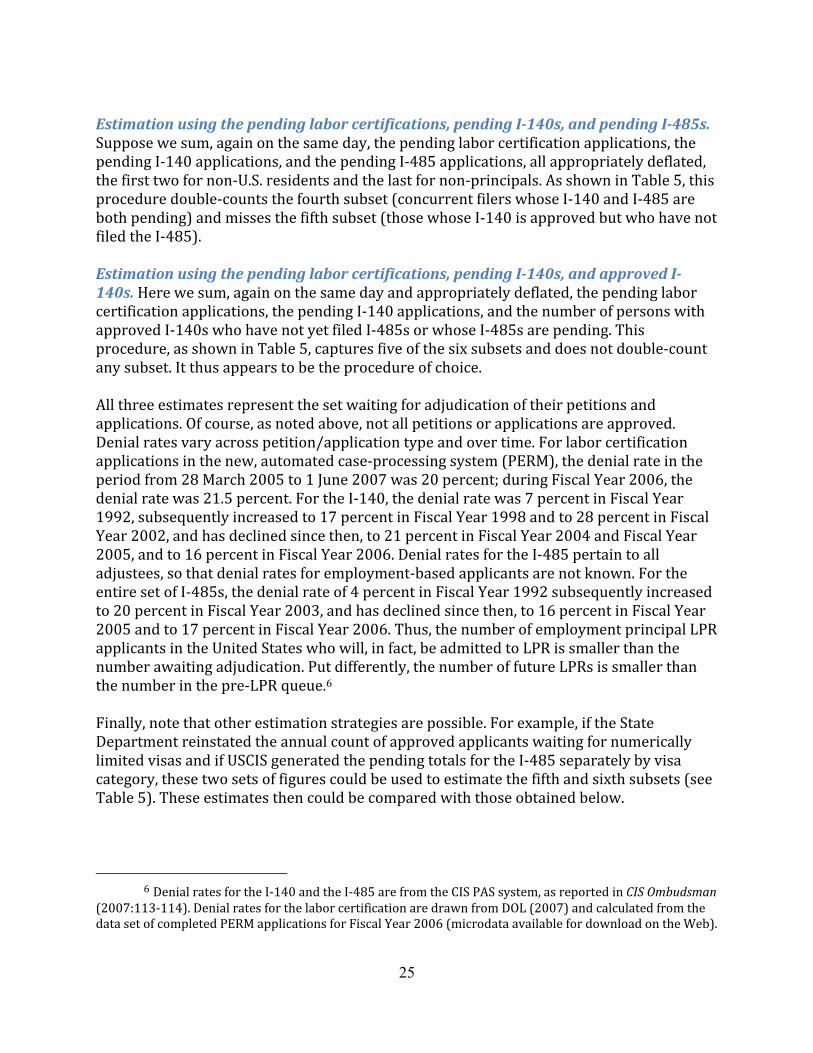
25
Estimation using the pending labor certifications, pending I140s, and pending I485s. Suppose we sum, again on the same day, the pending labor certification applications, the pending I‐140 applications, and the pending I‐485 applications, all appropriately deflated, the first two for non‐U.S. residents and the last for non‐principals. As shown in Table 5, this procedure double‐counts the fourth subset (concurrent filers whose I‐140 and I‐485 are both pending) and misses the fifth subset (those whose I‐140 is approved but who have not filed the I‐485). Estimation using the pending labor certifications, pending I140s, and approved I140s. Here we sum, again on the same day and appropriately deflated, the pending labor certification applications, the pending I‐140 applications, and the number of persons with approved I‐140s who have not yet filed I‐485s or whose I‐485s are pending. This procedure, as shown in Table 5, captures five of the six subsets and does not double‐count any subset. It thus appears to be the procedure of choice. All three estimates represent the set waiting for adjudication of their petitions and applications. Of course, as noted above, not all petitions or applications are approved. Denial rates vary across petition/application type and over time. For labor certification applications in the new, automated case‐processing system (PERM), the denial rate in the period from 28 March 2005 to 1 June 2007 was 20 percent; during Fiscal Year 2006, the denial rate was 21.5 percent. For the I‐140, the denial rate was 7 percent in Fiscal Year 1992, subsequently increased to 17 percent in Fiscal Year 1998 and to 28 percent in Fiscal Year 2002, and has declined since then, to 21 percent in Fiscal Year 2004 and Fiscal Year 2005, and to 16 percent in Fiscal Year 2006. Denial rates for the I‐485 pertain to all adjustees, so that denial rates for employment‐based applicants are not known. For the entire set of I‐485s, the denial rate of 4 percent in Fiscal Year 1992 subsequently increased to 20 percent in Fiscal Year 2003, and has declined since then, to 16 percent in Fiscal Year 2005 and to 17 percent in Fiscal Year 2006. Thus, the number of employment principal LPR applicants in the United States who will, in fact, be admitted to LPR is smaller than the number awaiting adjudication. Put differently, the number of future LPRs is smaller than the number in the pre‐LPR queue.6 Finally, note that other estimation strategies are possible. For example, if the State Department reinstated the annual count of approved applicants waiting for numerically limited visas and if USCIS generated the pending totals for the I‐485 separately by visa category, these two sets of figures could be used to estimate the fifth and sixth subsets (see Table 5). These estimates then could be compared with those obtained below.
6 Denial rates for the I‐140 and the I‐485 are from the CIS PAS system, as reported in CIS Ombudsman
(2007:113‐114). Denial rates for the labor certification are drawn from DOL (2007) and calculated from the data set of completed PERM applications for Fiscal Year 2006 (microdata available for download on the Web).
26
Numerical Approximations The preferred strategy for estimating the number of employment‐based principals who have a priority date and are in the United States waiting for LPR (rightmost column of Table 5) has three components: (1) the number of pending labor certification applications; (2) the number of pending I‐140 applications; and (3) the number of persons with approved I‐140 applications whose I‐485 is unfiled or pending. To implement this estimation strategy, we estimate the three components for the same time period and, because the three components pertain to both adjustees and new arrivals, we then remove the new arrivals.7 Finally, we also estimate the total number in the employment‐based pre‐LPR population, including family members. As will be seen below, estimation of the number of persons with approved I‐140 applications who are in the population requires information on the number who actually are admitted to LPR each year. This information is published annually by the INS/CIS. Information on both pending and approved I‐140s is available from the USCIS Performance Analysis System (PAS) and published in the CIS Ombudsman’s (2007:113‐114) report. As of this writing, the PAS data and the LPR data are available through Fiscal Year 2006. Accordingly, we estimate the employment‐based pre‐LPR population as of the end of Fiscal Year 2006. We had hoped to locate a parallel time series for the pending labor certifications, but, as will be seen, even estimating the number as of the end of Fiscal Year 2006 is a challenge.
Components of the Estimates Labor certification pending applications. The number of pending labor certification applications has two components: The first pertains to pending applications in the pre‐automated backlog and the second pertains to pending applications in the automated PERM system. To estimate the first component, we use two pieces of information. First, the Department of Labor’s PART assessments, which accompanied the Fiscal Year 2006 budget published in February 2005, mention a backlog of 315,000 cases and the goal to eliminate the backlog in two years, or by the end of Fiscal Year 2007. Second, DOL’s annual report for Fiscal Year 2006 states in the “Performance and Accountability Report” that ”Backlog Elimination Centers eliminated over 50 percent of the permanent program backlog three weeks ahead of the September 30, 2006 goal.”
7 Note, however, that some new arrivals are persons who are living in the United States and choose consular processing over CIS processing (a choice made on the I‐140 form but not a permanently binding choice).
27
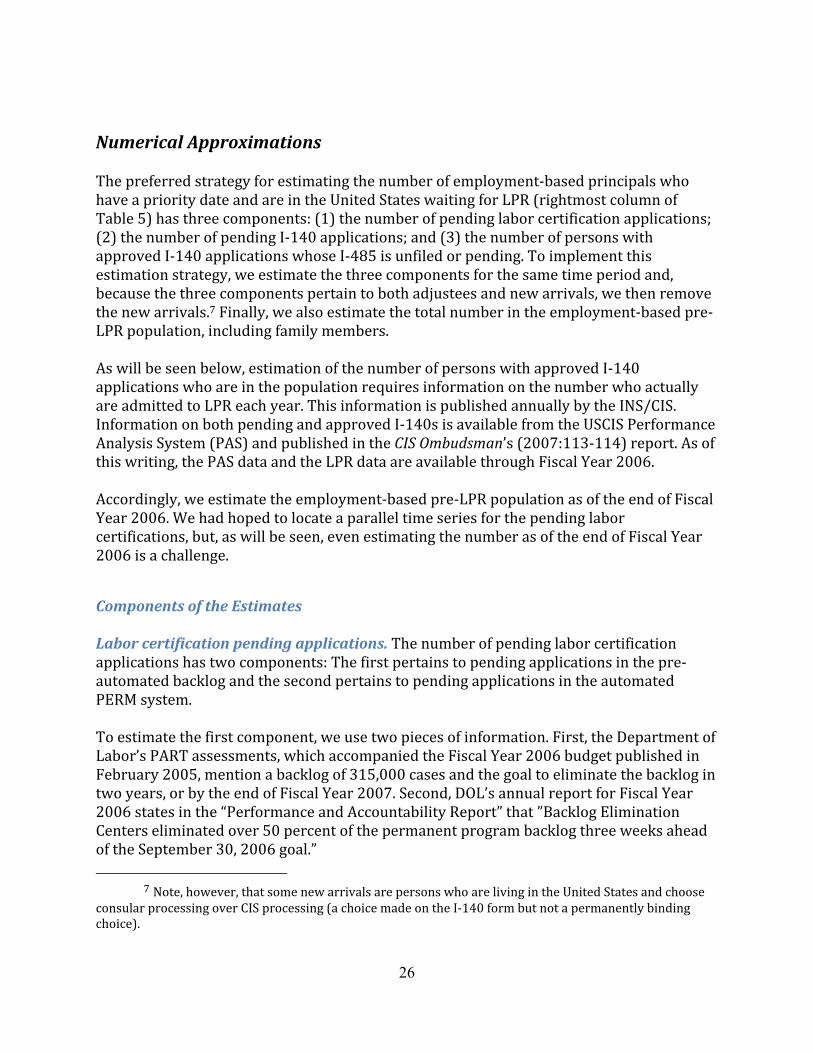
Accordingly, we estimate the number pending in the pre‐PERM backlog at the end of Fiscal Year 2006 at half of 315,000, or 157,500. To estimate the second component, we examine production statistics from the Department of Labor. The automated PERM system started on 28 March 2005. We use two pieces of information. First, the total number of applications filed at three points in time were: 80,272 as of 17 March 2006; 182,411 as of 2 March 2007; and 204,280 as of 1 June 2007. Second, the number pending was 10,561 on 2 March 2007 and 16,799 on 1 June 2007. If the number pending at the end of Fiscal Year 2006 resembles the number pending 5‐8 months later, it would be in the 10,000‐17,000 range. On the other hand, if the number pending at the end of Fiscal Year 2006 met but did not exceed the target of a six‐month processing cycle for 90 percent of receipts, then it would be in the 45,000‐52,000 range. Given the uncertainty and the recurring idea that the number of pending cases is decreasing, we fix the number pending at the end of Fiscal Year 2006 at 42,500. Accordingly, we put the number of labor certification applications pending at the end of Fiscal Year 2006 at around 200,000. I140 pending applications. The USCIS Performance Analysis System (PAS) provides a time series of the number of pending I‐140 applications at the end of each fiscal year since 1992 (when the provisions of the Immigration Act of 1990 took effect). This time series, along with other PAS figures, is published in CIS Ombudsman (2007, pp. 113‐114). Figure 5 depicts the pending I‐140 applications for the years 1992 to 2006. As shown, the number pending at the end of the fiscal year began its steep climb after 1997 and, since 2002, reflects the two countervailing forces of aggressive backlog reduction and increased demand. The number of pending I140 applications at the end of Fiscal Year 2006, as shown in Figure 5, is 50,132. This number represents the combined third and fourth subsets of the pre‐LPR population, as shown in Table 5.
28
Figure 5: I140 Petitions Pending Adjudication at End of Fiscal Year
At the end of a fiscal year, the number of persons with approved I‐140 applications who either have not yet filed the I‐485 (presumably because a visa number is not available) or whose I‐485 is pending is equal to the number at the start of the year plus the number of new I‐140 approvals during the year, minus the number who became LPR or left the LPR queue (because they died, became discouraged by the wait, or achieved LPR by another route). As noted above, new I‐140 approvals are reported by the PAS system, and new LPRs are reported annually by CIS. The PAS figures cover all I‐140s, and thus to match exactly to the LPR figures, we include in the LPR figures all visa categories that require an I‐140. The number of deaths is likely to be small, as this is a healthy, prime‐age population. There is no information on the number who get discouraged waiting for a visa number and leave the queue—though there is plenty of anecdotal information to that effect—nor is there information on the number who switch pathways to LPR—though again the anecdotal evidence is that courtship and marriage sometimes outpace visa number availability. Additionally, the number of principals with approved I‐140 applications at the start of the first year—1992—has to be estimated. Accordingly, our procedure for estimating the number of principals with approved I‐140 applications, and either unfiled or pending I‐485s has three steps. First, we calculate for
29
each year in the period 1992‐2006 the number of new approved I‐140 petitions minus the number of new LPR principals in EB‐1, EB‐2, and EB‐3 for whom the I‐140 is required. Second, we estimate the number at the start of the period. Third, we generate a running sum of the number of new approved I‐140s minus new LPRs, taking into account the estimate for the start of the period. Fourth, we examine the time series with an eye to adjusting it for the unmeasured departures from the LPR queue. To implement the second step, we rely on the annual visa waiting lists published by the State Department until 1997. In the context of employment‐based visas, the waiting lists cover all principals worldwide with approved I‐140 petitions who have not filed the I‐485 because a visa number is not available, plus their spouses and children, as of the first of each calendar year (i.e., the fifth subset in Table 5). Accordingly, we use the visa waiting list figures for January 1992—three months after the start of Fiscal Year 1992. The visa queues were: EB‐1, 535; EB‐2, 32,452; EB‐3 skilled, 50,003; and EB‐3, “other workers,” 87,806. To deflate these figures for non‐principals, we calculate for each category/subcategory the ratio of family members to principals among new LPRs in Fiscal Year 1992: EB‐1, 1.69; EB‐2, 1.12; EB‐3 skilled, 1.35; and EB‐3 “other workers,” 1.40. This procedure yields an estimate of 73,394 principals with approved I‐140s who had not filed for the I‐485 in January 1992. The number of principals with approved I‐140s and pending I‐485s at the start of Fiscal Year 1992 is left unmeasured; it is likely to have been small, as immigration and consular officers expanded their efforts to clear applications under the pre‐1992 immigration law (U.S. Department of State, 1992). At the third step, we calculate the running sum of approved I‐140s minus LPRs plus the initial number at the start of the period (73,394). Figure 6 depicts the time series of the number of persons with approved I‐140 applications who have not filed the I‐485 or whose I‐485 is pending. As shown, except for a dip in 2005, the number has increased steadily since 1992. At the end of Fiscal Year 2006, the number of employment principals with approved I‐140 applications and unfiled or pending I‐485s is estimated at 327,556.8
8 If we omit the number at the start of the period, the running sum at the end of Fiscal Year 2006 is
equal to the sum of all approved I‐140s over the 15‐year period, minus the sum of all the employment principal LPRs during the period (254,162). Of course, this number plus 73,394 equals the adjusted estimate of 327,556.
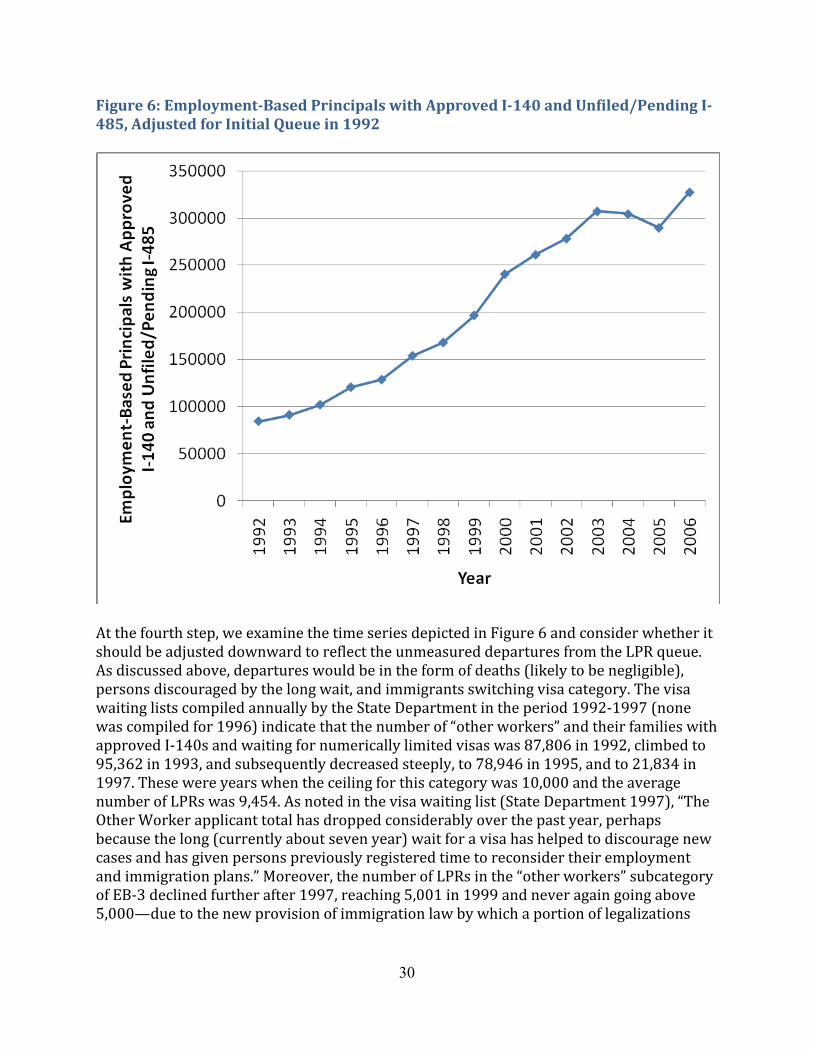
30
Figure 6: EmploymentBased Principals with Approved I140 and Unfiled/Pending I485, Adjusted for Initial Queue in 1992
At the fourth step, we examine the time series depicted in Figure 6 and consider whether it should be adjusted downward to reflect the unmeasured departures from the LPR queue. As discussed above, departures would be in the form of deaths (likely to be negligible), persons discouraged by the long wait, and immigrants switching visa category. The visa waiting lists compiled annually by the State Department in the period 1992‐1997 (none was compiled for 1996) indicate that the number of “other workers” and their families with approved I‐140s and waiting for numerically limited visas was 87,806 in 1992, climbed to 95,362 in 1993, and subsequently decreased steeply, to 78,946 in 1995, and to 21,834 in 1997. These were years when the ceiling for this category was 10,000 and the average number of LPRs was 9,454. As noted in the visa waiting list (State Department 1997), “The Other Worker applicant total has dropped considerably over the past year, perhaps because the long (currently about seven year) wait for a visa has helped to discourage new cases and has given persons previously registered time to reconsider their employment and immigration plans.” Moreover, the number of LPRs in the “other workers” subcategory of EB‐3 declined further after 1997, reaching 5,001 in 1999 and never again going above 5,000—due to the new provision of immigration law by which a portion of legalizations
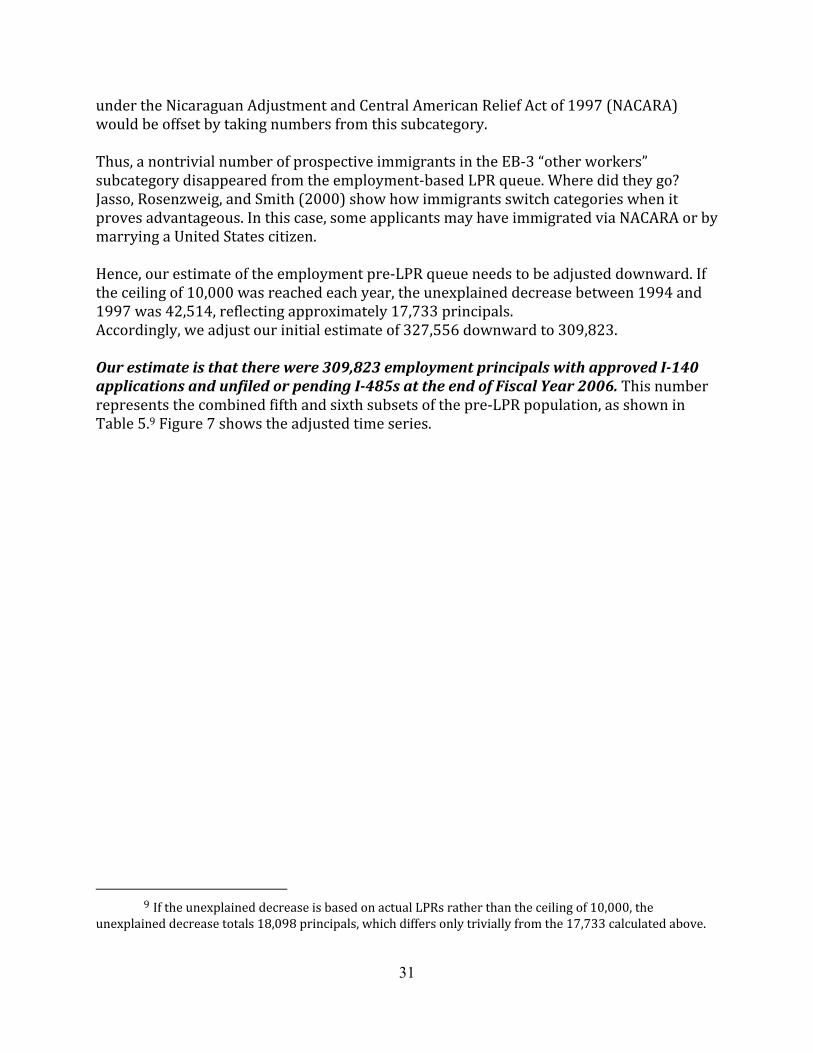
31
under the Nicaraguan Adjustment and Central American Relief Act of 1997 (NACARA) would be offset by taking numbers from this subcategory. Thus, a nontrivial number of prospective immigrants in the EB‐3 “other workers” subcategory disappeared from the employment‐based LPR queue. Where did they go? Jasso, Rosenzweig, and Smith (2000) show how immigrants switch categories when it proves advantageous. In this case, some applicants may have immigrated via NACARA or by marrying a United States citizen. Hence, our estimate of the employment pre‐LPR queue needs to be adjusted downward. If the ceiling of 10,000 was reached each year, the unexplained decrease between 1994 and 1997 was 42,514, reflecting approximately 17,733 principals. Accordingly, we adjust our initial estimate of 327,556 downward to 309,823. Our estimate is that there were 309,823 employment principals with approved I140 applications and unfiled or pending I485s at the end of Fiscal Year 2006. This number represents the combined fifth and sixth subsets of the pre‐LPR population, as shown in Table 5.9 Figure 7 shows the adjusted time series.
9 If the unexplained decrease is based on actual LPRs rather than the ceiling of 10,000, the
unexplained decrease totals 18,098 principals, which differs only trivially from the 17,733 calculated above.
32
Figure 7: EmploymentBased Principals with Approved I140 and Unfiled/Pending I485, Adjusted for Initial Queue in 1992 and Departures from the Queue in 1994, 1995 and 1996
33
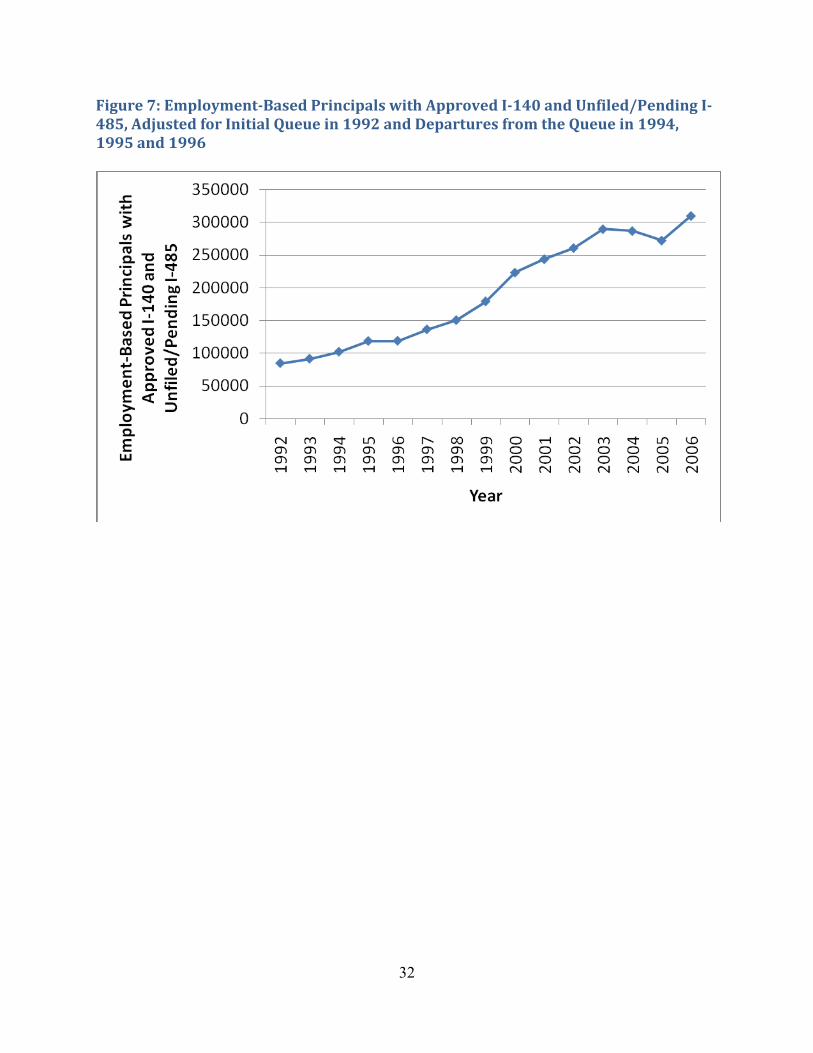
Numerical Approximation of the EmploymentBased PreLPR Population In the preceding section, we presented estimates of each of three components used in the preferred estimation strategy described earlier (shown in the rightmost column of Table 5). We now sum the three components to obtain the worldwide estimate for the end of Fiscal Year 2006: 200,000 with pending labor certifications (the first subset) plus 50,132 with pending I‐140 applications (the third and fourth subsets), plus 309,823 with approved I‐140 applications and unfiled or pending I‐485 applications (the fifth and sixth subsets) equals 559,955. Next we deflate this figure for new arrivals. In 2005 the proportion adjustee was approximately 89.3. Applying this figure, we obtain an estimate of the number of employmentbased principals waiting for LPR in the United States of approximately 500,040. As discussed above, we do not have a time series of pending labor certifications. Accordingly, we show in Figure 8 the combined pending and approved I‐140 subsets of the pre‐LPR population. Figure 8: EmploymentBased Principals with Pending or Approved I140 (Approved I140 Series Adjusted as in Figure 7)
34
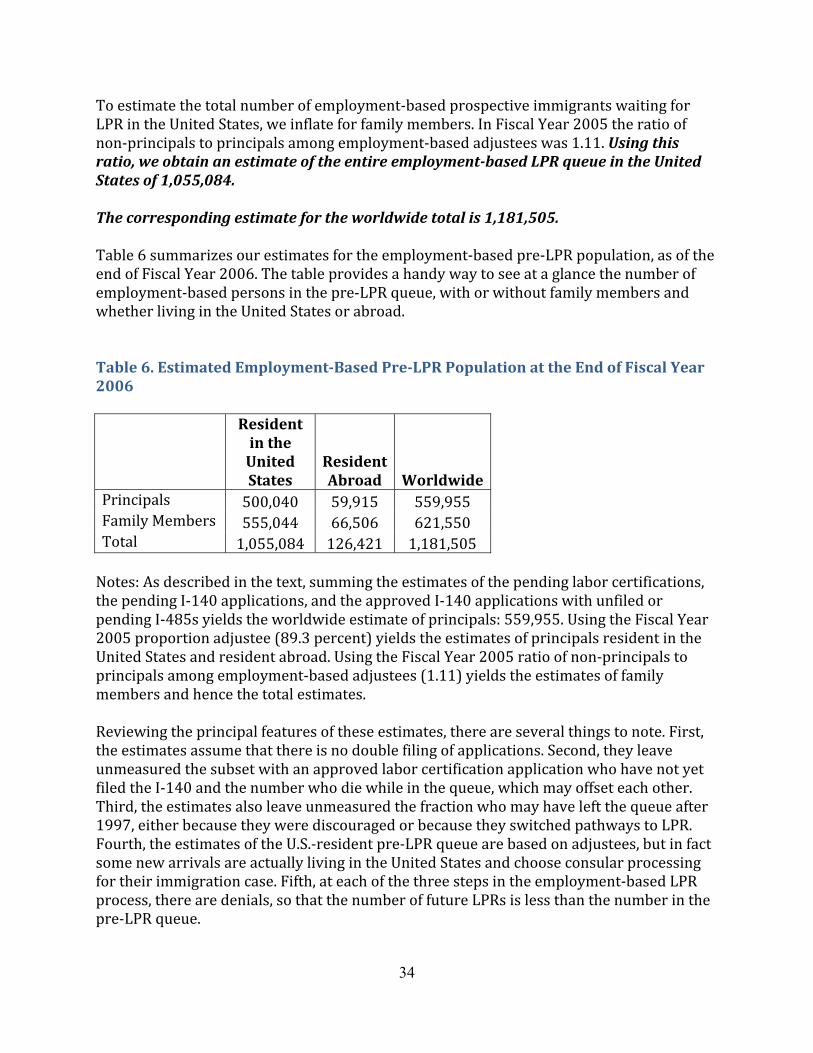
To estimate the total number of employment‐based prospective immigrants waiting for LPR in the United States, we inflate for family members. In Fiscal Year 2005 the ratio of non‐principals to principals among employment‐based adjustees was 1.11. Using this ratio, we obtain an estimate of the entire employmentbased LPR queue in the United States of 1,055,084. The corresponding estimate for the worldwide total is 1,181,505. Table 6 summarizes our estimates for the employment‐based pre‐LPR population, as of the end of Fiscal Year 2006. The table provides a handy way to see at a glance the number of employment‐based persons in the pre‐LPR queue, with or without family members and whether living in the United States or abroad. Table 6. Estimated EmploymentBased PreLPR Population at the End of Fiscal Year 2006 Resident
in the United States
Resident Abroad Worldwide
Principals 500,040 59,915 559,955 Family Members 555,044 66,506 621,550 Total 1,055,084 126,421 1,181,505 Notes: As described in the text, summing the estimates of the pending labor certifications, the pending I‐140 applications, and the approved I‐140 applications with unfiled or pending I‐485s yields the worldwide estimate of principals: 559,955. Using the Fiscal Year 2005 proportion adjustee (89.3 percent) yields the estimates of principals resident in the United States and resident abroad. Using the Fiscal Year 2005 ratio of non‐principals to principals among employment‐based adjustees (1.11) yields the estimates of family members and hence the total estimates. Reviewing the principal features of these estimates, there are several things to note. First, the estimates assume that there is no double filing of applications. Second, they leave unmeasured the subset with an approved labor certification application who have not yet filed the I‐140 and the number who die while in the queue, which may offset each other. Third, the estimates also leave unmeasured the fraction who may have left the queue after 1997, either because they were discouraged or because they switched pathways to LPR. Fourth, the estimates of the U.S.‐resident pre‐LPR queue are based on adjustees, but in fact some new arrivals are actually living in the United States and choose consular processing for their immigration case. Fifth, at each of the three steps in the employment‐based LPR process, there are denials, so that the number of future LPRs is less than the number in the pre‐LPR queue.
35
Finally, we note that these estimates can be updated as soon as information becomes available for Fiscal Year 2007. And we note again that alternative procedures for estimating one or more of the subsets of the pre‐LPR population may become available.
Discussion
Visa Number Wait and Visa Processing Wait Our estimates indicate that it is a safe bet that on 1 October 2006 there were about half a million prospective immigrants in the United States waiting to adjust to LPR as employment‐based principals and that the total including family members was more than a million. Even if these estimates turn out to overstate the employment‐based pre‐LPR population in the United States, they probably do not overstate the employment‐based pre‐LPR population worldwide. Thus, there were more than a million persons in line for approximately 120,120 visas a year—implying that we already had mortgaged almost nine years’ worth of employment visas. If all visa processing backlogs were eliminated, approximately 120,120 persons would receive EB‐1, EB‐2, and EB‐3 visas within a year. The others would experience visa number wait. Those who had filed the I‐485 before the processing backlogs were eliminated would be in a kind of semi‐halcyon time. They would now have a long wait to LPR, but they would retain their employment authorization and travel benefits, based on pending adjustment of status. Those who had not filed the I‐485 would have to continue to rely on a succession of temporary work visas. At this very moment, we are seeing this situation develop. As of 17 August 2007, all available employment visas for Fiscal Year 2007 have been given out. No one may file a new I‐485. Thus, there are prospective immigrants waiting for adjudication of I‐485s as well as prospective immigrants with priority dates who are stranded at the I‐140 stage because not enough employment‐based visas are available. And none of these can make the transition to LPR, no matter how efficient the Department of Labor and USCIS were to become at visa processing. Put differently, relief would come, not from more backlog elimination and timely processing at DOL and USCIS, but rather from larger allotments of employment visas—something only Congress can provide.
Relevant Population for Patent Activity For patent activity, the relevant population is larger than the United States population of adjustee principals in the LPR queue. The relevant population would include graduate students and temporary workers, especially H‐1B workers. In this section we approximate the size of this population. Note that some fraction of this population is in the LPR queue (i.e., already have priority dates and are included in the estimates above). Therefore, the total here cannot be added to the totals above. Graduate students and postdoctoral scholars. Here we focus on three fields—science, engineering, and health—and on students and postdoctoral scholars with temporary visas.
36
Estimates from the fall 2005 NSF‐NIH “Survey of Graduate Students and Postdoctorates in Science and Engineering” (NSF 2007) indicate that, as of fall 2005, the numbers of graduate students with temporary visas were 85,397 in science fields, 53,835 in engineering fields, and 7,464 in health fields, for a total of 139,232 in science and engineering, and a grand total, including health fields, of 146,696 (NSF 2007, Table 5). Postdoctoral appointees with temporary visas in fall 2005 included 17,641 in science, 2,742 in engineering, and 6,566 in health, for a total of 20,383 in science and engineering, and a grand total, including health fields, of 26,949 (NSF 2007, Table 50). Of course, total graduate enrollment of international students in all fields is substantially higher. Estimates from the International Institute of Education (IIE 2006) indicate that, in the 2005‐2006 academic year, there were 259,717 international graduate students. In addition, there were 38,096 in practical training, at least some of whom are likely to be postdoctoral scholars. Temporary workers. The population of foreign‐born temporary workers includes two main types of persons: (1) those holding explicit temporary work visas (such as one of the H or L principal visas; and (2) those with other types of temporary visas who are permitted to work if they apply for an Employment Authorization Document (EAD) and are approved (the form is I‐765). This second set includes parolees and family members of various temporary visitors, such as treaty traders, J exchange visitors, and L intra‐company transferees. Nonimmigrants who are not permitted to work (i.e., cannot file an I‐765) include spouses of H workers and of F students. Estimates of both subsets of temporary workers are difficult to obtain. Again, it appears that the requisite data systems are not in place at USCIS. Accordingly, we report the best available estimates.10 Passel, Van Hook, and Bean (2004) and Lowell (2000) estimated the H1B population in 2000 at 122,000 and 425,000, respectively. Passel, Van Hook, and Bean (2004) estimated the number of L workers in 2000 at 164,300. Grieco (2006) estimated that on a typical day in 2004 the population of H and L workers (all Hs except H4 spouses, plus L1) stood at 704,000. To estimate the second subset above, we turn to EAD issuances. The number of EADs issued for the year ending in May 2003 was 1.723 million; the overwhelming majority were approvals for one year, so that the number issued may be a plausible gauge of the number of persons who have temporary visas that are not explicitly for work (or, in some cases, do not have temporary visas at all, but “entered without inspection”) and who are in the labor force. Of this number, 617,863 (or about 36 percent) went to persons with pending applications for adjustment of status, and a small additional number went to persons with other pending applications that would lead to LPR (e.g., pending LIFE legalization application, 25,102, and pending legalization application, 4,651). 10 Of course, there may be a non‐trivial number of former H‐1B workers in the United States—some of them in the pre‐LPR queue—so that the number of H‐1Bs may appear to be higher than the number of current H‐1Bs.
37
Finally, we caution again that the estimates in this section cannot be added to the estimates of the LPR queue, as they do not pertain to the same time period, and even if they did, there might be substantial overlap (including, for example, persons in the LPR queue who have EADs).
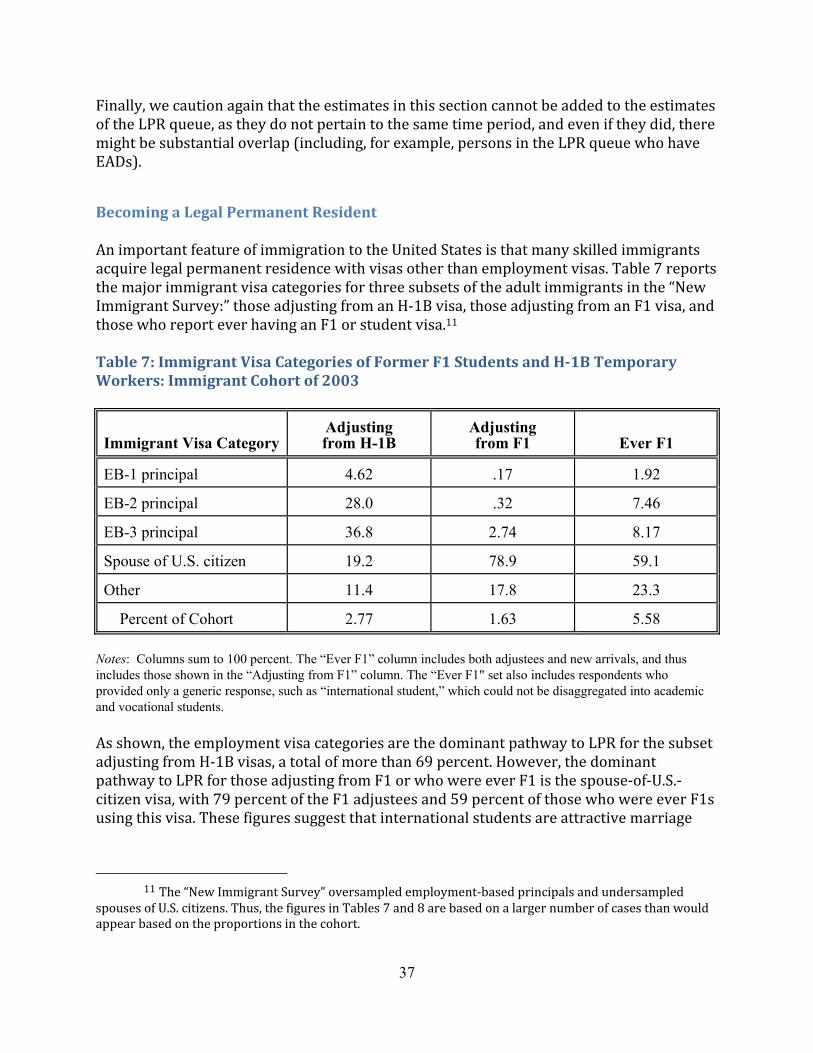
Becoming a Legal Permanent Resident An important feature of immigration to the United States is that many skilled immigrants acquire legal permanent residence with visas other than employment visas. Table 7 reports the major immigrant visa categories for three subsets of the adult immigrants in the “New Immigrant Survey:” those adjusting from an H‐1B visa, those adjusting from an F1 visa, and those who report ever having an F1 or student visa.11 Table 7: Immigrant Visa Categories of Former F1 Students and H1B Temporary Workers: Immigrant Cohort of 2003
Immigrant Visa Category
Adjusting from H-1B
Adjusting from F1
Ever F1
EB-1 principal
4.62 .17
1.92
EB-2 principal
28.0 .32
7.46
EB-3 principal
36.8 2.74
8.17
Spouse of U.S. citizen
19.2 78.9
59.1
Other
11.4 17.8
23.3
Percent of Cohort
2.77 1.63
5.58
Notes: Columns sum to 100 percent. The “Ever F1” column includes both adjustees and new arrivals, and thus includes those shown in the “Adjusting from F1” column. The “Ever F1" set also includes respondents who provided only a generic response, such as “international student,” which could not be disaggregated into academic and vocational students. As shown, the employment visa categories are the dominant pathway to LPR for the subset adjusting from H‐1B visas, a total of more than 69 percent. However, the dominant pathway to LPR for those adjusting from F1 or who were ever F1 is the spouse‐of‐U.S.‐citizen visa, with 79 percent of the F1 adjustees and 59 percent of those who were ever F1s using this visa. These figures suggest that international students are attractive marriage
11 The “New Immigrant Survey” oversampled employment‐based principals and undersampled
spouses of U.S. citizens. Thus, the figures in Tables 7 and 8 are based on a larger number of cases than would appear based on the proportions in the cohort.
38
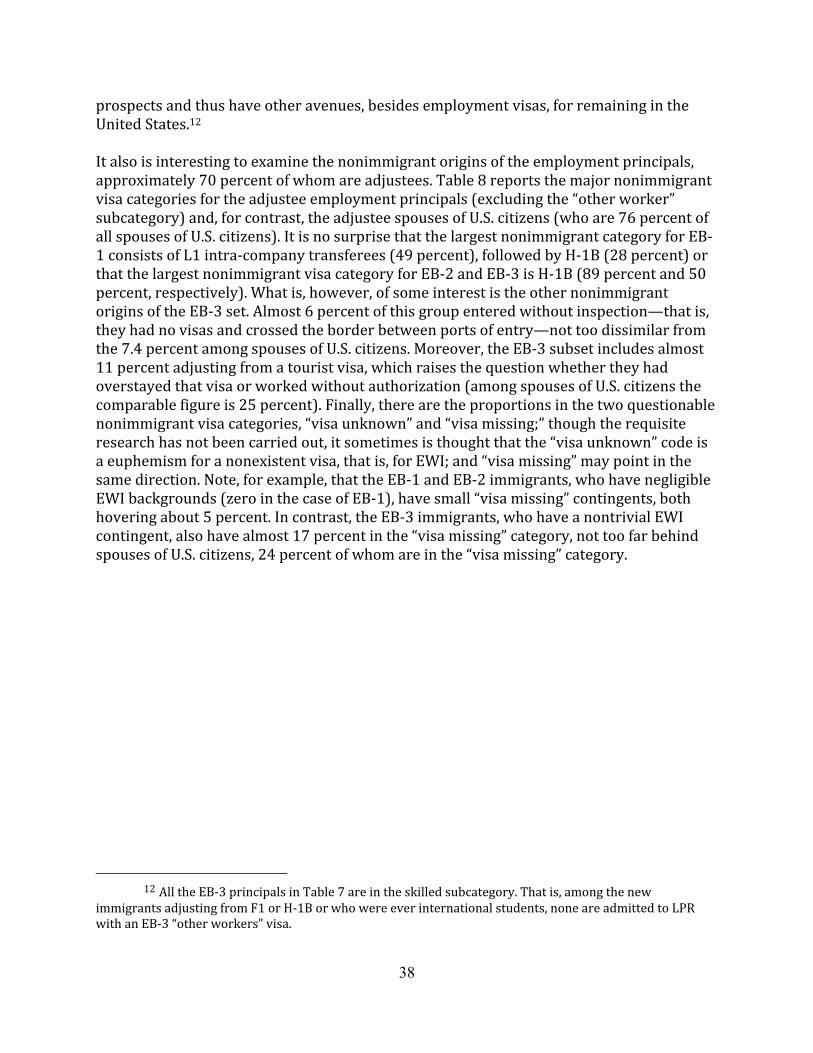
prospects and thus have other avenues, besides employment visas, for remaining in the United States.12 It also is interesting to examine the nonimmigrant origins of the employment principals, approximately 70 percent of whom are adjustees. Table 8 reports the major nonimmigrant visa categories for the adjustee employment principals (excluding the “other worker” subcategory) and, for contrast, the adjustee spouses of U.S. citizens (who are 76 percent of all spouses of U.S. citizens). It is no surprise that the largest nonimmigrant category for EB‐1 consists of L1 intra‐company transferees (49 percent), followed by H‐1B (28 percent) or that the largest nonimmigrant visa category for EB‐2 and EB‐3 is H‐1B (89 percent and 50 percent, respectively). What is, however, of some interest is the other nonimmigrant origins of the EB‐3 set. Almost 6 percent of this group entered without inspection—that is, they had no visas and crossed the border between ports of entry—not too dissimilar from the 7.4 percent among spouses of U.S. citizens. Moreover, the EB‐3 subset includes almost 11 percent adjusting from a tourist visa, which raises the question whether they had overstayed that visa or worked without authorization (among spouses of U.S. citizens the comparable figure is 25 percent). Finally, there are the proportions in the two questionable nonimmigrant visa categories, “visa unknown” and “visa missing;” though the requisite research has not been carried out, it sometimes is thought that the “visa unknown” code is a euphemism for a nonexistent visa, that is, for EWI; and “visa missing” may point in the same direction. Note, for example, that the EB‐1 and EB‐2 immigrants, who have negligible EWI backgrounds (zero in the case of EB‐1), have small “visa missing” contingents, both hovering about 5 percent. In contrast, the EB‐3 immigrants, who have a nontrivial EWI contingent, also have almost 17 percent in the “visa missing” category, not too far behind spouses of U.S. citizens, 24 percent of whom are in the “visa missing” category.
12 All the EB‐3 principals in Table 7 are in the skilled subcategory. That is, among the new
immigrants adjusting from F1 or H‐1B or who were ever international students, none are admitted to LPR with an EB‐3 “other workers” visa.
39
Table 8: Immediately Previous Nonimmigrant Visas of Immigrants Adjusting as Employment Principals or Spouses of U.S. Citizens: Immigrant Cohort of 2003
40
Some commentators suggest that the immigration system is so arduous and uncertain, even for skilled immigrants, that they run the risk of lapsing into illegality. These data hint at that possibility. And the information on having become depressed because of the visa process is not inconsistent with that supposition: The proportions of adjustee principals who became depressed line up with the employment‐based categories—17.3 percent in EB‐1, 21.7 percent in EB‐2, and 24.4 percent in EB‐3. Finally, some commentators suggest that a portion of the demand for employment‐based visas is generated by the ban on employment for spouses of H temporary workers. That is, employment‐based principals adjusting from H worker visas may not intend to live permanently in the United States, but instead may desire to obtain work authorization for their spouses. If that is the case, then the three employment categories, which differ greatly in the proportions adjusting from H‐1B (Table 8), also should differ in the intention to stay in the United States. Indeed, EB‐2, which has the highest proportion adjusting from H‐1B (89 percent), has the lowest proportion who intend to stay in the United States—48.8 percent. In EB‐1 and EB‐2, the proportions intending to stay are 60 percent and 73 percent, respectively. These figures contrast with 76 percent among adjustee spouses of U.S. citizens and 86 percent among all other adult adjustee immigrants.
Final Remarks on Immigration Backlog Our main purpose has been to estimate the size of the U.S.‐resident employment‐based pre‐LPR population. To that end, we developed a procedure based on estimation of six subsets of the population and approximated five of the six subsets. Our estimates are both a starting and an ending point. They are a starting point because new estimates can be obtained whenever new data become available—for example, at the end of Fiscal Year 2007—and because novel ways of estimating the subsets may emerge. They are an ending point because advances in the data systems of the Departments of Labor, State and Homeland Security, together with transparent publication of statistics, may render estimation exercises unnecessary. Our estimates indicate that, as of the end of Fiscal Year 2006, there were about half a million employmentbased principals awaiting LPR in the United States, and more than half a million family members. These numbers suggest that what has been viewed as a visa processing problem is actually—and formidably—a visa number problem. The approximately 120,120 visas available annually are no match for a million persons in line. Meanwhile, all who work to advance scientific understanding of migration and enlightened policymaking may want to collect items large and small for public discussion. For example, there is no substitute for good data systems that provide “we the people” with the information necessary to make intelligent decisions. It is a mystery why, in the recent immigration discussion, minds seemed to be formed without knowledge of even the number of persons with different types of applications pending. Similarly, it might be useful

41
to consider letting some of the time spent waiting for a visa number or for visa processing count toward naturalization—such a precedent exists in refugee procedures, and it could be a way of saying to visa applicants that the long wait has not been in vain. With respect to assessing the contributions of foreign‐born immigrants, it might be useful for the great science and humanities foundations, as well as the Patent Office, to consider collecting data on nativity. Otherwise the contributions of naturalized immigrants cannot be ascertained.
42
Conclusion In the global economy, America’s greatest advantage is its ability to push the frontier of knowledge and its application. In contrast to current debates about trade, international capital flows, and illegal immigration, we have analyzed the role that highly educated immigrants to the United States make in creating knowledge and innovation. By combining evidence from several data sets, we illuminate this contribution, and then highlight the problems these immigrants face in attaining permanent status and the country’s risk in losing some of them. Specifically, 1. Using data from WIPO, we find that in 2006, foreign nationals residing in the United States were inventors or co‐inventors of one in four U.S. PCT applications—a more than three‐fold increase over their proportion in 1998. 2. Using data from U.S. immigration statistics, we estimate that more than half a million skilled immigrants are awaiting legal permanent residence, and more than a million are in this situation. The immigration backlog is not simply a visa processing problem—which government agencies are working to reduce—but a visa shortage problem: Only 120,000 or so visas are available annually for the million or so applicants. 3. Using data from the “New Immigrant Survey,” we estimate that, in 2003, approximately one in five new legal immigrants in the United States, and about one in three employment principals, either planned to leave the United States or were uncertain about remaining. We would expect that at least some of those who considered leaving have actually returned to their homelands. Though we don’t know how many of those who have contributed to patents are discouraged by the visa process, we see no reason to expect them to be markedly different than other foreign residents working in the United States. Some are undoubtedly discouraged by the visa backlog and are considering leaving the United States. They constitute the possible “reverse brain‐drain” of our title. The United States benefits from having foreign‐born innovators create their ideas in the country. Their departures would, thus, be detrimental to U.S. economic well‐being. And, when foreigners come to the United States, collaborate with Americans in developing and patenting new ideas, and employ those ideas in business in ways they could not readily do in their home countries, the world benefits. Therefore, foreign national departures from the United States also reduce global well‐being. Given that the U.S. comparative advantage in the global economy is in creating knowledge and applying it to business, it behooves the country to consider how we might adjust policies to reduce the immigration backlog, encourage innovative foreign minds to remain in the country, and entice new innovators to come.
43
Author Biographies Vivek Wadhwa Vivek Wadhwa is a Wertheim fellow with the Labor and Worklife Program of Harvard Law School and executive‐in‐residence/adjunct professor for the Pratt School of Engineering at Duke University. He is also an entrepreneur who has founded two successful technology companies, an active mentor and advisor to various startups, and a columnist for BusinessWeek.com. Wadhwa was named a “Leader of Tomorrow“ by Forbes.com, and his company, Relativity Technologies, was named as one of the 25 “coolest“ companies in the world by Fortune magazine. Mr. Wadhwa holds a bachelor’s in Computing Studies from Canberra University in Australia and a master’s from New York University. Guillermina Jasso Guillermina Jasso is professor of sociology at New York University and research fellow, Institute for the Study of Labor (IZA), Bonn, Germany. Previously, she served as special assistant to the Commissioner of the U.S. Immigration and Naturalization Service and as director of research for the U.S. Select Commission on Immigration and Refugee Policy. Her major research interests are sociobehavioral theory and international migration. Professor Jasso has proposed a new mathematical formula for describing the sense of justice; a new unified theory that integrates justice, status, power, identity, and happiness; two new families of probability distributions (with Samuel Kotz); and a methodology for an empirically‐based point system for selecting immigrants. She was elected to the Johns Hopkins Society of Scholars and to the Sociological Research Association, was a fellow at the Center for Advanced Study in the Behavioral Sciences, and is a fellow at the Center for the Study of Poverty and Inequality at Stanford University. She holds a doctorate from John Hopkins University. Ben Rissing Ben Rissing is a Wertheim fellow with Labor and Worklife Program at the Harvard Law School. He was previously a research scholar at the Pratt School of Engineering of Duke University. He has a bachelor’s in mechanical engineering from the University of Virginia and a master’s in engineering management from Duke. He has been involved in initiatives ranging from engineering design/technology commercialization to cardiovascular laboratory research and public‐policy development in Washington, DC. Mr. Rissing has traveled extensively, enjoys multiculturalism, and is a nationally ranked competitive fencer.
44
Dr. Gary Gereffi Dr. Gary Gereffi is professor of sociology and director of the Center on Globalization, Governance & Competitiveness at Duke University. He holds a bachelor’s degree from the University of Notre Dame, and master’s and doctorate degrees from Yale University. He has published several books and a wide range of articles on business‐government relations in various parts of the world. His recent books include: The Value of Value Chains: Spreading the Gains from Globalization (special issue of the IDS Bulletin, July 2001); Free Trade and Uneven Development: The North American Apparel Industry after NAFTA, (Temple University Press, 2002); and The New Offshoring of Jobs and Global Development (International Labor Organization, 2006). Richard Freeman Richard Freeman holds the Herbert Ascherman Chair in Economics at Harvard University, and serves as faculty director of the Labor and Worklife Program at the Harvard Law School. He also is director of the labor studies program at the National Bureau of Economic Research, senior research fellow in Labour Markets at the London School of Economics' Centre for Economic Performance, and visiting professor at the London School of Economics. Professor Freeman has published more than 300 articles dealing with a wide range of research interests, and has written or edited more than 35 books, including: America Works: The Exceptional Labor Market (2007), What Workers Want? (2006, 1999), Seeking a Premiere League Economy (2004), and Emerging Labor Market Institutions for the 21st Century (2004).
Appendix A: Methodology U.S. WIPO Patent Filings Every year in the United States, tens of thousands of patent applications are filed. In this study, we focus on Patent Cooperation Treaty (PCT) applications submitted to the World Intellectual Property Organization’s (WIPO) U.S. Receiving Office. PCT applications are unique for several reasons. These applications represent the first step towards securing international protection for intellectual property, a time‐intensive and costly process. As such, the invention described in a PCT application generally has market potential in multiple countries, global visibility, and/or diverse applications. PCT applications record a great deal of information on inventors and their inventions. Our analysis utilizes the following information disclosed at the time of filing: • Inventor name • Inventor nationality • Inventor residency • Inventor address (at the time of filing) • Owner name • Owner address • International Patent Classification (IPC) Code
45
This information has enabled our team to conduct a nuanced analysis on the roles of U.S. citizens and foreign nationals who generate intellectual property in the United States.
Data Acquisition and Analysis
With the assistance of Neopatents, a Raleigh, North Carolina based patent research and analytics firm, we obtained full records of all 1998 and 2006 PCT applications published by WIPO’s U.S. receiving office. We chose to limit our analysis to 1998 and 2006. WIPO records in electronic form are available from 1998 onward; at the time of this paper’s publication, 2006 was the most recent full year of data. Our search of the PCT application database was conducted using Neopatents Spore® Search software. The specific search strings our team employed to collect this data can be found in Appendix B. After downloading full PCT records for 1998 and 2006, our team conducted a manual name‐heritage analysis of all WIPO patent applications for these years. During research for our January 2007 paper, “America’s New Immigrant Entrepreneurs,” we observed that foreign nationals from China and India filed more PCT applications in the United States than any other foreign‐national group. That analysis did not, however, identify the IP contributions of Indian and Chinese immigrants who had immigrated to the United States and obtained U.S. citizenship. To identify this information, two small teams of native Indian and Chinese graduate students were assembled to scan inventor name fields and flag names with Indian and Chinese ancestry. After collecting raw PCT data from NeoPatents and flagging inventors with Indian‐ and Chinese‐heritage names, we delivered this data to Chmura Economics and Analytics, an economic research and quantitative solutions firm. Chmura produced cross‐references between patents’ state of ownership, inventor citizenship, inventor nationality, and IPC code. During this analysis, only patent records with owners in the United States were counted. This resulted in the omission of 1,094 PCT applications filed through the U.S. receiving office in 1998 and 2,583 applications filed in 2006. These omissions constituted ~5 percent of the total filings in each year. We determined if a patent owner was based in the United States based on the owner address field. If no owner address was present, the first‐inventor address was employed instead. The zip code listed in the address field was used to map a patent record to a county and state. We used the two‐letter state abbreviation from the address line in some instances where the zip code was missing. We linked patents to broader field of technology and inventions based upon IPC codes. It is important to note that each patent record can list multiple IPC codes. As a result, our patent
46
IPC code analysis is non‐cumulative and instead tracks patent classification activity across the range of IPC filings. WIPO requires inventors to record nationality and residency information at the time of filing a PCT application. However, a portion of PCT application records are missing this inventor information. In the 1998 dataset, 41,722 out of the 60,997 inventor records (68.4 percent) do not have nationality or residency information. In the 2006 dataset, 16,132 of the 129,655 inventor records (12.4 percent) do not include this data. These records were omitted from our foreign national/US citizen queries. The large portion of 1998 PCT records missing nationality information in the WIPO database are likely due to an old legal practice in which U.S.‐based patent applicants did not designate the United States in applications due to of a lack of perceived need (a separate USPTO application would be filed concurrently).
47
References
CIS Ombudsman. 2007. Annual Report to Congress June 2007. Grieco, Elizabeth M. 2006. “Estimates of the Nonimmigrant Population of the United States: 2004.” Office of
Immigration Statistics, Department of Homeland Security. International Institute of Education. 2006. Open Doors 2006: Report on International Educational Exchange.
Retrieved from the IIE website. Jasso, Guillermina, and Mark R. Rosenzweig. 1995. "Do Immigrants Screened for Skills Do Better Than Family‐
Reunification Immigrants?" International Migration Review 29:85‐111. Jasso, Guillermina, Mark R. Rosenzweig, and James P. Smith. 2000. “The Changing Skill of New Immigrants to
the United States: Recent Trends and Their Determinants.” Pp. 185‐225 in George J. Borjas (ed.), Issues in the Economics of Immigration. Chicago, IL: University of Chicago Press.
Jasso, Guillermina, Douglas S. Massey, Mark R. Rosenzweig, and James P. Smith. In press. “The U.S. New Immigrant Survey: Overview and Preliminary Results Based on the New‐Immigrant Cohorts of 1996 and 2003.” Pp. 29‐46 in Beverley Morgan and Ben Nicholson (eds.), Immigration Research and Statistics Service Workshop on Longitudinal Surveys and Cross‐Cultural Survey Design: Workshop Proceedings. London, UK: Crown Publishing.
Lowell, B. Lindsay. 2000. “H‐1B Temporary Workers: Estimating the Population.” Working paper, Institute for the Study of International Migration, Georgetown University.
Passel, Jeffrey S., Jennifer Van Hook, and Frank D. Bean. 2004. “Estimates of the Legal and Unauthorized Foreign‐Born Population for the United States and Selected States, Based on Census 2000.” Unpublished paper.
National Science Foundation, Division of Science Resources Statistics. 2007. Graduate Students and Postdoctorates in Science and Engineering: Fall 2005. NSF 07‐321. Julia D. Oliver, project officer. Arlington, VA.
U.S. Department of Homeland Security. 2002‐2005. Yearbook of Immigration Statistics. Washington, DC: Government Printing Office.
U.S. Department of Labor. 2007. “Cumulative Production Statistics.” U.S. Department of State. Various years. Report of the Visa Office. Washington, DC: Government Printing Office. U.S. Department of State. 2007a. “Visa Bulletin for July 2007.” 9, no. 107. Posted 12 June 2007. ______. 2007b. “Visa Bulletin: Update on July Visa Availability.” 9, no. 108. Posted 2 July 2007. 2007c. “Visa Bulletin for August 2007.” 9, no. 109. Posted 17 July 2007. U.S. Immigration and Naturalization Service. 1979‐2001. Statistical Yearbook of the Immigration and
Naturalization Service. Washington, DC: Government Printing Office.
48
Works Cited 1 “The Constitution of the United States,” Article 1, Section 8, 2 Wadhwa, V., G. Gereffi, B. Rissing, A. Saxenian, June 11 2007. Education, Entrepreneurship and Immigration: America’s New Immigrant Entrepreneurs, Part II. Kauffman Foundation. 3 Wadhwa, V., G. Gereffi, B. Rissing, A. Saxenian, January 2007. America’s New Immigrant Entrepreneurs. Duke University. 4 World Intellectual Property Organization, April 2006. PCT: Protecting Your Inventions Abroad: Frequently Asked Questions About the Patent Cooperation Treaty (PCT). WIPO Publication no. 433(E). 5 Reeves, T., C. Bennet, December 2004. We the People: Asians in the United States. Census 2000 Special Report. P. 9. 6 US Census Bureau, 2000. Table FBP‐1. Profile of Selected Demographic and Social Characteristics: 2000, Population Universe: People Born in India. Available on the World Wide Web at: www.census.gov/population/cen2000/stp‐159/STP‐159‐india.xls 7 US Census Bureau, 2000. Table FBP‐1. Profile of Selected Demographic and Social Characteristics: 2000, Population Universe: People Born in China. Available on the World Wide Web at: www.census.gov/population/cen2000/stp‐159/STP‐159‐china.xls