Embed Size (px)
Citation preview
Strategies for development and diffusion of Energy Efficient Distribution Transformers
Selecting Energy Efficient Distribution TransformersA Guide for Achieving Least-Cost Solutions
Prepared for Intelligent Energy Europe ProgrammeStrategies for Development and Diffusion ofEnergy Efficient Distribution Transformers
Intelligent Energy Europe
About Intelligent Energy Europe Programme
There are many untapped opportunities to save energy and encourage the use of renewable energy sources in Europe, but market conditions do not always help.
The Intelligent Energy - Europe programme is the EU’s tool for funding action to improve these conditions and move us towards a more energy intelligent Europe.
Intelligent Energy Europe
LEGAL NOTICE
Neither the European Commission, nor any person acting on behalf of the Commission, nor any person from SEEDT Project Partners organizations is responsible for the use which might be made of the information contained in this publication.
The views given in this publication do not necessarily represent the views of the European Commission.
Reproduction is authorised provided the source is acknowledged.Intelligent Energy Europe Programme
Selecting Energy Efficient Distribution Transformers
A Guide for Achieving Least-Cost Solutions
PROJECT Nº EIE/05/056/SI2.419632First Published June 2008
Prepared for Intelligent Energy Europe Programme
Strategies for Development and Diffusion of
Energy Efficient Distribution Transformers
by
Polish Copper Promotion Centre and European Copper Institute
in collaboration with
National Technical University of Athens, NTUA -SEEDT Co-ordinator Greece
Agence De l’ Environnement et de la Maitrise de l’ Energie, ADEME France
Alternatives pour l’énergie, les énergies renouvelables et l’environnement, AERE France
AREVA T&D Spółka z ograniczoną odpowiedzialnością, AREVA Poland
ENDESA Distribución Electrica, ENDESA Spain
Federazione delle Associazioni Scientifiche e Techniche, FAST Italy
Łódzki Zakład Energetyczny S.A., ŁZE S.A. Poland
Thelcon Ltd Greece
Wuppertal Institut für Umwelt, Klima, Energie GmbH Germany
with the support of the EUROPEAN COMMISSION
This SEEDT Guide is Something Good for You:
If …
… you would like to:
purchase a distribution transformer at the least lifecycle costs �
achieve further energy and budget savings in your organisation �
contribute to increasing energy security and reducing �greenhouse gas emissions …
… and you are:
working in an electricity distribution company, industry, �commercial or public organisation wanting to purchase a distribution transformer
working as a facility manager, planner or equipment installer �in charge of technical planning or preparing the purchase of a distribution transformer in a client’s organisation …
… then we recommend you to read this brochure.
It presents recommendations and results of the European project SEEDT (Strategies for development and diffusion of energy-efficient distribution transformers), carried out with financial support from the EUROPEAN COMMISSION under the Intelligent Energy – Europe programme and national co-financiers. The aim of SEEDT is to promote the use of energy-efficient distribution transformers, which can be profitable for investors, and by contributing to European Community energy savings, may help to fulfil EU energy policy targets.
Disclaimer
The sole responsibility for the content of this publication lies with the authors. It does not necessarily reflect the opinion of the European Communities. The European Commission is not responsible for any use that may be made of the information contained therein. While this document has been prepared with care, SEEDT team and any other contributing institutions give no warranty in regards to the contents and shall not be liable for any direct, incidental or consequential damages arising out of its use.
5
Contents
1 INTRODUCTION 71.1 Profitable Solutions Contributing to European Targets 7
1.2 European Distribution Transformer Characteristics 7
2 Losses in transformers 92.1 Definition of transformer losses 9
2.1.1 Extra losses due to harmonics 10
2.2 Losses in European Distribution Transformers 11
2.3 Transformer losses standards 13
3 Cost of losses 153.1 Annual energy losses and cost of these losses 15
3.2 Life cycle cost of transformers 15
3.3 Price of a transformer 17
3.4 Electricity price 18
3.5 Time value of money – interest rate 19
3.6 Lifetime 19
3.7 Loading profile and Load factor 19
3.8 Other aspects; technical (cos phi, harmonics), operational and environmental (climate change mitigation, ecodesign) 21
3.9 Sensitivity analysis 21
4 Energy-efficient transformers 234.1 Traditional technologies 23
4.2 Superconducting transformers 23
4.3 Amorphous transformers 23
5 Policy support proposed by SEEDT 256 Conclusions 277 Bibliography 28Annex 29

6
LIST OF FIGURESFigure 1. Distribution transformer population / rated power 8
Figure 2. Fire of a pole-mounted distribution transformer in the streets of Moscow 10
Figure 3. Breakdown of distribution sector distribution transformer losses, EU-27 and Norway 12
Figure 4. Operating efficiency of distribution sector distribution transformers, EU-27 and Norway 12
Figure 5. Simplified chart for calculation of factor A 16
Figure 6. Explanation of relation between time of peak losses and time of peak load 20
Figure 7. Sensitivity analysis – capitalised cost 21
Figure 8. Continuously transposed conductors (courtesy DKI) 22
Figure 9. Casting amorphous metal – Courtesy Metglas, Inc 24
Figure 10. Amorphous transformer from the inside 24
Figure 11. Energy-efficient transformers can help our environment. 25
LIST OF TABLES
Table 1: EU27 distribution transformer populations and annual market (transformers installed in 2004) 8
Table 2: EU-27 distribution transformer losses 11
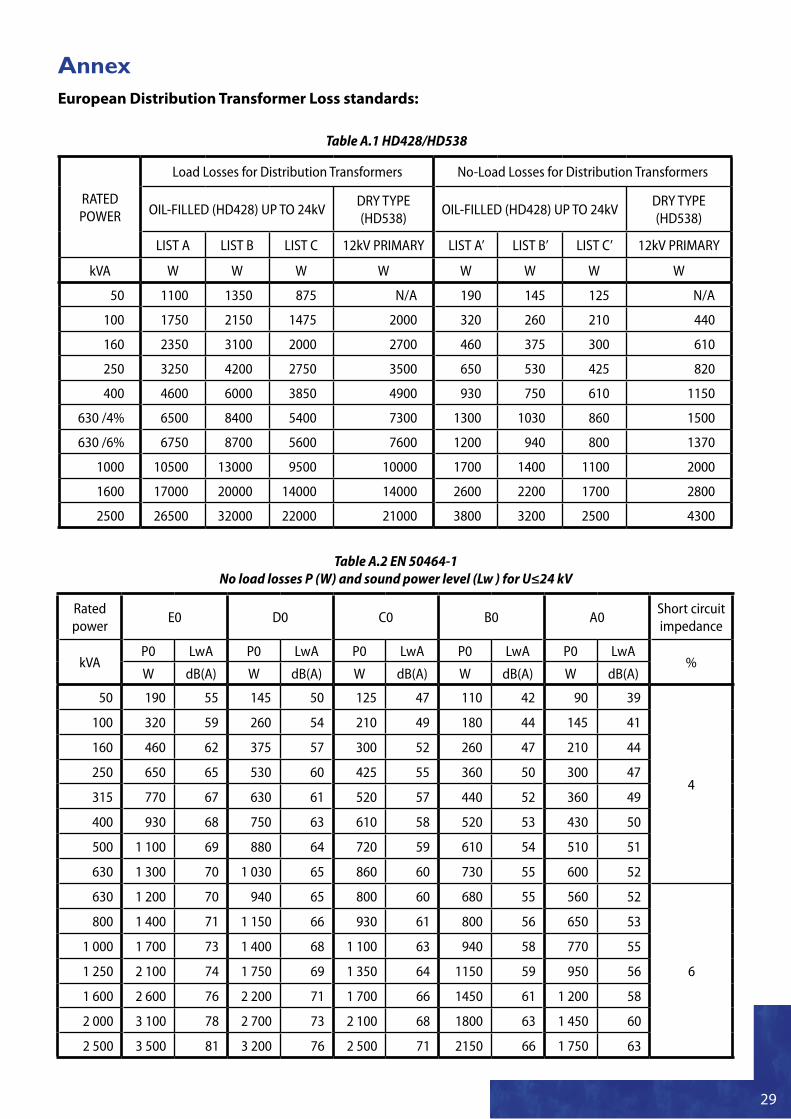
Table A.1 HD428/HD538 29
Table A.2 EN 50464-1No-load losses P (W) and sound power level (Lw ) for U≤24 kV 29
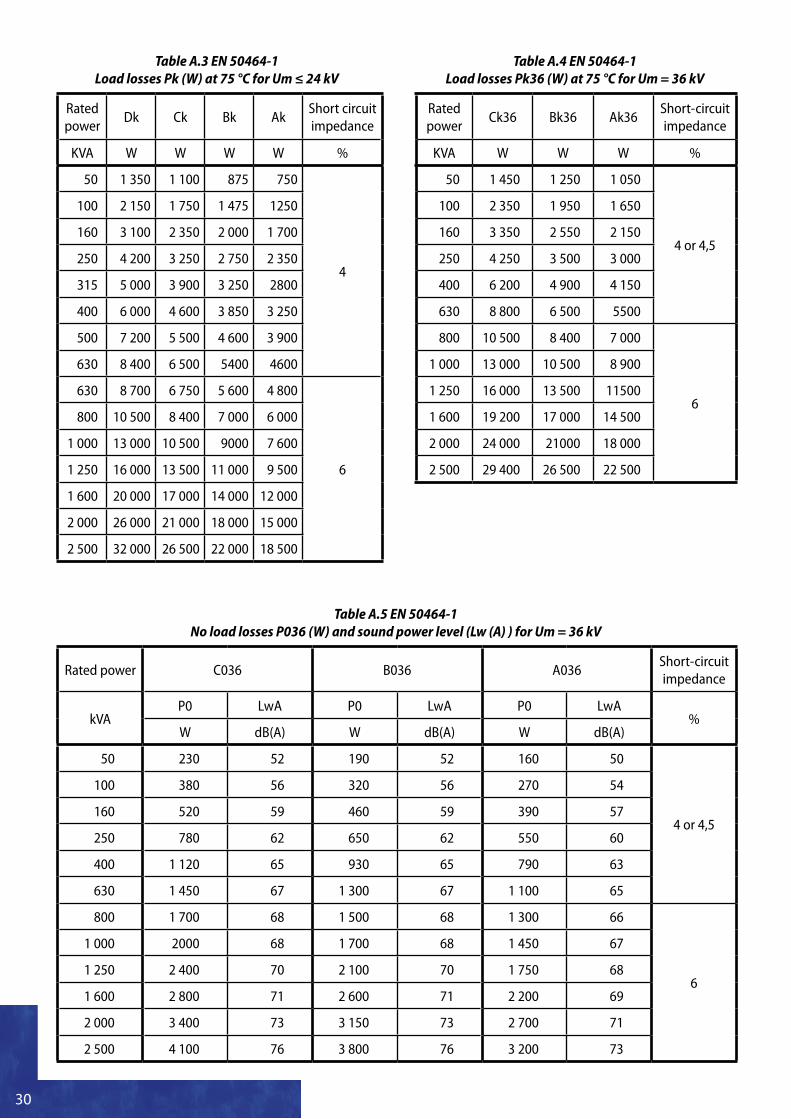
Table A.3 EN 50464-1 Load losses Pk (W) at 75 °C for Um ≤ 24 kV 30
Table A.4 EN 50464-1Load losses Pk36 (W) at 75 °C for Um = 36 kV 30
Table A.5 EN 50464-1No-load losses P036 (W) and sound power level (Lw (A) ) for Um = 36 kV 30
LIST OF ILLUSTRATIONSPhotography used under the terms of the GNU Free Documentation license version 1.2:
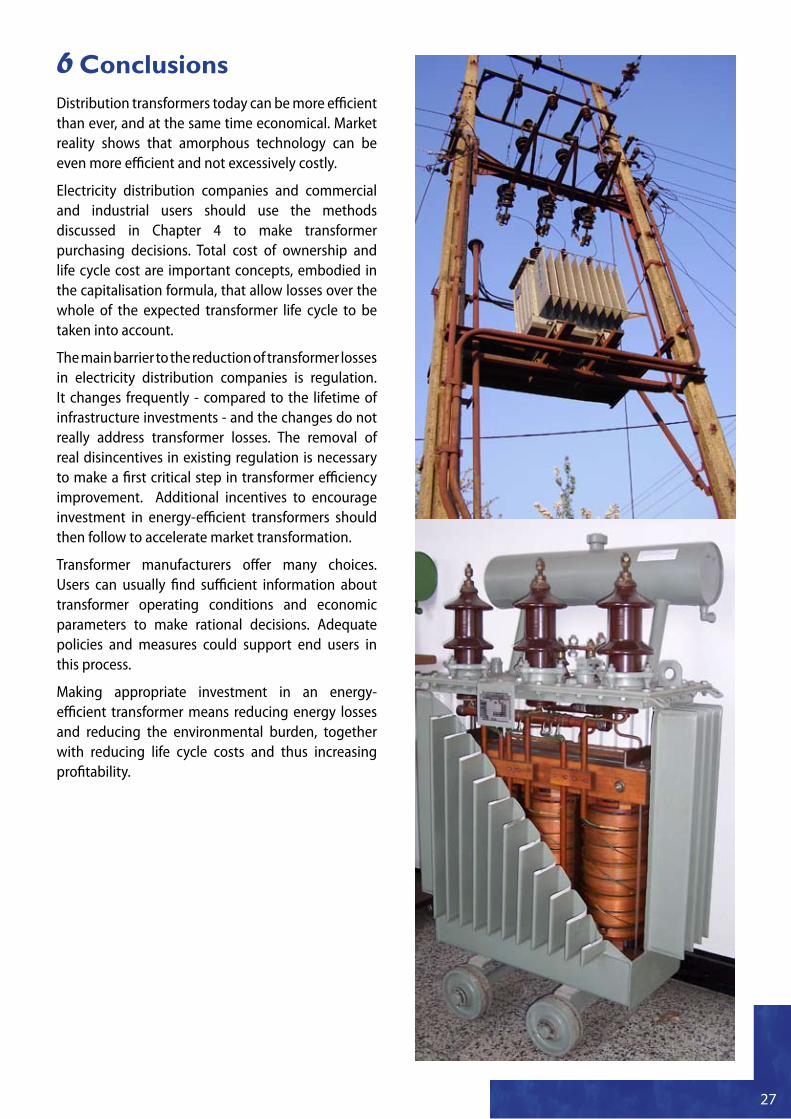
Title page photo: Transformer building in Eizer (Overijse), Belgium - author Wouter Hagens. •Page 27 top photo: Transformer in Wroclaw, Poland - author Kamil Kozłowski. •Page 27 bottom photo: Three-Phase, Medium-Voltage Transformer - author Stahlkocher. •
7
INTRODUCTION1 Profitable Solutions 1.1 Contributing to European Targets
SEEDT – Strategies for development and diffusion of Energy-efficient Distribution Transformers - is one of the projects in the Intelligent Energy Europe programme.
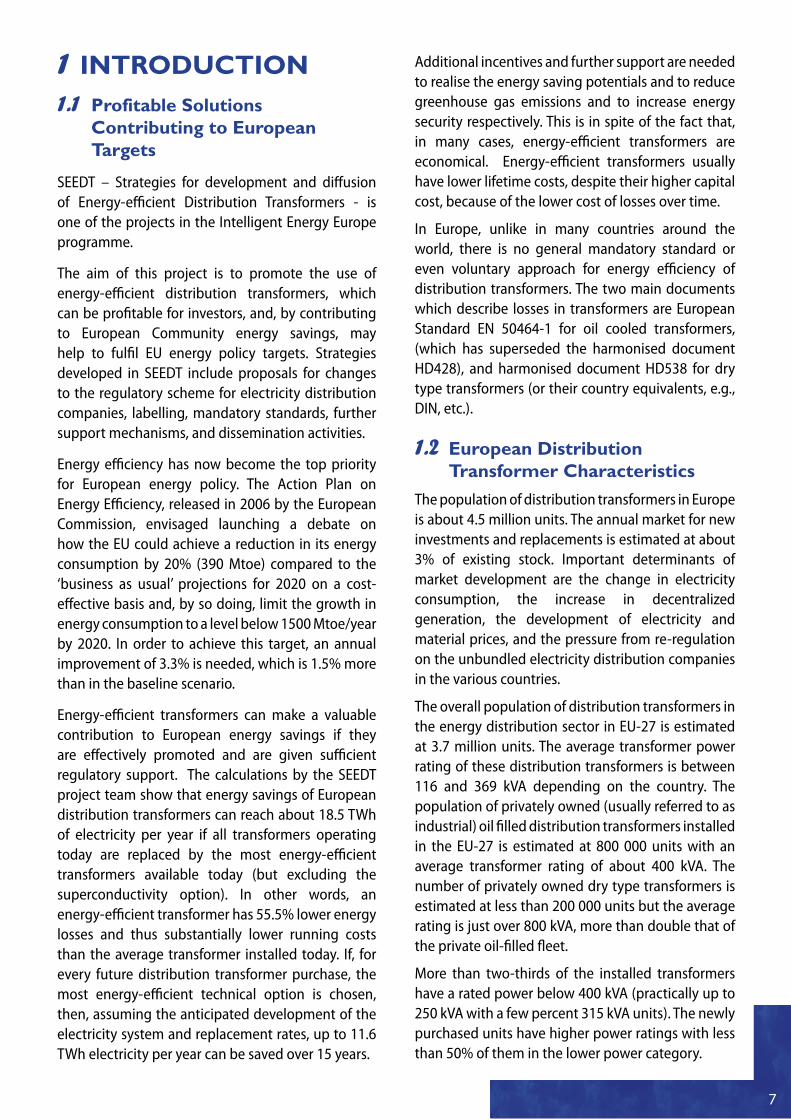
The aim of this project is to promote the use of energy-efficient distribution transformers, which can be profitable for investors, and, by contributing to European Community energy savings, may help to fulfil EU energy policy targets. Strategies developed in SEEDT include proposals for changes to the regulatory scheme for electricity distribution companies, labelling, mandatory standards, further support mechanisms, and dissemination activities.
Energy efficiency has now become the top priority for European energy policy. The Action Plan on Energy Efficiency, released in 2006 by the European Commission, envisaged launching a debate on how the EU could achieve a reduction in its energy consumption by 20% (390 Mtoe) compared to the ‘business as usual’ projections for 2020 on a cost-effective basis and, by so doing, limit the growth in energy consumption to a level below 1500 Mtoe/year by 2020. In order to achieve this target, an annual improvement of 3.3% is needed, which is 1.5% more than in the baseline scenario.
Energy-efficient transformers can make a valuable contribution to European energy savings if they are effectively promoted and are given sufficient regulatory support. The calculations by the SEEDT project team show that energy savings of European distribution transformers can reach about 18.5 TWh of electricity per year if all transformers operating today are replaced by the most energy-efficient transformers available today (but excluding the superconductivity option). In other words, an energy-efficient transformer has 55.5% lower energy losses and thus substantially lower running costs than the average transformer installed today. If, for every future distribution transformer purchase, the most energy-efficient technical option is chosen, then, assuming the anticipated development of the electricity system and replacement rates, up to 11.6 TWh electricity per year can be saved over 15 years.
Additional incentives and further support are needed to realise the energy saving potentials and to reduce greenhouse gas emissions and to increase energy security respectively. This is in spite of the fact that, in many cases, energy-efficient transformers are economical. Energy-efficient transformers usually have lower lifetime costs, despite their higher capital cost, because of the lower cost of losses over time.
In Europe, unlike in many countries around the world, there is no general mandatory standard or even voluntary approach for energy efficiency of distribution transformers. The two main documents which describe losses in transformers are European Standard EN 50464-1 for oil cooled transformers, (which has superseded the harmonised document HD428), and harmonised document HD538 for dry type transformers (or their country equivalents, e.g., DIN, etc.).
European Distribution 1.2 Transformer Characteristics
The population of distribution transformers in Europe is about 4.5 million units. The annual market for new investments and replacements is estimated at about 3% of existing stock. Important determinants of market development are the change in electricity consumption, the increase in decentralized generation, the development of electricity and material prices, and the pressure from re-regulation on the unbundled electricity distribution companies in the various countries.
The overall population of distribution transformers in the energy distribution sector in EU-27 is estimated at 3.7 million units. The average transformer power rating of these distribution transformers is between 116 and 369 kVA depending on the country. The population of privately owned (usually referred to as industrial) oil filled distribution transformers installed in the EU-27 is estimated at 800 000 units with an average transformer rating of about 400 kVA. The number of privately owned dry type transformers is estimated at less than 200 000 units but the average rating is just over 800 kVA, more than double that of the private oil-filled fleet.
More than two-thirds of the installed transformers have a rated power below 400 kVA (practically up to 250 kVA with a few percent 315 kVA units). The newly purchased units have higher power ratings with less than 50% of them in the lower power category.
8
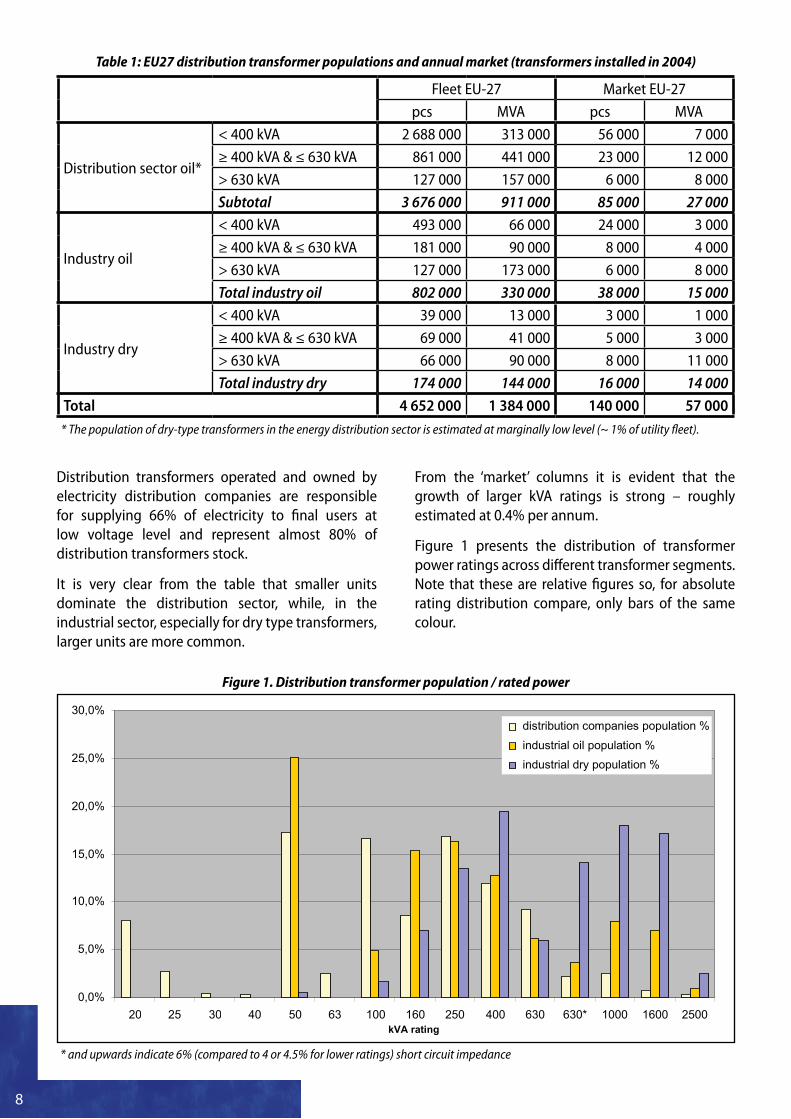
Table 1: EU27 distribution transformer populations and annual market (transformers installed in 2004)
Fleet EU-27 Market EU-27
pcs MVA pcs MVA
Distribution sector oil*
< 400 kVA 2 688 000 313 000 56 000 7 000
≥ 400 kVA & ≤ 630 kVA 861 000 441 000 23 000 12 000
> 630 kVA 127 000 157 000 6 000 8 000
Subtotal 3 676 000 911 000 85 000 27 000
Industry oil
< 400 kVA 493 000 66 000 24 000 3 000
≥ 400 kVA & ≤ 630 kVA 181 000 90 000 8 000 4 000
> 630 kVA 127 000 173 000 6 000 8 000
Total industry oil 802 000 330 000 38 000 15 000
Industry dry
< 400 kVA 39 000 13 000 3 000 1 000
≥ 400 kVA & ≤ 630 kVA 69 000 41 000 5 000 3 000
> 630 kVA 66 000 90 000 8 000 11 000
Total industry dry 174 000 144 000 16 000 14 000
Total 4 652 000 1 384 000 140 000 57 000
* The population of dry-type transformers in the energy distribution sector is estimated at marginally low level (~ 1% of utility fleet).
Distribution transformers operated and owned by electricity distribution companies are responsible for supplying 66% of electricity to final users at low voltage level and represent almost 80% of distribution transformers stock.
It is very clear from the table that smaller units dominate the distribution sector, while, in the industrial sector, especially for dry type transformers, larger units are more common.
From the ‘market’ columns it is evident that the growth of larger kVA ratings is strong – roughly estimated at 0.4% per annum.
Figure 1 presents the distribution of transformer power ratings across different transformer segments. Note that these are relative figures so, for absolute rating distribution compare, only bars of the same colour.
0,0%
5,0%
10,0%
15,0%
20,0%
25,0%
30,0%
20 25 30 40 50 63 100 160 250 400 630 630* 1000 1600 2500 kVA rating
distribution companies population % industrial oil population % industrial dry population %
Figure 1. Distribution transformer population / rated power
* and upwards indicate 6% (compared to 4 or 4.5% for lower ratings) short circuit impedance
9
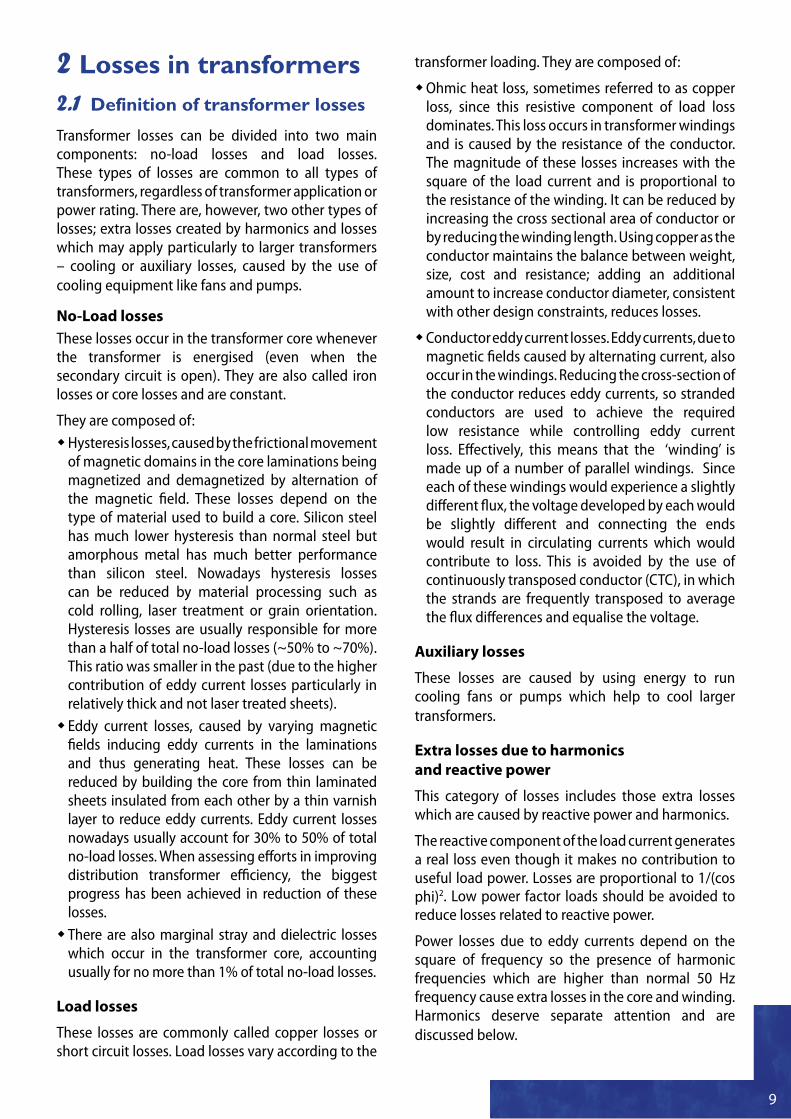
Losses in transformers2 Definition of transformer losses2.1
Transformer losses can be divided into two main components: no-load losses and load losses. These types of losses are common to all types of transformers, regardless of transformer application or power rating. There are, however, two other types of losses; extra losses created by harmonics and losses which may apply particularly to larger transformers – cooling or auxiliary losses, caused by the use of cooling equipment like fans and pumps.
No-Load lossesThese losses occur in the transformer core whenever the transformer is energised (even when the secondary circuit is open). They are also called iron losses or core losses and are constant.
They are composed of:Hysteresis losses, caused by the frictional movement �of magnetic domains in the core laminations being magnetized and demagnetized by alternation of the magnetic field. These losses depend on the type of material used to build a core. Silicon steel has much lower hysteresis than normal steel but amorphous metal has much better performance than silicon steel. Nowadays hysteresis losses can be reduced by material processing such as cold rolling, laser treatment or grain orientation. Hysteresis losses are usually responsible for more than a half of total no-load losses (~50% to ~70%). This ratio was smaller in the past (due to the higher contribution of eddy current losses particularly in relatively thick and not laser treated sheets). Eddy current losses, caused by varying magnetic �fields inducing eddy currents in the laminations and thus generating heat. These losses can be reduced by building the core from thin laminated sheets insulated from each other by a thin varnish layer to reduce eddy currents. Eddy current losses nowadays usually account for 30% to 50% of total no-load losses. When assessing efforts in improving distribution transformer efficiency, the biggest progress has been achieved in reduction of these losses.There are also marginal stray and dielectric losses �which occur in the transformer core, accounting usually for no more than 1% of total no-load losses.
Load losses
These losses are commonly called copper losses or short circuit losses. Load losses vary according to the
transformer loading. They are composed of:
Ohmic heat loss, sometimes referred to as copper �loss, since this resistive component of load loss dominates. This loss occurs in transformer windings and is caused by the resistance of the conductor. The magnitude of these losses increases with the square of the load current and is proportional to the resistance of the winding. It can be reduced by increasing the cross sectional area of conductor or by reducing the winding length. Using copper as the conductor maintains the balance between weight, size, cost and resistance; adding an additional amount to increase conductor diameter, consistent with other design constraints, reduces losses.
Conductor eddy current losses. Eddy currents, due to �magnetic fields caused by alternating current, also occur in the windings. Reducing the cross-section of the conductor reduces eddy currents, so stranded conductors are used to achieve the required low resistance while controlling eddy current loss. Effectively, this means that the ‘winding’ is made up of a number of parallel windings. Since each of these windings would experience a slightly different flux, the voltage developed by each would be slightly different and connecting the ends would result in circulating currents which would contribute to loss. This is avoided by the use of continuously transposed conductor (CTC), in which the strands are frequently transposed to average the flux differences and equalise the voltage.
Auxiliary losses
These losses are caused by using energy to run cooling fans or pumps which help to cool larger transformers.
Extra losses due to harmonics and reactive power
This category of losses includes those extra losses which are caused by reactive power and harmonics.
The reactive component of the load current generates a real loss even though it makes no contribution to useful load power. Losses are proportional to 1/(cos phi)2. Low power factor loads should be avoided to reduce losses related to reactive power.
Power losses due to eddy currents depend on the square of frequency so the presence of harmonic frequencies which are higher than normal 50 Hz frequency cause extra losses in the core and winding. Harmonics deserve separate attention and are discussed below.
10
Extra losses due to harmonics2.1.1 Non-linear loads, such as power electronic devices, such as variable speed drives on motor systems, computers, UPS systems, TV sets and compact fluorescent lamps, cause harmonic currents on the network. Harmonic voltages are generated in the impedance of the network by the harmonic load currents. Harmonics increase both load and no-load losses due to increased skin effect, eddy current, stray and hysteresis losses.
The most important of these losses is that due to eddy current losses in the winding; it can be very large and consequently most calculation models ignore the other harmonic induced losses.
The precise impact of a harmonic current on load loss depends on the harmonic frequency and the way the transformer is designed.
In general, the eddy current loss increases by the square of the frequency and the square of the load current. So, if the load current contained 20% fifth harmonic, the eddy current loss due to the harmonic current component would be 5 x 5 x 0.2 x 0.2 multiplied by the eddy current loss at the fundamental frequency – meaning that the eddy current loss would have doubled.
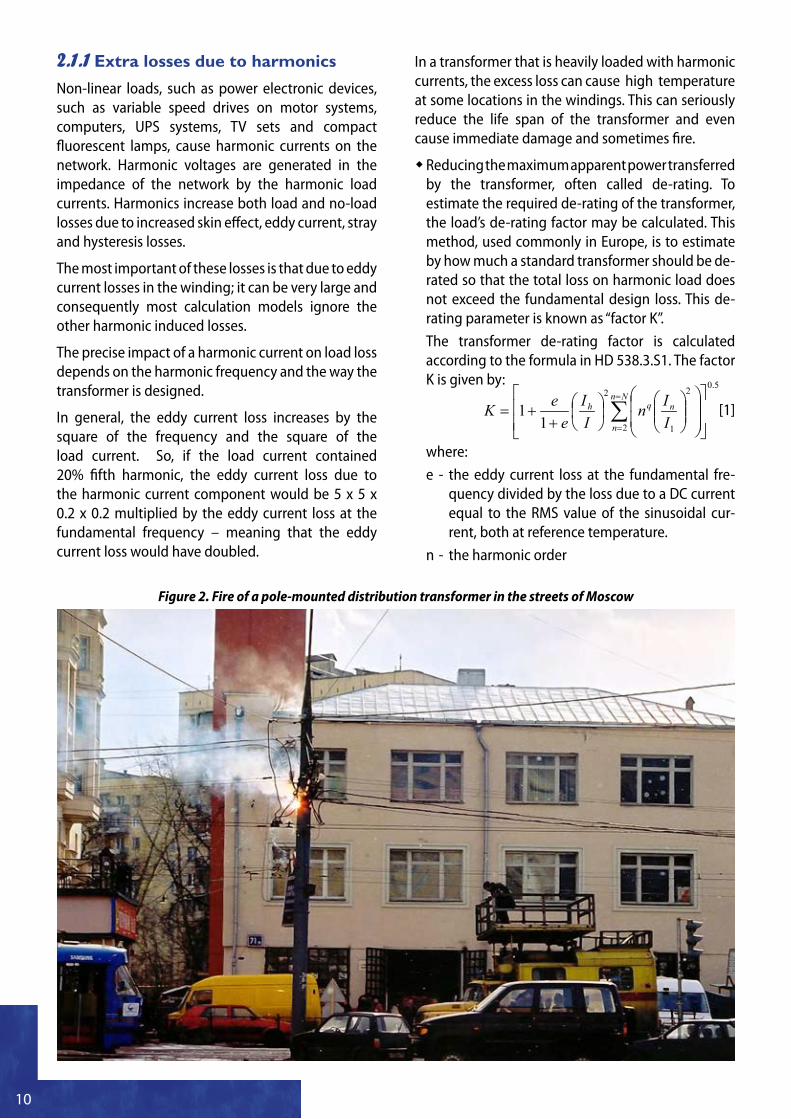
In a transformer that is heavily loaded with harmonic currents, the excess loss can cause high temperature at some locations in the windings. This can seriously reduce the life span of the transformer and even cause immediate damage and sometimes fire.
Reducing the maximum apparent power transferred �by the transformer, often called de-rating. To estimate the required de-rating of the transformer, the load’s de-rating factor may be calculated. This method, used commonly in Europe, is to estimate by how much a standard transformer should be de-rated so that the total loss on harmonic load does not exceed the fundamental design loss. This de-rating parameter is known as “factor K”.
The transformer de-rating factor is calculated according to the formula in HD 538.3.S1. The factor K is given by:
[1]
where:
e - the eddy current loss at the fundamental fre-quency divided by the loss due to a DC current equal to the RMS value of the sinusoidal cur-rent, both at reference temperature.
n - the harmonic order
Figure 2. Fire of a pole-mounted distribution transformer in the streets of Moscow
5.0
2
2
1
2
11
Nn
n
nqh
IIn
II
eeK
11
I - the RMS value of the sinusoidal current includ-ing all harmonics given by:
[2]
In - the magnitude of the n-th harmonic
I1
- the magnitude of the fundamental current
q - exponential constant that is dependent on the type of winding and frequency. Typical values are 1.7 for transformers with round rectangular cross-section conductors in both windings and 1.5 for those with foil low voltage windings.
Developing special transformer designs rated for �non-sinusoidal load currents. This process requires analysis and minimising of the eddy loss in the windings, calculation of the hot spot temperature rise, individual insulation of laminations, and/or increasing the size of the core or windings. Each manufacturer will use any or all of these techniques according to labour rates, production volume and the capability of his plant and equipment. These products are sold as ‘K rated’ transformers. During the transformer selection process, the designer should estimate the K factor of the load and select a transformer with the same or higher K factor.
K factor is defined as:
There are some simple tools available which help to calculate the de-rating factor-K and K-factor. To use them it is necessary to know the harmonic spectrum of the load current. An example of a K-Factor & Factor K calculator can be found at:
http://www.leonardo-energy.org/drupal/node/456
As an example IEC 61378-1 deals with the specification, design and testing of power transformers and reactors, which are intended for integration within semiconductor converter plants; it is not designed for industrial or public distribution of AC power in general.
The scope of this standard is limited to applications of power converters, of any power rating, for local distribution, at moderate rated converter voltage, generally for industrial applications and typically with a highest voltage for equipment not exceeding 36 kV.
The converter transformers covered by this standard may be of the oil immersed or dry-type design. The oil-immersed transformers are required to comply with IEC 60076, and with IEC 60726 for dry-type transformers.
5.0
1
2
11
5.0
1
2
Nn
n
nNn
nn I
IIII
2
1
2max
nIKnn
nn
Losses in European Distribution 2.2 Transformers
The study performed by the SEEDT team has estimated the distribution transformer losses in EU-27 countries and Norway.
The overall losses in EU-27 distribution transformers are estimated at about 33 TWh/year. However, this figure does not include reactive power and harmonic losses which, at a conservative estimate, add a further 5 TWh/year (or 15% of calculated total of no-load and load losses) for all electricity distribution companies and private distribution transformers. Therefore, total losses of distribution transformers in EU-27 might total about 38 TWh/year.
Table 2 below presents the EU-27 losses in distribution transformers divided into three sectors with the existing population (fleet) and newly installed units (market) listed separately. No-load losses (P
o) account
for more than 70% of total losses (1 - ΣPk / ΣP ratios).
Table 2: EU-27 distribution transformer losses
Transformer Fleet EU-27
Transformer Market EU-27
GWhyear
GWhyear
electricity distribution companies oil
ΣPo fleet 15 970 ΣP
o market 350
ΣPk fleet 6000 ΣP
k market 170
ΣPkfleet
ΣPtotal27.3%
ΣPkmarket
ΣPtotal33.0%
industry oil
ΣPo fleet 5540 ΣP
o market 260
ΣPk fleet 2170 ΣP
k market 100
ΣPkfleet
ΣPtotal28.1%
ΣPkmarket
ΣPtotal26.5%
industry dry
ΣPo fleet 2590 ΣP
o market 270
ΣPk fleet 1130 ΣP
k market 120
ΣPkfleet
ΣPtotal30.4%
ΣPkmarket
ΣPtotal30.9%
Total Ptotal 33400 Ptotal 1270
+ reactive power and harmonic losses
~5 000 ~200
Total Ptotal ~38 400 Ptotal ~1 470
12
Total losses in newly installed transformers are estimated at 1.24 TWh/year or 1.43 TWh/year including estimated reactive power and harmonic losses. Transformers purchased by electricity distribution companies account for more than 500 GWh/year of energy losses in the EU-25. Although transformers in electricity distribution companies have rather lower rated losses than those used by industry, their overall running efficiency is similar because the industrial population is made up of higher power transformers which are generally more efficient, run at higher loadings than transformers owned by electricity distribution companies.
70 141 11 91
1124
97 17 458
118
1400
163 68 78
471 22 8 16 6
222 204 185 97 277
22 46
682 410 462
306
3627
293
1646
425
4079
619 391
2026
595 852
1172
399 769
3631
60 49 220 181 43 63 223 79 22 59 18 69 144 0
500 1000 1500 2000 2500 3000 3500 4000 4500
AT BE CY CZ DE DK EE ES FI FR GR HU IE IT LT LU LV MT NL NO PL PT SE SI SK UK BG RO
Distribution companies - Load losses GWh Distribution companies - No-load losses GWh
Distribution companies - Total losses GWh
98,38% 98,43%
98,73%
98,43%
98,77%
98,40%
98,75%
98,06%
98,51% 98,72%
98,33%
98,05% 97,84%
98,47% 98,40%
98,16%
98,78%
98,17% 98,36%
98,87%
98,37% 98,35%
98,81% 98,66% 98,69% 98,77%
99,11% 99,04%
98,65% 98,82%
98,96%
98,68%
98,40%
98,95%
98,30%
98,58%
98,83% 98,73%
98,60%
98,89% 98,71%
98,57%
99,09%
98,56% 98,53% 98,70%
99,08% 98,91% 98,95%
98,38% 98,38%
97,50%
98,10%
98,77% 98,77%
98,46%
98,79%
98,36%
97,50% 97,70% 97,90% 98,10% 98,30% 98,50% 98,70% 98,90% 99,10% 99,30%
EU25 AT BE CY CZ DE DK EE ES FI FR GR HU IE IT LT LU LV MT NL NO PL PT SE SI SK UK BG RO
Didtribution companies population - Efficiency %Didtribution companies market - Efficiency %
Figure 3. Breakdown of distribution sector distribution transformer losses, EU-27 and Norway
Figure 4. Operating efficiency of distribution sector distribution transformers, EU-27 and Norway
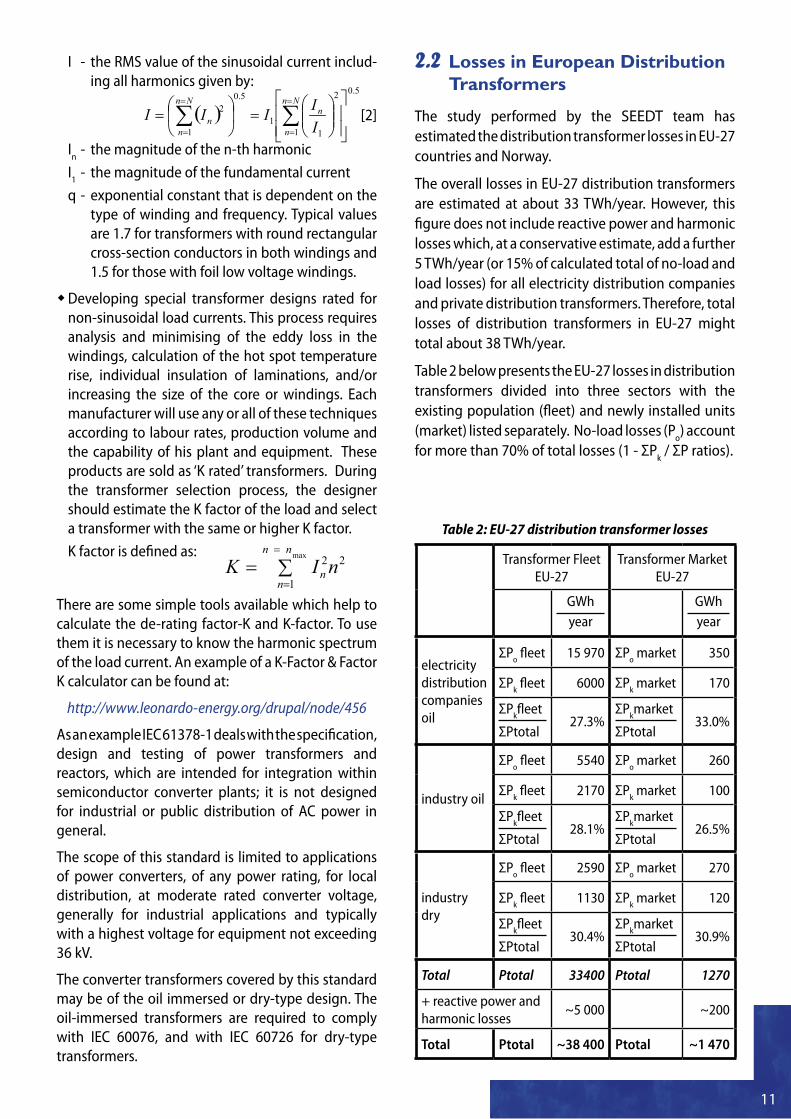
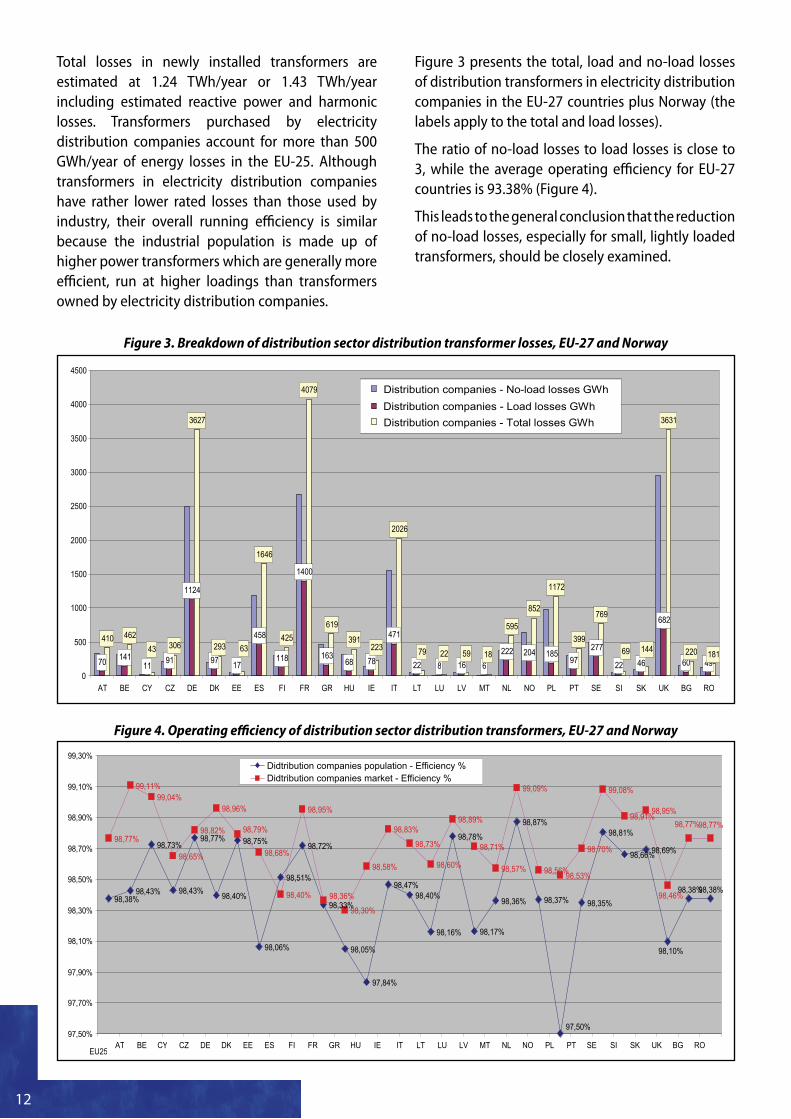
Figure 3 presents the total, load and no-load losses of distribution transformers in electricity distribution companies in the EU-27 countries plus Norway (the labels apply to the total and load losses).
The ratio of no-load losses to load losses is close to 3, while the average operating efficiency for EU-27 countries is 93.38% (Figure 4).
This leads to the general conclusion that the reduction of no-load losses, especially for small, lightly loaded transformers, should be closely examined.
13
It is worth mentioning that this ratio of no-load to load losses is specific for distribution transformers, mainly because of the loading characteristics. In larger transformers like those used to step up voltage in power plants or in substation transformers no-load losses are smaller or much smaller than load losses. In typical generator step-up transformers the ratio of no-load to load losses can be as small as 0.2 to 0.3.
Other observations are that electricity distribution companies in different countries take different approaches to taking losses into account when buying a transformer. Some of them apply rational (life-cycle cost) considerations, but others just follow traditional purchasing habits. Transformer manufacturers therefore have to adapt their sales strategies according to these different approaches. The analysis of the existing market situation and purchasing procedures leads to the conclusion that much remains to be done to reduce the existing levels of both no-load and load losses. A comparison of the market situation in electricity distribution companies and industry/commerce does not lead to very clear trends. However two observations are worth mentioning:
Distribution companies generally pay more �attention to reduction of losses in transformers than industry. However, due to higher loading and larger units of industry and commerce population, the operating efficiencies remain at a similar level.
In general, larger units are specified with lower �rated losses. This trend is even more evident in case of load losses.
Transformer losses standards 2.3 Unlike many countries around the world, Europe has no mandatory standard on energy efficiency of distribution transformers. The two main documents which describe losses in transformers are: the European Standard EN 50464-1, which has superseded the harmonised document HD428 for oil cooled transformers, and the harmonised document HD538 for dry type transformers, which is still valid (or their various country equivalents, e.g., DIN, etc.). Data from these norms is given in the Annex.
Despite the fact that there are no mandatory standards in Europe, there are some procurement procedures (internal standards of electricity distribution companies) which are highly demanding in Benelux, Germany, Austria, Switzerland and Scandinavia. Most
of the electricity distribution companies in these countries buy transformers at C 1 [C’ minus 30%] (HD 428) or AoBk (new 50464) standards. ENDESA in Spain purchases HD 428 CC’ for 400 kVA units. EdF has introduced a certain purchasing policy which specifies no load losses between Co and Eo and load losses between Dk and Bk. The mix of losses is focused on low no-load losses for small ratings and low load losses for higher ratings. Also tolerance of losses has changed recently. More often utilities reduce the tolerance of losses to, e.g., 0% instead of 15%.
Efficiency standards outside Europe may be expressed in terms of electrical efficiency, at a certain load level, or in terms of maximum values for no-load and load loss. Some examples follow below.
Australia “recalculated” the American 60 Hz efficiency NEMA TP-1 standard - which has never become mandatory in USA at federal level - to 50 Hz and also interpolated linearly the efficiencies for ratings which are different from those used in the USA.
New Zealand follows the Australian regulations for distribution transformers as a matter of policy.
In China, the standards are regularly upgraded since1999 with S7 and then S9 having been replaced by the current standard S11, which defines allowable levels for no-load and load losses slightly below Europe’s AC’ level. S11 will soon be replaced by S13 which is expected to specify lower loss levels.
The Indian Bureau of Energy Efficiency (BEE), classifies distribution transformers in the range from 25 up to 200 kVA into 5 categories from 1 Star (high loss) to 5 Stars (low loss). 5 Stars represents world-class performance. 3 Stars is being proposed as a minimum efficiency standard, and is being widely followed by utilities.
Japan has a different type of distribution system, with the last step of voltage transformation much closer to the consumer. The majority of units are pole mounted single phase transformers. The driver for setting up minimum efficiency standards was the Kyoto commitment. Transformers, together with 17 other categories of electrical equipment, should meet minimum efficiencies. In the case of transformers, the efficiency is defined at 40% load. Target average efficiency has been defined for the year 2006 (oil) or 2007 (dry type), based on the best products on the market in 2003.
1 Designations are explained in Annex - European Distribution Transformer Loss standards
14
The standard is designed differently from other standards, with efficiencies for different products being described by equations. This is currently the most demanding of all regulated standards.
Mexico sets the minimum efficiencies at slightly less stringent levels; 0.1% to 0.2% below NEMA TP-1 efficiency. As in Australia, the Mexican standard includes voluntary and mandatory elements.
In 1997, Oak Ridge National Laboratory performed extensive studies to determine whether energy conservation standards for distribution transformers would offer significant energy savings, be technically achievable and economically justified. The energy savings potential in the USA from switching to high efficient transformers was estimated to be 141 TWh cumulatively. One of the reasons for this high figure is the high number of distribution transformers in the utility networks in the US.
To reduce these losses, the National Electrical Manufacturers Association (NEMA) created the TP1 standard which defines a minimum efficiency for dry and oil-filled type transformers in the range from 10 to 2500 kVA. This became the basis for the rule making process on minimum standards. NEMA TP-1 has been used as a guideline by Canada, Australia, New Zealand and (partially) Mexico and was adopted by Massachusets, Minnesota, Wisconsin, New York, Vermont, California and Oregon. Subsequently, this standard was perceived as insufficiently demanding and, in 2006, the US Department of Energy (DoE) proposed a new standard. This proposal was a compromise between less stringent TP-1 and the level of losses which, on average, represent the minimum life cycle cost (MLLC), with the proposed loss levels set to represent one third of the improvement between TP-1 and MLCC.
Now, a new standard, closely based on the DoE proposal, has been introduced which will apply to all transformers manufactured for sale in the USA or imported into the USA on or after January 1, 2010. The requirement of the standard is very close to CC’ -30% or AoBk.
In addition to this standard, transformers are also a part of the broader EnergyStar labelling programme. EnergyStar is a voluntary programme that encourages the participating utilities to calculate the total cost of ownership of their transformers and buy the type if it is cost-effective to do so. EnergyStar is based on TP1 but may be tightened in the future.
A third programme in the US, set up by the Consortium for Energy Efficiency (CEE), aims to increase the awareness of the potential of efficient transformers in industry. It consists of a campaign to measure the efficiency of industrial transformers and to stimulate companies to upgrade their transformer park to the best available in the market.
Canada follows TP-1 strictly but the mandatory levels apply only for dry type transformers. As far as oil transformers are concerned Canada has conducted an analysis of MEPS implementation potential and found that the great majority of Canadian oil distribution transformers already comply with NEMA TP-1 so the standard would have almost no influence on the market. The yearly MEPS standard impact would only be 0.98 GWh for liquid filled transformers compared to a saving potential at 132 GWh for dry-type transformers. Also Energy Star products are very actively promoted in Canada.
15
Cost of losses3 Annual energy losses and cost of 3.1 these losses
The annual energy losses of a transformer can be estimated from the following formula:
[3]
in which:W
Loss - is the annual energy loss in kWh
Po - is the no-load loss in kW. This factor is
available from the transformer specifications or can be measured.
Pk - is the short-circuit loss (or load loss) in kW.
This factor is available from the transformer specifications or can be measured.
L - is the average per-unit load on the transformer.
8760 - is the number of hours in a year
To calculate the cost of these losses, they need to be converted to the moment of purchase by assigning capital values, to be able to put them into the same perspective as the purchase price. This is called the Total Capitalised Cost of the losses, TCCloss. This can be calculated using the following formula:
[4]
where:C - is the estimated average cost per kWh in
each yeari - is the estimated interest raten - is the expected life time of the transformer
Life cycle cost of transformers 3.2 To perform the economical analysis of transformer, it is necessary to calculate its life cycle cost, sometimes called total cost of ownership, over the life span of transformer or, in other words, the capitalised cost of the transformer. All these terms mean the same – in one formula, costs of purchasing, operating and maintaining the transformer need to be compared taking into account the time value of money.
The concept of the ‘time value of money’ is that a sum of money received today has a higher value – because it is available to be exploited – than a similar sum of money received at some future date.
In practice, some simplification can be made. While each transformer will have its own purchase price and loss factors, other costs, such as installation,
hLPPW KLoss 8760 ** 20
8760
)1(1)1(
Cii
iWTCC n
n
lossloss
maintenance and decommissioning will be similar for similar technologies and can be eliminated from the calculation. Only when different technologies are compared e.g. air cooled dry type transformers with oil cooled transformers will these elements need to be taken into account.
Taking only purchase price and the cost of losses into account the Total Cost of Ownership can be calculated by:
[5]
where: PP - is the purchase price of transformer,A - represents the assigned cost of no-load
losses per watt, Po - is the rated no-load loss,B - is the assigned cost of load losses per watt,Pk - is the rated load loss.
This formula can also be found in HD428 and HD538.
Po and P
k are transformer rated losses. A and B values
depend on the expected loading of the transformer and energy prices.
The choice of the factors A and B is difficult since they depend on the expected loading of the transformer, which is often unknown, and energy prices, which are volatile, as well as interest rate and the anticipated economic lifetime. If the load grows over time, the growth rate must be known or estimated and the applicable energy price over the lifetime must be forecast. Typically, the value of A ranges from less than 1 to 8 EUR/Watt and B is between 0.2 and 5 EUR/Watt.
Below we propose a relatively simple method for determining the A and B factor for distribution transformers.
A and B factors are calculated as follows:(no-load loss capitalisation)
[6]
and (no-load loss capitalisation)
[7]
where:i - interest rate [%/year]n - lifetime [years]C
kWh - kWh price [EUR/kWh]
8760 - number of hours in a year [h/year]I
l - loading current [A]
Ir - rated current [A]
KPBPAPPTCO ** 0
8760
)1(1)1(
CkWhn
n
iiiA
2
8760)1(
1)1(
r
lkWhn
n
II
iiiB C
16
These formulae assume that energy prices and the loading are constant over the transformer life.
Usually, the loss evaluation figures A and B form part of the request for quotation are submitted to the transformer manufacturers, who can then start the complicated process of designing a transformer to give the required performance. The result of this open process should be the cheapest transformer, i.e. with the lowest total cost of ownership, optimised for a given application. The drawback of this process is, as mentioned, the difficulty in predicting the future load profile and electricity costs and tarrifs with any confidence. On the other hand, these optimisation efforts depend on material prices, particularly active materials, i.e. conductor and core material. Dynamic optimisation makes sense when there is the different price volatility of different materials like aluminium and copper or high and low loss magnetic steel..
For large transformers, above a few MVA, the cost of losses are so high that transformers are custom-built, tailored to the loss evaluation figures specified in the request for quotation for a specific project.
For distribution transformers, often bought in large batches, the process is undertaken once every few years. This yields an optimum transformer design, which is then retained for several years – less so
0,00
2,00
4,00
6,00
8,00
10,00
12,00
14,00
1 2 3 4 5 6 7 8 9 10 11 12 13 14 15 16 17 18 19 20Years
6,75
3% 4% 5% 6% 7% 8% 9% 10% 11% 12%Interest
3% 4% 5% 6% 7% 8% 9% 10% 11% 12%Interest
A factor (euro/W) at an electricityprice = 100 Euro/MWh
nowadays because of the volatility of metal prices - until energy prices and load profiles have changed dramatically. In fact the loss levels established in HD428, HD538 and national standards reflect established practice of preferred designs with respect to loss evaluation values.
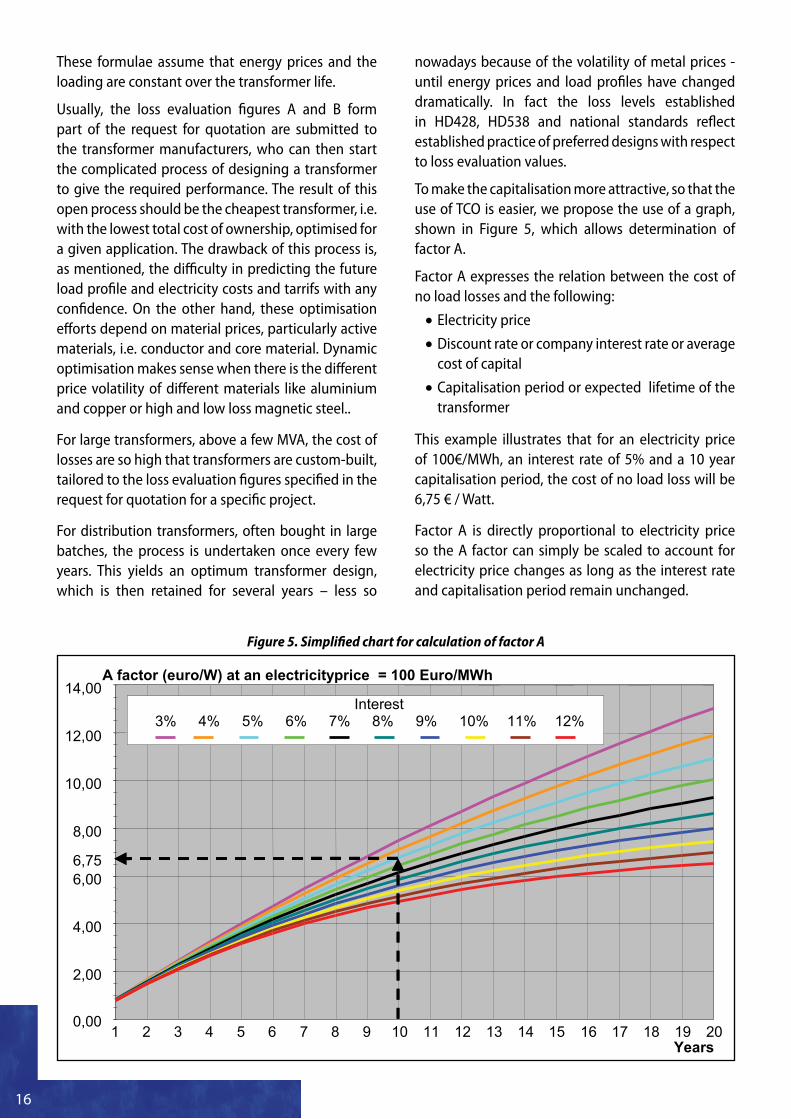
To make the capitalisation more attractive, so that the use of TCO is easier, we propose the use of a graph, shown in Figure 5, which allows determination of factor A.
Factor A expresses the relation between the cost of no load losses and the following:
Electricity price •Discount rate or company interest rate or average •cost of capital
Capitalisation period or expected lifetime of the •transformer
This example illustrates that for an electricity price of 100€/MWh, an interest rate of 5% and a 10 year capitalisation period, the cost of no load loss will be 6,75 € / Watt.
Factor A is directly proportional to electricity price so the A factor can simply be scaled to account for electricity price changes as long as the interest rate and capitalisation period remain unchanged.
Figure 5. Simplified chart for calculation of factor A
17
It is important to note that, for small interest rates, a doubling of the capitalisation period will result in almost doubling the cost of losses. On the other hand, applying too high a capital rate, by making, for example, too high a provision for risk, will produce a low value of loss.
Factor B, as explained previously, is simply the product of factor A and the square of the loading factor. (B = A * (Loading)2) The loading factor used here is the expected average load over the life span of the transformer, possibly taking harmonics into account.
Leonardo ENERGY offers a downloadable spread-sheet to be used as a calculator of TCO. The tool incorporates a more sophisticated modelling of loads and harmonics.
Furthermore, in the course of the SEEDT project, the tool SEEDT TLCalc has been developed. This transformer loss calculator is an interactive tool that allows comparison of two distribution transformers from both an economic and environmental point of view.
The Spreadsheet tools for life-cycle evaluation can be found at:
http://www.leonardo-energy.org/drupal/node/446
http://seedt.ntua.gr (cf. main menu with the title “TLCalc”)
Having determined the required values it is important to know how sensitive they are to changes in the assumptions on which they were based.
Price of a transformer 3.3 Today the production of transformers is characterised by a large variety of designs, manufactured in relatively short batches to meet the demands of a variety of customers with ever-changing expectations. Of course, fluctuations in commodity prices have a significant effect.
The designer has a certain choice of solutions which can be applied in order to build a transformer with expected rated losses. It is possible to use, for instance, different magnetic materials or change the proportions between the level of magnetic induction and current density. It is, however, important from the point of view of the manufacturer that the transformer with expected parameters will be designed in an optimum way.
It is also possible to vary the ratio of copper to steel quantities. According to an old rule of thumb within the transformer industry, the production cost optimum lies somewhere around a ratio of steel to copper usage of 2:1. However, it is a fairly flat optimum and, of course, varies with the price ratio of steel to copper. Independently of this, it should be taken into consideration that the operating properties of the transformer also vary when the shares are varied, especially with respect to losses: Holding the current densities in the windings and the magnetic flux density in the core constant, the loss per kilogram of copper or steel, respectively, will be more or less constant. Thereby a transformer designed according to this philosophy, but with more iron and less copper, tends to have higher iron losses, and one with more copper and less iron will have higher copper losses. But this does not mean that skimping on copper and steel pays off! Rather, enhancing the core cross-section while keeping the number of turns constant will reduce core losses, and enhancing the copper cross section while keeping the core cross section constant will reduce copper losses. In short: the bulkier transformer will always be more efficient, and metal prices will always be an obstacle against its implementation.
The progress in the scope of calculation techniques allows for optimisation to get a precise model of the transformer geometry, taking into account the actual core cross-section and the location of windings. It allows precise calculation of the transformer parameters. Manufacturers have many methods of design optimisation at their disposal which may be used in solving the issues in question.
At today’s commodity prices (low loss magnetic steel 2 500 - 3 000 € / tonne, copper 6 000 - 7 000 € / tonne) the indicative transformer price for AC’ class 100 kVA typical distribution transformer is around 3 000 €, 400 kVA is around 7 000 € and 1 000 kVA around 12 000 €. The price / rating characteristics can be roughly described as:
[8]
where:
C1 - is cost of transformer “1”
C0 - is cost of transformer “0”
S1n
- is rated power of transformer “1”S
0n - is rated power of transformer “0”
x - exponent (cost factor)
x
n
n
SSCC
0
101 *

18
The X factor is about 0.4 to 0.5. For more efficient units this factor has a tendency to increase up to 0.6 or even higher.
Dry type transformers representing rated losses specified by HD 538 standard are usually a few percent lighter than oil transformers (as they do not contain oil) but, because of the more costly manufacturing process, they are about 10% to 30% more expensive than CC’ oil-filled machines. Because of some differences in design, particularly of magnetic circuit, no-load losses of dry transformers are substantially higher than in oil transformers.
Thanks to optimisation efforts and technology improvements, there is an area for transformer manufacturing cost reduction. Commodity prices have gone up for the last few years and have outweighed the cost-reducing effect of optimisation and technological improvements. The cost of active materials in typical transformers increased by more than 50% between the years 2003 and 2007. In these conditions transformer design optimisation can bring around 5% savings in manufacturing cost. This effect is better in less efficient machines.
Please note that, when the price of both active materials (magnetic steel and winding material) increases in similar proportion, the optimisation brings only marginal savings in manufacturing cost, when the same loss levels are specified. So manufacturers rather prefer to agree certain capitalisation based formula when optimisation of transformer may bring some savings in manufacturing cost.
Today, the cost active materials in an average distribution transformer represents about 50% of the transformer total price; taking all materials into account increases this to 70% of the total price.
Let’s take the example of a typical medium size distribution transformer. Efficiency improvement today by reducing no-load losses adds to the cost by about 0.3% to 0.7% for 1% loss reduction in the area of moderate losses (between A’ and C’ level) and from 0.7% (close to C’) to 1.4% in area of very low losses (more than 20% below C’). For load losses, this proportion is higher, even at smaller load loss reduction and ranges from 0.6% to 1%. When we start to reduce load loss in the area of level C minus 15% (new Ak level) this cost may increase to 1.6%. Very roughly, if both losses are reduced at the same time, the cost should theoretically be higher (if no-
load losses are reduced by adding more steel, the core becomes wider and requires longer conductor path resulting in increase of resistance and load loss, when load losses are reduced by increasing conductor cross-section the core becomes larger and requires more steel) but in fact this effect is almost negligible until a certain level of both losses. Beyond that, reducing both losses at the same time results in increasing suboptimum and going further towards both reduction extremes becomes extremely expensive and absolutely impractical.
It is, however, worthwhile mentioning that load loss reduction by increasing the amount of conductor material is not necessarily the most cost-effective measure. As already mentioned, to reduce load losses by design optimisation it is possible to reduce the amount of copper but change other transformer parameters e.g. adding more or higher grade magnetic steel.
As a very general comparison, ten years ago, amorphous transformers were more expensive than the European average transformers (with AC’ losses) by a factor of 2 or more. Today, this proportion has reduced to a factor of 1.5 or less.
Note that values given above are indicative only!
Electricity price 3.4 The process of electricity market liberalisation led to an adjustment of electricity prices in Europe. Prices for end users consist of certain standardised components:
energy and load price •transmission price •distribution price •metering and billing price •
Prices for industry and commerce are usually subject to bilateral contracts between supplier and end user. Large industry partly buys directly in the energy market. Electricity distribution companies usually tender for covering loss energy.
Prices may differ depending on the type and size of end user, the time when the electricity is consumed (e.g. night tariffs) and the voltage level at which electrical energy delivery and metering is made. VAT and other local or national taxes are added.
19
Electricity prices for industry in Europe vary between 60€/MWh to almost 120€ / MWh depending on country and industry size with the mean value of 90€/MWh for users consuming around 1GWh annually. Price evolution scenarios are not identical as EU energy policy may have different costs and different results but, in general, no dramatic increase is expected and after 2010/2015 prices should become rather stable.
Which price should be used when calculating TCO? For industrial and commercial users the contractual price, if possible with a price evolution scenario when changes are thought likely. For an electricity distribution company tendering for covering electricity losses, the price received under the tender should be used. For other electricity distribution companies, the question is more complex. First of all this should be long-term marginal cost not a price. It should not be an electricity cost having generation and transmission part included only. Marginal costs of distribution network should be included as well. If electricity prices reflect fair electrical energy supply business i.e. are based on cost calculation, the cost in question should be final end user price less profit of distribution company.
The real situation for electricity distribution companies is further complicated by regulation schemes, which do not allow for direct and full return on capital invested in - for example - more efficient transformers.
Time value of 3.5 money – interest rate
Industrial investors have always in mind the rate of investment which should be applied when purchasing machines. This is either the weighted average cost of capital or the required rate of return on different investments. Investment in transformer is however essential to every business as it cannot be avoided. Applying too high rates with a lot of risk provisions is not advisable.
For electricity distribution companies, energy regulators usually recommend certain interest rates to value investments into electricity distribution assets. An indicative value is around 5% to 6 % real interest rate.
Lifetime 3.6 Lifetime is a crucial component of the TCO calculation. Transformers are durable and have long working lives. For financial purposes, the amortisation period for an investment in a transformer is often set at ten years. After that period, companies are no longer motivated to invest in new, more efficient, transformers since the 10 year-old one bears no cost and cannot be logically compared to the cost of a new investment. The average technical life of a transformer is 30 years or more; the SEEDT study has shown that more than 10% of the European transformer fleet is 40 years old or more. This 10% of the transformer fleet contributes more than 20% of the total no-load losses and more than 15% of load losses in European distribution companies.
Concluding, the minimum reasonable transformer lifetime in TCO calculations should be 20 years and arguments mentioned above indicate that applying 30 years lifetime in industry and commerce, and 40 years lifetime in electricity distribution companies can be justified as well
Loading profile and Load factor 3.7 Transformer loading conditions are probably most influential as far as optimum selection of distribution transformer losses is concerned. Very generally, for heavily loaded transformers, the focus should be on load losses while for those which are lightly loaded, it should be on no-load losses. What does heavily mean? Where is a difference?
Ideally, to calculate the load losses it would be necessary to integrate the squares of all momentary ratios of actual load to the rated load. This is practically impossible so the methodology to analyse load losses based on summation of energy consumed in transformers has been developed.
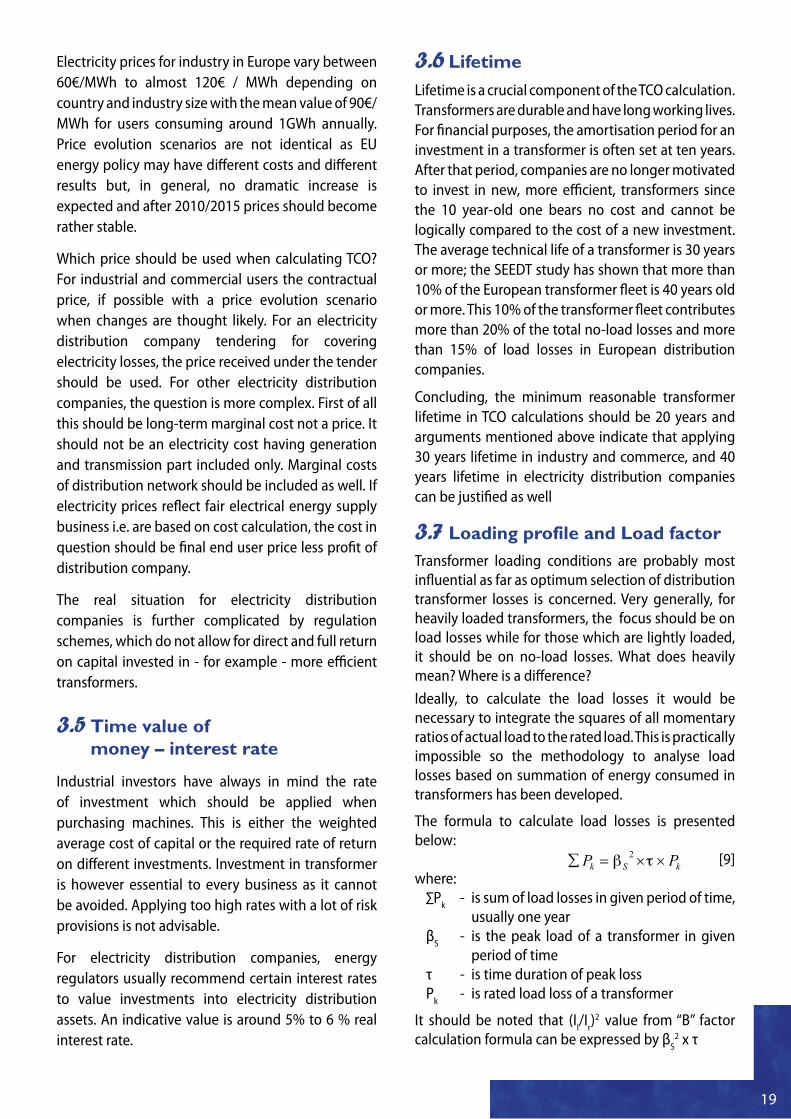
The formula to calculate load losses is presented below:
[9]where:
∑Pk - is sum of load losses in given period of time,
usually one yearβ
S - is the peak load of a transformer in given
period of timeτ - is time duration of peak lossP
k - is rated load loss of a transformer
It should be noted that (Il/I
r)2 value from “B” factor
calculation formula can be expressed by βS
2 x τ
kSk PP 2
20
LOAD Ts=4000 hLOAD LOSSES τs=2280 h
P/ Ps
ΔP /ΔPmax
0
0,1
0,2
0,3
0,4
0,5
0,6
0,7
0,8
0,9
1
0 1000 2000 3000 4000 5000 6000 7000 8000 9000Time [hours]
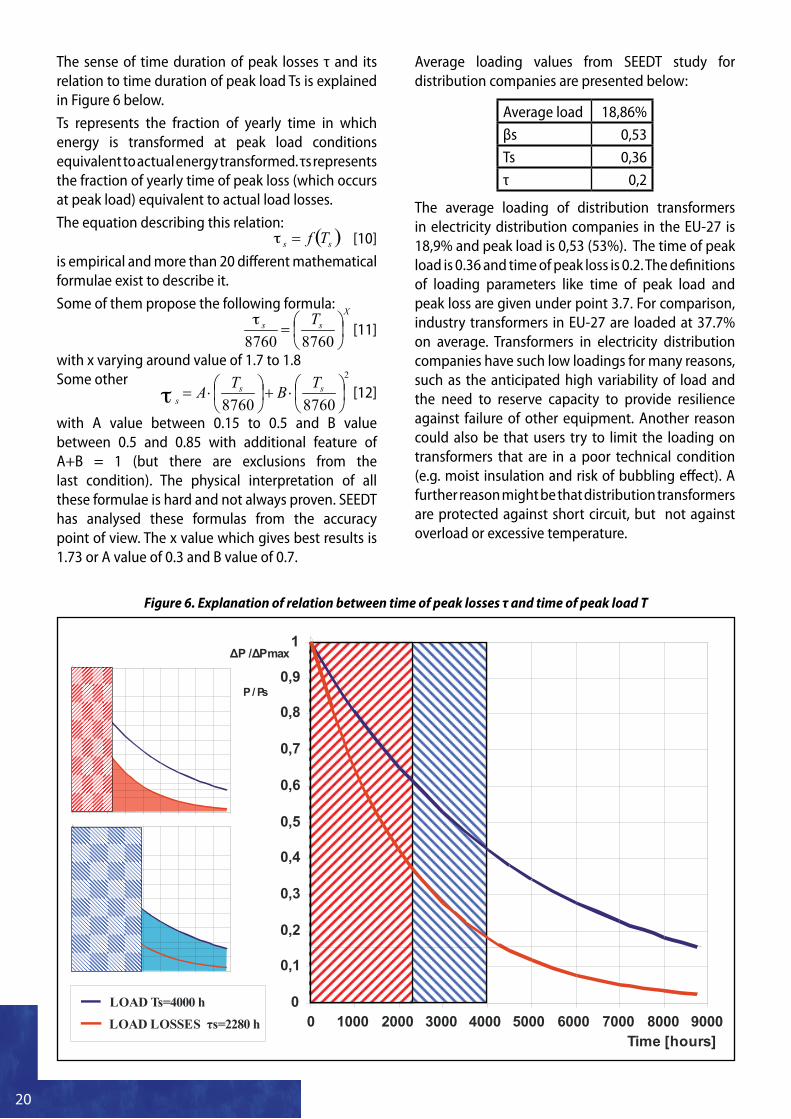
Figure 6. Explanation of relation between time of peak losses τ and time of peak load T
The sense of time duration of peak losses τ and its relation to time duration of peak load Ts is explained in Figure 6 below.
Ts represents the fraction of yearly time in which energy is transformed at peak load conditions equivalent to actual energy transformed. τs represents the fraction of yearly time of peak loss (which occurs at peak load) equivalent to actual load losses.
The equation describing this relation: [10]
is empirical and more than 20 different mathematical formulae exist to describe it.
Some of them propose the following formula:
[11]
with x varying around value of 1.7 to 1.8Some other
[12]
with A value between 0.15 to 0.5 and B value between 0.5 and 0.85 with additional feature of A+B = 1 (but there are exclusions from the last condition). The physical interpretation of all these formulae is hard and not always proven. SEEDT has analysed these formulas from the accuracy point of view. The x value which gives best results is 1.73 or A value of 0.3 and B value of 0.7.
Average loading values from SEEDT study for distribution companies are presented below:
Average load 18,86%
βs 0,53
Ts 0,36
τ 0,2
The average loading of distribution transformers in electricity distribution companies in the EU-27 is 18,9% and peak load is 0,53 (53%). The time of peak load is 0.36 and time of peak loss is 0.2. The definitions of loading parameters like time of peak load and peak loss are given under point 3.7. For comparison, industry transformers in EU-27 are loaded at 37.7% on average. Transformers in electricity distribution companies have such low loadings for many reasons, such as the anticipated high variability of load and the need to reserve capacity to provide resilience against failure of other equipment. Another reason could also be that users try to limit the loading on transformers that are in a poor technical condition (e.g. moist insulation and risk of bubbling effect). A further reason might be that distribution transformers are protected against short circuit, but not against overload or excessive temperature.
ss Tf
Xss T
87608760
2
87608760
ss
s
TBTA
21
Industrial transformers are loaded higher than transformers owned by distribution companies. Average load is 37.7%, peak load above 0.7, while time of peak load and peak loss are about 0.3 and 0.15, which suggests that industry as a whole time capacity and subsequent load are fairly intermittent.
It is quite visible that τ value is around 50 to 60% of T value. Theoretically τ is 50% of T in situations where the T curve (blue) in Figure 6 is a straight line between peak load and zero (load is continuously and uniformly distributed between peak load and zero). On the contrary, when the T curve is a straight horizontal line (equal load all the year), both values T and τ will be equal.
Understanding the influence of loading conditions is necessary to calculate the “B” factor. In practical situations additional effort should also be made to anticipate loading changes over time.
Other aspects; 3.8 technical (cos phi, harmonics), operational and environmental (climate change mitigation, ecodesign)
Apart from the parameters discussed in sections 3.3 to 3.7, which are inputs into the TCO calculation, other parameters, such as power factor (or reactive power), harmonics and even voltage level, have an influence on the energy efficiency of transformers and thus on the TCO results.
The influence of power factor and harmonics has already been explained in section 2.1. Voltage
-1500 -1250 -1000 -750 -500 -250 0 250 500 750EURO
Purchase price
Interest
Economic life time
Loading
CO2 value
CO2 emission
Electricity price
Harmonics
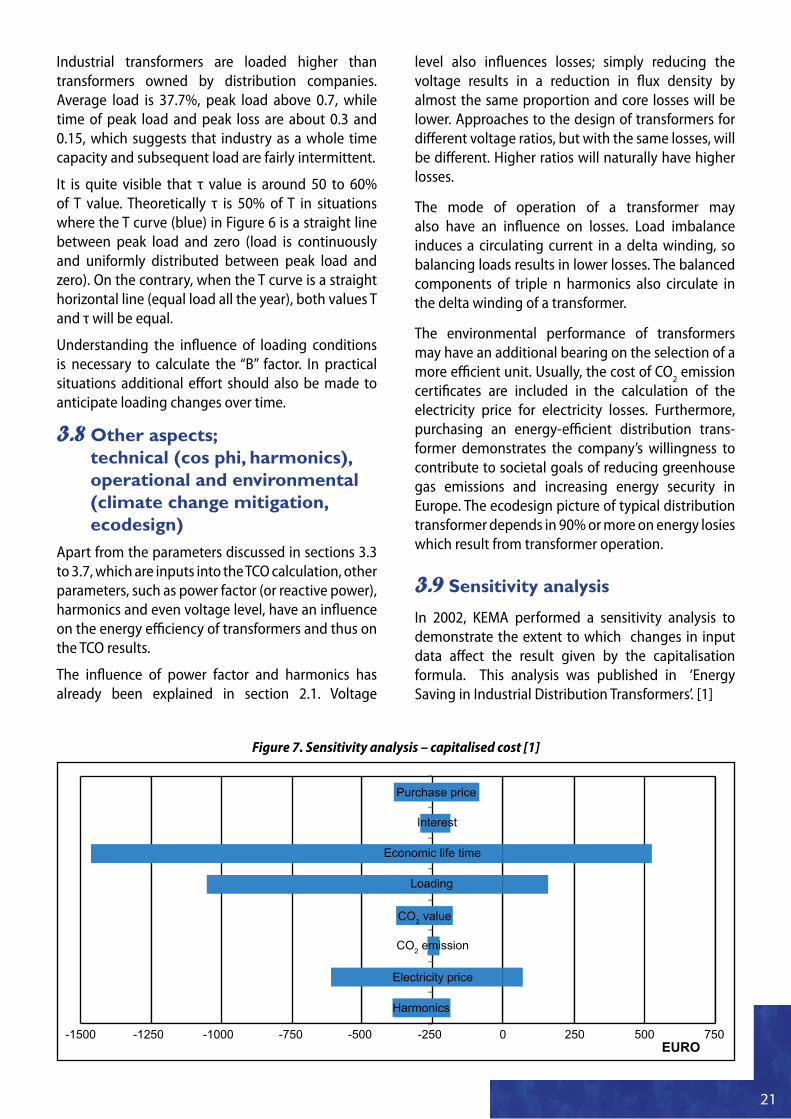
Figure 7. Sensitivity analysis – capitalised cost [1]
level also influences losses; simply reducing the voltage results in a reduction in flux density by almost the same proportion and core losses will be lower. Approaches to the design of transformers for different voltage ratios, but with the same losses, will be different. Higher ratios will naturally have higher losses.
The mode of operation of a transformer may also have an influence on losses. Load imbalance induces a circulating current in a delta winding, so balancing loads results in lower losses. The balanced components of triple n harmonics also circulate in the delta winding of a transformer.
The environmental performance of transformers may have an additional bearing on the selection of a more efficient unit. Usually, the cost of CO
2 emission
certificates are included in the calculation of the electricity price for electricity losses. Furthermore, purchasing an energy-efficient distribution trans-former demonstrates the company’s willingness to contribute to societal goals of reducing greenhouse gas emissions and increasing energy security in Europe. The ecodesign picture of typical distribution transformer depends in 90% or more on energy losies which result from transformer operation.
Sensitivity analysis3.9 In 2002, KEMA performed a sensitivity analysis to demonstrate the extent to which changes in input data affect the result given by the capitalisation formula. This analysis was published in ‘Energy Saving in Industrial Distribution Transformers’. [1]
22
A negative value means it is useful to choose the transformer with the low losses. When the result is positive, the transformer with the losses according to HD 538 (not very efficient) should be used. It is clear that most attention should be given to the economic lifetime, loading pattern and electricity price. Disregarding these values will certainly have a great influence on deciding which transformer should be used and could give a poorly optimised transformer. The influence of the purchase price of the transformer is relatively small and the remaining parameters even smaller.
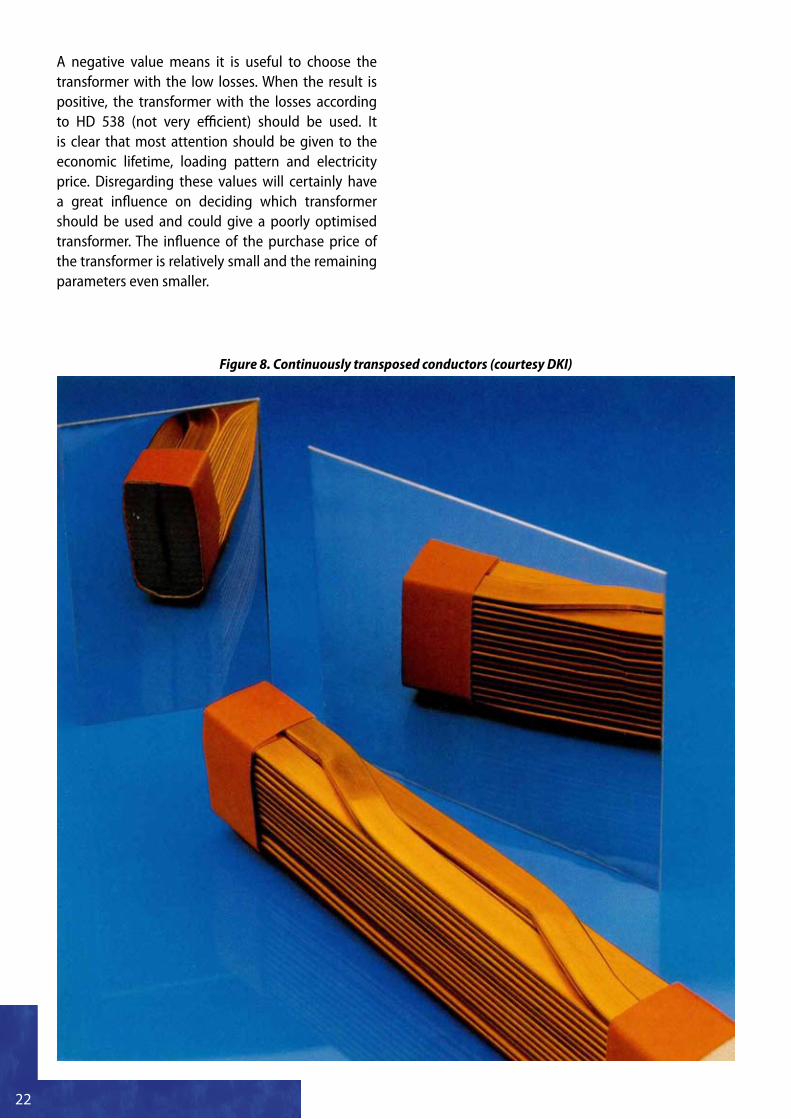
Figure 8. Continuously transposed conductors (courtesy DKI)
23
Energy-efficient 4 transformers
Traditional technologies4.1 According to the SEEDT study the load losses have been reduced by about 30 to 50% during last 40 years. Copper conductors have replaced aluminium conductors due to their lower resistance and better tensile strength. Conductor design has also been upgraded by the introduction of continuously transposed conductors (a single conductor sub divided into several flat sub-conductors which are regularly transposed), reducing eddy current losses and allowing better packing density of the winding.
Also winding design and insulation improvements, making it thinner, allowing operation at higher temperature, adding some dielectric strength, also helped to reduce load losses by improving heat evacuation and increasing the conductor area.
As far as no-load losses are concerned, their reduction over the last 40 years can be called revolutionary having been reduced by factor 3 to 4. The replacement of hot rolled steel by cold rolled steel, about 40 years ago, has been followed by many material improvements leading to the development of low loss silicon steel.
The introduction of laser cutting for laminations has reduced burrs, improving insulation between laminations and reducing no-load losses. Laminations are also thinner down to 0.1 mm (usually between 0.2 and 0.3 mm) reducing no load-losses further.
Superconducting transformers4.2 In a superconducting transformer the windings, made of a high temperature superconducting material (HTS), are cooled with liquid nitrogen at about 77K so that the resistance is almost negligible. Load losses, even after adding losses from nitrogen processing, can be reduced by 50%.
The use of HTS transformers on a larger scale is economically justified and will become more attractive as cooling systems improve and the cost of liquid nitrogen production falls. Another important factor is progress in the processing of long lengths of HTS conductors.
These transformers have smaller weight and volume and are more resistant to overload but cost about 150% to 200% of the price of conventional transformers.
So, in applications where weight is crucial (railway vehicles), transformers are much more “squeezed” (by forced cooling) to cut the weight. So efficiencies are much lower, and saving weight saves energy twice.
In our opinion, HTS transformers are suitable only in applications where the load losses make up a high proportion of the total losses, but are not yet ready for general use.
Amorphous transformers4.3 Amorphous alloys differ from conventional crystalline alloys in their magnetic and mechanical properties (such as hardness and strength).
Allied-Signal (US) spent more than 25 years and considerable R&D effort to achieve the commercial production of METGLAS® amorphous alloys. The Hitachi/Metglas group manufactures amorphous metals and is the biggest promoter of amorphous technology in distribution transformers. The worldwide market share of amorphous core transformers is quite significant with about 3 million single phase units and a few hundred thousand three phase units. It represents about 5% market share worldwide but this is not reflected in the European market. According to the SEEDT findings, the European market for amorphous transformers is just beginning. For example, ENDESA, the Spanish utility, has started to purchase amorphous transformers from outside Europe and is promoting this technology to local manufacturers.
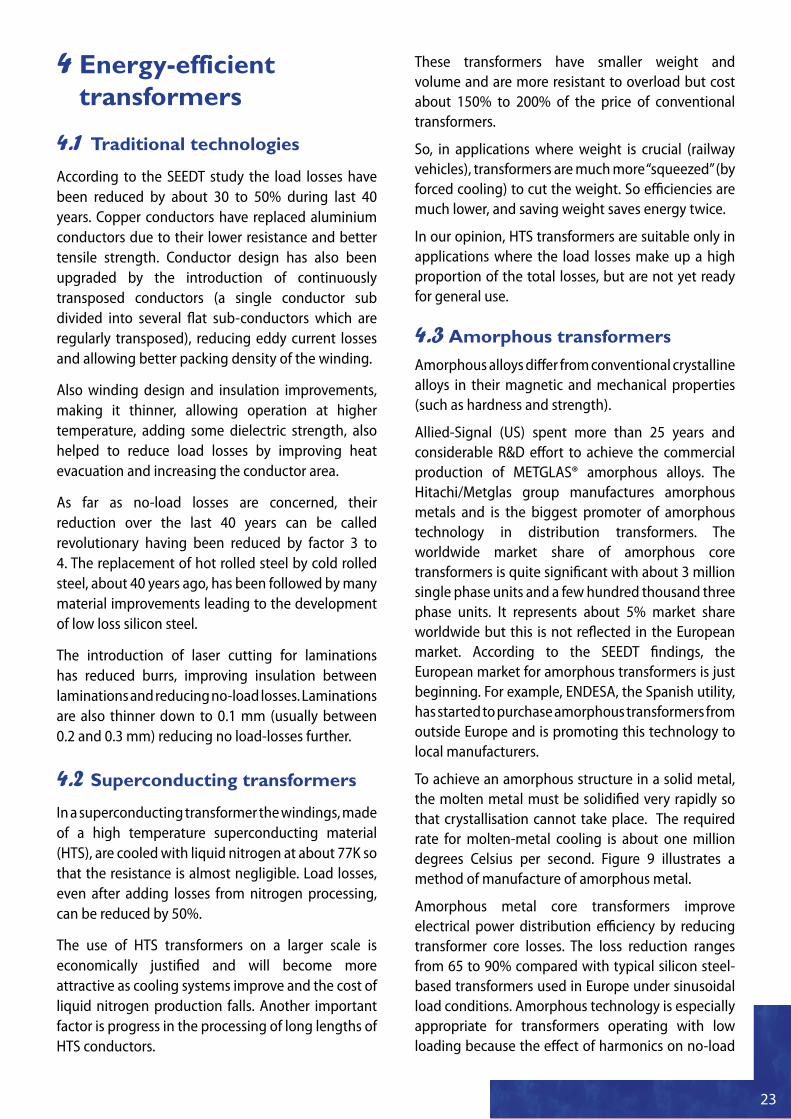
To achieve an amorphous structure in a solid metal, the molten metal must be solidified very rapidly so that crystallisation cannot take place. The required rate for molten-metal cooling is about one million degrees Celsius per second. Figure 9 illustrates a method of manufacture of amorphous metal.
Amorphous metal core transformers improve electrical power distribution efficiency by reducing transformer core losses. The loss reduction ranges from 65 to 90% compared with typical silicon steel-based transformers used in Europe under sinusoidal load conditions. Amorphous technology is especially appropriate for transformers operating with low loading because the effect of harmonics on no-load
24
Lately, Metglas introduced a new amorphous material, HB1, (improved from the earlier SA1 material) which compensates for the deficiency of reduced saturation induction. The new material reaches saturation at induction levels close to those typical of traditional magnetic steel. This allows more compact cores and smaller and lighter transformers than older amorphous designs. It is also characterised by lower noise level, which was a perceived deficiency of the earlier amorphous metal.
The increase in the use of power electronics has resulted in a considerable amount of higher harmonic distortion in electricity systems. High frequency harmonics lead to increased transformer core losses, especially in distribution transformers that use conventional steel core materials. Amorphous metal core distribution transformers are uniquely suited to providing low loss performance under low loading and at higher frequencies. This is due to improved processing techniques that allow thinner and more consistent strip to be manufactured, as well as
to the amorphous nature of the material that gives a higher electrical resistivity and low energy magnetic flux reversal.
From manufacturing cost perspective, amorphous transformers have only slightly higher or almost the same prices as highly efficient traditional
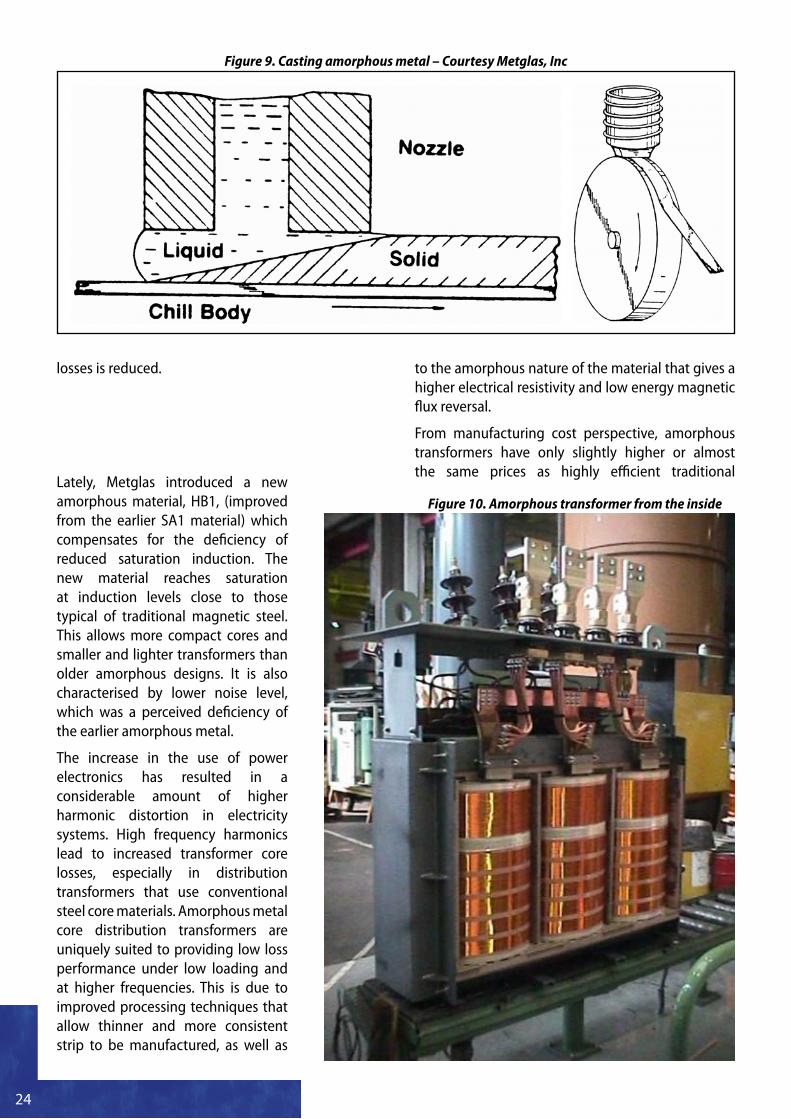
Figure 10. Amorphous transformer from the inside
Figure 9. Casting amorphous metal – Courtesy Metglas, Inc
losses is reduced.
25
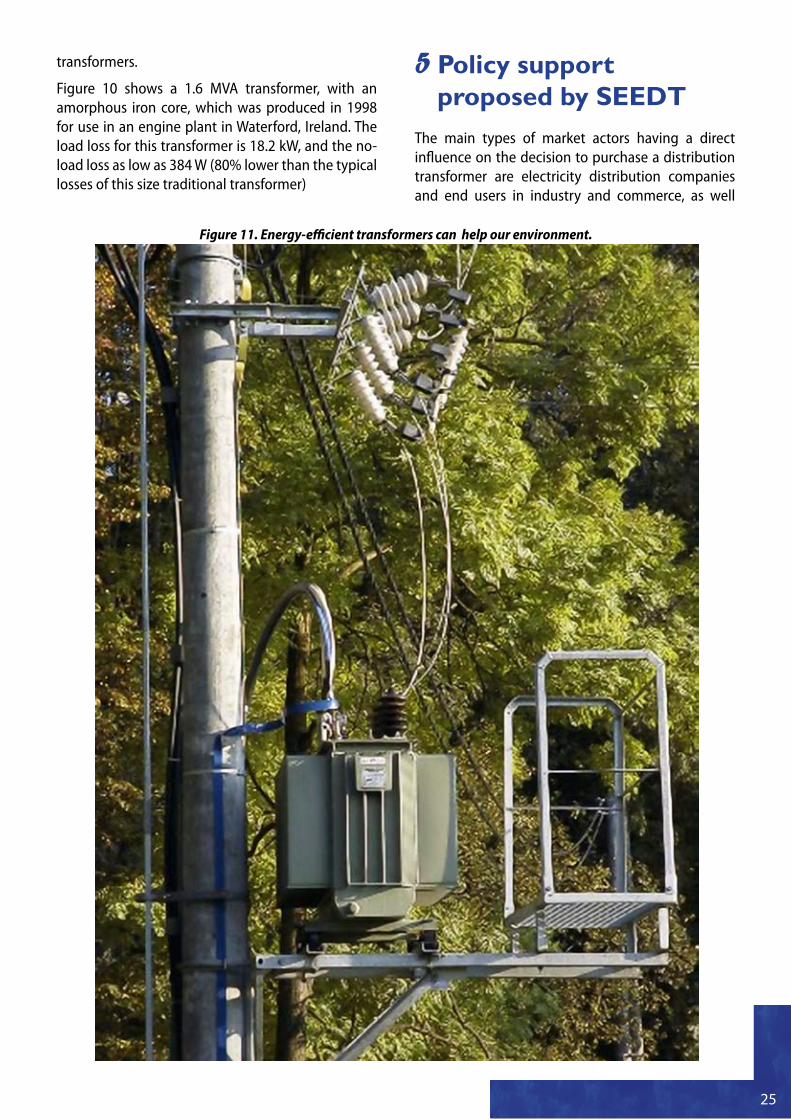
Figure 11. Energy-efficient transformers can help our environment.
transformers.
Figure 10 shows a 1.6 MVA transformer, with an amorphous iron core, which was produced in 1998 for use in an engine plant in Waterford, Ireland. The load loss for this transformer is 18.2 kW, and the no-load loss as low as 384 W (80% lower than the typical losses of this size traditional transformer)
Policy support 5 proposed by SEEDT
The main types of market actors having a direct influence on the decision to purchase a distribution transformer are electricity distribution companies and end users in industry and commerce, as well
26
as the engineering firms, energy service companies and consultants who advise to them in the planning and tendering phases of procurement. These market actors face different barriers and obstacles with regard to the development, planning, sales and purchase of energy-efficient distribution transformers. They currently do not receive any support to realise energy-efficient targets.
Therefore, in order to adequately address and overcome these barriers and obstacles and to realise the existing energy efficiency potentials in this field, different policies and measures are needed. These policies and measures should be bundled in an appropriate policy-mix. The SEEDT project proposes:
Changes in the regulatory schemes are needed �to remove disincentives and provide incentives to increase the use of energy-efficiency of distribution transformers by electricity distribution companies. The income of, and investment by, electricity distribution companies is mainly controlled by regulation due to the fact that distribution grids are in most cases natural monopolies. Therefore, the regulation scheme will have a large impact on the investment decisions of electricity distribution companies, including whether or not to buy energy-efficient distribution transformers. In most European Member States, the regulatory mechanisms currently in place do not give any incentives and may even provide a disincentive to the purchase of energy-efficient distribution transformers by electricity distribution companies. Until changes are made to these regulatory regimes, additional fiscal or financial incentives will be needed to offset the current disincentives.
A bundle of “soft” measures such as: �
the requirement for clearly visible nameplate •information, a labelling scheme, •the inclusion in energy advice and audit •programmes and the provision of a toolkit for buyers. •
Would particularly address those market actors �who lack information and knowledge or who tend to follow traditional purchasing routines that do not lead to least-cost solutions. This particularly affects small and medium industry and commerce, but also some smaller electricity distribution companies, engineering firms, energy service companies, energy consultants and planners.
A European mandatory standard would effectively �contribute to realising the saving potentials by addressing the same market actors as the bundle of “soft” measures. A mandatory standard makes it necessary that the regulation of electricity distribution acknowledges the higher investment costs needed for the more efficient distribution transformers and would help Europe to catch up with the developments in the US and in Asia.
All market actors can implement demonstration �or pilot projects together with manufacturers (and their suppliers), but larger companies, particularly, would benefit from increased availability of R&D support.
In total, very roughly estimated, up to about 10 TWh electricity savings could be realised, per year, by 2025, if the policies and measures proposed by the SEEDT project were broadly implemented, and if general development of the electricity system followed European trend scenarios. These potentials can be realised with technology already available today.
The calculations clearly show that changes in the regulatory schemes are most important to realise the existing saving potentials and to enable investments in transformers with the lowest lifecycle costs. As long as disincentives remain and positive incentives are missing, additional financial or fiscal incentives for electricity distribution companies should be introduced. The largest absolute electricity saving potentials in electricity distribution companies seem to be in France and UK, followed by Spain, Italy and Germany. Therefore, changes in the regulatory schemes are most urgent and should be implemented particularly in these countries.
Compared to saving potentials in other areas, the electricity saving potentials of distribution transformers seem to be small. Nevertheless, every contribution to climate change mitigation and energy security is necessary, particularly if it is economical. Since, in many cases, energy-efficient transformers are economical, it is recommended that the policies and measures proposed by the SEEDT project are implemented. In particular, if avoided external costs were included, or if electricity prices increase compared to the assumptions taken in the SEEDT project, the economic results would be even more favourable for energy-efficient distribution transformers.
27
Conclusions6 Distribution transformers today can be more efficient than ever, and at the same time economical. Market reality shows that amorphous technology can be even more efficient and not excessively costly.
Electricity distribution companies and commercial and industrial users should use the methods discussed in Chapter 4 to make transformer purchasing decisions. Total cost of ownership and life cycle cost are important concepts, embodied in the capitalisation formula, that allow losses over the whole of the expected transformer life cycle to be taken into account.
The main barrier to the reduction of transformer losses in electricity distribution companies is regulation. It changes frequently - compared to the lifetime of infrastructure investments - and the changes do not really address transformer losses. The removal of real disincentives in existing regulation is necessary to make a first critical step in transformer efficiency improvement. Additional incentives to encourage investment in energy-efficient transformers should then follow to accelerate market transformation.
Transformer manufacturers offer many choices. Users can usually find sufficient information about transformer operating conditions and economic parameters to make rational decisions. Adequate policies and measures could support end users in this process.
Making appropriate investment in an energy-efficient transformer means reducing energy losses and reducing the environmental burden, together with reducing life cycle costs and thus increasing profitability.
28
Bibliography7
Energy saving in industrial distribution transformers
W.T.J. Hulshorst, J.F. Groeman
KEMA, 2002
Energy-efficient Transformers
Barry W. Kennedy, Mc Graw
Hill, 1998
The cost of capitalised transformer – compromise between transformer producer and user
MSc. Eng. Jacek DZIURA, E-mail: [email protected], PhD eng. Dariusz Spałek,
Polish “Transformator 2006” Conference Article
Report on analysis of existing situation of energy-efficient transformers, technical and non technical solutions
Roman Targosz
et al 2007 SEEDT D1 Report
Policies and Measures Fostering Energy-Efficient Distribution Transformers
Wolfgang Irrek
et al 2007 SEEDT D6 Report
HD-428 S1, Three phase oil immersed distribution transformers 50 Hz, Part 1 with later changes
Cenelec, 1992
HD 538 – Three phase dry type distribution transformers 50 Hz.
Cenelec, 1992
EN 50464-1, Three phase oil immersed distribution transformers 50 Hz
Cenelec, 2005
http://seedt.ntua.gr/
http://www.leonardo-energy.org/drupal/transformers
29
AnnexEuropean Distribution Transformer Loss standards:
Table A.1 HD428/HD538
RATED POWER
Load Losses for Distribution Transformers No-Load Losses for Distribution Transformers
OIL-FILLED (HD428) UP TO 24kVDRY TYPE (HD538)
OIL-FILLED (HD428) UP TO 24kVDRY TYPE (HD538)
LIST A LIST B LIST C 12kV PRIMARY LIST A’ LIST B’ LIST C’ 12kV PRIMARY
kVA W W W W W W W W
50 1100 1350 875 N/A 190 145 125 N/A
100 1750 2150 1475 2000 320 260 210 440
160 2350 3100 2000 2700 460 375 300 610
250 3250 4200 2750 3500 650 530 425 820
400 4600 6000 3850 4900 930 750 610 1150
630 /4% 6500 8400 5400 7300 1300 1030 860 1500
630 /6% 6750 8700 5600 7600 1200 940 800 1370
1000 10500 13000 9500 10000 1700 1400 1100 2000
1600 17000 20000 14000 14000 2600 2200 1700 2800
2500 26500 32000 22000 21000 3800 3200 2500 4300
Table A.2 EN 50464-1 No load losses P (W) and sound power level (Lw ) for U≤24 kV
Rated power
E0 D0 C0 B0 A0Short circuit impedance
kVAP0 LwA P0 LwA P0 LwA P0 LwA P0 LwA
%W dB(A) W dB(A) W dB(A) W dB(A) W dB(A)
50 190 55 145 50 125 47 110 42 90 39
4
100 320 59 260 54 210 49 180 44 145 41
160 460 62 375 57 300 52 260 47 210 44
250 650 65 530 60 425 55 360 50 300 47
315 770 67 630 61 520 57 440 52 360 49
400 930 68 750 63 610 58 520 53 430 50
500 1 100 69 880 64 720 59 610 54 510 51
630 1 300 70 1 030 65 860 60 730 55 600 52
630 1 200 70 940 65 800 60 680 55 560 52
6
800 1 400 71 1 150 66 930 61 800 56 650 53
1 000 1 700 73 1 400 68 1 100 63 940 58 770 55
1 250 2 100 74 1 750 69 1 350 64 1150 59 950 56
1 600 2 600 76 2 200 71 1 700 66 1450 61 1 200 58
2 000 3 100 78 2 700 73 2 100 68 1800 63 1 450 60
2 500 3 500 81 3 200 76 2 500 71 2150 66 1 750 63
30
Table A.3 EN 50464-1 Load losses Pk (W) at 75 °C for Um ≤ 24 kV
Rated power
Dk Ck Bk AkShort circuit impedance
KVA W W W W %
50 1 350 1 100 875 750
4
100 2 150 1 750 1 475 1250
160 3 100 2 350 2 000 1 700
250 4 200 3 250 2 750 2 350
315 5 000 3 900 3 250 2800
400 6 000 4 600 3 850 3 250
500 7 200 5 500 4 600 3 900
630 8 400 6 500 5400 4600
630 8 700 6 750 5 600 4 800
6
800 10 500 8 400 7 000 6 000
1 000 13 000 10 500 9000 7 600
1 250 16 000 13 500 11 000 9 500
1 600 20 000 17 000 14 000 12 000
2 000 26 000 21 000 18 000 15 000
2 500 32 000 26 500 22 000 18 500
Table A.4 EN 50464-1 Load losses Pk36 (W) at 75 °C for Um = 36 kV
Rated power
Ck36 Bk36 Ak36Short-circuit impedance
KVA W W W %
50 1 450 1 250 1 050
4 or 4,5
100 2 350 1 950 1 650
160 3 350 2 550 2 150
250 4 250 3 500 3 000
400 6 200 4 900 4 150
630 8 800 6 500 5500
800 10 500 8 400 7 000
6
1 000 13 000 10 500 8 900
1 250 16 000 13 500 11500
1 600 19 200 17 000 14 500
2 000 24 000 21000 18 000
2 500 29 400 26 500 22 500
Table A.5 EN 50464-1 No load losses P036 (W) and sound power level (Lw (A) ) for Um = 36 kV
Rated power C036 B036 A036Short-circuit impedance
kVAP0 LwA P0 LwA P0 LwA
%W dB(A) W dB(A) W dB(A)
50 230 52 190 52 160 50
4 or 4,5
100 380 56 320 56 270 54
160 520 59 460 59 390 57
250 780 62 650 62 550 60
400 1 120 65 930 65 790 63
630 1 450 67 1 300 67 1 100 65
800 1 700 68 1 500 68 1 300 66
6
1 000 2000 68 1 700 68 1 450 67
1 250 2 400 70 2 100 70 1 750 68
1 600 2 800 71 2 600 71 2 200 69
2 000 3 400 73 3 150 73 2 700 71
2 500 4 100 76 3 800 76 3 200 73

Strategies for development and diffusion of Energy Efficient Distribution Transformers
Intelligent Energy Europe
Technical guide prepared by:Roman Targosz, PCPC, [email protected] •
Frangiskos Topalis, NTUA, [email protected] •
Wolfgang Irrek, Wuppertal Institute, [email protected] •
with collaboration of SEEDT project Partners:Andrzej Baginski, [email protected] •
Constantinos Bouroussis, [email protected] •
Jacques-Olivier BUDIN, [email protected] •
Juan Frau, [email protected] •
Jordi Gutierrez, [email protected] •
Anne Rialhe, [email protected] •
Arkaduisz Klimowicz, [email protected] •
Sebastien Kraft, [email protected] •
Theni Oikonomou, [email protected] •
Reijalt Marieke, [email protected] •
Janusz Sobota, [email protected] •
Ilias Sofronis, [email protected] •
Gerhard Wohlauf, [email protected] •
and SEEDT supporters:Zbigniew Szymanski, [email protected] •
Souflaris Thanassis, [email protected] •
Authors give thanks to:David Chapman, [email protected] •
Jacek Dziura, [email protected] •
Stefan Fassbinder, [email protected] •
Ivo Pinkiewicz, [email protected] •
for their review and help in preparation of this guide.
Project status: June 2008
Project co-ordinator: Ass. Professor Frangiskos V. Topalis National Technical University of Athens (NTUA) [email protected] +30 210 7723627 Greece
Project website: www.seedt.ntua.gr www.leonardo-energy.org
National Technical University of Athens
Agence de I’Environnement et de la Maitrise de I’Energie
Alternatives pour I’énergie les énergies renouvelables et I’environnement
AREVA T&DSpółka z ograniczonąodpowiedzialnością
ENDESA Distributión Eleectrica
Federazione delle Associazioni Scientifi che e Techniche
Łódzki Zakład Energetyczny S.A.
Polish Copper Promotion Centre
Wuppertal Institut für Umwelt Klima, Energie GmbH im Wissenschaftszentrum Nordrhein-Westfalen
THELCON Constructions Ldt
SEEDT PARTNERS