Embed Size (px)
Citation preview

Intensity, duration, and frequency of precipitation extremesunder 21st‐century warming scenarios
Shih‐Chieh Kao1 and Auroop R. Ganguly1
Received 20 December 2010; revised 22 March 2011; accepted 11 May 2011; published 26 August 2011.
[1] Recent research on the projection of precipitation extremes has either focused onconceptual physical mechanisms that generate heavy precipitation or rigorous statisticalmethods that extrapolate tail behavior. However, informing both climate prediction andimpact assessment requires concurrent physically and statistically oriented analysis. Acombined examination of climate model simulations and observation‐based reanalysisdata sets suggests more intense and frequent precipitation extremes under 21st‐centurywarming scenarios. Utilization of statistical extreme value theory and resampling‐baseduncertainty quantification combined with consideration of the Clausius‐Clapeyronrelationship reveals consistently intensifying trends for precipitation extremes at a global‐average scale. However, regional and decadal analyses reveal specific discrepancies inthe physical mechanisms governing precipitation extremes, as well as their statisticaltrends, especially in the tropics. The intensifying trend of precipitation extremes hasquantifiable impacts on intensity‐duration‐frequency curves, which in turn have directimplications for hydraulic engineering design and water‐resources management. Thelarger uncertainties at regional and decadal scales suggest the need for caution duringregional‐scale adaptation or preparedness decisions. Future research needs to explore thepossibility of uncertainty reduction through higher resolution global climate models,statistical or dynamical downscaling, as well as improved understanding of precipitationextremes processes.
Citation: Kao, S.‐C., and A. R. Ganguly (2011), Intensity, duration, and frequency of precipitation extremes under 21st‐centurywarming scenarios, J. Geophys. Res., 116, D16119, doi:10.1029/2010JD015529.
1. Introduction
[2] Current climate change mitigation policies, includingnational resource allocations and international emissionsnegotiations, are influenced by vulnerabilities to naturalhazards (e.g., precipitation extremes) at relatively aggregatescales. Adaptation strategies ranging from engineering deci-sions such as the design or reinforcement of hydraulic infra-structures to water‐resources management, are constructedpartially based on probabilistic assessments of extreme hydro‐meteorological processes such as severe precipitation events.Thus, there is a need to better understand the potential changeof global and regional frequencies of precipitation extremes.However, the extent to which climate model projected pre-cipitation can be translated to decision‐relevant metrics forhydraulic infrastructures and water resources management[Milly et al., 2008] has not been explored in detail.[3] Recent studies of precipitation extremes [Sugiyama
et al., 2010; Allan and Soden, 2008; Lenderink and vanMeijgaard, 2008; Sillmann and Roeckner, 2008; Kharinet al., 2007; Liu et al., 2009; O’Gorman and Schneider,
2009a, 2009b; Pall et al., 2007; Diffenbaugh et al.,2005; Kunkel et al., 2003] from climate models and observa-tions have either focused on the validity of governing physicalmechanisms (e.g., O’Gorman and Schneider [2009a] andSugiyama et al. [2010]) or sophisticated statistical analysis(e.g., Kharin et al. [2007]). While the Clausius‐Clapeyron(CC) relationship provides a physical basis for quantifyingincreased precipitation extremes in a warming environment,several studies [Liu et al., 2009; O’Gorman and Schneider,2009a, 2009b; Pall et al., 2007; Diffenbaugh et al., 2005]have pointed to more involved mechanisms, especially forshorter duration extremes. The inability of current generationclimate models to adequately resolve cloud microphysics[O’Gorman and Schneider, 2009a, 2009b; Pall et al., 2007;Diffenbaugh et al., 2005], upward velocity in the tropics[O’Gorman and Schneider, 2009a], and oceanic influences[Alexander et al., 2009], are considered among the mainfactors driving uncertainties in model‐simulated regionalprecipitation extremes [Tebaldi et al., 2006; Tomassini andJacob, 2009; Wilcox and Donner, 2007; Boberg et al.,2009]. O’Gorman and Schneider [2009a] and Sugiyamaet al. [2010] suggest a discrepancy between the credibilityof climate model projected precipitation extremes in thetropics versus the extra‐tropics, as well as the influence ofupdraft velocity and the moist‐adiabatic temperature lapse
1Oak Ridge National Laboratory, Oak Ridge, Tennessee, USA.
Copyright 2011 by the American Geophysical Union.0148‐0227/11/2010JD015529
JOURNAL OF GEOPHYSICAL RESEARCH, VOL. 116, D16119, doi:10.1029/2010JD015529, 2011
D16119 1 of 14

rates. A comparison of observed and climate model simulatedprecipitation extremes appears to suggest that models mayunderestimate the expected severity of precipitation extremesunder climate change [Liu et al., 2009], while the intensifi-cation of shorter duration (e.g., hourly) precipitation extremesmay exceed expectations [Lenderink and van Meijgaard,2008]. Pall et al. [2007] suggests that use of the CC rela-tion can aid in predicting changes in extreme precipitation,possibly making them more detectable than mean changes.Thus, understanding of the relationship between extremesand saturation vapor pressure in the atmospheric columnmay make prediction of precipitation extremes more viable,especially at regional scales of interest to water‐resourcesmanagers [e.g., Rosenberg et al., 2010].[4] Studies of mechanisms that generate precipitation
extremes have typically relied on percentile based definitionsand have been somewhat divorced from statistical extremevalue approaches that model low probability events. Extremevalue theory (EVT) [Reiss and Thomas, 2007;Coles, 2001] isanalogous to the central limit theorem but applies to largedeviations or extremes. Corresponding statistical distribu-tions attempt to extrapolate tail behavior from maximumvalues within a temporal window (e.g., annual maxima) orvalues exceeding high thresholds (e.g., high percentiles).EVT has been widely used to study climate and hydrologicextremes [Min et al., 2011; Buishand et al., 2008;Kuhn et al.,2007; Katz et al., 2002; Khan et al., 2007; Katz and Brown,1992]. Kharin et al. [2007] were among the first to developcomprehensive EVT characterizations of temperature andprecipitation extremes based on climate model simulationsand reanalysis data. EVT (and fitting of other probabilitydensity functions) is also an accepted practical approach totranslate the quantity of extremes in terms of recurrenceinterval for water resources management. However, giventhat the conventional EVT framework is only valid given astationary environment, one specific challenge to date is howto quantify the frequency of extremes given an unknownpattern of nonstationarity as modeled by various climatemodels and meteorological reanalyses. For climate impactsand adaption it is also important to understand and translatethe trend of changing frequency in terms that are familiar towater resources managers.[5] In this study, we approach model‐simulated precipi-
tation extremes from a hydrological and water‐resourcesperspective: our goal is to identify future direction for hydro‐climatic adaption and mitigation. We begin by investigatingvariability among extreme rainfall frequency from multipleclimate models and reanalysis data sets. Given that the EVT‐based rainfall frequency is derived from annual maxima, thecontribution of convective versus large scale rainfall amongdifferent models is also examined. Based on a 30 year movingwindow, the gradual change of precipitation extremes isexamined. In addition to historical reconstructions representedby reanalyses data sets and model hindcasts, the analysis isperformed for several climate model simulations forced withseveral IPCC‐SRES greenhouse‐gas emissions scenarios. TheCC ratio, which can be expressed simply as a function ofsurface air temperature, is plotted and compared to the depthchange rate of precipitation extremes (i.e., the rate of changeof extreme rainfall magnitudes that correspond to the samereturn period but estimated at different temporal windows).To gain further insights for hydrologic impacts, the intensity‐
duration‐frequency (IDF) curves, which can extract attri-butes of design storms used for hydraulic design and water‐resources management, are also built for each model. Themethodologies described here are geared toward respondingto the challenge posed by Milly et al. [2008]: how can wequantify the frequencies of hydrologic extremes when theassumption of stationarity is no longer hold? The results inthis paper are expected to demonstrate the potential of theseapproaches to characterize the nonstationary behavior ofprecipitation extremes under projected climate change.
2. Methodology and Data
2.1. Extreme Value Statistics
[6] Following prior literature [Kharin et al., 2007; Minet al., 2011; Kuhn et al., 2007; Reiss and Thomas, 2007;Coles, 2001; Katz et al., 2002; Khan et al., 2007], theGeneralized Extreme Value (GEV) distribution, which isbased on the block maxima theory, is adopted to quantify theintensity of extreme precipitation. Given a duration of interest(e.g., 6 hourly data), the annual maximum precipitation(AMP) series are computed from data; these are then used toestimate parameters of a fitted GEV distribution (seeWehneret al. [2010] and Min et al. [2011] for mathematical details).We employ the AMP approach rather than the peak‐over‐threshold approach [Kuhn et al., 2007; Coles, 2001; Khanet al., 2007], because the i.i.d. assumptions can be bettersatisfied using annual, likely independent, data points. TheAMP approach is also utilized by the U.S. National WeatherService for the development of regional design rainfallthresholds for hydraulic structures [Bonnin et al., 2004], soour approach may be appropriate for such stakeholders. Theparameters are used to derive extreme rainfall thresholdscorresponding to various levels of exceedance probabilities.In many studies, extreme rainfall statistics are expressed interms of T year rainfall depth, which represents that, statis-tically, one annual maximum precipitation event exceedinga given threshold is expected to occur within every non-overlapping T year length window, given that the system isstationary [Chow et al., 1988]. While the AMP approach isdeemed useful and reasonable to estimate the rainfall returnperiod from historic observations, the assumption of statio-narity may not hold if the system is in fact nonstationary, asmay be the case under climate change. Since we are examiningthe extreme rainfall statistics from both model projections andmeteorological reanalyses in this study, such a limitationmust be taken into consideration. To address the potentialnonstationary effect, rather than using all temporal data to fitone GEV distribution, GEV parameters are estimated sep-arately for a succession of 30 year moving windows. Indoing so, we are able to illustrate the continuous change inextreme rainfall thresholds over time. (As an alternative onecould also consider assuming the GEV parameters to befunctions of time [see Kharin and Zwiers, 2005]. However,the types of temporal functions need to be specified a priori,and such information may not be available and consistentgiven the complexity of climate system.) The 30 yearstandard is selected, because (1) it is expected to smooth outthe effects of most multidecadal climate oscillators, and (2) itprovides more confidence for low frequency extremes com-pared to the original 20 year standard of the World ClimateResearch Program’s (WCRP’s) Coupled Model Intercom-
KAO AND GANGULY: PRECIPITATION EXTREMES AND GLOBAL WARMING D16119D16119
2 of 14

parison Project phase 3 (CMIP3) [see Kharin et al., 2007].Current data availability also supports the use of 30 yearmoving windows for most models and reanalysis data sets.[7] Rather than focusing exclusively on subdaily, daily,
or multiday duration precipitation extremes, it is of interestto see variation in extreme rainfall statistics across multipledurations. Thus, the 6, 12, 18, 24, 36, 48, 72, 120, and240 h AMP series are computed and used to derive thresholds(for daily data only 24, 48, 72, 120, and 240 h AMP seriesare computed). These extreme rainfall estimates are thenillustrated in terms of IDF curves [e.g., Langousis andVeneziano, 2007], which are commonly used in practice forthe design of hydraulic structures.[8] Three possible sources of uncertainty that may be rel-
evant for the application of EVT to climate model simulationsare evaluated: (1) applicability of the EVT, in this case thegoodness of fit of the GEV distribution; (2) uncertaintiesinherent in the estimation of GEV parameters from relativelysmall samples, in this case computed by 1000 member boot-strapping [Efron and Tibshirani, 1994]; and (3) uncertaintiescaused by disagreement in extreme trends between modelsand observations.[9] The GEV parameters are estimated using the maximum
likelihood method. We test for the goodness of fit of theextreme value distributions, and if they fail to pass the corre-sponding statistical tests (Kolmogorov‐Smirnov (KS) andCramer‐von Mises (CM)) at a 5% significant level, they arereplaced with the empirically based kernel density function.Less than 1% of the total cases fail to pass both goodness‐of‐fit tests, suggesting the appropriateness of the GEVdistribution.
2.2. Conceptual Physical Relationship
[10] The CC relationship operating at relatively fine scalesis thought to be the predominant relationship governingprecipitation extremes [Liu et al., 2009; O’Gorman andSchneider, 2009a, 2009b; Pall et al., 2007]. While the CCrelationship is typically expressed as a function of saturationvapor pressure of water vapor and atmospheric temperature,the ratio ofwater vapormass (or density, since the volume doesnot change) under different temperatures can be approximatedbased on the ideal gas law.[11] Let rv be the density of water vapor, e the vapor
pressure, Rv the gas constant for water vapor, and T thetemperature (Celsius). From the ideal gas law we have:
�v ¼ e
Rv T þ 273ð Þ : ð1Þ
For fully saturated air, the vapor pressure e equals saturatedvapor pressure es. From the CC relationship, es becomes[Chow et al., 1988]:
es ¼ 611 exp17:27T
237:3þ T
� �: ð2Þ
By incorporating (1) and (2), the density of saturated watervapor rsv can be expressed as:
�sv ¼ esRv T þ 273ð Þ ¼
611
Rv T þ 273ð Þ exp17:27T
237:3þ T
� �: ð3Þ
For a given location, if the temperature changes from T1 toT2, then the ratio rsv2/rsv1 represents the rate change ofsaturated vapor density:
�sv2�sv1
¼ T1 þ 273
T2 þ 273exp
17:27T2237:3þ T2
� 17:27T1237:3þ T1
� �: ð4Þ
[12] If the precipitation extremes are assumed to occurwhen the water vapor is close to fully saturated, and theamount of precipitation extremes is proportional to es, thenthe ratio rsv2/rsv1 represents the change of precipitation mass(amount) from T1 to T2. Since most of the water vapor islocated near the earth’s surface, we utilize the annual averagesurface temperature from each model (climate model orreanalysis) to compute the CC ratio at each grid cell. Therelation between saturated surface water vapor and precipita-tion extremes is also suggested by O’Gorman and Schneider[2009a, 2009b].
2.3. Data Sets
[13] As one major objective of this study is to examinehow precipitation extremes change gradually with time andacross different durations, qualified data sets must be archivedcontinuously for the whole study period and should be avail-able at the finest temporal resolution (6 hourly). Given thisrequirement, the National Center for Atmospheric Research(NCAR) Community Climate System Model version 3(CCSM3, Collins et al. [2006]) is selected, in which thecomplete 6 hourly precipitation data set is available from theEarth System Grid [Bernholdt et al., 2005] from 1900–1999for the twentieth century control runs (20C3M), and from2000–2099 for various projection scenarios. In addition, theAustralian Commonwealth Scientific and Industrial ResearchOrganisation Global ClimateModelMk 3.5 (CSIRO,Gordonet al. [2002]) is selected, in which the daily based continuousdata is available from the WCRP’s CMIP3 archive (1901–2000 for control runs and 2001–2100 for projection runs).Five 21st‐century emission scenario runs are used for com-parison, including Commit (commitment runs with forcingsfixed at year 2000 values), B1 (low CO2 emissions), A1B(moderate CO2 emissions), A2 (high CO2 emissions), andA1FI (fossil fuel intensive emissions, available for CCSM3only). The fossil fuel intensive A1FI scenario was originallyconsidered unrealistically high, but recent observed emis-sions were reported to exceed the A1FI trajectories [Raupachet al., 2007].We note that since it is not required for modelinggroups to submit complete finer temporal‐scale results forboth twentieth and 21st centuries, suitable model outputs atCMIP3 archive are limited to these two models for our statedpurposes. Those interested in the comparison of extremerainfall statistics among a comprehensive set of models forspecific time periods (1981–2000, 2046–2065, and 2081–2000) are referred to Kharin et al. [2007].[14] Several reanalysis data sets are also used in this
study, including the National Center for Environmental Pre-diction (NCEP)‐NCAR reanalysis (NCEP1, data availablefrom 1948–2008 [Kalnay et al., 1996]), NCEP‐Departmentof Energy (DOE) AMIP‐II reanalysis (NCEP2, data avail-able from 1979–2008 [Kanamitsu et al., 2002]), and theEuropean Centre for Medium‐Range Weather Forecasting
KAO AND GANGULY: PRECIPITATION EXTREMES AND GLOBAL WARMING D16119D16119
3 of 14
(ECMWF) Reanalysis (ERA‐40, data available from 1958–2001 [Simmons and Gibson, 2000]). The data length is againan essential criterion for selecting suitable data sets. WhileNCEP1 and ERA‐40 are sufficiently long for the computationof multiple 30 year return periods, NCEP2 is only 40 years inlength. Reanalysis data sets were chosen as surrogates forrainfall observations as per several considerations: (1) A faircomparison between climate projection and observation mustbe performed in a spatially uniform fashion, or results will bebiased toward regions with more gauge stations; (2) Theobservational data sets must have a 6 hourly minimum tem-poral resolution to support the investigation of precipitationextremes under different rainfall durations; and (3) Theobservational data sets should have consistent temporal andspatial data coverage with minimum missing values. Thoughreanalysis data sets seem to be the most appropriate for ourpurpose, it should be noted that reanalysis precipitation is notconstrained by gauge observations. Therefore, considerabledifference may exist between various reanalysis models andgauge observations (e.g., Zolina et al. [2004] performed acomparative assessment of precipitation extremes over Europefrom different reanalyses). For the purpose of climate impactassessment, a greater emphasis should hence be placed on therelative trend from time to time and at a larger spatial scalerather than limiting the attention to the absolute values ateach individual grid cell.[15] The spatial resolution of selected models and
reanalyses vary. The CCSM3 adopts a 256 × 128 T‐85Gaussian grid (∼1.4° in space) and the CSIRO has a 192 × 96T‐63 Gaussian grid (∼1.9°). For reanalysis, both NCEP1 andNCEP2 use 192 × 94 grids (∼1.9°). The ERA‐40 data hasbeen preinterpolated from a finer 320 × 160 grid and areavailable on 144 × 73 grids (∼2.5°). Without introducingextra assumptions of spatial correlation, the extreme precip-itation statistics and CC ratios (equation (4)) are computedon each data set’s original grid and summarized over largeregions for comparison.
3. Results and Discussion
3.1. Difference Between Models and Reanalyses
[16] We start by computing the 3, 5, 10, 30, 50, and100 year return level precipitation extremes for 6, 12,18, 24, 36, 48, 72, 120, and 240 h duration at each gridcell using a 30 year moving window. It should be notedthat since the five 21st‐century simulations are continuedfrom the twentieth century control runs, the 1970–200020C3M annual maxima are adopted as the initial valuesto support the moving window analysis into the 21st century.For clarity, the extreme rainfall estimates are labeled by theending year of the window (e.g., year 2039 estimate wascomputed from 2010–2039 annual precipitation maxima).[17] The year 1999 estimates (1970–1999 window) are
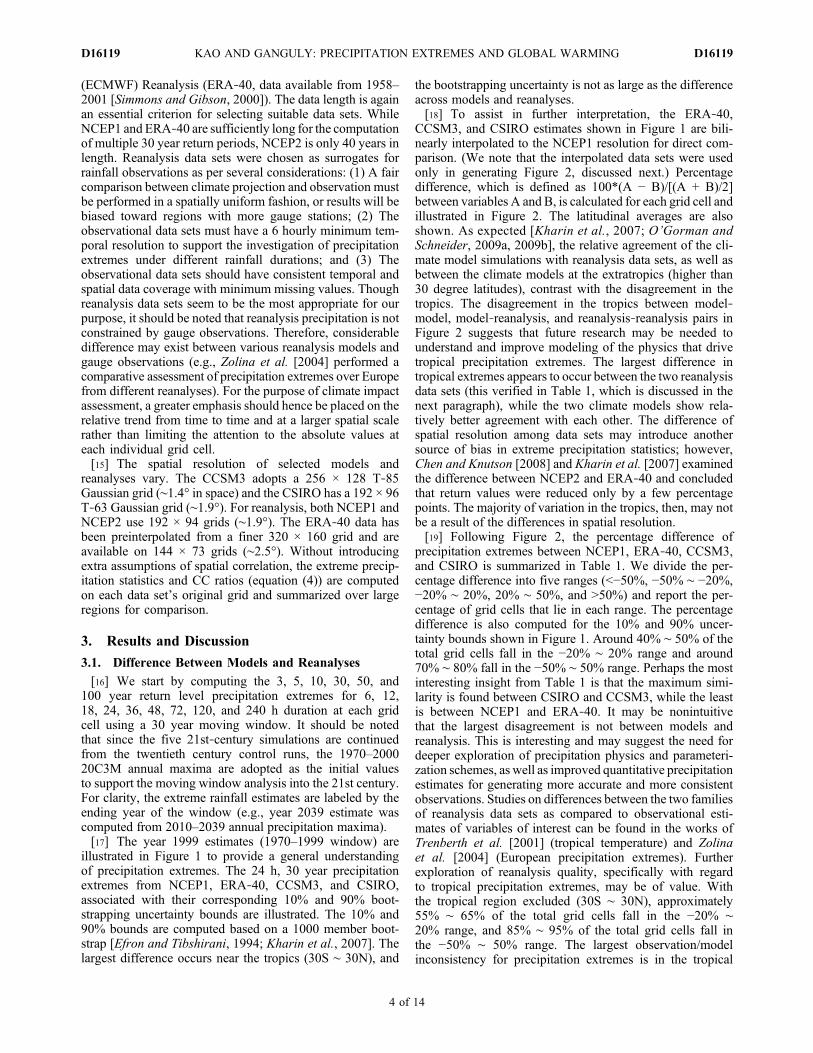
illustrated in Figure 1 to provide a general understandingof precipitation extremes. The 24 h, 30 year precipitationextremes from NCEP1, ERA‐40, CCSM3, and CSIRO,associated with their corresponding 10% and 90% boot-strapping uncertainty bounds are illustrated. The 10% and90% bounds are computed based on a 1000 member boot-strap [Efron and Tibshirani, 1994; Kharin et al., 2007]. Thelargest difference occurs near the tropics (30S ∼ 30N), and
the bootstrapping uncertainty is not as large as the differenceacross models and reanalyses.[18] To assist in further interpretation, the ERA‐40,
CCSM3, and CSIRO estimates shown in Figure 1 are bili-nearly interpolated to the NCEP1 resolution for direct com-parison. (We note that the interpolated data sets were usedonly in generating Figure 2, discussed next.) Percentagedifference, which is defined as 100*(A − B)/[(A + B)/2]between variables A and B, is calculated for each grid cell andillustrated in Figure 2. The latitudinal averages are alsoshown. As expected [Kharin et al., 2007; O’Gorman andSchneider, 2009a, 2009b], the relative agreement of the cli-mate model simulations with reanalysis data sets, as well asbetween the climate models at the extratropics (higher than30 degree latitudes), contrast with the disagreement in thetropics. The disagreement in the tropics between model‐model, model‐reanalysis, and reanalysis‐reanalysis pairs inFigure 2 suggests that future research may be needed tounderstand and improve modeling of the physics that drivetropical precipitation extremes. The largest difference intropical extremes appears to occur between the two reanalysisdata sets (this verified in Table 1, which is discussed in thenext paragraph), while the two climate models show rela-tively better agreement with each other. The difference ofspatial resolution among data sets may introduce anothersource of bias in extreme precipitation statistics; however,Chen and Knutson [2008] and Kharin et al. [2007] examinedthe difference between NCEP2 and ERA‐40 and concludedthat return values were reduced only by a few percentagepoints. The majority of variation in the tropics, then, may notbe a result of the differences in spatial resolution.[19] Following Figure 2, the percentage difference of
precipitation extremes between NCEP1, ERA‐40, CCSM3,and CSIRO is summarized in Table 1. We divide the per-centage difference into five ranges (<−50%, −50% ∼ −20%,−20% ∼ 20%, 20% ∼ 50%, and >50%) and report the per-centage of grid cells that lie in each range. The percentagedifference is also computed for the 10% and 90% uncer-tainty bounds shown in Figure 1. Around 40% ∼ 50% of thetotal grid cells fall in the −20% ∼ 20% range and around70% ∼ 80% fall in the −50% ∼ 50% range. Perhaps the mostinteresting insight from Table 1 is that the maximum simi-larity is found between CSIRO and CCSM3, while the leastis between NCEP1 and ERA‐40. It may be nonintuitivethat the largest disagreement is not between models andreanalysis. This is interesting and may suggest the need fordeeper exploration of precipitation physics and parameteri-zation schemes, as well as improved quantitative precipitationestimates for generating more accurate and more consistentobservations. Studies on differences between the two familiesof reanalysis data sets as compared to observational esti-mates of variables of interest can be found in the works ofTrenberth et al. [2001] (tropical temperature) and Zolinaet al. [2004] (European precipitation extremes). Furtherexploration of reanalysis quality, specifically with regardto tropical precipitation extremes, may be of value. Withthe tropical region excluded (30S ∼ 30N), approximately55% ∼ 65% of the total grid cells fall in the −20% ∼20% range, and 85% ∼ 95% of the total grid cells fall inthe −50% ∼ 50% range. The largest observation/modelinconsistency for precipitation extremes is in the tropical
KAO AND GANGULY: PRECIPITATION EXTREMES AND GLOBAL WARMING D16119D16119
4 of 14

regions. Though the above illustrations are only based on the24 h, 30 year precipitation extremes, we note that similarpatterns are observed for other durations, recurrence intervals,and temporal windows as well. The annual maxima and thecorresponding derived rainfall estimates are used in the fol-lowing analysis.
3.2. Contribution of Convective Precipitationin Annual Maximum Rainfall
[20] The reanalysis data sets and climate model outputsprovide a unique opportunity to examine the influence ofmodeled convective precipitation on rainfall extremes, eventhough they are not direct observations. The percentagecontribution of convective rainfall in the AMP series isexamined next. These percentage contributions are illus-trated in Figure 3, in which the average contribution of
convective precipitation in each of 1979–1999 NCEP1,NCEP2, ERA‐40, and CCSM3 annual maximum is com-puted at all latitudinal bands. We note that the CSIRO con-vective rainfall outputs are not achieved continuously at adaily scale within WCRP’s CMIP3 and hence are excludedfrom this part of analysis.[21] In Figure 3a, the average percentage contribution of
convective rainfall within 6 h annual maxima along latitudinalbands is shown to vary substantially. Convection is generallyconsidered to be the predominant generative mechanism ofprecipitation extremes, especially for shorter subdaily duration(with exceptions; see Scinocca and McFarlane [2004]).While convective contributions appear to be more dominantin the tropics, the significant differences between reanalysisand models may diminish the value of any generic insights.CCSM3‐simulated convective contributions to 6 h extremes
Figure 1. The 24 h duration, 30 year return period precipitation extremes estimated from the 1970–1999annual maxima. The 10% and 90% uncertainty bounds are computed based on a 1000 member bootstrap.
KAO AND GANGULY: PRECIPITATION EXTREMES AND GLOBAL WARMING D16119D16119
5 of 14

are in between NCEP1, NCEP2 (nearly 90%), and ERA‐40(barely 50%). When combined with the uncertainty in thetropics, these results suggest that significant improvementsare needed in our understanding of precipitation processesbeyond what is suggested in the literature [Allan and Soden,2008; Lenderink and van Meijgaard, 2008; O’Gorman andSchneider, 2009a, 2009b; Pall et al., 2007; Diffenbaughet al., 2005; Alexander et al., 2009].[22] In Figure 3b, the global area‐weighted average of
convective rainfall contribution is computed for variousdurations (note that duration is plotted in log‐scale). The factthat NCEP1, ERA‐40, and CCSM3 are nearly parallel toeach other may suggest different parameterizations withconstant bias, while the different behavior (nearly constantversus almost linear growth) of the subdaily versus daily orgreater than daily extremes may point to differences in theunderlying mechanisms generating shorter and longer dura-tion extremes. The contribution of convection to subdaily
duration precipitation extremes appear relatively constantwith changing durations (even though the two reanalysesand –CCSM3 suggest different levels), but for longer (thanone day) duration extremes, the contributions from convec-tion appear to increase linearly (in log‐scale) with duration.This suggests that the underlying mechanisms for shorter andlonger duration extremes may be fundamentally different.While convective rainfall contributes the most in NCEP1, itscontribution is least in ERA‐40. Once again, the maximumdifference occurs between two reanalysis data sets ratherthan between a reanalysis data set and CCSM3; the exactcause for this discrepancy may need to be investigated.Possible causes appear to be differences either in the pre-cipitation parameterization schemes or the actual observa-tions used to drive the forecasting models, which generate thetwo reanalysis data sets.[23] The geographical pattern of convective contribution
in 6 h annual maxima is plotted in Figure 4 for four models.
Figure 2. Percentage difference of 24 h duration, 30 year return period precipitation estimated from1970 to 1999 extremes from model and reanalysis data sets.
Table 1. Summary of Precipitation Extremes and Their Uncertainty Bounds Compared Across Pairs of Climate Models and Reanalysisa
Models
Range of Percentage Difference
<−50% −50% ∼ −20% −20% ∼ 20% 20% ∼ 50% >50%
ERA‐40∼NCEP1 5.85.17.8 16.415.3
17.4 41.544.335.6 10.610.8
12.0 25.724.527.2
Extratropics 7.86.810.7 24.022.0
25.1 57.661.449.3 8.06.8
11.7 2.63.03.2
CCSM3∼NCEP1 5.94.98.6 17.216.2
17.6 48.251.441.4 15.914.6
17.8 12.812.914.6
Extratropics 5.24.58.2 20.919.5
21.6 58.061.849.7 12.09.7
15.9 3.84.54.6
CSIRO∼NCEP1 7.06.39.7 17.516.2
18.4 42.544.936.7 14.613.8
15.8 18.418.819.4
Extratropics 8.16.911.8 23.922.2
24.6 55.058.946.1 9.78.0
13.1 3.44.04.4
CCSM3∼ERA‐40 23.121.025.2 11.410.8
12.7 45.949.138.8 15.614.8
17.6 4.04.35.7
Extratropics 1.20.73.2 10.48.0
13.7 62.767.352.5 21.820.5
24.4 3.83.56.3
CSIRO∼ERA‐40 18.115.322.5 16.915.0
18.2 51.056.941.8 11.710.3
13.5 2.22.44.0
Extratropics 1.30.83.6 14.611.2
18.4 56.673.255.2 15.412.9
18.4 2.11.84.3
CSIRO∼CCSM3 4.74.47.2 17.415.1
19.5 53.156.945.6 16.616.1
17.6 8.27.510.1
Extratropics 2.92.45.8 21.018.0
23.6 65.171.254.5 10.08.1
13.6 0.90.32.6
aThe comparison between 10% lower bounds is reported in subscripts, while the comparison between 90% upper bounds is in superscripts.
KAO AND GANGULY: PRECIPITATION EXTREMES AND GLOBAL WARMING D16119D16119
6 of 14

The spatial variation is significant, with NCEP2 suggestingpredominance of convection in most land areas but ERA‐40and NCEP1 showing convective precipitation mainly overtropical oceans. For NCEP1 (Figure 4a), convective pre-cipitation has the largest contribution in the entire tropicalband (30S∼30N, including both land and ocean), while forNCEP2 (Figure 4b), convective precipitation has a largercontribution on the land than on the ocean surface. Comparedto NCEP1, the NCEP2 shows more convective activity overland, especially in the extratropics and in the northernhemisphere. The CCSM3 simulations (Figure 4c) appear toexhibit a noticeable discontinuity between land and oceanaround continental Africa, south Asia, and northern Australia.The likely causes of this discontinuity could be due to thedifference between land and ocean models in the CCSM3.The difference in surface heat capacity between ocean and
land may trigger convection in different ways in the CCSM3cumulus parameterization. Also, there may be a diurnal effectover land that is absent over ocean. ERA‐40 (Figure 4d)exhibits the largest precipitation extreme depths, but thesmallest contribution from convection. The precipitationextremes in ERA‐40 are primarily controlled by a large‐scaleprecipitation mechanism. We note that while Figure 4 showsthe 6 h annual maxima results, these patterns are similar forother durations.
3.3. Trend of Rainfall Extremes Under WarmingScenarios
[24] In order to understand variation of precipitationextremes over time, the previous analysis is performedrepeatedly with a 30 year moving window. For each 30 yearperiod, the average temperature (required in equation (4) for
Figure 3. Contribution of convective precipitation to the annual maxima according to climate modelsimulations and reanalysis data sets.
Figure 4. Regional variability in the average contribution of convective precipitation to the 6 h annualmaxima precipitation extremes.
KAO AND GANGULY: PRECIPITATION EXTREMES AND GLOBAL WARMING D16119D16119
7 of 14

computing the CC ratio), GEV parameters, and 30 year rainfalldepth are estimated. The year 1999 values (corresponding tothe 1970–1999 window) are selected as a baseline for com-parison. By setting T1 as the average surface temperature from1970–1999, the CC ratio is computed for every grid and forall windows. Since the CC ratio represents the theoreticalincrease/decrease of saturated vapor density due to tem-perature change, it can be regarded as a theoretical referenceof extreme rainfall variation to year 1999. Similarly, thedepth ratios, which are defined as extreme rainfall estimatesnormalized by the corresponding year 1999 baseline values,are computed for comparison. The depth ratios represent therate of change of extreme rainfall magnitudes that corre-spond to the same return period but estimated at differenttemporal windows. In addition, by referring to the year 1999baseline values, we further compute the corresponding returnperiods (frequency) for different time periods.[25] The analysis is performed for the two reanalyses
(NCEP1, ERA‐40) and two climate models (CCSM3,CSIRO). NCEP2 is not included here since its data coverageis insufficient for continuous analysis. Taking 24 h durationas an example, the global area‐weighted medians of CCratio, depth ratio, and return period are shown in Figure 5,with insets emphasizing the overlapping period from 1987–2008. While the median is suggested as a proper measure byKharin et al. [2007], the difference in grid sizes along variouslatitudes must be adjusted; otherwise the median will bebiased toward the extratropics. To make a proper correction,the area‐weighted median is computed instead. The area‐weighted median [see Yin et al., 1996] is a general form ofmedian in which each grid value is assigned a corresponding
areal weight. By sorting the values and using the weights aswidths, the 50% percentile is identified to be the area‐weighted median. If all grids are equal sizes, the weightedmedian will be equivalent to the common median.[26] As shown in Figures 5a and 5b, the Clausius‐
Clapeyron ratio almost exactly mirrors the depth ratio andit provides a theoretical reference of global precipitationextremes intensification owing to atmospheric warming.However, the trends from NCEP1 in the prior decade do notagree with the trends in climate model hindcasts and must befurther investigated. The climate model hindcasts suggest thatearly twentieth century extreme intensities were less intense(about 96% of current) and less frequent (current 30 yearintensities, or occurring with a probability of 1/30, were about40 year then). Climate models project precipitation extremesto be more intense and frequent in the future. The worst caseA1FI scenario projects an intensification of 30% with the30 year rainfall event becoming as frequent as the current7 year event. We note that the scenarios show considerabledifference, suggesting that emissions may heavily influencethe intensification and larger frequencies of precipitationextremes in the future. The Commit scenario, which sustainsatmospheric concentration at year 1999 levels, shows theintensification in the future owing to both system delay ofstabilization and temporal memory in the moving averagecalculation; the rainfall extreme stabilizes after approxi-mately three decades. The intensity and frequency projectionsdisplay similar trends but have considerablymore uncertaintiesand variability at regional scales. The intensification andincreasing frequencies of precipitation extremes in a warmingenvironment, as well as the correspondence with the CC
Figure 5. Intensification of precipitation extremes at global scales based on climate models and reanalysisdata sets and the significance of Clausius‐Clapeyron relationship.
KAO AND GANGULY: PRECIPITATION EXTREMES AND GLOBAL WARMING D16119D16119
8 of 14

relation, are clearly illustrated in this approach, which alsorelies on extreme value statistics.[27] Given the potential limitation of inferences regarding
precipitation extremes at tropical regions (as discussed insection 3.1), Figure 6 illustrates the area weighted median ofextratropical regions (90S ∼ 30S and 30N ∼ 90N). The gen-eral trends are similar to Figure 5, but the Clausius‐Clapeyronprovides a higher ratio in the extratropics. This may appearnonintuitive since the reanalysis and model pairs appear tomatch better in the extratropics (see Figures 1 and 2, as wellas O’Gorman and Schneider [2009a, 2009b]). It suggeststhat equation (4) and the use of surface temperature may beoverly simple. Because this may be the case, regional andlocal scale trends may not be captured, even though therelationship appears reasonable at a global‐average scale.Figure 7 shows the results for Europe. We selected Europeas a case study because, visually, there is a good matchbetween the various reanalysis and climate model pairs. Weobserve that the intensification of precipitation extremetrends does not appear obvious from NCEP1 but is rela-tively clear from ERA‐40. The general trends agree withFigures 5 and 6, while the variability is larger compared tothe others, probably because there are considerably fewergrid cells.[28] The general temporal trends are observed in
Figures 5–7, and spatial variability is shown to be large. Anexample is shown in Figure 8, in which the 6 h durationprecipitation extremes from NCEP1 and CCSM3 are illus-trated in a more detailed fashion for the extratropical land(90S ∼ 30S, 30N ∼ 90N, land). By referring to the year 199930 year return level estimates at each grid cell, Figure 8a
displays histograms (spanning all grid cells) of the corre-sponding return levels of the year 1977 (1948–1977 window)and year 2008 (1979–2008 window) NCEP1 precipitationextremes. Less than half (48%) of the grid cells exhibit pre-cipitation extremes that are less than the 30 year level at year1977, implying that these extremes were less frequent his-torically. Conversely, more than half (59%) of the grid cellsshow precipitation extremes less than 30 year levels duringyear 2008, implying more frequent extremes. However, itshould be noticed that spatial variability is large, and the trendmay be flat or opposite within some individual grid cells.Similarly, Figure 8b compares the year 2099 CCSM3 pre-cipitation extremes of five scenarios. Spatially empiricalprobability density functions are estimated. The degree ofintensification follows the order of projected CO2 emissions.[29] To understand the spatial variability, the 30 year return
period, 24 h duration CCSM3 and CSIRO depth ratios at year2099 (2070–2099 window) are illustrated for four emissionscenarios (Commit, B1, A1B, and A2) in Figures 9 and 10,respectively. A nine‐neighbor grid smoothing is performedfor easier visualization and identification of regional patterns.The model‐projected intensification trends grow strongerwith increases in projected CO2 emissions (as defined in theIPCC‐SRES scenarios). Increased intensities of design storms,their large variability across geographical regions, and thespotty nature of the visuals (reflecting the large spatial vari-ability of precipitation and their extremes, as well as theestimation sensitivities) are clear from the maps. While theintensification trends projected by CCSM3 and CSIRO agreerelatively well at global and continental scales, the projections
Figure 6. Intensification of precipitation extremes at the extratropical regions based on climate modelsand reanalysis data sets as well as the significance of Clausius‐Clapeyron relationship.
KAO AND GANGULY: PRECIPITATION EXTREMES AND GLOBAL WARMING D16119D16119
9 of 14

are inconsistent for relatively finer resolution regional scales,even after smoothing.
3.4. Intensity‐Duration‐Frequency Relationshipsof Rainfall Extremes
[30] Precipitation intensity‐duration‐frequency (IDF)curves are frequently used in hydraulic design and water‐resources management [Houghtalen et al., 2009; Dunne andBergere, 1978; Koutsoyiannis et al., 1998]. By plotting theaverage rainfall intensity (total depth divided by duration)versus duration, it is empirically observed that rainfallintensities with the same frequency are negatively correlatedto duration on the log‐log scale. We note that the durationhere refers to the temporal window used to compute annualmaxima instead of the actual storm durations. In otherwords, IDF curves are the empirical relationship of rainfall
extremes across different durations from actual observation.Whether this relationship holds for reanalyses and climateprojections is seldom discussed, partially due to the challengeof analyzing rainfall extremes across a wide range of rainfalldurations. In order to support the construction of IDF curves,temporally higher resolution data sets must be available.[31] Building on the 6, 12, 18, 24, 36, 48, 72, 120, and
240 h extratropical area‐weighted median of year 1999(1970–1999 window) rainfall average intensities, Figure 11shows the NCEP1, ERA‐40, CCSM3, and CSIRO IDFcurves for 3, 5, 10, 30, 50, and 100 year return periods (notethat the CSIRO data can only support the computation ofextremes at durations of a day or more). The linear patternsare preserved in all cases and the curves are more or lessparallel to each other, suggesting that the scales of rainfallextremes across different durations seem reasonable. IDF
Figure 8. Increasing frequency of 6 h duration 30 year return periods of precipitation extremes over thelast several decades as well as for the rest of the 21st century in the extratropical land.
Figure 7. Intensification of precipitation extremes in the continental Europe.
KAO AND GANGULY: PRECIPITATION EXTREMES AND GLOBAL WARMING D16119D16119
10 of 14

curves can be utilized when investigating precipitationextremes with an arbitrary duration, which has not beenencountered before or computed previously. These curvesare potentially helpful to understand the behavior of rain-fall extremes from subdaily, daily, to multiday scales.[32] Another comparison is shown in Figure 12. Figure 12a
compares the year 1999 30 year IDF curves of NCEP1,ERA‐40, CCSM3, and CSIRO. The curves appear fairlylinear on the log‐log scale. The differences between thetwo climate models are relatively small compared to thedifferences between the two reanalysis data sets. NCEP1rainfall intensity is less than CCSM3 in shorter durations,while it becomes larger than CCSM3 for longer durations.Focusing on CCSM3, Figure 12b compares various IDF
curves at year 2099 under all emission scenarios. The 30 yearIDF curves from the various emission scenarios in the end ofthe century are parallel to the twentieth century control runs inthe log‐log graph. Parallel IDF curves in the log‐log plotsimply a constant ratio, which in turn may translate to a safetyfactor for engineering design and water‐resources manage-ment in the context of climate change adaptation. However,the larger differences among climate models and reanalysis(Figure 12a) point to uncertainty which must be character-ized and/or ideally reduced prior to making risk informeddecisions. The climate change‐influenced evolution of IDFcurves directly illustrate that water management can nolonger assume stationarity [Milly et al., 2008]. Figures 12cand 12d show two examples of IDF curves generated at
Figure 9. Intensification of precipitation extremes at the end of the century according to CCSM3.
Figure 10. Intensification of precipitation extremes at the end of the century according to CSIRO.
KAO AND GANGULY: PRECIPITATION EXTREMES AND GLOBAL WARMING D16119D16119
11 of 14

regional scales, specifically, North America and Europe.While IDF curves could be developed for any region orlocale of interest, the relatively low resolutions of extremeprecipitation processes within global climate models and thecorresponding increase in uncertainty of model‐based pre-cipitation extremes projections at higher resolutions limit the
credibility of local or even regional IDF curves. Improvingthe credibility of higher resolution IDF curves may be pos-sible through higher resolution global climate models, and/orthrough dynamical or statistical downscaling of the globalmodel outputs and/or through improved understanding ofextreme precipitation processes. However, the ability of
Figure 11. Intensity‐Duration‐Frequency (IDF) curves of precipitation extremes for various frequenciesand durations.
Figure 12. (a and b) Intensity‐Duration‐Frequency (IDF) curves for precipitation extremes from climatemodels and reanalysis data sets. (c and d) IDF curves of precipitation extremes for North America andEurope.
KAO AND GANGULY: PRECIPITATION EXTREMES AND GLOBAL WARMING D16119D16119
12 of 14

higher resolution global climate models to reduce uncertaintyin precipitation extremes remains a hypothesis to be tested(despite reports of initial success [Wehner et al., 2010]) whiledownscaling may cause additional cascading uncertainties[Schiermeier, 2010].
4. Conclusion
[33] By examining the EVT based precipitation estimatesand the physical based CC ratios concurrently, it is shownthat while precipitation extremes are projected to continuallyintensify in the 21st century, according to known physicalmechanisms in a spatially aggregate (e.g., global average)sense, significant uncertainties exist in both models andobservations, as well as how the models and reanalysishandle precipitation processes, especially at regional scales.The reanalysis and climate models studied here show largediscrepancies over the tropics, not just in terms of theintensities of short duration precipitation extremes, but alsoin terms of the contribution of convective versus large scaleprecipitation to extremes. The categorization of precipitationinto large‐scale versus convective suffers from differencesin semantics and tends to have a degree of arbitrariness. Inaddition, the resolution of processes within climate andreanalysis models would impact the categorization. Con-vection schemes simulated by climate models typically donot attempt to simulate the growth and decay of convectionbut provide an equilibrium response. An interpretation ofthe results presented here needs to be informed by and awareof these issues. The central tendencies of the reanalysis andmodeled precipitation extreme trends at aggregate scalestend to agree with each other over the last two decades andfollow the CC relation quite well. Uncertainties remainsignificant at regional and decadal scales, but may bequantifiable through statistical approaches such as resam-pling techniques or Bayesian methods. Changes in the IDFcurves, which are typically used for the design of hydraulicinfrastructures and for water resources management, mayoffer guidance for adaptation in a nonstationary environ-ment. Additionally, while the current (IPCC AR4) genera-tion of climate models may not be able to adequately resolvefine‐scale processes and hence may not reliably simulateprecipitation extremes or generate credible IDF curves atregional scales, higher‐resolution CMIP5 simulations mayoffer new opportunities. In addition, higher‐resolution cli-mate models geared for decadal or regional analysis [e.g.,see Shukla et al., 2009] may be able to resolve processesrelevant for location‐specific IDF curves. However, thepossible improvement in credibility of precipitation extremesat higher resolution as a function of climate model resolu-tions and corresponding improvements in physics or para-meterizations remains a hypothesis to be tested. Our methodsand results with IPCC AR4/CMIP3 data sets presented heremay offer a benchmark for comparisons and hypothesistesting. Future researchers may wish to assess the improve-ment in regional estimates of precipitation extremes fromthese higher resolution models toward potentially developingregional‐ and local‐scale IDF curves, which in turn may bevaluable for regional and local water‐resources managementapplications. While the current study has examined annualmaxima, it may also be of interest for future researchers toattempt to delineate other aspects of precipitation extremes.
For example, in many regions outside of the tropics, sea-sonal maxima may be of interest, as winter extremes mayexhibit interesting and different features.
[34] Acknowledgments. This research was funded by the LaboratoryDirected Research and Development (LDRD) Program of the Oak RidgeNational Laboratory (ORNL), which in turn is managed by UT‐Battelle,LLC, for the U.S. Department of Energy under contract DE‐AC05‐00OR22725. The United States Government retains a nonexclusive,paid‐up, irrevocable, worldwide license to publish or reproduce the pub-lished form of this manuscript, or allow others to do so, for United StatesGovernment purposes. The authors thank Dave Bader, Evan Kodra, ChengLiu, Richard Medina, and Karsten Steinhaeuser for helpful comments andsuggestions.
ReferencesAlexander, L. V., P. Uotila, and N. Nicholls (2009), Influence of seasurface temperature variability on global temperature and precipitationextremes, J. Geophys. Res., 114, D18116, doi:10.1029/2009JD012301.
Allan, R. P., and B. J. Soden (2008), Atmospheric warming and the ampli-fication of precipitation extremes, Science, 321(5895), 1481–1484,doi:10.1126/science.1160787.
Bernholdt, D., et al. (2005), The Earth System Grid: Supporting the nextgeneration of climate modeling research, Proc. IEEE, 93(3), 485–495,doi:10.1109/JPROC.2004.842745.
Boberg, F., P. Berg, P. Thejll, W. J. Gutowski, and J. H. Christensen(2009), Improved confidence in climate change projections of precipita-tion evaluated using daily statistics from the PRUDENCE ensemble,Clim.Dynam., 32(7–8), 1097–1106, doi:10.1007/s00382–008–0446-y.
Bonnin, G. M., D. Martin, B. Lin, T. Parzybok, M. Yekta, and D. Riley(2004), Precipitation‐frequency atlas of the United States, NOAA Atlas 14,vol. 2, Natl. Weather Serv., Natl. Oceanic and Atmos. Admin., U.S. Dep.of Commer., Silver Spring, Md.
Buishand, T. A., L. de Haan, and C. Zhou (2008), On spatial extremes:With application to rainfall problem, Ann. Appl. Stat., 2(2), 624–642,doi:10.1214/08-AOAS159.
Chen, C.‐T., and T. Knutson (2008), On the verification and comparison ofextreme rainfall indices from climate models, J. Clim., 21(7), 1605–1621,doi:10.1175/2007JCLI1494.1.
Chow, V. T., D. R. Mainment, and L. W. Mays (1988), Applied Hydrology,McGraw‐Hill, New York.
Coles, S. (2001), An Introduction to Statistical Modeling of ExtremeValues, Springer, London.
Collins, W. D., et al. (2006), The Community Climate System ModelVersion 3(CCSM3), J. Clim., 19(11), 2122–2143, doi:10.1175/JCLI3761.1.
Diffenbaugh, N. S., J. S. Pal, R. J. Trapp, and F. Giorgi (2005), Fine‐scaleprocesses regulate the response of extreme events to global climate change,Proc. Natl. Acad. Sci. U. S. A., 102(44), 15,774–15,778, doi:10.1073/pnas.0506042102.
Dunne, T., and L. Bergere (1978), Water in Environmental Planning,W. H. Freeman, New York.
Efron, B., and R. J. Tibshirani (1994), An Introduction to the Bootstrap,CRC Press, Boca Raton, Fla.
Gordon, H. B., et al. (2002), The CSIRO Mk3 Climate System Model,Tech. Rep. 60, CSIRO Atmos. Res., Aspendale, Vic., Australia.
Houghtalen, R. J., A. O. Akan, and N. H. C. Hwang (2009), Fundamentalsof Hydraulic Engineering Systems, 4th ed., Prentice Hall, Upper SaddleRiver, N. J.
Kalnay, E., et al. (1996), The NCEP/NCAR 40‐year reanalysis project,Bull. Am. Meteorol. Soc., 77, 437–471, doi:10.1175/1520-0477(1996)077<0437:TNYRP>2.0.CO;2.
Kanamitsu, M., W. Ebisuzaki, J. Woollen, S.‐K. Yang, J. J. Hnilo, M. Fiorino,and G. L. Potter (2002), NCEP‐DOEAMIP‐II Reanalysis (R‐2), Bull. Am.Meteorol. Soc., 83(11), 1631–1643, doi:10.1175/BAMS-83-11-1631.
Katz, R. W., and B. G. Brown (1992), Extreme events in a changingclimate: Variability is more important than averages, Clim. Change,21(3), 289–302, doi:10.1007/BF00139728.
Katz, R. W., M. B. Parlange, and P. Naveau (2002), Statistics of extremesin hydrology, Adv. Water Resour., 25, 1287–1304, doi:10.1016/S0309-1708(02)00056-8.
Khan, S., S. Bandyopadhyay, A. R. Ganguly, S. Saigal, D. J. Erickson III,V. Protopopescu, and G. Ostrouchov (2007), Relative performance ofmutual information estimation methods for quantifying the dependenceamong short and noisy data, Phys. Rev. E 76(2), 026209, doi:10.1103/PhysRevE.76.026209.
KAO AND GANGULY: PRECIPITATION EXTREMES AND GLOBAL WARMING D16119D16119
13 of 14

Kharin, V. V., and F. W. Zwiers (2005), Estimating extremes in transientclimate change simulations, J. Clim., 18, 1156–1173, doi:10.1175/JCLI3320.1.
Kharin, V. V., F. W. Zwiers, X. Zhang, and G. C. Hegerl (2007), Changesin precipitation and temperature extremes in the IPCC ensemble of globalcoupled model simulations, J. Clim., 20(8), 1419–1444, doi:10.1175/JCLI4066.1.
Koutsoyiannis, D., D. Kozonis, and A. Manetas (1998), A mathematicalframework for studying rainfall intensity‐duration‐frequency relation-ships, J. Hydrol., 206(1–2), 118–135, doi:10.1016/S0022-1694(98)00097-3.
Kuhn, G., S. Khan, A. R. Ganguly, andM. L. Branstetter (2007), Geospatial–temporal dependence among weekly precipitation extremes with applica-tions to observations and climate model simulations in South America,Adv. Water Resour., 30(12), 2401–2423, doi:10.1016/j.advwatres.2007.05.006.
Kunkel, K. E., D. R. Easterling, K. Redmond, and K. Hubbard (2003),Temporal variations of extreme precipitation events in the United States:1895–2000, Geophys. Res. Lett. , 30(17), 1900, doi:10.1029/2003GL018052.
Langousis, A., and D. Veneziano (2007), Intensity‐duration‐frequencycurves from scaling representations of rainfall, Water Resour. Res., 43,W02422, doi:10.1029/2006WR005245.
Lenderink, G., and E. van Meijgaard (2008), Increase in hourly precipitationextremes beyond expectations from temperature changes, Nat. Geosci., 1,511–514, doi:10.1038/ngeo262.
Liu, S. C., C. Fu, C.‐J. Shiu, J.‐P. Chen, and F. Wu (2009), Temperaturedependence of global precipitation extremes, Geophys. Res. Lett., 36,L17702, doi:10.1029/2009GL040218.
Milly, P. C. D., J. Betancourt, M. Falkenmark, R. M. Hirsch, Z. W.Kundzewicz, D. P. Lettenmaier, and R. J. Stouffer (2008), Climatechange: Stationarity is dead: Whither water management?, Science,319(5863), 573, doi:10.1126/science.1151915.
Min, S.‐K., X. Zhang, F. W. Zwiers, and G. C. Hegerl (2011), Human con-tribution to more‐intense precipitation extremes, Nature, 470, 378–381,doi:10.1038/nature09763.
O’Gorman, P. A., and T. Schneider (2009a), The physical basis forincreases in precipitation extremes in simulations of 21st‐century climatechange, Proc. Natl. Acad. Sci. U. S. A., 106(35), 14,773–14,777,doi:10.1073/pnas.0907610106.
O’Gorman, P. A., and T. Schneider (2009b), Scaling precipitation extremesover a wide range of climates simulated with an idealized GCM, J. Clim.,22(21), 5676–5685, doi:10.1175/2009JCLI2701.1.
Pall, P., M. R. Allen, and D. A. Stone (2007), Testing the Clausius‐Clapeyron constraint on changes in extreme precipitation under CO2warming, Clim. Dyn., 28(4), 351–363, doi:10.1007/s00382-006-0180-2.
Raupach, M. R., G. Marland, P. Ciais, C. L. Quere, J. G. Canadell,G. Klepper, and C. B. Field (2007), Global and regional drivers ofaccelerating CO2 emissions, Proc. Natl. Acad. Sci. U. S. A., 104(24),10,288–10,293, doi:10.1073/pnas.0700609104.
Reiss, R.‐D., and M. Thomas (2007), Statistical Analysis of ExtremeValues: With Applications to Insurance, Finance, Hydrology andOther Fields, 3rd ed., Springer, New York.
Rosenberg, E. A., P. W. Keys, D. B. Booth, D. Hartley, J. Burkey, A. C.Steinemann, and D. P. Lettenmaier (2010), Precipitation extremes andthe impacts of climate change on stormwater infrastructure in WashingtonState, Clim. Change, 102(1–2), 319–349, doi:10.1007/s10584-010-9847-0.
Schiermeier, Q. (2010), The real holes in climate science, Nature, 463(7279),284–287, doi:10.1038/463284a.
Scinocca, J. F., and N. A. McFarlane (2004), The variability of modelledtropical precipitation, J. Atmos. Sci., 61(16), 1993–2015, doi:10.1175/1520-0469(2004)061<1993:TVOMTP>2.0.CO;2.
Shukla, J., R. Hagedorn, B. Hoskins, J. Kinter, J. Marotzke, M. Miller,T. Palmer, and J. Slingo (2009), Revolution in climate prediction is bothnecessary and possible, Bull. Am. Meteor. Soc., 90(2).
Sillmann, J., and E. Roeckner (2008), Indices for extreme events in projec-tions of anthropogenic climate change, Clim. Change, 86(1–2), 83–104,doi:10.1038/415512a.
Simmons, A. J., and J. K. Gibson (2000), The ERA‐40 project plan,ECMWF ERA‐40 Proj. Rep. Ser. 1, Eur. Cent. for Medium‐RangeWeather Forecasting, Reading, U. K.
Sugiyama, M., H. Shiogama, and S. Emori (2010), Precipitation extremechanges exceeding moisture content increases in MIROC and IPCC cli-mate models, Proc. Natl. Acad. Sci. U. S. A., 107(2), 571–575,doi:10.1073/pnas.0903186107.
Tebaldi, C., K. Hayhoe, J. M. Arblaster, and G. A. Meehl (2006), Going tothe extremes, Clim. Change, 79(3–4), 185–211, doi:10.1007/s10584-006-9051-4.
Tomassini, L., and D. Jacob (2009), Spatial analysis of trends in extremeprecipitation events in high‐resolution climate model results and observa-tions for Germany, J. Geophys. Res., 114, D12113, doi:10.1029/2008JD010652.
Trenberth, K. E., D. P. Stepaniak, and J. W. Hurrell (2001), Quality ofreanalyses in the tropics, J. Clim., 14(7), 1499–1510, doi:10.1175/1520-0442(2001)014<1499:QORITT>2.0.CO;2.
Wehner, M. F., R. L. Smith, G. Bala, and P. Duffy (2010), The effect ofhorizontal resolution on simulation of very extreme US precipitationevents in a global atmosphere model, Clim. Dyn., 34, 241–247,doi:10.1007/s00382-009-0656-y.
Wilcox, E. M., and L. J. Donner (2007), The frequency of extreme rainevents in satellite rain‐rate estimates and an atmospheric general circula-tion model, J. Clim., 20(1), 53–69, doi:10.1175/JCLI3987.1.
Yin, L., R. Yang, M. Gabbouj, and Y. Neuvo (1996), Weighted medianfilters: A tutorial, IEEE Trans. Circuits Syst. II, 43(3), 157–192,doi:10.1109/82.486465.
Zolina, O., A. Kapala, C. Simmer, and S. K. Gulev (2004), Analysis ofextreme precipitation over Europe from different reanalyses: A compara-tive assessment, Global Planet. Change, 44(1–4), 129–161, doi:10.1016/j.gloplacha.2004.06.009.
A. R. Ganguly and S.‐C. Kao, Oak Ridge National Laboratory, OneBethel Valley Rd., Oak Ridge, TN 37831, USA. ([email protected])
KAO AND GANGULY: PRECIPITATION EXTREMES AND GLOBAL WARMING D16119D16119
14 of 14


![Development of Rainfall Intensity Duration …Reference [6] shows work done on revision of the rainfall-intensity duration frequency curves for the city of Kumasi-Ghana using annual](https://img.pdfslide.net/doc/110x75/5ea59752b6cbc0631d5a9da0/development-of-rainfall-intensity-duration-reference-6-shows-work-done-on-revision.jpg)