Embed Size (px)
Citation preview

INTENSIVE BEHAVIOURAL INTERVENTION FOR THE TREATMENT OF AUTISM
SPECTRUM DISORDER IN PRESCHOOL AND SCHOOL AGE CHILDREN:
A SYSTEMATIC REVIEW AND META-ANALYSIS
MIRHAD LONČAR
A Thesis Submitted to the Faculty of Graduate and Postdoctoral Studies (FGPS) in Partial
Fulfillment of the Requirements for the Master of Science Degree in Epidemiology
School of Epidemiology, Public Health and Preventive Medicine
Faculty of Medicine
University of Ottawa, Ottawa, Ontario, Canada
© Mirhad Lončar, Ottawa, Canada, 2016

ii
ABSTRACT
Intensive Behavioural Intervention (IBI) is one of the most widely used treatments for children
with an autism spectrum disorder (ASD). While IBI has been recognized as the treatment of
choice for very young children with an ASD, its sensible use among school age children is a
matter of dispute. The aim of this thesis was to determine the clinical effectiveness of IBI, as
compared with no treatment or treatment-as-usual, for the management of cognitive functioning
and adaptive skills in preschool and school age children with an ASD, as well as to examine
predictors of treatment response. Peer-reviewed, English language publications were identified
using MEDLINE, EMBASE, PsychINFO, CINAHL, and ERIC from 1995 to September 1,
2014. Grey literature and reference lists of published papers were also searched for relevant
records. Retrieved citations were screened by two independent reviewers, and data extraction
was performed by a single reviewer with verification by a second reviewer. The
methodological quality and procedural fidelity of included studies was assessed by one
reviewer, and a subset of included studies were pooled in a random-effects meta-analysis using
the standardized mean difference (SMD) effect size. A total of 24 unique studies were selected
for inclusion in this review, comprising a total of 1,816 participants. Findings revealed that IBI
improves full-scale IQ (SMD ES = 0.66, 95% CI 0.46 to 0.85, p<0.00001; 13 studies) and
adaptive skills (SMD ES = 0.57, 95% CI 0.33 to 0.82, p<0.00001; 12 studies) in preschool and
school age children with an ASD, with seemingly higher clinical benefits in children aged
under 4 years at intake. Better outcomes with IBI are predicted by children’s relatively younger
age, increased cognitive and adaptive ability, as well as a milder severity of symptoms at
treatment entry. Results warrant careful interpretation in light of several methodological
limitations and inadequate monitoring of procedural fidelity.

iii
ACRONYMS AND ABBREVIATIONS
AB Adaptive behaviour
ABA Applied Behavioural Analysis
ACBC-TRP Achenbach Child Behavior Checklist—Teacher Report Form
ADI-R Autism Diagnostic Interview-Revised
ADOS Autism Diagnostic Observation Schedule
ADOS-LC ADOS Language and communication domain
ADOS-RSI ADOS Reciprocal social interaction domain
AP Academic/educational placement
ASD Autism Spectrum Disorder
ASQ Autism Screening Questionnaire
BCBA Board Certified Behavior Analyst
BSID Bayley Scales of Infant Development
BSID-II Bayley Scales of Infant Development - 2nd Ed.
BSID-R Bayley Scales of Infant Development – Revised
CARS Childhood Autism Rating Scale
CADTH Canadian Agency for Drugs and Technologies in Health
CB Child behaviour
CI Confidence interval
COG Cognitive
DAS Differential Abilities Scale
DBC Developmental Behavior Checklist
DBS Developmental Behavioral Scales
DIR Developmental Individual Difference Relationship
DP-II Developmental Profile-II
DR Diagnostic recovery
DSM Diagnostic and Statistical Manual of Mental Disorders
E-LAP Early Learning Accomplishment Profile
ELG Expressive language
EOPVT Expressive One-Word Picture Vocabulary Test
ESCS Early Social Communication Scales
FMF Fine Motor Function
FSQ Family Satisfaction Questionnaire
Fx Functioning
GMF Gross Motor Function
HADS Hospital Anxiety and Depression Scale
IBI Intensive Behavioural Intervention
IEP Individualized education plan
IQ Intellectual quotient (cognitive/intellectual functioning)
IQ (Non-verbal) Visual-spatial IQ
JA Joint attention (non-verbal social communication)
KIPP Kansas Inventory of Parental Perceptions
Lang Expressive and receptive language
LAP-D Learning Accomplishment Profile-Diagnostic
MA Mental age/ratio IQ
MCYS Ministry of Child and Youth Services

iv
MD Difference in means
MDI Mental Developmental Index
ML Mirhad Lončar
MPSMT Merrill-Palmer Scale of Mental Tests
MS Mastery of skills/Initial skill acquisition
MSEL Mullen Scales of Early Learning
NCBRF Nisonger Child Behavior Rating Form (Positive Social Subscale)
PDD Pervasive Developmental Disorder
PDD-NOS Pervasive Developmental Disorder – Not Otherwise Specified
PECS Picture Exchange Communication System
PPVT Peabody Picture Vocabulary Test (3rd Ed.)
PRESS Peer Review of Electronic Search Strategies
PRISMA Preferred Reporting Items for Systematic Reviews and Meta-Analyses
Psy Psychopathology/severity of symptoms
PWB Parental well-being/family satisfaction
PWR Prewriting
QRS-FSF Questionnaire on Resources and Stress–Friedrich short form
RCog Cognitive rate of development
RCT Randomized controlled trial
RDev Adaptive date of development/developmental rate
RDLS-III Reynell Developmental Language Scales–3rd Ed.
RDLS-EL Reynell Expressive Language
RDLS-LC Reynell Language Comprehension
RLG Receptive language
ROPVT Receptive One-Word Picture Vocabulary Test
SB4 Stanford-Binet Intelligence Scale–4th Ed.
SBH Social behaviour
SEF Social emotional functioning
SFC Self-care
SK Shazya Karmali
SMD Standardized mean difference
TAU Treatment-as-usual
TC Tammy Clifford
TEACCH Treatment and Education of Autistic and Related Communication
Handicapped Children
UCLA YAP University of California Los Angeles Young Autism Project
UK United Kingdom
USA United States of America
VABS-Composite Vineland Adaptive Behavior Scales
VABS-C Vineland Adaptive Behavior Scales - Communication
VABS-DLS Vineland Adaptive Behavior Scales - Daily Living Skills
VABS-MS Vineland Adaptive Behavior Scales - Motor Skills
VABS-S Vineland Adaptive Behavior Scales - Socialization
WIAT Wechsler Individualized Achievement Test
WPPSI Wechsler Preschool and Primary Scales of Intelligence

v
DEDICATION
Abraham Lincoln once said:
“All that I am, all that I hope to be,
I owe to my angel mother;
My hand she guided as I learned to write,
My feet she guided in the ways of right,
My hopes she cherished, like a flame of light, –
God bless her soul, God bless her memory,
My angel mother.”
I lovingly dedicate this thesis to my angel mother Nermana, who instilled in me the love for
learning. Her words of encouragement and push for tenacity still ring in my ears.

vi
ACKNOWLEGEMENTS
The completion of this work would not have been possible without the encouragement and
support of several individuals, to whom I will always be grateful.
First and foremost, I wish to express my sincere gratitude to my supervisor, Dr. Tammy
Clifford, and my co-supervisor, Dr. Doug Coyle, for their great mentorship, for their
patience, and for the time and energy they have invested in taking me on under their
tutelage over the last two years. Thank you for sharing with me your knowledge and
passion for conducting high quality and meaningful research, and for providing me with
invaluable experiences throughout my graduate studies.
My sincere thanks also goes out to my thesis committee advisor, Dr. Lise Bisnaire, who
acquainted me with the fascinating world of autism research, and who has been very
supportive, kind, and encouraging.
I would also like to acknowledge the financial support of the Ontario Graduate Scholarship
and the School of Epidemiology, Public Health and Preventive Medicine for the
opportunity to present my research at several conferences.
To my epidemiology friends, thank you for helping to “smooth out the curves” of the
graduate school experience. To my Dad, and to my brother, who always asks the most
creative questions, thank you for your unwavering support and belief in my dreams –
I could not have done this without you.

vii
TABLE OF CONTENTS
ABSTRACT .......................................................................................................................... ii
ACRONYMS AND ABBREVIATIONS ........................................................................... iii
DEDICATION ...................................................................................................................... v
ACKNOWLEGEMENTS ................................................................................................... vi
TABLE OF CONTENTS .................................................................................................. vii
LIST OF FIGURES ............................................................................................................. ix
LIST OF TABLES ............................................................................................................... ix
CHAPTER I: Introduction & Background ........................................................................ 1
1.1 INTRODUCTION ............................................................................................................ 1
1.1.1 Statement of the problem .................................................................................... 1
1.1.2 Objectives ............................................................................................................ 3
1.1.3 Relevance to research and decision-making ...................................................... 4
1.1.4 Monograph outline ............................................................................................. 5
1.2 BACKGROUND.............................................................................................................. 6
1.2.1 Autism Spectrum Disorder .................................................................................. 6
1.2.2 Intervention for Children with an ASD ............................................................. 10
1.2.3 The Ontario IBI Program ................................................................................. 12
CHAPTER II: Methods ...................................................................................................... 15
2.1 OBJECTIVES ............................................................................................................... 15
2.1.1 Objective 1 ........................................................................................................ 15
2.1.2 Objective 2 ........................................................................................................ 16
2.2 CRITERIA FOR CONSIDERING STUDIES FOR THIS REVIEW ............................................ 16
2.3 TYPES OF OUTCOME MEASURES ................................................................................. 19
2.3.1 Primary outcomes ............................................................................................. 19
2.3.2 Secondary outcomes ......................................................................................... 19
2.4 SEARCH METHODS FOR IDENTIFICATION OF STUDIES .................................................. 20
2.4.1 Electronic searches ........................................................................................... 20
2.4.2 Searching other resources ................................................................................ 20
2.5 DATA COLLECTION AND STATISTICAL ANALYSIS ....................................................... 21
2.5.1 Selection of studies ............................................................................................ 21
2.5.2 Data extraction and management ..................................................................... 22
2.5.3 Assessment of methodological quality in included studies ............................... 23
2.5.4 Assessment of procedural fidelity ..................................................................... 24
2.5.5 Measures of treatment effect ............................................................................. 25
2.5.6 Unit of analysis issues ....................................................................................... 26
2.5.7 Dealing with missing data ................................................................................ 27
2.5.8 Assessment of heterogeneity ............................................................................. 28

viii
2.5.9 Assessment of reporting biases ......................................................................... 28
2.5.10 Data synthesis ................................................................................................... 29
2.5.11 Subgroup analysis and investigation of heterogeneity ..................................... 30
2.5.12 Sensitivity analysis ............................................................................................ 30
CHAPTER III: Results ...................................................................................................... 31
3.1 DESCRIPTION OF STUDIES ........................................................................................... 31
3.1.1 Results of the search ......................................................................................... 31
3.1.2 Characteristics of included studies ................................................................... 32
3.1.3 Procedural fidelity ............................................................................................ 45
3.1.4 Excluded studies ............................................................................................... 46
3.2 RISK OF BIAS IN INCLUDED STUDIES ........................................................................... 46
3.3 EFFECTS OF INTERVENTION ........................................................................................ 48
3.3.1 Cognitive functioning (IQ) ................................................................................ 48
3.3.2 Adaptive behaviour ........................................................................................... 51
3.3.3 Intervention effects among studies excluded from meta-analysis ..................... 55
3.3.4 Adverse events ................................................................................................... 58
3.4 PREDICTORS OF TREATMENT RESPONSE ..................................................................... 58
CHAPTER IV: Discussion ................................................................................................. 70
4.1 SUMMARY OF MAIN RESULTS ..................................................................................... 70
4.2 OVERALL COMPLETENESS AND APPLICABILITY OF EVIDENCE .................................... 72
4.3 QUALITY OF THE EVIDENCE ....................................................................................... 76
4.4 POTENTIAL BIASES IN THE REVIEW PROCESS .............................................................. 78
4.5 AGREEMENTS AND DISAGREEMENTS WITH OTHER STUDIES OR REVIEWS ................... 80
4.6 CONSIDERATION FOR COST AND COST-EFFECTIVENESS .............................................. 82
4.7 EQUITY IMPLICATIONS OF RESEARCH FINDINGS ......................................................... 90
CHAPTER V: Conclusions ................................................................................................ 92
5.1 IMPLICATIONS FOR PRACTICE ..................................................................................... 92
5.2 IMPLICATIONS FOR RESEARCH.................................................................................... 93
References ............................................................................................................................ 95
Appendices ......................................................................................................................... 105
APPENDIX 1: SEARCH STRATEGIES .................................................................................. 105
APPENDIX 2: LIST OF EXCLUDED STUDIES ....................................................................... 108
APPENDIX 3: LIST OF INCLUDED STUDIES ........................................................................ 116
APPENDIX 4: CHARACTERISTICS OF INCLUDED STUDIES .................................................. 118
APPENDIX 5: SUMMARY OF FINDINGS TABLES................................................................. 129
APPENDIX 6: RISK OF BIAS IN INCLUDED STUDIES ........................................................... 161
APPENDIX 7: DATA AND ANALYSIS ................................................................................. 167

ix
LIST OF FIGURES
Figure 1. PRISMA flow diagram ..................................................................................................... 33
Figure 2. Forest plot of comparison: IBI vs TAU, outcome: 1.1 IQ ................................................ 50
Figure 3. Forest plot of comparison: IBI vs TAU, outcome: 1.2 VABS Composite ....................... 52
Figure 4. Forest plot of comparison: IBI vs TAU, outcome: 1.3 VABS Communication ............... 54
Figure 5. Forest plot of comparison: IBI vs TAU, outcome: 1.4 VABS Daily Living Skills .......... 54
Figure 6. Forest plot of comparison: IBI vs TAU, outcome: 1.5 VABS Socialization .................... 55
Figure 7. Funnel plot of comparison: IBI vs TAU, outcome: 1.1 IQ ............................................. 167
Figure 8. Forest plot of comparison: IBI vs TAU, outcome: 1.1 IQ, subgroup: Intake Age .......... 168
Figure 9. Forest plot of comparison: IBI vs TAU, outcome: 1.1 IQ, subgroup: Intake IQ ............ 168
Figure 10. Forest plot of comparison: IBI vs TAU, outcome: 1.1 IQ, subgroup: Treatment model ........... 169
Figure 11. Forest plot of comparison: IBI vs TAU, outcome: 1.1 IQ, subgroup: Study design ..... 169
Figure 12. Funnel plot of comparison: IBI vs TAU, outcome: 1.2 VABS Composite .................. 170
Figure 13. Forest plot of comparison: IBI vs TAU, outcome: 1.2 VABS Composite, subgroup:
Intake Age ....................................................................................................................................... 171
Figure 14. Forest plot of comparison: IBI vs TAU, outcome: 1.2 VABS Composite, subgroup:
Intake IQ ......................................................................................................................................... 171
Figure 15. Forest plot of comparison: IBI vs TAU, outcome: 1.2 VABS Composite, subgroup:
Treatment model ............................................................................................................................. 172
Figure 16. Forest plot of comparison: IBI vs TAU, outcome: 1.2 VABS Composite, subgroup:
Study design .................................................................................................................................... 172
LIST OF TABLES
Table 1. Brief overview of characteristics of included studies. ........................................... 34
Table 2. Study, sponsorship and design characteristics of included studies ...................... 118
Table 3. Study, sample and treatment characteristics of included studies ......................... 120
Table 4. Study, treatment fidelity and outcome characteristics of included studies .......... 122
Table 5. Summary of findings from included studies ........................................................ 129
Table 6. Predictors of treatment response and observed associations in included studies 151
Table 7. Criteria of the adapted Downs and Black checklist. ............................................ 162
Table 8. Quality assessment of included studies according to Downs and Black checklist
(results by item). ................................................................................................................. 164
Table 9. Quality assessment of included studies according to the Downs and Black
checklist (results by domain). ............................................................................................. 166

1
CHAPTER I: INTRODUCTION & BACKGROUND
1.1 Introduction
1.1.1 Statement of the problem
Throughout the 1950s, it was widely accepted that children who exhibited a peculiar
set of neurological signs and symptoms – a range of repetitive and involuntary movements
such as spasms, tics, rocking, spinning, or flapping of the hands; balance and coordination
problems; difficulties in initiating movements analogous to what has been observed in
parkinsonism; a wide array of atypical sensory responses, with heightened or intolerable
sensitivity to certain stimuli and (often paradoxically) diminished responsiveness to other
stimuli; complex and unusual language difficulties – were the products and reflection of
bad parenting, most notably of an alarmingly detached, often uncaring, “refrigerator
mother.(1)” This popularized belief consequently led to an entire generation of parents –
mothers, particularly – who were riddled with feelings of guilt and self-deprecation related
to their child’s challenging behaviours, a symptomatic profile which would only a decade
later become more aptly recognized as “infantile autism,” a biological condition impervious
to a maternal lack of affection.(2) With a growing volume of data supporting a biological
basis of disease, it was not long before the misleading parental etiology became widely
discarded and the autistic subject was brought to light. Although infantile autism is better
known today as autism spectrum disorder (ASD), a neurodevelopmental condition
characterized by a triad of impairments in social relationships, communication, and play
and imaginative activities, its true etiology still remains unknown and there is no cure.(3)

2
Over the course of the last several decades, and perhaps most markedly in the recent
past, epidemiological studies have shown that the prevalence of this perplexing condition is
on the rise(4,5). Accordingly, the need for effective intervention approaches for children
with an ASD has become increasingly important. This is especially true given the long-
term implications of ASD on the quality of life of children and their families,(6–8) as well
as the large strain placed on the health care system which may not have the adequate or
appropriate resources to support these individuals or their caregivers.(9,10)
Fortunately, efforts in the development and application of interventions for the
management of core behavioural deficits related to ASD are ever-increasing.(11,12)
Indeed, among a variegated panoply of pharmacologic and non-drug treatments, intensive
behavioural intervention (IBI) has emerged as one of the most scientifically documented
and empirically validated therapeutic approaches for young children with an ASD.(13)
Rooted in the psychological principles of applied behaviour analysis, this therapy is
intended to kick-start the learning rate of very young children with an ASD so that they
may reach the developmental levels of typically developing peers as they enter the school
setting.(14) However, increased demand for this therapy over time, coupled with a delay to
diagnosis, has resulted in serious systemic issues regarding its timely access across several
jurisdictions. In particular, some children may not be initiating IBI until after they have
entered school, an age at which the efficacy of treatment has not been well studied.
Consequently, given the large economic burden that is associated with publicly-funded IBI
in Canada, and elsewhere,(15–17) the provision of treatment which may be unable to alter
the developmental trajectory of its recipients as intended is of great concern. Perhaps of

3
greater concern, however, are the lasting sequelae endured by those children who are
denied access to timely care if it is shown to be effective.
1.1.2 Objectives
The overarching goal of this thesis is to provide a better understanding of the
evidence base surrounding the effectiveness of IBI in the treatment of ASD in preschool
and school age children, as well as to explore predictors of treatment response with IBI.
Findings will be interpreted from a decision-making perspective, taking into consideration
the relative role of clinical efficacy, cost-effectiveness, and equity in resource allocation
decision-making.
Objective 1
To determine the clinical effectiveness of Intensive Behavioural Intervention (IBI),
as compared with no treatment or treatment as usual (TAU), for the management of
cognitive functioning and adaptive skills in preschool and school age children with an
autism spectrum disorder (ASD).
To address this objective, the following specific research questions will be answered:
1. Among children younger than 6 years of age with an ASD, what is the clinical
effectiveness of IBI, as compared with no treatment or TAU, for the management of
cognitive functioning and adaptive behaviour?
2. Among children aged 6 years and older with an ASD, what is the clinical
effectiveness of IBI, as compared with no treatment or TAU, for the management of
cognitive functioning and adaptive behaviour?

4
Objective 2
To examine predictors of response to IBI treatment in preschool and school age children
with an ASD.
To address this objective, the following research question will be answered:
1. Among preschool and school age children with an ASD, what are the predictors of
response to IBI therapy?
a. Is the effectiveness of IBI affected by the frequency, duration, or intensity of
the intervention?
b. Is the effectiveness of IBI affected by the training or experience of the
individual providing the therapy?
c. What characteristics, if any, of the child, modify the effectiveness of IBI?
d. Are there other factors which may predict treatment response with IBI?
1.1.3 Relevance to research and decision-making
The information generated from this thesis is primarily intended to provide a
comprehensive synthesis of the current published literature regarding the clinical
effectiveness of IBI in the treatment of ASD among preschool and school age children, as
well as to provide a better understanding of the participant and/or intervention
characteristics which may be associated with optimal treatment response and ultimately
lead to a difference in treatment effect among subgroups of this population. Findings will
be interpreted based on the quality and strength of the evidence, as well as its applicability
to the Canadian setting, with particular focus on the decision making context of the

5
province of Ontario, home of the country’s largest and most comprehensive IBI program.
Finally, consideration for cost-effectiveness and equity implications will allow to
contextualize the evidence and, in turn, provide a springboard for policy and decision-
makers to make choices regarding any changes to the current reimbursement process of IBI
services in Ontario, and elsewhere.
1.1.4 Monograph outline
The present chapter provides a thorough background to the patient population of interest,
the studied intervention, and describes the relevant policy context. The second chapter
provides a detailed description of the methods used in conducting the systematic review
and meta-analysis, including the criteria for considering studies for inclusion, the main
outcome measures being assessed, the search methods for identifying studies, as well as a
description of the data collection process and statistical analysis. The third chapter presents
the results of the review and meta-analysis, as well as an assessment of the methodological
quality of included studies. The extent to which procedural fidelity was monitored and
reported across the body of evidence is also discussed, as well as findings from studies
reporting on predictors of treatment response. Chapter four offers a discussion of the
relevance and applicability of the findings, and considers these findings in the context of
Canadian clinical practice, highlighting potential equity implications and considerations for
cost and cost-effectiveness. The final chapter considers the implications of the findings for
clinical practice and offers guidance for future research.

6
1.2 Background
1.2.1 Autism Spectrum Disorder
Almost three decades ago, American psychologist Kenneth D. Gadow – in reference
to what modern-day clinicians recognize as attention deficit hyperactivity disorder (ADHD)
– wrote: “In recent years, no other childhood disorder has received as much attention,
generated more controversy, or left educators and parents in more confusion about what to
do than the condition known as hyperactivity. The vagueness of the term has resulted in an
‘epidemic’ of cases, causes, and cures.(18)” Though this remark may very well still apply
to ADHD, present-day experts in child development would certainly agree that it applies
just as well to one of the most prevalent and fastest growing neurodevelopmental disorders
among children today: autism.
Commonly referred to as autism spectrum disorder (ASD), this condition
encompasses a wide range of developmental and neurological symptoms and behaviours
that affects individuals from all walks of life from early childhood years into
adulthood.(1,19,20) As hinted at by its name, clinical manifestations of autism fall on a
continuum of severity, with some individuals showing mild symptoms and others having a
much more severe clinical profile.(20,21) These symptoms often include impaired
communication affecting spoken language and nonverbal communication, impaired social
skills and diminished capacity to engage in social relationships, perseveration on interests
and activities resulting in a narrow range of interests and in repetitive, stereotyped body
movements, as well as abnormal responses to sensory stimulation and lack of flexible
imaginative skill.(1,21) Therefore, ASD fundamentally impairs a person’s ability to
communicate and to relate to others. Given the condition’s diverse symptomatology, each

7
affected individual may present with a different combination of symptoms, and each
person’s symptomatic profile may fluctuate throughout their lifespan.(21) Indeed, the
variability in expression of disease is one of ASD’s distinguishing features. Some people
with an ASD, for instance, may have delayed or absent verbal abilities, whereas others may
be highly proficient in spoken or expressive language. Similarly, some may be
uncomfortably bothered by sounds, whereas others may well be musical savants.
Furthermore, a number of medical (e.g. epilepsy, gastrointestinal problems, sleep disorders,
metabolic disease) and psychiatric (e.g. ADHD, obsessive compulsive disorder, intellectual
disability) comorbid disorders have been found to co-exist to varying degrees in children
with an ASD.(22–26) It is this great heterogeneity which ultimately complicates both the
selection of appropriate treatments and treatment response among those living with an
ASD.
Since the concept of autism in children was first introduced by Leo Kanner in 1943,
the disorder’s symptomatic profile has widened dramatically.(27) Undoubtedly, these
changes in symptomatology have occurred in parallel with the broadening of the diagnostic
criteria and definition of autism. Currently, the most widely accepted definition of ASD is
based on the Diagnostic and Statistical Manual of Mental Disorders (DSM), published by
the American Psychiatric Association. Although the term ‘autism’ as a childhood medical
condition first received its own classification in the third edition of the DSM, close to four
decades after Kanner’s first description of the autism prototype, it wasn’t until the fourth
edition of the DSM (DSM-IV-TR) that the description was expanded to incorporate the
notion of a continuum of related disorders referred to as pervasive developmental disorders
(PDDs), of which ‘autistic disorder’ was the most severe form.(27–29) Up until recently,

8
this neurodevelopmental condition was subsumed under the general PDD category
alongside four other disorders, namely Asperger’s disorder, childhood disintegrative
disorder (CDD), Rett syndrome, and PDD-not otherwise specified (PDD-NOS) (30).
However, the latest edition of the DSM (DSM-V), released in May 2013, no longer
considers autistic disorder, PDD-NOS, CDD, and Asperger’s disorder as distinct
conditions, but rather collectively defines them as ‘Autism Spectrum Disorder,’ thus
formally recognizing what has been the de-facto term in previous years.(30) Despite a
seemingly improved understanding of ASD’s clinical manifestations, no known cause of
this puzzling disorder has been identified to date.(3,4) In fact, the suspected causes of ASD
are perhaps as diverse as the spectrum itself, and presumably reflect a child’s genetic
endowment and early life environment.(31,32) Due in part to unknown etiology, there are
currently no definitive diagnostic tests for autism; therefore, clinicians rely heavily on a
detailed developmental history and direct behavioural observation to arrive at the
diagnosis.(3,27) For many children, ASD diagnosis usually occurs during the first three
years of life and is four times more common in boys than girls (3,33).
Just as ASD’s clinical profile has increased over time, so too has its prevalence. In
fact, more children are being diagnosed with an ASD each year in the United States than
AIDS, cancer, and diabetes combined.(34) According to recent estimates from the Centers
for Disease Control and Prevention’s (CDC) Autism and Developmental Disabilities
Monitoring Network (ADDM), one in 68 children (or 14.7 per 1,000 children) are thought
to be affected by this disorder, a number reflecting a 123% increase in reported prevalence
since 2002 (one in 150; 6.6 per 1,000).(35) Findings from the National Epidemiologic
Database for the Study of Autism in Canada (NEDSAC), which compared data between

9
2003 and 2010 in Prince Edward Island, southeastern Ontario, and Newfoundland and
Labrador, revealed similar trends in prevalent ASD cases, with an estimated 1 in 94
Canadian children affected.(36) Given the rising prevalence estimates, coupled with the
fact that autism was thought to be a rare condition as recently as the mid-1990s, it is not
surprising that popular opinion is that autism is affecting more and more individuals today
than ever before. However, it’s important to note that the degree to which ASD is on the
rise is a matter of some controversy. Though it cannot be contested that the number of
children diagnosed with an ASD has increased over the past decade or so, it is unclear
exactly how much of this is a true increase in prevalence and how much is due to a
broadening of the clinical definition of ASD, changing diagnostic criteria, different
methods used in epidemiological studies, and greater awareness of the condition among
parents and professional workers.(37)
Though the underlying reasons for rising prevalence rates remain elusive, the long-
term impact of ASD on the quality of life of affected individuals and their caregivers is
well recognized. In general, longitudinal studies have consistently demonstrated poor
outcomes of individuals with an ASD in adolescence and adulthood, with many adults
being socially isolated and unable to lead independent lives.(6,8,38) A high level of
dependence on their caregivers or other support services during the adult years is also often
coupled with a progressive decline in cognition and communication skills, as well as an
increased rate of challenging behaviours.(39,40) Recent data have indicated, however, that
prognosis may be more favourable than previously found, with a 10% increase over 20
years in individuals attaining “good” outcomes in adulthood.(38) The impact of broadening
diagnostic criteria or better case finding on this apparent increase in good outcomes in

10
adulthood remains unclear. In general, favourable outcomes are commonly experienced
among individuals with higher intellectual ability, and better adaptive functioning and
communication skills.(41,42)
1.2.2 Intervention for Children with an ASD
Though uncertainty still shrouds much of autism, a myriad of treatment modalities
are currently in place for the management of core symptoms associated with ASD.
Pharmacologic interventions for instance, though not indicated for the treatment of ASD
itself, are occasionally effective in addressing various associated symptoms.(43)
Furthermore, a range of complementary and alternative medicine approaches, such as
hyperbaric oxygen therapy and chemical chelation, also exist; however, they generally have
little research to support their clinical efficacy.(44) In fact, few medical and nonmedical
interventions show strong evidence of substantial benefit for children with an ASD;
nonetheless, advances in treatment continue to be made. In particular, there are currently
well over 50 different non-pharmacologic therapies targeting various deficits, including
pro-social and play-based interventions (e.g. social stories), language and communication-
based interventions (e.g. Picture Exchange Communication System (PECS)), sensory and
motor interventions (e.g. sensory integration), interventions targeting challenging behaviour
(e.g. intrusive behaviour reduction procedures) and those for general skill building (e.g.
behavioural teaching), as well as expressive psychotherapies (e.g. music therapy).(11,45)
While many of these treatment approaches carry a certain value, none has received as much
attention and empirical support as Intensive Behavioural Intervention (IBI), a
comprehensive form of early intervention for ASD.(13) Anchored in the principles of
applied behaviour analysis (ABA), a scientific approach designed to change behaviour and

11
measure the resulting change, IBI consists of a highly structured teaching approach for
young children with an ASD.(46,47) Treatment is typically administered in a one-to-one
format (in the beginning) for 20 to 40 hours per week over approximately two years, and
the overarching goal of therapy is to decrease challenging behaviours, to increase social
skills and cognitive ability, and to promote development.(47–49) More specifically, IBI is
intended to alter children’s developmental trajectory and enable them to learn at the level of
typically developing children as they transition into the school environment.(50,51)
The pioneering method of IBI was developed by Dr. O. Ivar Lovaas at the
University of California, Los Angeles (i.e. the UCLA Young Autism Project), who
proposed a very specific method of IBI treatment delivery targeted for very young children
with an ASD.(50) While the Lovaas method follows a specified treatment manual,(52) IBI
has been administered to children with an ASD in a variety of ways across a number of
different settings since it was first introduced. Each IBI program, although different from
the Lovaas method, typically consists of a core set of unifying features. These include
treatment that begins as early as 3 to 4 years of age, an intensive delivery of therapy
(around 20 to 40 hours per week), the use of an individualized and comprehensive approach
that targets a wide range of skills, the development of adaptive repertoires using multiple
behaviour analytic teaching techniques, a gradual progression of intervention delivery from
a one-to-one format to group activities and naturalistic settings, treatment goals which are
guided by normal developmental sequences, and the involvement of parents, to varying
degrees, as active co-therapists.(53) Despite these commonalities, IBI programming may
still vary in terms of the selected treatment intensity, the age at which children start therapy,
the focus on specific skills areas as treatment targets, the level of experience and

12
competence of therapists and/or program supervisors, as well as the setting (e.g. clinic-,
community-, school-, or home-based).
A recent overview of meta-analyses on the efficacy of IBI, also sometime referred
to as early intensive behavioural intervention (EIBI), reached the conclusion that “the
current evidence on the effectiveness of EIBI meets the threshold and criteria for the
highest levels of evidence-based treatments” and that “EIBI is the comprehensive treatment
model for individuals with ASDs with the greatest amount of empirical support.”(13) In
spite of these findings, it is important to note that some studies examining the effectiveness
of IBI have yielded conflicting results in that not all children with an ASD benefit equally
from this intervention. A better understanding of the various factors which may contribute
to the different outcomes experienced by children who undergo IBI therapy could
potentially aid in refining IBI programming to meet the needs of the population which
responds optimally to the goals of treatment, and at the same time, offering alternatives to
those children who do not respond to IBI-specific treatment targets.
1.2.3 The Ontario IBI Program
Based on a growing evidence base supporting IBI as an effective therapy option for
children with an ASD, the province of Ontario launched a province-wide IBI initiative in
the year 2000, the largest and most comprehensive IBI program of its kind worldwide.(47)
Funded by the provincial Ministry of Child and Youth Services (MCYS), Ontario’s Autism
Intervention Program (AIP) is provided free of charge by one of nine regional programs to
families residing in both large rural areas and densely-populated urban centres, with
services provided in either English or French. The goal of therapy provided at each regional

13
centre is to increase the developmental trajectory, or rate of learning, of children with an
ASD toward the severe end of the spectrum.(14)
When the Ontario IBI program was initially launched, children who were diagnosed
with an ASD were admitted following an assessment of eligibility based on consideration
of their adaptive functioning, severity of symptoms, and at times, intellectual ability. Once
a child met the specific eligibility criteria, which included a diagnosis toward the severe
end of the spectrum, he or she would start therapy on an intensive basis (20 to 40 weekly
hours) for up to two years, or until they reached their sixth birthday, at which time they
would transition into the school system.(47) Therefore, for children who were aged 6 years
or older at the time of diagnosis, and ultimately at the time of referral to IBI, funding for
treatment would be denied. As a result, a class action lawsuit was filed against the
provincial government in 2000, challenging the termination of public funding for IBI at the
age of 6 for qualifying individuals, in spite of the program’s mandate and the evidence base
supporting the use of IBI in very young children prior to enrollment in school.(54) In April
2005, the Superior Court of Ontario ruled in favor of the plaintiffs based on the fact that the
age criterion was deemed discriminatory.(54) This effectively directed regional autism
programs to accept children into IBI over the age of 6 and after entry in school, albeit
unsupported by evidence. This decision was later overturned at the Court of Appeal for
Ontario; however, the provincial government did not re-implement the age cut-off
criterion.(55) As a result, a number of older children are currently being admitted into the
program, and waitlists for treatment have become even lengthier than before.(55) With
increasing numbers of children reaching the age of 6 and beyond (at which point IBI is
ostensibly less effective) before ever receiving the care they need, discontent among

14
families seeking IBI services in Ontario is pervasive. Matters are further complicated by the
fact that program eligibility criteria restrict IBI services only to those children whose ASD
symptoms are clinically judged to be on the severe end of the autism spectrum, with recent
estimates showing that about one quarter of children with an ASD diagnosis who apply for
IBI are denied treatment because their autism is not considered severe enough.(56) It is
therefore not surprising that the equitable provision of IBI services in Ontario is a matter of
considerable controversy.
According to a recent evaluation of autism services and supports for children in
Ontario conducted by the Office of the Auditor General of Ontario, there were
approximately 2,000 children with an ASD receiving IBI services in the 2012/2013 fiscal
year (56); yet, close to the same amount of children were also waiting for this government-
funded treatment. Transfer payments for provincial ASD services and supports during the
same fiscal year totalled approximately $182 million, 64% of which were the result of
spending on IBI programming and transition supports for children entering the school
system.(56) This number represents a significant increase from an initial investment of $14
million on ASD services and supports in year 2000/01 by the Ministry of Child and Youth
Services, and a substantial economic burden on the province’s finite resources.

15
CHAPTER II: METHODS
The preceding chapter provided an overview of the patient population under study and
the intervention of interest, including an introduction to the decision-making context upon
which this thesis is based.
The following chapter outlines the methodology used in conducting the systematic
review of literature and meta-analyses relating to the comparative clinical effectiveness of
IBI in preschool and school age children with an ASD, as well as information relating to
predictors of treatment response. Detailed information is provided on the criteria which
guided the selection of articles for inclusion, the search methods used to identify relevant
published evidence, as well as the method of data collection and statistical analysis.
2.1 Objectives
2.1.1 Objective 1
To determine the clinical effectiveness of Intensive Behavioural Intervention (IBI),
as compared with no treatment or treatment as usual (TAU), for the management of
cognitive functioning and adaptive skills in preschool and school age children with an
autism spectrum disorder (ASD).
To address this objective, the following specific research questions will be answered:
1. Among children younger than 6 years of age with an ASD, what is the clinical
effectiveness of IBI, as compared with no treatment or TAU, for the management of
cognitive functioning and adaptive behaviour?

16
2. Among children aged 6 years and older with an ASD, what is the clinical
effectiveness of IBI, as compared with no treatment or TAU, for the management of
cognitive functioning and adaptive behaviour?
2.1.2 Objective 2
To examine predictors of response to IBI treatment in preschool and school age children
with an ASD.
To address this objective, the following research question will be answered:
1. Among preschool and school age children with an ASD, what are the predictors of
response to IBI therapy?
a. Is the effectiveness of IBI affected by the frequency, duration, and intensity
of the intervention?
b. Is the effectiveness of IBI affected by the training and/or experience of the
individual providing the therapy?
c. What characteristics, if any, of the child, modify the effectiveness of IBI?
d. Are there other factors which may predict treatment response with IBI?
2.2 Criteria for considering studies for this review
A number of pre-specified eligibility criteria guided the selection of key studies for
inclusion in this review. These criteria were implemented in a successive manner such that
a given record was considered as excluded as soon as it met one of the following reasons
for exclusion: (1) the study was published prior to year 1995; (2) the study was not a full,
published journal article (e.g. conference abstract, thesis or dissertation); (3) the study was

17
not written in English; (4) the study was a duplicate (this includes multiple reports from the
same study); (5) the study was not accessible through electronic databases; (6) the study did
not report on original primary research (e.g. review, discussion article, methods paper,
critique); (7) the study reported on a single-subject design (SSD) or on multiple non-
consecutive case reports; (8) the study participants were aged 18 years or older; (9) the
study participants did not have a formal diagnosis of an ASD (including autistic disorder,
pervasive developmental disorder (PDD), or similar diagnostic variant) according to the
Autism Diagnostic Interview – Revised (ADI-R), the Autism Diagnostic Observation
Schedule (ADOS), the Diagnostic and Statistical Manual of Mental Disorders (DSM)
criteria for autism, or a combination of any of these methods; (10) the experimental
treatment of interest (i.e. IBI or similarly-named behaviour analytic therapy) was not
described as intensive (i.e. 20 or more hours of intervention per week) nor comprehensive
(i.e. addresses several domains or multiple areas of functioning affected by an ASD); (11)
the intervention of interest was not administered by a trained professional or qualified
therapist, and (12) the study outcomes were not an objective measure of the participant’s
achievement or treatment response.
The rationale underpinning these exclusion criteria was manifold. First, given that
behaviour analytic treatment is clinically relevant and justified only for those individuals
with medically recognized deficits in development that are characteristic of autism (or
similar diagnostic variant like PDD or PDD-NOS), at-risk patient groups and those with a
self-reported or parent-reported ASD were excluded from the review. In keeping with the
aims of early behavioural therapy, participants aged older than 18 years were also excluded,
even though onset of IBI treatment in children of school-bearing age and adolescents is

18
considered uncommon, and to some degree unsubstantiated. Participants were not restricted
to a specific age window at treatment onset or excluded based on IQ or the presence of
comorbid disorders. Second, interventions whose treatment intensity averaged less than 20
hours per week or which were narrowly focused on a single developmental domain like
speech or play were excluded from the review because these characteristics reflect
deviations from the defining features and principles of Intensive Behavioural Intervention.
While the effect of treatment with IBI may be observed at thresholds below 20 hours per
week, this cut-off criterion is consistent with several IBI program guidelines and principles
of behaviour analysis. Third, studies in which measurement of treatment response relied
exclusively on an indirect assessment of a child’s achievement, for example via telephone
surveys with parents, were excluded because these outcomes were not considered to be
objective measures of response to therapy. Fourth, single subject design (SSD) studies or
those describing multiple non-consecutive case-reports were also excluded because their
focus is on solitary cases rather than groups of individuals, and this would require special
statistical manipulation in the estimation of treatment effect. Accordingly, these studies
would likely have a disproportionate impact on the intervention effect as they do not
adequately describe the target population as a whole. Fifth, studies which evaluated parent-
directed or parent-administered behavioural therapy were excluded because parents lack
adequate training and experience in delivering ABA-based treatment in a competent
manner, and this poses a significant threat to internal and external validity. Finally, any
studies that were published prior to year 1995 were excluded because the age of the
evidence base would not likely reflect current clinical practice.

19
Criteria for considering studies for inclusion were carefully selected to meet the
requirements for identifying studies for both objectives of this review. While it is common
for studies reporting on the clinical efficacy or effectiveness of IBI to also report data
relating to predictors of treatment response, not all studies follow this practice. Therefore,
the pre-defined eligibility criteria allowed for the inclusion of studies relating to the
efficacy/effectiveness of the intervention and/or predictors of treatment response.
2.3 Types of outcome measures
2.3.1 Primary outcomes
Cognitive functioning (as measured by the intellectual quotient or IQ) was selected
as the primary outcome measure for this review. IQ adequately reflects the goal and
potential benefit of IBI in the study population given that this intervention is designed to
jumpstart the learning rate of children so that they may meet the developmental milestones
of same-aged peers as they reach the school age. Therefore, IQ was deemed as the most
appropriate primary outcome.
2.3.2 Secondary outcomes
The secondary outcome measure of this review was adaptive behaviour (AB). While
acquisition of adaptive skills is important in the evaluation of therapeutic change in
children with an ASD undergoing behavioural therapy, an improvement in adaptive
behaviour does not reflect the primary goal of IBI therapy. As a result, it was assessed as a
secondary outcome in this review.

20
2.4 Search methods for identification of studies
A thorough search of the literature was conducted from both electronic databases and
grey literature sources to identify studies for both objectives of this review. Due to time and
resource constraints, only full-text English language publications were included in the
review. However, no restrictions based on language or study design were placed on the
initial search. Details of these search strategies are presented below.
2.4.1 Electronic searches
The following electronic databases were searched for relevant publications between
the year 1995 to present (September 1, 2014): MEDLINE including In-Process & Other
Non-Indexed Citations, Embase, PsycINFO, CINAHL and ERIC. All databases were
searched using the Ovid interface, with the exception of CINAHL and ERIC which were
accessed through the EBSCOhost and ProQuest interfaces, respectively. The MEDLINE
search strategy was developed using appropriate syntax and a combination of controlled
vocabulary and free-text terms. This core strategy was peer reviewed by an information
scientist experienced in systematic review searching, using the PRESS standard.(57) The
MEDLINE search was subsequently adapted for the other electronic databases. No
language or study design limits were applied to any of the searches. The search strategies
used are presented in Appendix 1: Search Strategies.
2.4.2 Searching other resources
Grey Literature
Electronic searches were supplemented by a search of various grey literature
sources. This search was performed using the Canadian Agency for Drugs and

21
Technologies in Health (CADTH) Grey Matters checklist (February 2014), an online
resource for grey literature searching. To ensure consistency in the searching process, four
key search terms were applied systematically across all sources: autism, autism spectrum
disorder, applied behavioural analysis, and intensive behavioural intervention. The searched
grey literature sources included national and international health technology assessment
(HTA) agency websites, clinical practice guidelines, clinical trial registries, as well as the
websites of key national and international professional ASD associations or organizations.
Any potentially relevant CADTH reports were also included in the grey literature search.
Reference lists
In addition to the grey literature search, reference lists of studies included in this
review were hand-searched and verified for reports of other relevant studies in the
published or unpublished literature.
2.5 Data collection and statistical analysis
2.5.1 Selection of studies
Two independent reviewers (ML and SK) screened the titles and abstracts of all
records identified in the database searches using the computerized screening program
ABSTRACKR™ (Tufts Medical Center, Boston, MA), an open-source web-based
software.(58) Ineligible studies in this first screening phase were excluded based on
population and/or intervention. If it was unclear whether a given study met inclusion
criteria for target population or intervention of interest, the full text of the citation was
retrieved for further assessment in the second phase of screening. During the second
screening phase, full-text articles of relevant citations were retrieved and assessed by the

22
same two independent reviewers using the pre-defined exclusion criteria. Disagreements
were resolved through discussion or through adjudication by a third reviewer (TC).
2.5.2 Data extraction and management
For objective 1 and objective 2, data from the selected review articles were
extracted by one reviewer (ML) using a piloted data collection instrument, and a second
reviewer (SK) performed a 10% validation of the extracted information. Disagreements
were resolved by the two reviewers through discussion, and a third reviewer (TC) was
sought for adjudication when consensus could not be reached.
The following data were retrieved and recorded from all included studies: (1)
baseline characteristics of participants in the treatment and/or control or comparison
group(s), including diagnosis, comorbid conditions, mean pre-intervention chronological
age in months, mean pre-intervention IQ, percentage of male participants, and total sample
size; (2) intervention characteristics, including experimental treatment delivery model
(UCLA model or other general IBI model), treatment intensity (hours per week), treatment
duration (months), number and frequency of follow-up assessments, setting of service
delivery, primary treatment provider(s), and role of parent(s) in treatment delivery, if any;
(3) outcome data on all reported outcome measures, including available pre- and post-test
outcome measures (mean and standard deviation) and corresponding measurement tools;
(4) data on predictors of treatment response (objective 2), where available, including
predictive variables, observed associations, and measure of association values; and (5)
general study characteristics, including funding source(s), study objective(s), study design
(randomized controlled trial, non-randomized controlled trial, uncontrolled multiple-group
comparison, one-group pre/post design), group assignment, as well as participant selection

23
criteria and recruitment procedures. Key conclusions and limitations of each review article
were also documented.
2.5.3 Assessment of methodological quality in included studies
The methodological quality of included studies was evaluated by means of the
Downs and Black (1998) checklist for randomized and non-randomized studies of health
care interventions.(59) Due to resource constraints, assessment of study quality was
conducted by a single reviewer (ML).
This quality checklist was selected primarily because it was deemed flexible enough
to be applicable to both one-group pre/post design studies as well as controlled multiple-
group comparison studies, whether randomized or not. This tool adopts a component
approach to quality assessment and covers five quality domains: reporting (10 items),
external validity (3 items), internal validity – bias (7 items), internal validity – confounding
(6 items), and power (1 item). A total of 28 points are possible, with higher total scores
indicating higher quality studies. To prevent over-representation of checklist domains
containing more items (e.g. reporting), each of the tool’s five domains was also rated on a
scale of 0 to 1 points, resulting in a 5-point total quality range. Following the original
author’s guidelines, this checklist was adapted specifically to the field of applied
behavioural analysis for autism in a previous meta-analysis conducted by Virues-Ortega et
al. (2010),(60) which served as the basis for evaluating the quality of studies included in
this review. Furthermore, the last item on the checklist (item 27) was simplified to consider
whether or not the study authors had reported a power estimation or provided a sample size
justification. This modified Downs and Black checklist with new additions and
specifications used in this review is presented in Table 7 of Appendix 6.

24
2.5.4 Assessment of procedural fidelity
Treatment fidelity, also referred to as procedural fidelity or treatment integrity,
refers to the degree to which a given intervention has been implemented as planned or
intended.(61,62) Evaluating how accurately or faithfully an intervention has been put into
practice, whether reproduced from a treatment manual or delivered by way of a theoretical
model, is integral for considering behavioural treatment efficacy as it allows for
unambiguous interpretation of study findings related to therapeutic change, and in turn,
predictors of treatment response.(61,63) Accordingly, procedural fidelity in included
studies was examined using the conceptual systems of treatment integrity proposed by
Perepletchikova and Kazdin (2005) and Gresham (2005).(61,64) According to
Perepletchikova and Kazdin (2005), treatment integrity encompasses three related aspects:
treatment adherence, therapist competence, and treatment differentiation.(61) Treatment
adherence refers to the extent to which specified therapeutic procedures were delivered as
designed across the study sample (e.g. strictly following a treatment manual, or performing
all prescribed tasks and activities). Conversely, therapist competence represents the skill
level and judgement displayed by the therapist in delivering the intervention, and treatment
differentiation relates to whether treatments under study differ from each other along
appropriate lines, often defined by a treatment manual (i.e. implementing procedures
prescribed for treatment A and avoiding procedures prescribed for treatment B and vice
versa). In keeping with this conceptual framework, Gresham (2005) proposed three
methods for measuring treatment integrity, which guided this assessment: (1) direct
measures, (2) indirect measures, and (3) manualized treatments. Namely, direct measures of
treatment integrity included reports of either direct observations of treatment delivery or
videotaping/audiotaping of therapy sessions, while indirect measures comprised evidence

25
of self-reports of treatment implementation or collection of completed therapy checklists
after each session to indicate which procedures were or were not delivered as designed or
prescribed in a manual. Evidence that delivery of prescribed tasks and avoidance of
proscribed procedures was carried out in different interventions of a comparative study, as
is often the case for comparisons of manualized treatments against status quo, was
considered sufficient to demonstrate treatment differentiation.
2.5.5 Measures of treatment effect
Dichotomous data were not encountered in any of the studies included in this
review. This was not surprising given that the outcomes of interest (i.e. cognitive level and
adaptive behaviour) are commonly measured on a continuous scale. Had binary outcomes
been reported, they would have been analyzed by computing an odds ratio (OR) with a
95% confidence interval (CI) for each outcome.(65)
Analysis of continuous data was based on the assumption that the means and
standard deviations reported in the study papers were derived from a normally distributed
sample with no evidence of skew.(65) Where outcomes of a similar construct were
estimated using different measurement scales or tools, the standardized mean difference
(SMD) with the 95% CI was calculated using Hedges g with small sample size correction
and used as a summary statistic.(66) In instances where a uniform measurement scale is
used to ascertain similar outcomes, the difference in means (MD) statistic is generally
favoured(65); however, because data from studies of alternate designs (i.e. controlled
comparisons and uncontrolled studies) were aggregated within the same meta-analysis, the
SMD statistic with the 95% CI was calculated instead using Hedges g with small sample
size correction and used as summary measure, as suggested by Morris & DeShon

26
(2002).(67) Although many of the included studies reported change scores from baseline as
a measure of treatment effect, these same studies also reported means (and SD) at pre- and
post-intervention times. Therefore, means and accompanying SD at baseline and at the last
recorded follow-up were extracted from the relevant articles.
2.5.6 Unit of analysis issues
Repeated measures studies
Studies with long follow-up periods may often report measures of outcome at more
than one time point within the study time frame. However, combining data from several
time points in a standard meta-analysis poses the risk of a unit-of-analysis error.(65)
Consequently, in cases where studies selected for inclusion in a meta-analysis documented
repeated observations on participants, interim measures were always discarded and pre-test
and post-test measures for the longest follow-up period from each study were chosen to
assess the effect of treatment on the chosen outcome, even when the last follow-up outcome
measure was reported in a separate or subsequent publication. Although this method
reduces the potential for a unit-of-analysis error, it may lead to a lack of consistency across
studies and result in greater heterogeneity.
Studies with multiple intervention groups
Studies which compared more than one experimental condition but which lacked a
control arm were treated with care. In such cases, although both groups implemented
similar therapy based on ABA principles, only one intervention group was chosen as the
treatment arm, and the other group was treated as a comparison group and dropped from the
analysis. The choice of treatment group was based on the intervention characteristics which

27
more closely aligned with the pre-specified criteria for eligible interventions for this
review. It was deemed inappropriate to combine results across two intervention groups
since one group often deviated from the requisite intervention characteristics specified as
part of the inclusion criteria.
A serious unit-of-analysis problem may also arise when multiple pair-wise
comparisons between all possible intervention pairs from studies with a single experimental
condition and multiple control arms are included in meta-analysis. In such instances, only
one control group was chosen for a single pair-wise comparison, and this choice was based
on the control condition which more closely reflected other control or treatment-as-usual
(TAU) groups across the included studies.
2.5.7 Dealing with missing data
Missing data and loss to follow-up was examined across all included studies and
this assessment was reflected in the analysis of the methodological quality of studies. For
studies in which either mean or standard deviation values were missing, or selectively
reported at either baseline or treatment discharge, an attempt was made to contact the
original investigators of relevant publications to request the missing data. When such
attempts were unsuccessful, outcome data for the corresponding article were dropped from
the quantitative, but not qualitative, synthesis. Thus, only the available data were analyzed
in meta-analysis, and replacement values were not imputed for missing data. The influence
of missing data on altering the results of the review is assessed and discussed (see 4.3
Quality of the evidence)

28
2.5.8 Assessment of heterogeneity
For objective 1, the clinical and methodological heterogeneity across studies was
evaluated based on the variability or differences between participants, interventions, and
outcomes of relevant studies, as well as their design and conduct or risk of bias. Where
studies were considered similar enough to allow pooling of data using meta-analysis, the
degree of statistical heterogeneity was assessed by visual inspection of forest plots and by
examining the Chi2 test for heterogeneity (Cochran Q) and the I2 statistic. Specifically, the
presence of statistical heterogeneity was indicated by a Chi2 statistic greater than the
degrees of freedom (df) and a low P-value; due to the low power of the chi-squared test to
detect heterogeneity, a P value of 0.10 was used as the level of significance (P <0.10).(65)
The percentage of variability that was due to heterogeneity rather than sampling error or
chance was quantified by the I2 statistic, with higher I2 values representing greater
heterogeneity of treatment effects. Moreover, poor overlap between the confidence
intervals for each effect estimate on the forest plot suggested that statistical heterogeneity
was likely present. Where heterogeneity was found in pooled effect estimates, possible
reasons for variability were considered and further investigated through subgroup analyses
where data permitted, as described below.
In the event that variability, whether from clinical, methodological, and/or statistical
sources, was too high across studies, results would not have been synthesized quantitatively
in a meta-analysis, and a narrative synthesis would have instead been provided.
2.5.9 Assessment of reporting biases
The likelihood of reporting biases was assessed qualitatively based on the
characteristics of included studies and based on information obtained from published

29
literature suggesting that there may be relevant unpublished studies. Where sufficient
studies (at least 10) were included in a meta-analysis for a specified outcome, funnel plots
were constructed to investigate small study effects, which may indicate the presence of
publication bias.(68) Funnel plots were not formally tested for asymmetry using statistical
methods (e.g. Egger’s regression test) due to limitations in the statistical software used;
however, visual inspection of funnel plot asymmetry allowed interpretation of the possible
effects of publication bias.
2.5.10 Data synthesis
To ensure meaningful conclusions from a statistically-pooled result for objective 1,
the decision to meta-analyse data or not was guided by an assessment of the similarity of
interventions across the included studies in terms of their participants, treatment intensity
and settings, as well as their theoretical basis and use of outcome measures with similar
psychometric properties. Where two or more studies with complete pre-test and post-test
measures (means and SD) were found, and the studies were considered similar enough
based on the aforesaid attributes, a meta-analysis was performed on the results. Controlled
comparisons and uncontrolled before-and-after studies were combined in the same meta-
analysis following the rationale provided by Morris & DeShon (2002).(67) Due to the
possibility of variation in intervention techniques and differences in participant populations,
a random-effects model was used for meta-analysis. When quantitative synthesis of data
was not possible, a narrative description of the study results was provided. Data synthesis
relating to the first objective was conducted using the Review Manager software (RevMan
5.3, The Cochrane Collaboration).

30
For objective 2, predictive variables which were reported in more than one study
were considered for further analysis in order to increase confidence in specific findings.
Information relating to these predictors of treatment response was synthesized qualitatively.
Consequently, a critical review of isolated variables (i.e. reported by only one study) was
deemed unsuitable owing to the limited information available.
2.5.11 Subgroup analysis and investigation of heterogeneity
Subgroup analyses were conducted to explore potential causes for heterogeneity.
When heterogeneity was identified in pooled effect estimates, the impact of children’s
chronological age (<48 months vs. >48 months), baseline IQ score (≤55 vs. 55.01-69.99 vs.
≥70), IBI treatment model (UCLA model vs. general non-UCLA IBI model), and the study
design (controlled comparisons vs. uncontrolled before-and-after studies) was examined in
subgroup analyses. These explanatory variables, however, were selected post hoc as a result
of insufficient familiarity of the clinical diversity which may impact treatment response
during the early stages of the review process. Due to the small number (<10) of relevant
studies for some outcome measures, subgroup analyses were deemed inappropriate.
2.5.12 Sensitivity analysis
No sensitivity analyses were conducted as part of any meta-analyses.

31
CHAPTER III: RESULTS
The previous chapter provided a detailed outline of the methods used in the conduct
of this systematic review and meta-analysis.
The current chapter presents the results of the systematic review of literature and
meta-analysis relating to the effectiveness of IBI in preschool and school age children with
an ASD. A qualitative synthesis of included studies is followed by as assessment of the
methodological quality of the evidence and the results of the various meta-analyses.
Findings relating to predictors of treatment response are also presented.
3.1 Description of studies
A detailed overview of the characteristics of studies included in this review can be
found in Appendix 4, and a detailed summary of findings in Table 5 of Appendix 5.
3.1.1 Results of the search
A total of 6,512 citations were identified through electronic database searching, and
an additional 46 records were identified from grey literature sources. Following the
removal of duplicate records, the titles and abstracts of 4,648 citations were screened, and
4,474 records were subsequently excluded. A total of 174 articles were assessed in full-text,
149 of which were excluded (κ=0.74), and hand-searching of reference lists of selected
review articles identified one additional relevant record. Ultimately, 26 papers describing
24 unique studies were selected for inclusion in the final qualitative synthesis. Pooling of
data for meta-analysis was possible for 17 studies which reported complete pre- and post-
intervention measures of cognitive level and adaptive skills, and these studies are included

32
in the quantitative synthesis. Figure 1 outlines the study selection process through a
PRISMA flow diagram, including reasons for exclusion of full-text articles.
3.1.2 Characteristics of included studies
Table 1 presents a brief overview of the characteristics of included studies.
Study location, sponsorship and design
There were a total of 24 unique studies included in this review which examined the
efficacy or effectiveness of IBI in preschool and school age children with an ASD. Of
these, eight were conducted in the United States,(69–77) six were conducted in
Canada,(78–83), five in Israel,(84–88) three in the UK,(89–91) and one each in Norway
(92,93) and Spain (94). Sources of funding varied considerably between and within the
different jurisdictions. Namely, four studies received sponsorship from national funding
bodies, including the National Institutes of Health (NIH),(92,93) the Health Foundation
UK,(91) as well as independent grants from the National Institute of Mental Health
(NIMH).(69,74,90) Two studies conducted in Israel received funding support from the
country’s Ministry of Education,(84,87) and one Canadian study was funded by the
Ministry of Child and Youth Services in the province of Ontario.(78,81) Moreover, there
were three university-funded studies, including two Canadian studies which received
sponsorship from York University in Toronto,(82,83) and one US study which reported the
UCLA Department of Education and Regents Scholar Society as a funding source. Another
Canadian study was funded by the Regional Autism Programs of Ontario Network
(RAPON), and two studies conducted in Israel were privately sponsored (Mr. Dov
Moran).(85,88) The remaining nine studies did not disclose any funding sources.(80,70–
73,76,77,86,89,94)

33
Figure 1. PRISMA flow diagram
Records identified through database searching
(n = 6,512)
Scre
enin
g In
clu
ded
El
igib
ility
Id
enti
fica
tio
n
Additional records identified through other sources
(n = 46)
Records after duplicates removed (n = 4,648)
Records screened (n = 4,648)
Records excluded (n = 4,474)
Full-text articles assessed for eligibility
(n = 174)
Full-text articles excluded, with reasons
(n = 149) 40 Not full, published journal article 13 Non-English publication 3 Duplicate publication 60 Not primary research 6 SSD or multiple non-consecutive case reports 1 No ASD diagnosis 16 Treatment not intensive or comprehensive 8 Treatment not administered by trained/qualified therapist 2 Non-objective outcome measures
Studies included in qualitative synthesis
(n = 26)
Studies included in quantitative synthesis
(meta-analysis) (n = 17)
Additional records selected through hand-searching
(n = 1)
Total records identified (n = 6,558)

34
Table 1. Brief overview of characteristics of included studies.
First author, year (Ref. No.) Country Sponsorshipi Design
Sample sizeiv Timing of assessment
(standardized instrument)
Diagnosisii Typeiii EG CG IQ AB
Ben-Itzchak, 2007 (84) Israel Ministry of
Education Autism BA 25 – Pre/post NR
Ben-Itzchak, 2009 (85) Israel Private support Autism BA 68 – NR NR
Ben-Itzchak, 2014 (86) Israel – ASD BA 46 – Pre/post Pre/post
Blacklock, 2014 (82) Canada York University Autism/autistic disorder (55%), PDD or
ASD (38%), PDD-NOS (7%) BA 68 – Pre/post Pre/post
Cohen, 2006 (69) USA NIMH Autism (83%), PDD-NOS (17%) NRCT 21 21 Pre/post
(partial)
Pre/post
(partial)
Eikeseth, 2002, 2007 (92,93) Norway NIH Autism NRCT 13 12 Pre/post Pre/post
Eikeseth, 2009 (89) UK – Autism BA 20 – Pre/post Pre/post
Flanagan, 2012 (79) Canada RAPON Autism (50%), PDD-NOS (50%) NRCT 61 61 Post Pre/post
Freeman, 2010 (80) Canada – Autistic disorder (61%), PDD-NOS (31%),
PDD or ASD (8%) BA 89 – Pre/post Pre/post
Granpeesheh, 2009 (70) USA – Autistic disorder (93%), PDD-NOS (7%) BA 245 – NR NR
Harris, 2000 (71) USA – Autistic disorder BA 27 – Pre/post NR
Hayward, 2009 (90)v UK NIMH Autism UCT 23 Pre/post Pre/post
21
Howard, 2005, 2014 (72,73)vi USA – Autistic disorder, PDD-NOS NRCT 29 16 Pre/post Pre/post
16

35
Table 1. (continued)
First author, year (Ref. No.) Country Sponsorshipi Design Sample sizeiv Timing of assessment
(standardized instrument)
Diagnosisii Typeiii EG CG IQ AB
Perry, 2008, 2011 (78,81) Canada MCYS Autistic disorder (58%), PDD or ASD
(28%), PDD-NOS (14%) BA 332 – Pre/post Pre/post
Perry, 2013a (83) Canada York University Autistic disorder, PDD-NOS, ASD BA 207 – Pre Pre
Perry, 2013b (83)vii Canada York University Autistic disorder, PDD-NOS, ASD UCT 60 – Pre/post Pre/post
60 –
Remington, 2007 (91) UK Health
Foundation Autism NRCT 23 21 Pre/post Pre/post
Sallows, 2005 (74)viii USA NIMH Autism UCT 13 – Pre/post Pre/post
10 –
Smith, 2000 (75) USA
Department of
Education &
UCLA Regents
Autism (50%), PDD-NOS (50%) RCT 15 13 Pre/post Pre/post
Stoelb, 2004 (76) USA – Autism BA 19 – NR Pre
Virues-Ortega, 2013 (94) Spain – ASD BA 24 – Pre/post NR
Weiss, 1999 (77) USA – Autism (90%), PDD-NOS (10%) BA 20 – NR Pre/post
Zachor, 2007 (87) Israel Ministry of
Education Autism, PDD-NOS NRCT 20 19 Pre NR
Zachor, 2010 (88) Israel Private support Autism NRCT 45 33 Pre/post Pre/post
iNIMH: National Institute of Mental Health; NIH: National Institutes of Health; RAPON: Regional Autism Programs of Ontario Network; MCYS: Ministry of Child and Youth Services. iiASD:
autism spectrum disorder; PDD: pervasive developmental disorder; PDD-NOS: pervasive developmental disorder – not otherwise specified. iiiBA: before-and-after study (one-group pre-post
design); NRCT: non-randomized controlled trial (multiple-group comparison); UCT: uncontrolled trial (multiple-group comparison); RCT: randomized controlled trial. ivEG: experimental/
treatment group; CG: control and/or comparison group. vEG1: Clinic-based; EG2: Parent-managed. viCG1: Autism educational programming (AP); CG2: Generic educational programming (GP). viiEG1: Younger (2-5 yrs.) group; EG2: Older (6-14 yrs.) group. viiiEG1: Clinic-directed; EG2: Parent-directed.
Note: “–” signifies not reported or not applicable.

36
Participant characteristics
There were a total of 1,816 participants across the included studies. Of the
participants, 1,604 (88%) received active treatment (IBI), and 212 (12%) received no
treatment or treatment as usual (TAU; i.e. special education services, eclectic therapy, etc.).
The smallest study in this review had 19 participants,(76) while the largest reported 332
participants.(78,81) The mean chronological age (CA) at intake across all participants
spanned 25 months (2.1 years) to about 90 months (7.5 years), with the majority being boys
(range 70% to 95%). Studies conducted in Israel reported the youngest participant samples,
with a mean CA ranging from 25.1 to 27.7 months at intake.(84–88) Conversely, some of
the oldest participants came from two Canadian studies: the mean CA of participants at IBI
program entry in studies by Blacklock et al. (2014) and Perry et al. (2013b) was 88.81
months and 89.4 months, respectively.(82,83) Considerable overlap in participant data may
exist between these two studies given that the study sample described by Perry et al.
(2013b) was fully drawn from the Perry et al. (2008, 2011) and Blacklock (2014) studies.
Although there was considerable variability in participants’ age at baseline between the
selected studies, there were, on average, more studies with participants aged below 48
months (14 studies),(79,69,72–75,77,84–91) as compared with children above 48 months of
age at intake (10 studies).(78,80,81,70,71,76,82,83,92–94) In addition, the mean intake CA
range among participants receiving UCLA-based IBI (30.2 to 66.31 months) was much
narrower than the age range of participants following non-UCLA-based treatment (25.1 to
89.4 months).
Initial level of cognitive functioning was assessed among participants in 19 studies,
and the mean pre-treatment IQ standard scores ranged from 36.7 to 76.1 for children in

37
active treatment groups and from 50.69 to 79.6 for children receiving TAU or no treatment
(7 studies). Five studies did not report baseline IQ scores.(79,70,76,77,85) Moreover, three
studies specified an IQ inclusion criterion. In Cohen et al. (2006), children with autism had
to have a pre-treatment IQ greater than 35, while participants in studies by Eikeseth et al.
(2002, 2007) were required to have an IQ greater than 50 at intake. Similarly, Smith et al.
(2000) study participants had to have a ratio IQ score between 35 and 75 at treatment entry.
Many participants across studies did not have any comorbid conditions or genetic
disorders in addition to their ASD diagnosis. In fact, the presence of such diagnoses was
used as an exclusion factor for recruitment in 50% of the included studies.(69,72–75,84,86–
93) For instance, Eikeseth et al. (2002, 2007) and Smith et al. (2000) specified the absence
of major medical problems other than autism as an inclusion criterion, and Ben-Itzchak et
al. (2014) excluded any children with hearing deficiencies and genetic syndromes.
Similarly, Remington et al. (2007) restricted participation only to those children who did
not have any other chronic or serious medical conditions that might interfere with treatment
delivery or that might adversely affect development.
Notwithstanding the narrow inclusion criteria applied in certain studies, participants
across all studies had one of the following autism spectrum diagnoses: autism/autistic
disorder, autism spectrum disorder (ASD), pervasive developmental disorder – not
otherwise specified (PDD-NOS), PDD or ASD. Studies which included participants of
varying diagnoses on the autism spectrum commonly specified the distribution of diagnoses
within the study sample. Moreover, diagnoses were made by an independent psychologist
or qualified clinician based on DSM-IV/DSM-IV-TR, DSM-III-R, or ICD-10 classification,
and were confirmed using one or more standardized tools for diagnosis, including the

38
Autism Diagnostic Interview – Revised (ADI-R), the Autism Diagnostic Observation
Schedule (ADOS), or the Childhood Autism Rating Scale (CARS). Table 2 in Appendix 4
highlights the variability in diagnoses among study participants within and between studies,
as well as the difference in choice of diagnostic label used across studies.
Intervention characteristics and delivery format
The instructional model and delivery format of interventions varied measurably
across the included studies; yet, the intervention content was generally comparable.
Seventeen samples (71%) received IBI based on a general early intervention model, while
seven samples (23%) received treatment based on the UCLA Young Autism Project (YAP)
model (also referred to as the Lovaas model). Although both instructional models are
essentially rooted in the same theoretical principles and science of applied behavioural
analysis (ABA), the UCLA YAP model is based wholly on a treatment manual and
teachings developed by Dr. O. Ivar Lovaas in the United States.
The intensity of interventions was primarily measured in weekly treatment hours
and ranged from an average of 20 to 40 hours per week across the study samples, with 9 of
24 samples (38%) reporting a mean treatment intensity of at least 30 hours per
week.(69,72–74,84,85,87,89,90,94) However, information on treatment intensity was not
always provided in a clear and consistent manner across studies. For instance, whereas
several study authors reported the precise range and mean treatment hours per week
received by study participants (as measured during study enrolment), other authors merely
reported an estimate of average weekly treatment hours(77,84) or an approximate intensity
range,(78,80,81,69,72,73,82,83) and one author reported intensity in terms of mean hours

39
per month.(70) In addition, several studies noted a reduction in treatment hours for certain
age groups,(69,92,93) or a reduced treatment intensity following a specified time period
after treatment onset.(74,75)
The mean duration of treatment with IBI varied from 12 months up to 48 months
across studies. Six samples (25%) received 12 months of intervention,(76,84,85,87,88,90)
while nine study samples (38%) received 24 months of treatment or greater.(79,69,73–
75,77,86,91,93) Participants of seven other studies followed a treatment program which
lasted variably between 12 and 24 months,(78,80–83,89,94) and two studies did not report
this information.(70,71)
Treatment providers across studies usually comprised a team of behaviour therapists
of varied qualifications, and often under the supervision of a Board Certified Behaviour
Analyst (BCBA), with or without auxiliary aides (speech-language pathologist,
occupational therapist, etc.). Therapists providing treatment under the UCLA YAP model
were additionally required to complete a mandatory 3- to 4-month training program at the
University of California, Los Angeles prior to treatment onset.(69) In addition to a team of
trained therapists, three studies included special education teachers in treatment
implementation,(86,88,92,93) and another two studies employed parents as active co-
therapists.(91,94) Furthermore, although detailed information concerning the role of
parents during intervention was not always provided across the included studies (see Table
3 in Appendix 4), parents received some form of training in 17 of 24 (71%) study samples.
Training provided to parents was generally focused on skill generalization and maintenance
procedures that could be implemented outside of regular treatment hours with the aim to
foster the child’s skill acquisition and development in the natural environment.

40
Therapy sessions were provided in a variety of settings including the participant’s
home or school, a designated treatment centre, or in the community. Namely, 10 of 24
(42%) samples were recipients of community- or centre-based intervention, and another
four (17%) and two (8%) study samples received intervention administered at home or at
school, respectively. For the remaining eight samples (33%), more than one setting was
used to implement therapy.
While there was great variability between studies with respect to the intensity and
duration of treatment, as well as the treatment providers and setting, variation in the
therapeutic techniques or content of the experimental intervention was less apparent. Since
UCLA-based IBI is a manualized treatment, its teaching methods were invariably described
as a combination of discrete trial training (DTT), natural environment teaching, and
incidental teaching across the relevant study samples.(69,74,75,89,90,92–94) Three UCLA-
based studies further specified that contingent aversives, as initially proposed by Lovaas,
were not employed as part of the intervention.(69,74,92,93) Studies which did not fully rely
on the UCLA YAP treatment manual frequently described similar teaching methods, with
reference to ABA as the source of behavioural teaching strategies. For instance, Ben-
Itzchak and Zachor (2009), Ben-Itzchak et al. (2014), and Zachor et al. (2007, 2010) quoted
the application of DTT, naturalistic, and incidental teaching techniques in addition to
several other procedures (shaping for positive reinforcement, successive approximation,
systematic prompting and fading procedures, etc.).(85–88) Similarly, Granpeesheh et al.
(2009) referred to the use of several structured and unstructured behavioural teaching
methods, as well as other strategies for behaviour modification (errorless prompting and
least-to-most prompting strategies, reinforcement, extinction, stimulus control,

41
generalization training, chaining and shaping, etc.).(70) Details of specific instructional
techniques were not always directly provided within the study articles; however, reference
to IBI program guidelines which explained the key features of the instructional approach
was provided in several publications.(78–83)
The concomitant use of other interventions with IBI was generally not employed
across the included studies. However, Harris and Handleman (2000) noted that some
families sought occupational and/or physical therapy for their child outside of IBI treatment
hours,(71) and Remington et al. (2007) mentioned that the Picture Exchange
Communication System (PECS) and Treatment and Education of Autistic and Related
Communication Handicapped Children (TEACCH) was used for some children in the
experimental group, in addition to speech therapy, dietary restrictions, routine prescription
medications, and vitamin injections.(91) Sallows and Graupner (2005) similarly reported
that some children within their sample received supplemental intervention before or during
the first year of IBI, including private therapies, speech therapy, sensory and auditory
integration training, music therapy, and horseback riding.(74) Lastly, the use of
supplementary dietary intervention was reported in about 40% of participants in the study
by Stoelb et al. (2004).(76) While other studies did not disclose the use of auxiliary
treatments prior to or during IBI, families were not prohibited from seeking such
treatments.
Control or comparison condition
There were a total of eight controlled multiple-group comparisons across the
included studies in this review, one of which applied a randomization procedure.(75) While

42
all eight studies compared the experimental treatment group with a group not receiving IBI,
the nature of the comparison or control conditions varied between study samples. Cohen et
al. (2006), for instance, employed a comparison group receiving various non-intensive
public school education classes and community services selected by parents, and described
the instructional methods used as ‘eclectic’.(69) Control group participants in the study by
Eikeseth et al. (2002, 2007) similarly received eclectic special education services
incorporating elements of TEACCH, sensory-motor therapies, ABA techniques, as well as
methods derived from personal experience; additionally, these services were provided at
about 20 to 35 hours per week, mirroring the treatment intensity of the study’s experimental
group.(92,93) In contrast, Remington et al. (2007) control participants received treatment as
usual (TAU) whereby parents were not actively seeking behavioural intervention but were
instead receiving publicly-funded services offered by their Local Education Authority.(91)
Moreover, Smith et al. (2000) employed a parent training control group in which parents
applied treatment techniques described in the Lovaas manual with the aim to facilitate their
child’s skill acquisition. Control group children in studies by Zachor et al. (2007) and
Zachor and Ben-Itzchak (2010) followed a community-based eclectic-developmental (ED)
program based on the principles derived from several approaches (i.e. mainly from the
Developmental, Individual-Difference, Relationship-Based (DIR) model, but also
incorporating TEACCH and ABA strategies).(87,88) Unlike other controlled studies
identified in this review, Flanagan et al. (2012) was the first to employ wait-list controls,
that is participants not yet receiving IBI,(79) and the study by Howard et al. (2005, 2014)
was the only one which used two comparison arms, one based on an intensive eclectic
approach (autism educational programming), and another consisting of less intensive public

43
early intervention programs (generic educational programming) provided through local
community special education classrooms.(72,73)
Although three additional multiple-group comparisons which addressed the research
questions of this review were identified in the literature, these studies were not deemed to
be controlled comparisons since all participants received some form of experimental
intervention. Sallows and Graupner (2005) and Hayward et al. (2009) both compared two
different service coordination models of the same UCLA-based intervention; namely, one
group received a clinic-directed IBI program while services provided to the other treatment
group were directed or managed by parents, meaning that intensive supervision was
provided by program consultants while the tutoring staff or therapists were recruited and
managed by parents.(74,90) Conversely, Perry et al. (2013b) conducted a retrospective
matched-pairs before-and-after study exploring differences in response to IBI within a
younger (2-5 years) and older (6-14 years) age group, both of which received the same
government-funded experimental treatment.(83)
Outcomes assessed
Included studies typically considered multiple primary and/or secondary outcomes
of interest. Most notably, there were 21 studies which measured change in full-scale
IQ,(78–81,69,71–75,82–94) 19 studies which measured adaptive behaviour,(78–81,69,72–
77,82,83,85,86,88–93), and 17 studies measured both change in full-scale IQ and adaptive
behaviour.(69,72,74,75,78–80,82,83,85,86,88–93) Receptive and/or expressive language
ability was the next most commonly measured outcome, as reported by 10 studies. (69,72–
76,84,89–92) The rationale for the choice of outcome measures was generally lacking, and

44
the instruments used frequently varied across and within studies. In addition, the use of
standardized instruments or tools in assessing similar constructs was often inconsistent
from participant to participant as well as from baseline to follow-up. This was especially
true in the assessment of cognitive functioning which often consisted of using several
different IQ tests for participants of the same sample from pre- to post-intervention. Table 4
in Appendix 4 details the specific outcome measures and associated instruments used
across the included studies.
In addition to the commonly applied standardized measures of assessment, some
study authors chose to administer non-validated measures or tools developed specifically
for their study sample. For example, Ben-Itzchak and Zachor (2007) administered the
developmental-behavioural scales (DBS) to assess several functioning domains such as
imitation, verbal and non-verbal communication, play skills, and stereotyped
behaviours.(84) Stoelb et al. (2004) similarly developed and applied an EIBI Performance
Scale (EPS) to retrospectively measure comparable domains of functioning,(76) and
Granpeesheh et al. (2009) and Weiss (1999) measured the number of monthly mastered
behavioural objectives and mastery of initial skills, respectively, among study participants
using pre-defined mastery criteria.(70,77) Furthermore, there were four studies which
identified academic or classroom placement as an outcome measure,(69,71,75,77) despite
the highly contested nature of this measure due to concerns that it may reflect factors such
as parent advocacy and school policy rather than the child’s functioning. Because it can be
potentially misleading to draw inferences from the pooled results of such measures or other
isolated measures across the included studies, data were not aggregated across these
measures in the meta-analysis.

45
On the whole, outcome measures were assessed immediately following treatment
discharge or at multiple time points within the study time frame in the case of repeated
measures studies. Long-term outcome data, that is, assessments extending beyond 48
months, were not reported in any of the included studies.
3.1.3 Procedural fidelity
The analysis of procedural fidelity according to the conceptual systems proposed by
Perpletchikova and Kazdin (2005) and Gresham (2005) revealed mixed results (refer to
Table 4 in Appendix 4). Of the 24 selected review studies, only 14 samples (58%)
employed procedures and/or measures to ensure or document treatment integrity.(78,69,73–
77,86,88–94) In measuring treatment adherence, 3 of 14 studies used direct measures, 11
studies used indirect measures, and 9 studies used a treatment manual. While studies
reporting on the use of a manual to guide treatment implementation provided a reference to
the specific manual(s) used, there was no independent verification that manuals were used
or not used as intended. Treatment differentiation could only be measured for the eight
controlled comparative studies; four of these assessed treatment differentiation using
indirect measures while one study used direct measures and three others did not report
measures of treatment differentiation. Therapist competence was measured in 13 of 24
studies; eight studies assessed therapist competence using direct measures and five studies
used indirect measures. Among the ten studies which did not appear to evaluate the degree
to which IBI was implemented as intended,(79,80,70,71,82–85,87) seven were before-and-
after studies with no control group, and 6 of 10 studies reported a retrospective design.
Indeed, the assessment of treatment integrity was more common among controlled
comparative studies than those with no control group, with 75% of controlled studies

46
employing procedural fidelity measures, as compared with only 50% of studies with an
uncontrolled before-and-after design.
3.1.4 Excluded studies
Of those studies for which full-text articles were retrieved, 149 were excluded from
this review. Excluded studies comprised 60 papers which were not deemed as original,
primary research publications, 40 papers which were not full published journal articles, 13
papers published in a language other than English, eight papers in which treatment was not
administered by trained staff or qualified therapists, six papers reporting a single subject
design (SSD) or multiple non-consecutive case reports, three duplicate publications, two
studies which did not use an objective outcome measure, and one study whose participants
did not have an ASD diagnosis. A detailed list of these articles and corresponding reasons
for exclusion is presented in Appendix 2.
3.2 Risk of bias in included studies
Methodological quality scores across the 24 included studies, using the modified
Downs and Black checklist (Table 7), ranged from 7 to 21 points (mean=15.29, SD=3.42).
In other words, included studies attained 25% to 75% of the maximum quality score (28
points). Based on the scoring cut-offs reported in a recent systematic review by Pereira et
al. (2015) which assessed study quality on a 28-point scale using a simplified version of the
Downs and Black checklist,(95) only two of the included studies in this review were
assessed to be of high quality, scoring 20 or more points.(74,92,93) Conversely, 17 studies
scored less than 20 points and were considered to have a moderate risk of bias,(78–
81,69,71–73,75,76,83,84,86,88–91,94) while five additional studies scored less than 13

47
points and were deemed to be of poor quality.(70,77,82,85,87) The results of individual
items of the quality assessment checklist are presented in Table 8 of Appendix 6.
Assessment of results by methodological quality domains revealed that major
concerns across studies were associated with external validity, internal validity
(confounding), and statistical power, while the reporting and internal validity (bias)
domains contributed to a lesser extent to the overall risk of bias between and within studies.
More specifically, only five studies (21%) provided sufficient information on the
recruitment of participants to inform the representativeness of the study sample (item 11),
three of which further cited the representativeness of subjects who were willing to
participate in the study (item 12); the implementation of the intervention was deemed to be
representative of that in use in the source population in 67% of the included studies (item
13). Although randomization of participants and concealment of treatment allocation (items
23, 24) were only possible for the eight controlled comparison studies, only one applied
randomization procedures and none of the studies concealed intervention assignment from
staff. Furthermore, it was generally unclear whether participants had been recruited over the
same time period (item 22), and only 13 of 24 studies (54%) used intention-to-treat analysis
(item 25). With the exception of one study, none of the included studies performed a power
estimation or provided a justification for the number of recruited participants (item 27); as a
result, it was difficult to assess whether study samples were sufficiently powered to detect a
clinically relevant treatment effect, and the validity of inferences made based on small
samples reported across many of the included studies remains questionable. Finally, while
most studies fared relatively well on items relating to reporting and internal validity (bias),
none of the included studies made an effort to report potential adverse events associated

48
with the intervention (item 8), and none of the participants across studies were blinded to
the intervention they received (item 14). The risk of bias from lack of blinding of study
participants, however, was difficult to prevent owing to the nature of the intervention which
demands a high frequency and regularity of interaction between participants and study
personnel.
In considering each of the five quality domains on a scale of 0 to 1 points such that
checklist domains containing more items (e.g. reporting) are not over-represented, the mean
quality score across the included studies (of a possible maximum of 5) was 2.1±0.7 (range
0.7 to 3.7). On average, studies tended to score higher in the reporting (0.7 out of 1.0) and
internal validity – bias (0.6) domains, as opposed to external validity (0.3), internal validity
– confounding (0.4), and power (0.0). If the scoring cut-offs from the 28-point quality
assessment scale were to be transformed onto the 5-point scale, 18 of 24 studies (75%)
would be rated as low quality, while five (21%) and one (4%) studies, respectively, would
be regarded as moderate and high quality studies. This shift toward an apparent reduction in
overall quality among included studies as a result of attributing equal importance to each of
the quality domains of the modified checklist is likely due to the general lack of reporting
of a power estimation across all studies and the considerable weight this domain carries on
a 5-point rating scale. The results by domain of the quality assessment checklist are
presented in Table 9 of Appendix 6.
3.3 Effects of intervention
3.3.1 Cognitive functioning (IQ)
Cognitive functioning or intelligence (IQ) was measured before and after IBI
implementation in 13 of 24 studies (78,71,72,74,75,82,84,86,89–94); results of these

49
studies were synthesized in a random-effects meta-analysis using the standardized
difference in means (SMD) effect size with small sample correction.(66) The eleven studies
which were not included in the meta-analysis comprised four studies which reported partial
outcome data, that is, either only pre-intervention or only post-intervention IQ
scores,(79,69,83,87) two studies which did not report full-scale IQ scores (MSEL
subdomain scores only),(85,88) as well as three studies which did not measure change in
IQ among the study participants(70,76,77). In addition, two Canadian studies by Freeman
and Perry (2010) and Perry et al. (2013b) were also excluded from the meta-analysis due to
risk of double-counting of participant data (80,83); namely, participant data for the study by
Freeman and Perry (2010) were entirely drawn from a previously published study by Perry
et al. (2008),(78) and the study sample reported in Perry et al. (2013b) overlapped with
participant data reported in Perry et al. (2008) and Blacklock et al. (2014).(78,82)
The SMD effect size across studies for change in IQ, covering a total of 492
participants, was 0.66 (95% CI 0.46 to 0.85, p<0.00001). There was evidence of moderate
statistical heterogeneity, as suggested by the I2 statistic (40%). In addition, the statistically
significant Q-statistic (Q(12)=20.08, p=0.07) indicated that there was definite heterogeneity
between the 13 included studies. Accordingly, the influence of heterogeneity on the pooled
effect size estimate was further explored through subgroup analysis. Figure 2 shows the
effect of IBI on children’s IQ for the included studies.
Findings from the subgroup analyses (see Figure 8, Figure 9, Figure 10, Figure 11
in Appendix 7) suggested that the effects of intervention tended to be stronger for UCLA-
based IBI programs (UCLA model: ES=0.94, 95% CI 0.65 to 1.22, p<0.00001; general IBI
model: ES=0.51, 95% CI 0.27 to 0.76, p<0.0001), as well as for participants aged less than

50
48 months (age <48 months: ES=0.74, 95% CI 0.52 to 0.96, p<00001; age >48 months:
ES=0.55, 95% CI 0.23 to 0.88, p<0.007), and for participants who had a mean baseline IQ
score of 70 or higher (intake IQ≥70: ES=0.74, 95% CI 0.15 to 1.33, p<0.01; intake IQ
55.01 to 69.99: ES=0.69, 95% CI 0.32 to 1.05, p<0.0002; intake IQ ≤55: ES=0.64, 95% CI
0.35 to 0.92, p<0.0001). In addition, intervention effects tended to be higher among
controlled comparisons (ES=0.81, 95% CI 0.46 to 1.16, p<0.00001), as compared with
before-and-after uncontrolled studies (ES=0.62, 95% CI 0.38 to 0.87, p<0.00001).
Figure 2. Forest plot of comparison: IBI vs TAU, outcome: 1.1 IQ
Visual inspection of the funnel plot of the standard error as a function of the effect
size (SMD) of each study revealed substantial asymmetry (see Figure 7 in Appendix 7),
suggesting the potential for the presence of publication bias. Given that the majority of
smaller studies clustered to the right of the mean, it appears as though smaller studies
tended to report larger effects of treatment on children’s cognitive functioning; however,
small study effects must be interpreted with caution in the absence of an objective measure
of publication bias.

51
3.3.2 Adaptive behaviour
Twelve of 24 selected review studies measured adaptive skills before and after
intervention using the Vineland Adaptive Behaviour Scales (VABS)
(79,72,74,75,77,82,86,88–93); results of these studies were combined in a random-effects
meta-analysis using the SMD effect size with small sample correction.(66) Study results
were pooled separately for the adaptive behaviour composite measure (11 studies) and each
of the VABS subdomains (8 studies). The twelve studies whose data were not aggregated
across this effectiveness measure comprised three studies reporting partial outcome data
(i.e. some or no post-intervention adaptive scores),(69,76,83) and six studies did not
measure adaptive functioning among study participants or report data in a meaningful way
(70,71,84,85,87,94). Three studies conducted in Canada (Freeman and Perry, 2010; Perry et
al. (2008); Perry et al. (2013b)) were excluded due to risk of double-counting participant
data resulting from overlap between study samples: participant data reported in Freeman
and Perry (2010) and Perry et al. (2008) overlapped with the controlled study by Flanagan
et al. (2012),(79) and the study sample reported in Perry et al. (2013b) overlapped with
participant data reported in studies by Blacklock et al. (2014) and Perry et al. (2008).
Furthermore, one non-randomized trial by Zachor and Ben-Itzchak (2010) only reported
VABS subdomain scores without a composite measure of adaptive skills; as a result, it was
excluded from the meta-analysis assessing change in the adaptive behaviour composite, but
its data were used when examining the pooled effects of intervention on each of the VABS
subdomains. Conversely, Flanagan et al. (2012) only reported pre- and post-intervention
standard scores for the adaptive behaviour composite; thus, it was excluded from meta-
analyses of the three VABS subdomains.

52
VABS Adaptive Behaviour Composite
The SMD effect size across studies for change in adaptive behaviour composite,
covering a total of 428 participants, was 0.57 (95% CI 0.33 to 0.82, p<0.00001). There was
evidence of moderate statistical heterogeneity, as suggested by the I2 statistic (50%). In
addition, the statistically significant Q-statistic (Q(10)=20.00, p=0.03) indicated that there
was definite heterogeneity between the 11 included studies. Accordingly, the influence of
heterogeneity on the pooled effect size estimate was further explored through subgroup
analysis. Figure 3 shows the effect of IBI on children’s adaptive behaviour composite score
for the included studies.
Figure 3. Forest plot of comparison: IBI vs TAU, outcome: 1.2 VABS Composite
Findings from the subgroup analyses suggested that the effects of intervention
tended to be slightly stronger for UCLA-based IBI programs (UCLA model: ES=0.60, 95%
CI 0.21 to 1.00, p<0.003; general IBI model: ES=0.56, 95% CI 0.22 to 0.90, p<0.001), and
much stronger for participants 48 months of age and older (age >48 months: ES=0.97, 95%
CI -0.17 to 2.11, p<0.09; age <48 months: ES=0.52, 95% CI 0.26 to 0.78, p<0.0001), as
well as for participants who had a mean baseline IQ score between 55 and 70 (intake

53
IQ≥70: ES=0.06, 95% CI -0.40 to 0.52, p<0.81; intake IQ 55.01 to 69.99: ES=0.96, 95% CI
-0.26 to 2.17, p<0.12; intake IQ ≤55: ES=0.50, 95% CI 0.27 to 0.74, p<0.0001). However,
findings from the subgroup analyses which favoured older age and a moderately low IQ
were not statistically significant. Moreover, intervention effects tended to be somewhat
higher among controlled studies (ES=0.61, 95% CI 0.24 to 0.99, p<0.001), as compared
with before-and-after uncontrolled studies (ES=0.55, 95% CI 0.19 to 0.91, p<0.003).
The funnel plot of the standard error as a function of the SMD effect size of each
study was noticeably asymmetric (see Figure 12 in Appendix 7), with several smaller
studies clustering to the right of the mean. Although publication bias may be present based
on visual impression, an objective measure of small study effects is required to confirm the
validity of this inference.
VABS Communication
The SMD effect size across studies for change in daily communication skills,
measured using the VABS communication domain and covering a total of 315 participants,
was 0.45 (95% CI 0.13 to 0.76, p<0.005). Although there was evidence of substantial
statistical heterogeneity between the eight studies, as indicated by the I2 statistic (57%) and
the statistically significant Q-statistic (Q(7)=16.23, p=0.02), the small number of studies
included in the meta-analysis precluded any further investigation of the influence of
heterogeneity on the pooled effect size estimate. Figure 4 shows the effect of IBI on
participant’s communication skills for the included studies.

54
Figure 4. Forest plot of comparison: IBI vs TAU, outcome: 1.3 VABS Communication
VABS Daily Living Skills
The SMD effect size across studies for change in daily living skills, measured using
the VABS daily living skills domain and covering a total of 315 participants, was 0.27
(95% CI 0.01 to 0.52, p<0.04). Although there was evidence of possible statistical
heterogeneity between the eight included studies, as indicated by the I2 statistic (38%) and
the Q-statistic (Q(7)=11.24, p=0.13), the small number of studies included in the meta-
analysis did not allow for any further exploration of the influence of heterogeneity on the
pooled effect size estimate. Figure 5 shows the effect of IBI on participant’s daily living
skills for the included studies.
Figure 5. Forest plot of comparison: IBI vs TAU, outcome: 1.4 VABS Daily Living Skills

55
VABS Socialization
The SMD effect size across studies for change in socialization skills, measured
using the VABS socialization domain and covering a total of 315 participants, was 0.35
(95% CI 0.01 to 0.70, p<0.05). Although there was evidence of substantial statistical
heterogeneity between the eight included studies, as indicated by the I2 statistic (64%) and
the statistically significant Q-statistic (Q(7)=19.69, p=0.006), the small sample of studies
included in the meta-analysis prevented further investigation of the influence of
heterogeneity on the pooled effect size estimate. Figure 6 shows the effect of IBI on
participant’s communication skills for the included studies.
Figure 6. Forest plot of comparison: IBI vs TAU, outcome: 1.5 VABS Socialization
3.3.3 Intervention effects among studies excluded from meta-analysis
A total of 11 of 24 studies selected for inclusion in this review were not synthesized
quantitatively in a meta-analysis estimating the effects of treatment with IBI on cognitive
functioning or IQ. These studies were excluded for various reasons, including the reporting
of partial outcome data which did not permit the calculation of a standardized mean
difference effect size,(79,69,83,87) the absence of participant IQ assessment (3 studies) or
the lack of reporting of full-scale IQ scores,(70,76,77,85,88) as well as overlap of
participant data between studies.(80,83)

56
Of the eight studies which measured therapeutic progress using IQ, four were non-
randomized controlled comparisons while the remainder did not have a control group.
Findings related to change in IQ following IBI treatment reported in these studies were
generally consistent with the magnitude and direction of the previously reported pooled
effect estimate for cognitive functioning. Namely, Cohen et al. (2006) reported a 25-point
mean increase in IQ score among participants in the experimental group, as compared with
an increase of only 14 points in the control group over a 36-month follow-up period. A
significant difference in IQ scores of about 19 points was observed between the treatment
and control group in the study by Flanagan et al. (2012) after about 28 months of treatment,
with results favouring the IBI group over the wait-list controls. Moreover, Freeman and
Perry (2010) noted an increase in about 11 IQ points among a subset of their study sample
(n=20) which had complete information on participants’ cognitive levels at intake and
discharge, and Perry et al. (2013b) observed that younger participants (2-5 years) made
average gains of about 17 IQ points at treatment exit, as compared to a mere 2-point
improvement in mean IQ scores among the older group aged 6-14 years; both studies
followed children’s progress in an IBI program over a mean course of about 20 months. In
contrast to studies showing a positive effect of IBI on the cognition of preschool-aged
children, there was one controlled comparison by Zachor and Ben-Itzchak’s (2010) which
did not observe a significant change in cognitive abilities between the treatment and control
groups following 12 months of school-based IBI therapy. Finally, the effect of IBI on
cognitive functioning was unclear in studies by Ben-Itzchak and Zachor (2009), Perry et al.
(2013a), and Zachor et al. (2007) given that change in IQ from intake to the last follow-up
was not explicitly measured; rather, IQ was treated as an independent or predictive variable
in these analyses.

57
Similarly to the meta-analysis which measured the effect of IBI on the cognitive
performance of children with ASD, there were 12 of 24 selected review studies which did
not contribute any data to the pooled effect estimates regarding adaptive behaviour
composite or associated VABS domains. Reasons for exclusion comprised the reporting of
partial outcome data which precluded the estimation of the SMD statistic, (69,76,83) the
absence of a full assessment of adaptive functioning or the lack of meaningful reporting of
data relating to participants’ overall adaptive skills, (70,71,84,85,87,94) as well as overlap
of participant data between study samples. (78,80,83)
Of the six studies which measured therapeutic change between and within
participants using the Vineland Adaptive Behaviour Scales, only two studies were
controlled comparisons while the rest did not have a control group. Findings relating to a
functional change in adaptive skills following IBI were mixed across these studies; yet,
results generally followed the direction of the previously reported pooled treatment effect
size for the VABS composite and weighted mean effect sizes for the associated
subdomains. More specifically, Cohen et al. (2006) noted an average increase of 9 points in
VABS composite scores among the IBI treatment group, while participants in the
comparison group experienced a 4-point decline following three years of treatment;
significant and similar differences were also observed in each of the constituent scales with
the exception of VABS socialization where a non-significant trend was observed.
Moreover, Perry et al. (2008) found that while children who received IBI for a mean
duration of about 18 months improved significantly on all domains of adaptive functioning
(n=274), large gains were noted only in the VABS Age Equivalent scores, while
differences in VABS standard scores, which are corrected for age, were generally quite

58
small and only statistically significant for the VABS Communication and Socialization
subdomains. A similar trend was observed within a smaller sample of participants (n=81) in
the study by Freeman and Perry (2011) whereby improvement in adaptive functioning was
only significant in VABS Age Equivalent scores, as compared with standard scores which
remained fairly stable; this finding is perhaps not surprising given that participant data for
this analysis was drawn entirely from the Perry et al. (2008) study. Another uncontrolled
trial by Perry et al. (2013b) which examined treatment response of a matched sample of
younger (2-5 years) versus older (6-14 years) children during a course of 20 months of IBI
revealed that adaptive gains were more modest and were similar across groups (VABS
composite standard score increased by 5 points and by 4 points in the younger and older
group, respectively); age-equivalent scores at treatment exit were not reported. Finally, the
influence of IBI treatment on adaptive functioning was unclear in studies by Perry et al.
(2013a) and Stoelb et al. (2004) given that adaptive gains were not explicitly measured at
admission to IBI and following treatment discharge; rather, these studies treated measures
of adaptive behaviour as independent or predictive variables within the analysis.
3.3.4 Adverse events
No adverse events or deterioration on primary or secondary outcome measures were
reported as a result of treatment in any study.
3.4 Predictors of treatment response
A wide range of variables which appear to be related to varied outcomes across
study participants were examined statistically across 16 of 24 (67%) studies included in this
review,(79,81,70,71,74–76,82–86,89,90,92–94) while the remaining eight studies (33%)

59
did not explore any active ingredients of effective treatment.(80,69,72,73,83,87,88,91) A
total of five predictor variables were examined statistically across two or more studies; the
five predictors included cognitive functioning as measured by IQ (11 studies), children’s
chronological age at treatment onset (11 studies), adaptive functioning (7 studies), severity
of symptoms or psychopathology (4 studies), and treatment duration (2 studies). Table 6 of
Appendix 5 presents a summary of findings for each of the 16 studies reporting on
predictors of treatment response, detailing the specific predictor variables examined, the
observed associations, and whether or not findings were statistically significant. What
follows is a synthesis of the results by predictor variable.
Cognitive functioning (IQ). A total of 11 of 24 (46%) studies statistically examined IQ as a
predictor of treatment response.(81,71,74,75,82–86,90,92,93) Of these, nine studies found
significant associations between IQ at intake and various outcome measures. Harris and
Handleman (2000), for instance, found that children who had higher IQ scores at admission
to IBI were more likely to be placed in regular education classes at follow-up, as opposed
to special education (r=0.655, p<0.005).(71) A significant association was also present
between higher IQ at discharge and regular classroom placement at follow-up (r=0.779,
p<0.005), although this relationship seems somewhat intuitive. Blacklock et al. (2014)
observed a strong linear relationship between full-scale IQ at baseline and all follow-up
outcome variables, including full-scale IQ (r=0.65, p<0.01; n=63), mental age (r=0.64,
p<0.01; n=63), cognitive rate of development (r=0.49, p<0.01; n=61), adaptive behaviour
standard scores (r=0.66, p<0.01; n=49), adaptive behaviour age equivalent scores (r=0.70,
p<0.01; n=64), and adaptive rate of development (r=0.31, p<0.01; n=49).(82) Similar
relationships were also observed within two prospective uncontrolled multiple-group

60
comparisons by Hayward et al. (2009) and Sallows and Graupner (2005). While Hayward
et al. (2009) found that baseline cognition was significantly correlated with follow-up IQ
(r=0.66, p<0.01), visual-spatial or non-verbal IQ (r=0.60, p<0.01), and the composite
measure of adaptive behaviour (r=0.57, p<0.01), the authors also observed that correlations
between intake IQ and treatment gains (change scores) on all measures were non-
significant.(90) Sallows and Graupner (2005) further assessed the predictive power of IQ at
one year after IBI onset with three outcome variables (full-scale IQ, language, and social
skills) following three years of treatment and observed a significant positive relationship
between IQ after one year of IBI and full-scale IQ scores at the three-year treatment mark
(r=0.75, p<0.01).(74) It was unclear, however, whether the predictive modeling among
these uncontrolled trials was conducted using data from either the clinic-based or parent-
managed/parent-directed treatment group alone, or if correlations represented the
relationship between pre-treatment variables and outcomes for all study participants,
irrespective of group assignment. Furthermore, there were three studies which used various
analysis of variance methods to investigate the predictive utility of intellectual functioning
on treatment response.(84–86) Namely, Ben-Itzchak and Zachor (2007) found that children
belonging to a higher cognitive ability group (IQ≥70) showed greater progress in receptive
and expressive language, play skills, and non-verbal communication skills, as compared
with children in a low IQ (<70) group.(84) The same authors also found a significant
negative correlation between IQ and the ADOS reciprocal-social interaction measure (r=-
0.606, p<0.01), which suggested that higher IQ scores were more likely to result in fewer
deficits in social interaction skills. Ben-Itzchak et al. (2014) similarly examined differences
in treatment response among children belonging to high (DQ≥70) and low (DQ<70)
cognitive ability groups and found that while improvement in autism severity between the

61
two groups was not affected by baseline cognition, significant increases in the
communication, socialization, and daily living domains of adaptive functioning were noted
only in the higher cognitive ability group, whereas standard scores remained unchanged
among children with lower cognitive function. These authors also found that children with
lower cognitive functioning experienced gains in fine-motor and receptive language MSEL
subdomains, while decreases in standard scores on the same measures were observed in the
higher cognition group. Another study by Ben-Itzchak and Zachor (2009) compared
outcomes of children whose diagnostic classification (severity) remained the same after
treatment (i.e. unchanged group) with those of children who improved their diagnosis post
intervention (i.e. improved group); findings revealed only one significant trend: the
improved group had significantly better non-verbal and verbal scores on the MSEL
standardized measure as compared with the unchanged group. Furthermore, regression
modeling techniques were applied within two of the 11 studies which statistically examined
IQ as a predictor variable. Specifically, Perry et al. (2011) carried out a stepwise linear
regression for eight primary dependent variables at follow-up and found that baseline IQ
accounted for 53% of the variance in IQ at treatment discharge (Step 1 of regression) and
that baseline IQ accounted for a significant but small amount of incremental variance for
adaptive behaviour (∆R2=0.053, p<0.001) and disease severity (∆R2=0.074, p<0.001),
beyond that associated with the initial value of IQ.(81) These authors also showed that
there were significant and strong correlations between initial IQ and all outcome variables,
including full-scale IQ (r=0.73, p<0.01), adaptive behaviour composite (r=0.67, p<0.01),
and severity of symptoms (r=-0.42, p<0.01). Similarly, Perry et al. (2013a) carried out a
hierarchical multiple regression on data from 207 children enrolled in the Ontario IBI
program and found that baseline IQ, controlling for treatment duration, accounted for 59%

62
of the variance in IQ at follow-up (p<0.001) and that initial IQ accounted for a significant
and substantial proportion of variance in adaptive behaviour standard scores at follow-up
(∆R2=0.44, p<0.001).(83) Initial IQ did not however predict the magnitude in IQ gains (i.e.
change in IQ from baseline to follow-up), and while children with higher skill levels before
treatment tended to have higher skill levels after treatment, those who were higher
functioning cognitively were not the ones who necessarily made the largest IQ gains.
Finally, there were only two controlled comparison studies which assessed the predictive
value of IQ on treatment response. Eikeseth et al. (2007) found that intake IQ was strongly
and significantly associated with follow-up IQ (r=0.60, p<0.05) and adaptive behaviour
scores, except the socialization subdomain score on the VABS measure (AB composite:
r=0.58, p<0.05); similar correlations were found in the previous 2002 publication by the
same authors.(92,93) Although children with higher intake IQ were more likely to score
higher on follow-up outcome measures, the authors found that they did not tend to make
larger gains in IQ, language or adaptive scores. Conversely, Smith et al. (2000) did not find
baseline IQ to be reliably associated with full-scale IQ at follow-up and reported that IQ
was not significantly correlated with any other measured outcome variable.
On the whole, there is some evidence that higher baseline cognition may be
associated with better outcomes following treatment with IBI. However, there were only
three studies which statistically examined the relationship between baseline IQ scores and
IQ treatment gains (i.e. change in IQ from baseline to follow-up), while most other studies
explored the predictive utility of baseline IQ on post-treatment scores. Of those studies
which attempted to quantify the association between intake IQ and treatment gains (or

63
change scores at IBI discharge), findings were either non-significant or revealed that initial
IQ did not reliably predict the magnitude of IQ gains at follow-up.
Child Age. Eleven of the 24 (46%) included studies statistically examined child age at
intake as a predictor of treatment response.(79,81,70,71,76,82,83,85,90,92–94) Of these
studies, five reported children’s baseline chronological age as a significant predictor of
treatment outcome, while another six did not find a significant relationship between initial
age and various outcome measures. Studies which reported significant results consistently
identified younger age at entry to IBI as predictive of optimal treatment
response.(81,70,71,83,94) In particular, Perry et al. (2011) found that age at entry was
significantly negatively correlated with IQ (r=-0.39, p<0.01) and the adaptive behaviour
composite measure (r=-0.43, p<0.01) at treatment exit, suggesting that children who started
IBI younger tended to score higher at discharge on cognitive and adaptive assessments. The
authors also found that younger age at entry was correlated with milder autism severity at
exit (r=0.18, p<0.01), and findings from a stepwise linear regression analysis revealed that
age accounted for a significant, but very small amount of unique variance for IQ
(∆R2=0.063, p<0.001) and autism severity (∆R2=0.015, p<0.05), but made no contribution
to the adaptive behaviour composite score at follow-up. Moreover, findings from a
hierarchical multiple regression analysis by Perry et al. (2013a) conducted using data from
207 children aged two to 14 years (mean=5.33, SD=2.01) demonstrated that young age at
admission into IBI resulted in higher cognitive (but not adaptive) functioning at the end of
treatment, even after controlling for treatment duration and the child’s initial cognitive level
(∆R2IQ at T2=0.05, p<0.001; ∆R2
total=0.064, p<0.001). In this study, age at IBI entry was also
the only predictor that was related to change in IQ, that is, cognitive gains during

64
intervention. Granpeesheh et al. (2009) further demonstrated that there was a significant
linear relationship between the examined predictor variables (age and treatment intensity)
and the number of mastered behavioural objectives among children in three age groups
spanning two to 12 years; however, results of this study warrant careful interpretation given
the limitations associated with using mastered behavioural objectives as a measure of
therapeutic progress. Additionally, Harris and Handleman (2000) found that children who
were younger at admission to IBI were more likely to be placed in a regular education
setting at follow-up, as opposed to special education, than were children who were older at
intake (r=0.658, p<0.005); they also found that younger children had higher IQ scores at
discharge than those who entered at an older age (r=-0.401, p<0.025). Although these
findings are significant and lend support for early intervention, the validity of academic
placement as an outcome measure has been highly criticized and the true magnitude of the
relationship between initial age and discharge IQ is uncertain given the relatively young
age of the study sample (mean=49 months, range=31-65 months). The final analysis which
reported significant results regarding the predictive value of chronological age in estimating
response to treatment was conducted by Virues-Ortega et al. (2013) by way of multilevel
regression modeling; specifically, the authors found that age was the second most efficient
predictor in a two-predictor model (keeping intervention time as the first factor) in terms of
improving fit of the regression models for measures of gross motor function, receptive
language, self-care, and social behaviour.
In contrast to the aforementioned findings, there were five studies, including two
controlled comparisons by Eikeseth et al. (2002, 2007) and Flanagan et al. (2012), which
did not find an association between the age at which children started treatment and outcome

65
or amount of change in scores (79,76,82,85,92,93); however, these results were not
statistically significant. This is particularly striking for the study by Blacklock et al. (2014)
which found weak linear relationships between age at entry with outcomes at treatment
discharge among participants aged six to 14 years (88.81±21.94 months). Based on a
scatterplot analysis by the same authors, it is possible that there may be a curvilinear
relationship between child’s age at intake and treatment outcomes at follow-up given that
more variable outcomes were noted for the relatively younger children within the sample,
as compared with older children (>8 years) which had uniformly low and less variable
outcomes.
On the whole, the evidence suggests that younger age at intake, particularly
preschool age, may be associated with better outcomes following treatment with IBI.
Certain factors, however, limit the interpretability of the results, including the paucity of
significant associations found among controlled comparison studies.
Adaptive behaviour. A total of seven of 24 (29%) studies included in this review
statistically examined adaptive functioning at intake, measured using the VABS
standardized assessment, as a predictor of treatment response.(79,81,74,82,85,90,92,93)
Four of these studies found that adaptive functioning at treatment onset was a reliable
predictor of effective treatment, while three studies did not report statistically significant
results. Studies which reported significant results commonly suggested that higher initial
adaptive skills were associated with positive therapeutic progress.(79,81,82,90)
Specifically, Perry et al. (2011) found that initial Vineland adaptive behaviour composite
(ABC) scores were significantly and highly correlated with full-scale IQ at follow-up
(r=0.72, p<0.01), as well as follow-up VABS composite scores (r=0.77, p<0.01); baseline

66
ABC scores were also significantly negatively correlated with severity of symptoms at
treatment exit (r=-0.51, p<0.01). Results of a stepwise linear regression by the same authors
further revealed that initial ABC scores accounted for significant incremental variance in
IQ (∆R2=0.059, p<0.001) and autism severity (∆R2=0.118, p<0.001) at follow-up, beyond
that associated with the initial ABC value. Blacklock et al. (2014) observed similar
associations between intake adaptive skills and several measured outcomes within a sample
of school-age participants (mean age=88.81 months, range=70-163 months): VABS ABC
standard scores at intake were highly and significantly associated full-scale IQ (r=0.91,
p<0.01, n=61), mental age (r=0.84, p<0.01; n=61), cognitive rate of development (r=0.32,
p<0.05; n=61), ABC standard scores (r=0.75, p<0.01; n=45), ABC age equivalent scores
(r=0.75, p<0.01; n=60), and adaptive rate of development (r=0.71, p<0.01; n=46) at follow-
up. Furthermore, results of a hierarchical multiple regression analysis from a wait-list
controlled comparison study by Flanagan et al. (2012) showed that higher initial adaptive
skills, controlling for duration and initial age, contributed a large amount of variance across
groups (∆R2=0.262, p<0.001). Finally, Hayward et al. (2009) also found that baseline
adaptive skills were significantly correlated with all outcome measures (full-scale IQ at
follow-up: r=0.56, p<0.01; non-verbal IQ at follow-up: r=0.41, p<0.01; ABC at follow-up:
r=0.53, p<0.01); however, the authors found that correlations between intake ABC scores
and treatment gains (change scores at follow-up) were non-significant.
While the aforementioned analyses suggest that children with higher baseline
adaptive functioning may respond in a more favourable manner to IBI, as compared with
children with relatively lower adaptive skills at intake, three additional studies by Ben-
Itzchak and Zachor (2009), Eikeseth et al. (2007), and Sallows and Graupner (2005) found

67
that pre-treatment adaptive behaviour was not reliably associated with outcome or amount
of change in outcome measures (74,85,93); however, results of these analyses were not
statistically significant.
Although current evidence suggests that higher pre-treatment adaptive functioning
may be predictive of better outcomes following treatment with IBI, data on this topic are
limited. Additional predictive analyses are needed, especially from controlled studies, to
make reliable inferences regarding the impact of pre-treatment adaptive skills on treatment
response.
Severity of symptoms. There were only four of 24 (17%) included studies which
statistically examined disease severity as a predictor of treatment response,(79,81,84,90) of
which only two found statistically significant results. Namely, Perry et al. (2011) found
modest negative correlations between initial autism severity scores (CARS) and discharge
full-scale IQ (r=-0.43, p<0.01) and ABC standard scores (r=-0.34, p<0.01), as well as a
positive correlation with CARS scores at treatment exit (r=0.52, p<0.01). This finding
effectively lends support for a milder initial autism severity as a predictor of better
outcomes with IBI. However, a stepwise linear regression analysis by the same authors
indicated that pre-treatment autism severity did not account for any variance in outcome
measures other than post-treatment IQ scores (∆R2=0.038, p<0.001). Perry et al. (2011)
also found that when initial IQ, age at IBI entry, and initial adaptive skill level were
controlled in a hierarchical multiple regression analysis, initial severity of symptoms
(CARS) contributed an additional 2.0% of variance to predictions in follow-up IQ, while a
considerable amount of variance (∆R2=0.637, p=NR) can be predicted based on the
combination of all four predictive variables. Similarly to Perry et al. (2011), findings from a

68
hierarchical multiple regression analysis by Flanagan et al. (2012) found that when
controlling for treatment duration, initial age and adaptive skill level, milder initial autism
severity appeared to contribute an additional 1% of variance to predictions in follow-up IQ
(∆R2=0.013, p<0.092). Therefore, regression analyses suggest that initial autism severity
may not be a meaningful predictor of treatment response when variables such as intake age
and baseline adaptive functioning are controlled.
In contrast to the observed relationships in the previous two studies, Ben-Itzchak
and Zachor (2007) found that pre-treatment autism severity in communication and in
reciprocal-social interaction domains did not impact the gain in IQ scores among
participants, and Harris and Handleman (2000) did not find a significant correlation
between severity of symptoms (CARS) and participants’ classroom placement at follow-up.
On the whole, the evidence base relating to the predictive utility of autism severity
is limited. Although two of the four studies which examined the impact of initial autism
severity levels on treatment outcomes support the presence of a milder symptomatic profile
as predictive of better outcomes following IBI, additional data are required, particularly
from controlled comparisons, to draw reliable conclusions about the true impact of baseline
disease severity on treatment response.
Treatment duration. Three of 24 (13%) included studies statistically examined the duration
of IBI treatment as a predictor of treatment outcome.(79,83,94) Namely, Flanagan et al.
(2012) conducted a hierarchical multiple regression analysis using data from their matched-
pairs comparison of 122 participants, 61 of which received IBI for at least 12 months (mean
duration of 28 months). They found that while treatment duration initially contributed

69
significantly to predictions, it did not remain a significant predictor after controlling for
group membership and other intervention variables. Another hierarchical multiple
regression analysis conducted by Perry et al. (2013a) among an older group of participants
(mean age=5.33±2.01 years, range=2.08 to 14.50 years) that received IBI treatment for an
average of 20 months (range 10-55) revealed that longer treatment duration was associated
with slower rates of cognitive and adaptive development between intake and program
discharge. The authors also found that the duration of IBI was not significantly associated
with other measured outcomes, suggesting that children who were in the IBI program
longer were not necessarily showing better outcomes on full-scale IQ, adaptive behaviour
composite, or change in IQ at treatment exit. Finally, Virues-Ortega et al. (2013) conducted
a series of multilevel regression models using different sets of predictors in order to select
models which would maximize goodness-of-fit for a given outcome when compared to an
unconditional baseline model, and they found that intervention duration had a positive
impact on the model’s fit, but to a lesser extent than total intervention time (weekly hours
multiplied by total weeks of treatment) in all eight measured outcomes. Although
methodological contributions of this study were clear, the clinical or practical implications
of the findings relating to the predictive utility of treatment duration remain unclear.
To date, there are few studies that have identified a clear statistical association
between treatment duration and therapeutic progress following IBI treatment.
Consequently, it is premature to conclude that a specific treatment duration may adversely
affect IBI treatment response.

70
CHAPTER IV: DISCUSSION
4.1 Summary of main results
Effects of intervention
A total of 24 unique studies which compared the effects of IBI to TAU or no
treatment in preschool and school age children with an ASD were identified. Sixteen
studies used an uncontrolled before-and-after design, while eight were controlled
comparison studies, one of which used a RCT design. Meta-analyses were conducted using
a random-effects model on thirteen and twelve studies, respectively, for full-scale IQ and
adaptive behaviour composite; data from eight studies were additionally aggregated for
each of the VABS adaptive behaviour domains. On the whole, findings revealed that IBI
improves full-scale IQ (SMD ES = 0.66, p<0.00001) and adaptive skills (SMD ES = 0.57,
p<0.00001) for this population; moderate SMD effect sizes were also found in
communication skills (SMD ES = 0.45, p<0.005), daily living skills (SMD ES = 0.27,
p<0.04), and socialization (SMD ES = 0.35, p<0.05). Results of subgroup analyses
performed on the IQ and VABS ABC standardized measures further revealed that the effect
of treatment may differ between preschool and school age children, across different pre-
treatment cognitive levels, and based on the format of treatment delivery. Namely, the
effect of IBI on both of these measures tended to be stronger for preschool aged
participants (<48 months at intake), for participants without significant cognitive
impairment at treatment intake (i.e. intake IQ >55), and for those following a UCLA-based
IBI program. Controlled trials also tended to show higher treatment effects in comparison
with uncontrolled studies on both measures; however, the reasons underpinning this

71
difference in treatment effect remain elusive and may be due to limitations in the statistical
techniques used.
Due to reliance on only a portion of selected review studies for meta-analysis, most
of which comprised uncontrolled studies, as well as the overall moderate rating given to the
body of evidence, results should be interpreted with caution. Additional data, especially
from controlled comparison studies, could very well change the estimate of treatment effect
and the confidence placed on its precision. Moreover, the amount of benefit that the
observed treatment gains may contribute to the quality of life of children and their families
over a longer term is an issue that merits further investigation and follow-up.
Predictors of treatment response
Sixteen of 24 studies included in this review statistically examined predictors of
treatment response. A total of five variables which appear to predict optimal response or
better outcomes with IBI were examined across two or more studies: cognitive level at
treatment intake, intake chronological age, pre-treatment adaptive functioning and severity
of symptoms, as well as treatment duration. Overall, results of predictive modeling across
studies demonstrated that better outcomes with IBI were largely experienced by children
who were relatively younger at treatment onset, those who had higher baseline levels of
cognitive and adaptive functioning, as well as children who had a milder severity of
symptoms at intake; the predictive utility of treatment duration revealed mixed results.
However, these findings warrant careful interpretation given the variability and lack of
justification regarding the choice of dependent variables used (and ultimately, agreement on
that which constitutes better or ‘best outcome’ or optimal response), uncertainty

72
surrounding the appropriateness of some statistical approaches, and perhaps most
importantly, the dominance of uncontrolled studies which limit the interpretation of
variables associated with change in the treated group as actual predictors of treatment
response (as not all of the observed change can be attributed to the effect of IBI).
4.2 Overall completeness and applicability of evidence
Several factors impact the completeness and applicability of findings of this review
and meta-analysis. First, while the pooled estimates of the intervention effect suggest that
IBI results in improved cognition and adaptive skills among children with an ASD, and that
the magnitude of effects may be more pronounced in preschool aged children as opposed to
children who have enrolled in school, these findings are based on an evidence base which is
largely composed of uncontrolled before-and-after studies. The lack of a control makes it
difficult to attribute any observed improvement in intellectual or adaptive functioning to the
effect of IBI therapy alone since the design of the study does not allow control for the effect
of maturation or the natural course of a child’s development. In other words, improved
functioning following IBI may, in part, be due to a natural progression in development or
learning that occurs as a child ages or matures over the course of follow-up, and not
necessarily wholly attributable to the success of behavioural therapy. For this reason,
studies which lack a control group often tend to overestimate the true intervention effects.
Reliance on published evidence which is composed, in large part, of repeated measures
studies with no control group (or uncontrolled multiple-group comparisons) limits the
internal validity of that body of evidence and, in turn, makes it difficult to generalize
findings about to the strength of IBI to contexts outside of the study setting. Second, the
lack of a standardized control group among controlled comparisons may also limit the

73
generalizability of results, especially where TAU conditions varied widely in the
application of intervention techniques. Specifically, while all controlled studies compared
the treatment group with a group not receiving IBI, some control conditions incorporated
elements of ABA as part of a multi-method eclectic approach and/or provided services at a
similar intensity to the IBI group, while other TAU groups comprised children whose
caregivers were not actively seeking behavioural services or consisted of wait-list
participants not yet receiving publicly-funded IBI programming. Third, randomization to
group assignment was not implemented across the majority of controlled studies (with the
exception of one RCT), which raises serious internal validity concerns (i.e. lack of
equivalent groups). Fourth, the intervention effects estimated through meta-analysis may
not be generalizable to children with significant cognitive impairments (e.g. intellectual
disability) or those with comorbid conditions given that participants with these attributes
were typically absent from the study samples of included studies. In fact, a number of
studies specified the presence of severe medical conditions other than ASD or genetic
disorders and/or a low pre-treatment IQ score (e.g. IQ<50) as exclusion criteria during
participant recruitment. Similarly, there were several studies which specified a very narrow
age range as part of the participant eligibility criteria (e.g. intake CA >24<42 months) prior
to enrolment in an IBI program. Nevertheless, there were several recent community-based
studies conducted within a Canadian setting which examined the effect of IBI across a
broad age range of participants, and which did not exclude participants on the basis of
comorbid disorders or a relatively lower cognitive ability. Despite the inclusion of more
heterogeneous samples within the recent published literature, the ability to generalize the
magnitude of effect IBI has on individuals with an ASD who concurrently suffer from
another medical disorder or whose intellectual ability is significantly diminished, across a

74
variety of settings, remains limited. Therefore, while the current published evidence
suggests that differential treatment effects may exist among preschool and school aged
children with an ASD, additional research using rigorous methods, standardized control
groups, random assignment of group membership, and heterogeneous samples of
participants including a broad age range may be needed before generalizations regarding
the effect of IBI in this population (and sub-populations) can be made with confidence.
The applicability of findings relating to predictors of treatment response is also
limited by several factors. While younger age, increased cognitive and adaptive ability, as
well as a milder symptomatic profile appear to be related to better outcomes following
treatment with IBI, data which have allowed to statistically examine these relationships are
limited, and the majority of predictive variables have been identified from datasets of
uncontrolled studies using, at times, potentially inappropriate statistical methods. Yoder
and Compton (2004) have suggested that few studies appropriately identify predictors of
treatment response, and point out that research which predicts the presence or amount of
change on a given outcome among the experimental group of an uncontrolled study is
merely examining predictors of growth within that sample, rather than predictors of
treatment response.(96) The authors further explain that a treatment response is typically
only a small portion of the total observed growth within a sample, and that predictors of
treatment response refers to “correlates of change due exclusively to the treatment.(96)” As
a result, variables associated with change in the treated groups of uncontrolled studies in
this review may not necessarily reflect actual predictors of treatment response as not all of
the change or growth observed among participants can be exclusively attributed to the
effect of IBI. Moreover, the paucity of significant associations stemming from the

75
predictive modeling results of controlled comparison studies is also of potential concern.
Non-significant findings among school aged samples are particularly troubling; yet, it
seems plausible that, given a large enough sample, admission into IBI after reaching school
age may not be reliably associated with optimal treatment response, and that IBI might not
be equally effective across child and adolescent groups. Such inferences, however, are
currently unsupported by the published literature relating to predictors of treatment
outcome. Finally, there were several inconsistencies in the choice of dependent variables
across predictive modeling studies, suggesting that there is a general lack of agreement
regarding the operational definition of a ‘best outcome’ or optimal treatment response, and
that a definition of ‘responders’ and ‘non-responders’ to treatment is often independent of
the treatment goals. In light of these limitations, findings warrant careful interpretation, and
additional data, especially from experimental studies with a control group, may help to
determine and to draw reliable conclusions regarding the true impact of relevant participant
and intervention characteristics on response to IBI.
On the whole, although the available evidence supports the use of IBI among
children with an ASD, and while it appears to suggest that preschool age children respond
better to treatment than school age populations, the variability in interventions including the
duration and intensity, differences in the intervention content and delivery, as well as the
variability in participant characteristics and the experimental design of studies, means that
these important questions cannot yet be answered will full confidence. Indeed, certain
factors need to be considered when making any generalisations about the body of evidence.
Nonetheless, this review provides a basis for concluding that IBI does appear, on average,

76
to lead to positive changes in cognition and adaptive skills among preschool and school age
children with an ASD.
4.3 Quality of the evidence
This review considered 24 unique studies, representing 1,816 children with an ASD.
Of these young participants, 1,156 (63.7%) were aged, on average, above 48 months at
intake, while the remainder comprised much younger, preschool aged children.
Additionally, there were only three samples across the included studies where the youngest
participant was aged above 4 years at baseline. In the meta-analyses, data from a maximum
of 492 children (Analysis 1.1: IQ) were statistically combined, with 62 (Analysis 1.1: IQ)
to a maximum of 123 children (Analysis 1.2: VABS ABC) making up the control
conditions. In addition, estimates from 81 and 240 participants with a mean intake age
above 48 months were combined in meta-analysis for full-scale IQ and VABS AB
composite, respectively. Therefore, while a considerable portion of the total number of
participants across the included studies had, on average, attained school age (>48 months),
only a fraction of the estimates regarding outcomes experienced by these participants was
available for pooling in the quantitative synthesis.
The quality of the evidence, as rated by the modified Downs and Black (1998)
checklist, is affected by a number of factors, with the majority of studies receiving a low or
moderate rating. This rating mostly reflects concerns with the external validity, internal
validity (confounding), and statistical power domains of the quality assessment tool. Of
particular concern is the use of non-randomized trials, retrospective study design, small
samples of participants, incomplete outcome data, inadequate adjustment for confounding

77
in the analyses, and perhaps most markedly, the dominance of uncontrolled, repeated
measures studies. Furthermore, intervention providers and the children’s parents were
aware of, and in some cases selected, the treatment status, which effectively increases the
risk of performance bias; however, this risk is difficult to mitigate given the nature of the
intervention. While blinding of parents or treatment staff was not possible, about 50% of
included studies successfully blinded those measuring the main outcomes of the
intervention; nevertheless, the risk of detection bias remains high. Additionally, because
data from studies which reported partial outcome measures were not aggregated in meta-
analysis, these missing data have the potential to bias the findings of the meta-analyses;
however, based on the results reported in the individual reports of relevant studies, missing
data are unlikely to influence the direction of the observed effect. Given the various threats
to both internal and external validity, results should be interpreted cautiously. Finally, the
risk of publication bias cannot be ruled out.
The quality of the evidence in this review is also reflected in the extent to which
procedural fidelity was measured across the included studies. Namely, while more than half
of the studies included in this review contained elements to maintain treatment integrity,
indirect measures were on average more common than direct measures in assessing
treatment adherence and therapist competence. In using indirect measures of assessment, it
becomes difficult to gauge definite levels of treatment integrity across and within studies
since these measures can underrepresent or overemphasize true fidelity levels. Conversely,
direct assessment methods may generate a more accurate portrayal of treatment integrity
since direct measures may be less susceptible to bias and distortions in self-interest. With
the exception of one study which reported direct measures of treatment adherence, therapist

78
competence, and treatment differentiation, many of the selected review studies did not
appear to measure therapy implementation at a level sufficient enough to draw definitive
conclusions about the quality and similarity of treatment across participants or within a
participant across therapists. Previous studies examining IBI implementation have found
that some therapists and parents experienced difficulty achieving high levels of treatment
integrity,(97,98) and it is well documented that questionable fidelity can limit research
conclusions in behavioural research.(99–101) Therefore, inferences regarding the impact of
treatment integrity levels on therapeutic change observed in studies included in this review
should be made with caution, and future studies should endeavour to measure procedural
fidelity directly across participants, therapists, and conditions. Once acceptable levels of
treatment integrity have been achieved, analyses relating to the impact of different levels of
integrity may allow to determine the levels of precision necessary for IBI to be optimally
effective.
4.4 Potential biases in the review process
While bias may exist in the methods used across included studies in a review, it can
also be introduced in the methods used during the systematic review process, commonly
referred to as metabias.(102) There are three general types of metabias that may occur
during the course of the review process: selection bias, information bias, and bias in the
analysis. First, the risk of selection bias in the review process is high where unpublished
studies tend to have different results than published studies (publication bias), where there
is selective reporting of relevant outcomes, and where studies which are easier to find have
different results from those that are more difficult to find (ascertainment bias). In this
review, the likelihood that all relevant studies have been identified is relatively high owing

79
to the comprehensive and systematic search of the evidence across several electronic
databases as well as the grey literature. Nevertheless, it is still possible that some relevant
studies may have been missed. Similarly, the presence of publication bias cannot be ruled
out. Second, concerns regarding the introduction of information bias in the review process
relate to the accuracy of quality assessment, as well as the accuracy and completeness of
the data abstraction that is done from the individual studies included in the review. In
addition, the outcome of a systematic review, and meta-analysis where applicable, may be
affected if study findings are known to the reviewer when study inclusion/exclusion criteria
are defined or data are abstracted (inclusion bias). While the screening of electronic
citations and full-text articles in this review was conducted using two independent
reviewers, data abstraction was carried out through single data abstraction and verification
by a second reviewer, as opposed to independent double data abstraction. In addition, only
one reviewer performed the methodological quality assessment of included studies, as well
as the assessment of procedural fidelity. As a result, information bias was not fully
prevented during the course of the review; yet, the impact that this bias may have had on
study findings is likely not significant. Moreover, given that study findings were unknown
to the reviewer at the outset of the review process, the risk of inclusion bias is low. Finally,
metabias may also be introduced in the analysis of a systematic review and meta-analysis
through the choice of statistical methods used and the investigation of heterogeneity.
Indeed, the decision to include non-randomized studies and statistically combine controlled
and uncontrolled studies may have introduced some bias in the analysis of this systematic
review and meta-analysis, even though the aggregation of data from studies of different
designs was justified. Finally, the post hoc selection of subgroup analysis for exploring
heterogeneity may also be a potential source of metabias in this review. On the whole,

80
while the presence of metabias in this review and meta-analysis is likely, standards for
minimizing meta-bias have also been implemented, including a thorough search for
relevant studies, the prevention of errors in data abstraction using verification by a second
reviewer, as well as the consideration for the impact of the used methods of analysis.
4.5 Agreements and disagreements with other studies or reviews
This review and meta-analysis is the first to consider the effectiveness of IBI in both
preschool and school age children with an ASD, and it is the first to incorporate published
Canadian evidence.
Over the course of the last five years, however, six different systematic reviews
with meta-analysis have been published,(60,103–107) all of which endeavoured to examine
the clinical effectiveness of IBI (or ABA-based early intervention programs) in children
with an ASD. Nevertheless, several factors distinguish each of the published reviews from
one another, as well as from the current review and meta-analysis. First, the numbers of
studies and the amount of participant data which have been previously synthesized, both
qualitatively and quantitatively, have varied considerably. Virues-Ortega et al. (2010)
published the largest review,(60) consisting of 22 studies (n=503), while the smallest
review was published by Spreckley & Boyd (2009),(105) with four selected review articles
(n=76). Second, although comparative effectiveness research relating to IBI has certainly
increased over the years, and while it seems plausible that variation in the amount of data
synthesized across reviews is attributable (at least in part) to a growing evidence base, the
large variation in study inclusion criteria across the published reviews appears to be a more
likely cause for the observed differences. For instance, most of the previous review authors

81
chose to focus on a much more restricted age range and include only preschool aged
children. In addition, different definitions of IBI, or a narrower focus on only UCLA-based
IBI studies, have also likely contributed to the differences in which studies were included in
each of the previous reviews. Third, the decision to combine controlled and uncontrolled
studies has also varied in previous studies, as well as the methods used for meta-analysis.
Namely, four of the previous reviews have statistically combined controlled comparisons
with pre/post one-group design studies,(60,104–106) while two review authors chose to
only select controlled designs for inclusion in their quantitative synthesis.(103,107) Effect
size calculations also varied across reviews between the use of the standardized mean
difference (SMD) in four studies,(60,103,105,106) the standardized mean change (SMC)
metric in one study,(104) and another study estimated effect size using the difference in
means (MD).(107) Furthermore, analyses in one review were based on individual raw data
gathered from selected study authors,(103) rather than group averages reported in original
papers, and a fixed-effect meta-analysis was used in two previous reviews,(103,105) while
three others used a random-effects model(60,104,107); one study did not report the
approach used for data synthesis.(106) Finally, the authors of one review did not assess the
methodological quality of included studies,(103) and only one review formally assessed
procedural fidelity across the selected review articles.(104)
Despite the differences identified between previously published reviews with meta-
analysis and this systematic review and meta-analysis, the results of this review are
consistent with the majority of previously published studies. Specifically, five of the
previously published meta-analyses demonstrated that IBI is an effective intervention for
improving cognitive and adaptive outcomes in children with an ASD,(60,103,104,106,107)

82
while one review did not show positive effects in favour of IBI for IQ or adaptive
behaviour.(105) However, while the authors of the latter review concluded that applied
behaviour intervention (ABI) did not result in significant improvement in cognitive,
language, or adaptive skills in comparison with standard care, their meta-analysis was
based on only three studies, and suffered from a major methodological limitation (i.e.
misinterpretation of a comparison group in one study), which effectively influenced the
results of their meta-analysis.(105) On the whole, findings from this review and meta-
analysis are in line with the direction of effects (albeit not necessarily magnitude of effects)
found in previous quantitative syntheses. The quality of the evidence, however, still
remains as a major concern.
4.6 Consideration for cost and cost-effectiveness
The importance of economic evaluation of health care interventions in informing
resource allocation decision making has been well recognized.(108–110) While findings
from clinical comparative effectiveness research can inform decisions regarding the use of
drugs and other health care interventions or programs, the increasing availability of novel
and costly health care interventions over time within a climate of constrained resources has
led to a growing need to prioritize and ration health care resources. As a result,
consideration for the budget impact of health care interventions, as well as their cost-
effectiveness, has become increasingly important across many decision-making contexts
and jurisdictions.

83
Cost-effectiveness of the Ontario IBI program: The need for an economic evaluation
Since the launch of the Ontario IBI program almost 15 years ago, funding for
autism services in Ontario, particularly for IBI, has markedly increased over the years.(56)
However, an assessment of the budget impact and cost-effectiveness of IBI in pre-school
and school age children is not yet available in the public domain.
To date, one economic evaluation of the Ontario IBI program has been published
which examined the cost-effectiveness of expanding this program to all children with an
ASD in Ontario. Published in 2006 by Motiwala et al., this study specifically sought to
examine the costs and consequences of expanding the Ontario IBI program from the
reimbursement strategy at the time of the study (i.e. coverage provided to about one third of
all ASD-affected children under the age of six with a severe diagnosis) to all children aged
two to five in Ontario.(15) Comparators included (1) status quo provision, (2) expansion of
IBI services, and (3) no intervention. Data on resource use and costs was obtained from the
provincial government and comprised information on the hours and costs of IBI and the
cost associated with educational and respite services. Treatment efficacy data were derived
from the published literature and evaluated in terms of patients’ levels of functioning (or
rates of normalization) at the completion of a three-year IBI program: normal, semi-
dependant, and very dependant functioning. Namely, it was assumed that the number of
individuals attaining normal functioning was 25% for the No Intervention group, 26.9% for
Status Quo, and 30% for the Expansion cohort. The distribution of individuals in a semi-
dependant state was 25%, 34.3%, and 50%, respectively, for the No Intervention, Status
Quo, and Expansion groups, while individuals whose level of functioning was assumed to
be very dependent for those same groups was distributed at 50%, 38.9%, and 20%. Thus,

84
the authors assumed that expansion of IBI services would result in a higher proportions of
individuals attaining normal or semi-dependent functioning, and a lower proportion of very
dependent individuals, as compared with no intervention or status quo. Disease
progression was modeled over the course of the “productive lifetime” (until the age of 65),
and individuals’ functional classification was assumed to remain constant over this time
frame. Because caregiving costs typically increase for all individuals after the age of 65,
and would therefore be more difficult to attribute to the effects of ASD alone, the authors
did not model the costs and benefits associated with IBI beyond this upper age limit. The
final outcome of the analysis was expressed in terms of incremental cost savings and gains
in dependency-free life years (DFLY), which would permit understanding of the extent to
which children are able to live on their own once they reach adulthood (i.e. free from the
care of a family member or other support services). Motiwala et al. reasoned that this
outcome best reflected the cognitive, social, communication, behavioural, and functional
outcomes of this population. The perspective adopted in the analysis was that of the
provincial government payer, with costs presented in 2003 Canadian dollars. Base-case
findings revealed that the expansion of the IBI program at the time of the study resulted in
total savings of over $45.1 million dollars. Furthermore, the incremental savings per child
over his or her lifetime as a result of expanding IBI from Status Quo (n=485) to all children
under six years who were eligible for IBI (n=1,309) was $34,479, with the majority of
savings arising from a decreased proportion of individuals in a very dependent state, and
therefore decreased spending on support services in adulthood (ages 18-65). Furthermore,
the incremental improvement in DFLYs per child was 2.8 years. In comparison with no
treatment, the number of dependency-free life years gained was 4.5 years per person.
Therefore, the authors concluded that expanding IBI services to all eligible children

85
resulted in lower overall costs of care and increased health benefits (i.e. increase in overall
dependency-free life years). Results, however, were sensitive to assumptions relating to the
discount rate and IBI efficacy data.
Overall, though this study appears to be well-designed, several factors may limit the
utility of study findings in aiding decision-making. First, treatment efficacy data were
derived from selected studies in the published literature which are of questionable quality,
and it is unclear how functional classification following IBI discharge was ascertained. This
is a significant limitation of the economic analysis, especially in light of more recent
studies which have measured treatment effectiveness using several standardized outcome
measures, such as IQ and adaptive behaviour. Second, the authors assumed that
individuals’ functional classification following treatment discharge, and by association IBI
efficacy, remained constant over the modeled population’s lifetime (or until age 65); yet,
this relationship has not been demonstrated in the published literature. Third, the target
population comprised only preschool aged children, and the model assumed that all
children started IBI treatment at the age of two for a period of three years; however, with
delays to diagnosis and increased numbers of school aged children receiving IBI, children
may not start treatment until a much later age, and treatment duration is unlikely to last
three years (which impacts treatment cost, and potentially estimates of treatment efficacy).
Reliance on these assumptions therefore limits the applicability of this study. Finally, the
age of the study does not reflect current clinical evidence or cost data. As a result, this
study is of poor applicability to the current decision making context.
Another cost-effectiveness analysis was recently published by Penner et al. (2015)
regarding ASD services in Ontario.(111) This economic evaluation built on the previous

86
analysis by Motiwala et al. (2006) and accounted for some of the limitations of that study.
Most notably, IQ was used as a surrogate marker in the analysis, linking intervention gains
(change in IQ from baseline) with future levels of dependence. However, the primary aim
of this analysis was to examine the costs and benefits (measured in DFLYs) associated with
the provision of two pre-diagnosis interventions for ASD (i.e. intensive Early Start Denver
Model (ESDM-I) and parent-delivered ESDM (ESDM-PD)) with the Ontario IBI program
(Status Quo). Accordingly, the target population of interest comprised toddlers aged 15 to
36 months with “undifferentiated developmental concerns,” that is, very young children
who have not yet received an ASD diagnosis. Given the choice of comparators and target
population in this analysis, the applicability of any findings in facilitating decision making
within the current policy context is limited. Besides, though novel ways to overcome some
of the modeling challenges outlined in the study by Motiwala et al. (2006) were proposed
by Penner et al. (2015), methodological limitations still persist. In particular, the use of
effectiveness data which is based on single, and in some cases uncontrolled, experimental
studies, as well as reliance on a single longitudinal cohort study with small sample size to
derive transition probabilities related to functional independence of children with an ASD
in adulthood, is of great concern.
Despite previous efforts, the need for an economic evaluation of the Ontario IBI
program which takes into consideration the differential effectiveness of treatment between
preschool and school age children with an ASD, as signalled by the results of this
systematic review and meta-analysis, remains a priority. The complexity of this task,
however, cannot be underestimated. Indeed, previous attempts in quantifying the cost-
effectiveness of IBI bring to light several barriers to conducting economic evaluations in

87
pediatric populations. Whether these barriers can be overcome is a question for further
study.
Barriers to conducting economic evaluations in child health
The peculiarity of child health poses several challenges to the economic evaluation
of interventions designed specifically for children. Namely, the pediatric population
consists of many groups from the perinatal period to adolescence, each of which is
characterized by a different set of physiological characteristics that influences response to
treatment, maturity, and development. Indeed, differences between child and adult health
must be acknowledged. In comparison to adults, children are different in terms of their
developmental vulnerability (disease expression and response to treatment may vary along
the trajectory of development) and their changing dependency relationships which
influence both their ability to seek and utilize health resources as well as their ability to
report their physical and emotional well-being. In addition, children have unique patterns of
health resource use (adults often serve as gatekeepers to accessing health care, and care is
provided in a variety of settings) and unique patters of morbidity and mortality (incidence
of disease is generally lower in children as compared with adults).(112)
Specific challenges in the conduct of economic evaluations of child health
interventions are mainly related to issues in costing, defining health-related outcomes,
measurement of preference-based utility measures, and issues in the analysis.(112) First,
measuring costs in child health often extends beyond the health system to include home,
school, and community resources, impacting resources use and relevant costs as the setting
of care delivery and age changes. Parent and other caregiver productivity costs may also

88
need to be considered since caring for a child affected by a given ailment can often be
accompanied by parents’ absenteeism from work or a change in work status (e.g.
presenteeism – the ability to continue work, but at much lower productivity). Data on
parent productivity losses, however, are not always readily available. Costing is further
complicated by the need to account for future child productivity costs given that morbidity
during childhood may reduce future work productivity and absorb more resources and
special services in adulthood. Moreover, in adopting lifelong time horizons, costing by
stage of development may be required, although data are not always available and there is
uncertainty associated with prediction. This is particularly true for modeling ASD, where
the availability of good data on costs associated with different developmental levels of
ASD across the life course is currently lacking. Second, while several reviews of child
health outcomes are available, defining health-related outcomes can be challenging. This is
largely due to the interwoven nature of child health with social determinants of health and
well-being, the physical environment, biologic and genetic determinants, and behavioural
responses. In addition, natural changes during phases of development are difficult to
measure. In the case of ASD, for instance, modeling disease progression in adults based on
small changes in childhood can be very difficult, and is often accompanied by a great deal
of uncertainty. Third, preferences for health states or utilities, a critical component of many
economic evaluations, are extremely challenging to measure in children. In fact, there are
no good instruments for preschool aged children. As a result, parents are often used as
proxies or proxy reporters of children’s functional status along different clinical
dimensions. However, while parents may be good proxies for observable symptoms, they
may not be reliable reporters for more subjective outcomes (e.g. mood and emotion).
Finally, several issues may be encountered in the modeling of child health interventions.

89
This particularly relates to challenges in constructing lifetime models and issues
surrounding valid data over the length of the time horizon. Reliance on multiple
assumptions in the modeling exercise can significantly impact the reliability and
applicability of results.
In brief, care must be taken when undertaking economic evaluation in pediatric
populations. Indeed, rationing of health care resources is an endeavour where choices
inevitably need to be made. For each choice that is made, however, there is an opportunity
cost associated with it – that is, something else must be given up. Placing a value on the
opportunity that is sacrificed, or the benefit forgone as a result of not employing the best
alternative use of an intervention, can be challenging without knowing whether something
is worth the cost. Therefore, to make choices about how best to ration a finite number of
health care resources, like services for children with an ASD for example, costs of
interventions are weighed against their benefits. Where an intervention, in comparison to an
alternative, (1) does what the alternative does but costs less, (2) costs the same as the
alternative but does better, or (3) costs less and does better than the alternative, it will be
judged as a good option (or economically attractive). Conversely, where an intervention is
available at a reduced total cost and reduced clinical benefit or at an increased total cost
with an improvement in clinical benefits, in comparison to an alternative, cost-effectiveness
will need to be considered. Economic evaluation, therefore, provides a measure of “value
for money,” and allows for a systematic way to compare two or more health interventions.
In the context of interventions for children with an ASD, economic evaluations must be
policy relevant and respond to the needs of health care providers making decision for
individual patients as well as the needs of decision-makers which allocate budgets. By

90
choosing to fund interventions that are judged to be “cost-effective,” provision of health
services should be become more efficient, and health benefits should increase within the
affected population. Nevertheless, consideration must be given to potential gaps in the
methods used, especially with respect to the availability and validity of outcome measures,
the ability to model cost and outcomes over the lifetime time horizon, as well as the
integration of family preferences.
4.7 Equity implications of research findings
Evidence-informed decision making can often be met with important equity
implications for a given patient population, especially when patients’ health needs are
situated in an environment of constrained resources.(113) Access to and coverage of IBI
programming for children with an ASD in Ontario is no exception to this quandary.
Based on the findings of this review which suggest that IBI may be more efficacious in
young pre-schoolers than children who are enrolled in school, and that relatively younger
age at entry to IBI predicts better outcome, it could reasonably be argued that funding for
this costly treatment should only be provided to those who have not yet reached the school
age. Reasoning for this decision would be justified purely on grounds of “best evidence,”
keeping in mind that uncertainty surrounding the results cannot be ruled out. However, by
making the choice to restrict coverage to only a subpopulation of children affected by ASD
(e.g. children under six years), without providing an alternative option to those who are
ineligible for coverage based on “best evidence,” the school aged population unavoidably
becomes vulnerable to disadvantage. This unequal distribution of publicly-funded (albeit
limited) resources could, in turn, be deemed as “unnecessary, avoidable, unfair, and

91
unjust,” and therefore inequitable,(114) in spite of an evidence-informed approach to
resource allocation. Indeed, proponents of equitable provision of health care resources and
distributive justice would agree that all children with an ASD and for whom treatment is
indicated should be able to access IBI, irrespective of age. Yet, where demand for therapy
exceeds the supply, choices on how to best distribute the limited resources is less clear.
Whether “best evidence” alone can be used to inform policy changes regarding IBI within
this resource-constrained context and enforce controlled access by those who are more
likely to accrue a larger clinical benefit from timely intervention is a question that warrants
serious consideration. Finally, in light of the findings in this review which suggest that
children with relatively milder forms of ASD tend to do better with IBI, as compared with
children with more severe forms of disease, decision-makers will also need to consider
whether the severity of illness argument (which currently disqualifies all children who are
not on the severe end of the autism spectrum from accessing IBI) still applies to the current
decision making context.

92
CHAPTER V: CONCLUSIONS
5.1 Implications for practice
Overall, the objectives of this review sought to answer some important questions of
direct relevance to parents, professionals, and policy makers. In particular, the findings of
this review and meta-analysis have a number of implications for practice. First, there is
considerable evidence that IBI is an effective treatment for preschool and school age
children diagnosed with an ASD, with moderately large gains in both intellectual
functioning (IQ) and adaptive skills. Findings of positive clinical benefit with IBI in this
review are in agreement with previously published comparative effectiveness research;
however, this review was the first to incorporate Canadian evidence of IBI efficacy and the
first to consider school aged populations of children with an ASD who were treated with
this intervention. The results of the meta-analyses conducted as part of this review suggest
that some school age children may also benefit from IBI; however the intensive treatment
appears to be more effective in increasing their adaptive skills as compared with cognition,
which did not seem to improve to the same degree. The inverse relationship was observed
in preschool children, whereby the effects of IBI on cognitive ability were much larger than
those observed in adaptive functioning. Furthermore, findings related to predictors of
treatment response revealed that younger age, increased cognitive and adaptive ability, as
well as a milder severity of symptoms at admission to IBI appear to be related to better
outcomes at IBI completion. However, this review and meta-analysis is not devoid of
limitations. Namely, a number of included studies had small sample sizes, many were
conducted without a control group, and procedural integrity was generally not well
monitored. Nonetheless, results remain very relevant to the Canadian decision making
context, and particularly striking in light of current clinical practice in the province of

93
Ontario where a considerable proportion of children receiving publicly-funded IBI have
reached the school age at treatment entry. Whether an age cut-off criterion should be re-
implemented within this jurisdiction is a question that warrants serious consideration on the
part of decision-makers dealing with limited resources, who need to be mindful of the
limitations associated with this body of evidence. Additionally, in light of the findings
which suggest that a milder symptomatic profile may lead to a better improvement with
IBI, decision-makers should also consider the appropriateness of the current eligibility
criteria for entry into the Ontario IBI program. While decisions relating to changes in the
current coverage of IBI should be evidence-informed, these decisions also have inherent
equity implications which need to be carefully weighed against the budget impact and cost-
effectiveness of a potentially restrictive funding strategy.
5.2 Implications for research
While the present review and meta-analysis does add to the growing evidence base
regarding the effectiveness of IBI in children with an ASD, and though it attempts to
elucidate the differential effectiveness that may exist between preschool and school age
recipients of this intervention, the quality of the evidence is of great concern. In fact, many
of the included studies had similar methodological flaws, and these shortcomings, if
avoided, could improve the quality of the of the available evidence – and in turn, the
confidence placed in the pooled estimates of treatment effect, as well as the findings
relating to predictors of therapeutic progress. First, the need for studies with larger samples
of participants cannot be ignored. Larger samples will help to increase power of study
results, and allow for more rigorous exploration of predictors of outcome. Second, future
studies should strive to conduct controlled comparisons with appropriate randomization

94
procedures, when possible, in order minimize threats to their internal validity and control
for factors outside of the treatment which may be contributing to an improved clinical
profile among participants. While it is not always ethical to not provide treatment,
especially in the case of children affected by an ASD, novel attempts to overcome this
limitation in the design of experimental studies have been previously explored with the use
of wait-list controls, for instance, and future studies should endeavour to adopt similar
methods. Where wait-list controls are not available, a standardized control group receiving
eclectic intervention at a similar intensity to IBI could be utilized. Third, prospective
follow-up should be favoured over retrospective file review, which might, to some extent,
help reduce the amount of partial or incomplete outcome data common to retrospective
studies. Fourth, the variable blinding of outcome assessors could be remediated in future
studies by enforcing blinding of those measuring participant outcomes, especially given
that blinding of participants is not possible due to the nature of the intervention. Fifth,
greater consistency in the types and numbers of outcome measures used across studies is
urgently needed, and measured outcomes should be both objective and tailored to reflect
the mandate or goal of IBI. Sixth, there is a great need to include more heterogeneous study
samples in future research on IBI efficacy, with the inclusion of a broad age range of
participants, those with comorbid conditions and below average cognitive skill. This will
hopefully provide a more accurate portrayal of characteristics of children in everyday
clinical practice and increase the generalizability of findings. Finally, procedural fidelity
should be monitored and measured during treatment provision, and reported in the final
research publications. Improvements in the design and conduct of future IBI efficacy
studies will ultimately lead to an even better understanding of the effects of IBI treatment,
and provide better insight into the variables that predict treatment response.

95
REFERENCES
1. Hill EL, Frith U. Understanding autism: insights from mind and brain. Philos Trans
R Soc Lond B Biol Sci. 2003 Feb 28;358(1430):281–9.
2. Verhoeff B. Autism in flux: a history of the concept from Leo Kanner to DSM-5.
Hist Psychiatry. 2013;24(4):442–58.
3. Anagnostou E, Zwaigenbaum L, Szatmari P, Fombonne E, Fernandez BA,
Woodbury-Smith M, et al. Autism spectrum disorder : advances in evidence-based.
Can Med Assoc J. 2014;186(7):509–19.
4. Waterhouse L. Autism overflows: increasing prevalence and proliferating theories.
Neuropsychol Rev. 2008;18:273–86.
5. Baio J. Prevalence of autism spectrum disorder among children aged 8 years - autism
and developmental disabilities monitoring network, 11 sites, United States, 2010.
[Internet]. Morbidity and Mortality Weekly Report. Washington, DC; 2014.
Available from:
http://www.cdc.gov/mmwr/preview/mmwrhtml/ss6302a1.htm?s_cid=ss6302a1_w
6. Mordre M, Groholt B, Knudsen AK, Sponheim E, Mykletun A, Myhre AM. Is long-
term prognosis for pervasive developmental disorder not otherwise specified
different from prognosis for autistic disorder? Findings from a 30-year follow-up
study. J Autism Dev Disord. 2012;42(6):920–8.
7. DePape A-M, Lindsay S. Parents’ Experiences of Caring for a Child With Autism
Spectrum Disorder. Qual Health Res. 2014;25(4):569–83.
8. Billstedt E, Gillberg C, Gillberg C. Autism after adolescence: Population-based 13-
to 22-year follow-up study of 120 individuals with autism diagnosed in childhood. J
Autism Dev Disord. 2005;35(3):351–60.
9. Barrett B, Mosweu I, Jones CR, Charman T, Baird G, Simonoff E, et al. Comparing
service use and costs among adolescents with autism spectrum disorders, special
needs and typical development. Autism. 2014;19(5):562–9.
10. Brown HK, Ouellette-Kuntz H, Hunter D, Kelley E, Cobigo V. Unmet needs of
families of school-aged children with an autism spectrum disorder. J Appl Res
Intellect Disabil. 2012;25(6):497–508.
11. Class J, Ladew P, Pollack EG (Eds. . National Standards Project, Phase 2 -
Addressing the need for evidence-based practice guidelines for Autism Spectrum
Disorder. Randolph, MA; 2015.

96
12. Rogers SJ, Vismara LA. Evidence-based comprehensive treatments for early autism.
J Clin Child Adolesc Psychol. 2008;37(1):8–38.
13. Reichow B. Overview of meta-analyses on early intensive behavioral intervention
for young children with autism spectrum disorders. J Autism Dev Disord.
2012;42(4):512–20.
14. Freeman N, Frey J, Laredo S, Lindbald T, Nicolson R, Perry A, et al. Development
of Clinical Practice Guidelines for the delivery of Intensive Behavioural Intervention
for children with autism spectrum disorders in Ontario. 2007.
15. Motiwala SS, Gupta S, Lilly MB, Ungar WJ, Coyte PC. The Cost-Effectiveness of
Expanding Intensive Behavioural Intervention to All Autistic Children in Ontario.
Healthc Policy. 2006;1(2):135–51.
16. Peters-Scheffer N, Didden R, Korzilius H, Matson J. Cost comparison of early
intensive behavioral intervention and treatment as usual for children with autism
spectrum disorder in The Netherlands. Res Dev Disabil. Elsevier Ltd;
2012;33(6):1763–72.
17. Jacobson JW, Mulick JA, Green G. Cost-Benefit Estimates for Early Intensive
Intervention for Young Children with Autism - General Model and Single State
Case. Behav Interv. 1998;13(1):201–2226.
18. Gadow KD. Children on Medication: Hyperactivity, Learning Disabilities, and
Mental Retardation. Vol 1. Baltimore, MD: Little, Brown and Co.; 1986. 251 p.
19. DiCicco-Bloom E, Lord C, Zwaigenbaum L, Courchesne E, Dager SR, Schmitz C, et
al. The developmental neurobiology of autism spectrum disorder. J Neurosci.
2006;26(26):6897–906.
20. Elsabbagh M, Divan G, Koh Y-J, Kim YS, Kauchali S, Marcín C, et al. Global
prevalence of autism and other pervasive developmental disorders. Autism Res.
2012;5(3):160–79.
21. Howlin P. Autism spectrum disorders. Psychiatry. 2006;5(9):320–4.
22. Johnson CP, Myers SM. Identification and evaluation of children with autism
spectrum disorders. Pediatrics. 2007;120(5):1183–215.
23. Manzi B, Loizzo AL, Giana G, Curatolo P. Autism and metabolic diseases. J Child
Neurol. 2008;23(3):307–14.
24. Mazzone L, Ruta L, Reale L. Psychiatric comorbidities in asperger syndrome and
high functioning autism: diagnostic challenges. Ann Gen Psychiatry. 2012;11(16):1–
13.

97
25. Amiet C, Gourfinkel-An I, Bouzamondo A, Tordjman S, Baulac M, Lechat P, et al.
Epilepsy in Autism is Associated with Intellectual Disability and Gender: Evidence
from a Meta-Analysis. Biol Psychiatry. 2008;64(7):577–82.
26. Simonoff E, Pickles A, Charman T, Chandler S, Loucas T, Baird G. Psychiatric
disorders in children with autism spectrum disorders: prevalence, comorbidity, and
associated factors in a population-derived sample. J Am Acad Child Adolesc
Psychiatry. 2008;47(8):921–9.
27. Wing L, Potter D. The epidemiology of autistic spectrum disorders: is the prevalence
rising? Ment Retard Dev Disabil Res Rev. 2002;8(3):151–61.
28. Grzadzinski R, Huerta M, Lord C. DSM-5 and autism spectrum disorders (ASDs):
an opportunity for identifying ASD subtypes. Mol Autism. 2013;4(1):2–6.
29. Halfon N, Kuo A a. What DSM-5 Could Mean to Children With Autism and Their
Families. JAMA Pediatr. 2013;167(7):608–13.
30. McGuinness TM, Johnson K. DSM-5 Changes in the Diagnosis of Autism Spectrum
Disorder. J Psychol Nurs. 2013;51(4):17–20.
31. Currenti SA. Understanding and determining the etiology of autism. Cell Mol
Neurobiol. 2010;30(2):161–71.
32. Abrahams BS, Geschwind DH. Advances in autism genetics: on the threshold of a
new neurobiology. Nat Rev Genet. 2008;9(5):341–55.
33. Bryson SE, Smith IM. Epidemiology of Autism: Prevalence, Associated
Characteristics, and Implications for Research and Service Delivery. Ment Retard
Dev Disabil Res Rev. 1998;4:97–103.
34. Centers for Disease Control and Prevention (CDC). Autism Spectrum Disorders
(ASDs): Data and Statistics [Internet]. 2013 [cited 2013 Aug 16]. Available from:
http://www.cdc.gov/ncbddd/autism/data.html
35. Centers for Disease Control and Prevention (CDC). Prevalence of Autism Spectrum
Disorder Among Children Aged 8 Years — Autism and Developmental Disabilities
Monitoring Network, 11 Sites, United States, 2010. Morb Mortal Wkly Rep
[Internet]. 2012 Mar 30;61(3):1–19. Available from:
http://www.ncbi.nlm.nih.gov/pubmed/22456193
36. National Epidemiologic Database for the Study of Autism in Canada (NEDSAC).
Findings from the National Epidemiologic Database for the Study of Autism in
Canada (NEDSAC): Changes in the Prevalence of Autism Spectrum Disorders in
Newfoundland and Labrador, Prince Edward Island, and Southeastern Ontario
[Internet]. 2012. Available from:

98
http://www.autismsocietycanada.ca/DocsAndMedia/KeyReports/NEDSAC_Report_
March2012.pdf
37. Fombonne E. Epidemiology of pervasive developmental disorders. Pediatr Res.
2009;65:591–8.
38. Howlin P. Outcomes in autism spectrum disorders. In: Volkmar FR, Paul R, Klin A,
Cohen D, editors. Handbook of autism and pervasive developmental disorders, vol 1:
Diagnosis, development, neurobiology, and behavior. 3rd ed. Hoboken, NJ: Wiley &
Sons; 2005. p. 201–20.
39. Gillberg C, Steffenburg S. Outcome and prognostic factors in infantile autism and
similar conditions: a population-based study of 46 cases followed through puberty. J
Autism Dev Disord. 1987;17(2):273–87.
40. Locklyer L, Rutter M. A Five- to Fifteen-Year Follow-up Study of Infantile
Psychosis: IV. Patterns of Cognitive Ability. Br J Soc Clin Psychol. 1970;9(2):152–
63.
41. Farley M a., McMahon WM, Fombonne E, Jenson WR, Miller J, Gardner M, et al.
Twenty-year outcome for individuals with autism and average or near-average
cognitive abilities. Autism Res. 2009;2(2):109–18.
42. Helt M, Kelley E, Kinsbourne M, Pandey J, Boorstein H, Herbert M, et al. Can
children with autism recover? If so, how? Neuropsychol Rev. 2008;18(4):339–66.
43. Huffman LC, Sutcliffe TL, Tanner ISD, Feldman HM. Management of symptoms in
children with autism spectrum disorders: a comprehensive review of pharmacologic
and complementary-alternative medicine treatments. J Dev Behav Pediatr.
2011;32(1):56–68.
44. Hanson E, Kalish LA, Bunce E, Curtis C, McDaniel S, Ware J, et al. Use of
complementary and alternative medicine among children diagnosed with autism
spectrum disorder. J Autism Dev Disord. 2007;37(4):628–36.
45. Perry A, Condillac R. Evidence-Based Practices for Children and Adolescents with
Autism Spectrum Disorders: Review of the Literature and Practice Guide [Internet].
Toronto, Ontario; 2003. Available from:
http://www.kidsmentalhealth.ca/documents/EBP_autism.pdf
46. De Rivera C. The use of intensive behavioural intervention for children with autism.
J Dev Disabil. 2008;14(2):1–15.
47. Perry A. Intensive Early Intervention Program for Children with Autism :
Background and Design of the Ontario Preschool Autism Initiative. J Dev Disabil.
2002;9(2):121–8.

99
48. Anderson SR, Romanczyk RG. Early intervention for young children with autism:
Continuum-based behavioral models. Res Pract Pers with Sev Disabil.
1999;24(3):162–73.
49. Green G. Early behavioral intervention for autism: What does the research tell us?
In: Maurice C, Green G, Luce SC, editors. Behavioral Intervention for Young
Children With Autism: A Manual for Parents and Professionals. Austin, Texas: Pro-
Ed.; 1996. p. 29–44.
50. Lovaas OI. Behavioral treatment and normal educational and intellectual functioning
in young autistic children. J Consult Clin Psychol. 1987;55(1):3–9.
51. McEachin JJ, Smith T, Lovaas OI. Long-term outcome for children with autism who
received early intensive behavioral treatment. Am J Ment Retard. 1993;97(4):359–
91.
52. Lovaas OI. Teaching Individuals with Developmental Delays: Basic Intervention
Techniques. Austin, TX: Pro-Ed.; 2002.
53. Maurice C, Green G, Foxx RM. Making a Difference: Behavioral Intervention for
Autism. Austin, TX: Pro-Ed.; 2001. 1-221 p.
54. Weir RW. Court of appeal overturns superior court ruling on the charter rights of
autistic children [Internet]. Education Law News. 2006 [cited 2015 Aug 15]. p. 10–3.
Available from:
http://www.blg.com/en/newsandpublications/documents/publication732_EN.pdf
55. Doherty HL. Autism Class Action Lawsuit at the Court of Appeal for Ontario
[Internet]. 2008 [cited 2015 Aug 15]. Available from:
http://autisminnb.blogspot.ca/search/label/Sagharian
56. Auditor General of Ontario. 3.01 Autism Services and Supports for Children
[Internet]. 2013 Annual Report. 2013 [cited 2015 Aug 15]. p. 52–81. Available from:
http://www.auditor.on.ca/en/reports_en/en13/301en13.pdf
57. McGowan J, Sampson M, Lefebvre C. An Evidence Based Checklist for the Peer
Review of Electronic Search Strategies (PRESS EBC). Evid Based Libr Inf Pract.
2010;5(1):149–54.
58. Wallace BC, Small K, Brodley CE, Lau J, Trikalinos T a. Deploying an interactive
machine learning system in an evidence-based practice center. Proc 2nd ACM
SIGHIT Symp Int Heal informatics - IHI ’12. 2012;819–24.
59. Downs SH, Black N. The feasibility of creating a checklist for the assessment of the
methodological quality both of randomised and non-randomised studies of health
care interventions. J Epidemiol Community Health. 1998;52(6):377–84.

100
60. Virués-Ortega J. Applied behavior analytic intervention for autism in early
childhood: Meta-analysis, meta-regression and dose-response meta-analysis of
multiple outcomes. Clin Psychol Rev. 2010;30(4):387–99.
61. Perepletchikova F, Kazdin AE. Treatment integrity and therapeutic change: Issues
and research recommendations. Clinical Psychology: Science and Practice. 2005. p.
365–83.
62. McLeod BD, Southam-Gerow M a, Weisz JR. Conceptual and Methodological
Issues in Treatment Integrity Measurement. School Psych Rev. 2009;38(4):541–6.
63. Perepletchikova F. On the Topic of Treatment Integrity. Clin Psychol Sci Pract.
2011;18(2):148–53.
64. Gresham FM. Treatment integrity and therapeutic change: Commentary on
Perepletchikova and Kazdin. Clinical Psychology: Science and Practice. 2005. p.
391–4.
65. Deeks JJ, Higgins JPT, Green S (editors). Chapter 9: Analysing data and undertaking
meta-analyses. In: Higgins JPT, Green S, editors. Cochrane Handbook for
Systematic Reviews of Interventions. Chichester (UK): John Wiley & Sons; 2008. p.
243–96.
66. Hedges L V., Olkin I. Statistical methods for meta-analysis. Orlando: Academic
Press; 1985.
67. Morris SB, DeShon RP. Combining effect size estimates in meta-analysis with
repeated measures and independent-groups designs. Psychol Methods.
2002;7(1):105–25.
68. Sterne JAC, Egger M, Moher D (editors). Chapter 10 : Addressing reporting biases.
In: Higgins JPT, Green S, editors. Cochrane Handbook for Systematic Reviews of
Interventions. Chichester (UK): John Wiley & Sons; 2008. p. 297–333.
69. Cohen H, Amerine-Dickens M, Smith T. Early intensive behavioral treatment:
replication of the UCLA model in a community setting. J Dev Behav Pediatr.
2006;27(2 Suppl):S145–55.
70. Granpeesheh D, Dixon DR, Tarbox J, Kaplan AM, Wilke AE. The effects of age and
treatment intensity on behavioral intervention outcomes for children with autism
spectrum disorders. Res Autism Spectr Disord. 2009;3(4):1014–22.
71. Harris SL, Handleman JS. Age and IQ at intake as predictors of placement for young
children with autism: a four- to six-year follow-up. J Autism Dev Disord.
2000;30(2):137–42.

101
72. Howard JS, Sparkman CR, Cohen HG, Green G, Stanislaw H. A comparison of
intensive behavior analytic and eclectic treatments for young children with autism.
Res Dev Disabil. 2005;26(4):359–83.
73. Howard JS, Stanislaw H, Green G, Sparkman CR, Cohen HG. Comparison of
behavior analytic and eclectic early interventions for young children with autism
after three years. Res Dev Disabil. 2014;35(12):3326–44.
74. Sallows GO, Graupner TD. Intensive Behavioral Treatment for Children With
Autism : Four-Year Outcome and Predictors. Am J Ment Retard. 2005;110(6):417–
38.
75. Smith T, Groen AD, Wynn JW. Randomized trial of intensive early intervention for
children with pervasive developmental disorder. Am J Ment Retard.
2000;105(4):269–85.
76. Stoelb M, Yarnal R, Miles J, Takahashi TN, Farmer JE, Mccathren RB. Predicting
Responsiveness to Treatment of Children with Autism: A Retrospective Study of the
Importance of Physical Dysmorphology. Focus Autism Other Dev Disabl.
2004;19(2):66–77.
77. Weiss MJ. Differential rates of skill acquisition and outcomes of early intensive
behavioral intervention for autism. Behav Interv. 1999;14(1):3–22.
78. Perry A, Cummings A, Dunn Geier J, Freeman NL, Hughes S, LaRose L, et al.
Effectiveness of Intensive Behavioral Intervention in a large, community-based
program. Res Autism Spectr Disord. 2008;2(4):621–42.
79. Flanagan HE, Perry A, Freeman NL. Effectiveness of large-scale community-based
Intensive Behavioral Intervention: A waitlist comparison study exploring outcomes
and predictors. Res Autism Spectr Disord. 2012;6(2):673–82.
80. Freeman N, Perry A. Outcomes of Intensive Behavioural Intervention in the Toronto
Preschool Autism Service. J Dev Disabil. 2010;16(2):17–32.
81. Perry A, Cummings A, Geier JD, Freeman NL, Hughes S, Managhan T, et al.
Predictors of outcome for children receiving intensive behavioral intervention in a
large, community-based program. Res Autism Spectr Disord. 2011;5(1):592–603.
82. Blacklock K, Perry A, Geier JD. Examining the Effectiveness of Intensive
Behavioural Intervention in Children with Autism Aged 6 and Older. J Dev Disabil.
2014;20(1):37–49.
83. Perry A, Blacklock K, Dunn Geier J. The relative importance of age and IQ as
predictors of outcomes in Intensive Behavioral Intervention. Res Autism Spectr
Disord. 2013;7(9):1142–50.

102
84. Ben-Itzchak E, Zachor D a. The effects of intellectual functioning and autism
severity on outcome of early behavioral intervention for children with autism. Res
Dev Disabil. 2007;28(3):287–303.
85. Ben Itzchak E, Zachor D a. Change in autism classification with early intervention:
Predictors and outcomes. Res Autism Spectr Disord. 2009;3(4):967–76.
86. Ben-Itzchak E, Watson LR, Zachor D a. Cognitive Ability is Associated with
Different Outcome Trajectories in Autism Spectrum Disorders. J Autism Dev
Disord. 2014;44(9):2221–9.
87. Zachor DA, Ben-Itzchak E, Rabinovich A-L, Lahat E. Change in autism core
symptoms with intervention. Res Autism Spectr Disord. 2007;1(4):304–17.
88. Zachor DA, Ben Itzchak E. Treatment approach, autism severity and intervention
outcomes in young children. Res Autism Spectr Disord. 2010;4(3):425–32.
89. Eikeseth S, Hayward D, Gale C, Gitlesen J-P, Eldevik S. Intensity of supervision and
outcome for preschool aged children receiving early and intensive behavioral
interventions: A preliminary study. Res Autism Spectr Disord. 2009 Jan;3(1):67–73.
90. Hayward D, Eikeseth S, Gale C, Morgan S. Assessing progress during treatment for
young children with autism receiving intensive behavioural interventions. Autism.
2009;13(6):613–33.
91. Remington B, Hastings RP, Kovshoff H, degli Espinosa F, Jahr E, Brown T, et al.
Early intensive behavioral intervention: outcomes for children with autism and their
parents after two years. Am J Ment Retard. 2007;112(6):418–38.
92. Eikeseth S, Smith T, Jahr E, Eldevik S. Intensive behavioral treatment at school for
4- to 7-year-old children with autism. A 1-year comparison controlled study. Behav
Modif. 2002;26(1):49–68.
93. Eikeseth S, Smith T, Jahr E, Eldevik S. Outcome for children with autism who began
intensive behavioral treatment between ages 4 and 7: a comparison controlled study.
Behav Modif. 2007;31(3):264–78.
94. Virues-Ortega J, Rodríguez V, Yu CT. Prediction of treatment outcomes and
longitudinal analysis in children with autism undergoing intensive behavioral
intervention. Int J Clin Heal Psychol. 2013;13(2):91–100.
95. Pereira MJ, Coombes BK, Comans TA, Johnston V. The impact of onsite workplace
health-enhancing physical activity interventions on worker productivity: a systematic
review. Occup Environ Med. 2015;72(6):401–12.

103
96. Yoder P, Compton D. Identifying predictors of treatment response. Ment Retard Dev
Disabil Res Rev. 2004;10(3):162–8.
97. Johnson E, Hastings RP. Facilitating factors and barriers to the implementation of
intensive home-based behavioural intervention for young children with autism. Child
Care Health Dev. 2002;28(2):123–9.
98. Symes MD, Remington B, Brown T, Hastings RP. Early intensive behavioral
intervention for children with autism: Therapists’ perspectives on achieving
procedural fidelity. Res Dev Disabil. 2006;27(1):30–42.
99. Bellg AJ, Borrelli B, Resnick B, Hecht J, Minicucci DS, Ory M, et al. Enhancing
treatment fidelity in health behavior change studies: best practices and
recommendations from the NIH Behavior Change Consortium. Heal Psychol.
2004;23(5):443–51.
100. Mcleod BD. Understanding why therapy allegiance is linked to clinical outcomes.
Clin Psychol Sci Pract. 2009;16(1):69–72.
101. Perepletchikova F. Treatment integrity and differential treatment effects. Clin
Psychol Sci Pract. 2009;16(3):379–82.
102. Goodman S, Dickersin K. Annals of Internal Medicine Editorial Metabias : A
Challenge for Comparative Effectiveness Research. Ann Intern Med.
2015;155(1):61–2.
103. Eldevik S, Hastings RP, Hughes JC, Jahr E, Eikeseth S, Cross S. Meta-analysis of
Early Intensive Behavioral Intervention for children with autism. J Clin Child
Adolesc Psychol. 2009;38(3):439–50.
104. Reichow B, Wolery M. Comprehensive synthesis of early intensive behavioral
interventions for young children with autism based on the UCLA young autism
project model. J Autism Dev Disord. 2009;39(1):23–41.
105. Spreckley M, Boyd R. Efficacy of applied behavioral intervention in preschool
children with autism for improving cognitive, language, and adaptive behavior: a
systematic review and meta-analysis. J Pediatr. 2009;154(3):338–44.
106. Makrygianni MK, Reed P. A meta-analytic review of the effectiveness of
behavioural early intervention programs for children with Autistic Spectrum
Disorders. Res Autism Spectr Disord. Elsevier Ltd; 2010 Oct;4(4):577–93.
107. Peters-Scheffer N, Didden R, Korzilius H, Sturmey P. A meta-analytic study on the
effectiveness of comprehensive ABA-based early intervention programs for children
with Autism Spectrum Disorders. Res Autism Spectr Disord. 2011;5(1):60–9.

104
108. Goeree R, Diaby V. Introduction to health economics and decision-making: Is
economics relevant for the frontline clinician? Best Pract Res Clin Gastroenterol.
2013;27(6):831–44.
109. Simoens S. Use of Economic Evaluation in Decision Making. Drugs.
2010;70(15):1917–26.
110. Yothasamut J, Tantivess S, Teerawattananon Y. Using Economic evaluation in
policy decision-making in Asian countries: Mission impossible or mission probable?
Value Heal. 2009;12(SUPPL. 3):26–30.
111. Penner M, Rayar M, Bashir N, Roberts SW, Hancock-Howard RL, Coyte PC. Cost-
Effectiveness Analysis Comparing Pre-diagnosis Autism Spectrum Disorder (ASD)-
Targeted Intervention with Ontario’s Autism Intervention Program. J Autism Dev
Disord. Springer US; 2015;45(1):2833–47.
112. Ungar WJ, Gerber A. The uniqueness of child health and challenges to measuring
costs and consequences. Economic Evaluation in Child Health. Oxford University
Press; 2009. p. 1–33.
113. Sheldon TA, Smith PC. Equity in the allocation of health care resources. Health
Econ. 2000;9(1):571–4.
114. Solomon R, Orridge C. Defining Health Equity. Healthc Pap [Internet].
2014;14(2):62–5. Available from: https://www.longwoods.com/content/24112

105
APPENDICES
Appendix 1: Search Strategies
Ovid MEDLINE (R)
1 Behavior Therapy/
2 "Early Intervention (Education)"/
3 intensive behavio?ral intervention.tw.
4 (intens* adj3 (interven* or therap* or treat* or program*)).tw.
5 (applied behavio* analy* or ABA).tw.
6 Lovaas*.tw.
7 or/1-6
8 exp Child Development Disorders, Pervasive/
9 (autis* adj3 disorder*).tw.
10 autism.tw.
11 (Kanner* adj syndrome*).tw.
12 (pervasive devel* adj3 (NOS or specified)).tw.
13 or/8-12
14 7 and 13
15 limit 14 to yr="1995 -Current"
EMBASE (Ovid)
1 Behavior Therapy/
2 Early childhood intervention/
3 intensive behavio?ral intervention.tw.
4 (intens* adj3 (interven* or therap* or treat* or program*)).tw.
5 (applied behavio* analy* or ABA).tw.
6 Lovaas*.tw.
7 or/1-6
8 exp autism/
9 (autis* adj3 disorder*).tw.
10 autism.tw.
11 (Kanner* adj syndrome*).tw.
12 (pervasive devel* adj3 (NOS or specified)).tw.
13 or/8-12
14 7 and 13
15 limit 14 to yr="1995 -Current"

106
PsycINFO (Ovid)
1 Behavior Therapy/
2 Early intervention/
3 intensive behavio?ral intervention.tw.
4 (intens* adj3 (interven* or therap* or treat* or program*)).tw.
5 (applied behavio* analy* or ABA).tw.
6 Lovaas*.tw.
7 or/1-6
8 exp autism/
9 (autis* adj3 disorder*).tw.
10 autism.tw.
11 (Kanner* adj syndrome*).tw.
12 (pervasive devel* adj3 (NOS or specified)).tw.
13 or/8-12
14 7 and 13
15 limit 14 to yr="1995 -Current"
CINAHL Plus (EBSCOhost)
S1 (MH "Early Childhood Intervention") OR (MH "Early Intervention")
S2 (MH "Behavior Therapy") OR (MH "Behavior Modification")
S3 ( TI intensive behavioral intervention or AB intensive behavioral intervention ) OR ( TI
intensive behavioural intervention or AB intensive behavioural intervention )
S4 (TI intens* N3 interven* or AB intens* N3 interven* ) OR ( TI intens* N3 therap* or
AB intens* N3 therap* ) OR ( TI intens* N3 treat* or AB intens* N3 treat* ) OR ( TI
intens* N3 program* or AB intens* N3 program* )
S5 “applied behavio* analy*" or “ABA”
S6 “lovaas*"
S7 S1 OR S2 OR S3 OR S4 OR S5 OR S6
S8 (MH "Autistic Disorder")
S9 TI autis* N1 disorder* or AB autis* N1 disorder*
S10 TI autis* N1 spectrum N1 disorder* or AB autis* N1 spectrum N1 disorder*
S11 TI autism or AB autism
S12 TI Kanner* N1 syndrome or AB Kanner* N1 syndrome
S13 TI pervasive N1 development* N1 disorder N1 "not otherwise specified" or AB
pervasive N1 development* N1 disorder N1 "not otherwise specified"

107
S14 TI pervasive N1 development* N1 disorder N1 NOS or AB pervasive N1
development* N1 disorder N1 NOS
S15 (MH "Asperger Syndrome")
S16 S8 OR S9 OR S10 OR S11 OR S12 OR S13 OR S14 OR S15
S17 S7 AND S16
S18 Limiters - Published Date: 19950101-20141231
S19 S17 AND S18
ERIC Dialog Datastar
ALL(behavio* therapy OR behavio* modification OR early intervention OR intensive
behavio* intervention OR early intensive behavio* intervention OR (intens* NEAR/3
(interven* OR therap* OR treat* OR program*)) OR applied behavio* analy* OR
Lovaas*) AND ALL (autism OR (autis* NEAR/1 disorder*) OR (autis* NEAR/1 spectrum
NEAR/1 disorder*) OR Kanner* syndrome* OR asperger* syndrome OR (pervasive
NEAR/1 development* NEAR/1 disorder* NEAR/1 "not otherwise specified") OR
(pervasive NEAR/1 development* NEAR/1 disorder* NEAR/1 NOS)) AND YR(>=1995)

108
Appendix 2: List of Excluded Studies
Reference Reason for
exclusion
Akshoomoff NA, Stahmer A. Early Intervention Programs and Policies for Children
with Autistic Spectrum Disorders. In: Fitzgerald HE, Zucker RA, Freeark K, editors.
The Crisis in Youth Mental Health: Childhood disorders. Praeger; 2006. p. 109–31.
Not full, published
journal article
Ames C. Book review: Social and Communication Development in Autism Spectrum
Disorders: Early Identification, Diagnosis and Intervention by Tony Charman and
Wendy Stone (eds). Autism. 2007;11(4):389–90.
Not full, published
journal article
Arikawa H. The Japanese Association of Special Education NII-Electronic Library
Service. Japanese J Spec Educ. 2009;47(4):265–75.
Non-English
publication
Arnold CL. A longitudinal re-evaluation of home-based behavioral treatment for
children with pervasive developmental disorders. 2002.
Not full, published
journal article
Azarbehi AC. The effectiveness of early intervention programs for children with
autism: A one-year follow-up study of Intensive Behavioural Intervention versus
preschool integration. 2009.
Not full, published
journal article
Baghdadli A, Assouline B, Sonié S, Pernon E, Darrou C, Michelon C, et al.
Developmental trajectories of adaptive behaviors from early childhood to adolescence
in a cohort of 152 children with autism spectrum disorders. J Autism Dev Disord.
2012;42(7):1314–25.
Treatment not
intensive or
comprehensive
Beglinger LJ. An information processing test and social subtyping questionnaire as
predictors of intensive behavioral treatment outcome in children with autism. 2002.
Not full, published
journal article
Ben Itzchak E, Zachor DA. Who benefits from early intervention in autism spectrum
disorders? Res Autism Spectr Disord. 2011;5(1):345–50.
Treatment not
intensive or
comprehensive
Berry LN. Early treatments associated with optimal outcome in children with autism
spectrum disorders. 2009.
Not full, published
journal article
Blue Cross Blue Shield Association. Special Report: Early Intensive Behavioral
Intervention Based on Applied Behavior Analysis among Children with Autism
Spectrum Disorders [Internet]. Technology Evaluation Center Assessment Program.
2009 [cited 2014 May 22]. Available from:
http://www.bcbs.com/blueresources/tec/press/special-report-early.html
Not full, published
journal article
Bono M a., Daley T, Sigman M. Relations among joint attention, amount of
intervention and language gain in autism. J Autism Dev Disord. 2004;34(5):495–505.
Treatment not
intensive or
comprehensive
Butter EM, Mulick JA, Metz B. Eight case reports of learning recovery in children
with pervasive developmental disorders after early intervention. Behav Interv.
2006;21(4):227–43.
SSD or multiple
non-consecutive
case reports
Cann P. Timely intervention. Nurs Stand. 2000;14(32):20. Not primary
research
Carr JE, Firth AM. The verbal behavior approach to early and intensive behavioral
intervention for autism: A call for additional empirical support. J Early Intensive
Behav Interv. 2005;2(1):18–27.
Not primary
research
Clark J. Merit mentalization enhanced remediation: An integrated treatment a
comprehensive intervention for children with autism. 2011.
Not full, published
journal article
Coucouvanis J. Behavioral intervention for children with autism. J Child Adolesc
Psychiatr Nurs. 1992;10(1):37–44.
Not primary
research
Darrou C, Pry R, Pernon E, Michelon C, Aussilloux C, Baghdadli A. Outcome of
young children with autism: does the amount of intervention influence developmental
trajectories? Autism. 2010;14(6):663–77.
Treatment not
intensive or
comprehensive
Dawson G. Early intensive behavioral intervention appears beneficial for young
children with autism spectrum disorders. J Pediatr. United States: Mosby, Inc.;
2013;162(5):1080–1.
Not primary
research

109
Dawson G. Review: more RCTs on early intensive behavioural intervention for young
children with autism spectrum disorders needed. Evid Based Ment Heal. England:
Department of Psychiatry, University of North Carolina, Autism Speaks, Chapel Hill,
North Carolina, USA.; 2013;16(2):45.
Not primary
research
Dawson G, Burner K. Behavioral interventions in children and adolescents with
autism spectrum disorder : a review of recent findings. Curr Opin Pediatr.
2011;23(6):616–20.
Not primary
research
Dawson G, Jones EJH, Merkle K, Venema K, Lowy R, Faja S, et al. Early behavioral
intervention is associated with normalized brain activity in young children with
autism. J Am Acad Child Adolesc Psychiatry. Elsevier Inc.; 2012;51(11):1150–9.
Treatment not
intensive or
comprehensive
Dawson G, Rogers S, Munson J, Smith M, Winter J, Greenson J, et al. Randomized,
controlled trial of an intervention for toddlers with autism: the Early Start Denver
Model. Pediatrics. Am Acad Pediatrics; 2010;125(1):e17–23.
Treatment not
intensive or
comprehensive
Dawson M, Gernsbacher MA. Effectiveness of intensive autism programmes. Lancet.
2010;375(9716):722–3.
Not primary
research
De La Osa D. An applied behavior analysis after-school program to treat autistic
children and educate their parents. 2002.
Not full, published
journal article
De Rivera C. The use of intensive behavioural intervention for children with autism. J
Dev Disabil. 2008;14(2):1–15.
Not primary
research
Dionne C, Paquet A, Rousseau M. Programmes d’intervention précoce pour les
enfants ayant un trouble envahissant du développement et des retards de
développement. Approch Neuropsychol des apprentissages chez l’enfant. PDG
Communication; 2011;(115):466–72.
Non-English
publication
Douglas L. An Evaluation of the Effectiveness of Early Intervention on Autistic
Children. 1999.
Not full, published
journal article
Eapen V, Črnčec R, Walter A. Clinical outcomes of an early intervention program for
preschool children with Autism Spectrum Disorder in a community group setting.
BMC Pediatr. 2013;13(1):1–9.
Treatment not
intensive or
comprehensive
Eikeseth S. Intensive behavioural intervention for children with autism. A reply to
prior. J Paediatr Child Health. 2005;41(7):391–2.
Not full, published
journal article
Eikeseth S, Klintwall L, Jahr E, Karlsson P. Outcome for children with autism
receiving early and intensive behavioral intervention in mainstream preschool and
kindergarten settings. Res Autism Spectr Disord. 2012;6(2):829–35.
Treatment not
administered by
trained/qualified
therapist
Eldevik S, Hastings RP, Hughes JC, Jahr E, Eikeseth S, Cross S. Meta-analysis of
Early Intensive Behavioral Intervention for children with autism. J Clin Child Adolesc
Psychol. 2009;38(3):439–50.
Not primary
research
Eldevik S, Hastings RP, Hughes JC, Jahr E, Eikeseth S, Cross S. Using participant
data to extend the evidence base for intensive behavioral intervention for children with
autism. Am J Intellect Dev Disabil. 2010;115(5):381–405.
Not primary
research
Eldevik S, Hastings RP, Jahr E, Hughes JC. Outcomes of behavioral intervention for
children with autism in mainstream pre-school settings. J Autism Dev Disord.
2012;42(2):210–20.
Treatment not
intensive or
comprehensive
Eriksson MA, Westerlund J, Hedvall A, Amark P, Gillberg C, Fernell E. Medical
conditions affect the outcome of early intervention in preschool children with autism
spectrum disorders. Eur Child Adolesc Psychiatry. 2013;22(1):23–33.
Treatment not
administered by
trained/qualified
therapist
Farrell P, Trigonaki N, Webster D. An exploratory evaluation of two early intervention
programmes for young children with autism. Educ child Psychol. 2005;22(4):29–40.
Not primary
research
Fava L, Strauss K, Valeri G, D’Elia L, Arima S, Vicari S. The effectiveness of a cross-
setting complementary staff- and parent-mediated early intensive behavioral
intervention for young children with ASD. Res Autism Spectr Disord.
2011;5(4):1479–92.
Treatment not
administered by
trained/qualified
therapist
Fernell E, Eriksson MA, Gillberg C. Early diagnosis of autism and impact on
prognosis: a narrative review. Clin Epidemiol. 2013;5(1):33–43.
Not primary
research

110
Fernell E, Hedvall A, Westerlund J, Hoglund Carlsson L, Eriksson M, Barnevik
Olsson M, et al. Early intervention in 208 Swedish preschoolers with autism spectrum
disorder. A prospective naturalistic study. Res Dev Disabil. 2011;32(6):2092–101.
Treatment not
administered by
trained/qualified
therapist
Finch L, Raffaele C. Developing expert practice Intensive behavioural intervention for
children with autism: a review of the evidence. Occup Ther Now. 2003;5(4):20–3.
Not full, published
journal article
Flanagan HE. The impact of community-based intensive behavioural intervention.
2009.
Not full, published
journal article
Foxx RM. Applied behavior analysis treatment of autism: the state of the art. Child
Adolesc Psychiatr Clin N Am. 2008;17(4):821–34.
Not primary
research
Freitag CM. Empirically based early intervention programs for children with autistic
disorders-a selective literature review. Zeitschrift fur Kinder-und Jugendpsychiatrie
und Psychother. 2010;38(4):247–56.
Non-English
publication
Gabriels RL, Ivers BJ, Hill DE, Agnew J a., McNeill J. Stability of adaptive behaviors
in middle-school children with autism spectrum disorders. Res Autism Spectr Disord.
2007;1(4):291–303.
Treatment not
intensive or
comprehensive
Goods KS, Ishijima E, Chang YC, Kasari C. Preschool based JASPER intervention in
minimally verbal children with autism: Pilot RCT. J Autism Dev Disord.
2013;43(5):1050–6.
Treatment not
intensive or
comprehensive
Gould E, Dixon DR, Najdowski AC, Smith MN, Tarbox J. A review of assessments
for determining the content of early intensive behavioral intervention programs for
autism spectrum disorders. Res Autism Spectr Disord [Internet]. Elsevier Ltd;
2011;5(3):990–1002. Available from: http://dx.doi.org/10.1016/j.rasd.2011.01.012
Not primary
research
Granpeesheh D, Kenzer A, Tarbox J. FC05-06 - Comparison of two-year outcomes for
children with autism receiving high versus low-intensity behavioral intervention. Eur
Psychiatry. 2011;26(Suppl1):1839.
Not full, published
journal article
Granpeesheh D, Tarbox J, Dixon DR, Carr E, Herbert M. Retrospective analysis of
clinical records in 38 cases of recovery from autism. Ann Clin Psychiatry.
2009;21(4):195–204.
Not primary
research
Granpeesheh D. Applied behavior analytic interventions for children with autism: a
description and review of treatment research. Ann Clin Psychiatry. 2009;21(3):162–
73.
SSD or multiple
non-consecutive
case reports
Green G. Early behavioral intervention for autism: What does research tell us? In:
Maurice C, Green G, Luce SC, editors. Behavioral Intervention for Young Children
With Autism: A Manual for Parents and Professionals. Pro-Ed.; 1996. p. 29–44.
Not full, published
journal article
Green G. On valid inferences: Comments on Weiss. Behav Interv. 1999;14(1):23–7. Not primary
research
Harris SL, Weiss MJ. Right from the Start: Behavioral Intervention for Young
Children with Autism. Woodbine House; 2007.
Not primary
research
Harris SL, Delmolino L. Applied Behavior Analysis : Its application in the treatment
of autism and related disorders in young children. Infants Young Child.
2002;14(3):11–7.
Not full, published
journal article
Herpertz-Dahlmann B, Konrad K, Freitag C. Autismus heute. Frühförderung
Interdiszip. 2009;29(1):3–12.
Non-English
publication
Horner CH. Influences of combined intervention therapies on learning, achievement,
and behavior ratings for children diagnosed with autism spectrum disorders. 2009.
Not full, published
journal article
Horner RH, Carr EG, Strain PS, Todd a W, Reed HK. Problem behavior interventions
for young children with autism: A research synthesis. J Autism Dev Disord.
2002;32(5):423–46.
Not primary
research
Hourmanesh N. Early comprehensive interventions for children with autism: A meta-
analysis. 2006.
Not full, published
journal article
Howlin P. The effectiveness of interventions for children with autism. J neural
Transm. 2005;(s69):101–19.
Not primary
research
Howlin P, Magiati I, Charman T. Systematic review of early intensive behavioral
interventions for children with autism. Am J Intellect Dev Disabil. 2009;114(1):23–41.
Not primary
research
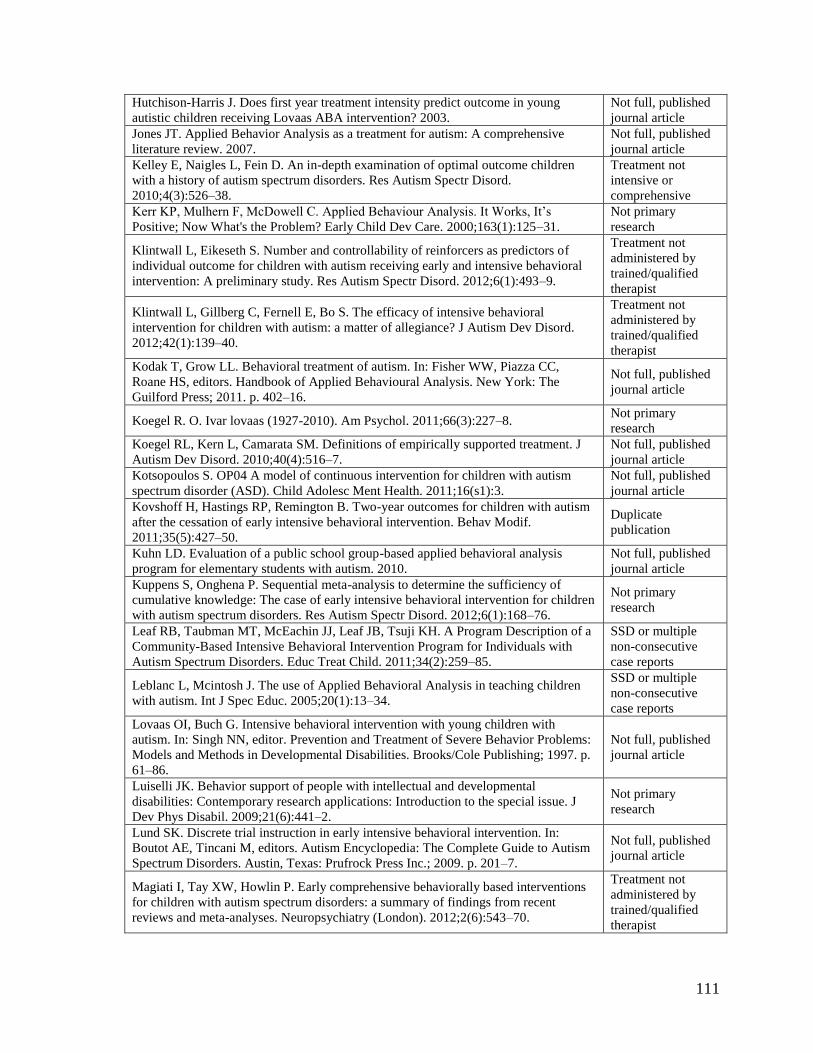
111
Hutchison-Harris J. Does first year treatment intensity predict outcome in young
autistic children receiving Lovaas ABA intervention? 2003.
Not full, published
journal article
Jones JT. Applied Behavior Analysis as a treatment for autism: A comprehensive
literature review. 2007.
Not full, published
journal article
Kelley E, Naigles L, Fein D. An in-depth examination of optimal outcome children
with a history of autism spectrum disorders. Res Autism Spectr Disord.
2010;4(3):526–38.
Treatment not
intensive or
comprehensive
Kerr KP, Mulhern F, McDowell C. Applied Behaviour Analysis. It Works, It’s
Positive; Now What's the Problem? Early Child Dev Care. 2000;163(1):125–31.
Not primary
research
Klintwall L, Eikeseth S. Number and controllability of reinforcers as predictors of
individual outcome for children with autism receiving early and intensive behavioral
intervention: A preliminary study. Res Autism Spectr Disord. 2012;6(1):493–9.
Treatment not
administered by
trained/qualified
therapist
Klintwall L, Gillberg C, Fernell E, Bo S. The efficacy of intensive behavioral
intervention for children with autism: a matter of allegiance? J Autism Dev Disord.
2012;42(1):139–40.
Treatment not
administered by
trained/qualified
therapist
Kodak T, Grow LL. Behavioral treatment of autism. In: Fisher WW, Piazza CC,
Roane HS, editors. Handbook of Applied Behavioural Analysis. New York: The
Guilford Press; 2011. p. 402–16.
Not full, published
journal article
Koegel R. O. Ivar lovaas (1927-2010). Am Psychol. 2011;66(3):227–8. Not primary
research
Koegel RL, Kern L, Camarata SM. Definitions of empirically supported treatment. J
Autism Dev Disord. 2010;40(4):516–7.
Not full, published
journal article
Kotsopoulos S. OP04 A model of continuous intervention for children with autism
spectrum disorder (ASD). Child Adolesc Ment Health. 2011;16(s1):3.
Not full, published
journal article
Kovshoff H, Hastings RP, Remington B. Two-year outcomes for children with autism
after the cessation of early intensive behavioral intervention. Behav Modif.
2011;35(5):427–50.
Duplicate
publication
Kuhn LD. Evaluation of a public school group-based applied behavioral analysis
program for elementary students with autism. 2010.
Not full, published
journal article
Kuppens S, Onghena P. Sequential meta-analysis to determine the sufficiency of
cumulative knowledge: The case of early intensive behavioral intervention for children
with autism spectrum disorders. Res Autism Spectr Disord. 2012;6(1):168–76.
Not primary
research
Leaf RB, Taubman MT, McEachin JJ, Leaf JB, Tsuji KH. A Program Description of a
Community-Based Intensive Behavioral Intervention Program for Individuals with
Autism Spectrum Disorders. Educ Treat Child. 2011;34(2):259–85.
SSD or multiple
non-consecutive
case reports
Leblanc L, Mcintosh J. The use of Applied Behavioral Analysis in teaching children
with autism. Int J Spec Educ. 2005;20(1):13–34.
SSD or multiple
non-consecutive
case reports
Lovaas OI, Buch G. Intensive behavioral intervention with young children with
autism. In: Singh NN, editor. Prevention and Treatment of Severe Behavior Problems:
Models and Methods in Developmental Disabilities. Brooks/Cole Publishing; 1997. p.
61–86.
Not full, published
journal article
Luiselli JK. Behavior support of people with intellectual and developmental
disabilities: Contemporary research applications: Introduction to the special issue. J
Dev Phys Disabil. 2009;21(6):441–2.
Not primary
research
Lund SK. Discrete trial instruction in early intensive behavioral intervention. In:
Boutot AE, Tincani M, editors. Autism Encyclopedia: The Complete Guide to Autism
Spectrum Disorders. Austin, Texas: Prufrock Press Inc.; 2009. p. 201–7.
Not full, published
journal article
Magiati I, Tay XW, Howlin P. Early comprehensive behaviorally based interventions
for children with autism spectrum disorders: a summary of findings from recent
reviews and meta-analyses. Neuropsychiatry (London). 2012;2(6):543–70.
Treatment not
administered by
trained/qualified
therapist

112
Magiati I, Charman T, Howlin P. A two-year prospective follow-up study of
community-based early intensive behavioural intervention and specialist nursery
provision for children with autism spectrum disorders. J Child Psychol Psychiatry.
2007;48(8):803–13.
Treatment not
administered by
trained/qualified
therapist
Magiati I, Moss J, Charman T, Howlin P. Patterns of change in children with Autism
Spectrum Disorders who received community based comprehensive interventions in
their pre-school years: A seven year follow-up study. Res Autism Spectr Disord.
2011;5(3):1016–27.
Not primary
research
Maglione MA, Gans D, Das L, Timbie J, Kasari C, Network HAIRB (AIR-B.
Nonmedical interventions for children with ASD: Recommended guidelines and
further research needs. Pediatrics. 2012;130(Suppl 2):S169–78.
Not primary
research
Makrygianni MK, Reed P. A meta-analytic review of the effectiveness of behavioural
early intervention programs for children with Autistic Spectrum Disorders. Res
Autism Spectr Disord. Elsevier Ltd; 2010 Oct;4(4):577–93.
Not primary
research
Mandell DS, Levy SE, Schultz RT. Department of error: Effectiveness of intensive
autism programmes - author’s reply. Lancet. 2011;378(9805):1778.
Duplicate
publication
Matson JL, Benavidez D a., Compton LS, Paclawskyj T, Baglio C. Behavioral
treatment of autistic persons: A review of research from 1980 to the present. Res Dev
Disabil. 1996;17(6):433–65.
Not primary
research
Matson JL, Goldin RL. Early Intensive Behavioral Interventions: Selecting behaviors
for treatment and assessing treatment effectiveness. Res Autism Spectr Disord.
2014;8(2):138–42.
Not primary
research
Matson JL, Konst MJ. What is the evidence for long term effects of early autism
interventions? Res Autism Spectr Disord. 2013;7(3):475–9.
Not primary
research
Matson JL, Rieske RD. Are outcome measures for early intensive treatment of autism
improving? Res Autism Spectr Disord. 2014;8(3):178–85.
Not primary
research
Matson JL, Smith KRM. Current status of intensive behavioral interventions for young
children with autism and PDD-NOS. Res Autism Spectr Disord. 2008;2(1):60–74.
Not primary
research
Mercier C, Cusson N. Le traitement précoce de l’autisme: L'intensité de l'intervention
seule en cause? Rev québécoise Psychol. 2005;26(3):13–28.
Non-English
publication
Morris EK. A case study in the misrepresentation of applied behavior analysis in
autism: the Gernsbacher lectures. Behav Anal. 2009;32(1):205–40.
Not primary
research
Mrug S, Hodgens JB. Behavioral Summer Treatment Program improves social and
behavioral functioning of four children with Asperger’s disorder`. Clin Case Stud.
2008;7(3):171–90.
No ASD diagnosis
Muratori F, Narzisi A, Tancredi R. Interventi precoci nell’autismo: una review [Early
interventions for autism: A review]. G Di Neuropsichiatr Dell’età Evol.
2010;30(2):136–48.
Non-English
publication
Nakajima Y. Social Life and Institutional Care of Severely Autistic Adolescents.
Japanese J Child Adolesc Psychiatry. 1996;37(1):12–8.
Non-English
publication
O’Connor AB, Healy O. Long-term post-intensive behavioral intervention outcomes
for five children with Autism Spectrum Disorder. Res Autism Spectr Disord.
2010;4(4):594–604.
SSD or multiple
non-consecutive
case reports
Ogiwara H, Takahashi O. Developmental Changes in Autistic Toddlers who Received
Very Early Intervention. Japanese J Child Adolesc Psychiatry. 2003;44(3):305–20.
Non-English
publication
Olszyk RK. Changes in symptomatology and functioning of preschoolers with autism
in the context of the DIR model. 2005.
Not full, published
journal article
Ospina MB, Seida JK, Clark B, Karkhaneh M, Hartling L, Tjosvold L, et al.
Behavioural and developmental interventions for autism spectrum disorder: a clinical
systematic review. PLoS One. 2008;3(11):1–32.
Not primary
research
Pellecchia M. Predictors of outcome for children with autism receiving a behavioral
intervention. 2013.
Not full, published
journal article
Pérez-González LA, Williams G. Comprehensive program for teaching skills to
children with autism. Psicothema. 2005;17(2):233–44.
Non-English
publication

113
Petermann F, Petermann U. Intensivtherapie. Kindheit und Entwicklung. Hogrefe &
Huber; 2012;21(2):77–80.
Non-English
publication
Peters-Scheffer N, Didden R, Korzilius H, Sturmey P. A meta-analytic study on the
effectiveness of comprehensive ABA-based early intervention programs for children
with Autism Spectrum Disorders. Res Autism Spectr Disord. 2011;5(1):60–9.
Not primary
research
Poustka L, Rothermel B, Banaschewski T, Kamp-Becker I. Intensive
verhaltenstherapeutische Interventionsprogramme bei Autismus-Spektrum-Störungen.
Kindheit und Entwicklung. Hogrefe & Huber; 2012;21(2):81–9.
Non-English
publication
Prichard EA. Short-term follow-up of of children with autism who have received
intensive behavioural intervention. 2011.
Not full, published
journal article
Prior M. Editorial comment. J Paediatr Child Health. 2004;40(9-10):506–7. Not primary
research
Reichow B. Overview of meta-analyses on early intensive behavioral intervention for
young children with autism spectrum disorders. J Autism Dev Disord.
2012;42(4):512–20.
Not primary
research
Reichow B, Barton EE, Boyd B a, Hume K. Early intensive behavioral intervention
(EIBI) for young children with autism spectrum disorders (ASD). Cochrane Database
Syst Rev. 2012;(10):1–60.
Not primary
research
Reichow B, Wolery M. Comprehensive synthesis of early intensive behavioral
interventions for young children with autism based on the UCLA young autism project
model. J Autism Dev Disord. 2009;39(1):23–41.
Not primary
research
Reitzel J, Summers J, Lorv B, Szatmari P, Zwaigenbaum L, Georgiades S, et al. Pilot
randomized controlled trial of a Functional Behavior Skills Training program for
young children with Autism Spectrum Disorder who have significant early learning
skill impairments and their families. Res Autism Spectr Disord. Elsevier Ltd;
2013;7(11):1418–32.
Treatment not
intensive or
comprehensive
Rhea P. Sally J. Rogers and Geraldine Dawson: Review of Early Start Denver Model
for Young Children with Autism: Promoting Language, Learning and Engagement. J
Autism Dev Disord. 2011;41(7):978–80.
Not full, published
journal article
Ringdahl JE, Kopelman T, Falcomata TS. Applied behavior analysis and its
application to autism and autism related disorders. In: Matson JL, editor. Applied
Behavior Analysis for Cihldren with Autism Spectrum Disorders. New York: Springer
Science+Business Media; 2009. p. 15–32.
Not full, published
journal article
Rivers J, Nye C. The conclusion that ABI has inconclusive effects for children with
autism may stem from the fact that there are few high quality studies. Evid Based
Commun Assess Interv. 2010;4(2):62–4.
Not primary
research
Romanczyk RG. Comments on Weiss. Behav Interv. 1999;14(1):35–6. Not primary
research
Roussel B, Zimmermann C, Duldulao P, Ahmed T. IBI Training: Predictors of
Outcome in the Area of Language Acquisition in Children with Autism Spectrum
Disorder. J Dev Disabil. 2010;16(3):78–80.
Non-objective
outcome measure
Sénéchal C, Forget J, Giroux N. Les programmes de type Lovaas et la réadaptation en
autisme infantile. / Lovaas-type programs and readaptation in autistic children. Rev
Psychoéducation. 2003;32(1):123–48.
Non-English
publication
Shade-Monuteaux DM. An innovative approach for children with autism spectrum
disorders: A preliminary outcome evaluation. 2003.
Not full, published
journal article
Shapiro T, Hertzig M. Applied behavioral analysis: astonishing results? J Am Acad
Child Adolesc Psychiatry. 1995;34(10):1255–6.
Not full, published
journal article
Sharma P, Heywood A, Rajkumar D. IBI training: Social and play skills upon entry as
predictors of outcome in children with autism spectrum disorder. J Dev Disabil. 2010;
Non-objective
outcome measure
Shattuck PT, Grosse SD. Issues related to the diagnosis and treatment of autism
spectrum disorders. Ment Retard Dev Disabil Res Rev. 2007;13(2):129–35.
Not primary
research
Shea V. A perspective on the research literature related to early intensive behavioral
intervention (Lovaas) for young children with autism. Commun Disord Q.
2005;26(2):102–11.
Duplicate
publication

114
Shea V. A perspective on the research literature related to early intensive behavioral
intervention (Lovaas) for young children with autism. Autism. 2004;8(4):349–67.
Not primary
research
Shi P, Yu Q, Guo S-Q, Li Y. Applied behavioral analysis treatment for autism. J Clin
Rehabil Tissue Eng Res. 2007;11(52):10489–91.
Non-English
publication
Siegel B. Autistic Learning Disabilities and Individualizing Treatment for Autistic
Spectrum Disorders. Infants Young Child. 1999;12(2):27–36.
Not primary
research
Simpson RL. Early Intervention with Children with Autism: The Search for Best
Practices. J Assoc Pers with Sev Handicap. 1999;24(3):218–21.
Not primary
research
Smith IM, Koegel RL, Koegel LK, Openden DA, Fossum KL, Bryson SE.
Effectiveness of a novel community-based early intervention model for children with
autistic spectrum disorder. Am J Intellect Dev Disabil. 2010;115(6):504–23.
Treatment not
intensive or
comprehensive
Smith T, Lovaas OI. Intensive and early behavioral intervention with autism: the
UCLA Young Autism Project. Infants Young Child. 1998;10(3):67–78.
SSD or multiple
non-consecutive
case reports
Smith T, Eikeseth S, Klevstrand M, Lovaas OI. Intensive behavioral treatment for
preschoolers with severe mental retardation and pervasive developmental disorder. Am
J Ment Retard. 1997;102(3):238–49.
Not full, published
journal article
Smith T. Early and Intensive Behavioral Intervention in Autism. In: Weisz JR, Kazdin
AE, editors. Evidence-Based Psychotherapies for Children and Adolescents. Second
Edi. New York; 2010. p. 312–26.
Not primary
research
Smith T, Eikeseth S, Sallows GO, Graupner TD. Efficacy of applied behavior analysis
in autism. J Pediatr. 2009;155(1):151–2.
Not full, published
journal article
Smith T, Groen AD, Wynn JW. ERRATA. Am J Ment Retard. 2001;106(3):208. Not full, published
journal article
Soltanifar A, Hojati M, Mashhadi A, Reebye P. P01-353 A comparative efficacy of
Holistic Multidimensional Treatment Model (HMTM) and Applied Behavioral
Analysis (ABA) in the treatment of children with Autism Spectrum Disorder (ASD).
Eur Psychiatry. 2011;26(s1):355.
Not full, published
journal article
Spreckley M, Boyd R. Efficacy of applied behavioral intervention in preschool
children with autism for improving cognitive, language, and adaptive behavior: a
systematic review and meta-analysis. J Pediatr. 2009;154(3):338–44.
Not primary
research
Strain PS, Schwartz I. Positive behavior support and early intervention for young
children with autism: Case studies on the efficacy of proactive treatment of problem
behavior. In: Sailor W, Dunlap G, Sugai G, Horner R, editors. Handbook of Positive
Behavior Support. Springer Science+Business Media; 2009. p. 107–23.
Not full, published
journal article
Strauss K, Mancini F, Fava L, SPC Group. Parent inclusion in early intensive behavior
interventions for young children with ASD: a synthesis of meta-analyses from 2009 to
2011. Res Dev Disabil. 2013;34(9):2967–85.
Not primary
research
Technology Assessment Reports. Autism and Lovaas treatment: a systematic review
of effectiveness evidence. Int J Technol Assesment Heal Care. 2001;17(2):252.
Not primary
research
Tonge BJ, Bull K, Brereton A, Wilson R. A review of evidence-based early
intervention for behavioural problems in children with autism spectrum disorder: the
core components of effective programs, child-focused interventions and
comprehensive treatment models. Curr Opin Psychiatry. 2014;27(2):158–65.
Not primary
research
Tsakiris EA. Treatment Effectiveness in Preschool Autism: A Look at Affective
Variables. 2009.
Not full, published
journal article
Valenti M, Cerbo R, Masedu F, De Caris M, Sorge G. Intensive intervention for
children and adolescents with autism in a community setting in Italy: a single-group
longitudinal study. Child Adolesc Psychiatry Ment Health. 2010;4(1):1–9.
Treatment not
intensive or
comprehensive
Van Dyke EM. Autistic disorder: early interventions can improve outcomes. JAAPA
Off J Am Acad Physician Assist. 2009;22(7):18–9.
Not primary
research
Van Kraayenoord C. Revisiting the key lessons learned from inclusive education:
Continuing the research agenda. Int J Disabil Dev Educ. 2007;54(2):145–9.
Not primary
research
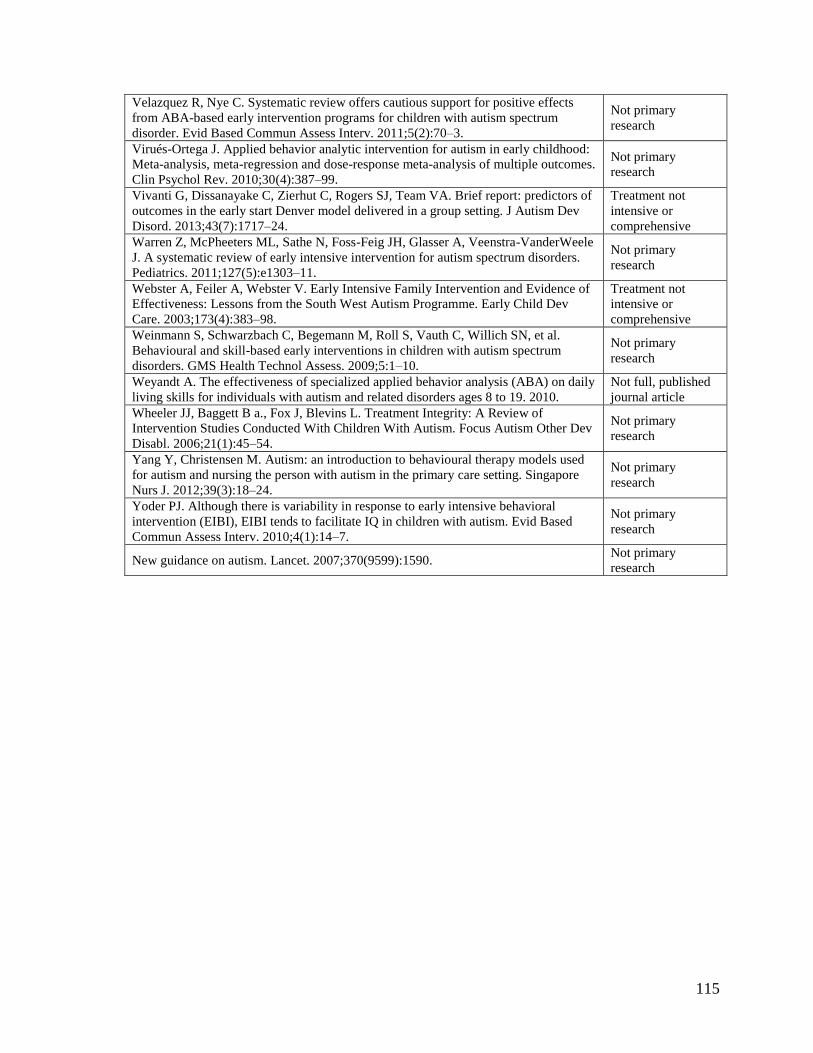
115
Velazquez R, Nye C. Systematic review offers cautious support for positive effects
from ABA-based early intervention programs for children with autism spectrum
disorder. Evid Based Commun Assess Interv. 2011;5(2):70–3.
Not primary
research
Virués-Ortega J. Applied behavior analytic intervention for autism in early childhood:
Meta-analysis, meta-regression and dose-response meta-analysis of multiple outcomes.
Clin Psychol Rev. 2010;30(4):387–99.
Not primary
research
Vivanti G, Dissanayake C, Zierhut C, Rogers SJ, Team VA. Brief report: predictors of
outcomes in the early start Denver model delivered in a group setting. J Autism Dev
Disord. 2013;43(7):1717–24.
Treatment not
intensive or
comprehensive
Warren Z, McPheeters ML, Sathe N, Foss-Feig JH, Glasser A, Veenstra-VanderWeele
J. A systematic review of early intensive intervention for autism spectrum disorders.
Pediatrics. 2011;127(5):e1303–11.
Not primary
research
Webster A, Feiler A, Webster V. Early Intensive Family Intervention and Evidence of
Effectiveness: Lessons from the South West Autism Programme. Early Child Dev
Care. 2003;173(4):383–98.
Treatment not
intensive or
comprehensive
Weinmann S, Schwarzbach C, Begemann M, Roll S, Vauth C, Willich SN, et al.
Behavioural and skill-based early interventions in children with autism spectrum
disorders. GMS Health Technol Assess. 2009;5:1–10.
Not primary
research
Weyandt A. The effectiveness of specialized applied behavior analysis (ABA) on daily
living skills for individuals with autism and related disorders ages 8 to 19. 2010.
Not full, published
journal article
Wheeler JJ, Baggett B a., Fox J, Blevins L. Treatment Integrity: A Review of
Intervention Studies Conducted With Children With Autism. Focus Autism Other Dev
Disabl. 2006;21(1):45–54.
Not primary
research
Yang Y, Christensen M. Autism: an introduction to behavioural therapy models used
for autism and nursing the person with autism in the primary care setting. Singapore
Nurs J. 2012;39(3):18–24.
Not primary
research
Yoder PJ. Although there is variability in response to early intensive behavioral
intervention (EIBI), EIBI tends to facilitate IQ in children with autism. Evid Based
Commun Assess Interv. 2010;4(1):14–7.
Not primary
research
New guidance on autism. Lancet. 2007;370(9599):1590. Not primary
research

116
Appendix 3: List of Included Studies
Ref No. Reference Category of
Publication
(85)
Ben Itzchak E, Zachor D a. Change in autism classification with
early intervention: Predictors and outcomes. Res Autism Spectr
Disord. 2009;3(4):967–76.
Unique study
(86)
Ben-Itzchak E, Watson LR, Zachor D a. Cognitive Ability is
Associated with Different Outcome Trajectories in Autism Spectrum
Disorders. J Autism Dev Disord. 2014;44(9):2221–9.
Unique study
(84)
Ben-Itzchak E, Zachor D a. The effects of intellectual functioning
and autism severity on outcome of early behavioral intervention for
children with autism. Res Dev Disabil. 2007;28(3):287–303.
Unique study
(82)
Blacklock K, Perry A, Geier JD. Examining the Effectiveness of
Intensive Behavioural Intervention in Children with Autism Aged 6
and Older. J Dev Disabil. 2014;20(1):37–49.
Unique study
(69)
Cohen H, Amerine-Dickens M, Smith T. Early intensive behavioral
treatment: replication of the UCLA model in a community setting. J
Dev Behav Pediatr. 2006;27(2 Suppl):S145–55.
Unique study
(89)
Eikeseth S, Hayward D, Gale C, Gitlesen J-P, Eldevik S. Intensity of
supervision and outcome for preschool aged children receiving early
and intensive behavioral interventions: A preliminary study. Res
Autism Spectr Disord. 2009 Jan;3(1):67–73.
Unique study
(92)
Eikeseth S, Smith T, Jahr E, Eldevik S. Intensive behavioral
treatment at school for 4- to 7-year-old children with autism. A 1-
year comparison controlled study. Behav Modif. 2002;26(1):49–68. Publications
based on same
study (93)
Eikeseth S, Smith T, Jahr E, Eldevik S. Outcome for children with
autism who began intensive behavioral treatment between ages 4 and
7: a comparison controlled study. Behav Modif. 2007;31(3):264–78.
(79)
Flanagan HE, Perry A, Freeman NL. Effectiveness of large-scale
community-based Intensive Behavioral Intervention: A waitlist
comparison study exploring outcomes and predictors. Res Autism
Spectr Disord. 2012;6(2):673–82.
Unique study
(80)
Freeman N, Perry A. Outcomes of Intensive Behavioural
Intervention in the Toronto Preschool Autism Service. J Dev Disabil.
2010;16(2):17–32.
Unique study
(70)
Granpeesheh D, Dixon DR, Tarbox J, Kaplan AM, Wilke AE. The
effects of age and treatment intensity on behavioral intervention
outcomes for children with autism spectrum disorders. Res Autism
Spectr Disord. 2009;3(4):1014–22.
Unique study
(71)
Harris SL, Handleman JS. Age and IQ at intake as predictors of
placement for young children with autism: a four- to six-year follow-
up. J Autism Dev Disord. 2000;30(2):137–42.
Unique study
(90)
Hayward D, Eikeseth S, Gale C, Morgan S. Assessing progress
during treatment for young children with autism receiving intensive
behavioural interventions. Autism. 2009;13(6):613–33.
Unique study

117
(72)
Howard JS, Sparkman CR, Cohen HG, Green G, Stanislaw H. A
comparison of intensive behavior analytic and eclectic treatments for
young children with autism. Res Dev Disabil. 2005;26(4):359–83. Publications
based on same
study (73)
Howard JS, Stanislaw H, Green G, Sparkman CR, Cohen HG.
Comparison of behavior analytic and eclectic early interventions for
young children with autism after three years. Res Dev Disabil.
2014;35(12):3326–44.
(83)
Perry A, Blacklock K, Dunn Geier J. The relative importance of age
and IQ as predictors of outcomes in Intensive Behavioral
Intervention. Res Autism Spectr Disord. 2013;7(9):1142–50.
Two unique
studies within one
publication:
S1: Perry (2013a)
S2: Perry (2013b)
(78)
Perry A, Cummings A, Dunn Geier J, Freeman NL, Hughes S,
LaRose L, et al. Effectiveness of Intensive Behavioral Intervention in
a large, community-based program. Res Autism Spectr Disord.
2008;2(4):621–42. Publications
based on same
study
(81)
Perry A, Cummings A, Geier JD, Freeman NL, Hughes S, Managhan
T, et al. Predictors of outcome for children receiving intensive
behavioral intervention in a large, community-based program. Res
Autism Spectr Disord. 2011;5(1):592–603.
(91)
Remington B, Hastings RP, Kovshoff H, degli Espinosa F, Jahr E,
Brown T, et al. Early intensive behavioral intervention: outcomes for
children with autism and their parents after two years. Am J Ment
Retard. 2007;112(6):418–38.
Unique study
(74)
Sallows GO, Graupner TD. Intensive Behavioral Treatment for
Children With Autism : Four-Year Outcome and Predictors. Am J
Ment Retard. 2005;110(6):417–38.
Unique study
(75)
Smith T, Groen AD, Wynn JW. Randomized trial of intensive early
intervention for children with pervasive developmental disorder. Am
J Ment Retard. 2000;105(4):269–85.
Unique study
(76)
Stoelb M, Yarnal R, Miles J, Takahashi TN, Farmer JE, Mccathren
RB. Predicting Responsiveness to Treatment of Children with
Autism: A Retrospective Study of the Importance of Physical
Dysmorphology. Focus Autism Other Dev Disabl. 2004;19(2):66–77.
Unique study
(94)
Virues-Ortega J, Rodríguez V, Yu CT. Prediction of treatment
outcomes and longitudinal analysis in children with autism
undergoing intensive behavioral intervention. Int J Clin Heal
Psychol. 2013;13(2):91–100.
Unique study
(77)
Weiss MJ. Differential rates of skill acquisition and outcomes of
early intensive behavioral intervention for autism. Behav Interv.
1999;14(1):3–22.
Unique study
(88)
Zachor DA., Ben Itzchak E. Treatment approach, autism severity and
intervention outcomes in young children. Res Autism Spectr Disord.
2010;4(3):425–32.
Unique study
(87)
Zachor DA., Ben-Itzchak E, Rabinovich A-L, Lahat E. Change in
autism core symptoms with intervention. Res Autism Spectr Disord.
2007;1(4):304–17.
Unique study

118
Appendix 4: Characteristics of Included Studies
Table 2. Study, sponsorship and design characteristics of included studies
First author, year (Ref. No.) Country Sponsorshipi Design
Diagnosisii Labeliii Typeiv Assignment
Ben-Itzchak, 2007 (84) Israel Ministry of
Education Autism ADI-R, ADOS, DSM-IV BA –
Ben-Itzchak, 2009 (85) Israel Private support Autism ADI-R, ADOS, DSM-IV BA –
Ben-Itzchak, 2014 (86) Israel – ASD ADI-R, ADOS, DSM-IV BA –
Blacklock, 2014 (82) Canada York
University
Autism/autistic disorder (55%), PDD or
ASD (38%), PDD-NOS (7%) CARS, DSM-IV BA –
Cohen, 2006 (69) USA NIMH Autism (83%), PDD-NOS (17%) ADI-R, DSM-IV NRCT Parent preference
Eikeseth, 2002, 2007 (92,93) Norway NIH Autism ADI-R, ICD-10 NRCT Therapist availability
Eikeseth, 2009 (89) UK – Autism ADI-R BA –
Flanagan, 2012 (79) Canada RAPON Autism (50%), PDD-NOS (50%) CARS NRCT Treatment availability
Freeman, 2010 (80) Canada – Autistic disorder (61%), PDD-NOS
(31%), PDD or ASD (8%) CARS, DSM-IV BA –
Granpeesheh, 2009 (70) USA – Autistic disorder (93%), PDD-NOS
(7%) – BA –
Harris, 2000 (71) USA – Autistic disorder CARS, DSM-III-R BA –
Hayward, 2009 (90) UK NIMH Autism ADI-R UCT Geographic location
Howard, 2005, 2014 (72,73) USA – Autistic disorder, PDD-NOS DSM-IV NRCT Parent preference

119
Table 2. (continued)
First author, year (Ref. No.) Country Sponsorshipi Design
Diagnosisii Labeliii Typeiv Assignment
Perry, 2008, 2011 (78,81) Canada MCYS Autistic disorder (58%), PDD or ASD
(28%), PDD-NOS (14%) CARS, DSM-IV BA –
Perry, 2013a (83) Canada York University Autistic disorder, PDD-NOS, ASD – BA –
Perry, 2013b (83) Canada York University Autistic disorder, PDD-NOS, ASD – UCT Age (younger vs.
older)
Remington, 2007 (91) UK Health
Foundation Autism ADI-R NRCT Parent preference
Sallows, 2005 (74) USA NIMH Autism ADI-R, DSM-IV UCT Random assignment
Smith, 2000 (75) USA
Department of
Education &
UCLA Regents
Autism (50%), PDD-NOS (50%) – RCT Random assignment
Stoelb, 2004 (76) USA – Autism DSM-IV BA –
Virues-Ortega, 2013 (94) Spain – ASD ADI-R, ADOS-G, DSM-IV-TR BA –
Weiss, 1999 (77) USA – Autism (90%), PDD-NOS (10%) DSM-IV BA –
Zachor, 2007 (87) Israel Ministry of
Education Autism, PDD-NOS ADI, DSM-IV NRCT Geographic location
Zachor, 2010 (88) Israel Private support Autism ADI-R, ADOS NRCT Geographic location
iNIMH: National Institute of Mental Health; NIH: National Institutes of Health; RAPON: Regional Autism Programs of Ontario Network; MCYS: Ministry of Child and Youth Services. iiASD:
autism spectrum disorder; PDD: pervasive developmental disorder; PDD-NOS: pervasive developmental disorder – not otherwise specified. iiiADI-R: Autism Diagnostic Interview – Revised;
ADOS: Autism Diagnostic Observation Schedule; DSM: Diagnostic and Statistical Manual of Mental Disorders; CARS: Childhood Autism Rating Scale; ICD: International Classification of
Diseases. ivBA: before-and-after study (one-group pre-post design); NRCT: non-randomized controlled trial (multiple-group comparison); UCT: uncontrolled trial (multiple-group comparison);
RCT: randomized controlled trial.
Note: “–” signifies not reported or not applicable.

120
Table 3. Study, sample and treatment characteristics of included studies
First author, year (Ref. No.) Sample sizei Mean CAvi Treatment
EG CG (mos) Modelvii Intensity (h/w) Duration (mos) Setting Provider Parent training
Ben-Itzchak, 2007 (84) 25 – 26.6 IBI ≥35 12 Centre Therapists Training
Ben-Itzchak, 2009 (85) 68 – 25.4 IBI 35 12 Centre Therapists Training
Ben-Itzchak, 2014 (86) 46 – 25.5 IBI 20 24 Centre Therapists,
Teachers Training
Blacklock, 2014 (82) 68 – 88.81 IBI 20-40† 19.46 Centre Therapists –
Cohen, 2006 (69) 21 21 30.2 UCLA <3 yrs.: 20-30
>3 yrs.: 35-40 36 Community Therapists Training
Eikeseth, 2002, 2007 (92,93) 13 12 66.31 UCLA <6 yrs.: 28
>6 yrs.: 18 31.4 School
Therapists,
Teachers Training
Eikeseth, 2009 (89) 20 – 34.9 UCLA 34.2 14 Home Therapists Training
Flanagan, 2012 (79) 61 61 42.93 IBI 25.81 27.84 Multiple Therapists Training
Freeman, 2010 (80) 89 – 53.64 IBI 20-40† 19.39 Centre Therapists –
Granpeesheh, 2009 (70) 245 – 73.92 IBI 76.65‡ – Centre Therapists Training
Harris, 2000 (71) 27 – 49.0 IBI 27.5 – Multiple Therapists Training
Hayward, 2009 (90)ii 23 – 35.7 UCLA 37.4 12 Multiple Therapists Training
21 – 34.4 UCLA 34.2 12 Multiple Therapists –
Howard, 2005, 2014 (72,73)iii 29 16 30.86 IBI 35-40 36 Multiple Therapists Training
16
Perry, 2008, 2011 (78,81) 332 – 53.56 IBI 20-40† 18.43 Multiple Therapists Training
Perry, 2013a (83) 207 – 63.96 IBI 20-40† 20.16 Centre Therapists –
Perry, 2013b (83)iv 60 – 51.12 IBI 20-40† 20.53 Centre Therapists –
60 – 89.4 IBI 20-40† 20.2 Centre Therapists –

121
Table 3. (continued)
First author, year (Ref. No.) Sample sizei Mean CAvi Treatment
EG CG (mos) Modelvii Intensity (h/w) Duration (mos) Setting Provider Parent training
Remington, 2007 (91) 23 21 35.7 IBI 25.6 24 Home Therapists,
Parents No training
Sallows, 2005 (74)v 13 – 33.23 UCLA Y1: 38.6
Y2: 36.55 48 Multiple Therapists Training
10 – 34.20 UCLA Y1: 31.67
Y2: 30.88 48 Multiple Therapists Training
Smith, 2000 (75) 15 13 36.07 UCLA Y1: 24.52
Y2/3: reduced 33.44 Multiple Therapists Training
Stoelb, 2004 (76) 19 – 56 IBI 22.79 12 Multiple Therapists Training
Virues-Ortega, 2013 (94) 24 – 50.5 UCLA 31.87 21.87 Home Therapists,
Parents Training
Weiss, 1999 (77) 20 – 41.5 IBI ~40 24 Home Therapists –
Zachor, 2007 (87) 20 19 27.7 IBI 35 12 Centre Therapists –
Zachor, 2010 (88) 45 33 25.1 IBI 20 12 School Therapists,
Teachers Training
iEG: experimental/treatment group; CG: control and/or comparison group. iiEG1: Clinic-based, EG2: Parent-managed. iiiCG1: Autism educational programming (AP), CG2: Generic educational
programming (GP). ivEG1: Younger (2-5 yrs.) group, EG2: Older (6-14 yrs.) group. vEG1: Clinic-directed, EG2: Parent-directed. viMean chronological age of behavioural treatment group at
intake. viiIBI: General IBI model rooted in principles of applied behavioural analysis (ABA); UCLA: University of California, Los Angeles model (Lovaas treatment manual). †Assumed intensity range; actual treatment intensity not explicitly stated. ‡Hours per month, as reported in original article.
Note: “–” signifies not reported or not applicable.

122
Table 4. Study, treatment fidelity and outcome characteristics of included studies
First author, year
(Ref. No.)
Treatment fidelity Outcomes measured† (instrument)‡ Repeated
measures
Timing of assessment
(standardized instruments)
Adherence Competence Differentiation
(≥2 follow-up
assessments) Cognitive Adaptive
Ben-Itzchak, 2007
(84) NR NR
N/A
(one-group study)
Imitation (DBS)
Lang (DBS)
Play skills (DBS)
JA (DBS)
Stereotyped behaviours (DBS)
IQ composite (BSID-II, SB4)
No Pre/post NR
Ben-Itzchak, 2009
(85) NR NR
N/A
(one-group study)
DR (ADOS algorithm)
IQ composite (MSEL)
AB composite (VABS)
No NR NR
Ben-Itzchak, 2014
(86)
Indirect measures,
treatment manual. Indirect measures
N/A
(one-group study)
IQ composite (MSEL)
AB composite (VABS)
AB-Com (VABS)
AB-DLS (VABS)
AB-Soc (VABS)
AB-M (VABS)
Psy (ADOS)
Yes Pre/post Pre/post
Blacklock, 2014
(82) NR NR
N/A
(one-group study)
IQ composite (MSEL, WISC-IV, WPPSI-III, SB4/5)
MA (n/a)
RCog (n/a)
AB composite (VABS)
AB-Com (VABS)
AB-DLS (VABS)
AB-Soc (VABS)
RDev (n/a)
No Pre/post Pre/post

123
Table 4. (continued)
First author, year
(Ref. No.)
Treatment fidelity Outcomes measured† (instrument)‡ Repeated
measures
Timing of assessment
(standardized instruments)
Adherence Competence Differentiation
(≥2 follow-up
assessments) Cognitive Adaptive
Cohen, 2006
(69)
Indirect measures,
treatment manual. Direct measures Indirect measures
IQ composite (BSID-R, WPPSI-R)
Non-verbal IQ (MPSMT)
AB composite (VABS)
AB-Com (VABS)
AB-DLS (VABS)
AB-Soc (VABS)
Lang (RDLS)
AP (n/a)
Yes Pre/post
(partial)
Pre/post
(partial)
Eikeseth, 2002
(92)
Indirect measures,
treatment manual. Direct measures Indirect measures
IQ composite (WPPSI-R, WISC-R, BSID-R)
Non-verbal IQ (MPSMT)
Lang (RDLS, WPPSI-R, WISC-R)
AB composite (VABS)
AB-Com (VABS)
AB-DLS (VABS)
AB-Soc (VABS)
AB-M (VABS)
No Pre/post Pre/post
Eikeseth, 2007 (93) Indirect measures,
treatment manual. Direct measures Indirect measures
IQ composite (WPPSI-R, WISC-R, BSID-R)
AB composite (VABS)
AB-Com (VABS)
AB-DLS (VABS)
AB-Soc (VABS)
AB-M (VABS)
SEF (ACBC-TRF)
Yes Pre/post Pre/post

124
Table 4. (continued)
First author, year
(Ref. No.)
Treatment fidelity Outcomes measured† (instrument)‡ Repeated
measures
Timing of assessment
(standardized instruments)
Adherence Competence Differentiation
(≥2 follow-up
assessments) Cognitive Adaptive
Eikeseth, 2009
(89)
Indirect measures,
treatment manual. Direct measures
N/A
(one-group study)
IQ composite (WPPSI-R, BSID-R)
Non-verbal IQ (MPSMT)
Lang (RDLS)
AB composite (VABS)
No Pre/post Pre/post
Flanagan, 2012
(79) NR NR NR
IQ composite (MSEL, WPPSI-III, SB4)
AB composite (VABS)
AB-Com (VABS)
AB-DLS (VABS)
AB-Soc (VABS)
Psy (CARS)
No Post Pre/post
Freeman, 2010
(80) NR NR
N/A
(one-group only)
IQ composite (MSEL, BSID-II, WPPSI-III, SB4)
MA (n/a)
AB composite (VABS)
AB-Com (VABS)
AB-DLS (VABS)
AB-Soc (VABS)
AB-M (VABS)
Psy (CARS)
RDev (n/a)
No Pre/post Pre/post
Granpeesheh, 2009
(70) NR NR
N/A
(one-group study) MS (n/a) Yes NR NR
Harris, 2000
(71) NR NR
N/A
(one-group study)
AP (n/a)
IQ composite (SB4) No Pre/post NR

125
Table 4. (continued)
First author, year
(Ref. No.)
Treatment fidelity Outcomes measured† (instrument)‡ Repeated
measures
Timing of assessment
(standardized instruments)
Adherence Competence Differentiation
(≥2 follow-up
assessments) Cognitive Adaptive
Hayward, 2009
(90)
Indirect measures,
treatment manual. Direct measures
N/A
(no control group)
IQ composite (BSID-R, WPPSI-R)
Non-verbal IQ (MPSMT)
Lang (RDLS)
AB composite (VABS)
No Pre/post Pre/post
Howard, 2005
(72) NR NR NR
IQ composite (BSID-II, WPPSI-R, DP-II, SB4, DAS,
DAYC, PEP-R)
Non-verbal IQ (MPSMT, Leiter-R)
Lang (RDLS, Rosetti, REEL-2, PLS-3, PPVT-III, EVT,
DP-II, SICD-R, ROPVT, EOPVT)
AB composite (VABS)
AB-Com (VABS)
AB-DLS (VABS)
AB-Soc (VABS)
AB-M (VABS)
No Pre/post Pre/post
Howard, 2014
(73) Direct Direct Indirect
IQ composite (WPPSI-III/-R, WISC-III/-IV, SB4/5,
DAS, SIT-R, WJ-III)
Non-verbal IQ (MPSMT)
Lang (RDLS, ROPVT, EOPVT, PPVT, EVT, SICD-R)
AB composite (VABS)
AB-Com (VABS)
AB-DLS (VABS)
AB-Soc (VABS)
AB-M (VABS)
Yes Pre/post Pre/post
Perry, 2008, 2011
(78,81)
Indirect measures,
treatment manual Direct measures
N/A
(one-group study)
IQ composite (MSEL, BSID-II, WPPSI-III/-R, SB4)
MA (n/a)
AB composite (VABS)
AB-Com (VABS)
AB-DLS (VABS)
AB-Soc (VABS)
AB-M (VABS)
Psy (CARS)
RDev (n/a)
No Pre/post Pre/post

126
Table 4. (continued)
First author, year
(Ref. No.)
Treatment fidelity Outcomes measured† (instrument)‡ Repeated
measures
Timing of assessment
(standardized instruments)
Adherence Competence Differentiation
(≥2 follow-up
assessments) Cognitive Adaptive
Perry, 2013a
(83) NR NR
N/A
(one-group study)
IQ composite (various, unspecified)
Non-verbal IQ (MA, in years)
AB composite (VABS)
RCog (n/a)
RDev (n/a)
No Pre Pre
Perry, 2013b
(83) NR NR NR
IQ composite (various, unspecified)
AB composite (VABS)
RCog (n/a)
RDev (n/a)
No Pre/post Pre/post
Remington, 2007
(91) Indirect measures Indirect measures Indirect measures
IQ composite (BSID, SB4)
MA (n/a)
AB composite (VABS)
AB-Com (VABS)
AB-DLS (VABS)
AB-Soc (VABS)
AB-M (VABS)
JA (ESCS)
Lang (RDLS)
CB (NCBRF, DBC)
PWB (HADS)
Yes Pre/post Pre/post
Sallows, 2005
(74)
Indirect measures,
treatment manual. Direct measures
N/A
(no control group)
IQ composite (BSID-II, WPPSI-R, WISC-III)
Non-verbal IQ (MPSMT, Leiter-R)
AB composite (VABS)
AB-Com (VABS)
AB-DLS (VABS)
AB-Soc (VABS)
Lang (RDLS, CELF-III)
SEF (ACBC-TRF)
MS (ELM)
Yes Pre/post Pre/post
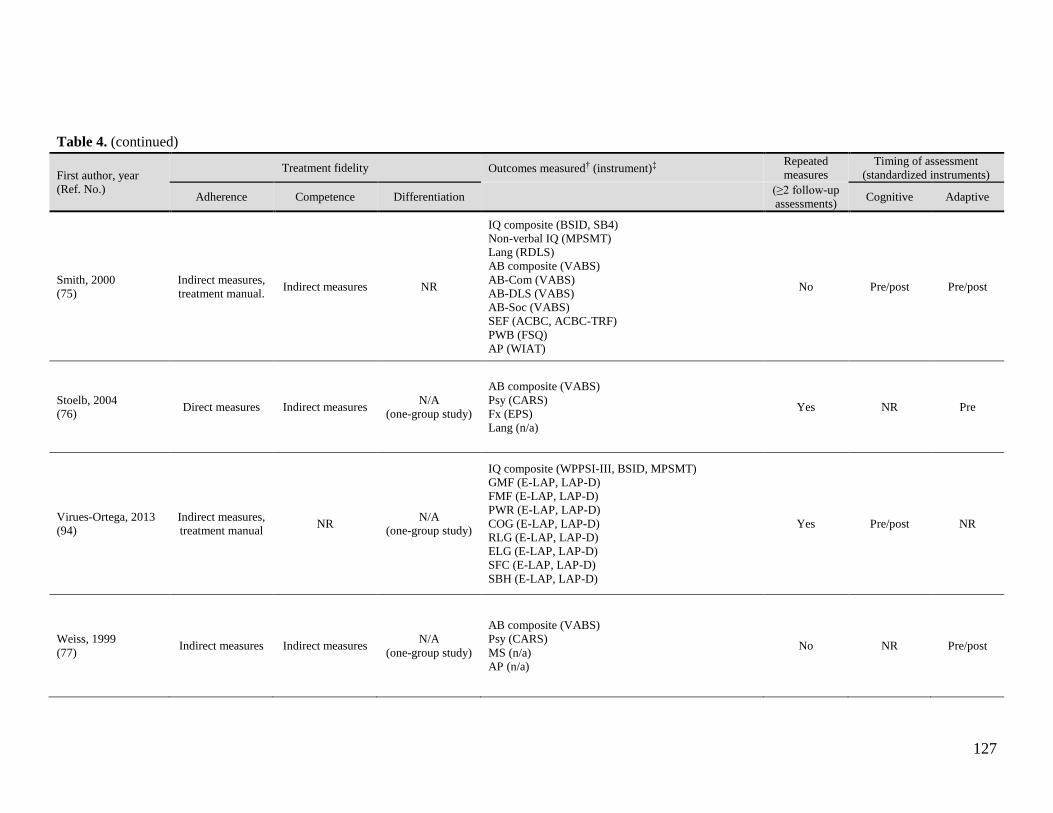
127
Table 4. (continued)
First author, year
(Ref. No.)
Treatment fidelity Outcomes measured† (instrument)‡ Repeated
measures
Timing of assessment
(standardized instruments)
Adherence Competence Differentiation
(≥2 follow-up
assessments) Cognitive Adaptive
Smith, 2000
(75)
Indirect measures,
treatment manual. Indirect measures NR
IQ composite (BSID, SB4)
Non-verbal IQ (MPSMT)
Lang (RDLS)
AB composite (VABS)
AB-Com (VABS)
AB-DLS (VABS)
AB-Soc (VABS)
SEF (ACBC, ACBC-TRF)
PWB (FSQ)
AP (WIAT)
No Pre/post Pre/post
Stoelb, 2004
(76) Direct measures Indirect measures
N/A
(one-group study)
AB composite (VABS)
Psy (CARS)
Fx (EPS)
Lang (n/a)
Yes NR Pre
Virues-Ortega, 2013
(94)
Indirect measures,
treatment manual NR
N/A
(one-group study)
IQ composite (WPPSI-III, BSID, MPSMT)
GMF (E-LAP, LAP-D)
FMF (E-LAP, LAP-D)
PWR (E-LAP, LAP-D)
COG (E-LAP, LAP-D)
RLG (E-LAP, LAP-D)
ELG (E-LAP, LAP-D)
SFC (E-LAP, LAP-D)
SBH (E-LAP, LAP-D)
Yes Pre/post NR
Weiss, 1999
(77) Indirect measures Indirect measures
N/A
(one-group study)
AB composite (VABS)
Psy (CARS)
MS (n/a)
AP (n/a)
No NR Pre/post

128
Table 4. (continued)
First author, year
(Ref. No.)
Treatment fidelity Outcomes measured† (instrument)‡ Repeated
measures
Timing of assessment
(standardized instruments)
Adherence Competence Differentiation
(≥2 follow-up
assessments) Cognitive Adaptive
Zachor, 2007
(87) NR NR Indirect measures
IQ composite (BSID-II, SB4)
Psy (ADOS-LC, ADOS-RSI)
DR (ADOS algorithm)
No Pre NR
Zachor, 2010
(88) Direct measures Direct measures Direct measures
IQ composite (MSEL subdomains)
AB composite (VABS)
AB-Com (VABS)
AB-DLS (VABS)
AB-Soc (VABS)
AB-M (VABS
Psy (ADOS algorithm)
No Pre/post Pre/post
†AB: adaptive behaviour, AB-Com: AB communication subdomain, AB-DLS: AB daily living skills subdomain, AB-M: AB motor skills subdomain, AB-Soc: AB socialization subdomain, AP:
adacemic/educational placement, CB: child behaviour, COG: cognitive, DR: diagnostic revovery, ELG: expressive language, FMF: fine motor function, GMF: gross motor function, IQ (Non-verbal): visual-
spatial IQ, IQ: intellectual quotient, JA: joint attention, Lang: language, MA: mental age/ratio IQ, MS: mastery of skills or behavioural objectives/initial skill acquisition , Psy: Severity of
symptoms/psychopathology, PWB: Parental well-being/family satisfaction, PWR: prewriting, RCog: Cognitive rate of development, RDev: Developmental rate/Adaptive rate of development, RLG: receptive
language, SBH: social behaviour, SEF: social emotional functioning, SFC: self-care. ‡ACBC: Achenbach Child Behavior Checklist, ACBC-TRP: ACBC Teacher Report Form, ADOS: Autism Diagnostic Observation Schedule, ADOS-G: Autism Diagnostic Observation Schedule-Generic,
ADOS-LC: ADOS language and communication domain, ADOS-RSI: ADOS reciprocal social interaction domain, BSID: Bayley Scales of Infant Development, BSID-II: Bayley Scales of Infant
Development (2nd Ed.), BSID-R: Bayley Scales of Infant Development - Revised, CARS: Childhood Autism Rating Scale, CELF-III: Clinical Evaluation of Language Fundamentals (3rd Ed.), DAS:
Differential Abilities Scale, DAYC: Developmental Assessment of Young Children, DBC: Developmental behavior checklist (parent report version), DBS: Developmental-behavioral scales, DP-II:
Developmental Profile-II, E-LAP: Early Learning Accomplishment Profile, ELM: Early Learning Measure (UCLA), EOPVT: Expressive One-Word Picture Vocabulary Test, EPS: EIBI Performance Scale,
ESCS: Early Social Communication Scales, EVT: Expressive vocabulary test, FSQ: Family Satisfaction Questionnaire, HADS: Hospital Anxiety and Depression Scale, LAP-D: Learning Accomplishment
Profile-Diagnostic, Leiter-R: Leiter International Performance Scale-Revised, MPSMT: Merrill-Palmer Scale of Mental Tests, MSEL: Mullen Scales of Early Learning, NCBRF: Nisonger Child Behavior
Rating Form (positive social subscale), PEP-R: Psychoeducational Profile-Revised, PLS-3: Preschool Language Scale-3, PPVT: Peabody Picture Vocabulary Test (3rd Ed.), RDLS: Reynell Developmental
Language Scales, REEL-2: Receptive-Expressive Emergent Language Scales-Revised, ROPVT: Receptive One-Word Picture Vocabulary Test, Rosetti: Rosetti Infant-Toddler Language Scale, SB4/5:
Stanford-Binet Intelligence Scale (4th/5th Ed.), SB4: Stanford-Binet Intelligence Scale (4th Ed.), SICD-R: Sequenced Inventory of Communication Development-Revised Edition, SIT-R: Slosson Intelligence
Test-Revised, VABS: Vineland Adaptive Behaviour Scales, WIAT: Wechsler Individualized Achievement Test, WISC-III: Wechsler Intelligence Scales for Children (3rd. Ed.), WISC-IV:Wechsler
Intelligence Scales for Children (4th Ed.), WISC-R: Wechsler Intelligence Scales for Children-Revised, WJ-III: Woodcock-Johnson Tests of Cognitive Abilities-III, WPPSI: Wechsler Preschool and Primary
Scale of Intelligence, WPPSI-III: Wechsler Preschool and Primary Scale of Intelligence (3rd Ed.), WPPSI-R: Wechsler Preschool and Primary Scale of Intelligence-Revised.

129
Appendix 5: Summary of Findings Tables
Table 5. Summary of findings from included studies
Study Description Participants Intervention/Comparison Outcomes Main Findings Comments
First author, year (Ref.):
Ben-Itzchak, 2007 (84)
Country: Israel
Study design: Prospective
one-group pre/post
design Number of centres: NR
Funding source: Ministry of Education in Israel
Quality: Moderate
Sample size (n): 25
Male (%): 92.00
Sample attrition: None
Inclusion criteria for study entry: • Free of any comorbidities and
genetic disorders.
• ADI or ADOS scores above cut-off points for autism in all observed
domains.
Baseline participant characteristics
Age in months, mean±SD (range):
26.6 (20-32)
IQ at intake, mean±SD (range):
70.67±17.01
EG: Centre-based ABA program
delivered at ≥35 weekly hours.
Other interventions used: None
described
Provider(s): Skilled behaviour
therapist under the supervision of
a trained behaviour analyst
Parental role: Parents learned
how to use behavioural methods to apply at home for
generalization and maintenance
purposes and worked with program supervisor in
establishing developmental goals
in the natural environment.
Primary outcome(s):
• Six developmental-
behavioural domains:
imitation, receptive
language, expressive
language, play skills, nonverbal
communication skills,
and stereotypes behaviours
• Full-scale IQ
Secondary outcome(s):
None described
Length of follow-up: 12
months
• Significant change was observed in all six
developmental-behavioural domains, and IQ
scores increased by an average of 17.3 points
from baseline to follow-up.
• Children with higher initial cognitive levels
and children with fewer measured early social interaction deficits showed better acquisition of
developmental skills (especially noted in
receptive language, expressive language and play skills).
• The gain in IQ scores in this study is acquired
regardless of pre-treatment autism severity in communication and in reciprocal social-
interaction domains.
• No control group
• Small sample size
• Developmental-behavioural
scales (DBS) is not a validated
outcome measure (even though
content validity was approved by two assessors).
First author, year (Ref.): Ben-Itzchak, 2009 (85)
Country: Israel
Study design: Prospective
one-group pre/post
design
Number of centres: NR
Funding source: Private
support (Mr. Dov Moran)
Quality: Low
Sample size (n): 68 Male (%): 91.18
Sample attrition: Missing outcome data reported on some children (2-7
approx.) at follow-up.
Inclusion criteria for study entry:
• Diagnosis of autism disorder in accordance with the DSM-IV, ADI-
R, and ADOS.
Baseline participant characteristics
Age (months), mean±SD (range):
25.4±4.0 (18-35)
IQ at intake, mean±SD (range):
NR
EG: Centre-based autism-specific preschool program based on
behavioural principles delivered
at about 35 weekly hours; its curriculum included discrete trial
training (DTT), naturalistic, and incidental teaching techniques.
Other interventions used: None described
Provider(s): Skilled behaviour
therapist under the supervision of
a trained behaviour analyst
Parental role: Parent training was
offered to address problem
behaviours.
Primary outcome(s): • Full-scale IQ
• Adaptive behaviour
• Diagnostic recovery
Secondary outcome(s): None described.
Length of follow-up: 12 months
• Participants' diagnostic classification (based on ADOS algorithm) remained very stable
after one year of intervention (i.e. 19% moved
from autism to the less severe ASD classification and only 3% no longer met
criteria for ASD). • Verbal abilities at the time of diagnosis were
significantly better in participants whose
diagnostic severity improved form baseline to follow up, as compared with participants
whose disease severity remained unchanged.
• Pre-intervention child factors, including the
child’s age, level of adaptive skills, and
environmental factors such as parents’ age or
level of education, were not related to the change in autism categorical classification at
post-intervention time.
• No control group • Relatively small sample size
• Only 40 out of 68 participants
received therapy based exclusively on ABA teaching
principles. The remaining 28 participants received eclectic
treatment, a combination of
several teaching approaches.

130
Table 5. (continued)
Study Description Participants Intervention/Comparison Outcomes Main Findings Comments
First author, year (Ref.): Ben-Itzchak, 2014 (86)
Country: Israel
Study design:
Retrospective one-group
pre/post design
(retrospective file review)
Number of centres: Four
centre-based facilities, but
most participants (n=33) came from one site.
Funding source: Private support (Mr. Dov Moran)
Quality: Moderate
Sample size (n): 46 Male (%): 84.78
Sample attrition: Considerable amount of missing data on VABS
and MSEL measures at follow-up
assessments.
Inclusion criteria for study entry:
• Diagnosis of ASD • Received centre-based IBI for at
least 2 years
• Presence of baseline cognitive ability scores
• Absence of hearing deficiencies
and genetic syndromes
Baseline participant characteristics
Age (months), mean±SD (range): 25.5±3.95 (17-33)
IQ at intake, mean±SD (range): 71.4±20.2 (n=33)
EG: Centre-based ABA program provided at about 20 hours per
week. Teaching techniques
comprised discrete trial training, incidental teaching, shaping for
positive reinforcement,
successive approximation, systematic prompting and fading
procedures, discrimination
learning, task analysis and functional assessment and
reinforcement procedures
according to several treatment manuals.
Other interventions used: None described.
Provider(s): Trained therapists (team of 3 per child), under the
supervision of a Board Certified
Behaviour Analyst (BCBA), speech-language pathologist,
occupational therapist, special
education preschool teachers.
Parental role: Parents received weekly instructions for home
treatment from the behaviour
analyst who supervised the child's program.
Primary outcome(s): • Full-scale IQ
• Adaptive behaviour
• Severity of symptoms
Secondary outcome(s):
None described.
Length of follow-up: 24
months. Assessments occurred at baseline (T1)
and after the first (T2)
and second (T3) year of intervention.
• A significant increase in cognitive abilities (MSEL composite score) was noted only for
the low cognitive abilities group (IQ<70) after
the second year of intervention. Significant gains in the MSEL expressive language
subdomain standard score were found for all
participants and only after the first year of intervention.
• An increase in overall adaptive skills was
only found during the second year of intervention.
• A significant increase in adaptive skills was
observed in standard scores for the communication, daily living skills and
socialization VABS subdomains; yet,
improvements in these subdomains were only noted as significant for the higher cognitive
ability group (IQ≥70), while standard scores
remained unchanged for the IQ<70 group. • A gradual significant decrease in autism
severity was observed after 2 years of
intervention, with no difference based on cognitive group (i.e. IQ<70 versus IQ≥70).
• Baseline cognitive level was not found to be
a significant moderator of change in autism symptom severity; however, having a higher
baseline cognitive level seemed to enable acquisition of adaptive skills, as compared
with the lack of marked progress observed in
children with baseline cognitive impairment.
• No control group. • Small sample size.
• Considerable amount of
missing data (22-30%) on VABS and MSEL outcome
measures at follow-up
assessments. • Potential for some unaccounted
variability in intervention across
the different treatment settings, even though authors claim that
all study subjects received the
same intervention approach and were supervised by the same
team.
• Exclusion of participants based on presence of comorbid
conditions.
• Questionable methods used for examining moderators of
outcome.

131
Table 5. (continued)
Study Description Participants Intervention/Comparison Outcomes Main Findings Comments
First author, year (Ref.): Blacklock, 2014 (82)
Country: Canada
Study design:
Retrospective one-group
pre/post design
(retrospective file review)
Number of centres: Nine
regional IBI program
centres providing government-funded
services.
Funding source: York
University Faculty of
Health Small Research Grant
Quality: Low
Sample size (n): 68 Male (%): 82.35
Sample attrition: Some missing outcome data at follow-up.
Inclusion criteria for study entry: • Received 10 or more months of
IBI treatment through the Ontario
Autism Intervention Program (AIP) • Began therapy at 6 years or older
• Baseline assessment occurred
within 4 months of starting IBI
Baseline participant characteristics
Age (months), mean±SD (range): 88.81±21.94 (70.0-163.0)
IQ at intake, mean±SD (range): 43.26±21.09 (<20.0-104.0; n=63)
EG: Large, community-based, publicly-funded IBI program
delivered at 20 to 40 hours per
week.
Other interventions used:
None described.
Provider(s): Trained instructor-
therapists
Parental role: NR
Primary outcome(s): • Full-scale IQ
• Adaptive behaviour
Secondary outcome(s):
• Mental age
• Cognitive rate of development
• Adaptive rate of
development (developmental rate)
Length of follow-up: Mean program duration of about
19 months (range: 10-69
months, n=56)
• Participants as a group did not show statistically significant gains
in IQ, cognitive rate of
development, adaptive behaviour standard scores or age equivalent
scores from program entry to
discharge. • Some children (<10%) showed
clinically significant gains in their
cognitive (increase in IQ score by 15 points) and adaptive functioning
(learned new skills), and a few (3%)
displayed clinically significant losses on these measures. Gains
tended to be made more commonly
in adaptive functioning, and to a lesser extent in cognitive level.
• There were strong correlations of
initial cognitive and adaptive scores, but not initial age, with all
variables at follow-up.
• A curvilinear relationship was observed between the child's age
and outcome measures: relatively
younger children (age 6-7 at program entry) had highly variable
outcomes but children over 8 years at intake tended to be less variable
and showed consistently poor
outcomes.
• No control group. • Inconsistency in collected data (i.e.
collected from many different sites, which
often had different practices). • No control or influence over measures
used for assessment, nor the timing of the
assessments (due to retrospective nature of study).
• Measures used have several limitations
(i.e. VABS has parents' biases and large standard error, ratio IQ used at times (since
a standardized score was not available for
low performance) which isn't as good as full-scale IQ, psychometric limitations of
age-equivalent scores - not corrected for
age, and may not mean the same thing at different ages).
• Different standardized assessments
sometimes used at different time points. • No knowledge of whether children
received any other intervention prior to or
during IBI. • No specific measure of treatment
intensity/duration and no measure of
quality/fidelity. • Outcome assessors were not blind to
children's participation in IBI, nor were they independent of the organization
providing IBI.
• No exclusion of participants based on presence of comorbid disorders.
• Of the 332 children in the Perry et al.
(2008) study, there were 20 children who met the inclusion criteria for the current
study and were included.

132
Table 5. (continued)
Study Description Participants Intervention/Comparison Outcomes Main Findings Comments
First author, year (Ref.): Cohen, 2006 (69)
Country: United States
Study design: Non-
randomized prospective
controlled multiple-
group comparison
(matched-pairs comparison)
Number of centres: NR
Funding source: National
Institute of Mental Health
Quality: Moderate
Sample size (n): 42 EG (n): 21
CG (n): 21
Male (%): 83.33
Sample attrition: Five dropouts (in addition to the 42 participants)
excluded from the analyses (3
participants in EG and 2 in CG), and a few participants has missing data at
one or more follow-up assessments.
Inclusion criteria for study entry:
• Diagnosis of autism or PDD-NOS
confirmed by ADI-R • Pre-treatment IQ>35
• Intake age<48 months and between
18-42 months at diagnosis • No severe medical limitation or
illness that would preclude partaking
in intensive weekly therapy • Residence within 60 km of treatment
agency
• No more than 400 hours of behavioural intervention prior to
intake • Parent's agreement to actively
partake in parent training and
generalization and to have an adult present during home intervention
hours
Baseline participant characteristics
Age (months), mean±SD (range):
EG: 30.2±5.8 CG: 33.2±3.7
IQ at intake, mean±SD (range): EG: 61.6±16.4
CG: 59.4±14.7
EG: Community-based early intensive behavioural treatment (EIBT) based on the
UCLA instructional model and consisting of
three components: (i) in-home 1:1 instruction delivered at 20-30 weekly hours for children
below 3 years, and 35-40 weekly hours for
children above 3 years, (ii) peer play training, and (iii) regular education classroom inclusion.
No aversive interventions were used throughout
the study. CG: Various public school education classes and
community services selected by parents.
Other interventions used:
None described.
Provider(s): Trained therapists (mandatory
completion of 3-4 month internship at UCLA)
and tutors (main providers of direct services recruited from the community). Site director was
a BCBA.
Parental role: Parents were encouraged to be
involved in all levels of intervention (to foster the
child's acquisition and generalization skills), and they were asked to be active participants in their
child’s intervention, although there was no requirement for parents to provide any direct
intervention hours.
Primary outcome(s): • Full-scale IQ
Secondary outcome(s): • Non-verbal IQ (visual-spatial
skills)
• Adaptive behaviour • Language
• Academic/classroom placement
Length of follow-up: 36 months
(47 weeks per year). Assessments
occurred at baseline (T1) and after the first (T2), second (T3),
and third (T4) year of
intervention.
• There was a significant difference between groups on
cognitive functioning at
program discharge: the mean IQ score increased by 25 points
in the EG, as compared with 14
points in the CG. • In addition to IQ, the EG
made significantly greater gains
in receptive language and adaptive functioning as
compared with control.
• Seventeen of 21 EG children were included into regular
education classroom settings,
as compared with one of 21 children in the control group
(despite IQ gains).
• Small sample size • Non-random
assignment (as a
result of community program that is
mandated to provide
treatment to parents and children with
ASD who are free to
accept a plan or not). • Pre-existing group
differences
(diagnosis, family education, etc.) may
have biased the
results, even after statistically
controlling for family
variables.

133
Table 5. (continued)
Study Description Participants Intervention/Comparison Outcomes Main Findings Comments
First author, year (Ref.):
Eikeseth, 2002, 2007
(92,93)
Country: Norway
Study design:
Non-randomized
prospective controlled
multiple-group
comparison
Number of centres: Several potential sites
within two counties in
Norway (number unspecified)
Funding source: National Institutes of Health
Quality: High
Sample size (n): 25 EG (n): 13
CG (n): 12
Male (%): 76.0
Sample attrition: There were two dropouts in addition to the 25
participants.
Inclusion criteria for study entry:
• Diagnosis of childhood autism
(ICD-10) via ADI-R and independent psychologist
• Intake age >4<7 years
• Deviation IQ>50 at intake or ratio IQ>50
• Absence of major medical
conditions other than autism
Baseline participant characteristics
Age (months), mean±SD (range): EG: 66.31±11.31
CG: 65.00±10.95
IQ at intake, mean±SD (range):
EG: 61.92±11.31 CG: 65.17±14.97
EG: IBI based on Lovaas manual and associated videotapes (UCLA
teaching model) delivered at 20-35
weekly hours, with the modification that contingent aversives were not
employed. Treatment intensity was
reduced to about 5-20 hours per week after participants enrolled in school
(≥6 years)
CG: Intensive, eclectic special
education services delivered at 20-35
weekly hours, but with less supervision than EG. Treatment
incorporated elements of TEACCH,
sensory-motor therapies, ABA, as well as methods derived from
personal experience.
Other interventions used:
None described.
Provider(s): Trained therapists
(special education teachers) and one
or more aides, as well as student instructors and paraprofessionals.
Parental role: Parents worked alongside therapists for the first 3
months for a minimum of 4 hours per
week, and then applied generalization and maintenance procedures.
Primary outcome(s): • Full-scale IQ
• Adaptive behaviour
Secondary outcome(s):
• Non-verbal IQ (visual-
spatial skills) • Language
• Social-emotional
functioning (SEF) domains
Length of follow-up:
Originally 12 months, then extended to about 31
months in follow-up study.
Assessments occurred at baseline (T1), after the first
year (T2), and last follow-
up (T3).
• IBI treated children showed greater gains on cognitive functioning and
adaptive skills with intervention, as
compared with children in the CG: average gain of 25 IQ points and 12
points on adaptive functioning (as
measured by VABS) at last EG follow-up (after >2 years of intervention).
• EG also showed less severe aberrant
behaviour and fewer social problems at follow-up compared to control.
• Seven of 13 children in the EG (54%)
who scored within the range of mental retardation at intake scored within the
average range (IQ≥85) on both IQ and
visual-spatial IQ at follow-up, as compared with two of 12 children in CG
(17%).
• None of the demographic variables (e.g. age at intake) or pre-treatment test
scores (e.g. IQ) predicted individual
differences in response to treatment in the EG.
• Non-random assignment to groups (based on geographical
location).
• Small sample size. • Inclusion criteria restricted full
heterogeneity in sample
population (e.g. only those with IQ≥ 50 included), and resulted in
participants that may have been
higher functioning at intake than is usual for children with ASD.
• CG may have functioned at a
more advanced level then the EG at intake.
• No direct quality control
measures of treatment.

134
Table 5. (continued)
Study Description Participants Intervention/Comparison Outcomes Main Findings Comments
First author, year (Ref.): Eikeseth, 2009 (89)
Country: United
Kingdom
Study design:
Retrospective one-group
pre/post design
(retrospective file review)
Number of centres: NR
Funding source: NR
Quality: Moderate
Sample size (n): 20 Male (%): 70.0
Sample attrition: NR
Inclusion criteria for study entry:
• Diagnosis of autism according to the ICD-10 criteria
• Intake CA >24<42 months
• Absence of other severe medical conditions, as certified by a
medical practitioner
• Residence outside of the catchment area for clinic-based
services
Baseline participant characteristics
Age (months), mean±SD (range):
34.9±5.7 (28-42)
IQ at intake, mean±SD (range):
54.2±15.1 (17-83)
EG: UK Young Autism Project (YAP) home-based therapy
delivered at an average of 34 weekly
hours (the British replication site for the UCLA international multi-site
YAP).
Other interventions used:
None described.
Provider(s): At least two trained
therapists and one program
consultant per child.
Parental role: Parents were offered
a half-day course on ABA principles, followed by several days
of hands-on training for the purpose
of implementing generalization and maintenance procedures.
Primary outcome(s): • Full-scale IQ
• Non-verbal IQ (visual-
spatial skills) • Language
• Adaptive behaviour
Secondary outcome(s):
None described.
Length of follow-up: Mean
program duration of about
14 months.
• Intensity of supervision was significantly associated with change in IQ score
between intake and program discharge.
• Change in IQ score was significantly correlated with baseline visual-spatial IQ,
while all other correlations were non-
significant.
• Preliminary/exploratory study with low sample size.
• No control group.
• The study is correlational in nature.
• Data from the parent-managed
treatment group of the study by Hayward et al (2000) are used.

135
Table 5. (continued)
Study Description Participants Intervention/Comparison Outcomes Main Findings Comments
First author, year (Ref.): Flanagan, 2012 (79)
Country: Canada
Study design:
Non-randomized
retrospective controlled
multiple-group
comparison (matched-pairs comparison)
Number of centres: Single centre (Toronto
Partnership for Autism
Services: the largest of 9 publicly-funded regional
IBI programs in Ontario)
Funding source: Regional
Autism Programs of
Ontario Network (RAPON)
Quality: Moderate
Sample size (n): 122 EG (n): 61
CG (n): 61
Male (%): 85.25
Sample attrition: None.
Inclusion criteria for study entry:
• Receiving IBI or on waitlist for at least 12 months
• Complete information available on
adaptive functioning, autism severity, and cognitive skills, with
all measures at the same time point
and within 3 months of one another • Received <10 weekly hours of IBI
from private agencies if on waitlist
• Received IBI for 80% of the interval between intake and exit
assessment
Baseline participant characteristics
Age (months), mean±SD (range):
EG: 42.93±11.53 CG: 42.79±10.51
IQ at intake, mean±SD (range):
EG: NR
CG: NR
EG: Large-scale community IBI program rooted in ABA teaching
principles (Toronto Partnership
for Autism Services or TPAS) delivered at 20-35 hours per
week.
CG: Wait-list participants not yet receiving IBI therapy. Most
children attended school (small
specialized classrooms for children with developmental
disabilities, typical classrooms
with or without educational assistant support) for an average
of about 18 hours per week. Some
children received auxiliary services, such as low intensity
behavioural intervention (<10
hours per week), speech-language pathology services, occupational
therapy and/or behavioural
consultation.
Other interventions used:
None described.
Provider(s): Trained instructor-therapists.
Parental role: Parents were encouraged to attend training and
meet regularly with treatment
staff.
Primary outcome(s): • Full-scale IQ
• Adaptive behaviour
• Severity of symptoms
Secondary outcome(s):
None described.
Length of follow-up: Mean
program duration of about 28 months.
• Although groups did not differ significantly at intake, the EG had milder
autism severity, higher adaptive
functioning and higher cognitive skills at discharge. The effect size of group
differences was medium for autism
severity and adaptive functioning, and large for cognitive skills (19-point
difference in IQ scores at exit, with results
favouring the IBI group). • At the last follow-up assessment, 18% of
children in the IBI group has IQ estimates
in the average range (>85), as compared with 3.3% in the Waitlist group.
• Initial age was found to be an important
predictor of better outcomes in IBI relative to a comparison group.
• Children with higher initial adaptive
skills are more likely to experience good outcomes with IBI, although these
children may also benefit the most from
other interventions. • Autism severity may not play a
meaningful predictor role when age and
adaptive skill level are controlled. • Duration was not a significant predictor
of outcome.
• Clinicians carrying out assessments knew whether
children had received IBI or not
(i.e. independent assessors not employed).
• Formal measures of treatment
quality and fidelity were not available or reported.
• Duration between test periods
differed significantly between groups.
• Information about cognitive
functioning was not available at intake (i.e. unable to determine
pre-treatment differences in
cognitive skills between groups). • Non-random assignment to
groups.
• Some of the children in the EG were also included in previous
studies exploring the impact of
the Ontario IBI program (16% were included in Freeman
(2010); 27% were included in
Perry (2008, 2011))

136
Table 5. (continued)
Study Description Participants Intervention/Comparison Outcomes Main Findings Comments
First author, year (Ref.): Freeman, 2010 (80)
Country: Canada
Study design:
Retrospective one-group
pre/post design
Number of centres: Single centre (Toronto
Partnership for Autism
Services: the largest of 9 publicly-funded regional
IBI programs in Ontario)
Funding source: NR
Quality: Moderate
Sample size (n): 89 Male (%): 82.02
Sample attrition: Incomplete outcome data at follow-up for full-
scale IQ score (n=20) and AB
composite (n=81) measures.
Inclusion criteria for study entry:
No specific criteria described.
Baseline participant characteristics
Age (months), mean±SD (range): 53.64±13.12 (20-83)
IQ at intake, mean±SD (range): 36.65±14.83 (15-77)
EG: Large, community-based, publicly-funded IBI
program delivered at 20 to
40 hours per week.
Other interventions used:
None described.
Provider(s): Trained
instructor-therapists.
Parental role: NR
Primary outcome(s): • Severity of symptoms
• Full-scale IQ
• Adaptive behaviour • Adaptive rate of development
(developmental rate)
Secondary outcome(s):
None described.
Length of follow-up: Mean
program duration of about 19
months (range: 5-47 months)
• Children showed statistically significant reductions in autism symptom severity
(based on change in CARS scores)
• Significant improvements in cognitive level (increase in IQ of about 11 points)
were observed among children who had
complete information on cognitive functioning (n=20), with nine children
making clinically significant gains (increase
in IQ by 15 or more points). • Children gained significantly in
developmental skills in all areas of adaptive
behaviour; however, only age equivalent scores increased, while standard scores,
which are corrected for age, remained stable.
• Children's rate of development during IBI was found to be approximately double their
initial rate (prior to IBI).
• Average functioning was achieved by 11% of children in the sample (defined as scoring
in the non-autism range based on severity
and having cognitive and/or adaptive standard scores in the low average range at
discharge).
• Children who began IBI before age 4 scored significantly better at program
discharge on the CARS, VABS, and full-scale IQ estimate scores than those that
started treatment after age 4.
• Children who received 2 or more years of IBI scored significantly better at program
discharge on all outcome variable than those
children who had shorter program durations (< 2 years).
• No control/comparison group of similar children who received no
treatment or a different treatment.
• No measure of treatment fidelity. • Outcome measures are limited
and do not tap all possible changes
of interest (e.g. problem behaviour), have imperfect
reliability and validity, and were
not always available for all children.
• Outcome assessors (at intake and
discharge) were not blind to the children's participation in IBI, nor
were they independent of the
organization providing treatment.

137
Table 5. (continued)
Study Description Participants Intervention/Comparison Outcomes Main Findings Comments
First author, year (Ref.): Granpeesheh, 2009 (70)
Country: United States
Study design:
Retrospective one-group
pre/post design
Number of centres: Six centres in across six US
states, including west
coast, east coast, and middle region.
Funding source: NR
Quality: Low
Sample size (n): 245 Male (%): NR
Sample attrition: NR
Inclusion criteria for study entry:
• Intake age >16 months and <12 years
• Received an average of 20 or
more hours per month for the duration of the study
• Mastery of at least one skill item
per month • Not in first month of treatment or
has received treatment for more
than 4 years
Baseline participant characteristics
Age (years), mean±SD (range): 6.16±2.33
IQ at intake, mean±SD (range): NR
EG: Community-based IBI services individualized for each
child to address all areas of
functioning in which he/she displayed skill deficits and
delivered at about 20 to 169
hours per month. Treatment involved both structured
(discrete trial training) and
unstructured (natural environment training)
behavioural teaching strategies,
verbal behaviour-oriented language intervention, use of
both errorless prompting
strategies and least-to-most prompting, use of behavioural
principles to design and
implement teaching (reinforcement, extinction,
stimulus control, generalization
training, chaining and shaping), and a function-based approach
to assessing and treating
challenging behaviours.
Other interventions used: None described.
Provider(s): Trained therapists (limited details provided).
Parental role: Inclusion of parents in all treatment
decisions and regular parent
training.
Primary outcome(s): • Mastery of behavioural
objectives (i.e. achievement
of 80% correct or higher on an objective for two
consecutive therapy sessions;
if the child met this criterion, then the objective was scored
as "mastered")
Secondary outcome(s):
None described.
Length of follow-up: NR;
Assessments occurred at
baseline and once per month for four months.
• An increase in treatment hours and decrease in participant age was associated
with the greatest number of mastered
behavioural objectives. • The youngest group (2–5 years) showed
the greatest response to treatment at low
levels of intensity and similar level of gains as the middle age group (5–7 years)
at high levels of intensity.
• The middle age group (5–7 years) showed a similar increasing trend, like the
youngest group, such that there was no
point of diminishing-returns from increased treatment hours (i.e. for children
under 7 years, there was not a point at
which participants began to burn out from treatment).
• Children in the highest age group (7–12
years) did not show a significant relationship between treatment hours and
the number of behavioral objectives
mastered (i.e. efficacy of intervention decreases as the age of the child
increases).
• Behavioural intervention produces more efficient skill acquisition per unit time in
younger children, as compared with older children, thereby underscoring the need
for early intervention.
• No control/comparison group. • Use of mastered behavioural
objectives as a measure of
therapeutic progress is inherently flawed (e.g. different objectives
are of different difficulty to
master); yet, authors argue that it seems likely that, given a large
enough sample size, measurement
errors should be evenly distributed across the participants such that
the crude measure will be a
relatively valid proxy of overall treatment progress.
• No formal inter-observer
agreement was collected on outcome data.
• Participants were unable to be
assigned to differing levels of treatment hours (due to non-
random assignment and
uncontrolled nature of study). • Some participants received
treatment at well below 20 hours
per week, although the average of all participants was around 20
weekly hours. • Variation in treatment delivery
across different centres across the
US is possible.

138
Table 5. (continued)
Study Description Participants Intervention/Comparison Outcomes Main Findings Comments
First author, year (Ref.): Harris, 2000 (71)
Country: United States
Study design: Prospective
one-group pre/post
design
Number of centres: Single centre (Douglas
Developmental
Disabilities Center)
Funding source: NR
Quality: Moderate
Sample size (n): 27 Male (%): 85.19
Sample attrition: NR
Inclusion criteria for study entry:
• Complete data on age at admission and discharge, pre and post IQ data,
and CARS scores at admission
Baseline participant characteristics
Age (months), mean±SD (range):
49 (31-65)
IQ at intake, mean±SD (range):
59.33 (35-109)
EG: Intensive centre-based educational instruction
(developmentally sequenced and
rooted in ABA teaching methods) delivered at an average of 27.5
weekly hours. Children typically
begin in a 1:1 setting and then ultimately progressed to an
integrated classroom.
Other interventions used: Some
families elected to receive
occupational and/or physical therapy outside of school hours.
Provider(s): Professional therapist in conjunction with a
speech therapist and
undergraduate assistant.
Parental role: Each family was
expected to provide an additional 10-15 weekly hours of home-
based instruction. Generalization
and maintenance procedures for material learned in school and/or
self-help and life independence skills were also applied.
Primary outcome(s): • Academic/classroom
placement
• Full-scale IQ
Secondary outcome(s):
None described.
Length of follow-up:
Participants followed-up 4 to 6 years after they left the
preschool.
• Children’s age at intake was significantly associated with educational placement,
such that children who started treatment
before 4 years were, as a group, more likely to be in regular education settings at
follow-up than children who started
treatment after 4 years. • Children who had higher IQs at
admission were more likely to be in
regular education classes at follow-up. Among children with IQ scores of 59 or
more at intake, 10 were included in regular
classes and 3 were in special education programs, as compared with the 14
children with intake IQs of 52 or less
which were placed mainly in special education classes (one child went to a
regular education class).
• Younger children had higher IQ scores at discharge than those who started treatment
at an older age.
• Those children who went into special education settings showed measurable
gains in IQ from pre- to post-treatment
(i.e. mean increase in about 13 IQ points from intake to discharge). By contract, the
group of children that went on to regular classes showed a 26-point mean gain in IQ
scores.
• Small sample size. • No control/comparison group.
• Impact of treatment density
remains unclear. • It is possible that not all
potentially intercorrelated
variables have been controlled.

139
Table 5. (continued)
Study Description Participants Intervention/Comparison Outcomes Main Findings Comments
First author, year (Ref.): Hayward, 2009 (90)
Country: United
Kingdom
Study design: Prospective
uncontrolled multiple-
group comparison Number of centres:
Several potential sites
within UK YAP catchment area (number
unspecified)
Funding source: National
Institute of Mental Health
(NIMH)
Quality: Moderate
Sample size (n): 44 EG1 (n): 23
EG2 (n): 21
Male (%): 77.27
Sample attrition: NR
Inclusion criteria for study entry:
• Diagnosis of autism according to ICD-10 criteria
• Intake age >24<42 months
• Absence of other severe medical conditions
Baseline participant characteristics Age (months), mean±SD (range):
EG1: 35.7±6.2
EG2: 34.4±5.7
IQ at intake, mean±SD (range):
EG1: 53.5±15.1 EG2: 54.1±15.1
EG1: Clinic-based program based on UCLA YAP model delivered
at an average of 37.4 weekly
hours. Teaching methods included discrete trial training
(DTT), natural environment
teaching, and incidental teaching. EG2: Parent-managed program
delivered at an average of 34.2
weekly hours. Intensive supervision was provided by
program consultants, while
tutoring staff (therapists) were recruited and managed by
parents.
Other interventions used:
None described.
Provider(s): Tutors, senior tutors,
and program consultants.
Parental role: Parents in both
groups were given a half-day
course on ABA principles followed by several days of
hands-on training from senior tutors and program consultants.
Primary outcome(s): • Adaptive behaviour
• Full-scale IQ
• Non-verbal IQ (visual-spatial skills)
• Language
Secondary outcome(s):
None described.
Length of follow-up:
12 months.
• Participants in both treatment groups improved significantly on all outcome
measures between intake and follow-up,
and there were no significant differences between the two groups on any of the
follow-up measures.
• Mean IQ increased by 16 points between intake and follow-up, with 89% of
children showing an increase in IQ score,
and 50% showing gains of 15 IQ points or more.
• VABS composite standard scores
increased by 6.4 points between intake and follow-up.
• Data suggest that the best predictor of
outcome was visual-spatial IQ as it predicted follow-up IQ, visual-spatial IQ,
language comprehension, expressive
language and adaptive behaviour, as well as changes in IQ and adaptive behaviour.
Baseline IQ predicted outcome on all these
variables, but not changes in scores as a result of treatment.
• Age at intake predicted neither treatment
outcome nor gains in treatment.
• Lack of an alternative treatment or a no-treatment control group.
• Non-random assignment to groups
(based on geographical location). • Small sample size: study was
potentially underpowered to predict
which participants would benefit most from IBI.
• Because of the non-significant group
differences, data for both groups were treated as one data set (for the purpose
of all analyses).
• Five participants did not achieve basal on the visual-spatial IQ test at
intake and analysis excluded these
lowest-functioning participants. • Treatment density is a composite of
total hours spent in 1:1 tutored
sessions, parent sessions, shadowed time in school, team meetings and/or
workshops.

140
Table 5. (continued)
Study Description Participants Intervention/Comparison Outcomes Main Findings Comments
First author, year (Ref.): Howard, 2005, 2014 (72,73)
Country: United States
Study design: Non-
randomized retrospective
controlled multiple-group
comparison Number of centres: Several
regional centres in California
(number unspecified)
Funding source: NR
Quality: Moderate
Sample size (n): 61 EG (n): 25
CG1 (n): 16
CG2 (n): 16
Male (%): 88.52
Sample attrition: Some missing
outcome data across follow-up
assessments and unequal groups at pre- and post- measurements.
Inclusion criteria for study entry: • Diagnosis of autistic disorder or
PDD-NOS under DSM-IV criteria
• Age at diagnosis and treatment onset before 48 months of age
• English as primary spoken
language at home • No other significant medical
conditions
• No prior treatment for more than 100 hours
Baseline participant characteristics Age (months), mean±SD (range):
EG: 30.86±5.16 CG1: 37.44±5.68
CG2: 34.56±6.53
IQ at intake, mean±SD (range):
EG: 58.54±18.15
CG1: 53.69±13.50 CG2: 59.88±14.85
EG: Early intensive behaviour analytic treatment (IBT) delivered at 23-30 weekly
hours for children below 3 years and at 35-40
hours for those above 3 years of age. Initial treatment targets focused on foundational
repertoires (e.g. attending, imitating vocal and
motor sequences, following spoken directions, receptive and expressive labeling, initiating
requests, tolerating change, etc.). Treatment
targets duding Years 2 and 3 generally focused on advanced cognitive, social, play, self-care,
academic, and communication skills. More
complex interactions involving peers and siblings generally occurred during Years 2 and
3 than in Year 1
CG1: Autism educational programming (AP) consisting of intensive eclectic intervention
delivered at 25-30 hours per week in public
education classrooms with supervision. CG2: Generic educational programming (GP)
consisting of non-intensive public early
intervention programs delivered at 15-17 hours per week through local community special
education classrooms.
Other interventions used:
None described.
Provider(s): Trained team of 4-5 instructional
assistants (behaviour technicians) with supervision by highly skilled clinical staff who
worked under the direction of a BCBA.
Parental role: Parents helped support
treatment outside of formal treatment hours to
varying degrees. Training focused on teaching instruction-following, promoting spontaneous
language, re-directing non-functional repetitive
behaviour, managing interfering behaviours and building skills (toileting, dressing,
independent play, etc.).
Primary outcome(s): • Full-scale IQ
• Adaptive behaviour
• Language
Secondary outcome(s):
• Non-verbal IQ (visual-spatial skills)
Length of follow-up: Originally 14 months,
then extended to about
36 months in follow-up study. Assessments
occurred at baseline
(T1), and at approximately 14
months (T2), 27
months (T3), and 38 months (T4).
• The EG performed significantly better on all measures than either comparison group
after three years of treatment.
• Largest gains typically occurred in the first year of treatment and in EG children
only.
• Benefits of IBT which were incurred after one year of treatment were sustained
throughout years 2 and 3.
• Outcomes at years 2 and 3 were worse for children in either comparison group
than for children receiving IBT, while
outcome between comparison groups did not differ significantly.
• At final assessment, children who
received IBT were more than twice more likely to score in the normal range on
measures of cognitive, language, and
adaptive functioning than were children who received either form of eclectic
intervention (CG1 or CG2).
• IQ, language, and adaptive behaviour test scores increased significantly (by at least 1
SD) from baseline to follow-up in children
who received IBT, as compared with those in the two other groups. Neither eclectic
treatment (CG1 or CG 2) was more likely than the other to produce a favourable
outcome.
• Though the majority of positive and largest treatment effects were experienced
in the first year of treatment with IBT
(which may lead to question the benefit of extending the treatment beyond the first
year), those children with scores below the
normal range were able to attain normal functioning range scores with additional
years of intervention (unlike children in
the eclectic treatment groups, who did not make substantial gains after year 1).
• Relatively small sample size.
• Non-random
assignment (based on parental preference and
education team
decisions) • EG children were on
average younger than
children in either comparison group.
• Examiners who
conducted assessments were not blind to
participants’ group
assignment. • Treatment integrity
was not measured or
reported in the first publication (2005).
• Potential cross-over
effects in comparator groups (some children
switched between the
comparison treatments during Years 2 and 3),
and intervention in years 2 and/or 3 was
not available for a few
CG children.

141
Table 5. (continued)
Study Description Participants Intervention/Comparison Outcomes Main Findings Comments
First author, year (Ref.): Perry, 2008, 2011 (78,81)
Country: Canada
Study design:
Retrospective one-group
pre/post design
Number of centres: Nine regional IBI program
centres providing
government-funded services
Funding source: Ministry of Children and Youth
Services (MCYS)
Quality: Moderate
Sample size (n): 332 Male (%): 83.13
Sample attrition: Considerable amount of missing data at follow-
up assessment, especially for
intellectual functioning.
Inclusion criteria for study entry:
• Complete information available on at least one outcome measure at
both baseline and follow-up
assessment.
Baseline participant characteristics
Age (months), mean±SD (range): 53.56±12.60 (20-86)
IQ at intake, mean±SD (range): 45.50±19.24 (11-96); n=151
EG: Large, community-based, publicly-funded IBI
program delivered at 20 to
40 hours per week.
Other interventions used:
None described.
Provider(s): Trained
instructor-therapists and senior therapists.
Parental role: Parents were encouraged to participate in
goal setting and to promote
generalization.
Primary outcome(s): • Full-scale IQ
• Adaptive behaviour
• Severity of symptoms
Secondary outcome(s):
• Mental age • Adaptive rate of development
(developmental rate)
Length of follow-up: Mean
program duration of about 18
months (range 4-47).
• Children improved significantly across all measures from program entry to discharge,
but there was substantial heterogeneity.
• Cognitive functioning showed a clinically significant increase (IQ gains by 15 or more
points) in 39% of children (n=127).
• Adaptive behavior age equivalents increased substantially in all areas, but
standard scores changed only modestly
(higher for socialization and communication subdomains but lower for daily living skills).
• Participants demonstrated significantly
milder autistic symptomatology at program discharge.
• Children’s rate of development during IBI
was roughly double what it had been at baseline (prior to IBI).
• Children were classified into seven
categories of progress/outcome (n=296). The majority of children (75%) showed some
benefit or improvement during the time they
received IBI and 11% achieved average functioning.
• A subgroup of children who were more
similar to children from model programs (younger with milder developmental delays)
had similar outcomes to those reported in other efficacy studies.
• A non-linear relationship was found
between initial age and measured outcomes: Children starting treatment before 4 years
scored higher on all outcome measures than
children who were 4 years or older at program entry, and children who achieved
best outcomes were considerably younger at
entry (42 months versus 53 months) than all other outcome groups.
• No control or comparison group of similar children who received
no treatment or a different
treatment. • No measure of treatment quantity
(intensity/duration), or treatment
fidelity. • Available outcome measures
(although standard and appropriate
for this population) are limited, and have imperfect reliability and
validity.
• It is unknown whether children’s gains post discharge were
maintained or generalized (or
stabilized or even declined). • Outcome assessors at intake and
discharge were not blind to the
children’s participation in IBI, nor independent from the organization
providing IBI.
• Measurement of developmental rate is based on questionable
assumptions (i.e. child’s
development prior to IBI and during IBI is assumed to have been
linear, and the pre- and post- data points are sufficient to derive a
slope).

142
Table 5. (continued)
Study Description Participants Intervention/Compari
son Outcomes Main Findings Comments
First author, year (Ref.):
Perry, 2013a (83)
Country: Canada
Study design:
Retrospective one-group
pre/post design
Number of centres: Nine
regional IBI program centres providing
government-funded
services
Funding source: York
University
Quality: Moderate
Sample size (n): 207
Male (%): 80.68
Sample attrition: None.
Inclusion criteria for study entry:
• All children with a documented
initial IQ score.
Baseline participant characteristics
Age (years), mean±SD (range): 5.33±2.01 (2.08-14.50)
IQ at intake, mean±SD (range): 43.20±20.52 (10-104)
EG: Large, community-
based, publicly-funded IBI program delivered at
20 to 40 hours per week.
Other interventions
used:
None described.
Provider(s): Trained
instructor-therapists.
Parental role: NR.
Primary outcome(s):
• Full-scale IQ • Mental age
• Adaptive behaviour
• Cognitive rate of
development
• Adaptive rate of
development
Secondary outcome(s):
None described.
Length of follow-up:
Mean program duration of about 20
months (range 10-55).
• Longer duration of IBI was associated with
slower rates of development between intake and discharge, and children who were in the
program longer were not showing better
outcomes on IQ, ABC or change in IQ.
• Children with higher skill levels before
treatment tended to have higher skill levels
after treatment, but children who were higher functioning cognitively at intake were not the
ones who necessarily made large IQ gains.
• The younger the child was at entry into IBI, the higher their cognitive (but not their
adaptive) functioning was after treatment, even
after controlling for treatment duration and the children’s initial cognitive level.
• Age at entry was the only predictor that was
related to change in IQ. • Children who entered the program with very
low IQ scores (IQ<30) showed uniformly poor
outcomes, regardless of age.
• No control group (i.e. predictors of
outcomes at discharge may be predictors regardless of treatment).
• Outcome measures are imperfect, which
may impact on their reliability and validity.
• Missing data on some scores.
• No precise information on intensity of
treatment (although program guidelines require a minimum of 20 hours per week).
• Inclusion criterion excluded many
children in the younger group • Outcome assessors were not independent
nor blind to the child’s participation in IBI.
• There were younger children than older ones in the sample and the older children
tended to be somewhat lower functioning at
entry. • Data are drawn from two previously
completed studies: Perry at al. (2008, 2011)
and Blacklock et al. (2014)
First author, year (Ref.): Perry, 2013b (83)
Country: Canada
Study design:
Retrospective
uncontrolled multiple-
group comparison
(matched pairs)
Number of centres: Nine regional IBI program
centres providing
government-funded services
Funding source: York University
Quality: Moderate
Sample size (n): 120 EG1 (n): 60
EG2 (n): 60
Male (%): NR
Sample attrition: None.
Inclusion criteria for study entry: • All children with a documented
initial IQ score.
Baseline participant characteristics
Age (years), mean±SD (range):
EG1: 4.26±1.09 (2.08-5.92) EG2: 7.45±1.87 (6.00-13.58)
IQ at intake, mean±SD (range): EG1: 40.92±20.68 (11-98)
EG2: 40.93±21.12 (10-104)
EG1: Younger age group (2-5 years)
EG2: Older age group
(6-14 years) Both groups received the
same treatment (large, community-based,
publicly-funded IBI
program delivered at 20-40 hours per week.
Other interventions used:
None described.
Provider(s): Trained
instructor-therapists.
Parental role: NR
Primary outcome(s): • Full-scale IQ
• Mental age
• Adaptive behaviour • Cognitive rate of
development • Adaptive rate of
development
Secondary outcome(s):
None described.
Length of follow-up:
Mean program
duration of about 20 months (range 10-42).
• Younger children (2-5 years) made an
average of 17 IQ points, while older children
(6-14 years) made average gains of only 2 IQ points.
• The younger group’s rate of cognitive development increased during IBI whereas the
older group’s remained essentially unchanged.
• Very large IQ gains (>30 points) only occurred in younger children. Children aged >8
years and children with low initial IQs (<30),
regardless of age, showed uniformly low IQs at program discharge.
• Adaptive gains were more modest and were
similar across groups (with similar effect sizes in both groups).
• Young children gained more rapidly than
older children for both cognitive and adaptive development, although this difference was
much more pronounced for cognitive rate of
development.
• No control group.
• Outcome measures are imperfect, which
may impact on their reliability and validity. • No precise information on intensity of
treatment (although program guidelines require a minimum of 20 hours per week).
• Details surrounding the nature of the
participants’ IBI program was lacking (i.e. it is possible that the curriculum for older
children might have been somewhat
different). • Outcome assessors were not independent
nor blind to the child’s participation in IBI.
• Study sample was formed by yoke-matching older participants (on the basis of
initial IQ) with younger children from Perry
et al. (2013a) study.

143
Table 5. (continued)
Study Description Participants Intervention/Comparison Outcomes Main Findings Comments
First author, year (Ref.): Remington, 2007 (91)
Country: United
Kingdom
Study design: Non-
randomized prospective
controlled multiple-
group comparison
Number of centres:
Several potential sites (exact number
unspecified).
Funding source: Health
Foundation UK
Quality: Moderate
Sample size (n): 44 EG (n): 23
CG (n): 21
Male (%): NR
Sample attrition: Some missing data on one or more outcome
measures at follow-up.
Inclusion criteria for study entry:
• Diagnosis of autism based on
ADI-R • Intake age ≥30≤42 months
• Free of any other chronic or
serious medical condition that might interfere with intervention
delivery or that might adversely
affect development • Currently living in family home
Baseline participant characteristics Age (months), mean±SD (range):
EG: 35.7±4.0
CG: 38.4±4.4
IQ at intake, mean±SD (range): EG: 61.43±16.43
CG: 62.33±16.64
EG: Home-based early intensive behavioural intervention delivered at
18-34 hours per week. Although
delivered by a range of service providers, all interventions shared the
10 common features characterizing
research-based interventions identified by Green et al. (2002).
CG: Treatment as usual (TAU),
whereby parents were not actively seeking behavioral intervention and
were instead receiving publicly-funded
standard provision offered by their Local Education Authority.
Other interventions used: PECS & TEACCH for some EG children. Some
participants received speech therapy at
baseline and follow-up assessments, and dietary restrictions as well as
routine prescription medications and
vitamin injections were also commonly reported.
Provider(s): Trained therapists (3-5) and parents.
Parental role: NR.
Primary outcome(s): • Full-scale IQ
Secondary outcome(s): • Adaptive behaviour
• Language
• Mental age • Joint attention
• Child behaviour
• Parental well-being/family satisfaction
Length of follow-up: 24 months. Assessments
occurred at baseline (T1),
after the first year (T2), and last follow-up (T3).
• The EG showed significantly greater increases in mental age, intellectual
functioning, language functioning,
adaptive functioning, and positive social behaviours as compared with
control.
The 24-month effect size for IQ (based on Cohen’s d statistic) was
0.77, indicating a relatively large
difference between the groups. • Six children in the EG (26%)
achieved a statistically reliable
improvement from baseline to the last follow-up, as compared with only
three children (14%) in the CG (three
CG children also regressed reliably). • Five of the six EG children who
achieved reliable change also
achieved clinically significant change, and all three children in the CG
achieving reliable improvement also
achieved clinically significant change. • There was no evidence of
differentially increased stress or
additional mental health problems in parents of the EG participants as
compared with control.
• Small sample size. • Non-random assignment of
participants to groups (based on
parent preference). • Some pre-existing group
differences may have been
unobserved. • Range of treatment providers
did not allow for
uniform/coherent treatment delivery and treatment integrity.
• Staff turnover was common
and replacement tutors often difficult to obtain and slow to
train (tutor shortages have a
direct impact on treatment fidelity).
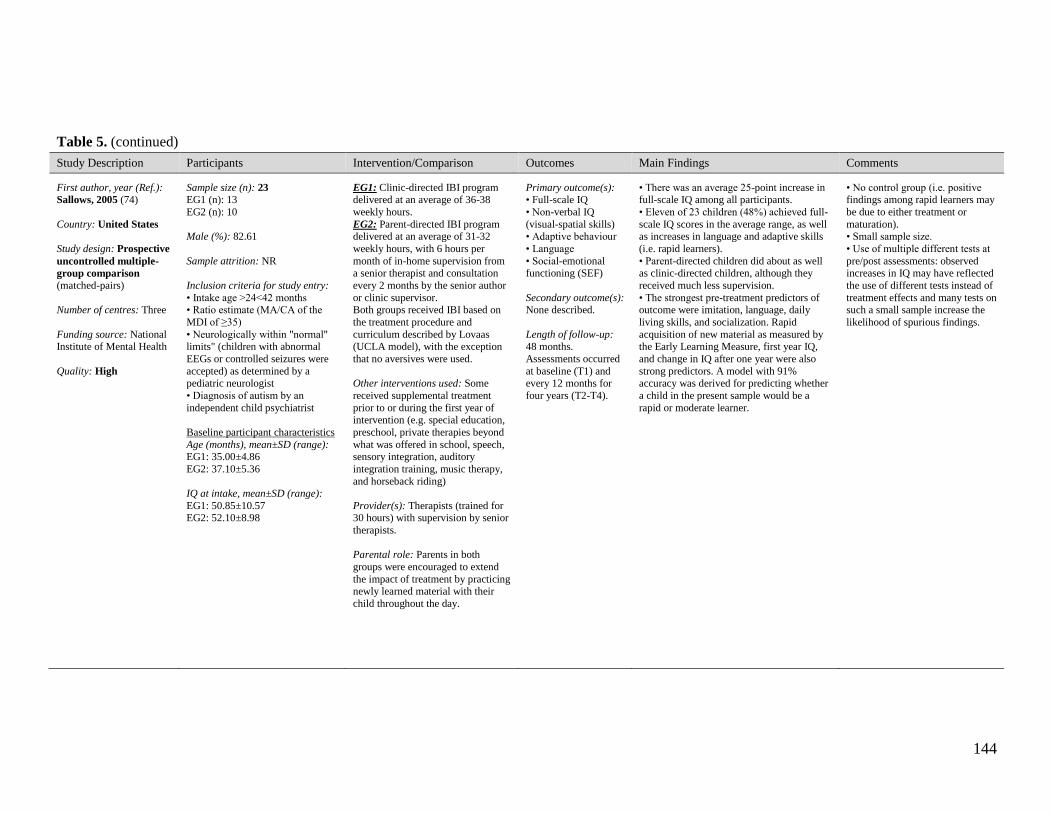
144
Table 5. (continued)
Study Description Participants Intervention/Comparison Outcomes Main Findings Comments
First author, year (Ref.): Sallows, 2005 (74)
Country: United States
Study design: Prospective
uncontrolled multiple-
group comparison
(matched-pairs)
Number of centres: Three
Funding source: National Institute of Mental Health
Quality: High
Sample size (n): 23 EG1 (n): 13
EG2 (n): 10
Male (%): 82.61
Sample attrition: NR
Inclusion criteria for study entry:
• Intake age >24<42 months • Ratio estimate (MA/CA of the
MDI of ≥35)
• Neurologically within "normal" limits" (children with abnormal
EEGs or controlled seizures were
accepted) as determined by a pediatric neurologist
• Diagnosis of autism by an
independent child psychiatrist
Baseline participant characteristics
Age (months), mean±SD (range): EG1: 35.00±4.86
EG2: 37.10±5.36
IQ at intake, mean±SD (range):
EG1: 50.85±10.57 EG2: 52.10±8.98
EG1: Clinic-directed IBI program delivered at an average of 36-38
weekly hours.
EG2: Parent-directed IBI program delivered at an average of 31-32
weekly hours, with 6 hours per
month of in-home supervision from a senior therapist and consultation
every 2 months by the senior author
or clinic supervisor. Both groups received IBI based on
the treatment procedure and
curriculum described by Lovaas (UCLA model), with the exception
that no aversives were used.
Other interventions used: Some
received supplemental treatment
prior to or during the first year of intervention (e.g. special education,
preschool, private therapies beyond
what was offered in school, speech, sensory integration, auditory
integration training, music therapy,
and horseback riding)
Provider(s): Therapists (trained for 30 hours) with supervision by senior
therapists.
Parental role: Parents in both
groups were encouraged to extend
the impact of treatment by practicing newly learned material with their
child throughout the day.
Primary outcome(s): • Full-scale IQ
• Non-verbal IQ
(visual-spatial skills) • Adaptive behaviour
• Language
• Social-emotional functioning (SEF)
Secondary outcome(s): None described.
Length of follow-up: 48 months.
Assessments occurred
at baseline (T1) and every 12 months for
four years (T2-T4).
• There was an average 25-point increase in full-scale IQ among all participants.
• Eleven of 23 children (48%) achieved full-
scale IQ scores in the average range, as well as increases in language and adaptive skills
(i.e. rapid learners).
• Parent-directed children did about as well as clinic-directed children, although they
received much less supervision.
• The strongest pre-treatment predictors of outcome were imitation, language, daily
living skills, and socialization. Rapid
acquisition of new material as measured by the Early Learning Measure, first year IQ,
and change in IQ after one year were also
strong predictors. A model with 91% accuracy was derived for predicting whether
a child in the present sample would be a
rapid or moderate learner.
• No control group (i.e. positive findings among rapid learners may
be due to either treatment or
maturation). • Small sample size.
• Use of multiple different tests at
pre/post assessments: observed increases in IQ may have reflected
the use of different tests instead of
treatment effects and many tests on such a small sample increase the
likelihood of spurious findings.

145
Table 5. (continued)
Study Description Participants Intervention/Comparison Outcomes Main Findings Comments
First author, year (Ref.): Smith, 2000 (75)
Country: United States
Study design:
Randomized controlled
trial (matched-pairs
comparison)
Number of centres: NR.
Funding source: Department of Education
& UCLA Regents
Quality: Moderate
Sample size (n): 28 EG (n): 15
CG (n): 13
Male (%): 82.14
Sample attrition:
Inclusion criteria for study entry:
• Intake age >18<42 months • Residence within 1 hour of
treatment centre
• IQ ratio score between 35 and 75 • Diagnosis of ASD or PDD-NOS
• Absence of major medical
problems (other than autism or mental retardation)
Baseline participant characteristics Age (months), mean±SD (range):
EG: 36.07±6.00
CG: 35.77±5.37
IQ at intake, mean±SD (range):
EG: 50.53±11.18 CG: 50.69±13.88
EG: Home-based IBI program based on UCLA YAP model (Lovaas manualized
treatment) delivered at an average of 25
weekly hours in the first year of treatment, with reduced weekly hours in years 2 and 3.
CG: Parent training group, whereby parents
taught to use treatment approaches described in the Lovaas manual and were supervised in
using these approaches to help their child
acquire skills. Treatment incorporates one hour per week of supervision by primary
author, and additional supervision as needed.
Other interventions used:
None reported.
Provider(s): Student therapists (team of 4-6)
under close supervision.
Parental role: Each primary caregiver was
asked to conduct five weekly hours of
treatment in the EG.
Primary outcome(s): • Full-scale IQ
• Non-verbal IQ (visual-
spatial skills) • Adaptive behaviour
• Language
• Social emotional functioning (SEF) domains
• Parental well-
being/family satisfaction • Academic/classroom
placement
Secondary outcome(s):
None described.
Length of follow-up: Mean
program duration of 33
months (range 18-63). Assessments occurred at
baseline (T1) and at
between ages 7-8 (T2).
• Intensively treated (EG) children outperformed children in the CG at
follow-up on measures of intelligence
(IQ), visual-spatial ability, language, and academic achievement. As a group,
EG children also had less restrictive
school placements. • IBI children did not differ from
children in the parent training group
(CG) on standardized tests of behaviour problems and adaptive functioning at
follow-up.
• Within each group, PDD-NOS children benefited at least as much from
IBI as did children with autism.
• Parents in both groups held highly positive views about the services their
children received.
• Intake data were generally poor predictors of follow-up scores.
• Small sample size. • Lack of a standardized
diagnostic instrument.

146
Table 5. (continued)
Study Description Participants Intervention/Comparison Outcomes Main Findings Comments
First author, year (Ref.): Stoelb, 2004 (76)
Country: United States
Study design:
Retrospective one-group
pre/post design
Number of centres: Two academic medical centres
Funding source: NR
Quality: Moderate
Sample size (n): 19 Male (%): 73.68
Sample attrition: Some missing data at follow-up.
Inclusion criteria for study entry: • Diagnosis of autism according to
DSM-IV
• Completion of a medical/neurological/genetic
evaluation
• Participation in an EIBI program for at least one year.
Baseline participant characteristics Age (months), mean±SD (range):
56 (26-122)
IQ at intake, mean±SD (range):
NR
EG: Centre-based IBI program modeled after published descriptions
of other early intensive behavioural
programs and delivered at 12-36 weekly hours. Individualized
intervention programs employed the
use of discrete trial technology, and behavioral acceleration and
deceleration techniques.
Other interventions used: Use of
supplementary dietary intervention in
about 40% of participants.
Provider(s): Team of 2-6 therapy
implementers, overseen by 1 of 3 behavioural consultants.
Parental role: Efforts were made to include parents in all aspects of
treatment, and they were encouraged to
participate in intervention delivery as implementers. Some were involved in
treatment delivery and treatment
decisions, while others opted out of parental involvement.
Primary outcome(s): • Adaptive behaviour
• Severity of symptoms
• Functioning • Language
Secondary outcome(s): None reported
Length of follow-up: 12 months. Assessments
occurred at baseline
(T1), after 6 months (T2), and after one year
of treatment (T3).
• Physical dysmorphology was strongly correlated with outcome following both 6
and 12 months of treatment.
• Nondysmorphic participants who were linguistic at treatment onset tended to make
more progress if they did not have a
regressive form of autism and if they began treatment at younger ages.
• A wide variety of other variable failed to
effectively predict outcome: gender, head circumference, MRI results, history of
seizures, pre-treatment functioning, autism
subtype, history of sleep difficulties, family history, SES, parental participation in
treatment, treatment intensity, and the use of
dietary interventions.
• No control group. • Small sample size.
• The EPS is not a validated
measure for evaluating outcomes with IBI, and it was
used retrospectively (rather
than prospectively).

147
Table 5. (continued)
Study Description Participants Intervention/Comparison Outcomes Main Findings Comments
First author, year (Ref.): Virues-Ortega, 2013 (94)
Country: Spain
Study design: Prospective
one-group pre/post
design
Number of centres: Single centre in Barcelona, Spain
(Fundación Planeta
Imaginario IBI program)
Funding source: NR
Quality: Moderate
Sample size (n): 24 Male (%): 87.50
Sample attrition: None.
Inclusion criteria for study entry:
None described. There were no exclusions based on age or pre-
intervention functioning.
Baseline participant characteristics
Age (months), mean±SD (range):
50.5±28.3
IQ at intake, mean±SD (range):
74.50±13.98
EG: Home-based IBI program based on the
UCLA YAP model
affiliated with the Lovaas institute and delivered at
about 15 to 47 weekly
hours.
Other interventions used:
None described.
Provider(s): Trained tutors,
supervised by licensed psychologists.
Parental role: Parents were active co-therapists during
intervention.
Primary outcome(s): • Full-scale IQ
• Early Learning Accomplishment
Profile (E-LAP) domains • Learning Accomplishment
Developmental Profile-II (LAP-D)
domains
Secondary outcome(s):
None reported.
Length of follow-up: Mean program
duration of about 22 months (range 5.33-58.57). Assessments occurred
at baseline (T1) and every six
months until discharge (T2-T4).
• Increased intervention time, younger age at intervention onset, and higher pre-intervention
functioning might be associated with greater
gains on outcome measures for IBI programs of up to four years in duration.
• Individuals starting intervention at a lower
level in a given outcome were more likely to follow an asymptotical growth as opposed to
individuals that initiated treatment with a
higher level of performance. • Multilevel regression analyses revealed that
total intervention duration in hours (weekly
hours multiplied by weeks of intervention) was the single predictor with the highest
contribution to the model fit for all outcomes
when compared with unconditional models (i.e. both intensity and duration, as represented
by total intervention time, remained important
factors of intervention gains regardless of pre-intervention functioning or age).
• No control group • Small sample size
• E-LAP & LAP-D results
are difficult to interpret.

148
Table 5. (continued)
Study Description Participants Intervention/Comparison Outcomes Main Findings Comments
First author, year (Ref.): Weiss, 1999 (77)
Country: United States
Study design: Prospective
one-group pre/post
design
Number of centres: Single centre (Center for Applier
Psychology at Rutgers
University)
Funding source: NR
Quality: Low
Sample size (n): 20 Male (%): 95.0
Sample attrition: NR
Inclusion criteria for study entry:
None described.
Baseline participant characteristics
Age (months), mean±SD (range): 41.5 (20-65)
IQ at intake, mean±SD (range): NR
EG: Home-based intensive behaviour analytic
intervention delivered at
about 40 hours per week.
Other interventions used:
None described.
Provider(s): Trained
instructors/therapists.
Parental role: NR
Primary outcome(s): • Adaptive behaviour
• Severity of symptoms
• Mastery of skills • Academic/classroom
placement
Secondary outcome(s):
None described.
Length of follow-up:
24 months.
• Initial learning rates of children with autism were somewhat related to later
learning and status after two years (i.e.
children who initially learned quickly continued to demonstrate rapid
acquisition rates)
• Initial learning rates were also positively correlated with the child's
adaptive skills and severity of symptoms
at discharge. • All children who struggled with initial
skill acquisition continued to struggle
with it, exhibited higher degrees autistic behaviour and lower adaptive skills at
discharge.
• No control group or group receiving a different level of treatment.
• Small sample size.
• Some problems with measures selected for outcome (e.g. while the CARS may be
potentially quite useful for diagnostic
screening, it's not an instrument which discriminates effectively between autism
and other disorders, and it's not based on
current criteria for diagnosis; both CARS and VABS rely on parental report).
• Potential selection bias in selection of
participants (i.e. children receiving services may be from higher SES families and those
who are very involved with/advocate for
their children). • Full-scale IQ is not measured (data would
strengthen the study if present).
• Other factors may be confounded with learning rate (variability in responsiveness
to reinforcement, variability in skill levels
of teams). • The author did not collect precise data on
the number of hours of therapy/instruction
each child received per week (families were advised to provide 40 weekly hours).
• CARS scores at pre- and post-IBI were completed by parents, while it is typically
used as a standardized behaviour
observation measure.

149
Table 5. (continued)
Study Description Participants Intervention/Comparison Outcomes Main Findings Comments
First author, year (Ref.): Zachor, 2007 (87)
Country: Israel
Study design: Non-
randomized prospective
controlled multiple-
group comparison Number of centres: Two
centres in two different
counties.
Funding source: Ministry
of Education
Quality: Low
Sample size (n): 39 EG (n): 20
CG (n): 19
Male (%): 94.87
Sample attrition: Missing outcome data for 3 participants at follow-up.
Inclusion criteria for study entry: • Age <36 months
• Absence of identified medical
abnormalities (e.g. seizures, hearing deficiencies)
Baseline participant characteristics Age (months), mean±SD (range):
EG: 27.7 (22-34)
CG: 28.8 (23-33)
IQ at intake, mean±SD (range):
EG: 76.1±15.2 CG: 79.6±17.0
EG: Centre-based IBI program based on ABA principles and
delivered at about 35 weekly
hours, incorporating discrete trial training, naturalistic, and
incidental teaching techniques.
CG: Eclectic-developmental (ED) program based on the principles
derived from several approaches,
mainly from the developmentally oriented philosophy and the DIR
model, but also strategies driven
from TEACCH and ABA.
Other interventions used:
None described.
Provider(s): Skilled behaviour
therapist, supervised by trained behaviour analyst.
Parental role: NR.
Primary outcome(s): • Severity of symptoms
• Diagnostic recovery
Secondary outcome(s):
None described.
Length of follow-up:
12 months.
• After 1 year of intervention, both the EG and CG showed improvement in reciprocal
social interaction (based on ADOS scores),
though advancement in this domain is more pronounced in the EG.
• EG showed significant progress in
language and communication, as compared with CG.
• Children with higher IQ scores at intake
had better language and communication and reciprocal social skills before and after the
intervention; yet, children with higher IQ
scores at intake did not improve significantly more than children with lower intake IQ
scores.
• EG children improved more than children in the CG, regardless of their baseline IQ
level.
• Diagnostic recovery (change from autism/ASD to off-spectrum) occurred in
20% of the EG sample, and none of the CG
members.
• Non-random assignment to groups (based on geographical
location).
• Small sample size. • No formal measures or reporting
of treatment integrity.
• Focus of analysis is on demonstrating improvement in
core autistic features (reciprocal-
social interaction) rather than learning rate (IQ), which deviates
from the goal of IBI therapy.
• Cognitive functioning (IQ) is only assessed at pre-intervention
time, and IQ is treated as an
independent variable in the analysis (rather than an outcome
measure).

150
Table 5. (continued)
Study Description Participants Intervention/Comparison Outcomes Main Findings Comments
First author, year (Ref.): Zachor, 2010 (88)
Country: Israel
Study design: Non-
randomized
retrospective controlled
multiple-group
comparison
Number of centres: Seven
centre-based autism-specific early intervention
community-based
preschools (four of which used ABA teaching
principles)
Funding source: Private
support (Mr. Dov Moran)
Quality: Moderate
Sample size (n): 78 EG (n): 45
CG (n): 33
Male (%): 91.03
Sample attrition: Some missing data at follow-up and discordant
pre- and post- intervention sample
sizes.
Inclusion criteria for study entry:
• Clinical diagnosis of autism based on DSM-IV criteria and cut-off
points on the ADI-R
• Absence of additional major medical diagnoses
• Complete post-intervention
assessments
Baseline participant characteristics
Age (months), mean±SD (range): EG: 25.1±3.9 (17-35)
CG: 26.0±4.6 (15-33)
IQ at intake, mean±SD (range):
EG: 72.2±19.2 (49-135) CG: 73.3±22.2 (49-132)
Treatment arms EG: School-based IBI program rooted in ABA
teaching principles delivered at about 20
weekly hours and consisting of individualized goals and objectives to increase language, play,
social, emotional, academic, and daily living
skills, and to reduce inappropriate behaviours. Behavioural analytic techniques used included:
discrete trial training, incidental teaching,
shaping for positive reinforcement, successive approximation, systematic prompting, fading
procedures, discrimination learning, task
analysis and functional assessment and reinforcement procedures according to several
treatment manuals.
CG: Community-based eclectic program incorporating several intervention approaches
(i.e. developmental, DIR, TEACCH).
Other interventions used:
None described.
Provider(s): Program supervisors (BCBA),
trained therapists (team of 3 per child), speech
language specialists, occupational therapists, and special education preschool teachers.
Parental role: Parents received weekly
instructions for home treatment from the
behaviour analyst who supervised the child's program. CG parents participated one full day
per week in the child's preschool, learned how
therapists work with the child, practiced intervention, and received individual and group
training.
Primary outcome(s): • Full-scale IQ
• Adaptive behaviour
• Severity of symptoms
Secondary outcome(s):
None described.
Length of follow-up:
12 months.
• Both intervention groups improved significantly, and there were no significant
group differences over time on any of the
outcomes measures (change in autism diagnostic classification, cognitive abilities,
or adaptive skills).
• Diagnostic stability was very high at discharge, as 91% of children remained with
a classification of autism, with both groups
showing similar stability and change of autism symptoms.
• CG children with less severe autism
symptoms had better outcome in adaptive communication and socialization skills than
EG children with similar autism severity,
while no such association was found for cognitive functioning.
• Non-random assignment (based on
place of residence).
• The CG had a greater parental
involvement
component than the EG (more child
centered).

151
Table 6. Predictors of treatment response and observed associations in included studies
First author, year
(Ref. No.)
Predictive
variable(s) Observed association Statistical methods
Significant
association Measure of association Comments
Ben-Itzchak, 2007
(84)
IQ
(1) HIQ group showed greater progress in receptive language, expressive language, play
skills, and nonverbal communication skills, as
compared with LIQ group.
(2) Significant negative correlation was found
between the ADOS reciprocal-social interaction and IQ (i.e. higher IQ scores
correlated with fewer deficits in social
interaction skills).
(1) one-way
MANCOVA on DBS
domains
(2) Pearson correlation
Yes
(1) F(6,11)=3.30, p<0.05,
ƞ²=0.643
(2) r = -0.606; p <0.01
Median IQ = 70, <70=LIQ, >71=HIQ
HS = high social; LS = low social; HC =
high communication; LC = low
communication.
Variables associated with change in the
treated group may not necessarily reflect
actual predictors of outcome as not all of
the observed change can be attributed to
the effect of behavioural treatment.
Psy
HS group showed greater progress in
receptive and expressive language, as
compared with LS group. No significant effect was observed for the HC
and LC groups.
Two one-way
MANCOVA tests on all DBS domains
No NR
Ben-Itzchak, 2009
(85)
Age
No significant differences between the
unchanged and improved groups were noted in child's age, adaptive skills, or parental
measures. A trend was only noted in cognitive
abilities; specifically, the improved group had significantly better non-verbal and verbal
scores (receptive language domain), as
compared with the unchanged group.
2 X 2 MANOVA (2
groups x 2 times)
with repeated measures
No NS
Unchanged group (n=53): Children whose
diagnostic classification (severity) remained the same after treatment.
Improved group (n=15): Children who
improved their diagnosis post intervention (i.e. ASD or Off Spectrum vs. Autism)
Variables associated with change in
unchanged and improved group may not
necessarily reflect actual predictors of
outcome as not all of the observed change
can be attributed to treatment. This study
therefore examined predictors of growth
rather than predictors of treatment response.
IQ
Yes
(receptive
language)
NR
AB No NS
Parental factors
(education level) No NS

152
Table 6. (continued)
First author, year
(Ref. No.)
Predictive
variable(s) Observed association Statistical methods
Significant
association Measure of association Comments
Ben-Itzchak, 2014 (86)
IQ
(1) The high (DQ≥70) and low (DQ<70)
cognitive ability groups did not differ significantly in their decrease in autism
severity (i.e. improvement in autism severity
is not affected by baseline cognition) (2) Significant increases in the
communication, socialization, and daily living
sub-domains were noted only in the higher cognitive ability group, while standard scores
remained unchanged for the lower cognitive
ability group. (3) Gains in the fine-motor and receptive
language MSEL subdomain scores were noted
only in the group with lower cognition, with decreases in standard scores observed for the
higher cognitive group.
Three separate 3 X 2
MANOVAs with repeated measures on
time
No (except
for select
VABS and MSEL
subdomain
scores)
Unclear.
Unclear whether statistical methods
used were suitable for identifying
predictors of treatment response.
Variables associated with change in
the treated group may not
necessarily reflect actual predictors
of outcome as not all of the observed
change can be attributed to the effect
of behavioural treatment.
Blacklock, 2014
(82)
IQ
Strong linear relationships were observed
between full-scale IQ at baseline and all follow-up (T2) outcome variables.
Pearson correlation Yes
FS IQ at T2: r=0.65 (p<0.01, n=63)
MA at T2: r=0.64 (p<0.01, n=63) RCog: r=0.49 (p<0.01, n=61),
ABC SS at T2: r=0.66 (p<0.01, n=49)
ABC AE at T2: r=0.70 (p<0.01, n=64) RDev: r=0.31 (p<0.05, n=49)
Variables associated with change in
the treated group may not
necessarily reflect actual predictors
of response to IBI as not all of the
observed change can be attributed to
the effect of behavioural treatment
(due to study design limitation).
AB composite
(ABC)
AB composite standard scores at intake were significantly and highly correlated with all six
outcome variables.
Pearson correlation Yes
FS IQ at T2: r=0.91 (p<0.01, n=61) MA at T2: r=0.84 (p<0.01, n=61)
RCog: r=0.32 (p<0.05, n=61)
ABC SS at T2: r=0.75 (p<0.01, n=45) ABC AE at T2: r=0.75 (p<0.01, n=60)
RDev: r=0.71 (p<0.01, n=46)
Age
Correlations for age at entry with outcomes at T2 showed weak linear relationships (i.e. age
at program entry was not reliably associated
with outcome). There is a possible curvilinear relationship between child's age at entry and
treatment outcomes at follow-up (as per
scatterplot analysis): more variable outcomes were noted for the relatively younger children
within the sample, as compared with older
children (>8 years) which had uniformly low and less variable scores.
Pearson correlation No
FS IQ at T2: r=-0.14 (NS, n=64)
MA at T2: r=0.25 (p<0.05, n=64)
RCog: r=-0.12 (NS, n=61) ABC SS at T2: r=-0.26 (NS, n=50)
ABC AE at T2: r=0.24 (NS, n=65)
RDev: r=0.18 (NS, n=49)

153
Table 6. (continued)
First author, year
(Ref. No.)
Predictive
variable(s) Observed association Statistical methods
Significant
association Measure of association Comments
Eikeseth, 2002 (92)
Age Age at which children started treatment was not reliably associated with outcome or
amount of change in scores.
Unprotected Pearson
correlations No NS
Correlations were conducted separately
for the behavioural and eclectic
treatment groups. Multiple regression analysis with a dummy-coded
treatment variable might have allowed
for more rigorous predictive modeling.
IQ Intake IQ was strongly associated with follow-up IQ and language. Correlations on
all other measures were non-significant.
Unprotected Pearson
correlations
No
(except IQ,
Lang, and ∆Lang)
IQ at T2: r=0.82 (p<0.01) Lang at T2: r=0.89 (p<0.001)
∆Lang: r=0.59 (p<0.05)
Non-verbal IQ
Performance (non-verbal) IQ at baseline was
not reliably associated with outcome. A
significant correlation was only noted between non-verbal IQ at intake and follow-
up change in non-verbal IQ scores.
Unprotected Pearson
correlations
No (except
∆IQ, non-
verbal)
∆IQ (non-verbal): r=-0.84 (p<0.01)
AB
Adaptive skills at intake were not reliably associated with outcome. Correlations
between intake adaptive behaviour scores and treatment gains were only significant for
change in performance IQ.
Unprotected Pearson correlations
No
(except ∆IQ, non-
verbal)
∆IQ (non-verbal): r=-0.60 (p<0.05)
Eikeseth, 2007 (93)
Age
Age at which children started treatment was
not reliably associated with outcome or
amount of change in scores.
Unprotected Pearson correlations
No NS
Correlations were conducted separately for the behavioural and eclectic
treatment groups. Multiple regression analysis with a dummy-coded
treatment variable might have allowed
for more rigorous predictive modeling.
IQ
Intake IQ was significantly correlated only
with follow-up IQ and AB scores (except
VABS socialization subdomain score);i.e., children with higher intake IQ tended to score
higher on follow-up measures but did not tend
to make larger gains in IQ, language and adaptive scores.
Unprotected Pearson
correlations Yes
IQ at T2: r=0.60 (p<0.05)
AB composite at T2: r=0.58 (p<0.05)
AB-Com at T2: r=0.56 (p<0.05) AB-DLS at T2: r=0.60 (p<0.05)
AB
Intake adaptive skills were not reliably
associated with outcome or amount of change in scores.
Unprotected Pearson
correlations No NS
Eikeseth, 2009
(89)
Intensity of
supervision
A significant correlation was noted between intensity of supervision and change in IQ
scores between intake and follow-up.
Unprotected Pearson correlations
Linear regression
No (except
∆IQ) ∆IQ: r=0.45, p<0.05
Participant data taken from parent-managed treatment arm of Hayward et
al (2009) study.
Mean intensity of supervision per child per month was 5.2 h, and ranged from
2.9 to 7.8 h.
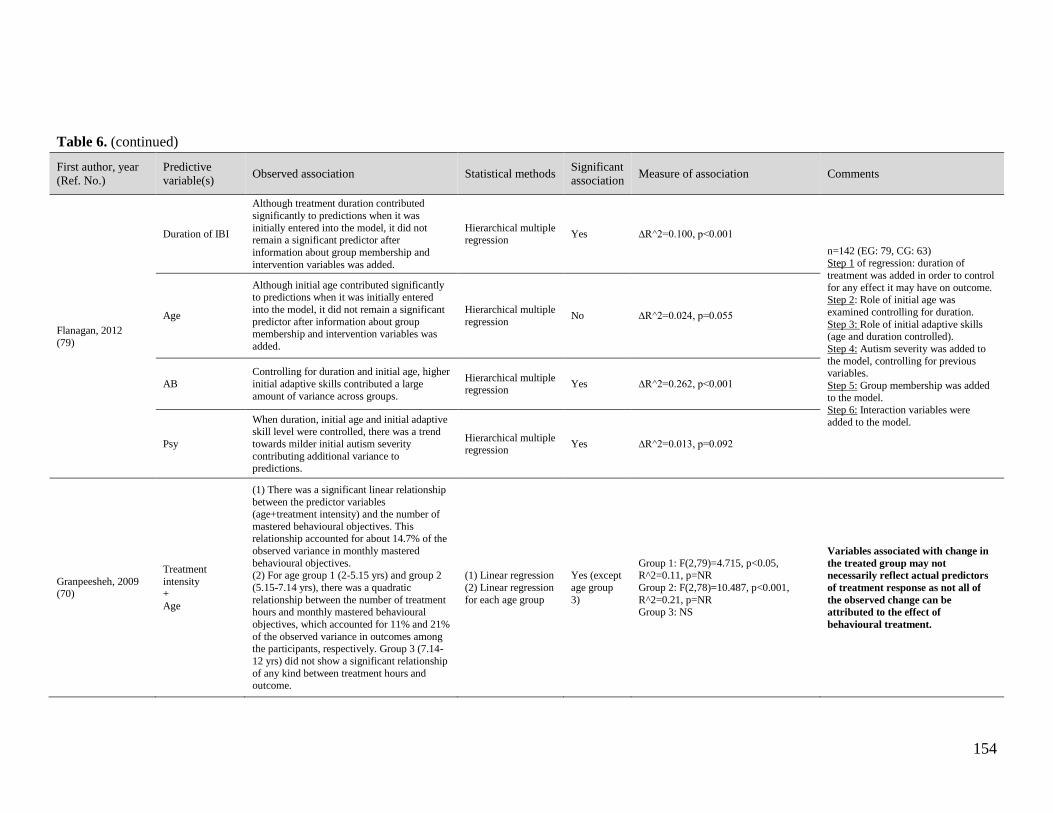
154
Table 6. (continued)
First author, year
(Ref. No.)
Predictive
variable(s) Observed association Statistical methods
Significant
association Measure of association Comments
Flanagan, 2012
(79)
Duration of IBI
Although treatment duration contributed
significantly to predictions when it was
initially entered into the model, it did not remain a significant predictor after
information about group membership and
intervention variables was added.
Hierarchical multiple regression
Yes ∆R^2=0.100, p<0.001
n=142 (EG: 79, CG: 63)
Step 1 of regression: duration of
treatment was added in order to control
for any effect it may have on outcome. Step 2: Role of initial age was
examined controlling for duration.
Step 3: Role of initial adaptive skills (age and duration controlled).
Step 4: Autism severity was added to
the model, controlling for previous variables.
Step 5: Group membership was added
to the model. Step 6: Interaction variables were
added to the model.
Age
Although initial age contributed significantly to predictions when it was initially entered
into the model, it did not remain a significant
predictor after information about group membership and intervention variables was
added.
Hierarchical multiple
regression No ∆R^2=0.024, p=0.055
AB
Controlling for duration and initial age, higher
initial adaptive skills contributed a large
amount of variance across groups.
Hierarchical multiple regression
Yes ∆R^2=0.262, p<0.001
Psy
When duration, initial age and initial adaptive
skill level were controlled, there was a trend
towards milder initial autism severity
contributing additional variance to predictions.
Hierarchical multiple regression
Yes ∆R^2=0.013, p=0.092
Granpeesheh, 2009 (70)
Treatment
intensity +
Age
(1) There was a significant linear relationship
between the predictor variables (age+treatment intensity) and the number of
mastered behavioural objectives. This relationship accounted for about 14.7% of the
observed variance in monthly mastered
behavioural objectives. (2) For age group 1 (2-5.15 yrs) and group 2
(5.15-7.14 yrs), there was a quadratic
relationship between the number of treatment
hours and monthly mastered behavioural
objectives, which accounted for 11% and 21%
of the observed variance in outcomes among the participants, respectively. Group 3 (7.14-
12 yrs) did not show a significant relationship
of any kind between treatment hours and outcome.
(1) Linear regression
(2) Linear regression
for each age group
Yes (except
age group
3)
Group 1: F(2,79)=4.715, p<0.05, R^2=0.11, p=NR
Group 2: F(2,78)=10.487, p<0.001,
R^2=0.21, p=NR
Group 3: NS
Variables associated with change in
the treated group may not
necessarily reflect actual predictors
of treatment response as not all of
the observed change can be
attributed to the effect of
behavioural treatment.

155
Table 6. (continued)
First author, year
(Ref. No.)
Predictive
variable(s) Observed association Statistical methods
Significant
association Measure of association Comments
Harris, 2000
(71)
IQ at intake Children who had higher IQ at admission were more likely to be in regular education
classes at follow-up.
Pearson product-
moment correlation Yes r(25)=0.655, p<0.005
Variables associated with change in
the treated group may not
necessarily reflect actual predictors
of treatment response as not all of
the observed change can be
attributed to the effect of
behavioural treatment.
IQ at discharge Children who had higher IQ at discharge were more likely to be placed in regular education
classroom at follow-up.
Pearson product-
moment correlation Yes r(25)=0.779, p<0.005
Psy
Severity of autism (as measured by the
CARS) was not significantly correlated to academic placement at follow-up.
Pearson product-
moment correlation No NS
Age
(1) Children who were younger at admission were more likely to be in regular education
settings at follow-up than were children who
were older at intake. (2) Younger children had higher IQs at
discharge than those who entered at an older
age.
Pearson product-
moment correlation Yes
(1) r(25) = 0.658, p<0.005
(2) r(25)= -0.401, p<0.025
Hayward, 2009
(90)
Age Age at which children started treatment was not reliably associated with outcome or
amount of change in scores.
Unprotected Pearson
correlation No NS
It is unclear whether predictive modeling was carried out using data
from the intensive clinic-based group,
or if correlations represent the relationship between pre-treatment
variables and outcomes for all
participants. Due to non-significant group differences at follow-up, data for
the clinic-based and parent-managed
groups were treated as one data set. As a result, this same data set may have
been used for the analysis of predictive
variables.
Variables associated with change in
the treated groups (clinic-based and
parent-managed) may not
necessarily reflect actual predictors
of outcome as not all of the observed
change can be attributed to the effect
of behavioural treatment.
IQ
Intake IQ was significantly correlated with
follow-up IQ, visual-spatial IQ, and AB;
however, correlations between intake IQ and treatment gains (change scores) on all
measures were non-significant.
Unprotected Pearson
correlation Yes
IQ at T2: r=0.66 (p<0.01)
IQ (non-verbal) at T2: r=0.60 (p<0.01) AB composite at T2: r=0.57 (p<0.01)
Non-verbal IQ
Intake visual-spatial (non-verbal) IQ was
significantly correlated with all measures at follow-up, as well as with changes in full-
scale IQ and AB composite scores.
Unprotected Pearson correlation
Yes
IQ at T2: r=0.77 (p<0.01) ∆IQ: r=0.38 (p<0.05)
IQ (non-verbal) at T2: r=0.70 (p<0.01)
ABC at T2: r=0.62 (p<0.01) ∆ABC: r=0.64 (p<0.01)
AB composite
(ABC)
Intake adaptive skills were significantly correlated with all measures at follow-up;
however, correlations between intake adaptive
skills and treatment gains (change scores) on all measures at follow-up were non-
significant.
Unprotected Pearson
correlation Yes
IQ at T2: r=0.56 (p<0.01) IQ (non-verbal) at T2: r=0.41 (p<0.01)
ABC at T2: r=0.53 (p<0.01)

156
Table 6. (continued)
First author, year
(Ref. No.)
Predictive
variable(s) Observed association Statistical methods
Significant
association Measure of association Comments
Perry, 2011
(81)
Age
(1) Children who started IBI younger tended
to score higher at discharge on adaptive and
cognitive variables (i.e. AB and IQ were significantly negatively correlated with age at
entry). Younger age at entry was also
correlated with milder autism severity at exit. (2) Age accounted for a significant, but very
small, amount of unique variance for IQ and
autism severity, but made no unique contribution to AB-composite at T2.
(1) Correlation
(2) Stepwise linear
regression
Yes
(1) IQ: r = -0.39, p<0.01
AB composite: r = -0.43, p<0.01
Psy (CARS): r=0.18, p<0.01
(2) IQ estimate: R^2=0.063, p<0.001
Psy(CARS): R^2=0.015, p<0.05
Regressions were computed for 8
primary dependent variables at T2.
Step 1: T1 score of the same variable was entered (as a way of controlling for
it) and report R^2 for the initial step.
Step 2: Predictor variable was entered in Step 2 to determine whether it
accounted for any additional variance.
R^2 Step 2 change scores are reported as measures of association.
Variables associated with change in
the treated group may not
necessarily reflect actual predictors
of outcome as not all of the observed
change can be attributed to the effect
of behavioural treatment. This
analysis more closely reflect an investigation of predictors of growth
rather than predictors of outcome.
IQ
(1) There were significant and strong correlations with initial IQ on all outcome
variables.
(2) Initial IQ accounted for a significant but small amount of incremental variance for AB
and autism severity (beyond that associated
with the initial value of IQ). IQ at intake accounted for 53% of the variance in T2 IQ
(Step 1 of regression).
(1) Correlation (2) Stepwise linear
regression
Yes
(1) IQ: r = 0.73, p<0.01 AB composite: r = 0.67, p<0.01
Psy(CARS): r = -0.42, p<0.01
(2) AB composite: ∆R^2=0.053, p<0.001
Psy(CARS): ∆R^2=0.074, p<0.001
AB
(1) Initial Vineland AB composite scores were significantly and quite highly correlated
with all outcome variables.
(2) Initial AB composite scores accounted for significant incremental variance (beyond that
associated with the initial AB-composite
value) in IQ and autism severity.
(1) Correlation
(2) Stepwise linear regression
Yes
(1) IQ: r = 0.72, p<0.01
AB composite: r = 0.77, p<0.01
Psy(CARS): r = -0.51, p<0.01 (2) IQ estimate: ∆R^2=0.059, p<0.001
Psy(CARS): ∆R^2=0.118, p<0.001
Psy
(1) Correlation with initial severity scores
(CARD) indicated modest negative correlations with all outcome variables.
(2) Regression analyses showed that, in
general, initial autism severity did not
contribute to the prediction of outcome
variables, with the exception of IQ at T2.
(3) When initial IQ, age at entry, and initial adaptive skill level were controlled, autism
severity (CARS) contributed an additional
2.0% of variance to predictions. A considerable amount of variance (64%) in
outcome IQ can be predicted based on the
combination of all four predictive variables.
(1) Correlation
(2) Stepwise linear regression
(3) Hierarchical
multiple regression
Yes
(1) IQ: r = -0.43, p<0.01
AB composite: r = -0.34, p<0.01 Psy(CARS): r = 0.52, p<0.01
(2) IQ estimate: ∆R^2=0.038, p<0.001
(3) R^2=0.637, p=NR

157
Table 6. (continued)
First author, year
(Ref. No.)
Predictive
variable(s) Observed association Statistical methods
Significant
association Measure of association Comments
Perry, 2013a
(83)
Age
Controlling for duration and initial IQ, age
accounted for a significant but small, amount
of incremental variance for IQ at T2, but made no unique contribution to AB-
composite standard scores at T2.
Regression analysis further showed that young age at entry into IBI resulted in higher
cognitive (but not adaptive) functioning at the
end of treatment, even after controlling for treatment duration and the child's initial
cognitive level. Age at entry was the only
predictor that that was related to change in IQ (i.e. cognitive gains during intervention)
Hierarchical multiple
regression Yes
IQ at T2: ∆R^2=0.05, p<0.001, Total R^2=0.64, p<0.001
ABC SS at T2: NS
Step 1 of regression: duration of
treatment was added in order to control
for any effect it may have on outcome; Step 2: initial IQ was added; Step 3:
age at start of treatment was added
Variables associated with change in
this single combined group study
may not necessarily reflect actual
predictors of outcome as not all of
the observed change can be
attributed to the effect of
behavioural treatment.
IQ
Controlling for duration, initial IQ accounted for 59% of the variance in IQ at T2, and age
at entry to IBI an additional 5%, for a total of
64% explained variance (total R^2). Initial IQ
did not however predict the magnitude of IQ
gains (change in IQ).
Initial IQ accounted for a significant and substantial proportion of variance in AB
standard scores at T2 (44%), and age at entry
added nothing, for a total of 46% of explained variance.
Regression analysis further demonstrated that
children with higher skill levels before treatment tended to have higher skills levels
after treatment, but children who were higher
functioning cognitively were not the ones who necessarily made the largest IQ gains.
Hierarchical multiple regression
Yes
IQ at T2: ∆R^2=0.59, p<0.001, Total
R^2=0.64, p<0.001 ABC SS at T2: ∆R^2=0.44, p<0.001,
Total R^2=0.46, p<0.001
Duration of IBI
Longer duration of IBI was associated with
slower rates of development between the two
assessments. Treatment duration was not
significantly associated with other outcomes, suggesting that children who were in the
program longer were perhaps not showing
better outcomes on IQ at T2, AB, or change in IQ.
Hierarchical multiple regression
Yes (RCog
& RDev)
No (IQ at T2, ∆IQ, &
ABC SS at
T2)
RCog: β=-0.23 (p<0.01) RDev: β=-0.24 (p<0.001)

158
Table 6. (continued)
First author, year
(Ref. No.)
Predictive
variable(s) Observed association
Statistical
methods
Significant
association Measure of association Comments
Sallows, 2005
(74)
IQ at Y1
IQ at one year was positively and significantly
correlated with full-scale IQ at the three-year treatment
mark.
Correlation Yes r=0.75, p<0.01 Correlations and regression analyses
between pre-treatment variables and three outcome variables (full-scale IQ,
language, and social skills) at three
years post treatment were examined in this study. However, results of any
significant associations between AB
composite score, IQ at one year and full-scale IQ at follow-up are presented
here. Other pre-treatment variables
included: language, Early Learning Measure (ELM) subdomains, VABS
subdomains, non-verbal IQ, ratio IQ,
and ADI-R scores.
AB composite AB composite scores at pre-treatment were not reliably
associated with full-scale IQ at three years. Correlation No NS
IQ, imitation,
language, social
relatedness, severity of
symptoms
Post-treatment IQ was best predicted by this subset of
variables, with 70% of variation in post-treatment IQ explained by this subset.
Linear and logistic
regression (best subset approach)
NR
Unclear (70% variance
reported in text with correlation value of 0.83)
Smith, 2000
(75)
IQ IQ at treatment onset was not reliably associated with full-scale IQ at follow-up. IQ did not significantly
correlate with any other outcome variable.
Unprotected
Pearson correlation No NS
Other pre-
treatment
variables
Other intake measures included: Non-verbal IQ, Lang, AB, SEF, PWB, and AP.
There were 3 statistically significant correlations:
(1) Intake non-verbal IQ with follow-up non-verbal IQ,
(2) intake language with follow-up language, and
(3) intake language with follow-up adaptive skills.
Unprotected
Pearson correlation
No (except for
non-verbal IQ
and language)
(1) r=0.43, p=NR
(2) r=0.36, p=NR
(3) r=0.48, p=NR

159
Table 6. (continued)
First author, year
(Ref. No.)
Predictive
variable(s) Observed association Statistical methods
Significant
association Measure of association Comments
Stoelb, 2004
(76)
Pre-treatment
functioning None
Stepwise linear
regression No NS
The nature of this study does not permit identification of predictors of
treatment response; at best, these
factors can be considered to be predictors of growth.
Outcome measurement was performed retrospectively using a criterion-
referenced scale developed for the study (EIBI Performance Scale).
Results should be interpreted with
caution.
An attempt was made to identify
predictor variables that were significantly correlated with change
among 9 children who were considered
linguistic at treatment onset using the Wilcoxon rank rums test. Although the
authors conclude that participants who
were linguistic at treatment onset tended to make more progress is they
began treatment at younger ages, age
can only be viewed as a predictor of growth, rather than a predictor of
outcome as a result of the study design
limitation as well as the applied
statistical modeling.
Age at treatment
onset
(1) None (2) Participants who were younger (and had a
histories that did not include regression)
tended to have higher EPS change scores.
(1) Stepwise linear
regression
(2) Mann-Whitney (Wilcoxon rank
sums) test
(1) No
(2) Yes
(1) NS
(2) NR, p=0.0081
Treatment
intensity None
Stepwise linear
regression No NS
Family involvement
None Stepwise linear regression
No NS
Dysmorphic
features
+ History of
regressive
symptoms
Physical dysmorphology and history of
regressive symptoms were strongly correlated with outcome (change in EPS scores)
following both 6 months and 12 months of
treatment. These variables accounted for 58% and 67% of the variance in outcome at 6 and
12 months, respectively.
Stepwise linear regression
Yes At 6 mos: r^2=0.5835, p=0.009 At 12 mos: r^2=0.6722, p=0.0001
Other
None; investigated factors included: MRI results, head circumference, history of
seizures, presence of sleep problems, gender,
autism classification (essential or complex), family addiction history, family income
group, use of supplementary dietary
intervention.
Stepwise linear
regression No NS

160
Table 6. (continued)
First author, year
(Ref. No.)
Predictive
variable(s) Observed association Statistical methods
Significant
association Measure of association Comments
Virues-Ortega, 2013
(94)
Intervention duration
Positive impact in the model's fit, but to a
lesser extent than total intervention time in all
eight outcomes.
Multilevel regression
model : One-
predictor model
NR Various goodness-of-fit (AIC, BIC) parameters per outcome measure
A series of multilevel models were
estimated using different sets of predictors in order to select models that
would maximize goodness-of-fit for a
given outcome (change in E-LAP and LAP-D scores) when compared with an
unconditional baseline model (model
with no predictors).
Variables associated with change in
the treated group (intervention time,
age at intervention onset, and pre-
intervention functioning) may not
necessarily reflect actual predictors
of outcome as not all of the observed
change can be attributed to the effect
of behavioural treatment.
Total intervention time
Total intervention time had the highest favorable impact on goodness-of-fit for all E-
LAP and LAP-D outcomes.
Multilevel regression model : One-
predictor model
Yes Various goodness-of-fit (AIC, BIC) parameters per outcome measure
Age
Two-predictor model: Age was the second most efficient predictor (keeping intervention
time as first factor) in terms of improving fit
of the regression models for gross motor function, receptive language, self-care, and
social behavior.
Multilevel regression
model : One-
predictor and two-predictor model
Yes Various goodness-of-fit (AIC, BIC)
parameters per outcome measure
Gender Positive impact in the model's fit
Multilevel regression
model : Two-predictor model
NR Various goodness-of-fit (AIC, BIC)
parameters per outcome measure
Pre-intervention level
Pre-intervention level was the second most
efficient predictor for regression models using fine motor function, prewriting, cognitive, and
expressive language.
Multilevel regression
model : Two-predictor model
Yes Various goodness-of-fit (AIC, BIC) parameters per outcome measure

161
Appendix 6: Risk of Bias in Included Studies
QUALITY ASSESSMENT: Downs & Black (1998) Checklist
Assessment of the methodological quality of included studies was performed by means of
the Downs and Black (1998) checklist for randomized and non-randomized studies of heath
care interventions.(59)
Following the original author’s guidelines, this checklist was adapted specifically to the
field of applied behavioural analysis for autism in a previous meta-analysis conducted by
Virues-Ortega et al. (2010),(60) which served as the basis for evaluating the quality of
studies included in this review.
Items on randomization (items 23 and 24) were considered non-applicable for single group
studies with pre/post design, and overall scores for those studies were prorated accordingly.
In addition, the last item on the checklist (item 27) was simplified to consider whether or
not the study authors had reported a power estimation or provided a sample size
justification.
The following table lists the quality criteria of the Downs and Black checklist, with
modifications specified in italics:

162
Table 7. Criteria of the adapted Downs and Black checklist.
Domain Item Quality Criteria Scoring†
Reporting 1 Is the hypothesis/aim/objective of the study clearly described? A
2 Are the main outcomes to be measured clearly described in the Introduction or Methods section? If the main outcomes are first mentioned in the Results
section, the question should be answered no.
A
3 Are the characteristics of the patients included in the study clearly described? In cohort, within subject studies and trials, inclusion and/or exclusion
criteria should be given. In case-control studies, a case-definition and the source for controls should be given. (Inclusion criteria or at least one other
relevant feature apart from sex and age).
A
4 Are the interventions of interest clearly described? Treatments and placebo/control (where relevant) that are to be compared should be clearly described. A
5 Are the distributions of principal confounders in each group of subjects or treatment condition to be compared clearly described? At least one of the
following are described apart from sex and age: past and concurrent interventions, intervention intensity (hours per week), diagnoses, severity of existing
illness, intellectual quotient at pretest, treatment fidelity indexes, other relevant confounder. If only sex and/or age are described, answer 1.
B
6 Are the main findings of the study clearly described? Simple outcome data should be reported for all major findings so that the reader can check the major
analyses and conclusions (provide means or data from all participants). (This question does not cover statistical tests, which are considered below).
A
7 Does the study provide estimates of the random variability in the data for the main outcomes? In non-normally distributed data the inter-quartile range of
results should be reported. In normally distributed data the standard error, standard deviation or confidence intervals should be reported. If the distribution
of the data is not described, it must be assumed that the estimates used were appropriate and the question should be answered yes.
A
8 Have all important adverse events that may be a consequence of the intervention been reported? This should be answered yes if the study demonstrates
that there was a comprehensive attempt to measure adverse events or at least to prevent them on the basis of specific exclusion and inclusion criteria.
A
9 Have the characteristics of patients lost to follow-up been described? This should be answered yes where there were no losses to follow-up or where
losses to follow-up were so small that findings would be unaffected by their inclusion (-10%). This should be answered ‘no’ where a study does not report
the number of patients lost to follow-up. Question should be answered ‘no’ in retrospective studies.
A
10 Have actual probability values been reported (e.g. 0.035 rather than <0.05) for the main outcomes except where the probability value is less than 0.001? A
External validity 11 Were the subjects asked to participate in the study representative of the entire population from which they were recruited? The study must identify the
source population for patients and describe how the patients were selected. Patients would be representative if they comprised the entire source
population, an unselected sample of consecutive patients, or a random sample. Random sampling is only feasible where a list of all members of the
relevant population exists. Where a study does not report the proportion of the source population from which the patients were selected, the question
should be answered as unable to determine.
C
12 Were those subjects who were prepared to participate representative of the entire population from which they were recruited? The proportion of those
asked who agreed should be stated. Validation that the sample was representative would include demonstrating that the distribution of the main
confounding factors was the same in the study sample and the source population.
C
13 Were the staff, places, and facilities where the patients were treated, representative of the treatment the majority of patients receive? For the question to be
answered yes the study should demonstrate that the intervention was representative of that in use in the source population. The question should be
answered no if, for example, the intervention was undertaken in a specialist centre unrepresentative of the hospitals most of the source population would
attend. For interventions that took place at the participants’ home question should be answered yes.
C
Internal validity
(bias)
14 Was an attempt made to blind study subjects to the intervention they have received? For studies where the patients would have no way of knowing which
intervention they received, this should be answered yes.
C
15 Was an attempt made to blind those measuring the main outcomes of the intervention? In cases were outcome variables were collected through self-
administered questionnaires answer should be answered yes. Question should be answer yes if those measuring the main outcomes were whether blind to
group status or were independent of treatment delivery.
C

163
16 If any of the results of the study were based on “data dredging”, was this made clear? Any analyses that had not been planned at the outset of the study
should be clearly indicated. If no retrospective unplanned subgroup analyses were reported, then answer yes. Question should be answered ‘no’ for
retrospective studies were cases were not admitted consecutively or were selected in anyway. Note: data dredging is the inappropriate (sometimes
deliberately so) search for 'statistically significant' relationships in large quantities of data in spite of previous hypothesis.
C
17 In trials and cohort studies, do the analyses adjust for different lengths of follow-up of patients, or in case-control and within-subjects studies, is the time
period between the intervention and outcome the same for cases and controls? Where follow-up was the same for all study patients the answer should yes.
If different lengths of follow-up were adjusted for by, for example, survival analysis the answer should be yes. Studies where differences in follow-up are
ignored should be answered no.
C
18 Were the statistical tests used to assess the main outcomes appropriate? The statistical techniques used must be appropriate to the data. For example
nonparametric methods should be used for small sample sizes. Where little statistical analysis has been undertaken but where there is no evidence of bias,
the question should be answered yes. If the distribution of the data (normal or not) is not described it must be assumed that the estimates used were
appropriate and the question should be answered yes.
C
19 Was compliance with the intervention/s reliable? Where there was non-compliance with the allocated treatment or where there was contamination of one
group, the question should be answered no. For studies where the effect of any misclassification was likely to bias any association to the null, the question
should be answered yes. In no measure for treatment fidelity assurance were taken, question should be answered no.
C
20 Were the main outcome measures used accurate (valid and reliable)? For studies where the outcome measures are clearly described, the question should
be answered yes (e.g., systematic behavioral observation with inter-rater reliability information). For studies which refer to other work or that
demonstrate the outcome measures are accurate (e.g., validated psychometric tests), the question should be answered as yes.
C
Internal validity
(confounding)
21 Were the patients in different intervention groups (trials and cohort studies) or were the cases and controls (case-control studies), or all participants
within-subjects designs, recruited from the same population? For example, patients for all comparison groups should be selected from the same hospital.
The question should be answered unable to determine for cohort and case control studies where there is no information concerning the source of patients
included in the study.
C
22 Were study subjects in different intervention groups (trials and cohort studies) or were the cases and controls (case-control studies) or participants in
within-subjects studies recruited over the same period of time? For a study which does not specify the time period over which patients were recruited, the
question should be answered as unable to determine.
C
23 Were study subjects randomized to intervention groups? Studies that state that subjects were randomized should be answered yes except where method of
randomization would not ensure random allocation. For example alternate allocation would score no because it is predictable.
C
24 Was the randomized intervention assignment concealed from both patients and health care staff until recruitment was complete and irrevocable? All non-
randomized controlled studies should be answered no. If assignment was concealed from patients but not from staff, it should be answered no.
C
25 Was there adequate adjustment for confounding in the analyses from which the main findings were drawn? This question should be answered no for trials
if: the main conclusions of the study were based on analyses of treatment rather than intention to treat; the distribution of known confounders in the
different treatment groups was not described; or the distribution of known confounders differed between the treatment groups but was not taken into
account in the analyses. In nonrandomized studies if the effect of the main confounders was not investigated or confounding was demonstrated but no
adjustment was made in the final analyses the question should be answered as no.
C
26 Were losses of patients to follow-up taken into account? If the numbers of patients lost to follow-up are not reported, the question should be answered as
unable to determine. If the proportion lost to follow-up was too small to affect the main findings, the question should be answered yes. (<10%). For
retrospective studies question should be answered ‘no.’
C
Power 27 Was a power estimation performed and reported with sufficient numbers recruited? A
†Scoring instructions: A: Yes (1 point), No (0 points); B: Yes (2 points), Partially (1 point), No (0 points); C: Yes (1 point), Unable to determine (0 points), No (0 points)

164
Table 8. Quality assessment of included studies according to Downs and Black checklist (results by item).
Reporting External validity
Internal validity
bias
Internal validity
confounding Power
First author, year (Ref.) 1 2 3 4 5 6 7 8 9 10 11 12 13 14† 15 16 17 18 19 20 21 22 23† 24† 25 26 27
Ben-Itzchak, 2007 (84) 1 1 1 1 2 1 1 0 1 1 0 0 0 0 1 0 1 1 0 1 0 0 – – 0 1 0
Ben-Itzchak, 2009 (85) 0 1 0 0 0 1 1 0 1 0 0 0 0 0 0 0 1 1 0 1 1 0 – – 0 0 0
Ben-Itzchak, 2014 (86) 1 1 1 1 2 1 1 0 0 1 0 0 0 0 1 0 1 1 1 1 0 0 – – 0 0 0
Blacklock, 2014 (82) 1 1 1 1 2 1 1 0 0 1 0 0 1 0 0 0 0 1 0 1 1 0 – – 0 0 0
Cohen, 2006 (69) 1 1 1 1 2 1 1 0 1 1 0 0 1 0 1 1 1 1 1 1 0 0 0 0 1 1 0
Eikeseth, 2002, 2007 (92,93) 1 1 1 1 2 1 1 0 1 0 0 0 1 0 1 1 1 1 1 1 1 1 0 0 1 1 0
Eikeseth, 2009 (89) 1 1 1 1 1 1 1 0 1 0 0 0 1 0 1 0 1 1 1 1 0 0 – – 0 1 0
Flanagan, 2012 (79) 1 1 1 1 2 1 1 0 0 1 1 1 1 0 0 1 1 1 0 1 1 1 0 0 1 0 0
Freeman, 2010 (80) 1 1 1 1 2 1 1 0 0 1 1 0 1 0 0 1 0 1 0 1 1 0 – – 0 0 0
Granpeesheh, 2009 (70) 1 1 1 1 2 0 0 0 0 0 0 0 0 0 0 0 0 1 0 0 0 0 – – 0 0 0
Harris, 2000 (71) 1 1 1 1 2 1 0 0 1 0 0 0 1 0 1 1 0 1 0 1 1 1 – – 0 1 0
Hayward, 2009 (90) 1 1 1 1 1 1 1 0 1 0 0 0 1 0 1 0 1 1 1 1 0 0 – – 0 1 0
Howard, 2005, 2014 (72,73) 1 1 1 1 2 1 1 0 0 0 0 0 0 0 1 1 1 1 1 1 0 1 0 0 1 1 0
Perry, 2008, 2011 (78,81) 1 1 1 1 2 1 1 0 0 1 1 1 1 0 0 0 1 1 0 1 1 1 – – 1 0 0

165
Table 8. (continued)
Reporting External validity
Internal validity
bias
Internal validity
confounding Power
First author, year (Ref.) 1 2 3 4 5 6 7 8 9 10 11 12 13 14† 15 16 17 18 19 20 21 22 23† 24† 25 26 27
Perry, 2013a (83) 1 1 1 1 2 1 1 0 0 1 0 0 1 0 0 0 1 1 0 1 1 0 – – 1 0 0
Perry, 2013b (83) 1 1 1 1 2 1 1 0 0 1 0 0 1 0 0 0 1 1 0 1 1 0 – – 1 0 0
Remington, 2007 (91) 1 1 1 1 2 1 1 0 0 1 0 0 1 0 1 1 1 1 0 1 0 0 0 0 1 0 0
Sallows, 2005 (74) 1 1 1 1 2 1 1 0 1 0 1 1 1 0 0 1 1 1 1 1 1 1 – – 1 1 0
Smith, 2000 (75) 1 1 1 1 2 1 1 0 1 0 0 0 1 0 1 0 0 1 1 1 1 1 1 0 1 1 0
Stoelb, 2004 (76) 1 1 1 1 2 1 0 0 0 1 0 0 0 0 0 1 1 1 1 1 1 0 – – 1 0 0
Virues-Ortega, 2013 (94) 1 1 1 1 2 0 0 0 0 0 1 0 1 0 1 1 1 1 0 1 1 1 – – 1 0 1
Weiss, 1999 (77) 1 1 0 1 1 1 0 0 0 1 0 0 1 0 0 1 0 1 0 1 1 0 – – 0 0 0
Zachor, 2007 (87) 1 1 1 1 2 1 1 0 0 0 0 0 0 0 0 1 1 1 0 1 0 0 0 0 0 0 0
Zachor, 2010 (88) 1 1 1 1 2 1 1 0 0 0 0 0 0 0 1 1 1 1 1 1 0 0 0 0 1 0 0
% of maximum score 96 100 92 96 90 92 79 0 38 50 21 13 67 0 50 54 75 100 42 96 58 33 4 0 54 38 4
Note: 0 or 1 point for all items, except item 5 (02 points). †Items 23 and 24 were only applicable to controlled comparison studies.

166
Table 9. Quality assessment of included studies according to the Downs and Black checklist
(results by domain).
First author, year (Ref.)
Reporting
/11 (/1.0)
External
Validity
/3 (/1.0)
Bias
/7 (/1.0)
Confounding
/6 (/1.0)
Power
/1 (/1.0)
Total
/28 (/5.0)
Ben-Itzchak, 2007 (84) 10 (0.9) 0 (0.0) 4 (0.6) 1 (0.3) 0 (0.0) 15 (1.7)
Ben-Itzchak, 2009 (85) 4 (0.4) 0 (0.0) 3 (0.4) 1 (0.3) 0 (0.0) 8 (1.0)
Ben-Itzchak, 2014 (86) 9 (0.8) 0 (0.0) 5 (0.7) 0 (0.0) 0 (0.0) 14 (1.5)
Blacklock, 2014 (82) 9 (0.8) 1 (0.3) 2 (0.3) 1 (0.3) 0 (0.0) 13 (1.7)
Cohen, 2006 (69) 10 (0.9) 1 (0.3) 6 (0.9) 2 (0.3) 0 (0.0) 19 (2.4)
Eikeseth, 2002, 2007 (92,93) 9 (0.8) 1 (0.3) 6 (0.9) 4 (0.7) 0 (0.0) 20 (2.7)
Eikeseth, 2009 (89) 8 (0.7) 1 (0.3) 5 (0.7) 1 (0.3) 0 (0.0) 15 (2.0)
Flanagan, 2012 (79) 9 (0.8) 3 (1.0) 4 (0.6) 3 (0.5) 0 (0.0) 19 (2.9)
Freeman, 2010 (80) 9 (0.8) 2 (0.7) 3 (0.4) 1 (0.3) 0 (0.0) 15 (2.2)
Granpeesheh, 2009 (70) 6 (0.5) 0 (0.0) 1 (0.1) 0 (0.0) 0 (0.0) 7 (0.7)
Harris, 2000 (71) 8 (0.7) 1 (0.3) 4 (0.6) 3 (0.8) 0 (0.0) 16 (2.4)
Hayward, 2009 (90) 8 (0.7) 1 (0.3) 5 (0.7) 1 (0.3) 0 (0.0) 15 (2.0)
Howard, 2005, 2014 (72,73) 8 (0.7) 0 (0.0) 6 (0.9) 3 (0.5) 0 (0.0) 17 (2.1)
Perry, 2008, 2011 (78,81) 9 (0.8) 3 (1.0) 3 (0.4) 3 (0.8) 0 (0.0) 18 (3.0)
Perry, 2013a (83) 9 (0.8) 1 (0.3) 3 (0.4) 2 (0.5) 0 (0.0) 15 (2.1)
Perry, 2013b (83) 9 (0.8) 1 (0.3) 3 (0.4) 2 (0.5) 0 (0.0) 15 (2.1)
Remington, 2007 (91) 9 (0.8) 1 (0.3) 5 (0.7) 1 (0.2) 0 (0.0) 16 (2.0)
Sallows, 2005 (74) 9 (0.8) 3 (1.0) 5 (0.7) 4 (1.0) 0 (0.0) 21 (3.5)
Smith, 2000 (75) 9 (0.8) 1 (0.3) 4 (0.6) 5 (0.8) 0 (0.0) 19 (2.6)
Stoelb, 2004 (76) 8 (0.7) 0 (0.0) 5 (0.7) 2 (0.5) 0 (0.0) 15 (1.9)
Virues-Ortega, 2013 (94) 6 (0.5) 2 (0.7) 5 (0.7) 3 (0.8) 1 (1.0) 17 (3.7)
Weiss, 1999 (77) 6 (0.5) 1 (0.3) 3 (0.4) 1 (0.3) 0 (0.0) 11 (1.6)
Zachor, 2007 (87) 8 (0.7) 0 (0.0) 4 (0.6) 0 (0.0) 0 (0.0) 12 (1.3)
Zachor, 2010 (88) 8 (0.7) 0 (0.0) 6 (0.9) 1 (0.2) 0 (0.0) 15 (1.8)
Note: Score and proportion of the maximum achievable score by domain. Total expressed in raw scores
and proportion of maximum achievable score across all domains.

167
Appendix 7: Data and Analysis
Primary analysis: IQ
Figure 7. Funnel plot of comparison: IBI vs TAU, outcome: 1.1 IQ

168
Subgroup analyses: IQ
Figure 8. Forest plot of comparison: IBI vs TAU, outcome: 1.1 IQ, subgroup: Intake Age
Figure 9. Forest plot of comparison: IBI vs TAU, outcome: 1.1 IQ, subgroup: Intake IQ

169
Figure 10. Forest plot of comparison: IBI vs TAU, outcome: 1.1 IQ, subgroup: Treatment model
Figure 11. Forest plot of comparison: IBI vs TAU, outcome: 1.1 IQ, subgroup: Study design

170
Primary analysis: VABS Adaptive Behaviour Composite
Figure 12. Funnel plot of comparison: IBI vs TAU, outcome: 1.2 VABS Composite

171
Subgroup analyses: VABS Adaptive Behaviour Composite
Figure 13. Forest plot of comparison: IBI vs TAU, outcome: 1.2 VABS Composite, subgroup:
Intake Age
Figure 14. Forest plot of comparison: IBI vs TAU, outcome: 1.2 VABS Composite, subgroup:
Intake IQ

172
Figure 15. Forest plot of comparison: IBI vs TAU, outcome: 1.2 VABS Composite, subgroup:
Treatment model
Figure 16. Forest plot of comparison: IBI vs TAU, outcome: 1.2 VABS Composite, subgroup:
Study design