Embed Size (px)
Citation preview
Conference Report Published by
The CareFusion Center for Safety and Clinical Excellence
www.cardinalhealth.com/clinicalcenter
Intensive Insulin Therapy forTight Glycemic Control
Proceedings from
The Seventh Conference
The CareFusion Center for Safety and Clinical Excellence
June 7-8, 2007, San Diego, CA
Philip J. Schneider, MS, FASHP, Editor
Research
Therapy
Monitoring
Nursing
International Conference on
Intensive Insulin Therapy
for Tight Glycemic Control
The seventh invitational conference at the CareFusion Center for Safety and Clinical
Excellence in San Diego, held June 7-8, 2007, brought together a distinguished faculty
from clinical practice, academia, and organizations. Judith Jacobi, PharmD, FCCM, FCCP,
BCPS, Critical Care Pharmacist, Methodist Hospital/Clarian Health, Indianapolis, IN and
Timothy S. Bailey, MD, FACE, CPI, Advanced Metabolic Care and Research, Escondido,
CA chaired the conference. Internationally recognized experts on research, current
issues and opportunities in the use of intensive insulin therapy for tight glycemic
control (TGC IIT) presented.
This conference report summarizes the information presented on TGC IIT with regard
to research findings, safety concerns, emerging practices, monitoring, and nursing
issues as researchers and clinicians seek to optimize insulin therapy to help maintain
normoglycemia in critically ill patients. The proceedings were edited by Philip J.
Schneider, MS, FASHP, Clinical Professor and Director, Latiolais Leadership Program,
College of Pharmacy, The Ohio State University, Columbus, OH.
Executive Summary Conference Report 1
7th Invited Conference: Intensive Insulin Therapy for Tight Glycemic Control
Content
Introduction
p3 Tight Glycemic Control: Judith Jacobi, PharmD, FCCM, FCCP, BCPS An Overview Methodist Hospital/Clarian Health, Indianapolis, IN
Timothy S. Bailey, MD, FACE, CPI Advanced Metabolic Care and Research Escondido, CA
Research
p4 A Brief History of Tight Glycemic Control: Tony Furnary, MD What We Know in 2007; and How We Got Here Starr-Wood Cardiac Group, Portland, OR
p10 Intensive Insulin Therapy and the Simon Finfer, MBBS NICE-SUGAR Study Royal North Shore Hospital of Sydney, Australia
p13 European Multi-center Trials with Tight Glucose Philippe Devos, MD Control by Intensive Insulin Therapy The George Institute of Liege, Belgium
p17 Implementation of Tight Glycemic Control James Krinsley, MD at Stamford Hospital Stamford Hospital, Stamford, CT
p21 Meta-analysis of Randomized Trials Anastassios G. Pittas, MD, MS of Tight Glycemic Control Tufts/New England Medical Center, Boston, MA
p23 Perioperative Glucose Management Richard Prielipp, MD and IIT in The Operating Room University of Minnesota, Minneapolis, MN
Douglas Coursin, MD Univertisty of Wisconsin, Madison,WI
p26 Economic Advantages of Judi Jacobi, PharmD Tight Glycemic Control Methodist Hospital/Clarian Health, Indianapolis, IN
Therapy
p29 Intensive Insulin Therapy in the Robert Osburne, MD Intensive Care Unit Atlanta Medical Center, Atlanta, GA
p33 Use of Computerized Algorithm in Patients Bruce Bode, MD Undergoing Cardiovascular Surgery: Atlanta Diabetes Associates, Atlanta, GA A Protocol for Tight Glycemic Control
p36 Computerized Management of Pat Burgess, MD, PhD Tight Glycemic Control Carolinas Medical Center, Charlotte, NC
p39 Analysis of Variation in Guy Soo Hoo, MD Insulin Protocols VA Hospital, Los Angeles, CA
p43 Improving ICU Quality and Safety: Sean Berenholtz, MD Implications for Tight Glycemic Control Johns Hopkins, Baltimore, MD
p47 Specialized Nutrition Support Kalman Holdy, MD and Glycemic Control Sharp Healthcare, San Diego, CA
2 Executive Summary Conference Report
7th Invited Conference: Intensive Insulin Therapy for Tight Glycemic Control
p50 Examining Medication Errors John Santell, MS Associated with Intravenous Insulin US Pharmacopeia, Washington, DC
p53 The Portland-Vancouver Regional Chris Hogness, MD, MPH Inpatient Glycemic Control Collaborative Southwest Washington Medical Center Vancouver, WA
p56 Building Transitions from the ICU to the Ward Greg Maynard, MD for the Hyperglycemic Patient: UCSD, San Diego, CA One Piece of the Puzzle
Monitoring
p59 Glucose Control and (Continuous) Christophe De Block, MD Glucose Monitoring in Critical Illness Antwerp University Hospital, Belgium
p62 Glucose Sensor Technology: Timothy Bailey, MD Current State and Future Trends Advanced Metabolic Care and Research Escondido, CA
p64 Assessing the Accuracy and Confounding Nam Tran, PhD (Candidate) Factors in Critical Care Glucose Monitoring UC Davis, Davis, CA
p68 Glucose Sensor Augmented Insulin Delivery Jeffrey Joseph, DO in the Hospital: Open and Closed-Loop Methods T. Jefferson University, Philadelphia, PA
Nursing
p73 The Impact of Intensive Insulin Therapy Daleen Aragon, PhD, CCRN, FCCM on Nursing Orlando Regional, Orlando, FL
p76 Nursing Education and Intensive Insulin Therapy Carol Manchester, MSN, APRN, BC-ADM, CDE University of Minnesota, Minneapolis, MN
p79 Applying Glucometrics to Tight Jacqueline Thompson, MAS,RN,CDE Glycemic Control Sharp Healthcare, San Diego, CA
Roundtable
p81 Impact on Hospital Costs
p81 Reasonable Target
p82 Factors that Complicate Glycemic Control
p82 Administrative Aspects of IIT
p83 Risk of Hypoglycemia
p84 Blood Glucose Measurement
Appendix
p85 Table. Major Published Randomized Controlled Anastassios G. Pittas, MD, MS Trials with Insulin Therapy in Critically Ill Patients Tufts/New England Medical Center, Boston, MA
Executive Summary Conference Report 3
7th Invited Conference: Tight Glycemic Control : An Overview
INTRODUCTION
Tight Glycemic Control: An OverviewJudith Jacobi, PharmD, FCCM, FCCP, BCPS, Critical Care Pharmacist, Methodist Hospital/Clarian Health, Indianapolis, IN;
Timothy S. Bailey, MD, FACE, CPI, Advanced Metabolic Care and Research, Escondido, CA
More than five years ago the publication
of a landmark trial of intensive insulin therapy
(IIT) that demonstrated a reduction in surgi-
cal critical care mortality led clinicians to seek
to evaluate and improve glycemic control in
their practice. Many protocols were devel-
oped and implemented in critical care units
with varying degrees of effectiveness. The
first protocols were paper-based and varied
greatly in complexity. Computer support is
now being developed to make intravenous
(IV) insulin (considered a high-risk drug) safer
and easier to use.
The benefits of insulin and glucose con-
trol were not surprising to endocrinologists
or cardiovascular surgeons. Early reports
showed that the use of insulin infusions to
improve glucose control was associated with
prevention of deep sternal wound infections
and lower mortality. Subsequent studies have
added evidence to support the use of IIT
to reduce morbidity and mortality in criti-
cally ill patients, including a subset of medi-
cal patients who remain in the intensive care
unit (ICU) more than three days. Clinicians
still struggle to provide IIT to achieve
near-euglycemia without causing hypogly-
cemia.
There is significant workload associated
with frequent glucose monitoring. Point-of-
care (POC) testing is a component of nurse-
titrated protocols. Current POC methodolo-
gies are less precise and more expensive
than standard central laboratory methods.
Potential errors arise from faulty operator
technique, inadequate sample volume and
artifacts due to the altered physiology in ICU
patients (e.g., hypoxia or low hematocrit).
Subcutaneous continuous glucose monitor-
ing technology is only approved for use in
outpatients. Research with glucose sensors
that may be used in critically ill patients is
ongoing.
Although single-center clinical trials have
suggested a benefit to lowering glucose to
80-110 mg/dL, a recent multi-center trial was
stopped well before the target enrollment
because of safety concerns. A large, multi-
center trial (NICE-SUGAR) is underway by the
Australia-New Zealand Critical Care Clinical
Trials group with results expected in 2008.
Without more large, prospective trials, ques-
tions will remain about the optimal (both safe
and effective) glucose endpoint.
With regard to the future it is clear that
no matter what research will reveal, clinicians
will no longer ignore blood glucose values
as a mere epiphenomenon of critical illness.
Glycemic control is essential, although the
optimal target remains a topic of discussion.
The IIT process will need to be computer-
ized to provide the most consistent ability
to follow complex dosing algorithms, and
glucose monitoring will need to be far more
automated. Closed-loop insulin titration and
continuous monitoring would be most desir-
able.
The CareFusion Center for Safety and
Clinical Excellence hosted an international
conference that brought together some
of the world’s leaders in glycemic control
research, therapy and monitoring to discuss
the latest findings in this area. Summaries of
their presentations and the spirited roundta-
ble discussion that concluded the conference
are compiled in this monograph.
We hope that our readers will recognize
the value of this information and experi-
ence with IIT and that future systems can be
designed to achieve optimal safety and effi-
cacy. We wish to express our sincere thanks
to CareFusion for their commitment to medi-
cation safety and their sponsorship of this
program.
4 Executive Summary Conference Report
7th Invited Conference: A Brief History of Tight Glycemic Control:
What We Know in 2007; and How We Got Here
Key points
• Elevatedaveragethree-daypostoperativebloodglucose(3BG)isariskfactorformorbidity
andmortalityinhospitalizedpatientswithdiabetes.
• Continuousinsulininfusionsthatcontrol3BGtonear-euglycemiclevelsnormalizethe
diabeticpatientoutcomestonon-diabeticlevels.
• Incardiacsurgerypatientstargetglucoselevelanddurationofintravenous(IV)insulin
therapyarebothkeyelementsofeffectivetightglycemiccontrol(TGC).Simplystated,the
“3”isjustasimportantasthe“BG.”
• TheeffectivenessofTGChasbeenprovenin:
− Diabetescardiacsurgerypatientsintheintensivecareunit(ICU),
− Non-ICUdiabetescardiacsurgerypatientsthroughthreepostoperativedays,
− MedicalpatientswhoresideintheICUlongerthanthreedays.
• Glucose-insulin-potassium(GIK)therapyisnotequivalenttocontinuousinsulininfusions.
• IntensiveglucosecontrolintheICUwithcontinuousinsulininfusionsfollowedby
subcutaneouscontrolonthewardshavenotproducedequivalentresultstothreedays
ofIVinsulininfusions.
PROCEEDINGS
A Brief History of Tight Glycemic Control: What We Know in 2007, and How We Got Here
Tony Furnary, MD, Starr-Wood Cardiac Group, Portland, OR
This brief history reviews the major stud-
ies of tight glycemic control (TGC) from 1992
to 2007. These five major studies combined
have evaluated the effects of TGC on more
than 31,000 patients. The studies consid-
ered here in chronological order include
the Portland Diabetes Project1-6 on cardiac
surgery patients with diabetes, the Diabetes
Mellitus, Insulin Glucose Infusion in Acute
Myocardial Infarction (DIGAMI) Study-17, the
Leuven studies by Van den Berghe, et al. in
the surgical intensive care unit (SICU)8 and
medical ICU (MICU)9, the Stamford ICU studies
by Krinsley10,11, the CREATE-ECLA12 multicenter
study and the multicenter DIGAMI-2 study13.
Portland Diabetic Project
Effects of hyperglycemia on cardiac sur-
gery patients. The Portland Diabetic Project
was started in 1992 as a prospective, nonran-
domized interventional study to evaluate the
effects of hyperglycemia and its reduction
with continuous intravenous (IV) insulin infu-
sions on morbidity and mortality in cardiac
surgery patients. Between 1987 and end of
2005, 5,534 patients had been enrolled in this
ongoing study. This number included approx-
imately 4,500 coronary bypass, 470 valve, 570
valve coronary artery bypass graft (CABG) and
60 additional patients who had other cardiac
surgical procedures. Pre-admission (out-
patient) glycemic control strategies in this
patient population included subcutaneous
(SQ) insulin therapy in 31% and only oral
hyperglycemic agents in 52%, while 12% were
managed with diet control alone, and five
percent were undiagnosed and not previously
treated at the time of admission for cardiac
surgery.
One thousand of the 5,534 patients with
diabetes were treated using our first protocol,
which was a very intensive SQ insulin proto-
col, administering SQ doses of regular insulin
every four hours. The other 4,500 patients were
managed using some version of the “Portland
Protocol.” In this protocol blood glucose was
assessed for every patient every 30 minutes
to two hours throughout their hospital stay.
In the ICU glucose was measured using blood
from an arterial or venous line, and in non-ICU
general nursing units, with blood obtained
using capillary fingerstick. If an ICU patient’s
blood glucose was very high or very low, it
was monitored every 30 minutes, and in the
operating room, every 20 to 30 minutes. For
purposes of data analysis the glycemic state
of each patient was described by a single
number, the average three-day postoperative
blood glucose (3BG) i.e., the average of all glu-
cose measurements on the day of surgery and
first and second postoperative days, derived
from 24 to 72 glucose measurements made
per protocol during that period of time.
The Portland Protocol blood glucose tar-
get range became progressively lower over
time as our goal was to ultimately achieve
Executive Summary Conference Report 5
7th Invited Conference: A Brief History of Tight Glycemic Control:
What We Know in 2007; and How We Got Here
euglycemia in all patients. Between 1987 and
1991 treatment was started with SQ insulin
with a target blood glucose of < 200 mg/dL. In
1992 we were the first to implement intensive
glycemic control using continuous insulin
infusions. Our institutional review board (IRB)
required proof that intensive glycemic con-
trol would not lead to hypoglycemia-related
fatalities, so we began the IV insulin phase
of the project with a target range of 150-200
mg/dL and limited this therapy to the ICU.
In 1995 after analyzing the initial data we
realized that to truly cause change, we had
to implement intensive glycemic control not
only in the ICU but also in the operating room
and in non-critical care patient care areas. The
3BG concept began when we realized that
the second major factor in TGC is not where a
patient is being treated in the hospital (e.g., in
the ICU or in a general nursing unit) rather, it
is the length of time (the duration of glycemic
control since a patient’s acute event) that truly
matters. In 1995 we began using continuous
insulin infusions on the non-ICU telemetry
floor and maintained a target of 150–200 mg/
dL. In 1999 we lowered the target range to
125-175 mg/dL; in 2001, to 100-150 mg/dL; in
2004, to 80-120 mg/dL; and in 2005, to 70-110
mg/dL. In 2005 the 3BG, which includes the
initial phase of induction through transition
to a general nursing unit, for all our patients
was 121 mg/dL. We had essentially eliminated
hyperglycemia from our patient population.
Early results. We first reported on the rela-
tionship between hyperglycemia and cardiac
surgery outcomes in a presentation to the
annual meeting of the Society of Thoracic
Surgeons in 19956. Whether the data were
analyzed with a single cutoff of > 175 mg/
dL or by 50 mg/dL-increments, our results
showed that the postoperative level of blood
glucose, as measured by 3BG, has an inde-
pendent effect on the incidence of deep
sternal wound infection. Multivariate analysis
showed that the deep sternal wound infec-
tion rate approximately doubles with every
50 mg/dL increase in blood glucose above
175 mg/dL3. These findings were presented
in 1995 and published in 1997. It took two
years to get these data published, because
the findings were so different from the tra-
ditional concept of “benign hyperglyemia"
that reviewers were reluctant to believe the
results.
Investigating further, we evaluated the
effect of the individual (daily) components
of 3BG on infection rates. We found that with
three days of TGC, preoperative hemoglobin
A1c has no bearing on infection. However,
preoperative blood glucose > 180 mg/dL
does have a significant effect. Blood glucose
on the day of surgery has no bearing on
infection, but blood glucose > 180 mg/dL on
the first, second and third postoperative days
all have an independent effect on infection
rates14.
We also found a highly significant differ-
ence between patients whose glucose levels
were inadequately controlled or only partially
controlled with SQ insulin compared to those
who were managed using continuous insulin
infusions. In the later group, the infection rate
decreased to 0.7% as compared to a rate of
2% in the SQ group (p<0.001)1. Interestingly,
at that time, in the mid 1990s, the diabetic
cardiac surgery patient population world-
wide had an overall incidence of deep sternal
infection of 5.6%. So our infection rate of 2%,
even in the subcutaneously treated popula-
tion was very low compared to that reported
in the world literature at the time. This dem-
onstrated the significant effects of targeted
glycemic control even with SQ insulin therapy
when compared to the previous standard of
care14.
The results obtained with continuous IV
insulin therapy were better still. Multivariate
analysis showed that continuous insulin infu-
sions independently reduced the risk of infec-
tion by 63%. The independent effect of IV
insulin on deep sternal infection rates was
published in 19991. Not since the discovery
and subsequent clinical introduction of peni-
cillin in the 1930s and early ‘40s, respectively,
has there been a non-surgical intervention
that has so dramatically altered surgical-site
infection rates.
Based on these studies we concluded that
diabetes itself was not a risk factor for infec-
tion. Rather it was the presence of hypergly-
cemia in the diabetes population that is the
true risk factor for infection. Furthermore,
this risk can be reduced by 63% through the
use of three postoperative days of TGC with
continuous insulin infusions.
Acute mortality. In 1999 we presented
data at the American Heart Association that
compared 3BG levels to mortality in the coro-
nary bypass (CABG) population2. For CABG
patients, when the 3BG was > 200 mg/dL,
the mortality was 6% and when the 3BG
was < 200 mg/dL, the mortality was only
1.5%. Multivariate analysis showed that 3BG
is a highly significant independently predic-
tive variable for mortality. The mortality rate
increases by two–fold for every 50 mg/dL
increase in 3BG.
At a time when it was commonly thought
that there was nothing wrong with hypergly-
cemia in the postoperative patient, we estab-
lished hyperglycemia as an independent risk
factor for mortality in CABG patients. Again,
independent analysis of the various compo-
nents of 3BG showed that hemoglobin A1c is
not predictive of mortality, nor is preoperative
glucose, but elevated glucose is a significant
independent risk for death. Blood glucose
levels on the first and second postoperative
days, and, for patients who remain in the ICU,
the third day are also significant predictors of
in-hospital death.
Thus, the duration of hyperglycemia and,
conversely the duration of tight glucose man-
agement is an important determinant of out-
comes related to hyperglycemia in cardiac
6 Executive Summary Conference Report
surgery patients. Thus, the second critical
factor in TGC management (the first being
target blood glucose level) is not location
of the patient ( ICU or the operating room
or non-ICU floor); rather, it is the duration of
TGC therapy. It is the critical three-day peri-
od immediately following the seminal ICU
admission event during which hyperglycemia
significantly affects outcomes. For patients
who remain in critical condition, it continues
to affect outcomes for as long as the patient
remains in the ICU.
SQ vs. continuous insulin infusion. We
have shown that continuous insulin infu-
sions reduce absolute unadjusted mortality
rates by more than 50% in CABG patients
who also have diabetes. Multivariate analy-
sis shows that the risk-adjusted indepen-
dent effect of continuous insulin infusions is
to reduce mortality by 65%.
Our annualized mortality rates show that
after continuous insulin infusions were used
in the patients with diabetes, by 1995 the
risk of death was normalized to that of
patients without diabetes. As the average
protocol target and actual glucose levels
were lowered, results continued to improve.
Between 2000 and 2006 the overall mortal-
ity for patients with diabetes in our hospital
was 0.9%, compared to the national repost-
ed Society of Thoracic Surgeons mortality
rate of 3.4% in CABG patients with diabe-
tes15,16.
Complications. Publication of our results
showed that increasing 3BG is associated
with an increasing number of complications,
including death, transfusion, new-onset
atrial fibrillation and deep sternal wound
infection. Low-cardiac-output syndrome
and length of stay also increase over time.
We did not see a relationship between 3BG
and pneumonia, stroke, and other complica-
tions17.
Non-diabetes patients. In 2007 we began
looking at the non-diabetes CABG patient
population. Although we have applied our
Portland Protocols to our non-diabetes
patients with stress hyperglycemia since
1998, we have not seen any reduction in mor-
tality in this population of patients. We are
now hoping to randomize our non-diabetes
patient population with stress hyperglycemia
to TGC and non-TGC groups. However, based
on our preliminary data, TGC may not make
a difference in the non-diabetes cardiac sur-
gery population.
DIGAMI-1
Diabetes and acute myocardial infarction
(AMI). While we were publishing our findings
from 1995 through 1998, others were work-
ing on this problem, including the effect of
the management of diabetes on AMI mor-
tality. Most studies had shown that in every
era of cardiac intervention – from the 1960s
through the present – patients with diabe-
teshad a two-fold higher mortality for AMI
compared to those without diabetes18.
When thrombolysis became part of car-
diac care between the mid-1980s and 2000,
overall mortality decreased, yet diabetes
still had a higher mortality for AMI. Since
2000, patients with diabetes who have a AMI
still have a two-times-higher incidence of
mortality than the total patient population.
Therefore, diabetes seems to be a risk factor
for death following AMI.
Even in patients without diabetes there
is a relationship between severe hyperglyce-
mia and mortality. Pooled meta-analysis data
show that the pooled risk factor is about 2.8
to 5.8 or about a four-fold increase in risk.
Hyperglycemia is also a risk factor for myocar-
dial infarction.
The DIGAMI-1 study7 reported by Klas
Malmberg in 1995 evaluated patients who
had an AMI and blood glucose concentra-
tions greater than 200 mg/dL. Intensive insu-
lin treatment used in the ICU included IV
insulin for more than 24 hours, then four SQ
injections a day for the next three months.
Mortality was reduced by 20% during the
three to four years patients were evaluated.
In-hospital mortality was not reduced but
long-term survival improved. Lower glucose
upon admission was associated with lower
in-hospital mortality. Although this associa-
tion was not significant, there was a trend
towards a lower mortality in the group with
lower glucose.
The patients in the insulin-treated group
also had better long-term survival. These
patients were tightly controlled, versus the
control group that was not tightly controlled.
For patients who were initially not on insulin
therapy at the time of admission for AMI and
who were then placed on insulin and very
tightly controlled, the survival advantage was
even greater over the next few years. Those
findings were published in 1997.
DIGAMI-2
Glucose, insulin and potassium (GIK). The
randomized DIGAMI-2 study by Malmberg,
Lars Ryden, et al. in 200513 included 48
hospitals in six countries and 1,200 patients
who were assigned to three treatment arms.
Group One received a solution of GIK for 24
hours followed by home insulin therapy.
Group Two was given GIK infusion followed
by standard glucose control. Group Three
had routine metabolic management. No
statistical differences were found between
these three groups in terms of outcomes.
There were no differences among the major
etiologic factor, glucose and the major pri-
mary outcome, mortality. Glucose control
in all three groups was exactly the same
over time and therefore did not produce a
separation of the outcomes curve. However,
a multivariate analysis of mortality in the
DIGAMI-2 shows three very significant risk
factors for long-term death. Increased age,
serum creatinine, heart failure and higher
7th Invited Conference: A Brief History of Tight Glycemic Control:
What We Know in 2007; and How We Got Here
Executive Summary Conference Report 7
7th Invited Conference: A Brief History of Tight Glycemic Control:
What We Know in 2007; and How We Got Here
fasting blood glucose concentrations all neg-
atively affected survival.
In the CREATE-ECLA trial12 cardiologists
at 470 centers around the world evaluated
patients with elevated-S-T myocardial infarc-
tion. The goal was to evaluate whether use
of the GIK protocol reduced 30-day mortality
and other measures in AMI patients. Results
showed no difference in the primary end-
point of mortality. The blood glucose levels in
the control (non-GIK) group were lower than
the blood glucose levels in the GIK group, so
that any advantage that insulin might have
conferred was taken away by the disadvan-
tage of increased glucose levels. The study
showed no reduction in mortality because
the study design did not create a separation
in the primary variable hypothesized to affect
mortality, i.e., blood glucose levels.
However, if these data are divided into
glucose terciles, mortality increased with
increasing glucose levels. Patients in the low-
est third of glucose levels had the lowest
mortality rate. In the middle third mortality
was higher, and in the highest third there was
significantly higher mortality. Even though
this study is considered a negative study, it
shows a relationship between hyperglycemia
and mortality.
From these studies on AMI one can con-
clude that GIK is not effective in altering
outcomes. Over the past 40 years multiple
studies utilizing GIK have been carried out
to investigate its efficacy in reducing mortal-
ity. Not one of these studies has produced a
significant positive result. Outcome improve-
ment has only been associated with the use
of insulin therapy to achieve glucose control.
The Leuven studies / Van den Berghe
Intensive insulin therapy (IIT) in cardiac
surgery patients–prospective, randomized
trial. In 2001 Van den Berghe8 published a
landmark trial of 1,500 patients that showed
results similar to the early results from the
Portland Diabetic Project. In this prospective,
randomized study patients were assigned
to an IIT (target glucose < 110 mg/dL) or a
non-IIT group (180-200 mg/dL). It is impor-
tant to note that 60% of enrollees were
postoperative cardiac surgery patients. IIT
was associated with a 34% reduction in
mortality, a 46% reduction in infection, a
41% reduction in dialysis, a 50% reduction
in transfusions and a marked reduction in
peripheral nerve polyneuropathy.
The majority of the reduction in mortality
occurred in patients who were in the ICU and
kept on insulin infusion for five days or longer.
In the study hospital, insulin infusions are not
used in general nursing care areas. If patients
were transferred out of the ICU after the first
or second day, they only had one or two days
of TGC and then the glucose concentrations
increased. A reduction in mortality was not
seen in this subset of patients. Therefore, in
Van den Berghe’s first surgical study, there is
confirmation of the duration component of
continuous insulin infusions or ITT therapy
previously described by the Portland series.
A follow-up study from Leuven showed that
the survival benefit achieved in the hospital
is maintained up to three or four years after
surgery.
Medical ICU. In 2006 in a population of
1,200 MICU patients, Van den Berghe exam-
ined in-hospital mortality between groups
randomized to TGC (80 –110 mg/dL) or less
intensive glycemic control (< 180 mg/dL).
They found a significant effect of ITT on mor-
tality for patients who remained in the ICU
three days or longer. For those who were in
the MICU for less than three days there was
no apparent effect of ITT on mortality. In
patients in the ICU for three days or longer,
the mortality risk reduction was about 18%,
which was highly significant.
Stamford / Krinsley
Hyperglycemia in medical/surgical ICU
patients–retrospective data review. A corrob-
orating study by James Krinsley was based on
a retrospective data review of 1,800 patients
at Stamford Hospital between 1999 and
200310. The study showed a direct relation-
ship between increased mean ICU glucose
levels and increased mortality in a mixed,
medical/surgical ICU that did not include
cardiac surgery patients. In Van den Berghe’s
study, 65% were cardiac surgery patients, and
the cardiac surgery population itself likely
had a significant effect on the results seen.
In Krinsley’s non-cardiac surgery ICU popula-
tion, patients observed with blood glucose
levels of 150 mg/dL had a three-fold increase
in mortality compared to the group with the
lowest blood glucose values of 90 mg/dL.
Krinsley concluded that increased glucose
levels adversely affect mortality rate even in
non-cardiac surgery populations.
Length of stay. In 2006 Krinsley report-
ed19 that hyperglycemia was also related to
increased length of stay. Insulin infusions,
which reduce hyperglycemia, were shown to
decrease hospital costs. From the Portland
data, IIT on the day of surgery and the first
and second postoperative days has been
shown to reduce length of stay. Overall, insu-
lin infusions reduce the length of stay by
about two days in cardiac surgery patients.
What Do We Know About TCG at the End of 2007?
From the Portland study we know that:
• Mortalityisaffectedbyglucoseontheday
of surgery, the first day and the second
day post-surgery, but the effect becomes
insignificant on the third day.
• Infection rates are affected preoperative-
ly, are almost significant are the day of
surgery (p = 0.7) and are significant
on the first, second, and third day postop-
eratively.
8 Executive Summary Conference Report
• Length of stay is affected on the first,
second and third day, and even preopera-
tively.
• In cardiac surgery patients the “3” is just
as important as the “BG.” Both express
the important terms of this therapy–target
level and duration.
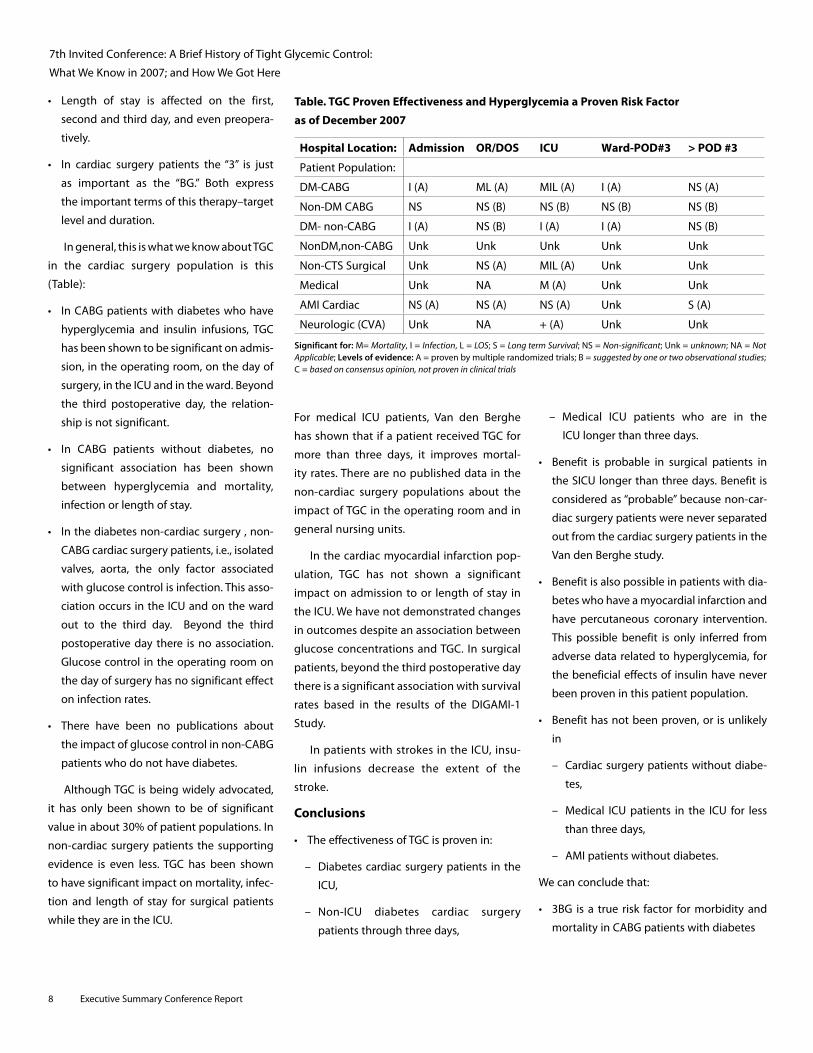
In general, this is what we know about TGC
in the cardiac surgery population is this
(Table):
• InCABGpatientswithdiabeteswhohave
hyperglycemia and insulin infusions, TGC
has been shown to be significant on admis-
sion, in the operating room, on the day of
surgery, in the ICU and in the ward. Beyond
the third postoperative day, the relation-
ship is not significant.
• In CABG patients without diabetes, no
significant association has been shown
between hyperglycemia and mortality,
infection or length of stay.
• Inthediabetesnon-cardiacsurgery,non-
CABG cardiac surgery patients, i.e., isolated
valves, aorta, the only factor associated
with glucose control is infection. This asso-
ciation occurs in the ICU and on the ward
out to the third day. Beyond the third
postoperative day there is no association.
Glucose control in the operating room on
the day of surgery has no significant effect
on infection rates.
• There have been no publications about
the impact of glucose control in non-CABG
patients who do not have diabetes.
Although TGC is being widely advocated,
it has only been shown to be of significant
value in about 30% of patient populations. In
non-cardiac surgery patients the supporting
evidence is even less. TGC has been shown
to have significant impact on mortality, infec-
tion and length of stay for surgical patients
while they are in the ICU.
For medical ICU patients, Van den Berghe
has shown that if a patient received TGC for
more than three days, it improves mortal-
ity rates. There are no published data in the
non-cardiac surgery populations about the
impact of TGC in the operating room and in
general nursing units.
In the cardiac myocardial infarction pop-
ulation, TGC has not shown a significant
impact on admission to or length of stay in
the ICU. We have not demonstrated changes
in outcomes despite an association between
glucose concentrations and TGC. In surgical
patients, beyond the third postoperative day
there is a significant association with survival
rates based in the results of the DIGAMI-1
Study.
In patients with strokes in the ICU, insu-
lin infusions decrease the extent of the
stroke.
Conclusions
• TheeffectivenessofTGCisprovenin:
– Diabetes cardiac surgery patients in the
ICU,
– Non-ICU diabetes cardiac surgery
patients through three days,
– Medical ICU patients who are in the
ICU longer than three days.
• Benefit is probable in surgical patients in
the SICU longer than three days. Benefit is
considered as “probable” because non-car-
diac surgery patients were never separated
out from the cardiac surgery patients in the
Van den Berghe study.
• Benefitisalsopossibleinpatientswithdia-
betes who have a myocardial infarction and
have percutaneous coronary intervention.
This possible benefit is only inferred from
adverse data related to hyperglycemia, for
the beneficial effects of insulin have never
been proven in this patient population.
• Benefithasnotbeenproven,or isunlikely
in
– Cardiac surgery patients without diabe-
tes,
– Medical ICU patients in the ICU for less
than three days,
– AMI patients without diabetes.
We can conclude that:
• 3BG is a true risk factor formorbidity and
mortality in CABG patients with diabetes
7th Invited Conference: A Brief History of Tight Glycemic Control:
What We Know in 2007; and How We Got Here
Table. TGC Proven Effectiveness and Hyperglycemia a Proven Risk Factor
as of December 2007
Hospital Location: Admission OR/DOS ICU Ward-POD#3 > POD #3
Patient Population:
DM-CABG I (A) ML (A) MIL (A) I (A) NS (A)
Non-DM CABG NS NS (B) NS (B) NS (B) NS (B)
DM- non-CABG I (A) NS (B) I (A) I (A) NS (B)
NonDM,non-CABG Unk Unk Unk Unk Unk
Non-CTS Surgical Unk NS (A) MIL (A) Unk Unk
Medical Unk NA M (A) Unk Unk
AMI Cardiac NS (A) NS (A) NS (A) Unk S (A)
Neurologic (CVA) Unk NA + (A) Unk Unk
Significant for: M= Mortality, I = Infection, L = LOS; S = LongtermSurvival; NS = Non-significant; Unk = unknown; NA = NotApplicable; Levels of evidence: A = proven by multiple randomized trials; B = suggestedbyoneortwoobservationalstudies; C = basedonconsensusopinion,notproveninclinicaltrials
Executive Summary Conference Report 9
• Continuous insulin infusions that control
3BG can normalize the diabetic patient
outcomes to non-diabetic levels.
• GIKisnotequivalenttocontinuousinsulin
infusions.
• TCG in the ICUwith continuous infusions
followed by SQ control in general nursing
units has not produced equivalent results
to three days of IV insulin infusions.
References
1. Furnary AP, Zerr KJ, Grunkemeier GL, Starr A. Continuous intravenous insulin infusion reduces the incidence of deep sternal wound infection in diabetic patients after cardiac surgical procedures. AnnThoracSurg. Feb 1999;67(2):352-60; discussion 360-52.
2. Furnary AP, Zerr KJ, Grunkemeier GL, Heller CA. Hyperglycemia: A predictor of mortality following CABG in diabetics. Circulation. 1999;100(18):I-591.
3. Furnary AP, Wu Y, Bookin SO. Effect of hyperglyce-mia and continuous intravenous insulin infusions on outcomes of cardiac surgical procedures: the Portland Diabetic Project. Endocr Pract. Mar-Apr 2004;10 Suppl 2:21-33.
4. Furnary AP, Gao G, Grunkemeier GL, et al. Continuous insulin infusion reduces mortality in patients with diabetes undergoing coronary artery bypass grafting. J Thorac Cardiovasc Surg. May 2003;125(5):1007-21.
5. Furnary AP, Chaugle H, Zerr K, Grunkemeier G. Postoperative hyperglycemia prolongs length of stay in diabetic CABG patients. Circulation. 2000;102(18):II-556.
6. Zerr KJ, Furnary AP, Grunkemeier GL, Bookin S, Kanhere V, Starr A. Glucose control lowers the risk of wound infection in diabetics after open heart operations. Annals of Thoracic Surgery. 1997;63(2):356-61.
7. Malmberg K. Prospective randomised study of intensive insulin treatment on long term survival after acute myocardial infarction in patients with diabetes mellitus. DIGAMI (Diabetes Mellitus, Insulin Glucose Infusion in Acute Myocardial Infarction) Study Group. Bmj. May 24 1997;314(7093):1512-5.
8. van den Berghe G, Wouters P, Weekers F, et al. Intensive insulin therapy in the critically ill patients. NEnglJMed. Nov 8 2001;345(19):1359-67.
9. Van den Berghe G, Wilmer A, Hermans G, et al. Intensive insulin therapy in the medical ICU. NEnglJMed. Feb 2 2006;354(5):449-61.
10. Krinsley JS. Association between hyperglycemia and increased hospital mortality in a heteroge-neous population of critically ill patients. MayoClinProc. Dec 2003;78(12):1471-8.
11. Krinsley JS. Effect of an intensive glucose manage-ment protocol on the mortality of critically ill adult patients. MayoClinProc. Aug 2004;79(8):992-1000.
12. Mehta SR, Yusuf S, Diaz R, et al. Effect of glucose-insulin-potassium infusion on mortality in patients with acute ST-segment elevation myocardial infarc-tion: the CREATE-ECLA randomized controlled trial. Jama. Jan 26 2005;293(4):437-46.
13. Malmberg K, Ryden L, Wedel H, et al. Intense meta-bolic control by means of insulin in patients with diabetes mellitus and acute myocardial infarction (DIGAMI 2): effects on mortality and morbidity. EurHeartJ. Apr 2005;26(7):650-61.
14. Furnary AP, Wu Y. Eliminating the diabetic disadvan-tage: the Portland Diabetic Project. Semin ThoracCardiovascSurg. Winter 2006;18(4):302-8.
15. Brown JR, Edwards FH, O'Connor GT, Ross CS, Furnary AP. The diabetic disadvantage: historical outcomes measures in diabetic patients under-going cardiac surgery--the pre-intravenous insu-lin era. Semin Thorac Cardiovasc Surg. Winter 2006;18(4):281-8.
16. Furnary AP. Diabetes, hyperglycemia, and the car-diac surgery patient: introduction. Semin ThoracCardiovascSurg. Winter 2006;18(4):278-80.
17. Furnary AP, Cheek DB, Holmes SC, Howell WL, Kelly SP. Achieving tight glycemic control in the operating room: lessons learned from 12 years in the trenches of a paradigm shift in anesthetic care. SeminThoracCardiovascSurg. Winter 2006;18(4):339-45.
18. Braunwald E. Shattuck lecture--cardiovascular medicine at the turn of the millennium: triumphs, concerns, and opportunities. N Engl JMed. Nov 6 1997;337(19):1360-9.
19. Krinsley JS. Glycemic control, diabetic status, and mortality in a heterogeneous population of criti-cally ill patients before and during the era of intensive glycemic management: six and one-half years experience at a university-affiliated commu-nity hospital. SeminThoracCardiovascSurg. Winter 2006;18(4):317-25.
7th Invited Conference: A Brief History of Tight Glycemic Control:
What We Know in 2007; and How We Got Here
PROCEEDINGS
10 Executive Summary Conference Report
Intensive Insulin Therapy and the NICE-SUGAR StudySimon Finfer, MB, BS, FRCP, FRCA, FJFICM, Director of Critical Care and Trauma, George Institute for International Health,
Professor, Faculty of Medicine, University of Sydney, Sydney, Australia
Key points
• ThelandmarkstudiesbyVandenBergheetal.havemadecontrolofbloodglucosea
centralpartofthemanagementofcriticallyillpatients,butotherrandomized,controlled
trialshavebeenunabletoreplicatetheirresults.
• AsaresultofthetwoconflictingVandenBerghetrialsandconcernsovercasemix,higher-
than-expectedmortalityinthecontrolgroup,androutineuseofhigh-doseintravenous
glucose,intensive-carecliniciansremainuncertainwhethertouseintensiveinsulintherapy
(IIT)intheirpatients.
• ThelargesttrialofIITwillbetheNICE-SUGARstudy,whichcomparestheeffectsofthe
twobloodglucosetargets—4.5-6.0mmol/L(80-110mg/dLa)and8.0–10.0mmol/L
(180-200mg/dL)—on90-day,all-causemortalityinintensivecarepatientswhoare
predictedtobeintheintensivecareunitonmorethantwocalendardays.
• IftheNICE-SUGARstudydemonstratesafavorabletreatmenteffect,maintaining
normoglycemiawillmostlikelybecomeatreatmentstandardworldwide.
Published observational data show a
decrease in unwanted outcomes accompany-
ing improved glycemic control in cardiotho-
racic surgery patients and in those admitted
to a mixed population intensive care unit
(ICU)1-3. While it is tempting to conclude that
these data are evidence of “cause and effect,”
other reports suggest that it is hazardous to
make such inferences. Two examples illus-
trate this point:
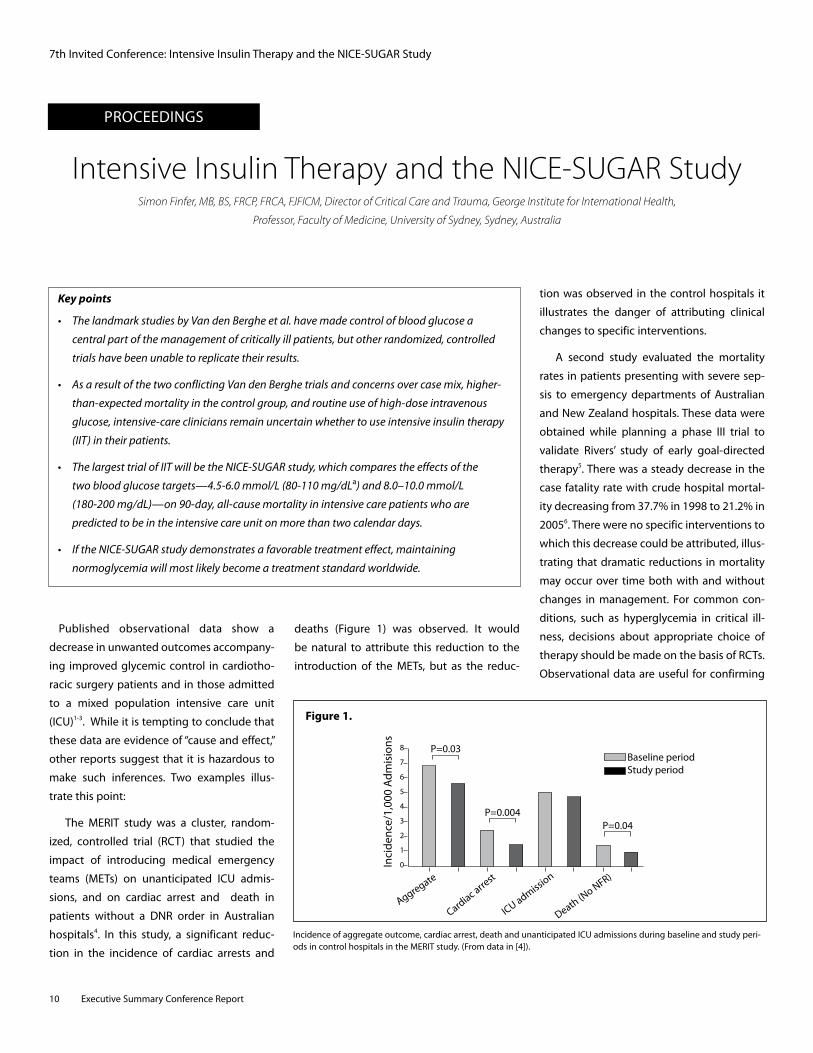
The MERIT study was a cluster, random-
ized, controlled trial (RCT) that studied the
impact of introducing medical emergency
teams (METs) on unanticipated ICU admis-
sions, and on cardiac arrest and death in
patients without a DNR order in Australian
hospitals4. In this study, a significant reduc-
tion in the incidence of cardiac arrests and
deaths (Figure 1) was observed. It would
be natural to attribute this reduction to the
introduction of the METs, but as the reduc-
tion was observed in the control hospitals it
illustrates the danger of attributing clinical
changes to specific interventions.
A second study evaluated the mortality
rates in patients presenting with severe sep-
sis to emergency departments of Australian
and New Zealand hospitals. These data were
obtained while planning a phase III trial to
validate Rivers’ study of early goal-directed
therapy5. There was a steady decrease in the
case fatality rate with crude hospital mortal-
ity decreasing from 37.7% in 1998 to 21.2% in
20056. There were no specific interventions to
which this decrease could be attributed, illus-
trating that dramatic reductions in mortality
may occur over time both with and without
changes in management. For common con-
ditions, such as hyperglycemia in critical ill-
ness, decisions about appropriate choice of
therapy should be made on the basis of RCTs.
Observational data are useful for confirming
P=0.038
7
6
5
4
3
2
1
0Inci
denc
e/1,
000
Adm
isio
ns
P=0.004P=0.04
Aggregate
Cardiac arrest
ICU admission
Death (No NFR)
Baseline periodStudy period
Incidence of aggregate outcome, cardiac arrest, death and unanticipated ICU admissions during baseline and study peri-ods in control hospitals in the MERIT study. (From data in [4]).
Figure 1.
7th Invited Conference: Intensive Insulin Therapy and the NICE-SUGAR Study
Executive Summary Conference Report 11
the findings of RCTsand for investigating rare
but serious side effects, but are subject to
large errors due to bias7,8.
Intensive Insulin Therapy (IIT) Studies–Van den Berghe et al.
In their first randomized trial, Van den
Berghe et al. randomized 1,548 surgical inten-
sive care patients to receive insulin to main-
tain blood glucose between 4.4-6.1 mmol/L
(80-110 mg/dLa) (intensive insulin group)
or between 10-11.1 mmol/L (180-200 mg/
dL) (conventional insulin group)9. The study
reported an absolute reduction in hospital
mortality of 3.7% (relative risk reduction, RRR
33%) with IIT9. Other benefits reported in
the intensive insulin group were a reduc-
tion in hospital stay, blood stream infections,
acute renal failure requiring dialysis, incidence
of critical-illness polyneuropathy and blood
transfusions. The external validity of the
results has been questioned because study
patients received high doses of intravenous
(IV) glucose and the control group mortality
was unexpectedly high. Many consider the
RRR to be implausible10. There was no differ-
ence in the number of deaths occurring dur-
ing the first five days in intensive care, and the
reduction in mortality was limited to patients
receiving more than five days’ treatment in
the ICU. The incidence of hypoglycemia was
significantly increased in the intensive insulin
group (39 patients) compared to those in the
conventional glucose group (6 patients). No
long-term sequelae from hypoglycemia were
detected.
In February 2006, Van den Berghe et al.
published a second RCT in 1200 critically ill
medical patients expected to be treated in the
ICU for three or more days11. The study did not
find a significant reduction in mortality in the
intention-to-treat population, although in an
a priori subgroup of 767 patients who were
in the ICU on three or more calendar days,
90-day mortality was reduced from 49.1% to
42.2% (RRR 14.1%, p=0.06). The investigators
were not able to predict accurately how long
each patient was likely to stay in the ICU. The
publication of this second study has increased
clinicians’ uncertainty over the role of IIT in
critically ill patients. Van den Berghe called for
additional large-scale RCTs of at least 5,000
participants to answer the important ques-
tion of whether IIT reduces mortality in ICU
patients. Van den Berghe’s call was supported
by an accompanying editorial highlighting
the need for further study to answer this
important question12.
The NICE-SUGAR Study
As a result of the two conflicting Van den
Berghe trials and concerns over case mix,
higher-than-expected mortality in the control
group and routine use of high-dose IV glucose,
ICU clinicians are still uncertain about using IIT
in their patients. To resolve this uncertainty, a
National Health and Medical Research Council
(NHMRC)-funded RCT of IIT commenced in
Australia and New Zealand in 2005, and in
2006 the Normoglycaemia in Intensive Care
Evaluation (NICE) Study Investigators joined
with the Survival Using Glucose Algorithm
Regulation (SUGAR) trial investigators of the
Canadian Critical Care Trials Group to com-
plete a single trial thereafter called the NICE-
SUGAR study13.
The primary aim of the NICE-SUGAR study
is to compare the effects of the two blood
glucose targets on 90-day, all-cause mortality
in intensive care patients who are predicted
to be in the ICU on more than two calendar
days. The null hypothesis is that there is no dif-
ference in the relative risk of death between
patients assigned a blood glucose target of
4.5-6.0 mmol/L (81-108 mg/dL) and those
assigned a blood glucose target of less than
10.0 mmol/L (<180 mg/dL) with insulin being
infused if blood glucose exceeds 10.0 mmol/L
(180 mg/dL) and adjusted when needed to
maintain blood glucose of 8.0–10.0 mmol/L
(144-180 mg/dL).
The two blood glucose targets are achieved
with the aid of a web-based algorithm. The
use of this algorithm promotes uniform blood
glucose management in all study sites and
enables the study management committee to
monitor blood glucose management within
the study. It is therefore known whether the
blood glucose targets are being met with suf-
ficient separation between the two groups.
After more than 1.5 million hours of blood
glucose management, the average blood glu-
cose derived from measurements entered
into the treatment algorithm is 5.9mmol/L
(106.2 mg/dL) in the lower range group versus
8.4mmol/L (151.2 mg/dL) in the higher range
group. This compares with 5.7 vs. 8.5mmol/L
(102.6 vs. 153.0 mg/dL) in the first Van den
Berghe study and 6.2 vs. 8.5mmol/L (111.6 vs.
153.0 mg/dL) in the second study. The aver-
age time on study treatment is 386 hours or
16.1 days.
The major safety concern with IIT is
hypoglycemia. The rate of hypoglycemia for
patients randomized to the low-range arms
of the two Van den Berghe trials was 5% and
18% respectively9,11. In 4,450 patients the rate
of hypoglycemia in the low-range group of
the NICE-SUGAR study is 10.2 events per
100 patients, towards the lower end of the
rates reported for this treatment. All episodes
of hypoglycemia are classified as serious
adverse events (SAEs) and reported to partici-
pating centers’ ethics committees and to the
study’s independent data and safety monitor-
ing committee. All SAEs have been followed
up by the study management committee and
to date there have been no harmful sequelae
detected.
The data from the two Van den Berghe
studies suggest that in a combined medical
and surgical population a RRR of 14% is a
more appropriate target, and 6,100 patients
will be included in NICE-SUGAR to provide
90% power to detect a 14% RRR from a base-
line mortality of 30% (α < 0.05).
7th Invited Conference: Intensive Insulin Therapy and the NICE-SUGAR Study
12 Executive Summary Conference Report
NICE-SUGAR Research Planb Patient Selection
The treatment effect in the first Van den
Berghe study was limited to patients who
were in the ICU for five or more days. In the
second study only patients expected to be in
the ICU for three days were included. In the
NICE-SUGAR study patients expected to be
discharged alive or die before the end of the
day following admission are not being includ-
ed. To exclude patients who will stay in the
ICU for more than two calendar days but who
have a very low risk of death, patients who
are able to eat (or who are tube-fed due to
pre-existing bulbar or laryngeal dysfunction)
and patients who do not have an arterial line
as part of their routine management are also
being excluded. Patients who are moribund
and at imminent risk of death (brain death or
cardiac standstill) are excluded on the basis
that treatment allocation cannot alter their
outcome. Randomization is achieved via a
password-protected, encrypted, secure study
website with patients allocated to receive
one of two target ranges for glycemic control
in the ICU. A minimization program stratifies
treatment allocation by type of critical illness
(medical vs. surgical) and by region: Australia
and New Zealand or North America.
Study Outcomes
Primary outcome measure:
• All-cause,90-daymortality
Secondary outcomes:
• Death in the ICU, by day 28 and before
hospital discharge
• LengthofICUstay
• Lengthofhospitalstay
• The need for organ support (inotropes,
renal replacement therapy and positive
pressure ventilation)
• Incidenceofbloodstreaminfections
• Incidenceandseverityofhypoglycemia
• Inthesubgroupofpatientsadmittedwith
diagnosis of traumatic brain injury, long-
term functional status will be determined
by Extended Glasgow Outcome Scores
(GOSE) at six months and two years.
Organization and Collaboration
The study is being conducted as a col-
laboration among the Australian and New
Zealand Intensive Care Society Clinical Trials
Group (ANZICS CTG), the Canadian Critical
Care Trials Group (CCCTG) and The George
Institute for International Health and over-
seen by the NICE-SUGAR study management
committee. Data analysis, data sharing, and
publication regulations will involve all inves-
tigators according to ANZICS CTG guide-
lines and will be regulated by memoranda of
understanding.
The group assembled for this study
includes epidemiologists and intensive
care physicians who provide the expertise
and clinical and research skills to conduct
this study. The collaboration between the
Australian and New Zealand and Canadian
Critical Care Trials Groups and the Mayo Clinic
will provide reliable evidence about the com-
parative effects of different targets for blood
glucose concentration in patients treated in
the Australasian and North American inten-
sive care setting.
Summary
The two studies conducted by Van den
Berghe et al have made control of blood glu-
cose an important issue in the management
of critically ill patients. To date, other RCTs
have been unable to replicate the results of
these studies. The NICE-SUGAR Study will be
the largest trial of IIT, and if it demonstrates a
favorable treatment effect, maintaining nor-
moglycemia will most likely become a treat-
ment standard worldwide.
a. mmol/L = (md/dL x 10) divided by atom-
ic weight of glucose (MW = 180), i.e.,
mmol/L X 18 = mg/dL of glucose
b. See electronic supplement to Angus and
Abraham, 200513
References
1. Krinsley JS. Effect of an intensive glucose manage-ment protocol on the mortality of critically ill adult patients. MayoClinProc 2004;79:992-1000.
2. Furnary AP, Zerr KJ, Grunkemeier GL, et al. Continuous intravenous insulin infusion reduces the incidence of deep sternal wound infection in diabetic patients after cardiac surgical procedures. AnnThoracSurg1999;67:352-60.
3. Furnary AP, Gao G, Grunkemeier GL, et al. Continuous insulin infusion reduces mortal-ity in patients with diabetes undergoing coronary artery bypass grafting. J Thorac Cardiovasc Surg 2003;125:1007-21.
4. Hillman K, Chen J, Cretikos M, et al. Introduction of the medical emergency team (MET) system: a cluster-randomized controlled trial. Lancet 2005; 365:2091-7.
5. Rivers E, Nguyen B, Havstad S, et al. Early goal-directed therapy in the treatment of severe sepsis and septic shock. NEnglJMed 2001;345:1368-77.
6. The Australasian Resuscitation in Sepsis Evaluation (ARISE) Investigators and the Australian and New Zealand Intensive Care Society (ANZICS) Adult Patient Database (APD) Management Committee. The outcome of patients with sepsis and sep-tic shock presenting to emergency departments in Australia and New Zealand. Critical Care andResuscitation 2007;9:8-18.
7. Collins R, MacMahon S. Reliable assessment of the effects of treatment on mortality and major mor-bidity, I: clinical trials. Lancet 2001;357:373-80.
8. MacMahon S, Collins R. Reliable assessment of the effects of treatment on mortality and major morbidity, II: observational studies. Lancet 2001;357:455-62.
9. Van den Berghe G, Wouters P, Weekers F, et al. Intensive insulin therapy in critically ill patients. NEnglJMed2001;345:1359-67.
10. Bellomo R, Egi M. Glycemic control in the intensive care unit: why we should wait for NICE-SUGAR. MayoClinProc 2005;80:1546-8.
11. Van den Berghe G, Wilmer A, Hermans G, et al. NEnglJMed 2006;354:449-61.
12. Malhotra A. Intensive Insulin in Intensive Care. NEnglJMed 2006, 354: 516-8.
13. Angus DC, Abraham E. Intensive Insulin Therapy in Critical Illness. Am J Respir Crit CareMed 2005; 172:1358-9.
7th Invited Conference: Intensive Insulin Therapy and the NICE-SUGAR Study
Executive Summary Conference Report 13
PROCEEDINGS
Key points
• Incontrasttothedecreasesinmortalityandlowseverityofadverseeffectsreportedwhen
insulininfusionratewastitratedtokeepbloodglucoselevelsbetween80-110mg/dL,these
benefitswerenotconfirmedinmulti-centerprospectivestudies.
• Retrospectivedataanalysisfoundanassociationbetweenameanbloodglucoselevel
below140-150mg/dLandimprovedoutcome.
• Currentlyunresolvedissuesinintensiveinsulintherapy(IIT)includetheoptimalblood
glucosetarget,theeffectsofhighvariabilityinbloodglucoselevels,therisksandhazardsof
hypoglycemiaandthepotentialinfluenceofanunderlyingdisorderontheeffectsoftight
glucosecontrol(TGC).
• AlthoughrecommendationsregardingthepracticalaspectsofTGCIITcannotpresentlybe
made,anintermediatetargetlevelforbloodglucoseseemstobeassociatedwiththelowest
risk-to-benefitratio.
European Multi-center Trials with Tight Glucose Control by Intensive Insulin Therapy
Philippe Devos, MD, Jean-Charles Preiser, MD, PhD, Department of General Intensive Care, University Hospital of Liege–Sart-Tilman, Liege, Belgium
Tight glucose control (TGC) by intensive
insulin therapy (IIT) is defined as the main-
tenance of “normoglycemia” (blood glucose
levels 80-110 mg/dL). Achieving TGC by
the titration of intravenous (IV) insulin has
become a major topic of interest. The com-
mon condition of “stress hyperglycemia” as
a physiological response to a critical illness
was challenged by the report of Greet Van
den Berghe and co-workers in Leuven. They
reported a 4% decrease in absolute mortality
associated with TGC IIT in a surgical intensive
care unit (ICU) population1. The beneficial
effects of TGC IIT were partially confirmed by
the same team in a medical ICU population2.
New insights into the mechanisms of
glucose toxicity have also been described.
Severe hyperglycemia was found to induce
acute changes in cellular metabolism and
in the structure of macromolecules3,4. In the
presence of high glucose concentrations,
several steps in the glycolytic pathways can
induce the release of toxic derivates. These
effects, sometimes collectively referred to
as “the Brownlee theory,” are reversible with
the pharmacological inhibition of Poly-ADP-
ribosyl-polymerase5, suggesting the involve-
ment of the activation of this enzymatic com-
plex of nuclear repair enzymes. This is prob-
ably related to the involvement of reactive
oxygen intermediates in the toxic effects of
hyperglycemia6,7.
These clinical and biochemical findings
support the concept of hyperglycemia as a
mediator for rather than a marker of criti-
cal illness. Proof that hyperglycemia is an
independent risk factor for ICU mortality in
critically ill patients is lacking8. Several dif-
ferent teams tried to confirm the results of
the Leuven team in prospective, random-
ized trials, including the German VISEP
trial, the Australian NICE-SUGAR trial and
the European Gluconcontrol study, while
others analyzed retrospectively collected
data9,10,11,12.
Multi-center Trials of TGC IIT
VISEP. The German Competence Network
Sepsis (SepNet), a publicly funded, indepen-
dent, collaborative study group, designed
the randomized VISEP trial13 to address two
questions in a group of septic patients (col-
loids versus crystalloids and TGC IIT). This
trial was stopped for safety reasons after 488
patients in 17 centers were enrolled between
April 2003 and March 2005. Of these, 247
received intensive insulin therapy (IIT [goal:
80-110 mg/dL]) and 241 received conven-
tional insulin therapy (CIT, [goal: 180-200 mg/
dL]). Interim data analysis showed that 30
patients (12.1%) treated with IIT developed
hypoglycemia, compared to 5 patients (2.1%)
treated with CIT (p < 0.001). No adverse event
was classified as leading to patient death. No
differences were found in the 28-day (21.9%
vs 21.6%;p = 1.0) and 90-day mortality rates
(32.8% vs 29.5%; p = 0.43) for IIT and CIT,
respectively. Since the observed rate of hypo-
glycemia was considered unacceptably high
and since there was no treatment efficacy
(no significant difference in 28- or 90-day
mortality), the Independent Data Monitoring
Committee (IDMC) strongly recommended
that the insulin arm of the trial be stopped.
7th Invited Conference: European Multi-center Trials
with Tight Glucose Control by Intensive Insulin Therapy
14 Executive Summary Conference Report
Glucontrol. This prospective, randomized,
controlled, multi-center study14 compared the
effects of TGC IIT to a control group with less
abnormal blood glucose concentrations than
in patients in the Leuven studies (140-180
mg/dL). The primary outcome measure was
ICU mortality. Twenty-one ICUs participated
on a voluntary basis (i.e., no financial incen-
tive or defrayment of study-related costs).
This study was stopped for safety reasons
by the Data Safety Monitoring Board (DSMB)
after the first interim analysis because of a
high rate of unintended protocol violations.
A total of 1,011 patients (550 in the IIT arm,
551 in the CIT arm) were enrolled. Patient
characteristics (median age 65 years, medical
patients 41%, males 62.7%, APACHE II score at
admission 16.5 ± 7.0) did not differ between
groups. From the time of admission the mean
blood glucose levels calculated from individu-
al blood glucose values were higher in the CIT
than in the IIT group with a median value of
119 (IQR 110-131) mg/dL in the IIT group and
147 (IQR 128-165) mg/dL in the CIT group,
p < 0.0001. The adherence to the experi-
mental protocol was confirmed by the pro-
portion of time spent in the assigned range
(40.8% and 38.2% for the IIT and CIT groups,
respectively). The ICU mortality was slightly
higher in the IIT compared to the CIT group
(16.7% versus 15.2%, NS). Multivariate analy-
sis showed a significant association between
APACHE II and SOFA scores on admission and
higher mortality. The rate of hypoglycemia
was higher in the IIT (9.8 %) than in the CIT
group (2.7%, p < 0.0001). Assignment to
the IIT group, death in the ICU, and APACHE
II scores were significantly associated with
hypoglycemia.
Multi-center Trial Results. The currently
available results of both multi-center trials
do not seem to confirm the Leuven data and
actually raise additional clinically important
concerns, questions and difficulties that must
be resolved before widespread use of TGC IIT
for critically ill patients in ICUs worldwide can
be recommended.
Optimal Target for Blood Glucose
The answer to the question of optimal
blood glucose target level can probably be
inferred from clinical data rather than from
experimental findings. Indeed, in the various
studies the detrimental effects of hyperglyce-
mia were observed in the presence of blood
glucose levels higher than those observed
in patients and therefore could be irrelevant
for the determination of the optimal glyce-
mia. Based on the data from the two Leuven
studies1,2, blood glucose > 200 mg/dL can
probably no longer be considered an accept-
able target for insulin therapy in critically
ill patients. However, the issue of the safest
range below this level is still unresolved and
has not been specifically addressed in pro-
spective clinical trials to date.
Three large retrospective trials9,10,11 found
that blood glucose levels < 140 mg/dL were
associated with an improved outcome com-
pared with higher levels.
Ideally, the optimal target for blood glu-
cose levels should be defined by large pro-
spective trials comparing two ranges15. The
Normoglycaemia in Intensive Care Evaluation
and Survival Using Glucose Algorithm
Regulation (NICE-SUGAR) and the Glucontrol
study were designed and launched to com-
pare the effects of insulin therapy titrated to
target blood glucose levels of 80-110 mg/
dL versus 140-180 mg/dL. The results of the
Glucontrol study to date suggest that a blood
glucose target of 140-180 mg/dL is safer
than 80-110 mg/dL. Even though further
confirmation of these findings is desirable,
most clinicians presently use this intermedi-
ate range of 140-180 mg/dL as a target for
IIT16, 17.
Detrimental Effects of High-glucose Variability
Egi and colleagues18 performed a multi-
variate logistic regression analysis of retro-
spectively collected data from 7,049 critically
ill patients. The coefficient of variability cal-
culated from the standard deviation of blood
glucose values recorded for each patient
appeared to be closely related with survival.
In patients with diabetes, blood glucose vari-
ability was a stronger predictor of ICU mortal-
ity than was the absolute blood glucose value.
Outside the ICU, recent data recorded in dia-
betic patients and compared to volunteers
also indicate that blood glucose fluctuations
increase the oxidative stress19. These clinical
data may reflect “cellular” data that showed
cell damage to be most prominent when
blood glucose changed rapidly from a normal
to an elevated level (reviewed in Brownlee3).
This potentially important issue of glucose
variability was not analyzed in the large trials
performed in critically ill patients published
to date. In the Glucontrol study14, the blood
glucose standard deviation was identical in
the two treatment arms.
One implication of the discovery of the
importance of keeping blood glucose as sta-
ble as possible could be to favour the use
of strict algorithms to maintain blood glu-
cose within a narrow range. Although several
different validated algorithms are available,
indices of blood glucose variability usually
were not assessed and not used to compare
different protocols.
Risks and Hazards of Hypoglycemia
Hypoglycemia is the major fear when start-
ing IIT and justified the interruption of the
two European multi-centre prospective trials
mentioned above. Even if the incidence of
hypoglycemia was substantial in both Leuven
studies1,2, the condition of the patients expe-
riencing hypoglycemia was not worsened.
Of note, blood glucose monitoring was very
7th Invited Conference: European Multi-center Trials with
Tight Glucose Control by Intensive Insulin Therapy
Executive Summary Conference Report 15
tight, which implies that the duration of the
hypoglycemic episodes was definitely short.
Therefore, the possibility that long-lasting
hypoglycemia may be deleterious or even
life-threatening cannot be ruled out. Using IIT
titrated to maintain normoglycemia requires
careful blood glucose monitoring, since the
classical neurological symptoms can be offset
by sedation or by an underlying impairment
of the mental status.
Some categories of patients with signifi-
cant dysfunctions of neoglucogenic organs
(liver and kidney), with adrenal failure lead-
ing to an impaired responsiveness of coun-
ter-regulatory hormones, or with a delayed
elimination of insulin could experience longer
episodes of hypoglycemia. The effects of TGC
IIT in these subgroups need to be carefully
assessed.
Potential Influence of the Underlying Disorder on the Effects of TGC IIT
In the second Leuven study2, the improve-
ment in mortality was seen only in patients
who were in the ICU three days or longer.
Mortality tended to increase in patients with
a shorter length of stay who were random-
ized to the IIT group. Some secondary out-
come variables (see Devos and Preiser20 for
discussion) such as requirement for dialysis,
incidence of bacteremia, requirement for pro-
longed antibiotic therapy, incidence of hyper-
bilirubinemia and “hyperinflammation” were
not improved in the IIT group. These differ-
ences could point out subgroups of patients
that do not benefit from IIT. Another category
of patients that may not benefit from IIT is the
subset of patients with pre-existing diabetes,
as shown by the aggregation of the results of
both Leuven studies21.
At the present stage, there is no definite
answer to the question of which subgroups
are likely to benefit more from IIT. Patients
with myocardial ischemia and after cardiac
surgery may represent a subset of patients
susceptible to the deleterious effects of hyper-
glycemia (reviewed in Devos et al. 22).
Interventional studies performed in spe-
cific subgroups or, at least, subgroup analyses
of the large multi-center trials are needed
to define the categories of patients that will
selectively benefit from IIT. Meanwhile, the
use of an intermediate blood glucose target
is probably more prudent and is presently
recommended23,24,25,26.
Conclusions
In spite of the findings that mortality can
be decreased in critically ill patients by TGC
and restoring normal blood glucose values
using IIT, several important questions are still
unanswered. These include the issues of the
best target range, the importance of mini-
mizing blood glucose variability, the avoid-
ance of hypoglycemia and the delineation
of the categories of patients in whom the
restoration of “normal” blood glucose is most
beneficial. With the notable exception of the
VISEP trial, the titration of insulin in order
to maintain blood glucose < 180 mg/dL is
supported by the currently available clinical
data, and an improvement in outcome was
consistently associated with blood glucose
< 140-150 mg/dL.
References
1. Van den Berghe G, Wouters P, Weekers F, et al. Intensive insulin therapy in the critically ill patients. NEnglJMed 2001; 345:1359-67.
2. Van den Berghe G, Wilmer A, Hermans G, et al. Intensive insulin therapy in the medical ICU. NEnglJMed 2006; 354:449-61.
3. Brownlee M. Biochemistry and molecular cell biolo-gy of diabetic complications. Nature 2001; 414:813-20.
4. Hirsch IB, Brownlee M. Should minimal blood glu-cose variability become the gold standard of glyce-mic control?JDiabetesComplications 2005; 19:178-81.
5. Garcia Soriano F, Virag L, Jagtap P, et al. Diabetic endothelial dysfunction: the role of poly(ADP-ribose) polymerase activation. Nat Med 2001; 7:108-13.
6. Szabo C, Biser A, Benko R, et al. Poly(ADP-Ribose) polymerase inhibitors ameliorate nephropathy of type 2 diabetic Leprdb/db Mice. Diabetes 2006; 55:3004-12.
7. Ceriello A. Oxidative stress and diabetes-associated complications. EndocrPract 2006; 12(Suppl 1):60-2.
8. Corstjens AM, van der Horst IC, Zijlstra JG, et al. Hyperglycaemia in critically ill patients: marker or mediator of mortality? CritCare2006; 10:216.
9. Krinsley JS. Effect of an intensive glucose manage-ment protocol on the mortality of critically ill adult patients. MayoClinProc 2004; 79:992-1000.
10. Finney SJ, Zekveld C, Elia A, et al. Glucose control and mortality in critically ill patients. JAMA 2003; 290:2041-7.
11. Gabbanelli V, Pantanetti S, Donati A, et al. Correlation between hyperglycemia and mortality in a medical and surgical intensive care unit. MinervaAnestesiol 2005; 71:717-25.
12. Ouattara A, Lecomte P, Le Manach Y, et al. Poor intraoperative blood glucose control is associated with a worsened hospital outcome after cardiac surgery in diabetic patients. Anesthesiology 2005; 103:687-94.
13. Brunkhorst FM, Kuhnt E, Engel C et al. Intensive insulin therapy in patients with severe sepsis and septic shock is associated with an increased rate of hypoglycaemia–results from a randomized multi-center study. Abstr. Infection 2005; 33(Suppl 1):19. (http://webanae.med.uni-jena.de/WebObjects/DSGPortal.woa/WebServerResources/sepnet/visep.html)
14. Devos P, Preiser J, Mélot C, on behalf of the Glucontrol steering committee. Impact of tight glucose control by intensive insulin therapy on ICU mortality and the rate of hypoglycaemia: Final results of the glucontrol study. CritCareMed 2007–Abstract: oral presentation # 0735 (supplement for the annual congress): In press.
15. Angus DC, Abraham E. Intensive insulin therapy in critical illness. Am J Respir Crit Care Med 2005; 172:1358-9.
16. McMullin J, Brozek J, Jaeschke R, et al. Glycemic control in the ICU: a multicenter survey. IntensiveCareMed 2004; 30:798-803.
17. Devos Ph, Ledoux D, Preiser JC, on behalf of the GLUCONTROL Steering Committee. Current prac-tice of glycaemia control in European intensive care units (ICUs). Abstr. IntensiveCareMed 2005; 31:130.
18. Egi M, Bellomo R, Stachowski E, et al. Variability of blood glucose concentration and short-term mor-tality in critically ill patients. Anesthesiology 2006; 105:244-52.
19. Monnier L, Mas E, Ginet C, et al. Activation of oxida-tive stress by acute glucose fluctuations compared with sustained chronic hyperglycemia in patients with type 2 diabetes. JAMA 2006; 295:1681-7.
7th Invited Conference: European Multi-center Trials with
Tight Glucose Control by Intensive Insulin Therapy
16 Executive Summary Conference Report
20. Devos P, Preiser JC. Is it time for implementation of tight glycaemia control by intensive insulin therapy in every ICU ? CritCare 2006; 10(2):130.
21. Van den Berghe G, Wilmer A, Milants I, et al. Intensive insulin therapy in mixed medical/surgical intensive care units: benefit versus harm. Diabetes 2006; 55:3151-9.
22. Devos P, Chiolero R, Van den Berghe G, et al. Glucose, insulin and myocardial ischaemia. CurrOpinClinNutrMetabCare 2006; 9:131-9.
23. Devos P, Preiser JC. Tight blood glucose control: a recommendation applicable to any critically ill patient? CritCare 2004; 8:427-9.
24. Preiser JC, Devos P, Van den Berghe G. Tight control of glycaemia in critically ill patients. CurrOpinClinNutrMetabCare 2002; 5:533-7.
25. McMahon MM, Miles JM. Glycemic control and nutrition in the intensive care unit. CurrOpinClinNutrMetabCare 2006; 9:120-3.
26. Dellinger RP, Carlet JM, Masur H, et al. Surviving Sepsis Campaign guidelines for management of severe sepsis and septic shock. CritCareMed 2004; 32:858-73.
7th Invited Conference–European Multi-center Trials with
Tight Glucose Control by Intensive Insulin Therapy
PROCEEDINGS
Key points
• Elementsofasuccessfulimplementationofatightglycemiccontrol(TGC)protocolinclude
multidisciplinarycollaboration;priorstaffexperiencewithcomplexprotocols;anagreed-
upon,achievablebloodglucosetarget;robustdata-analysiscapabilities;andclinician
accesstorelevantintensivecareunit(ICU)outcomedata.
• Avoidanceofdeleteriousseverehypoglycemiarequiresrecognitionoftheriskfactorssuch
asseverityofillness,thepresenceofrenalfailure(delayedclearanceofinsulin),sepsis
andliverfailure(impairedgluconeogenesis),discontinuationofsourceofcalorieswith
continuationofinsulintherapy,anddiabetes.
• TGChasemergedasastandardofcareintheICUbecauseofitsbiologicplausibilityand
theavailableinterventionalstudies.Furthercorroborationmaycomefromtheongoing
NICE-SUGARtrial.
• Theappropriatetreatmentthreshold–110,120,140oreven150mg/dL–isnotknownwith
certaintyandmayvarybasedondiagnosticcategory.Availableevidence,however,does
notsupportmaintenanceofhigherlevelsofsustainedhyperglycemia.
Implementation of Tight Glycemic Control at Stamford Hospital
James Krinsley, MD, FCCM, FCCP, Director of Critical Care, Stamford Hospital, Professor of Clinical Medicine
Columbia University College of Physicians and Surgeons, Stamford, CT
Before the project discussed in this arti-
cle, glycemic management in the Stamford
Hospital intensive care unit (ICU)—a 14-bed
unit where medical, surgical and cardiac
patients were treated—was similar to that
in most ICUs. Moderate degrees of hypergly-
cemia were tolerated without consideration
for treatment, because this condition was
common and believed to be adaptive. After
the publication of Van den Berghe’s random-
ized study of intensive insulin therapy (IIT), a
program for tight glycemic control (TGC) was
implemented at our hospital.
The process of making this change began
with a review of a database that includes
detailed clinical and financial data for 8,600
consecutively admitted patients to investi-
gate the relationship between glycemic lev-
els and mortality. The results were striking. A
nearly linear relationship was found between
these two variables even within the range of
euglycemia. Further elaboration of these data
was published in 20032.
This evaluation identified the importance
of glycemic control and prompted discus-
sions with the ICU nurses about the type of
treatment protocol that should be instituted
in the unit. It became clear that the nurses
were unwilling to implement a protocol with
a blood glucose target of 80-110 mg/dL. The
nurses feared the work burden imposed by
strict monitoring and treatment and the risk
of hypoglycemia, particularly if such a strict
target was established. After discussion, it
was agreed that 140 mg/dL would be an
acceptable initial treatment threshold. As a
result, a 80-140 mg/dL target was used in the
1,600 patient before-and-after interventional
study3.
This experience highlights some of the
important principles about successful imple-
mentation of tight glycemic control (TGC).
Developing and implementing an ITT proto-
col is most successful where there is multi-
disciplinary collaboration. Before addressing
TGC, nearly all routine aspects of care in the
unit had been “protocolized.” The nurses and
physicians had experience crafting evidence-
based protocols and standardized care was
accepted. This was important, because TGC
presented a level of complexity not present
in most other protocols. Medical and nursing
leadership needed to share the same vision
for the unit for this work to be done success-
fully.
Another key point is the decision to
choose an achievable goal. There was no
buy-in from the nursing staff regarding the
idea of TGC until they were comfortable with
the glycemic target. A final component for
successful execution of TGC was the avail-
ability of robust data-analysis capabilities.
Clinicians who practice in the ICU need to
have ready and timely access to glycemic
values. The treating clinicians need to know
whether hyperglycemia is being adequately
controlled and whether the insulin therapy
is associated with an unacceptable rate of
hypoglycemia.
7th Invited Conference: Implementation of Tight Glycemic Control at Stamford Hospital
Executive Summary Conference Report 17
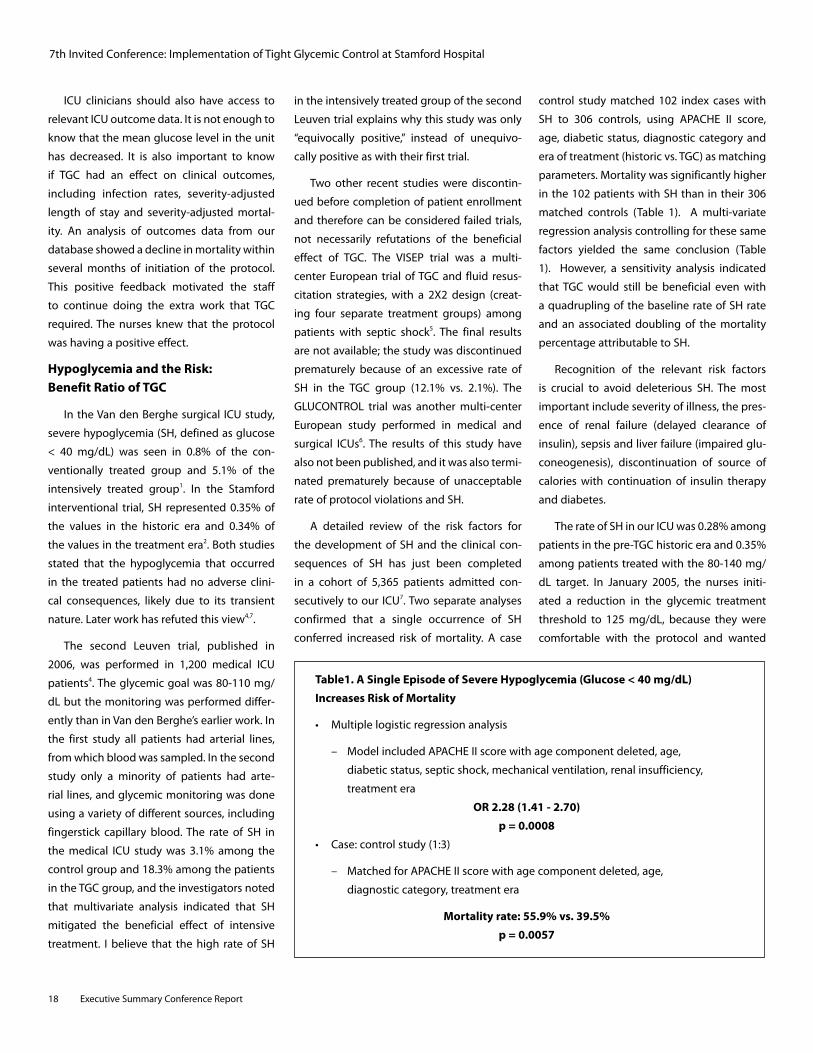
18 Executive Summary Conference Report
ICU clinicians should also have access to
relevant ICU outcome data. It is not enough to
know that the mean glucose level in the unit
has decreased. It is also important to know
if TGC had an effect on clinical outcomes,
including infection rates, severity-adjusted
length of stay and severity-adjusted mortal-
ity. An analysis of outcomes data from our
database showed a decline in mortality within
several months of initiation of the protocol.
This positive feedback motivated the staff
to continue doing the extra work that TGC
required. The nurses knew that the protocol
was having a positive effect.
Hypoglycemia and the Risk: Benefit Ratio of TGC
In the Van den Berghe surgical ICU study,
severe hypoglycemia (SH, defined as glucose
< 40 mg/dL) was seen in 0.8% of the con-
ventionally treated group and 5.1% of the
intensively treated group1. In the Stamford
interventional trial, SH represented 0.35% of
the values in the historic era and 0.34% of
the values in the treatment era2. Both studies
stated that the hypoglycemia that occurred
in the treated patients had no adverse clini-
cal consequences, likely due to its transient
nature. Later work has refuted this view4,7.
The second Leuven trial, published in
2006, was performed in 1,200 medical ICU
patients4. The glycemic goal was 80-110 mg/
dL but the monitoring was performed differ-
ently than in Van den Berghe’s earlier work. In
the first study all patients had arterial lines,
from which blood was sampled. In the second
study only a minority of patients had arte-
rial lines, and glycemic monitoring was done
using a variety of different sources, including
fingerstick capillary blood. The rate of SH in
the medical ICU study was 3.1% among the
control group and 18.3% among the patients
in the TGC group, and the investigators noted
that multivariate analysis indicated that SH
mitigated the beneficial effect of intensive
treatment. I believe that the high rate of SH
in the intensively treated group of the second
Leuven trial explains why this study was only
“equivocally positive,” instead of unequivo-
cally positive as with their first trial.
Two other recent studies were discontin-
ued before completion of patient enrollment
and therefore can be considered failed trials,
not necessarily refutations of the beneficial
effect of TGC. The VISEP trial was a multi-
center European trial of TGC and fluid resus-
citation strategies, with a 2X2 design (creat-
ing four separate treatment groups) among
patients with septic shock5. The final results
are not available; the study was discontinued
prematurely because of an excessive rate of
SH in the TGC group (12.1% vs. 2.1%). The
GLUCONTROL trial was another multi-center
European study performed in medical and
surgical ICUs6. The results of this study have
also not been published, and it was also termi-
nated prematurely because of unacceptable
rate of protocol violations and SH.
A detailed review of the risk factors for
the development of SH and the clinical con-
sequences of SH has just been completed
in a cohort of 5,365 patients admitted con-
secutively to our ICU7. Two separate analyses
confirmed that a single occurrence of SH
conferred increased risk of mortality. A case
control study matched 102 index cases with
SH to 306 controls, using APACHE II score,
age, diabetic status, diagnostic category and
era of treatment (historic vs. TGC) as matching
parameters. Mortality was significantly higher
in the 102 patients with SH than in their 306
matched controls (Table 1). A multi-variate
regression analysis controlling for these same
factors yielded the same conclusion (Table
1). However, a sensitivity analysis indicated
that TGC would still be beneficial even with
a quadrupling of the baseline rate of SH rate
and an associated doubling of the mortality
percentage attributable to SH.
Recognition of the relevant risk factors
is crucial to avoid deleterious SH. The most
important include severity of illness, the pres-
ence of renal failure (delayed clearance of
insulin), sepsis and liver failure (impaired glu-
coneogenesis), discontinuation of source of
calories with continuation of insulin therapy
and diabetes.
The rate of SH in our ICU was 0.28% among
patients in the pre-TGC historic era and 0.35%
among patients treated with the 80-140 mg/
dL target. In January 2005, the nurses initi-
ated a reduction in the glycemic treatment
threshold to 125 mg/dL, because they were
comfortable with the protocol and wanted
Table1. A Single Episode of Severe Hypoglycemia (Glucose < 40 mg/dL)
Increases Risk of Mortality
• Multiple logistic regression analysis
– Model included APACHE II score with age component deleted, age,
diabetic status, septic shock, mechanical ventilation, renal insufficiency,
treatment era
OR 2.28 (1.41 - 2.70)
p = 0.0008
• Case: control study (1:3)
– Matched for APACHE II score with age component deleted, age,
diagnostic category, treatment era
Mortality rate: 55.9% vs. 39.5%
p = 0.0057
7th Invited Conference: Implementation of Tight Glycemic Control at Stamford Hospital
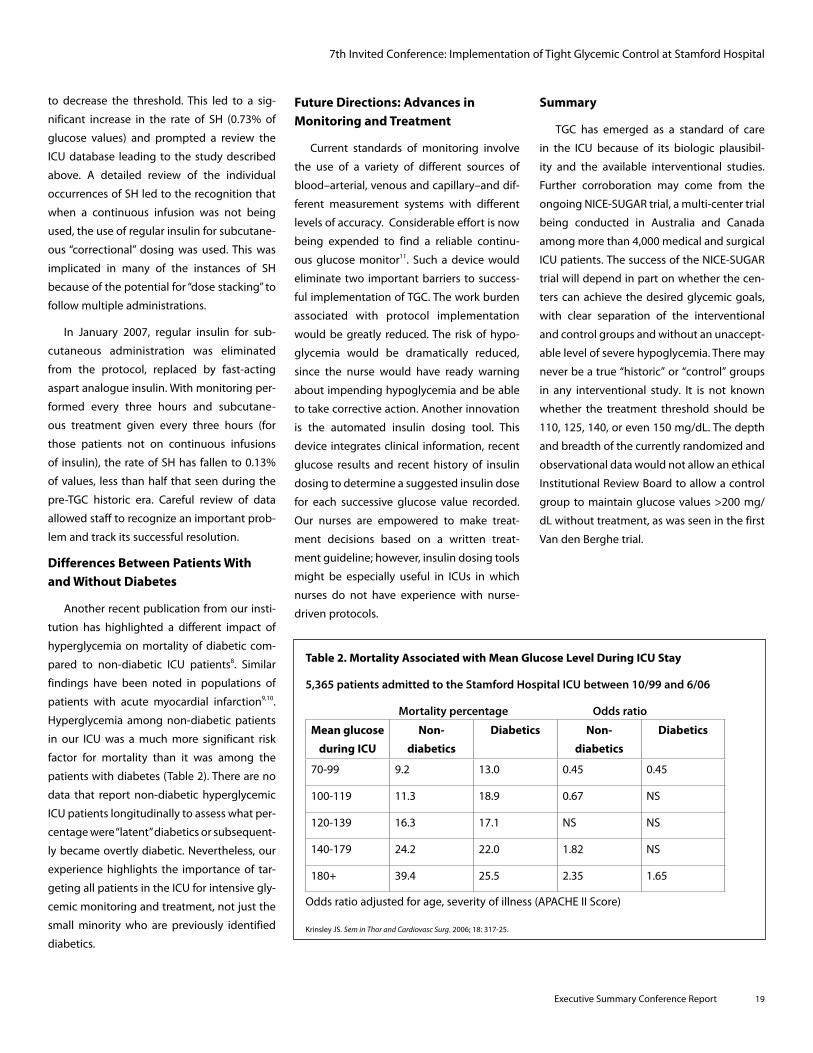
Executive Summary Conference Report 19
Future Directions: Advances in Monitoring and Treatment
Current standards of monitoring involve
the use of a variety of different sources of
blood–arterial, venous and capillary–and dif-
ferent measurement systems with different
levels of accuracy. Considerable effort is now
being expended to find a reliable continu-
ous glucose monitor11. Such a device would
eliminate two important barriers to success-
ful implementation of TGC. The work burden
associated with protocol implementation
would be greatly reduced. The risk of hypo-
glycemia would be dramatically reduced,
since the nurse would have ready warning
about impending hypoglycemia and be able
to take corrective action. Another innovation
is the automated insulin dosing tool. This
device integrates clinical information, recent
glucose results and recent history of insulin
dosing to determine a suggested insulin dose
for each successive glucose value recorded.
Our nurses are empowered to make treat-
ment decisions based on a written treat-
ment guideline; however, insulin dosing tools
might be especially useful in ICUs in which
nurses do not have experience with nurse-
driven protocols.
Summary
TGC has emerged as a standard of care
in the ICU because of its biologic plausibil-
ity and the available interventional studies.
Further corroboration may come from the
ongoing NICE-SUGAR trial, a multi-center trial
being conducted in Australia and Canada
among more than 4,000 medical and surgical
ICU patients. The success of the NICE-SUGAR
trial will depend in part on whether the cen-
ters can achieve the desired glycemic goals,
with clear separation of the interventional
and control groups and without an unaccept-
able level of severe hypoglycemia. There may
never be a true “historic” or “control” groups
in any interventional study. It is not known
whether the treatment threshold should be
110, 125, 140, or even 150 mg/dL. The depth
and breadth of the currently randomized and
observational data would not allow an ethical
Institutional Review Board to allow a control
group to maintain glucose values >200 mg/
dL without treatment, as was seen in the first
Van den Berghe trial.
to decrease the threshold. This led to a sig-
nificant increase in the rate of SH (0.73% of
glucose values) and prompted a review the
ICU database leading to the study described
above. A detailed review of the individual
occurrences of SH led to the recognition that
when a continuous infusion was not being
used, the use of regular insulin for subcutane-
ous “correctional” dosing was used. This was
implicated in many of the instances of SH
because of the potential for “dose stacking” to
follow multiple administrations.
In January 2007, regular insulin for sub-
cutaneous administration was eliminated
from the protocol, replaced by fast-acting
aspart analogue insulin. With monitoring per-
formed every three hours and subcutane-
ous treatment given every three hours (for
those patients not on continuous infusions
of insulin), the rate of SH has fallen to 0.13%
of values, less than half that seen during the
pre-TGC historic era. Careful review of data
allowed staff to recognize an important prob-
lem and track its successful resolution.
Differences Between Patients With and Without Diabetes
Another recent publication from our insti-
tution has highlighted a different impact of
hyperglycemia on mortality of diabetic com-
pared to non-diabetic ICU patients8. Similar
findings have been noted in populations of
patients with acute myocardial infarction9,10.
Hyperglycemia among non-diabetic patients
in our ICU was a much more significant risk
factor for mortality than it was among the
patients with diabetes (Table 2). There are no
data that report non-diabetic hyperglycemic
ICU patients longitudinally to assess what per-
centage were “latent” diabetics or subsequent-
ly became overtly diabetic. Nevertheless, our
experience highlights the importance of tar-
geting all patients in the ICU for intensive gly-
cemic monitoring and treatment, not just the
small minority who are previously identified
diabetics.
Table 2. Mortality Associated with Mean Glucose Level During ICU Stay
5,365 patients admitted to the Stamford Hospital ICU between 10/99 and 6/06
Mortality percentage Odds ratio
Mean glucose
during ICU
Non-
diabetics
Diabetics Non-
diabetics
Diabetics
70-99 9.2 13.0 0.45 0.45
100-119 11.3 18.9 0.67 NS
120-139 16.3 17.1 NS NS
140-179 24.2 22.0 1.82 NS
180+ 39.4 25.5 2.35 1.65
Odds ratio adjusted for age, severity of illness (APACHE II Score)
Krinsley JS. SeminThorandCardiovascSurg. 2006; 18: 317-25.
7th Invited Conference: Implementation of Tight Glycemic Control at Stamford Hospital
20 Executive Summary Conference Report
References
1. Van den Berghe G, Wouters P, Weekers F, et al. Intensive insulin therapy in critically ill patients.NEnglJMed 2001; 345:1359-67.
2. Krinsley JS. Association between hyperglycemia and increased hospital mortality in a heteroge-neous population of critically ill patients. MayoClinicProc 2003; 78:1471-8.
3. Krinsley JS. The effect of an intensive glucose man-agement protocol on the mortality of critically ill adult patients. MayoClinicProc 2004; 79:992-1000.
4. Van den Berghe G, Wilmer A, Hermans G, et al. Intensive insulin therapy in the medical ICU. NEnglJMed 2006; 354:449-61.
5. Brunkhorst FM, Kuhnt E, Engel C, et al. Intensive insulin therapy in patients with severe sepsis and septic shock is associated with an increased rate of hypoglycemia–results from a randomized mul-ticenter study (VISEP). Infection 2005; 33(S1): 19.
6. Glucontrol study. Available online at: http://www.glucontrol.org/
7. Krinsley JS, Grover A. Severe hypoglycemia in critically ill patients: Risk factors and outcomes. CritCareMed. 2007;35:2262-7 .
8. Krinsley JS. Glycemic control, diabetic status and mortality in a heterogeneous population of criti-cally ill patients before and during the era of tight glycemic control. Seminars inThorandCardiovascSurg 2006;18:317-25.
9. Sala J, Masia R, Gonzalez de Molina, et al. Short-term mortality of myocardial infarction patients with diabetes or hyperglycaemia during admission. JEpidemiolCommHealth 2002; 56:707-12.
10. Capes SE, Hunt D, Malmberg K, Gerstein HC. Stress hyperglycaemia and increased risk of death after myocardial infarction in patients with and without diabetes: a systematic overview. Lancet 2000; 355:773-8.
11. Krinsley JS, Zheng, P, Hall D et al. ICU validation of the OptiScanner, a continuous glucose monitoring device. CritCareMed 2006; 34:A67.
7th Invited Conference: Implementation of Tight Glycemic Control at Stamford Hospital
Executive Summary Conference Report 21
PROCEEDINGS
Meta-analysis of Randomized Trials of Tight Glycemic Control
Anastassios G. Pittas, MD, MS, Associate Professor of Medicine, Tufts-New England Medical Center, Boston, MA
Key points
• Theresultsofobservationalstudiesshowthatin-hospitalhyperglycemiaisanindependent
riskfactorforadverseoutcomes,includingmortality.
• Asingle-centerrandomizedtrialfoundthattightglycemiccontrolwithinsulinimproves
mortalityandmorbidityinthesurgicalintensivecareunit;benefitinotherhospitalsettings
hasnotbeenestablishedbyrandomizedtrials.
• Cliniciansshouldaimforapre-prandialglucoseconcentration<150mg/dLinmost
hospitalizedpatients,withstricterglucosegoalsinthecriticallyillpatient,especiallyamong
patientswithcardiacdisease.
Hyperglycemia is a common occurrence
in the critically ill patient. Historically, in-
hospital hyperglycemia, especially of new
onset, has been seen as an adaptive response
to heightened medical stress and considered
a marker of illness severity rather than a
distinct medical entity that requires manage-
ment. Recent evidence, however, challenges
that notion. Several observational studies
have established that in-hospital hyperglyce-
mia is an independent risk factor for adverse
outcomes, including mortality, particularly
in critically ill patients with known diabetes
but also in those with new-onset hyperglyce-
mia. Recently, several randomized trials have
tested the hypothesis that lowering glycemia
in hospitalized patients would improve out-
comes, but with conflicting results. Here I
summarize the evidence from these trials.
Early Trials
Experimentally, the concept of altering
glycemia in hospitalized patients to affect
outcomes was first introduced in the 1960s
when an infusion of glucose, insulin and
potassium (GIK) was developed as a potential
therapy to improve cardiac-related outcomes
following acute myocardial infarction (AMI).
Over the next 30 years multiple small inter-
vention studies with GIK were completed
with conflicting results that could be due, at
least in part, to the differences in the various
regiments used.
Large Intervention Studies
The first large intervention study with a
glucose-insulin infusion aiming at euglyce-
mia was the DIGAMI study, which random-
ized patients with diabetes and AMI to either
‘routine’ therapy or intensive therapy with
glucose-insulin infusion for 48 hours with a
glucose goal less than 10 mmol/L, followed
by subcutaneous insulin therapy1. Although
there was no short-term statistically signifi-
cant benefit with intensive insulin-glucose
therapy, at one year the latter group had
a relative mortality reduction of 26% com-
pared to the control group.
The DIGAMI study was the first to provide
concrete evidence that controlling glycemia
in hospitalized patients may improve out-
comes. However, it was not until 1991, when
the results of a study by Van den Berghe et
al. were published, that hyperglycemia and
its therapy with insulin in the critically ill
became of great interest to clinicians2. Van
den Berghe et al. conducted a randomized
controlled trial where patients admitted
to the surgical intensive care unit (ICU), of
which 63% had cardiac surgery, received
either ‘routine’ therapy or intensive insulin
therapy (IIT) aiming at tight glycemic con-
trol (TGC). The results were remarkable: IIT
resulted in a blood glucose (BG) level of 103
mg/dL vs. 153 mg/dL in the control group
and significantly reduced in-hospital mortal-
ity and morbidity (see Table in Appendix).
Since then, three large studies with insu-
lin therapy in hospitalized patients were
published with neutral results.
• TheCREATE-ECLAstudywasaninterna-
tional trial of patients with AMI, who were
randomized upon hospital admission to
receive either GIK infusion for 24 hours
(without a glucose target) or usual care3.
No difference on mortality or morbidity
was seen with the GIK infusion.
• TheDIGAMI-2studytriedtodistinguish
the short-term from the long-term ben-
efits of an insulin-based glucose manage-
ment protocol in patients hospitalized for
AMI by randomizing patients into three
groups (Table in Appendix)4. There were
7th Invited Conference: Meta-analysis of Randomized Trials of Tight Glycemic Control
22 Executive Summary Conference Report
no differences in mortality or morbidity
among the three groups. This study was
underpowered by not meeting enroll-
ment numbers and did not achieve its
treatment goals.
The results of the CREATE-ECLA and
DIGAMI-2 trials suggest that insulin ther-
apy without targeting euglycemia prob-
ably has no effect on outcomes.
• ThethirdstudywasconductedbyVan
den Berghe et al. in patients in the medi-
cal ICU and followed a protocol identical
to the surgical intensive care study by the
same investigators5. Overall, there was no
benefit of IIT reduced BG levels but did
not significantly reduce in-hospital mor-
tality (40% vs. 37% in the conventional
vs intensive group, respectively). Among
patients who stayed in the ICU for less
than three days, mortality was greater
among those receiving intensive therapy.
In contrast, among patients who stayed in
the ICU for three or more days, in-hospital
mortality was reduced from 53% to 43%
with IIT.
Updated Review and Meta-analysis of Randomized Trials
My colleagues and I recently conducted
a systematic review and meta-analysis of
randomized trials to determine the effect on
mortality of insulin therapy initiated during
hospitalization in patients with critical illness
defined as AMI, stroke, cardiac surgery or an
illness requiring a stay in the ICU6. I updated
the search and analyses for this conference.
The search revealed 41 published ran-
domized trials (n=32,573 patients) that have
employed an insulin regimen, including GIK,
and reported data on mortality. Combining
results from all 41 trials, there was a trend that
insulin therapy decreased short-term mortal-
ity (Relative Risk 09.94 [95% CI, 0.85-1.03]).
After combining data from studies that used
a non-GIK insulin regimen, the relative risk
for mortality remained essentially unchanged
(Relative Risk 0.92 [95% CI, 0.74-1.15]). It is
interesting to note that since the positive
results in the surgical ICU reported by Van de
Berghe et al. in 2001, 14 trials with a variety of
insulin regimens, including GIK, in hospital-
ized patients have been published, and none
of them have shown a statistically significant
benefit for insulin therapy. Two randomized
trials (VISEP and Glucontrol) whose results
are pending were stopped early because of
frequent hypoglycemia (these are discussed
elsewhere in these Proceedings).
Conclusion
There is general agreement that improved
glycemic control should be an important
component of care in the hospitalized patient.
Although the evidence supports TGC in cardi-
ac patients in the surgical ICU, currently there
is not enough evidence from randomized
trials to recommend the same degree of strict
glycemic control in all hospitalized patients.
Until further evidence becomes available, it
is prudent for clinicians to aim for a pre-pran-
dial blood glucose concentration less than
150 mg/dL in all hospitalized patients, with
stricter blood glucose goals in the critically
ill patient, especially among patients with
cardiac disease.
References
1. Malmberg K, Ryden L, Efendic S, et al. Randomized trial of insulin-glucose infusion followed by sub-cutaneous insulin treatment in diabetic patients with acute myocardial infarction (DIGAMI study): effects on mortality at 1 year. JAmCollCardioL Jul 1995;26(1):57-65.
2. Van den Berghe G, Wouters P, Weekers F, et al. Intensive insulin therapy in critically ill patients. NEnglJMed 2001;345(19):1359-67.
3. Mehta SR, Yusuf S, Diaz R, et al. Effect of glucose-insulin-potassium infusion on mortality in patients with acute ST-segment elevation myocardial infarc-tion: the CREATE-ECLA randomized controlled trial. JAmerMedAssn Jan 26 2005;293(4):437-46.
4. Malmberg K, Ryden L, Wedel H, et al. Intense meta-bolic control by means of insulin in patients with diabetes mellitus and acute myocardial infarction (DIGAMI 2): effects on mortality and morbidity. EurHeartJApr2005;26(7):650-61.
5. Van den Berghe G, Wilmer A, Hermans G, et al. Intensive insulin therapy in the medical ICU. NEnglJMed Feb 2 2006;354(5):449-61.
6. Pittas AG, Siegel RD, Lau J. Insulin therapy for critically ill hospitalized patients: a meta-analysis of randomized controlled trials.ArchInternMed Oct 11 2004;164(18):2005-11.
7th Invited Conference: Meta-analysis of Randomized Trials of Tight Glycemic Control
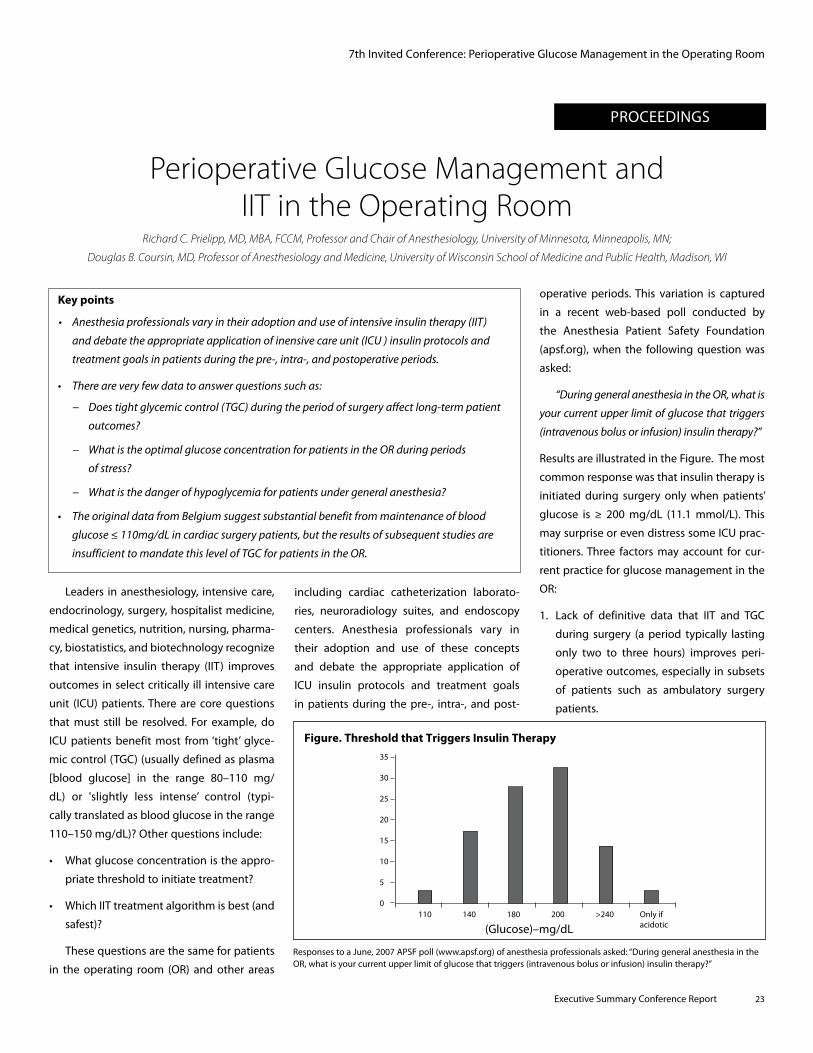
Executive Summary Conference Report 23
PROCEEDINGS
Key points
• Anesthesiaprofessionalsvaryintheiradoptionanduseofintensiveinsulintherapy(IIT)
anddebatetheappropriateapplicationofinensivecareunit(ICU)insulinprotocolsand
treatmentgoalsinpatientsduringthepre-,intra-,andpostoperativeperiods.
• Thereareveryfewdatatoanswerquestionssuchas:
− Doestightglycemiccontrol(TGC)duringtheperiodofsurgeryaffectlong-termpatient
outcomes?
− WhatistheoptimalglucoseconcentrationforpatientsintheORduringperiods
ofstress?
− Whatisthedangerofhypoglycemiaforpatientsundergeneralanesthesia?
• TheoriginaldatafromBelgiumsuggestsubstantialbenefitfrommaintenanceofblood
glucose≤110mg/dLincardiacsurgerypatients,buttheresultsofsubsequentstudiesare
insufficienttomandatethislevelofTGCforpatientsintheOR.
Perioperative Glucose Management and IIT in the Operating Room
Richard C. Prielipp, MD, MBA, FCCM, Professor and Chair of Anesthesiology, University of Minnesota, Minneapolis, MN;
Douglas B. Coursin, MD, Professor of Anesthesiology and Medicine, University of Wisconsin School of Medicine and Public Health, Madison, WI
Leaders in anesthesiology, intensive care,
endocrinology, surgery, hospitalist medicine,
medical genetics, nutrition, nursing, pharma-
cy, biostatistics, and biotechnology recognize
that intensive insulin therapy (IIT) improves
outcomes in select critically ill intensive care
unit (ICU) patients. There are core questions
that must still be resolved. For example, do
ICU patients benefit most from ‘tight’ glyce-
mic control (TGC) (usually defined as plasma
[blood glucose] in the range 80–110 mg/
dL) or 'slightly less intense’ control (typi-
cally translated as blood glucose in the range
110–150 mg/dL)? Other questions include:
• Whatglucoseconcentrationistheappro-
priate threshold to initiate treatment?
• WhichIITtreatmentalgorithmisbest(and
safest)?
These questions are the same for patients
in the operating room (OR) and other areas
including cardiac catheterization laborato-
ries, neuroradiology suites, and endoscopy
centers. Anesthesia professionals vary in
their adoption and use of these concepts
and debate the appropriate application of
ICU insulin protocols and treatment goals
in patients during the pre-, intra-, and post-
operative periods. This variation is captured
in a recent web-based poll conducted by
the Anesthesia Patient Safety Foundation
(apsf.org), when the following question was
asked:
“DuringgeneralanesthesiaintheOR,whatis
yourcurrentupperlimitofglucosethattriggers
(intravenousbolusorinfusion)insulintherapy?”
Results are illustrated in the Figure. The most
common response was that insulin therapy is
initiated during surgery only when patients’
glucose is ≥ 200 mg/dL (11.1 mmol/L). This
may surprise or even distress some ICU prac-
titioners. Three factors may account for cur-
rent practice for glucose management in the
OR:
1. Lack of definitive data that IIT and TGC
during surgery (a period typically lasting
only two to three hours) improves peri-
operative outcomes, especially in subsets
of patients such as ambulatory surgery
patients.
35
30
25
20
15
10
5
0
(Glucose)–mg/dL 110 140 180 200 >240 Only if acidotic
Responses to a June, 2007 APSF poll (www.apsf.org) of anesthesia professionals asked: “During general anesthesia in the OR, what is your current upper limit of glucose that triggers (intravenous bolus or infusion) insulin therapy?”
7th Invited Conference: Perioperative Glucose Management in the Operating Room
Figure. Threshold that Triggers Insulin Therapy
24 Executive Summary Conference Report
2. The uncertainty of the ideal blood glucose
target/goal in the OR (similar to the chal-
lenge and dilemma faced by ICU practitio-
ners).
3. The ill-defined danger of iatrogenic
hypoglycemia associated with IIT during
anesthesia, when the classic autonomic
and neurological signs and symptoms of
low blood glucose are masked or absent.
Implicit with this concern are the medico-
legal consequences of unintended hypo-
glycemia during anesthesia.
Factor # 1: Does TGC during the period of
surgery impact long-term patient outcomes?
There are very few data to guide glucose
management for patients who are in the
OR. Many anesthesia practitioners therefore
question whether it is appropriate to apply
data from pre-operative, post-operative, and
ICU periods to the relatively brief period of
surgery. Others think that data derived from
studies of specific ICU populations such as
those patients suffering MI, cerebral ischemia,
sepsis, or undergoing cardiac surgery are not
applicable to patients under general anes-
thesia having routine surgery lasting two to
three hours. A recent prospective, random-
ized, open-label, controlled study at the Mayo
Clinic of 400 cardiac surgery patients1 was
unable to demonstrate a benefit of IIT during
surgery.
The Mayo Clinic patients were random-
ized to tight intraoperative control utilizing
an insulin infusion to maintain blood glucose
between 80–100 mg/dL while in the OR, or
conventional treatment where they received
insulin only when blood glucose exceeded
200 mg/dL. All patients received the “standard
ICU insulin protocol” and achieved TGC within
four to six hours of arrival in the cardiac ICU.
Outcomes including hospital and ICU length
of stay (LOS) were identical for both groups
of patients. The IIT group had more deaths (4
vs. 0; p = 0.06), and more strokes (8 vs. 1; p =
0.02) than the conventional treatment group.
Although this was a modest-sized study, mor-
tality rates were less than half that reported
in the commonly discussed IIT ICU study by
Van den Berghe2. Van den Berghe wrote an
accompanying editorial suggesting that TGC
during the “brief” duration of OR care is insuf-
ficient to affect patient outcomes. Data from
other studies such as the Portland Diabetic
Project4 draw different conclusions. This non-
randomized, prospective, observational study
of 5,510 cardiac surgery patients found that
hyperglycemia in the first three post-opera-
tive days was an independent and robust pre-
dictor of mortality, sternal wound infections,
and increased LOS for patients with diabetes.
So, how do anesthesiology clinicians rec-
oncile this conflicting information? Until con-
clusive data are published, some anesthesia
practitioners suggest that routine glucose
management is sufficient for the OR, and it
is reasonable to delay TGC until the patient
arrives in the ICU. They note the ICU environ-
ment is ideally suited to engage multi-disci-
plinary teams to implement IIT protocols.
Until then the lack of definitive evidence-
based outcome data about intraoperative
glycemic control will result in variable prac-
tices for insulin therapy in the OR. The core
question remains as to whether two to three
hours of hyperglycemia in the OR constitutes
a critical risk which increases adverse patient
outcomes. As this discussion continues, it
is likely that intra-operative glucose man-
agement and IIT will be a component of
overall perioperative care, and maybe even a
benchmark for anesthesiology P4P (pay-for-
performance).
Factor # 2: What is the optimal glucose con-
centration for patients in the OR during peri-
ods of stress?
This question parallels the challenge facing
ICU practitioners. While it is widely recognized
that patient outcomes improve when glucose
is tightly controlled during ICU treatment for
certain subsets of hospitalized patients, it is
not clear that all patients derive these ben-
efits. An improvement has been documented
in complex cardiac surgery patients for whom
an aggressive IIT protocol was used for an
extended time after surgery. These results
have not been reconfirmed, however.
Factor # 3: What is the danger of hypoglyce-
mia for patients under general anesthesia?
Anesthesia professionals prefer to avoid
risk and are sensitive to the possibility of iat-
rogenic hypoglycemia when using IIT during
anesthesia. The usual autonomic and neu-
rological signs and symptoms of low blood
sugar are masked or absent during anes-
thesia. Little is known about the frequency,
severity and consequences of intraoperative
hypoglycemia. Hypoglycemia in awake out-
patients is defined as < 50 mg/dL in males
and < 40 mg/dL in females. The clinically rel-
evant symptoms associated with this degree
of hypoglycemia are summarized in Table 1.
Clinicians are naturally cautious when con-
ditions exist which blunt the usual responses
to hypoglycemia. Drugs such as anesthet-
ics and beta-blockers, various medical con-
ditions, or autonomic sympathetic hypo-re-
sponsiveness (termed “hypoglycemia-associ-
ated autonomic failure,” HAAF) can blunt the
physiologic response to low blood glucose,
and serious neuroglycopenia can occur in the
absence of changes in vital signs or observ-
able neurological symptoms.
The concern surrounding iatrogenic hypo-
glycemia is one factor limiting routine aggres-
sive glucose management in the OR. It is likely
that the sequelae of hypoglycemia are dura-
tion (time)–and “dose” (severity)–related. Low
glucose concentrations are associated with
predictable neurological dysfunction (Table
2). There is minimal permanent risk from a sin-
gle episode of hypoglycemia (blood glucose
≤ 40 mg/dL), providing it is diagnosed and
managed in a timely fashion. A recent study5
of a long-term, outpatient, intensive diabetic-
care algorithm showed that patients experi-
7th Invited Conference: Perioperative Glucose Management in the Operating Room
Executive Summary Conference Report 25
• Clinicalexperiencesuggeststhatasingle
episode of hypoglycemia (blood glucose
≤ 40 mg/dL) carries minimal risk if diag-
nosed and managed in a timely fashion.
The issue of hypoglycemia is still a con-
cern for the many anesthesia profession-
als. Patients with sepsis exhibit a much
higher risk of hypoglycemia and control of
their blood sugar is more difficult.
• Practitioners in both the OR and ICU
struggle with the question of what is the
necessary, appropriate and “ideal” glucose
target. The original cardiac surgery data
from Leuven, Belgium suggest substan-
tial benefit from maintenance of blood
glucose ≤ 110mg/dL. Current data appear
insufficient to mandate this level of TGC for
patients in the OR. A recent randomized
study in cardiac surgery patients found no
difference in ICU or hospital LOS despite
TGC throughout the operative period.
References
1. Gandhi GY, Nuttall GA, Abel MA, et al. Intensive intraoperative insulin therapy versus conventional glucose management during cardiac surgery: A randomized trial. AnnInternMed2007;146:233-43.
2. Van den Berghe G, et al. Intensive insulin therapy in critically ill patients. N Engl J Med 2001; 345: 1359-67.
3. Van den Berghe G. Does tight glycemic control dur-ing cardiac surgery improve patient outcome? AnnInternMed2007;146:307-8. Editorial.
4. Furnary AP, Wu Y. Clinical effects of hyperglycemia in the cardiac surgery population: the Portland Diabetic Project. Endocr Pract. 2006; 12 Suppl 3:22-6.
5. Jacobson AM, Musen, G, Ryan CM, et al. Long-term effects of diabetes and its treatment on cognitive function. NewEnglJMed2007;356:1842-52.
6. Kroll HR, Maher TR. Significant hypoglycemia sec-ondary to icodextrin peritoneal dialysate in a dia-betic patient. AnesthAnalg2007;104:1473-4.
7. Marik PE, Raghavan M. Stress-hyperglycemia, insu-lin and immunomodulation in sepsis. IntensiveCareMed 2004; 30:748-56.
enced frequent hypoglycemic episodes. The
extensive battery of neuropsychiatric tests,
however, found no difference in neurologi-
cal deficits between intensive and routine
diabetic care for study patients. In nearly two
decades, no adverse neurological sequelae
could be correlated with hypoglycemic epi-
sodes.
More data are needed to define the
minimal duration and severity of hypogly-
cemia that constitutes “neurological risk” for
patients in the OR (where brain temperature
may be an important co-variate, for example).
This information will define the optimal time
increment between blood sugar determina-
tions for patients who are receiving IIT under
general anesthesia. This is important because
additional variables such as blood sampling
site (venous vs. capillary vs. arterial), anemia,
and confounding substrates may lead to spu-
rious glucose determinations7.
A Summary of Perioperative Glucose Management
Conclusions about perioperative glucose
management include:
• Theprevalenceoftype2diabetesmellitus
is increasing rapidly.
• TGC requires an interdisciplinary team
approach, a culture of safety and a focus
on professional education. Benchmarks to
evaluate effectiveness are needed.
• It is important tonote thatperioperative
hyperglycemia occurring in “non-diabet-
ics” may actually indicate undiagnosed
type 2 diabetes that may result in increased
morbidity and mortality. Providers should
consider hemoglobin A1c determinations
in these patients to direct optimal meta-
bolic management and potentially alter
the timing of procedural intervention, par-
ticularly for elective surgeries such as joint
replacement, spine surgery or bariatric
procedures.
• It isnowbeing recognized that insulin is
appropriate therapy for all acute stress
and perioperative hyperglycemia. The
treatment of patients who do not have
diabetes but become hyperglycemic may
achieve the greatest benefit with appro-
priate treatment.
Table 1: Signs and Symptoms of
Hypoglycemia in Awake Patients
Behavior/mood alterations
– Emotional lability
– Irritability
Physical Symptoms
– Diaphoresis
– Tremor
– Paresthesia
– Tachycardia
Neuroglycopenic Signs and Symptoms
– Hypothermia
– Weakness
– Fatigue
– Slurred speech
– Loss of consciousness (LOC)
– Hemiparesis
– Seizures
– Brain damage
Table 2: Neurological Consequences of Hypoglycemia
Blood sugar below 45 mg/dL = neuroglycopenia
– Altered mentation, eventually leading to seizures,
unconsciousness and coma
Below 36 mg/dL = EEG changes
– EEG changes persist even after restoration of plasma sugar
Below 18 mg/dL = neuronal necrosis likely
7th Invited Conference: Perioperative Glucose Management in the Operating Room
PROCEEDINGS
26 Executive Summary Conference Report
Economic Advantages of Tight Glycemic Control
Judith Jacobi, PharmD, FCCM, FCCP, BCPS, Critical Care Pharmacist, Methodist Hospital/Clarian Health, Indianapolis, IN
Key points
• Measuresofimportanceinevaluatingtheeconomicimpactoftightglycemiccontrol(TGC)
includeclinicaloutcomes,mortalityandmorbidity,reductioninlengthofstay,equipment
utilizationandpersonneltime.
• StudieshaveshownthatachievingTGCreducesintensivecareunit-relatedcomplications
andlengthofstaycomparedwithconventionalglycemicmanagementthatproduces
highermeanglucosevaluesof150-170mg/dL.
• Thedegreeofcostsavingmayvarywithotherpatientpopulationsandwithotherglycemic
managementprograms,dependingonthebaselinecomplicationrateandtheeffectiveness
andsafetyoftheTGCprotocol;however,outcomeandeconomicbenefitsofTGCappearto
besignificantandpositive.
Evaluation of the economic impact of any
intervention in the critical care unit is a com-
plex proposition. Many overhead expenses
are fixed in a technology-rich environment.
However, there have been several reports
examining the potential impact of tight gly-
cemic control (TGC) in critical care.
The economic measures of importance
include clinical outcomes, mortality and mor-
bidity, length of stay, equipment utilization
and personnel time. A reduction in mortal-
ity is the most important clinical outcome;
however, it can lead to additional expenses
if associated with a longer intensive care
unit (ICU) length of stay (LOS) or additional
therapeutic interventions. The large trials of
tight TGC have also demonstrated significant
reductions in morbidity1,2.
The two large clinical trials from Leuven,
Belgium demonstrated significant absolute
mortality reduction of at least 3% to 4% in all
patients and above 7% in surgical intensive
care (SICU) patients and medical ICU (MICU)
patients who remained in the ICU for more
than 3 days3. A combined dataset from these
two trials demonstrated consistent benefits
in all subsets with the exception of patients
with diabetes who were previously treat-
ed with insulin, where a tendency toward
increased risk of death was suggested. While
the benefit on mortality may be progressive
as the glucose is lowered to normal ranges
of 80-110 mg/dL, achieving normoglycemia
appears essential to prevent renal failure and
critical-illness polyneuropathy4.
Specific morbidity measures have great
impact on cost analysis. TGC reduced ICU
and hospital LOS and, importantly, reduced
the percentage of patients requiring more
than two weeks of ICU care1. Reduction of
the duration of mechanical ventilation (MV)
and the need for prolonged ventilation is an
important contributor to more rapid ICU dis-
charge. The need for MV has a large impact on
ICU costs, as demonstrated by Dasta and col-
leagues5. Mean intensive care costs and LOS
were higher than for those not requiring MV.
Daily costs were greatest on day 1 ($10,794
versus $6,667 for MV vs. no MV, respectively)
and decreased daily, becoming stable after
day 3 ($3,968 vs. $3,184, respectively). The
mean incremental cost of MV was $1,522 per
day, although costs appear to be higher in
surgical and trauma patients than in medical
ICU patients.
Infectious complications are another
important contributor to hospital costs. The
importance of glucose control has been
shown by the Portland Diabetic Project.
Reductions in the three-day post-operative
average blood glucose (3BG) have been asso-
ciated with progressive reductions in deep
sternal wound infection (DSWI) and mortal-
ity6. The risk of post-cardiac bypass mortality
is doubled for each 50mg/dL increase in 3BG.
The reported 3.2% reduction in DSWI trans-
lates into a number needed to treat (NNT) of
31 diabetic patients to prevent 1 DSWI. The
cost of a DSWI was reported to be $81,0007.
The average cost per day in open heart sur-
gery patients has been reported to be as high
as $1,1508. In summary, actual cost saving per
patient is $2,613 and savings from reduced
length of stay is $3,150 per day, producing a
net saving of $5,580 ($138-$5,718) per patient
treated with the Portland Protocol6.
7th Invited Conference: Economic Advantages of Tight Glycemic Control
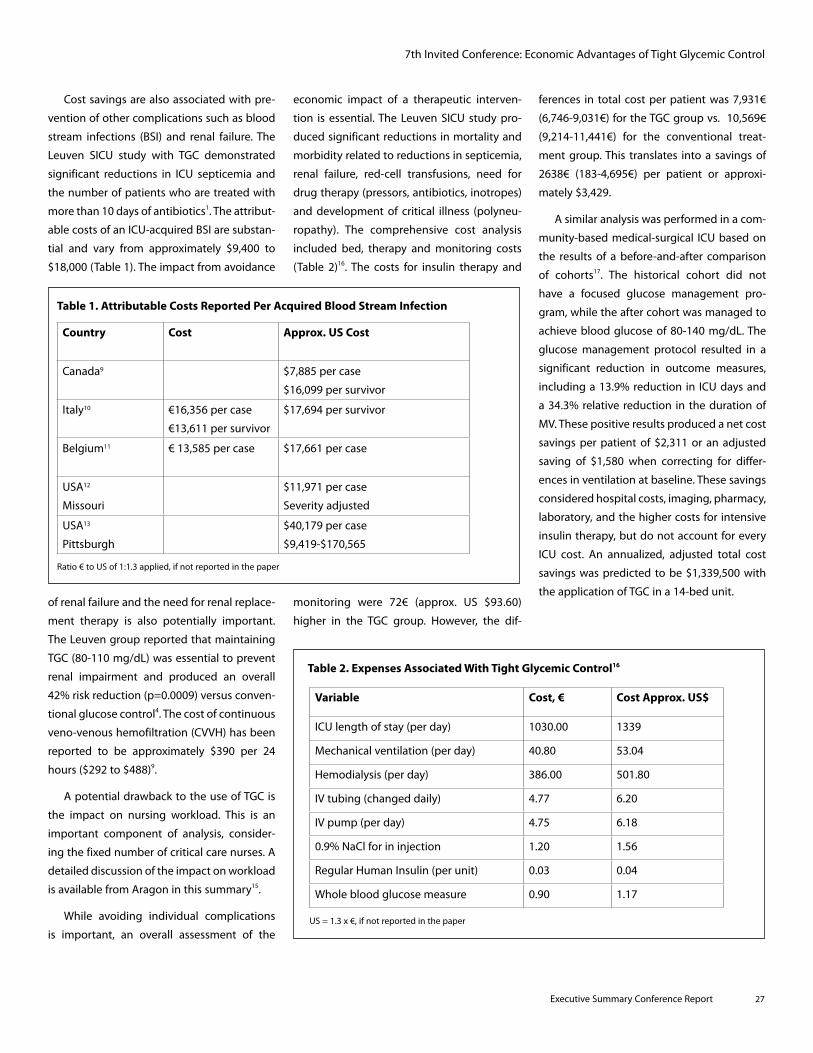
Executive Summary Conference Report 27
Cost savings are also associated with pre-
vention of other complications such as blood
stream infections (BSI) and renal failure. The
Leuven SICU study with TGC demonstrated
significant reductions in ICU septicemia and
the number of patients who are treated with
more than 10 days of antibiotics1. The attribut-
able costs of an ICU-acquired BSI are substan-
tial and vary from approximately $9,400 to
$18,000 (Table 1). The impact from avoidance
of renal failure and the need for renal replace-
ment therapy is also potentially important.
The Leuven group reported that maintaining
TGC (80-110 mg/dL) was essential to prevent
renal impairment and produced an overall
42% risk reduction (p=0.0009) versus conven-
tional glucose control4. The cost of continuous
veno-venous hemofiltration (CVVH) has been
reported to be approximately $390 per 24
hours ($292 to $488)9.
A potential drawback to the use of TGC is
the impact on nursing workload. This is an
important component of analysis, consider-
ing the fixed number of critical care nurses. A
detailed discussion of the impact on workload
is available from Aragon in this summary15.
While avoiding individual complications
is important, an overall assessment of the
economic impact of a therapeutic interven-
tion is essential. The Leuven SICU study pro-
duced significant reductions in mortality and
morbidity related to reductions in septicemia,
renal failure, red-cell transfusions, need for
drug therapy (pressors, antibiotics, inotropes)
and development of critical illness (polyneu-
ropathy). The comprehensive cost analysis
included bed, therapy and monitoring costs
(Table 2)16. The costs for insulin therapy and
monitoring were 72€ (approx. US $93.60)
higher in the TGC group. However, the dif-
ferences in total cost per patient was 7,931€
(6,746-9,031€) for the TGC group vs. 10,569€
(9,214-11,441€) for the conventional treat-
ment group. This translates into a savings of
2638€ (183-4,695€) per patient or approxi-
mately $3,429.
A similar analysis was performed in a com-
munity-based medical-surgical ICU based on
the results of a before-and-after comparison
of cohorts17. The historical cohort did not
have a focused glucose management pro-
gram, while the after cohort was managed to
achieve blood glucose of 80-140 mg/dL. The
glucose management protocol resulted in a
significant reduction in outcome measures,
including a 13.9% reduction in ICU days and
a 34.3% relative reduction in the duration of
MV. These positive results produced a net cost
savings per patient of $2,311 or an adjusted
saving of $1,580 when correcting for differ-
ences in ventilation at baseline. These savings
considered hospital costs, imaging, pharmacy,
laboratory, and the higher costs for intensive
insulin therapy, but do not account for every
ICU cost. An annualized, adjusted total cost
savings was predicted to be $1,339,500 with
the application of TGC in a 14-bed unit.
7th Invited Conference: Economic Advantages of Tight Glycemic Control
Country Cost Approx. US Cost
Canada9 $7,885 per case
$16,099 per survivor
Italy10 €16,356 per case
€13,611 per survivor
$17,694 per survivor
Belgium11 € 13,585 per case $17,661 per case
USA12
Missouri
$11,971 per case
Severity adjusted
USA13
Pittsburgh
$40,179 per case
$9,419-$170,565
Ratio € to US of 1:1.3 applied, if not reported in the paper
Table 1. Attributable Costs Reported Per Acquired Blood Stream Infection
Table 2. Expenses Associated With Tight Glycemic Control16
Variable Cost, € Cost Approx. US$
ICU length of stay (per day) 1030.00 1339
Mechanical ventilation (per day) 40.80 53.04
Hemodialysis (per day) 386.00 501.80
IV tubing (changed daily) 4.77 6.20
IV pump (per day) 4.75 6.18
0.9% NaCl for in injection 1.20 1.56
Regular Human Insulin (per unit) 0.03 0.04
Whole blood glucose measure 0.90 1.17
US = 1.3 x €, if not reported in the paper
28 Executive Summary Conference Report
Conclusion
Achieving TGC has been shown to reduce
ICU-related complications and LOS compared
with conventional glycemic management
that produces higher mean glucose values
of 150-170 mg/dL. The degree of cost sav-
ing may vary with other patient populations
and other glycemic management programs,
depending on the baseline complication rate
and the effectiveness and safety of the TGC
protocol, but outcome and economic ben-
efits of TGC appear to be significant and posi-
tive.
References
1. Van den Berghe G, Wouters P, Weekers F, et al. Intensive insulin therapy in critically ill patients. NEnglJMed 2001;345:1359-67.
2. Van den Berghe G, Wilmer A, Hermans G, et al. Intensive insulin therapy in medical ICU. N Engl JMed 2006;354:449-61.
3. Vanhorebeek I, Langouche L, Van den Berghe G. Tight blood glucose control with insulin in the ICU. Facts and controversies. Chest 2007;132:268-78.
4. Van den Berghe G, Wilmer A, Milants I, et al. Intensive insulin therapy in mixed medical/surgical intensive care units. Benefit versus harm. Diabetes 2006;55:3151-9.
5. Dasta JF, McLaughlin TP, Mody SH, Piech KT. Daily cost of an intensive care unit day: the contri-bution of mechanical ventilation. Crit Care Med 2005;33:1266-71.
6. Furnary AP, Wu X, Bookin SO. Effect of hypergly-cemia and continuous insulin infusions on out-comes of cardiac surgical procedures: The Portland Diabetic Project. Endocr Pract 2004;10(Suppl 2):21-3.
7. Cimochowski GE, Harostock MD, Brown R, et al. Intranasal mupirocin reduces sternal wound infec-tion after open heart surgery in diabetics and nondiabetics. AnnThoracSurg2001;71:1572-9.
8. Furnary AP, Gao G, Grunkemeier GL, et al. Continuous infusion insulin reduces mortality in patients with diabetes undergoing coronary artery bypass graft-ing. JThoracCardiovascSurg2003;125:1007-21.
9. Laupland KB, Lee H, Gregson DB, Manns BJ. Cost of intensive care unit-acquired bloodstream infec-tions. JHospInfect 2006;63:124-32.
10. Orsi GB, DiStefano L, Noah N. Hospital-acquired, laboratory-confirmed bloodstream infection: increased hospital stay and direct costs. InfControlHospEpidemiol 2002;23:190-7.
11. Blot SI, Depuydt P, Annemans L, et al. Clinical and economic outcomes in critically ill patients with nosocomial catheter-related bloodstream infec-tions. ClinInfectDis 2005;41:1591-8.
12. Warren DK, Quadir WW, Hollenbeak CS, et al. Attributable cost of catheter-associated bloodstream infections among intensive care patients in a nonteaching hospital. Crit CareMed2006;34:2084-9.
13. Pitts Shannon RP, Patel B, Cummins D, et al. Economics of central-line associated bloodstream infections. AmJMedQual 2006;21(Suppl):7s-16s.
14. Klarenbach SW, Pannu N, Tonelli MA, Manns BJ. Cost-effectiveness of hemofiltration to prevent contrast nephropathy in patients with chronic kid-ney disease. CritCareMed 2006;34:1044-51.
15. Aragon D, Evaluation of nursing work effort and perceptions about blood glucose testing in tight Glycemic control. AmJCritCare 2006;15:370-7.
16. Van den Berghe G, Wouters PJ, Kesteloot K, et al. Analysis of healthcare resource utilization with intensive insulin therapy in critically ill patients. CritCareMed2006;34:612-6.
17. Krinsley JS, Jones RL. Cost analysis of intensive Glycemic control in critically ill adult patients. Chest 2006;129:644-50.
7th Invited Conference: Economic Advantages of Tight Glycemic Control
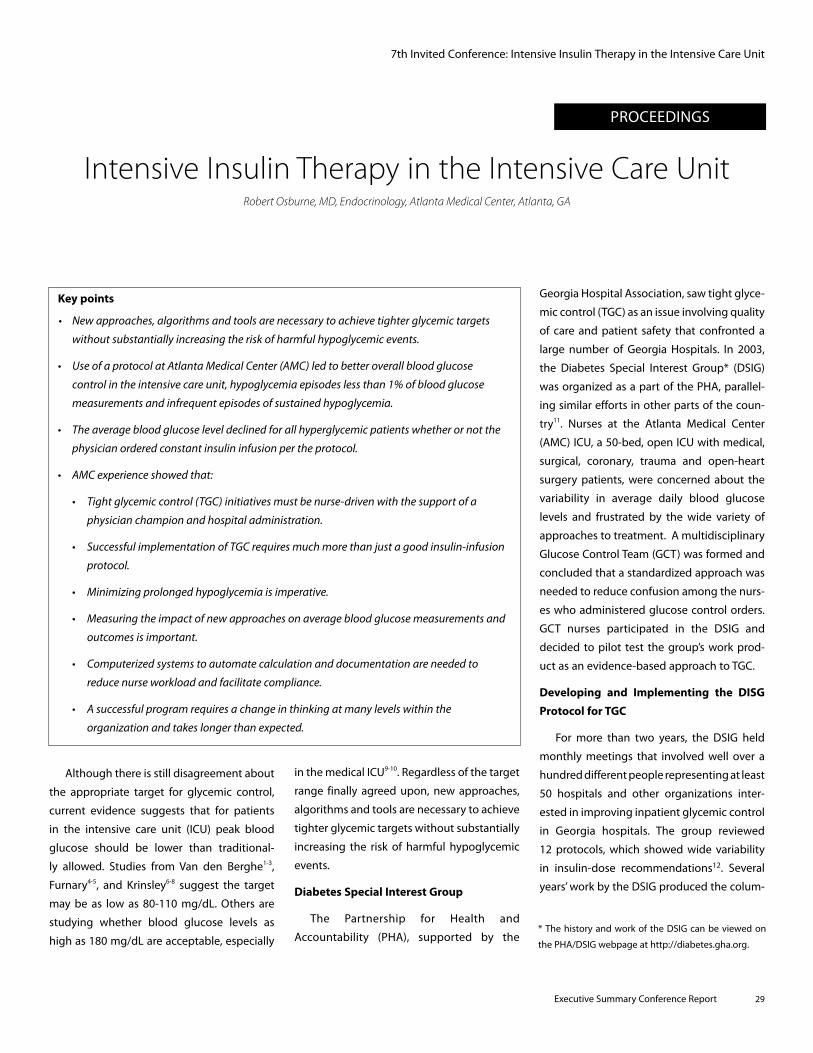
Executive Summary Conference Report 29
PROCEEDINGS
7th Invited Conference: Intensive Insulin Therapy in the Intensive Care Unit
Key points
• Newapproaches,algorithmsandtoolsarenecessarytoachievetighterglycemictargets
withoutsubstantiallyincreasingtheriskofharmfulhypoglycemicevents.
• UseofaprotocolatAtlantaMedicalCenter(AMC)ledtobetteroverallbloodglucose
controlintheintensivecareunit,hypoglycemiaepisodeslessthan1%ofbloodglucose
measurementsandinfrequentepisodesofsustainedhypoglycemia.
• Theaveragebloodglucoseleveldeclinedforallhyperglycemicpatientswhetherornotthe
physicianorderedconstantinsulininfusionpertheprotocol.
• AMCexperienceshowedthat:
• Tightglycemiccontrol(TGC)initiativesmustbenurse-drivenwiththesupportofa
physicianchampionandhospitaladministration.
• SuccessfulimplementationofTGCrequiresmuchmorethanjustagoodinsulin-infusion
protocol.
• Minimizingprolongedhypoglycemiaisimperative.
• Measuringtheimpactofnewapproachesonaveragebloodglucosemeasurementsand
outcomesisimportant.
• Computerizedsystemstoautomatecalculationanddocumentationareneededto
reducenurseworkloadandfacilitatecompliance.
• Asuccessfulprogramrequiresachangeinthinkingatmanylevelswithinthe
organizationandtakeslongerthanexpected.
Intensive Insulin Therapy in the Intensive Care UnitRobert Osburne, MD, Endocrinology, Atlanta Medical Center, Atlanta, GA
Although there is still disagreement about
the appropriate target for glycemic control,
current evidence suggests that for patients
in the intensive care unit (ICU) peak blood
glucose should be lower than traditional-
ly allowed. Studies from Van den Berghe1-3,
Furnary4-5, and Krinsley6-8 suggest the target
may be as low as 80-110 mg/dL. Others are
studying whether blood glucose levels as
high as 180 mg/dL are acceptable, especially
in the medical ICU9-10. Regardless of the target
range finally agreed upon, new approaches,
algorithms and tools are necessary to achieve
tighter glycemic targets without substantially
increasing the risk of harmful hypoglycemic
events.
Diabetes Special Interest Group
The Partnership for Health and
Accountability (PHA), supported by the
Georgia Hospital Association, saw tight glyce-
mic control (TGC) as an issue involving quality
of care and patient safety that confronted a
large number of Georgia Hospitals. In 2003,
the Diabetes Special Interest Group* (DSIG)
was organized as a part of the PHA, parallel-
ing similar efforts in other parts of the coun-
try11. Nurses at the Atlanta Medical Center
(AMC) ICU, a 50-bed, open ICU with medical,
surgical, coronary, trauma and open-heart
surgery patients, were concerned about the
variability in average daily blood glucose
levels and frustrated by the wide variety of
approaches to treatment. A multidisciplinary
Glucose Control Team (GCT) was formed and
concluded that a standardized approach was
needed to reduce confusion among the nurs-
es who administered glucose control orders.
GCT nurses participated in the DSIG and
decided to pilot test the group’s work prod-
uct as an evidence-based approach to TGC.
Developing and Implementing the DISG
Protocol for TGC
For more than two years, the DSIG held
monthly meetings that involved well over a
hundred different people representing at least
50 hospitals and other organizations inter-
ested in improving inpatient glycemic control
in Georgia hospitals. The group reviewed
12 protocols, which showed wide variability
in insulin-dose recommendations12. Several
years’ work by the DSIG produced the colum-
* The history and work of the DSIG can be viewed on
the PHA/DSIG webpage at http://diabetes.gha.org.
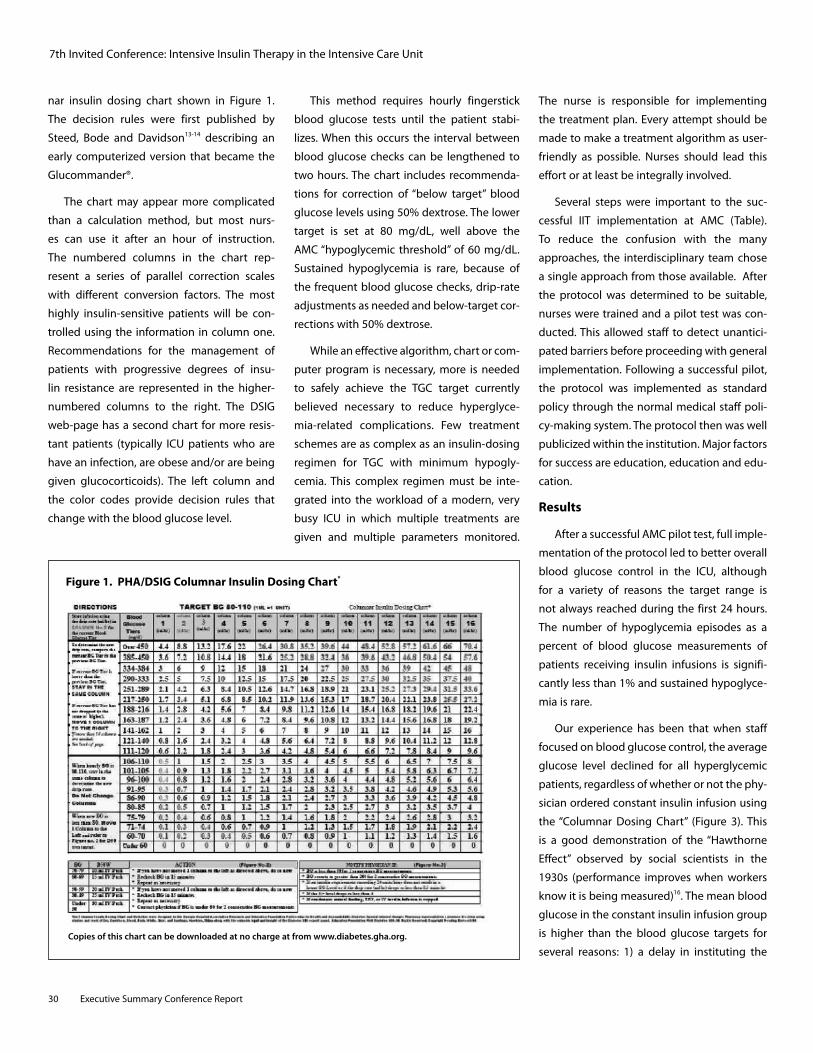
30 Executive Summary Conference Report
nar insulin dosing chart shown in Figure 1.
The decision rules were first published by
Steed, Bode and Davidson13-14 describing an
early computerized version that became the
Glucommander®.
The chart may appear more complicated
than a calculation method, but most nurs-
es can use it after an hour of instruction.
The numbered columns in the chart rep-
resent a series of parallel correction scales
with different conversion factors. The most
highly insulin-sensitive patients will be con-
trolled using the information in column one.
Recommendations for the management of
patients with progressive degrees of insu-
lin resistance are represented in the higher-
numbered columns to the right. The DSIG
web-page has a second chart for more resis-
tant patients (typically ICU patients who are
have an infection, are obese and/or are being
given glucocorticoids). The left column and
the color codes provide decision rules that
change with the blood glucose level.
This method requires hourly fingerstick
blood glucose tests until the patient stabi-
lizes. When this occurs the interval between
blood glucose checks can be lengthened to
two hours. The chart includes recommenda-
tions for correction of “below target” blood
glucose levels using 50% dextrose. The lower
target is set at 80 mg/dL, well above the
AMC “hypoglycemic threshold” of 60 mg/dL.
Sustained hypoglycemia is rare, because of
the frequent blood glucose checks, drip-rate
adjustments as needed and below-target cor-
rections with 50% dextrose.
While an effective algorithm, chart or com-
puter program is necessary, more is needed
to safely achieve the TGC target currently
believed necessary to reduce hyperglyce-
mia-related complications. Few treatment
schemes are as complex as an insulin-dosing
regimen for TGC with minimum hypogly-
cemia. This complex regimen must be inte-
grated into the workload of a modern, very
busy ICU in which multiple treatments are
given and multiple parameters monitored.
The nurse is responsible for implementing
the treatment plan. Every attempt should be
made to make a treatment algorithm as user-
friendly as possible. Nurses should lead this
effort or at least be integrally involved.
Several steps were important to the suc-
cessful IIT implementation at AMC (Table).
To reduce the confusion with the many
approaches, the interdisciplinary team chose
a single approach from those available. After
the protocol was determined to be suitable,
nurses were trained and a pilot test was con-
ducted. This allowed staff to detect unantici-
pated barriers before proceeding with general
implementation. Following a successful pilot,
the protocol was implemented as standard
policy through the normal medical staff poli-
cy-making system. The protocol then was well
publicized within the institution. Major factors
for success are education, education and edu-
cation.
Results
After a successful AMC pilot test, full imple-
mentation of the protocol led to better overall
blood glucose control in the ICU, although
for a variety of reasons the target range is
not always reached during the first 24 hours.
The number of hypoglycemia episodes as a
percent of blood glucose measurements of
patients receiving insulin infusions is signifi-
cantly less than 1% and sustained hypoglyce-
mia is rare.
Our experience has been that when staff
focused on blood glucose control, the average
glucose level declined for all hyperglycemic
patients, regardless of whether or not the phy-
sician ordered constant insulin infusion using
the “Columnar Dosing Chart” (Figure 3). This
is a good demonstration of the “Hawthorne
Effect” observed by social scientists in the
1930s (performance improves when workers
know it is being measured)16. The mean blood
glucose in the constant insulin infusion group
is higher than the blood glucose targets for
several reasons: 1) a delay in instituting the
7th Invited Conference: Intensive Insulin Therapy in the Intensive Care Unit
Figure 1. PHA/DSIG Columnar Insulin Dosing Chart*
Copies of this chart can be downloaded at no charge at from www.diabetes.gha.org.
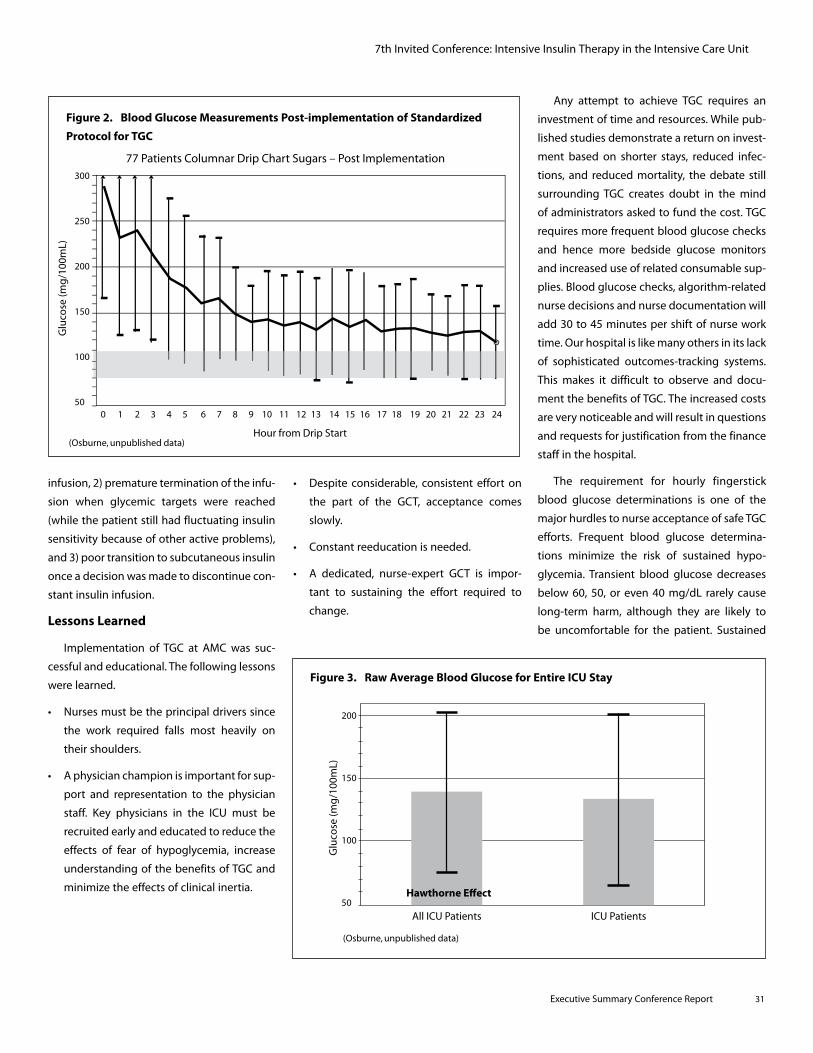
Executive Summary Conference Report 31
infusion, 2) premature termination of the infu-
sion when glycemic targets were reached
(while the patient still had fluctuating insulin
sensitivity because of other active problems),
and 3) poor transition to subcutaneous insulin
once a decision was made to discontinue con-
stant insulin infusion.
Lessons Learned
Implementation of TGC at AMC was suc-
cessful and educational. The following lessons
were learned.
• Nursesmustbetheprincipaldriverssince
the work required falls most heavily on
their shoulders.
• Aphysicianchampionisimportantforsup-
port and representation to the physician
staff. Key physicians in the ICU must be
recruited early and educated to reduce the
effects of fear of hypoglycemia, increase
understanding of the benefits of TGC and
minimize the effects of clinical inertia.
• Despite considerable, consistentefforton
the part of the GCT, acceptance comes
slowly.
• Constantreeducationisneeded.
• A dedicated, nurse-expert GCT is impor-
tant to sustaining the effort required to
change.
Any attempt to achieve TGC requires an
investment of time and resources. While pub-
lished studies demonstrate a return on invest-
ment based on shorter stays, reduced infec-
tions, and reduced mortality, the debate still
surrounding TGC creates doubt in the mind
of administrators asked to fund the cost. TGC
requires more frequent blood glucose checks
and hence more bedside glucose monitors
and increased use of related consumable sup-
plies. Blood glucose checks, algorithm-related
nurse decisions and nurse documentation will
add 30 to 45 minutes per shift of nurse work
time. Our hospital is like many others in its lack
of sophisticated outcomes-tracking systems.
This makes it difficult to observe and docu-
ment the benefits of TGC. The increased costs
are very noticeable and will result in questions
and requests for justification from the finance
staff in the hospital.
The requirement for hourly fingerstick
blood glucose determinations is one of the
major hurdles to nurse acceptance of safe TGC
efforts. Frequent blood glucose determina-
tions minimize the risk of sustained hypo-
glycemia. Transient blood glucose decreases
below 60, 50, or even 40 mg/dL rarely cause
long-term harm, although they are likely to
be uncomfortable for the patient. Sustained
7th Invited Conference: Intensive Insulin Therapy in the Intensive Care Unit
300
250
200
150
100
50
Hour from Drip Start(Osburne, unpublished data)
77 Patients Columnar Drip Chart Sugars – Post Implementation
Glu
cose
(mg
/100
mL)
0 1 2 3 4 5 6 7 8 9 10 11 12 13 14 15 16 17 18 19 20 21 22 23 24
Figure 2. Blood Glucose Measurements Post-implementation of Standardized
Protocol for TGC
200
150
100
50
All ICU Patients ICU Patients
(Osburne, unpublished data)
Glu
cose
(mg
/100
mL)
Hawthorne Eect
Figure 3. Raw Average Blood Glucose for Entire ICU Stay
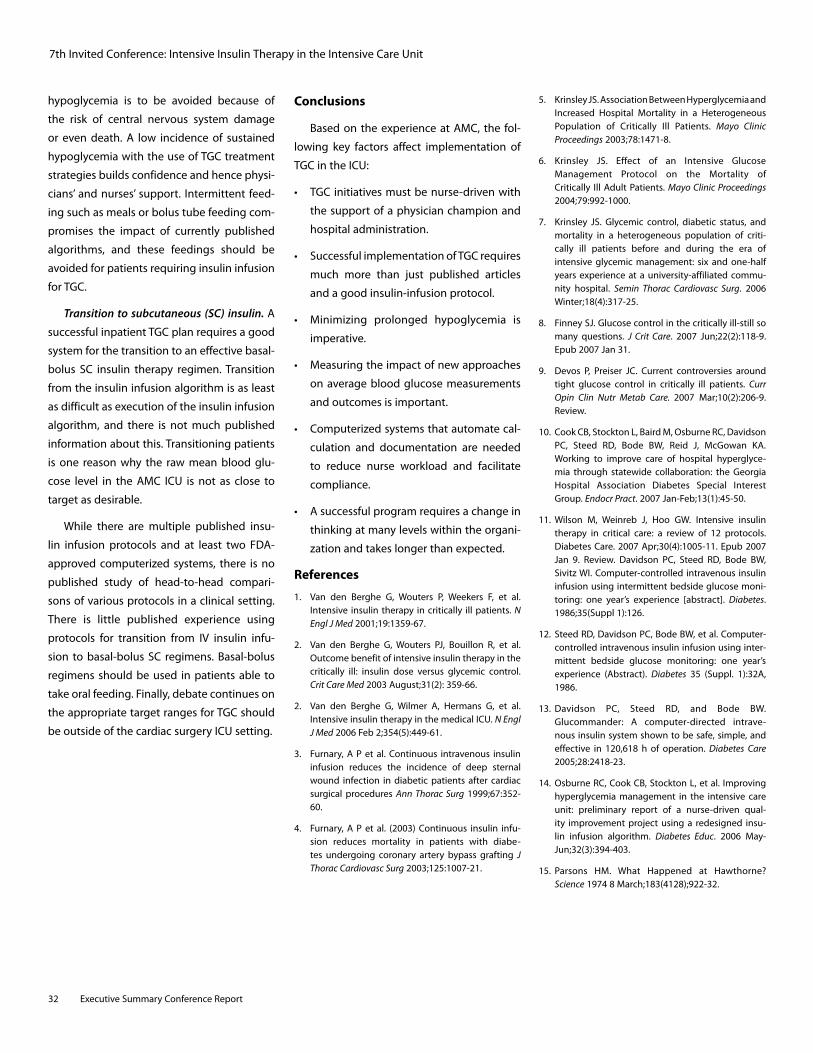
32 Executive Summary Conference Report
hypoglycemia is to be avoided because of
the risk of central nervous system damage
or even death. A low incidence of sustained
hypoglycemia with the use of TGC treatment
strategies builds confidence and hence physi-
cians’ and nurses’ support. Intermittent feed-
ing such as meals or bolus tube feeding com-
promises the impact of currently published
algorithms, and these feedings should be
avoided for patients requiring insulin infusion
for TGC.
Transition to subcutaneous (SC) insulin. A
successful inpatient TGC plan requires a good
system for the transition to an effective basal-
bolus SC insulin therapy regimen. Transition
from the insulin infusion algorithm is as least
as difficult as execution of the insulin infusion
algorithm, and there is not much published
information about this. Transitioning patients
is one reason why the raw mean blood glu-
cose level in the AMC ICU is not as close to
target as desirable.
While there are multiple published insu-
lin infusion protocols and at least two FDA-
approved computerized systems, there is no
published study of head-to-head compari-
sons of various protocols in a clinical setting.
There is little published experience using
protocols for transition from IV insulin infu-
sion to basal-bolus SC regimens. Basal-bolus
regimens should be used in patients able to
take oral feeding. Finally, debate continues on
the appropriate target ranges for TGC should
be outside of the cardiac surgery ICU setting.
Conclusions
Based on the experience at AMC, the fol-
lowing key factors affect implementation of
TGC in the ICU:
• TGC initiativesmustbenurse-drivenwith
the support of a physician champion and
hospital administration.
• SuccessfulimplementationofTGCrequires
much more than just published articles
and a good insulin-infusion protocol.
• Minimizing prolonged hypoglycemia is
imperative.
• Measuringtheimpactofnewapproaches
on average blood glucose measurements
and outcomes is important.
• Computerizedsystemsthatautomatecal-
culation and documentation are needed
to reduce nurse workload and facilitate
compliance.
• Asuccessfulprogramrequiresachangein
thinking at many levels within the organi-
zation and takes longer than expected.
References
1. Van den Berghe G, Wouters P, Weekers F, et al. Intensive insulin therapy in critically ill patients. NEnglJMed 2001;19:1359-67.
2. Van den Berghe G, Wouters PJ, Bouillon R, et al. Outcome benefit of intensive insulin therapy in the critically ill: insulin dose versus glycemic control. CritCareMed 2003 August;31(2): 359-66.
2. Van den Berghe G, Wilmer A, Hermans G, et al. Intensive insulin therapy in the medical ICU. NEnglJMed 2006 Feb 2;354(5):449-61.
3. Furnary, A P et al. Continuous intravenous insulin infusion reduces the incidence of deep sternal wound infection in diabetic patients after cardiac surgical procedures AnnThoracSurg 1999;67:352-60.
4. Furnary, A P et al. (2003) Continuous insulin infu-sion reduces mortality in patients with diabe-tes undergoing coronary artery bypass grafting JThoracCardiovascSurg 2003;125:1007-21.
5. Krinsley JS. Association Between Hyperglycemia and Increased Hospital Mortality in a Heterogeneous Population of Critically Ill Patients. Mayo ClinicProceedings 2003;78:1471-8.
6. Krinsley JS. Effect of an Intensive Glucose Management Protocol on the Mortality of Critically Ill Adult Patients. MayoClinicProceedings 2004;79:992-1000.
7. Krinsley JS. Glycemic control, diabetic status, and mortality in a heterogeneous population of criti-cally ill patients before and during the era of intensive glycemic management: six and one-half years experience at a university-affiliated commu-nity hospital. Semin Thorac Cardiovasc Surg. 2006 Winter;18(4):317-25.
8. Finney SJ. Glucose control in the critically ill-still so many questions. J Crit Care. 2007 Jun;22(2):118-9. Epub 2007 Jan 31.
9. Devos P, Preiser JC. Current controversies around tight glucose control in critically ill patients. CurrOpin Clin Nutr Metab Care. 2007 Mar;10(2):206-9. Review.
10. Cook CB, Stockton L, Baird M, Osburne RC, Davidson PC, Steed RD, Bode BW, Reid J, McGowan KA. Working to improve care of hospital hyperglyce-mia through statewide collaboration: the Georgia Hospital Association Diabetes Special Interest Group. EndocrPract. 2007 Jan-Feb;13(1):45-50.
11. Wilson M, Weinreb J, Hoo GW. Intensive insulin therapy in critical care: a review of 12 protocols. Diabetes Care. 2007 Apr;30(4):1005-11. Epub 2007 Jan 9. Review. Davidson PC, Steed RD, Bode BW, Sivitz WI. Computer-controlled intravenous insulin infusion using intermittent bedside glucose moni-toring: one year’s experience [abstract]. Diabetes. 1986;35(Suppl 1):126.
12. Steed RD, Davidson PC, Bode BW, et al. Computer-controlled intravenous insulin infusion using inter-mittent bedside glucose monitoring: one year’s experience (Abstract). Diabetes 35 (Suppl. 1):32A, 1986.
13. Davidson PC, Steed RD, and Bode BW. Glucommander: A computer-directed intrave-nous insulin system shown to be safe, simple, and effective in 120,618 h of operation. Diabetes Care 2005;28:2418-23.
14. Osburne RC, Cook CB, Stockton L, et al. Improving hyperglycemia management in the intensive care unit: preliminary report of a nurse-driven qual-ity improvement project using a redesigned insu-lin infusion algorithm. Diabetes Educ. 2006 May-Jun;32(3):394-403.
15. Parsons HM. What Happened at Hawthorne? Science 1974 8 March;183(4128);922-32.
7th Invited Conference: Intensive Insulin Therapy in the Intensive Care Unit
Executive Summary Conference Report 33
PROCEEDINGS
Use of a Computerized Algorithm in Patients Undergoing Cardiovascular Surgery: A Protocol for Tight Glycemic Control
Bruce W. Bode, MD, FACE, Atlanta Diabetes Associates, Atlanta, GA;
Member of the Diabetes Special Interest Group of the Georgia Hospital Association
7th Invited Conference: Use of a Computerized Algorithm in Patients Undergoing
Cardiovascular Surgery: A Protocol for Tight Glycemic Control
Key points
• Hospitalprotocolstocontrolglucosemustbesimpleanduser-friendly.
• Theseprotocolsshouldallowpatientswithhyperglycemiatobetreatedthesame,allowing
modificationandrefinementoftheprotocolonlywhennecessary.
• Therearetwoeffectivemethodsfornormalizingglucoseforhospitalizedpatients:
continuous,variable-rateintravenous(IV)insulininfusionsandbasalbolussubcutaneous
(SC)insulintherapy
• ComputerizedalgorithmsforIVinsulininfusionandtransitiontoSCinsulintherapyenable
standardizationthatcanminimizemedicalerrorsmadeininsulindosing.
• Theuseofacomputerizedprotocolforcardiovascularsurgerypatientsresultedin
near-normalglycemia(meanbloodglucose107mg/dL)withnobloodglucose<40mg/dL.
Introduction
Studies have shown the benefits and risks
of tight glycemic control (TGC) in hospitalized
patients, including the intensive care unit
(ICU)1-4. TGC methodologies can be difficult
to implement because they often require
complex, insulin-dosing formulas that are
restricted to the ICU, and highly skilled nurses
to work with only one or two patients at a
time. Severe hypoglycemia also can be a
problem with many intravenous (IV) insulin
protocols and has been shown to be an
independent risk factor for mortality5. In this
article, the methodology, results and benefits
of a computerized protocol in cardiovascular
(CV) patients undergoing bypass or valve
surgery are discussed.
The recommended goals for glyce-
mic control in the hospital vary slightly
between the American Association of Clinical
Endocrinologist (AACE) and the American
Diabetes Association (ADA). Both organi-
zations recommend a blood glucose level
< 110 mg/dL in the ICU. AACE recommends
< 110 mg/dL premeal with peak postprandial
< 180 mg/dL, while the ADA recommends
90-130 mg/dL premeal6.
To accomplish these goals while minimiz-
ing the risk of hypoglycemia, protocols can
be developed and implemented to screen
patients at high risk for hyperglycemia and
to modify and initiate insulin therapy when
needed. If a patient is acutely ill or unable
to eat, a continuous, variable-rate IV insulin
infusion based on hourly or more frequent
glucose measurements should be used. If a
patient is stable and able to eat, subcutane-
ous (SQ) basal bolus therapy can be used,
with blood glucose measured premeal, at
bedtime and at 0300. Transition from IV to SC
basal bolus insulin therapy should be done
with known or newly diagnosed patients
with diabetes who had pre-existing glycemia
based on an A1c > 6%. Discharge planning
should be done for all patients with diabe-
tes who have not received insulin before,
including those who are newly diagnosed.
Case-specific recommendations are made for
diabetes management at home.
Methodology
Based on the above goals, Piedmont
Hospital in Atlanta decided to implement
a TGC protocol in CV patients undergoing
bypass and valve surgery. This decision was
made after analysis of data from the preced-
ing six months that revealed that only 50% to
60% of CV patients had met the Institute for
Healthcare Improvemement’s goal of having
all blood glucose levels be < 200 mg/dL in the
24 hours post-surgery7. To achieve this goal,
a team of endocrinologists, nurses, pharma-
cists and educators met with a CV surgeon
every week for three months to develop the
protocol. All parties agreed to the following:
1. The protocol would be used for all patients,
so that all patients would be treated the
same.
2. Since CV patients are at high risk for hyper-
glycemia, upon arrival at the hospital all
patients would be screened for both A1c
and glucose.
3. If a patient were admitted > 24 hours
before surgery, a weight-based basal bolus
SQ insulin would be initiated if the A1c
were > 6% or the premeal blood glucose
was > 140 mg/dL. The weight-based for-
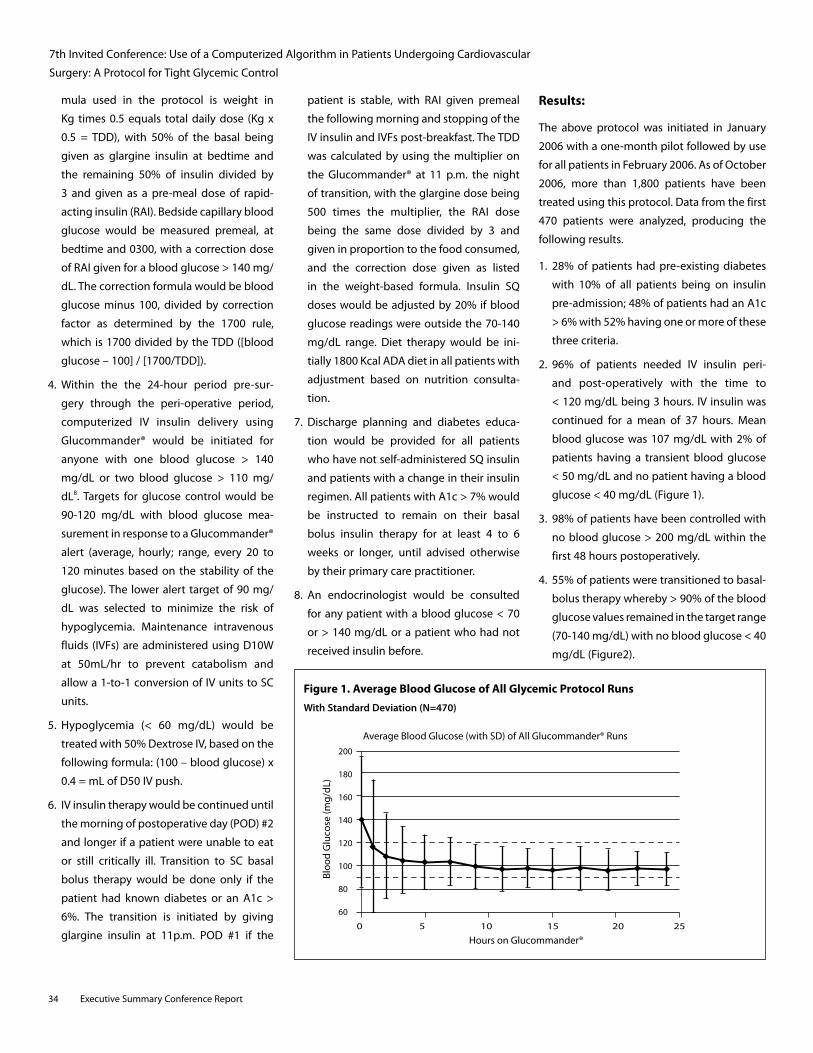
34 Executive Summary Conference Report
mula used in the protocol is weight in
Kg times 0.5 equals total daily dose (Kg x
0.5 = TDD), with 50% of the basal being
given as glargine insulin at bedtime and
the remaining 50% of insulin divided by
3 and given as a pre-meal dose of rapid-
acting insulin (RAI). Bedside capillary blood
glucose would be measured premeal, at
bedtime and 0300, with a correction dose
of RAI given for a blood glucose > 140 mg/
dL. The correction formula would be blood
glucose minus 100, divided by correction
factor as determined by the 1700 rule,
which is 1700 divided by the TDD ([blood
glucose – 100] / [1700/TDD]).
4. Within the the 24-hour period pre-sur-
gery through the peri-operative period,
computerized IV insulin delivery using
Glucommander® would be initiated for
anyone with one blood glucose > 140
mg/dL or two blood glucose > 110 mg/
dL8. Targets for glucose control would be
90-120 mg/dL with blood glucose mea-
surement in response to a Glucommander®
alert (average, hourly; range, every 20 to
120 minutes based on the stability of the
glucose). The lower alert target of 90 mg/
dL was selected to minimize the risk of
hypoglycemia. Maintenance intravenous
fluids (IVFs) are administered using D10W
at 50mL/hr to prevent catabolism and
allow a 1-to-1 conversion of IV units to SC
units.
5. Hypoglycemia (< 60 mg/dL) would be
treated with 50% Dextrose IV, based on the
following formula: (100 – blood glucose) x
0.4 = mL of D50 IV push.
6. IV insulin therapy would be continued until
the morning of postoperative day (POD) #2
and longer if a patient were unable to eat
or still critically ill. Transition to SC basal
bolus therapy would be done only if the
patient had known diabetes or an A1c >
6%. The transition is initiated by giving
glargine insulin at 11p.m. POD #1 if the
patient is stable, with RAI given premeal
the following morning and stopping of the
IV insulin and IVFs post-breakfast. The TDD
was calculated by using the multiplier on
the Glucommander® at 11 p.m. the night
of transition, with the glargine dose being
500 times the multiplier, the RAI dose
being the same dose divided by 3 and
given in proportion to the food consumed,
and the correction dose given as listed
in the weight-based formula. Insulin SQ
doses would be adjusted by 20% if blood
glucose readings were outside the 70-140
mg/dL range. Diet therapy would be ini-
tially 1800 Kcal ADA diet in all patients with
adjustment based on nutrition consulta-
tion.
7. Discharge planning and diabetes educa-
tion would be provided for all patients
who have not self-administered SQ insulin
and patients with a change in their insulin
regimen. All patients with A1c > 7% would
be instructed to remain on their basal
bolus insulin therapy for at least 4 to 6
weeks or longer, until advised otherwise
by their primary care practitioner.
8. An endocrinologist would be consulted
for any patient with a blood glucose < 70
or > 140 mg/dL or a patient who had not
received insulin before.
Results:
The above protocol was initiated in January
2006 with a one-month pilot followed by use
for all patients in February 2006. As of October
2006, more than 1,800 patients have been
treated using this protocol. Data from the first
470 patients were analyzed, producing the
following results.
1. 28% of patients had pre-existing diabetes
with 10% of all patients being on insulin
pre-admission; 48% of patients had an A1c
> 6% with 52% having one or more of these
three criteria.
2. 96% of patients needed IV insulin peri-
and post-operatively with the time to
< 120 mg/dL being 3 hours. IV insulin was
continued for a mean of 37 hours. Mean
blood glucose was 107 mg/dL with 2% of
patients having a transient blood glucose
< 50 mg/dL and no patient having a blood
glucose < 40 mg/dL (Figure 1).
3. 98% of patients have been controlled with
no blood glucose > 200 mg/dL within the
first 48 hours postoperatively.
4. 55% of patients were transitioned to basal-
bolus therapy whereby > 90% of the blood
glucose values remained in the target range
(70-140 mg/dL) with no blood glucose < 40
mg/dL (Figure2).
7th Invited Conference: Use of a Computerized Algorithm in Patients Undergoing Cardiovascular
Surgery: A Protocol for Tight Glycemic Control
200
180
160
140
120
100
80
60
220
200
180
160
140
120
100
80
60
40
Hours on Glucommander®
Hours after IV insulin
n=209
Last
GM
Lunc
hDin
ner
Bedt
ime
3:00
AM
Brea
kfas
t
Dinne
rBe
dtim
e
3:00
AM
Brea
kfas
t
Lunc
h
Dinne
r
Bedt
ime
Bedt
ime
3:00
AM
Lunc
h
Bloo
d G
luco
se (m
g/dL
)
Bloo
d G
luco
se (m
g/dL
)
Average Blood Glucose (with SD) of All Glucommander® Runs
0 5 10 15 20 25
0 8 16 24 32 40 48 56 64 72
Basal: Multiplier *500; CIR: 0.5/Multiplier; Correction Factor: 1.7/Multiplier
Figure 1. Average Blood Glucose of All Glycemic Protocol Runs
With Standard Deviation (N=470)

Executive Summary Conference Report 35
7th Invited Conference: Use of a Computerized Algorithm in Patients Undergoing
Cardiovascular Surgery: A Protocol for Tight Glycemic Control
5. 23% of patients were discharged with
home insulin therapy: > 90% of those were
discharged on basal-bolus therapy.
6. Nursing feedback after the first 60 days
was uniformly positive: the only major ini-
tial complaint was the frequency of glu-
cose monitoring while a patient is on IV
insulin. Complaints subsided after nurses
realized that patients had fewer infections
and shorter length of stay. Agency and
float nurses were able to learn the protocol
within their first shift on the CV ICU post-
operative unit or CV floor.
7. Physician acceptance of the protocol has
been uniformly positive with no criticisms
or complaints.
8. Post-operative length of stay was reduced
by 0.8 days for an estimated annual savings
of over > $800,000.
Conclusions
This glycemic protocol using a computer-
ized system for IV insulin infusion and transi-
tion to SC basal bolus insulin therapy was
highly effective in normalizing blood glu-
cose without significant hypoglycemia in all
patients undergoing CV surgery at Piedmont
Hospital in Atlanta. Several important factors
were involved in achieving this success. The
protocol was designed and implemented as
a group effort by diabetes specialists, nurses,
pharmacists and educators under the guid-
ance of a CV surgeon who championed the
program to his fellow surgeons and hospital
administration. Empowerment of the nurses
in the design, ownership and implementation
of the protocol was crucial. Use of a proven,
computerized, IV-insulin-dosing algorithm
(Glucommander®) with appropriate setting of
the target range of 90-120 mg/dL allowed all
patients to obtain a mean glucose of 107 mg/
dL with no glucose < 40 mg/dL.
Transition from IV to SQ insulin in all
patients with known diabetes or an A1c > 6%
allowed normalization of blood glucose after
eating during the post-operative period until
discharge. To accomplish this, all patients were
screened for diabetes and had an A1c drawn
to identify patients to transition from IV to SQ
insulin and who would benefit from insulin
after discharge. Any patients admitted with
poorly controlled diabetes were normalized in
the hospital with insulin and discharged with
an insulin regimen to keep their blood glu-
cose levels normal as long as they complied
with their case-specific regimen. It is felt by all
200
180
160
140
120
100
80
60
220
200
180
160
140
120
100
80
60
40
Hours on Glucommander®
Hours after IV insulin
n=209
Last
GM
Lunc
hDin
ner
Bedt
ime
3:00
AM
Brea
kfas
t
Dinne
rBe
dtim
e
3:00
AM
Brea
kfas
t
Lunc
h
Dinne
r
Bedt
ime
Bedt
ime
3:00
AM
Lunc
h
Bloo
d G
luco
se (m
g/dL
)
Bloo
d G
luco
se (m
g/dL
)
Average Blood Glucose (with SD) of All Glucommander® Runs
0 5 10 15 20 25
0 8 16 24 32 40 48 56 64 72
Basal: Multiplier *500; CIR: 0.5/Multiplier; Correction Factor: 1.7/Multiplier
Figure 2 . Transition from Glucommander® to Basal-Bolus Insulin
Glargine and Aspart
team members that such a glycemic protocol
could also be used in normalizing glucose in
other patients in the hospital system.
Glucommander® is a product of Glucotec,
Inc., based in Greenville, SC.
References
1. Van den Berghe G, Wouters P, Weekers F, et al. Intensive insulin therapy in the critically ill patients. NEnglJMed2001; 345:1359-67. 2001.
2. Furnary AP, Gao G, Grunkemeier GL, et al. Continuous insulin infusion reduces mortality in patients with diabetes undergoing coronary artery bypass graft-ing. JThoracCardiovascSurg. 2003 May;125(5):1007-21.
3. Krinsley JS. Effect of intensive glucose management on the mortality of critically ill adult patients. MayoClinProc. 2004;79:992-1000.
4. Gandhi GY, Nutta GA, Abel MD, et al. Intensive intraoperative insulin therapy versus conventional glucose management during cardiac surgery, a ran-domized trial. AnnInternMed 2007;146:233-43.
5. Krinsley JS, Grover A. Severe hypoglycemia in criti-cally ill patients: risk factors and outcomes. CritCareMed.2007 Oct;35(10):2262-7.
6. American College of Endocrinology and American Diabetes Association Consensus Statement on In-Patient Diabetes and Glycemic Control. EndocrPract.2006 Jul-Aug 12(14):458-68 and DiabetesCare 2006 Aug 29; (8):1955-62.
7. Institute for Healthcare Improvement web-site: www.IHI.org/IHI/Topics/PatientSafety/S u r g i c a l S i t e I n f e c t i o n s / C h a n g e s /SSI+Maintain+Glucose+Control.htm
8. Davidson PC, Steed RD, Bode BW. Glucommander, A Computer-Directed Intravenous Insulin System, Shown to be Safe, Simple, and Effective in 120, 618 h of Operation. Diabetes Care 2005;28(10): 2418-23.
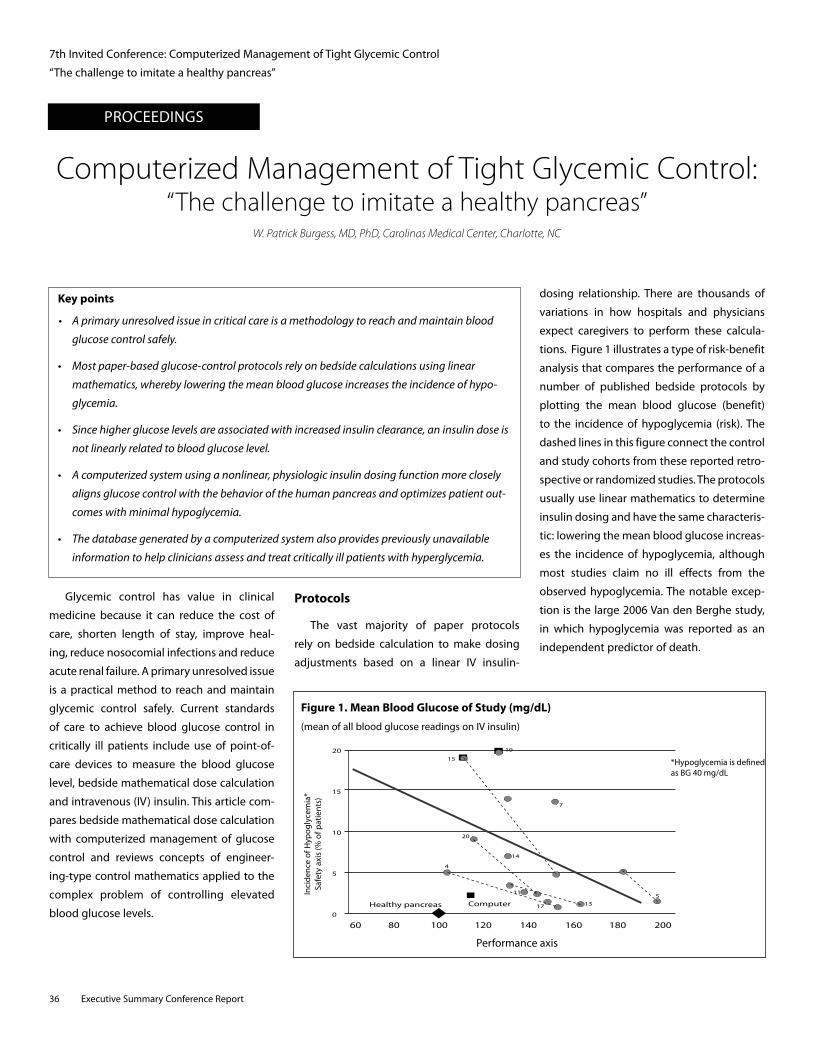
PROCEEDINGS
36 Executive Summary Conference Report
Computerized Management of Tight Glycemic Control: “The challenge to imitate a healthy pancreas”
W. Patrick Burgess, MD, PhD, Carolinas Medical Center, Charlotte, NC
Key points
• Aprimaryunresolvedissueincriticalcareisamethodologytoreachandmaintainblood
glucosecontrolsafely.
• Mostpaper-basedglucose-controlprotocolsrelyonbedsidecalculationsusinglinear
mathematics,wherebyloweringthemeanbloodglucoseincreasestheincidenceofhypo-
glycemia.
• Sincehigherglucoselevelsareassociatedwithincreasedinsulinclearance,aninsulindoseis
notlinearlyrelatedtobloodglucoselevel.
• Acomputerizedsystemusinganonlinear,physiologicinsulindosingfunctionmoreclosely
alignsglucosecontrolwiththebehaviorofthehumanpancreasandoptimizespatientout-
comeswithminimalhypoglycemia.
• Thedatabasegeneratedbyacomputerizedsystemalsoprovidespreviouslyunavailable
informationtohelpcliniciansassessandtreatcriticallyillpatientswithhyperglycemia.
Glycemic control has value in clinical
medicine because it can reduce the cost of
care, shorten length of stay, improve heal-
ing, reduce nosocomial infections and reduce
acute renal failure. A primary unresolved issue
is a practical method to reach and maintain
glycemic control safely. Current standards
of care to achieve blood glucose control in
critically ill patients include use of point-of-
care devices to measure the blood glucose
level, bedside mathematical dose calculation
and intravenous (IV) insulin. This article com-
pares bedside mathematical dose calculation
with computerized management of glucose
control and reviews concepts of engineer-
ing-type control mathematics applied to the
complex problem of controlling elevated
blood glucose levels.
Protocols
The vast majority of paper protocols
rely on bedside calculation to make dosing
adjustments based on a linear IV insulin-
dosing relationship. There are thousands of
variations in how hospitals and physicians
expect caregivers to perform these calcula-
tions. Figure 1 illustrates a type of risk-benefit
analysis that compares the performance of a
number of published bedside protocols by
plotting the mean blood glucose (benefit)
to the incidence of hypoglycemia (risk). The
dashed lines in this figure connect the control
and study cohorts from these reported retro-
spective or randomized studies. The protocols
usually use linear mathematics to determine
insulin dosing and have the same characteris-
tic: lowering the mean blood glucose increas-
es the incidence of hypoglycemia, although
most studies claim no ill effects from the
observed hypoglycemia. The notable excep-
tion is the large 2006 Van den Berghe study,
in which hypoglycemia was reported as an
independent predictor of death.
20
15
10
5
0
20%
18%
16%
14%
12%
10%
8%
6%
4%
2%
0%
Blood Glucose Range, mg/dL
5 10 15 20 25
0.1%0.2%
0.5%1.1%
60 80 100 120 140 160 180 200
*Hypoglycemia is dened as BG 40 mg/dL
Healthy pancreas
4
20
14
15
19
11
17
7
135
Computer
Performance axis
n > 200,000 dose calculationsin over 5,500 patients
Figure 1. Mean Blood Glucose of Study (mg/dL)
(mean of all blood glucose readings on IV insulin)
Inci
denc
e of
Hyp
ogly
cem
ia*
Safe
ty a
xis
(% o
f pat
ient
s)
7th Invited Conference: Computerized Management of Tight Glycemic Control
“The challenge to imitate a healthy pancreas”
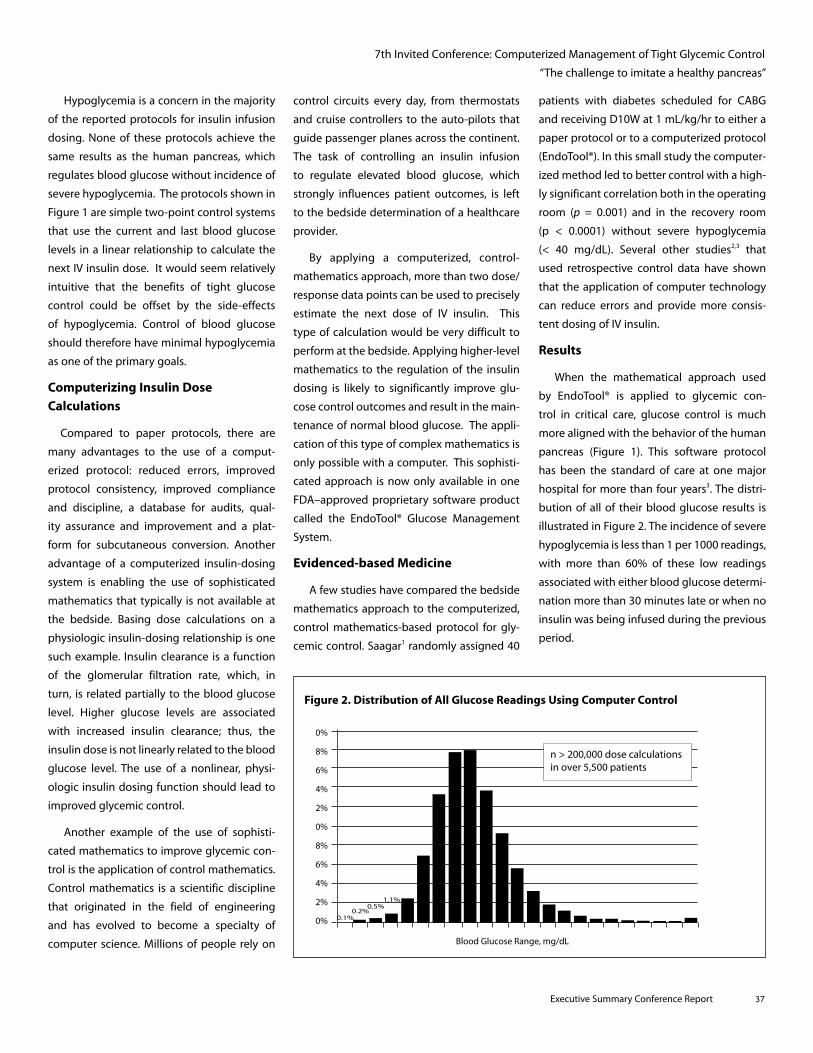
Executive Summary Conference Report 37
7th Invited Conference: Computerized Management of Tight Glycemic Control
“The challenge to imitate a healthy pancreas”
Hypoglycemia is a concern in the majority
of the reported protocols for insulin infusion
dosing. None of these protocols achieve the
same results as the human pancreas, which
regulates blood glucose without incidence of
severe hypoglycemia. The protocols shown in
Figure 1 are simple two-point control systems
that use the current and last blood glucose
levels in a linear relationship to calculate the
next IV insulin dose. It would seem relatively
intuitive that the benefits of tight glucose
control could be offset by the side-effects
of hypoglycemia. Control of blood glucose
should therefore have minimal hypoglycemia
as one of the primary goals.
Computerizing Insulin Dose Calculations
Compared to paper protocols, there are
many advantages to the use of a comput-
erized protocol: reduced errors, improved
protocol consistency, improved compliance
and discipline, a database for audits, qual-
ity assurance and improvement and a plat-
form for subcutaneous conversion. Another
advantage of a computerized insulin-dosing
system is enabling the use of sophisticated
mathematics that typically is not available at
the bedside. Basing dose calculations on a
physiologic insulin-dosing relationship is one
such example. Insulin clearance is a function
of the glomerular filtration rate, which, in
turn, is related partially to the blood glucose
level. Higher glucose levels are associated
with increased insulin clearance; thus, the
insulin dose is not linearly related to the blood
glucose level. The use of a nonlinear, physi-
ologic insulin dosing function should lead to
improved glycemic control.
Another example of the use of sophisti-
cated mathematics to improve glycemic con-
trol is the application of control mathematics.
Control mathematics is a scientific discipline
that originated in the field of engineering
and has evolved to become a specialty of
computer science. Millions of people rely on
control circuits every day, from thermostats
and cruise controllers to the auto-pilots that
guide passenger planes across the continent.
The task of controlling an insulin infusion
to regulate elevated blood glucose, which
strongly influences patient outcomes, is left
to the bedside determination of a healthcare
provider.
By applying a computerized, control-
mathematics approach, more than two dose/
response data points can be used to precisely
estimate the next dose of IV insulin. This
type of calculation would be very difficult to
perform at the bedside. Applying higher-level
mathematics to the regulation of the insulin
dosing is likely to significantly improve glu-
cose control outcomes and result in the main-
tenance of normal blood glucose. The appli-
cation of this type of complex mathematics is
only possible with a computer. This sophisti-
cated approach is now only available in one
FDA–approved proprietary software product
called the EndoTool® Glucose Management
System.
Evidenced-based Medicine
A few studies have compared the bedside
mathematics approach to the computerized,
control mathematics-based protocol for gly-
cemic control. Saagar1 randomly assigned 40
patients with diabetes scheduled for CABG
and receiving D10W at 1 mL/kg/hr to either a
paper protocol or to a computerized protocol
(EndoTool®). In this small study the computer-
ized method led to better control with a high-
ly significant correlation both in the operating
room (p = 0.001) and in the recovery room
(p < 0.0001) without severe hypoglycemia
(< 40 mg/dL). Several other studies2,3 that
used retrospective control data have shown
that the application of computer technology
can reduce errors and provide more consis-
tent dosing of IV insulin.
Results
When the mathematical approach used
by EndoTool® is applied to glycemic con-
trol in critical care, glucose control is much
more aligned with the behavior of the human
pancreas (Figure 1). This software protocol
has been the standard of care at one major
hospital for more than four years3. The distri-
bution of all of their blood glucose results is
illustrated in Figure 2. The incidence of severe
hypoglycemia is less than 1 per 1000 readings,
with more than 60% of these low readings
associated with either blood glucose determi-
nation more than 30 minutes late or when no
insulin was being infused during the previous
period.
20
15
10
5
0
20%
18%
16%
14%
12%
10%
8%
6%
4%
2%
0%
Blood Glucose Range, mg/dL
5 10 15 20 25
0.1%0.2%
0.5%1.1%
60 80 100 120 140 160 180 200
*Hypoglycemia is dened as BG 40 mg/dL
Healthy pancreas
4
20
14
15
19
11
17
7
135
Computer
Performance axis
n > 200,000 dose calculationsin over 5,500 patients
Figure 2. Distribution of All Glucose Readings Using Computer Control
38 Executive Summary Conference Report
7th Invited Conference: Computerized Management of Tight Glycemic Control
“The challenge to imitate a healthy pancreas”
Discussion
The potential for a computerized approach
to improve glycemic control should be intui-
tive given the potential for errors and the
complexity of some paper-based glycemic
control protocols. Critical care nurses are over-
whelmed by new protocols that have to be
integrated into the care plans. Removing the
need for of bedside calculations by using a
computerized system that reduces the work-
load for the caregiver should be a component
of computerized glycemic control programs.
Controlling the blood glucose level promptly
can help reduce the frequency of point-of-
care determinations and associated costs, and
can lead to control similar to that achieved
by the human pancreas, optimizing patient
outcomes and reducing the caregiver’s work-
load. Available alarms and quality assurance
reports can improve compliance with the
glycemic-control protocol.
Conclusions
The control of elevated blood glucose
levels in critically ill patients is a complex
problem. The use of IV insulin is ideal for
glycemic control because of its short half-life.
Computerized calculation of IV insulin dosing
for glycemic control may be a methodology
that can:
• Imitate the human pancreas’ control of
glucose
• Optimizepatient outcomeswithminimal
hypoglycemia.
Computerized management of elevated
blood glucose in critically ill patients can
reduce human errors and improve work flow.
A database generated by this method also
has the potential to enhance patient care by
documenting previously unavailable informa-
tion to help clinicians in the assessment and
treatment of critically ill patients with hyperg-
lycemia.
References
1. Saager L, Collins GL, Burnside B, et al. A randomized study in diabetic patients undergoing cardiac sur-gery comparing computer-guided glucose man-agement with a standard sliding scale protocol. JCardiothoracicandVascularAnesthesia 2007; article in press.
2. Davidson PC, Steed RD, Bode BW. Glucommander: a computer-directed intravenous insulin system shown to be safe, simple, and effective in 120,618 h of operation. DiabetesCare 2005; 28:2418-23.
3. Dunn K, Miller E, Cochran S, et al. Optimized glu-cose management with EndoTool® intravenous insulin dosing. American Diabetes Association, 67th Scientific Session, June 2007; Abstract 0463-P.
Executive Summary Conference Report 39
PROCEEDINGS
Key points
• Existinginsulininfusionprotocolsvarygreatlyinthedetailsofimplementationandcan
resultingreatvariationsininsulindoserecommendations.
• Protocolsdevelopedwithonegroupofpatientsmayrequirevalidationwhenusedforother
patients,buteaseofuseandefficacyinpatientsareimportantfeaturesofanyprotocol.
• Atrialusingaprotocolmaybenecessaryindecidingwhichonetouse.
• Insulinprotocolinnovationsincludetheuseofnomograms,pre-printedtablesandinternet-
basedorcomputer-basedprotocolswithautomaticdosecalculations.
• Involvingandempoweringnursingstaffiscriticalforthesuccessofanyprotocol.
• Differentprotocolsmayberequiredfordifferentpatientsinthesamehospitalbecauseone
protocolmaynotfitall.
Analysis of Variation in Insulin ProtocolsGuy W. Soo Hoo, MD, MPH; Pulmonary and Critical Care Section; West Los Angeles Healthcare Center;
VA Greater Los Angeles Healthcare System
7th Invited Conference: Analysis of Variation in Insulin Protocols
Protocol Development
Managing critically ill patients has dramat-
ically changed over the past decade. Many
large clinical trials have identified optimal
approaches or therapies in areas where there
was once a high degree of variation. There
are now established protocols that have
become part of the routine care of critically
ill patients. Protocols reduce variation in care
and promote the best available therapeu-
tics or best practices1. Adherence to these
protocols should improve patient care and
patient outcomes2. Protocols are intended
to complement care, however, and are not a
substitute for sound clinical judgment.
Protocols are not a "cookbook" approach
to patient care. Protocols may not necessarilly
translate well from the research setting to
general patient use. Blind adoption of proto-
cols developed for other patients may com-
promise patient comfort or safety. Protocols
require flexibility and adaptation for suc-
cessful application in any patient population.
Successful implementation requires a critical
mass of organizational and administrative
support, especially for protocols that require
acceptance and use by several healthcare
providers.
Examples of widely accepted protocols
used in intensive care units (ICU) include
ventilator management of acute lung injury
(ALI) and acute respiratory distress syndrome
(ARDS), weaning patients from ventilators,
sedation, analgesia, transfusions and more
recently antimicrobial stewardship1,3. Intensive
insulin therapy (IIT) to control hyperglycemia
in critically ill patients is another area of great
interest. Adverse outcomes associated with
hyperglycemia and the merits of tight glu-
cose control (TGC) defined as serum glucose
between 80-110 mg/dL have been well docu-
mented4-8. Universal acceptance of guidelines
for TGC is tempered by limited scientific sup-
port that remains confined to the experience
from one medical center8,9.
Many of these protocols have been incor-
porated into best practice models referred to
as "bundles," with ventilator or sepsis bun-
dles the most common. Greater benefit may
result from the use of bundled management
compared to the interventions alone. Many
organizations have taken the lead in this
approach, with the Institute for Healthcare
Improvement (IHI) conducting one of the
most visible campaigns advocating ventilator
and central line bundles. Severe sepsis guide-
lines have also garnered much attention.
The first guidelines arose from collaboration
between the Society of Critical Care Medicine,
European Society of Intensive Care Medicine
and International Sepsis Forum, who col-
laborated on the "Surviving Sepsis" cam-
paign10 with subsequent support from IHI.
Although questions have been raised about
the objectivity of the recommendations, the
guidelines are highly visible within the medi-
cal community11. The sepsis bundle includes
recommendations for adequate glycemic
control defined as a serum glucose < 150
mg/dL achieved by administering continuous
infusions of insulin and glucose. The group
acknowledged the limited scientific support
for this recommendation. Others have been
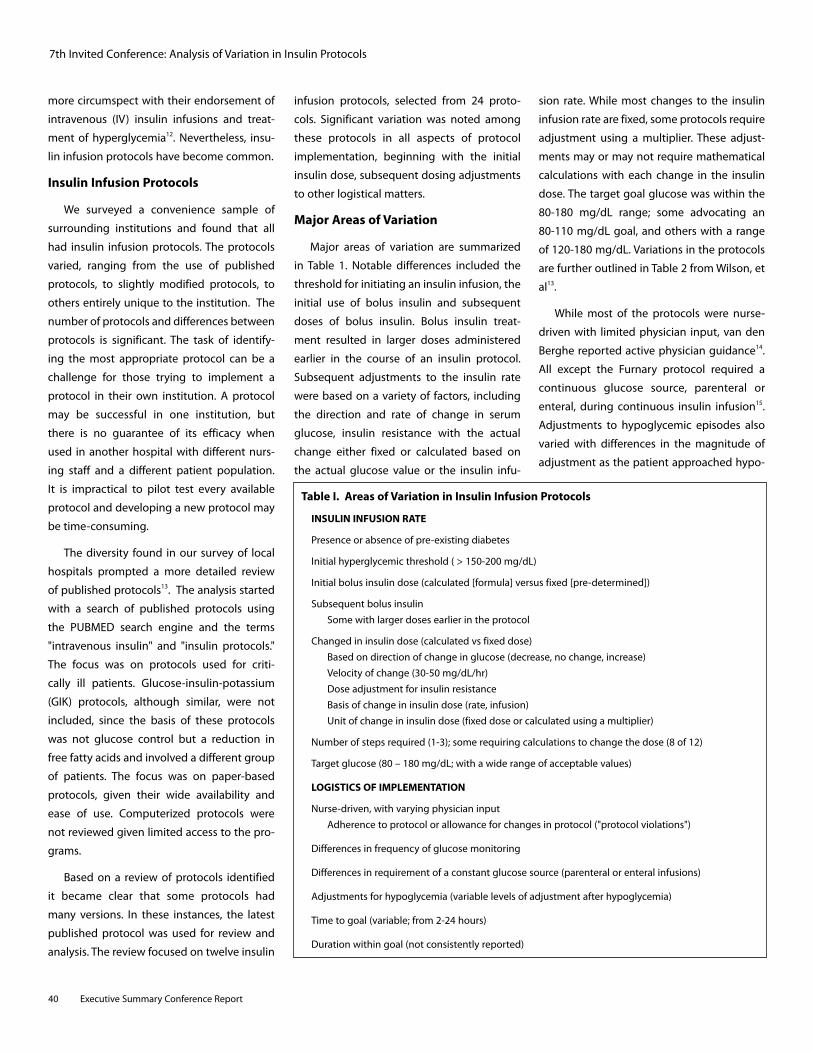
40 Executive Summary Conference Report
7th Invited Conference: Analysis of Variation in Insulin Protocols
more circumspect with their endorsement of
intravenous (IV) insulin infusions and treat-
ment of hyperglycemia12. Nevertheless, insu-
lin infusion protocols have become common.
Insulin Infusion Protocols
We surveyed a convenience sample of
surrounding institutions and found that all
had insulin infusion protocols. The protocols
varied, ranging from the use of published
protocols, to slightly modified protocols, to
others entirely unique to the institution. The
number of protocols and differences between
protocols is significant. The task of identify-
ing the most appropriate protocol can be a
challenge for those trying to implement a
protocol in their own institution. A protocol
may be successful in one institution, but
there is no guarantee of its efficacy when
used in another hospital with different nurs-
ing staff and a different patient population.
It is impractical to pilot test every available
protocol and developing a new protocol may
be time-consuming.
The diversity found in our survey of local
hospitals prompted a more detailed review
of published protocols13. The analysis started
with a search of published protocols using
the PUBMED search engine and the terms
"intravenous insulin" and "insulin protocols."
The focus was on protocols used for criti-
cally ill patients. Glucose-insulin-potassium
(GIK) protocols, although similar, were not
included, since the basis of these protocols
was not glucose control but a reduction in
free fatty acids and involved a different group
of patients. The focus was on paper-based
protocols, given their wide availability and
ease of use. Computerized protocols were
not reviewed given limited access to the pro-
grams.
Based on a review of protocols identified
it became clear that some protocols had
many versions. In these instances, the latest
published protocol was used for review and
analysis. The review focused on twelve insulin
infusion protocols, selected from 24 proto-
cols. Significant variation was noted among
these protocols in all aspects of protocol
implementation, beginning with the initial
insulin dose, subsequent dosing adjustments
to other logistical matters.
Major Areas of Variation
Major areas of variation are summarized
in Table 1. Notable differences included the
threshold for initiating an insulin infusion, the
initial use of bolus insulin and subsequent
doses of bolus insulin. Bolus insulin treat-
ment resulted in larger doses administered
earlier in the course of an insulin protocol.
Subsequent adjustments to the insulin rate
were based on a variety of factors, including
the direction and rate of change in serum
glucose, insulin resistance with the actual
change either fixed or calculated based on
the actual glucose value or the insulin infu-
sion rate. While most changes to the insulin
infusion rate are fixed, some protocols require
adjustment using a multiplier. These adjust-
ments may or may not require mathematical
calculations with each change in the insulin
dose. The target goal glucose was within the
80-180 mg/dL range; some advocating an
80-110 mg/dL goal, and others with a range
of 120-180 mg/dL. Variations in the protocols
are further outlined in Table 2 from Wilson, et
al13.
While most of the protocols were nurse-
driven with limited physician input, van den
Berghe reported active physician guidance14.
All except the Furnary protocol required a
continuous glucose source, parenteral or
enteral, during continuous insulin infusion15.
Adjustments to hypoglycemic episodes also
varied with differences in the magnitude of
adjustment as the patient approached hypo-
Table I. Areas of Variation in Insulin Infusion Protocols
INSULIN INFUSION RATE
Presence or absence of pre-existing diabetes
Initial hyperglycemic threshold ( > 150-200 mg/dL)
Initial bolus insulin dose (calculated [formula] versus fixed [pre-determined])
Subsequent bolus insulin
Some with larger doses earlier in the protocol
Changed in insulin dose (calculated vs fixed dose)
Based on direction of change in glucose (decrease, no change, increase)
Velocity of change (30-50 mg/dL/hr)
Dose adjustment for insulin resistance
Basis of change in insulin dose (rate, infusion)
Unit of change in insulin dose (fixed dose or calculated using a multiplier)
Number of steps required (1-3); some requiring calculations to change the dose (8 of 12)
Target glucose (80 – 180 mg/dL; with a wide range of acceptable values)
LOGISTICS OF IMPLEMENTATION
Nurse-driven, with varying physician input
Adherence to protocol or allowance for changes in protocol ("protocol violations")
Differences in frequency of glucose monitoring
Differences in requirement of a constant glucose source (parenteral or enteral infusions)
Adjustments for hypoglycemia (variable levels of adjustment after hypoglycemia)
Time to goal (variable; from 2-24 hours)
Duration within goal (not consistently reported)
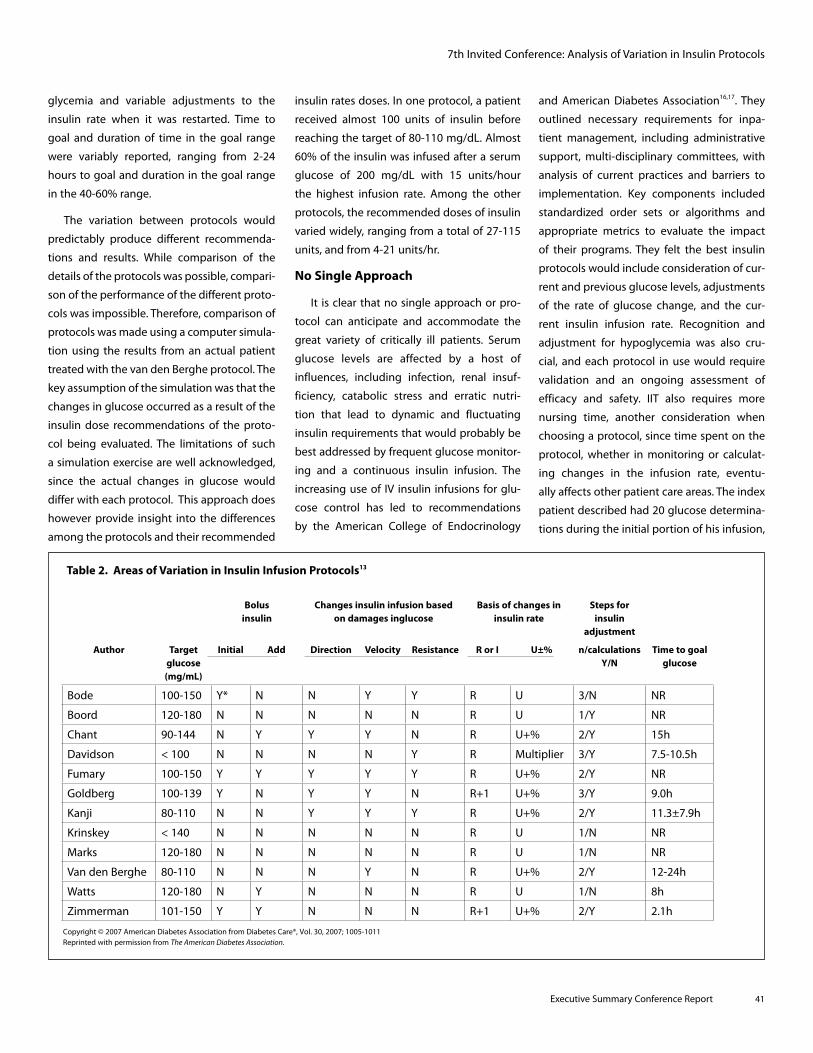
Executive Summary Conference Report 41
glycemia and variable adjustments to the
insulin rate when it was restarted. Time to
goal and duration of time in the goal range
were variably reported, ranging from 2-24
hours to goal and duration in the goal range
in the 40-60% range.
The variation between protocols would
predictably produce different recommenda-
tions and results. While comparison of the
details of the protocols was possible, compari-
son of the performance of the different proto-
cols was impossible. Therefore, comparison of
protocols was made using a computer simula-
tion using the results from an actual patient
treated with the van den Berghe protocol. The
key assumption of the simulation was that the
changes in glucose occurred as a result of the
insulin dose recommendations of the proto-
col being evaluated. The limitations of such
a simulation exercise are well acknowledged,
since the actual changes in glucose would
differ with each protocol. This approach does
however provide insight into the differences
among the protocols and their recommended
insulin rates doses. In one protocol, a patient
received almost 100 units of insulin before
reaching the target of 80-110 mg/dL. Almost
60% of the insulin was infused after a serum
glucose of 200 mg/dL with 15 units/hour
the highest infusion rate. Among the other
protocols, the recommended doses of insulin
varied widely, ranging from a total of 27-115
units, and from 4-21 units/hr.
No Single Approach
It is clear that no single approach or pro-
tocol can anticipate and accommodate the
great variety of critically ill patients. Serum
glucose levels are affected by a host of
influences, including infection, renal insuf-
ficiency, catabolic stress and erratic nutri-
tion that lead to dynamic and fluctuating
insulin requirements that would probably be
best addressed by frequent glucose monitor-
ing and a continuous insulin infusion. The
increasing use of IV insulin infusions for glu-
cose control has led to recommendations
by the American College of Endocrinology
and American Diabetes Association16,17. They
outlined necessary requirements for inpa-
tient management, including administrative
support, multi-disciplinary committees, with
analysis of current practices and barriers to
implementation. Key components included
standardized order sets or algorithms and
appropriate metrics to evaluate the impact
of their programs. They felt the best insulin
protocols would include consideration of cur-
rent and previous glucose levels, adjustments
of the rate of glucose change, and the cur-
rent insulin infusion rate. Recognition and
adjustment for hypoglycemia was also cru-
cial, and each protocol in use would require
validation and an ongoing assessment of
efficacy and safety. IIT also requires more
nursing time, another consideration when
choosing a protocol, since time spent on the
protocol, whether in monitoring or calculat-
ing changes in the infusion rate, eventu-
ally affects other patient care areas. The index
patient described had 20 glucose determina-
tions during the initial portion of his infusion,
Bolus insulin
Changes insulin infusion based on damages inglucose
Basis of changes in insulin rate
Steps for insulin
adjustment
Author Target glucose (mg/mL)
Initial Add Direction Velocity Resistance R or I U±% n/calculations Y/N
Time to goal glucose
Bode 100-150 Y* N N Y Y R U 3/N NR
Boord 120-180 N N N N N R U 1/Y NR
Chant 90-144 N Y Y Y N R U+% 2/Y 15h
Davidson < 100 N N N N Y R Multiplier 3/Y 7.5-10.5h
Fumary 100-150 Y Y Y Y Y R U+% 2/Y NR
Goldberg 100-139 Y N Y Y N R+1 U+% 3/Y 9.0h
Kanji 80-110 N N Y Y Y R U+% 2/Y 11.3±7.9h
Krinskey < 140 N N N N N R U 1/N NR
Marks 120-180 N N N N N R U 1/N NR
Van den Berghe 80-110 N N N Y N R U+% 2/Y 12-24h
Watts 120-180 N Y N N N R U 1/N 8h
Zimmerman 101-150 Y Y N N N R+1 U+% 2/Y 2.1h
7th Invited Conference: Analysis of Variation in Insulin Protocols
Copyright © 2007 American Diabetes Association from Diabetes Care®, Vol. 30, 2007; 1005-1011 Reprinted with permission from TheAmericanDiabetesAssociation.
Table 2. Areas of Variation in Insulin Infusion Protocols13
42 Executive Summary Conference Report
7th Invited Conference: Analysis of Variation in Insulin Protocols
which would translate into 100 minutes spent
on glucose management alone, allotting five
minutes for each glucose check.
Summary
Existing insulin infusion protocols vary
greatly in the details of implementation. The
differences in protocols can result in great
variations in insulin dose recommendations.
Protocols developed with one group of
patients may require validation when applied
to other patients. The ease of use and efficacy
in patients are important features of each
protocol. A fair assessment of a protocol may
not be possible without a treatment trial.
New innovations are emerging, including the
use of nomograms, pre-printed tables, inter-
net-based or computer-based protocols with
automatic dose calculations. Irrespective of
the protocol chosen, involving and empow-
ering nursing staff is critical for its success.
There may not be one protocol suitable for
all patients, and different protocols may be
required for different patients in the same
hospital. One protocol may not fit all.
References
1. Holcomb BW, Wheeler AP, Ely EW. New ways to reduce unnecessary variation and improve out-comes in the intensive care unit. CurrOpinCritCare 2001; 7(4):304-11.
2. Meade MO, Ely EW. Protocols to improve the care of critically ill pediatric and adult patients. JAmerMedAssn 2002;288(20):2601-3.
3). Barlam TF, DiVall M. Antibiotic-stewardship practic-es at top academic centers throughout the United States and at hospitals throughout Massachusetts. InfectControlHospEpidemiol 2006;27(7):695-703.
4. Capes SE, Hunt D, Malmberg K, et al. Stress hypergly-caemia and increased risk of death after myocardial infarction in patients with and without diabetes: a systematic overview. Lancet 2000;355(9206):773-8.
5). Capes SE, Hunt D, Malmberg K, et al. Stress hyper-glycemia and prognosis of stroke in nondiabetic and diabetic patients: a systematic overview. Stroke 2001; 32(10):2426-32.
6. Finney SJ, Zekveld C, Elia A, et al. Glucose control and mortality in critically ill patients. J AmerMedAssn 2003;290(15):2041-7.
7. Krinsley JS. Association between hyperglycemia and increased hospital mortality in a heteroge-neous population of critically ill patients. MayoClinProc 2003;78(12):1471-8.
8. Van den BG, Wouters P, Weekers F, et al. Intensive insulin therapy in the critically ill patients. NEnglJMed 2001;345(19):1359-67.
9. Van den BG, Wilmer A, Hermans G, et al. Intensive insulin therapy in the medical ICU. N Engl J Med 2006;354(5):449-61.
10. Dellinger RP, Carlet JM, Masur H, et al. Surviving Sepsis Campaign guidelines for management of severe sepsis and septic shock. CritCareMed 2004; 32(3):858-73.
11. Eichacker PQ, Natanson C, Danner RL. Surviving sepsis--practice guidelines, marketing campaigns, and Eli Lilly. NEnglJMed 2006; 355(16):1640-2.
12. Angus DC, Abraham E. Intensive insulin thera-py in critical illness. Am J Respir Crit Care Med2005;172(11):1358-9.
13. Wilson M, Weinreb J, Soo Hoo GW. Intensive insulin therapy in critical care: a review of 12 protocols. DiabetesCare 2007;30(4):1005-11.
14. van den Berghe G, Bouillon R, Lauwers P. Intensive insulin therapy in critically ill patients; supplemen-tary material. NEnglJMed2002;346:1587-8.
15. Furnary AP, Wu Y, Bookin SO. Effect of hyperglyce-mia and continuous intravenous insulin infusions on outcomes of cardiac surgical procedures: the Portland Diabetic Project. Endocr Pract 2004;10 (Suppl 2):21-33.
16. American College of Endocrinology and American Diabetes Association Consensus statement on inpatient diabetes and glycemic control: a call to action. DiabetesCare 2006; 29(8):1955-62.
17. American College of Endocrinology and American Diabetes Association consensus statement on inpatient diabetes and glycemis control. EndocrPract 2006;12(Suppl 3):4-13.
Executive Summary Conference Report 43
PROCEEDINGS
Improving ICU Quality and Safety: Implications for Tight Glycemic Control
Sean Berenholtz, MD MHS FCCM, Johns Hopkins University,Quality and Safety Research Group, Baltimore, MD
7th Invited Conference: Improving ICU Quality and Safety–Implications for Tight Glycemic Control
Key points
• Structuredapproachestoimprovethereliabilityofcareandteamworkclimateinintensive
careunits(ICUs)haveimprovedpatientsafetyandoutcomes.
• Thelinkbetweenteamworkclimateandtightglucosecontrol(TGC)hasnotbeen
investigated;however,TGCisclearlyateameffort.
• Lessonslearnedfromqualityandsafetyresearchtoimproveinfectioncontroland
post-surgicalcaremaywellbeapplicabletoTGC.
The Johns Hopkins Quality and Safety
Research Group (QSRG), which manages sev-
eral large collaboratives including more than
250 intensive care units (ICUs), has a strong
focus on quality and safety issues. Studies
in these ICUs have shown that a culture of
safety, particularly a teamwork climate, is a
predictor for many clinically important out-
comes. Fortunately, teamwork and the safety
climate can be improved.
The link between teamwork climate and
tight glycemic control (TGC) has not been
investigated but TGTC clearly requires team-
work. In this article the Johns Hopkins model
for improving the reliability of care, the four
critical components of all change efforts,
and the Johns Hopkins Comprehensive Unit-
based Safety Program (CUSP) are discussed.
Improving Reliability of Care
The Johns Hopkins QSRG model for
improving the reliability of care that has been
developed over the past five years is based on
literature showing that patients receive evi-
dence-based therapies they should receive
only about 50% of the time1. To improve reli-
ability of care:2
• Pick a clinically important area—some-
thing commonly seen in the ICU or associ-
ated with significant morbidity and mor-
tality.
• Identify“Whatshouldwedo?”—whatevi-
denced-based therapies should be pro-
vided for patients?
• Measure performance—translate those
therapies into behaviors that can be mea-
sured validly and feasibly with data col-
lected concurrently at the bedside and
analyze whether those behaviors are
being done.
• Focus on improving the systems of care
(decreasing complexity, creating redun-
dancy and learning from mistakes) to
improve performance.
• Evaluate whether improvement in mea-
sures has been achieved.
Many individual hospitals have used this
model and seen reductions in complications
and mortality and improvements in patient
satisfaction, rates of nosocomial infections,
glucose control and sepsis care.
For example, this model has been used
to reduce catheter-related bloodstream
infections (CR-BSIs), a completely prevent-
able complication that currently results in
one to eleven patient deaths every day.
Studies show that CR-BSIs can be reduced
by the following steps, ensuring that patients
receive five evidence-based interventions as
described in Center for Disease Control (CDC)
guidelines3:
• Applyfivebestpractices
– Remove unnecessary lines
– Perform hand hygiene
– Use maximal barrier precautions
– Use chlorhexidine for skin antisepsis
– Avoid femoral lines
• Decrease complexity, e.g., create a “line
cart” that has all the necessary supplies, so
that providers do not have to go to eight
different places to gather their supplies.
• Createredundancy,e.g.,createachecklist
to be completed by the nurse at the bed-
side and then empower the nurses to stop
the procedure if a violation is noted.
Use of this model reduced the rate of
CR-BSIs in the Johns Hopkins ICU from about
the 50th percentile, the National Nosocomial
Infection Surveillance benchmark, to less than
one per thousand catheter days. Because
44 Executive Summary Conference Report
safety efforts focused on systems change,
this dramatic reduction has been maintained
in an academic medical center for the past
three years. This approach can be broadly
generalized. In Michigan, for example, within
three months of implementing all the above
interventions in 136 ICUs across the state, the
median rate of CR-BSIs went to zero4.
Technical and Adaptive Components of Change
One of the most important lessons from
our experience and the literature is the four
critical components for all change efforts.
• Engage. Providers and front-line staff
need to be engaged. More than just pro-
viding data back to providers, what can
we do to touch their hearts or create
that imperative for change? Telling stories
is one example. Many hospitals identify
patients who had adverse events and then
feed those stories back to staff.
• Educate. Provide relevant educational
material. Many providers are not able,
interested or willing to read a 72-page CDC
guideline on the prevention of CR-BSIs, so
distill the information down into discreet
behaviors known to be important. The
biggest gap between current performance
and best evidence is not that providers
disagree with the evidence, but that they
do not know the evidence exists.
• Execute. Provide templates or examples of
how to create redundancy or standardized
care within the ICU. Many of ICU teams
want examples they can adapt to their
local environment.
• Evaluate. Provide valid tools to evaluate
whether care has improved.
Context of Care
Teamwork is a critically important element
in the culture of safety. An aviation industry
study showed that most commercial aviation
accidents happened on the first day a flight
crew worked together. In healthcare, there
is little training on teamwork. In labor and
delivery, intensive care units and the operat-
ing room, survey data show that physicians
uniformly overrate communication and col-
laboration compared to nurses5.
A highly validated safety culture assess-
ment instrument is the safety attitude ques-
tionnaire (SAQ)6. The SAQ evaluates a variety
of domains within the ICU—job satisfaction,
teamwork climate, safety climate, percep-
tions of management, stress recognition and
working conditions—as perceived by front-
line nurses, physicians, respiratory therapists,
pharmacists, aides, secretaries and other
staff.
The SAQ definition of teamwork is “the
perceived quality of collaboration between
personnel in this unit.” Examples include
“Disagreements in the ICU are appropriately
resolved (i.e., not who is right, but what is best
for the patient)” and “Our doctors and nurses
work together as a well coordinated team.”
Safety climate is defined as “perceptions of
strong or proactive commitment to patient
safety in this unit,” e.g., “I would feel safe being
treated in this ICU” and “Medical errors are
handled appropriately in this ICU6.”
Baseline SAQ results from Michigan
ranged from an ICU in which only 15% of staff
agreed they have good teamwork to another
ICU in which almost 90% agreed2. When sur-
vey results were correlated with subsequent
efforts to reduce CR-BSIs rates, the results
were striking. Of ICUs in the lowest tercile in
teamwork climate, 21% went five months or
more without a CR-BSI, compared to 44% in
the highest-tercile ICUs. The strongest pre-
dictor of an ICU’s ability to reduce its CR-BSI
rate was the answer to a single question: “Do
caregivers feel comfortable speaking up if
they perceive a problem with patient care?”2
Perhaps not surprising when we consider that
evaluation of sentinel events and root cause
analyses have shown that in the vast majority
of instances, somebody knew something was
not comfortable speaking up, or they spoke
up and their concerns were not acknowl-
edged.
Teamwork also is a predictor for other clini-
cally important outcomes such as wrong-site
surgeries, decubitus ulcers, delays in starting
in the operating room, bloodstream infec-
tions, post-operative sepsis, post-operative
infections, post-operative bleeding, pulmo-
nary embolism/deep vein thrombosis, venti-
lator-associated pneumonia, nursing turnover
and absenteeism5. The link between safety or
teamwork and tight glucose control has not
been investigated; however, TGC is clearly a
team effort.
CUSP
Another important lesson from our collab-
orative efforts is that teamwork and a safety
climate can be improved, as shown by results
achieved by CUSP7. Data from the general
surgical ICU (SICU) and the Weinberg oncol-
ogy ICU (WICU) at Johns Hopkins showed dra-
matic improvements in the culture of safety.
The SICU improved from one-third to 70% of
respondents reporting a good safety culture
pre- and post-CUSP, and the WICU improved
from one-third to almost 90% (Figure). In
Michigan, after two years there has been an
incremental improvement of approximately
2% to 10% in teamwork and safety culture in
ICUs (Figure)2. Culture change takes time.
To track changes in SAQ results over time,
hospitals are classified as ‘needs improve-
ment’ if less than 60% of the providers say
that they have a good teamwork or safety
culture. From 2004 to 2006 CUSP implemen-
tation decreased the percent of ICUs across
Michigan that “need improvement” from 84%
to 41% for safety climate and from 82% to
47% for teamwork climate.
7th Invited Conference: Improving ICU Quality and Safety–Implications for Tight Glycemic Control
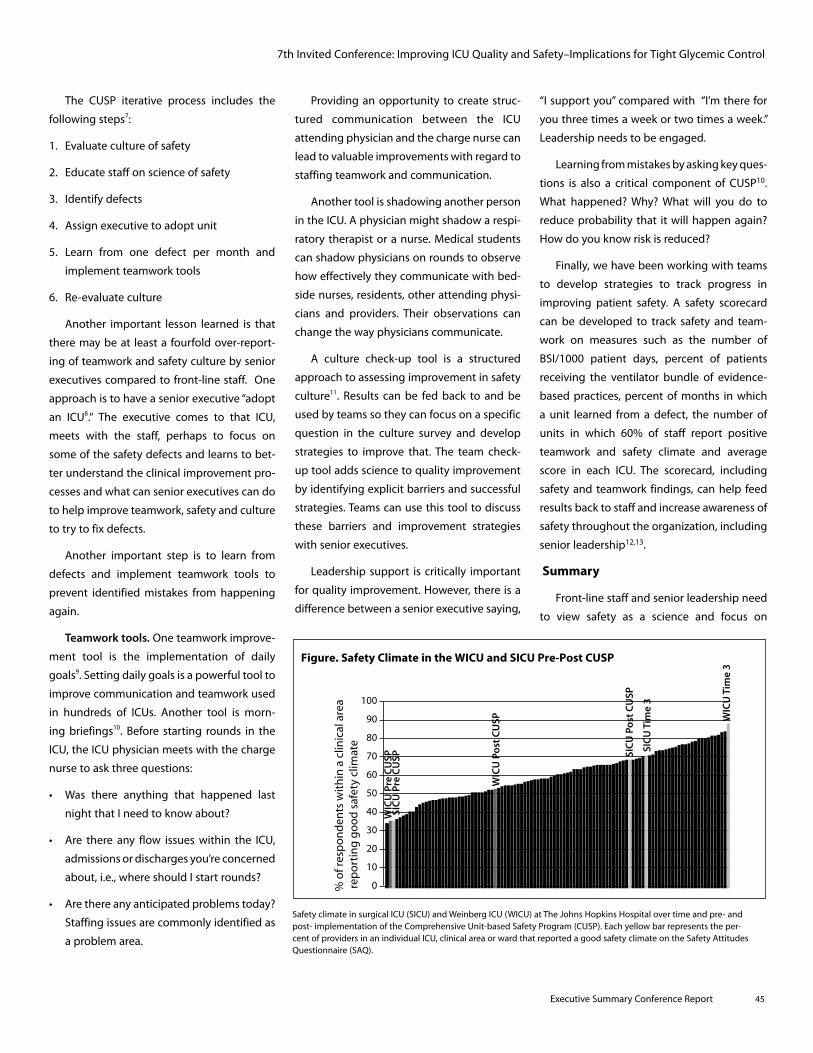
Executive Summary Conference Report 45
The CUSP iterative process includes the
following steps7:
1. Evaluate culture of safety
2. Educate staff on science of safety
3. Identify defects
4. Assign executive to adopt unit
5. Learn from one defect per month and
implement teamwork tools
6. Re-evaluate culture
Another important lesson learned is that
there may be at least a fourfold over-report-
ing of teamwork and safety culture by senior
executives compared to front-line staff. One
approach is to have a senior executive “adopt
an ICU8.“ The executive comes to that ICU,
meets with the staff, perhaps to focus on
some of the safety defects and learns to bet-
ter understand the clinical improvement pro-
cesses and what can senior executives can do
to help improve teamwork, safety and culture
to try to fix defects.
Another important step is to learn from
defects and implement teamwork tools to
prevent identified mistakes from happening
again.
Teamwork tools. One teamwork improve-
ment tool is the implementation of daily
goals9. Setting daily goals is a powerful tool to
improve communication and teamwork used
in hundreds of ICUs. Another tool is morn-
ing briefings10. Before starting rounds in the
ICU, the ICU physician meets with the charge
nurse to ask three questions:
• Was there anything that happened last
night that I need to know about?
• Are there any flow issueswithin the ICU,
admissions or discharges you’re concerned
about, i.e., where should I start rounds?
• Arethereanyanticipatedproblemstoday?
Staffing issues are commonly identified as
a problem area.
Providing an opportunity to create struc-
tured communication between the ICU
attending physician and the charge nurse can
lead to valuable improvements with regard to
staffing teamwork and communication.
Another tool is shadowing another person
in the ICU. A physician might shadow a respi-
ratory therapist or a nurse. Medical students
can shadow physicians on rounds to observe
how effectively they communicate with bed-
side nurses, residents, other attending physi-
cians and providers. Their observations can
change the way physicians communicate.
A culture check-up tool is a structured
approach to assessing improvement in safety
culture11. Results can be fed back to and be
used by teams so they can focus on a specific
question in the culture survey and develop
strategies to improve that. The team check-
up tool adds science to quality improvement
by identifying explicit barriers and successful
strategies. Teams can use this tool to discuss
these barriers and improvement strategies
with senior executives.
Leadership support is critically important
for quality improvement. However, there is a
difference between a senior executive saying,
“I support you” compared with “I’m there for
you three times a week or two times a week.”
Leadership needs to be engaged.
Learning from mistakes by asking key ques-
tions is also a critical component of CUSP10.
What happened? Why? What will you do to
reduce probability that it will happen again?
How do you know risk is reduced?
Finally, we have been working with teams
to develop strategies to track progress in
improving patient safety. A safety scorecard
can be developed to track safety and team-
work on measures such as the number of
BSI/1000 patient days, percent of patients
receiving the ventilator bundle of evidence-
based practices, percent of months in which
a unit learned from a defect, the number of
units in which 60% of staff report positive
teamwork and safety climate and average
score in each ICU. The scorecard, including
safety and teamwork findings, can help feed
results back to staff and increase awareness of
safety throughout the organization, including
senior leadership12,13.
Summary
Front-line staff and senior leadership need
to view safety as a science and focus on
7th Invited Conference: Improving ICU Quality and Safety–Implications for Tight Glycemic Control
100
90
80
70
60
50
40
30
20
10
0% o
f res
po
nd
ents
wit
hin
a c
linic
al a
rea
rep
ort
ing
go
od
saf
ety
clim
ate
WIC
U P
re C
USP
WIC
U P
ost C
USP W
ICU
Tim
e 3
SICU
Pre
CU
SP SICU
Pos
t CU
SP
SICU
Tim
e 3
Figure. Safety Climate in the WICU and SICU Pre-Post CUSP
Safety climate in surgical ICU (SICU) and Weinberg ICU (WICU) at The Johns Hopkins Hospital over time and pre- and post- implementation of the Comprehensive Unit-based Safety Program (CUSP). Each yellow bar represents the per-cent of providers in an individual ICU, clinical area or ward that reported a good safety climate on the Safety Attitudes Questionnaire (SAQ).
46 Executive Summary Conference Report
7th Invited Conference: Improving ICU Quality and Safety–Implications for Tight Glycemic Control
systems to ensure patients receive the thera-
pies they should. Both the technical and the
adaptive components of change must be
addressed. Culture trumps strategy, and effi-
cient, structured approaches must be used to
learn from mistakes and improve safety cul-
ture. Efforts to improve glucose control within
the ICU would be remiss if they do not explic-
itly address culture and the prior beliefs of
the ICU staff. Fortunately, tools such as CUSP
can now be used to help improve culture. The
ultimate goal is to help teams be able to say
that a patient is less likely to be harmed this
year as opposed to last.
References
1. McGlynn EA, Asch SM, Adams J, et al. The quality of health care delivered to adults in the United States. NEnglJMed 2003;348:2635-45.
2. Health Services Research, 2006;41(4 Part II):1599.
3. Guidelines for the Prevention of Intravascular Catheter-Related Infections. Center for Disease Control. CDC August 9, 2002 / 51(RR10);1-26. http://www.cdc.gov/mmwr/preview/mmwrhtml/rr5110a1.htm (Accessed January 7, 2008)
4. Pronovost P, Needham D, Berenholtz S, et al. An intervention to decrease catheter-related blood stream infections in the ICU. N Engl JMed2006;355:2725-32.
5. Unpublished data, personal communication, Dr. Bryan Sexton at The Johns Hopkins University, 2007.
6. Colla J, Bracken A, Kinney L, et al. Measuring patient safety climate: a review of surveys. QualSafHealthCare 2005;14:364-6.
7. Pronovost P. Improving care throughout Maryland: Introducing CUSP. JtCommJQualPatientSaf2006 Feb;32(2):102-8.
8. Pronovost PJ, Weast B, Bishop K, et al. Senior execu-tive adopt-a-work unit: a model for safety improve-ment. JtCommJQualSaf 2004 Feb;30(2):59-68.
9. Pronovost P, Berenholtz S, Dorman T, et al. Improving communication in the ICU using daily goals. JCritCare 2002;18(2):71-5.
10. Thompson D, Holzmueller C, Hunt D, et al. A morn-ing briefing: setting the stage for a clinically and operationally good day. JtCommJQualPatientSaf. 2005 Aug;31(8):476-9.
11. Sexton BJ, Paine LA, Manfuso J, et al. A check-up for safety culture in "my patient care area". JtCommJQualPatientSaf 2007 Nov;33(11):699-703, 645.
12. Pronovost P, Holzmueller CG, Needham DM, et al. How will we know patients are safer? An organiza-tion-wide approach to measuring and improving safety. CritCarMed2006;34(7):1988-95.
13. Pronovost PJ, Berenholtz SM, Needham DM. A framework for healthcare organizations to develop and evaluate a safety scorecard. J AmerMedAssn 2007;298(17):2063-5.
Executive Summary Conference Report 47
PROCEEDINGS
7th Invited Conference: Specialized Nutrition Support and Glycemic Control
Specialized Nutrition Support and Glycemic ControlKalman Holdy, MD, ABPNS, Medical Director of Clinical Nutrition, Sharp Memorial Hospital, San Diego, CA;
Clinical Professor of Medicine, University of California, San Diego
Key points
• Hyperglycemiaassociatedwithspecializednutritionsupport(SNS)maycompromise
intendedtreatmentgoals.Thus,cliniciansneedtoconsiderphysiologicglycemic
managementasaprimarygoal.
• Anewapproachisto:
– ProvideSNStoallpatientsbasedonnutritionassessmentandseverityofillness,with
glycemiccontrolgivenpriorityoverprovisionofadequateenergy.
– Afterglycemiccontrolisachieved,usuallyin24to48hours,advancenutritionwhile
maintainingglycemiccontrol.
– TheNutritionandMetabolicSupportServiceatSharpMemorialHospitalhasobserved
thatthisapproachminimizeshyperglycemiaforpatientsreceivingbothparenteraland
enteralnutrition.
– Forpatientswhoareeating,a“glycemiccontroldiet”—whichprovidescontrolled
calories,adequateproteinandthesamecarbohydratewitheachmeal—allowsmore
predictableprandialinsulindosing,comparedtotheconventional1800-2000calorie
diet,iswellacceptedbypatientsandleadstobetterprandialglycemiccontrol.
The benefits of tight glycemic control
(TGC) are being embraced for the care of
critical and acute care patients. Successful
glycemic management is integrally related
to the nutrition provided to a hospitalized
patient. A new look should be taken at hospi-
tal nutrition with physiologic glycemic man-
agement as a primary goal. The glycemic
effects of specialized nutrition support (SNS)
for hospitalized patients (parenteral [PN] and/
or enteral nutrition [EN]) have been exam-
ined more than the effects of oral diets, and
lessons learned from the glycemic effects of
SNS should be applied to patients taking oral
diets. Based on the currently available data,
a reasonable approach regarding hospital
nutrition is to provide nutrition in a manner
that fosters glycemic control as first priority
and achieves “goal” calories as a secondary
priority. This prioritized approach is increas-
ingly used with SNS and should be applied to
all hospital nutrition, including oral diets.
Nutrition Goals and Fears
Nutrition goals for hospitalized patents
include the provision of essential nutrients
to maintain energy, metabolic homoeosta-
sis, organ function and functional capacity.
There are several concerns about the cur-
rent recommendations for the nutrition care
of hospitalized patients. One of these con-
cerns is the possibility that inadequate calorie
intake will accelerate malnutrition because
of the “hypermetabolism” of illness and the
nutrient needs of patients will be unmet dur-
ing illness. Most illnesses do not accelerate
total energy expenditure significantly and
short-term underfeeding is well tolerated by
most non-critically ill patients1.
In contrast, the harm from overfeeding is
now well recognized. The benefit of meeting
metabolic needs at the expense of creating
hyperglycemia is doubtful at best and harm-
ful at worst. From the Leuven studies2. it is
clear that in critically ill patients, providing
SNS while permitting hyperglycemia results
in worse outcomes than maintaining eug-
lycemia (Figure)3. No comparable study is
available in patients who are not dependant
on SNS, but the harmful effects of hyperg-
lycemia related to diet appear clear (Table
1). Hyperglycemia during feeding results
in catabolism, is immunenosuppresive and
proinflamatory, and delays gastric empty-
ing. Postprandial hyperglycemia is recog-
nized as a major element in the long-term
complications of diabetes. Based on these
observations, nutrition-related hyperglyce-
mia appears to be counterproductive to the
basic goals of hospital nutrition.
Another concern about hospital nutrition
which affects feeding recommendations is
that hospital feeding reverses the catabolic
effects of illness. A large body of evidence
indicates that no single or combination of
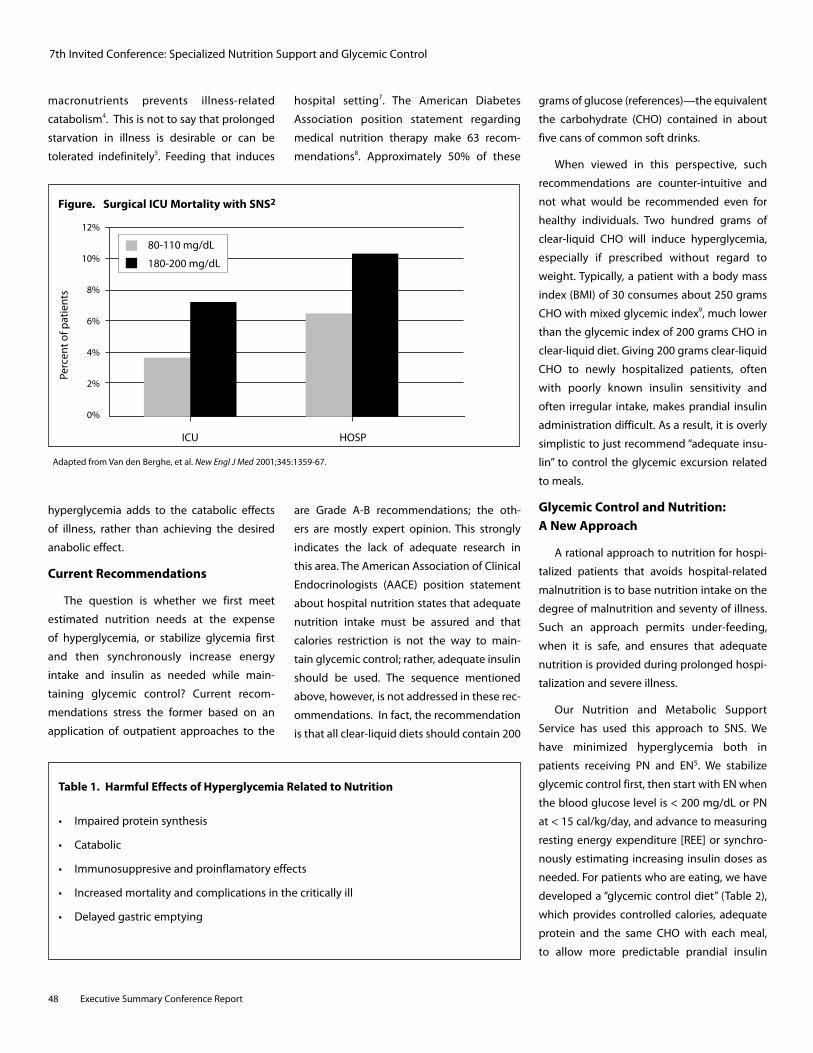
48 Executive Summary Conference Report
7th Invited Conference: Specialized Nutrition Support and Glycemic Control
macronutrients prevents illness-related
catabolism4. This is not to say that prolonged
starvation in illness is desirable or can be
tolerated indefinitely5. Feeding that induces
hyperglycemia adds to the catabolic effects
of illness, rather than achieving the desired
anabolic effect.
Current Recommendations
The question is whether we first meet
estimated nutrition needs at the expense
of hyperglycemia, or stabilize glycemia first
and then synchronously increase energy
intake and insulin as needed while main-
taining glycemic control? Current recom-
mendations stress the former based on an
application of outpatient approaches to the
hospital setting7. The American Diabetes
Association position statement regarding
medical nutrition therapy make 63 recom-
mendations8. Approximately 50% of these
are Grade A-B recommendations; the oth-
ers are mostly expert opinion. This strongly
indicates the lack of adequate research in
this area. The American Association of Clinical
Endocrinologists (AACE) position statement
about hospital nutrition states that adequate
nutrition intake must be assured and that
calories restriction is not the way to main-
tain glycemic control; rather, adequate insulin
should be used. The sequence mentioned
above, however, is not addressed in these rec-
ommendations. In fact, the recommendation
is that all clear-liquid diets should contain 200
grams of glucose (references)—the equivalent
the carbohydrate (CHO) contained in about
five cans of common soft drinks.
When viewed in this perspective, such
recommendations are counter-intuitive and
not what would be recommended even for
healthy individuals. Two hundred grams of
clear-liquid CHO will induce hyperglycemia,
especially if prescribed without regard to
weight. Typically, a patient with a body mass
index (BMI) of 30 consumes about 250 grams
CHO with mixed glycemic index9, much lower
than the glycemic index of 200 grams CHO in
clear-liquid diet. Giving 200 grams clear-liquid
CHO to newly hospitalized patients, often
with poorly known insulin sensitivity and
often irregular intake, makes prandial insulin
administration difficult. As a result, it is overly
simplistic to just recommend “adequate insu-
lin” to control the glycemic excursion related
to meals.
Glycemic Control and Nutrition: A New Approach
A rational approach to nutrition for hospi-
talized patients that avoids hospital-related
malnutrition is to base nutrition intake on the
degree of malnutrition and seventy of illness.
Such an approach permits under-feeding,
when it is safe, and ensures that adequate
nutrition is provided during prolonged hospi-
talization and severe illness.
Our Nutrition and Metabolic Support
Service has used this approach to SNS. We
have minimized hyperglycemia both in
patients receiving PN and EN5. We stabilize
glycemic control first, then start with EN when
the blood glucose level is < 200 mg/dL or PN
at < 15 cal/kg/day, and advance to measuring
resting energy expenditure [REE] or synchro-
nously estimating increasing insulin doses as
needed. For patients who are eating, we have
developed a “glycemic control diet” (Table 2),
which provides controlled calories, adequate
protein and the same CHO with each meal,
to allow more predictable prandial insulin
Table 1. Harmful Effects of Hyperglycemia Related to Nutrition
• Impaired protein synthesis
• Catabolic
• Immunosuppresive and proinflamatory effects
• Increased mortality and complications in the critically ill
• Delayed gastric emptying
12%
10%
8%
6%
4%
2%
0%
Perc
ent o
f pat
ient
s
ICU HOSP
80-110 mg/dL
180-200 mg/dL
Figure. Surgical ICU Mortality with SNS2
Adapted from Van den Berghe, et al. NewEnglJMed 2001;345:1359-67.
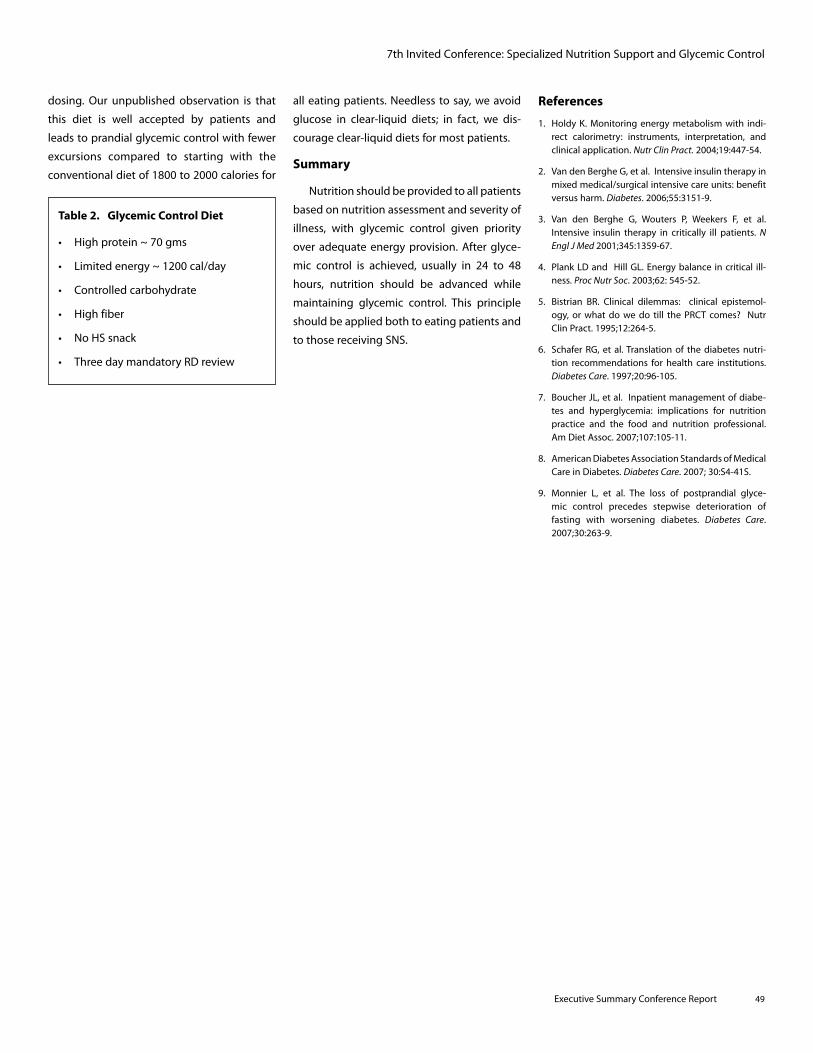
Executive Summary Conference Report 49
all eating patients. Needless to say, we avoid
glucose in clear-liquid diets; in fact, we dis-
courage clear-liquid diets for most patients.
Summary
Nutrition should be provided to all patients
based on nutrition assessment and severity of
illness, with glycemic control given priority
over adequate energy provision. After glyce-
mic control is achieved, usually in 24 to 48
hours, nutrition should be advanced while
maintaining glycemic control. This principle
should be applied both to eating patients and
to those receiving SNS.
dosing. Our unpublished observation is that
this diet is well accepted by patients and
leads to prandial glycemic control with fewer
excursions compared to starting with the
conventional diet of 1800 to 2000 calories for
Table 2. Glycemic Control Diet
• High protein ~ 70 gms
• Limited energy ~ 1200 cal/day
• Controlled carbohydrate
• High fiber
• No HS snack
• Three day mandatory RD review
7th Invited Conference: Specialized Nutrition Support and Glycemic Control
References
1. Holdy K. Monitoring energy metabolism with indi-rect calorimetry: instruments, interpretation, and clinical application. NutrClinPract. 2004;19:447-54.
2. Van den Berghe G, et al. Intensive insulin therapy in mixed medical/surgical intensive care units: benefit versus harm. Diabetes. 2006;55:3151-9.
3. Van den Berghe G, Wouters P, Weekers F, et al. Intensive insulin therapy in critically ill patients. NEnglJMed2001;345:1359-67.
4. Plank LD and Hill GL. Energy balance in critical ill-ness. ProcNutrSoc. 2003;62: 545-52.
5. Bistrian BR. Clinical dilemmas: clinical epistemol-ogy, or what do we do till the PRCT comes? Nutr Clin Pract. 1995;12:264-5.
6. Schafer RG, et al. Translation of the diabetes nutri-tion recommendations for health care institutions. DiabetesCare. 1997;20:96-105.
7. Boucher JL, et al. Inpatient management of diabe-tes and hyperglycemia: implications for nutrition practice and the food and nutrition professional. Am Diet Assoc. 2007;107:105-11.
8. American Diabetes Association Standards of Medical Care in Diabetes. DiabetesCare. 2007; 30:S4-41S.
9. Monnier L, et al. The loss of postprandial glyce-mic control precedes stepwise deterioration of fasting with worsening diabetes. Diabetes Care. 2007;30:263-9.
50 Executive Summary Conference Report
7th Invited Conference: Examining Medication Errors Associated with Intravenous Insulin
Examining Medication Errors Associated with Intravenous Insulin
John P. Santell, MS, RPh, FASHP, Director, Practitioner Programs and Services,
United States Pharmacopeia, Rockville, MD
While the risks and benefits of intensive
insulin therapy (IIT) to manage blood glucose
levels continues to be debated, it is impor-
tant to recognize that patient risks associ-
ated with insulin use go beyond episodes of
hypo/hyperglycemia. Medication errors that
can lead to adverse drug events (ADEs) are
another issue that should be included in the
discussion about the safety and efficacy of
insulin therapy. Medication errors are pre-
ventable events that arise from the interplay
between people, processes, technology and
products.
Medication errors involving insulin have
been reported for many years, but despite
this, their common occurrence continues1-5.
According to the most recent MEDMARX®
report published by the United States
Pharmacopeia (USP), insulin, in all its dosage
forms, has been the most commonly report-
ed product involved in errors overall and the
leading product involved in harmful errors6.
Analysis of these reported events by patient
safety experts has identified the following
problems with insulin.
• Ahand-written“U”forunitsbeingmisread
as a number
• The many types of insulin products
(approximately 26)
• Similarity between brand/generic names
and packages (e.g., Humalog Mix 75/25®
and Humulin 70/30® and Novolog Mix
70/30® and Novolin 70/30®)
• Wide access to insulin as floor stock in
most hospitals/health systems
• Manydosingschedulesand‘sliding-scales’
within an individual facility
• Non-standard, compounded intravenous
(IV) solutions and infusion rates
USP MEDMARX® Data Findings – IV Insulin
Analysis of data submitted to USP’s
MEDMARX® program during the five-year
period from January 2002- December 2006
provides additional information about the
severity, origin, types and causes of IV insulin
errors. During this period, 1,298 IV insulin
errors were reported with approximately 9.3%
(n = 121) of these causing harm to the patient.
The average percentage of harm for error
reports submitted to MEDMARX® has been
approximately 1.5%, indicating that an error
involving an IV insulin product is six times
more likely to result in harm (Categories E-I)
(Table 1) compared to other medicines.
Key points
• Insulintherapyisfraughtwithpatientsafetyconcernsandthepotentialfor
medicationerrors.
• USPMEDMARX®datashowthat:
− Comparedwithothermedicationerrors,intravenous(IV)insulinerrorsaresixtimes
morelikelytoresultinharm.
− ThemajorityofIVinsulinerrorsoccurduringadministrationbynurses.
− TheleadingcausesofIVinsulinerrorsareperformancedeficit,procedure/protocol
notfollowed,andcommunication.
• ThefollowingarefrequentproblemswithIVinsulintherapy:
− IVpumpprogrammingerrors
− ConfusingIVinsulinwithanotherIVpiggyback
− Orderincorrectlyenteredbypharmacy
− PatienttamperingwithIVpump
− Staffunfamiliarwithglucoseprotocolleadingtoinadequatemonitoring,
unclearcontrolorders
− Incompletedocumentation
• Policies,procedures,orprotocolsfortightglycemiccontrolshouldbedevelopedwith
considerationofthepotentialforincreasingtheopportunitiesforharmfulmedication
errorsandadversedrugevents.
PROCEEDINGS
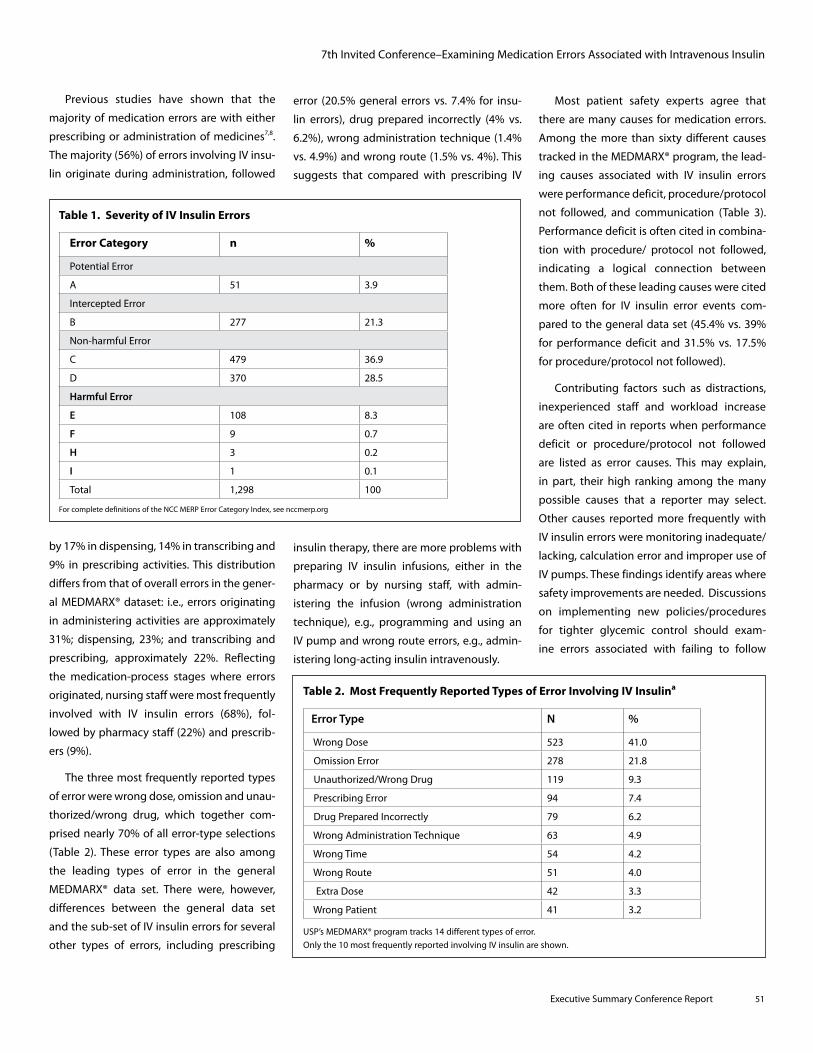
Executive Summary Conference Report 51
Previous studies have shown that the
majority of medication errors are with either
prescribing or administration of medicines7,8.
The majority (56%) of errors involving IV insu-
lin originate during administration, followed
by 17% in dispensing, 14% in transcribing and
9% in prescribing activities. This distribution
differs from that of overall errors in the gener-
al MEDMARX® dataset: i.e., errors originating
in administering activities are approximately
31%; dispensing, 23%; and transcribing and
prescribing, approximately 22%. Reflecting
the medication-process stages where errors
originated, nursing staff were most frequently
involved with IV insulin errors (68%), fol-
lowed by pharmacy staff (22%) and prescrib-
ers (9%).
The three most frequently reported types
of error were wrong dose, omission and unau-
thorized/wrong drug, which together com-
prised nearly 70% of all error-type selections
(Table 2). These error types are also among
the leading types of error in the general
MEDMARX® data set. There were, however,
differences between the general data set
and the sub-set of IV insulin errors for several
other types of errors, including prescribing
error (20.5% general errors vs. 7.4% for insu-
lin errors), drug prepared incorrectly (4% vs.
6.2%), wrong administration technique (1.4%
vs. 4.9%) and wrong route (1.5% vs. 4%). This
suggests that compared with prescribing IV
insulin therapy, there are more problems with
preparing IV insulin infusions, either in the
pharmacy or by nursing staff, with admin-
istering the infusion (wrong administration
technique), e.g., programming and using an
IV pump and wrong route errors, e.g., admin-
istering long-acting insulin intravenously.
Most patient safety experts agree that
there are many causes for medication errors.
Among the more than sixty different causes
tracked in the MEDMARX® program, the lead-
ing causes associated with IV insulin errors
were performance deficit, procedure/protocol
not followed, and communication (Table 3).
Performance deficit is often cited in combina-
tion with procedure/ protocol not followed,
indicating a logical connection between
them. Both of these leading causes were cited
more often for IV insulin error events com-
pared to the general data set (45.4% vs. 39%
for performance deficit and 31.5% vs. 17.5%
for procedure/protocol not followed).
Contributing factors such as distractions,
inexperienced staff and workload increase
are often cited in reports when performance
deficit or procedure/protocol not followed
are listed as error causes. This may explain,
in part, their high ranking among the many
possible causes that a reporter may select.
Other causes reported more frequently with
IV insulin errors were monitoring inadequate/
lacking, calculation error and improper use of
IV pumps. These findings identify areas where
safety improvements are needed. Discussions
on implementing new policies/procedures
for tighter glycemic control should exam-
ine errors associated with failing to follow
7th Invited Conference–Examining Medication Errors Associated with Intravenous Insulin
Table 1. Severity of IV Insulin Errors
Error Category n %
Potential Error
A 51 3.9
Intercepted Error
B 277 21.3
Non-harmful Error
C 479 36.9
D 370 28.5
Harmful Error
E 108 8.3
F 9 0.7
H 3 0.2
I 1 0.1
Total 1,298 100
For complete definitions of the NCC MERP Error Category Index, see nccmerp.org
Table 2. Most Frequently Reported Types of Error Involving IV Insulina
Error Type N %
Wrong Dose 523 41.0
Omission Error 278 21.8
Unauthorized/Wrong Drug 119 9.3
Prescribing Error 94 7.4
Drug Prepared Incorrectly 79 6.2
Wrong Administration Technique 63 4.9
Wrong Time 54 4.2
Wrong Route 51 4.0
Extra Dose 42 3.3
Wrong Patient 41 3.2
USP’s MEDMARX® program tracks 14 different types of error.
Only the 10 most frequently reported involving IV insulin are shown.
52 Executive Summary Conference Report
7th Invited Conference–Examining Medication Errors Associated with Intravenous Insulin
policies/procedures and insufficient patient
monitoring to avoid introducing new error
opportunities.
Selected Insulin Error Reports
Case #1: An insulin infusion was ordered
for an ICU patient. The infusion was started
at the wrong rate with subsequent bolus and
rate changes not administered as ordered by
the physician. Fasting blood sugar was 27mg/
dL, and the patient was found unresponsive
and diaphoretic. Dextrose 50% IV was ordered
and administered and the patient remained in
the ICU for a prolonged period of time.
Case #2: An insulin infusion was ordered
and started pre-operatively on a patient under-
going kidney transplant. Post-operatively, the
patient was transferred to the ICU without
the insulin drip. After this was discovered, it
was determined the patient’s blood glucose
was 443 mg/dL and significant electrolyte
abnormalities. Dialysis was reinstituted on the
patient, who also required a lengthened ICU
stay.
Case #3: A patient with diabetes in the ICU
was receiving an IV infusion of regular insulin
1unit/mL at a rate of 10 units/hour titrated
per sliding scale. After changing to a new bag
of insulin, the IV pump was reset manually to
clear prior totals and to enter the new volume
that was to be infused. Shortly after the new
bag was hung, a nurse noticed that the infu-
sion pump was incorrectly set at 150mL (i.e.,
150 units) per hour. The infusion was stopped
and the patient was given orange juice and
closely monitored for the next three hours.
If the total volume of the bag (100mL) had
been infused at the rate of 150mL/hour, it
would have taken only 40 minutes for the
patient to receive 100 units of insulin, poten-
tially causing irreversible brain damage and/
or death from cerebral edema and insulin
shock.
Common Error Scenarios
A review of several hundred reported error
events identified the following frequently
occurring problems:
• Incorrect infusion rates (generally by a
factor of 10) as a result of incorrectly pro-
gramming the IV pump (e.g., 60 units/hr vs
6 units/hr)
• Mix-ups with another IV piggyback (e.g.,
anesthesiologist infusing insulin thinking
it was the antibiotic)
• Order incorrectly entered by pharmacy
leading to incorrect concentration pre-
pared and infused
• Patient tamperingwith IV pump causing
an increased infusion rate
• Staff unfamiliar with glucose protocol
leading to inadequate monitoring, unclear
control orders
• Incompletedocumentationonmedication
administration record leading to unclear
or omitted rate information, when infu-
sion started, etc
• GeneralIVpumpprogrammingerrors
Conclusion
Insulin therapy is fraught with safety con-
cerns and the potential for medication errors.
Data submitted to USP’s MEDMARX® program
can help identify where safety risks exist and
how current practices contribute to error
events. Any discussion of implementing new
policies, procedures or protocols for tight
glycemic control should proactively evaluate
their potential for increasing the opportuni-
ties for medication errors and ADEs.
References
1. Cohen MR. Medication errors. Check and double-check all insulin doses. Nursing 1983;13(4):32.
2. Cohen MR. Lantus or lente insulin? The confusion builds. Nursing 2003;33(9):12.
3. Abbreviations Will Get U In Trouble. ISMP, 2007. (Accessed October 1, at <http://www.ismp.org/Newsletters/acutecare/archives/Aug97.asp>.)
4. Insulin Errors: A Common Problem. 2003. (Accessed October 1, 2007, at http://www.usp.org/pdf/EN/patientSafety/capsLink2003-07-01.pdf.)
5. Hicks R, Santell JP, Cousins DD, et al. MEDMARX® 5th Anniversary Data Report: A Chartbook of 2003 Findings and Trends 1999-2003. Rockville: USP Center for the Advancement of Patient Safety;2004.
6. Hicks R, Becker SC, Cousins DD. MEDMARX® Data Report: A Chartbook of Medication Error Findings from the Perioperative Settings from 1998-2005. Rockville: USP Center for the Advancement of Patient Safety;2006.
7. Bates DW, Cullen DJ, Laird N, et al. Incidence of adverse drug events and potential adverse drug events. Implications for prevention. ADE Prevention Study Group. JAmerMedAssn 1995;274(1):29-34.
8. Leape LL, Bates DW, Cullen DJ, et al. Systems analy-sis of adverse drug events. ADE Prevention Study Group. JAmerMedAssn 1995;274(1):35-43.
Table 3. Most Frequently Reported Causes of Error Involving IV Insulin
Cause of Error n %
Performance/ Human Deficit 583 45.4
Procedure / Protocol not followed 405 31.5
Communication 172 13.4
Knowledge deficit 159 12.4
Computer entry 140 10.9
Documentation 113 8.8
Monitoring inadequate / lacking 111 8.6
Calculation error 109 8.5
Pump, improper use 104 8.1
Transcription inaccurate/missing 100 7.8
USP’s MEDMARX® program tracks 67 different types of error.
Only the 10 most frequently reported involving IV insulin are shown.
Executive Summary Conference Report 53
PROCEEDINGS
Key points
• Aregionalfocusonprovidingoptimalinpatientcaretodiabeticpatientsisclearlyneeded.
• Statecollaborativessupportingchronicdiseasemanagement,includingdiabetes,inthe
outpatientsettinghavebecomeincreasinglycommonoverthepastdecade.
• Locallybased,inpatientqualitycollaboratives,inwhichhospitalsdirectlycompeting
formarketshareagreetocooperateandtransparentlysharetheirworkinquality
improvement,areanemergingphenomenon.
• InaregionalinpatientglycemiccontrolcollaborativeconvenedbySouthwestWashington
MedicalCenter(SWMC)inSeptember2006,participatinghospitalsshareglucometricdata
toassistmembersinidentifyingandlearningfrombestpracticesandtostimulateregional
improvementsininpatientglycemiccontrol.
• TheworkofataskforceconvenedbytheSocietyofHospitalMedicine(SHM)todevelop
practicalrecommendationsforglucometricsinthehospitalhasbeenhelpful.
• Theopensharingofdifferentapproachestoinpatientglycemiccontrolhasbenefitedall
institutionsinthecollaborative.
The Portland-Vancouver Regional Inpatient Glycemic Control Collaborative
Chris Hogness, MD, MPH, Southwest Washington Medical Center, Vancouver, WA
7th Invited Conference: The Portland-Vancouver Regional Inpatient Glycemic Control Collaborative
A focus on providing optimal inpatient
care to diabetic patients in our region is clear-
ly needed. From 1994 to 2004 the percentage
of adults with diabetes in Washington State
increased from 4% to 6%. In 2002, diabetes-
related hospitalizations in Washington State
cost $1.1 billion. One of the more important
sequellae of diabetes is cardiovascular dis-
ease, which was responsible for nearly 4 out
of 10 hospitalizations in Washington State in
20021.
State collaboratives supporting chronic
disease management, including diabetes, in
the outpatient setting have become increas-
ingly common over the past decade. For
example, more than 100 outpatient health-
care facilities participated in the Washington
State Collaborative on Diabetes and
Cardiovascular Disease from 1999 through
20051.
Locally based, inpatient quality collabora-
tives, in which hospitals directly competing
for market share agree to cooperate and
share their work in quality improvement, are
an emerging phenomenon. In some cases
this work has been coordinated by an out-
side intermediary (such as a state health
department, academic institution, or qual-
ity improvement advocacy group), either
nationally, as in the Institute for Healthcare
Improvement’s 100,000 Lives and 5 Million
Lives Campaigns, or locally, as in the Michigan
Health and Hospital Association’s Keystone
Center for Patient Safety and Quality collabor-
ative effort to reduce central-line-associated
blood stream infections.
Perhaps less commonly, local or regional
health care delivery organizations are directly
bringing themselves together to share qual-
ity improvement work. The announcement
in May 2007 that Adventist, Wellmont and
Novant health systems were launching a col-
laborative effort to reduce medical error by
“creating metrics and identifying best prac-
tices that can serve as a template for promot-
ing patient safety at hospitals nationwide” is
one example of what may become a more
widespread trend2.
There is much to gain and little to lose for
competing hospitals to collaborate in quality
improvement work. Hospitals who are fur-
thest along in developing a particular quality
improvement program may vault themselves
into a position of regional quality leadership
in convening a collaborative of local hospitals
to share their work. Hospitals less far along
the path can accelerate their progress by par-
ticipating in a regional quality improvement
collaborative and learning from the work of
peer organizations. Ultimately the patients
in the region benefit—and it is sometimes
worth emphasizing that one never knows
in which hospital one may be personally
a patient (including those of competing
organizations). This is what gives the quality
improvement dictum to “steal shamelessly
and share senselessly” its very rational foun-
dation.
54 Executive Summary Conference Report
7th Invited Conference: The Portland-Vancouver Regional Inpatient Glycemic Control Collaborative
The Portland-Vancouver Regional Inpatient Glycemic Control Collaborative
Following a one- to two-year period of
intense focus on inpatient glycemic con-
trol, Southwest Washington Medical Center
(SWMC) convened a regional inpatient gly-
cemic control collaborative initially attended
by nine hospitals in the Portland-Vancouver
area in September 2006. Hospital person-
nel who attended the first meeting included
physicians (hospitalists, surgeons and endo-
crinologists), nurse managers, diabetic edu-
cators and pharmacists from Oregon Health
and Sciences University, Kaiser Sunnyside, the
Portland VA hospital, Providence Portland,
Providence St. Vincent, Legacy Emanuel,
Legacy Salmon Creek, Adventist and SWMC.
We met in December 2006, March 2007 and
June 2007, and plan to continue meeting
with every three months for the foreseeable
future. Over this period other hospitals from
the Providence and Legacy systems joined
the group. The participating health system
farthest from the Portland-Vancouver metro-
politan area is Asante Health Systems in Bend,
Oregon.
All participating hospitals are committed
to transparently sharing glucometric data for
purposes of inter-hospital comparison across
the region. We believe that this will assist us
in identifying and learning from best prac-
tices, stimulating regional improvements in
inpatient glycemic control. The work of a task
force convened by the Society of Hospital
Medicine (SHM) to develop practical recom-
mendations for glucometrics in the hospital
has been helpful3.
Participating hospitals came to the col-
laborative with a wide range of experience
in inpatient glycemic control and varying
degrees of initial access to glucometric data.
Some, including SWMC, had already exam-
ined their hospitals’ glucometrics using a
glucometer-value denominator (e.g., percent
of glucometer values in different areas of the
hospital within specified ranges) as opposed
to a patient-denominator (e.g., percent of
patient-monitored days for which all or all
but one values are in a specified range). Some
hospitals were in the initial stages of getting
access to their data or had not yet begun to
do so.
At our June 2007 meeting, we agreed on
the following metrics with which to compare
data:
• Patient-monitoredday=adayonwhicha
patient has at least two glucometer values
recorded.
• Patient-controlleddayforwardpatients=
a patient-monitored day in which no more
than one glucometer value is outside of a
range of 70-180 mg/dL.
• Patient-controlled day for intensive care
unit (ICU) patients = a patient-monitored
day in which no more than one glucom-
eter value is outside of a range of 70-150
mg/dL.
In addition, for our ICU patients, many or
most of who are on insulin infusions, often
with hourly glucose checks, we will also com-
pare percent of glucometer values (glucom-
eter denominator as opposed to patient-mon-
itored day denominator) within the range of
70-150 mg/dL. This issue is addressed well in
the SHM document referenced above3.
As a collaborative, openly sharing our
different approaches to inpatient glycemic
control has benefited all participating institu-
tions. SWMC has shared the process we used
to develop a pharmacist/clinical diabetic edu-
cator (CDE)-centered glycemic control team
with other institutions thinking of developing
similar teams. We also have shared our work in
educating nursing in glycemic control and in
developing insulin infusions, e.g., the recently
published SWMC protocol4. At our June meet-
ing, collaborating institutions agreed to inves-
tigate each instance of a glucose less than 40
mg/dL and to report back to the group on this
process at our fall meeting. We feel that meet-
ing at three-month intervals works well for us
at this time.
We have done this work without budgeted
financial support. This may be a limiting factor
as the group considers taking on more struc-
tured, regional quality improvement activities.
One possibility for collaboratives to obtain
funding may be to approach insurance com-
panies or other potential donors to support
the development of a more well-resourced,
formalized collaborative focused on assisting
all hospitals in the region to achieve optimal
institutional glycemic control.
National networking with benchmark
institutions has also been useful to many of
us in the collaborative. The range of prac-
tices reported in the SHM Workbook for
Improvement on inpatient glycemic control
has been helpful in this regard4. Other oppor-
tunities for national collaboration may emerge
from a national training conference for quality
improvement teams working on inpatient gly-
cemic control hosted by SWMC and Oregon
Health and Sciences University in Vancouver,
Washington in October 2007. This program
targets the range of people involved in inpa-
tient glycemic control, including pharmacists,
CDEs, nurses, quality improvement personnel,
information systems staff, hospitalists, endo-
crinologists, surgeons, critical care physicians,
hospital administrators and others.
References
1. Washington State Diabetes Collaborative Website: http://www.doh.wa.gov/cfh/WSC/default.htm accessed 7/6/2007.
2. Health Care Advisory Board newsletter, May 2007.
3. Society of Hospital Medicine Workbook for Improvement titled: Improving Glycemic Control, Preventing Hypoglycemia, and Optimizing Care of the Inpatient with Hyperglycemia and Diabetes; 27-43. http://www.hospitalmedicine.org/AM/Template.cfm?Section=Quality_Improvement_Resource_
Executive Summary Conference Report 55
7th Invited Conference: The Portland-Vancouver Regional Inpatient Glycemic Control Collaborative
R o o m s & Te m p l a t e = / C M / C o n t e n t D i s p l a y .cfm&ContentID=11878
4. Hogness C, Finneman L, Chandler P, et al. Effective implementation of a new 6-column insulin infu-sion protocol in the ICU. The Hospitalist 2006 December;10(12):42-4. http://media.wiley.com/assets/1146/32/TH1206.pdf.
PROCEEDINGS
56 Executive Summary Conference Report
Building Transitions from the ICU to the Ward for the Hyperglycemic Patient: One Piece of the Puzzle
Greg Maynard, MD, MS, Associate Clinical Professor of Medicine and Chief,
University of California at San Diego, Division of Hospital Medicine, San Diego, CA
7th Invited Conference: Building Transitions from the ICU to the Ward for the
Hyperglycemic Patient: One Piece of the Puzzle
Key points
• Arational,step-wiseapproachcanensuresuccessfultransitionsfromintravenousto
subcutaneousinsulinregimens.
• Somevariationofthisstep-wiseapproachtotransitionshouldbedevelopedintoa
standardizedprotocolforeveryinstitution.
• Multiplemethodscanenhancereliabilityofprotocoluse,including:
– Educatestaffabouttheprotocol.
– Designtheprotocolguidanceintotheordersusedatthepointofcare.
– Maketheprotocolthe“default”methodformakingthetransition.
– Automateordelegatespecialteamstoassistinthetransition.
– Measureresultsobtainedafterprotocolimplementationtofurtherrefineand
revisetheprotocol.
• TheSocietyofHospitalMedicinehasaweb-based“GlycemicControlResourceRoom”1
designedtoassistGlycemicControlteamswithallaspectsofbuildingandeffectively
implementingaseriesoflinkedglycemiccontrol/hypoglycemiapreventionprotocols.
Case Study
RW is a 60-year-old hyperglycemic male
in the intensive care unit (ICU) with multiple
medical problems. He is on full-dose, con-
tinuous tube feedings at 40 mL/hr, and he has
been on intravenous (IV) insulin infusion at a
stable rate of 3 units/hr over the last 6 hours.
Prior to falling ill, his baseline A1c was 8.7%,
and his outpatient regimen was 30 units of
70/30 mixed insulin and an oral hypoglyce-
mic agent. The problem: maintaining good
glycemic control safely as RW transitions to a
general medical ward that does not support
IV insulin infusion, while continuing enteral
tube feeding.
Mismanagement of transitions like this
may lead to prolonged hyperglycemia, hypo-
glycemia or, in the case of an insulin-depen-
dent patient deprived of basal insulin, dia-
betic ketoacidosis (DKA). Safe and effective
transitions can be accomplished reliably with
the use of a step-by-step method that we are
adopting at our institution.
Step 1. Calculate the amount of insulin
the patient requires over 24 hours. For
example, an insulin infusion rate of 3 units/hr
would lead to an insulin requirement of 72
units in 24 hours (Table 1).
Step 2. Decrease this dose to ensure
a safety cushion. Just as insulin require-
ments increase with increasing physiologic
stress and illness, insulin requirements can be
reduced as the patient improves. One meth-
od to insert a safety cushion is to simply take
the most recent stable-infusion rate times 20
(instead of 24). In the above example, this
yields an estimate of 60 units. Note that while
you have introduced a safety cushion, your
estimate of insulin requirement is still twice
the insulin dose RW took as an outpatient.
Step 3. Assess whether the insulin
requirement was furnishing basal insulin
needs, or basal and nutritional needs. In
Table 1. Step-wise Approach: Transitioning from IV to SC Insulin
• Calculate how much IV insulin the patient has been requiring. Modify down for
safety cushion.
• Was this insulin supplying basal requirements, or basal and nutritional
requirements? Translate into the subcutaneous regimen.
• Consider any nutritional changes that may be implemented at the time of the
transition off of the drip.
• Make sure SC insulin is given before discontinuation of the IV insulin.
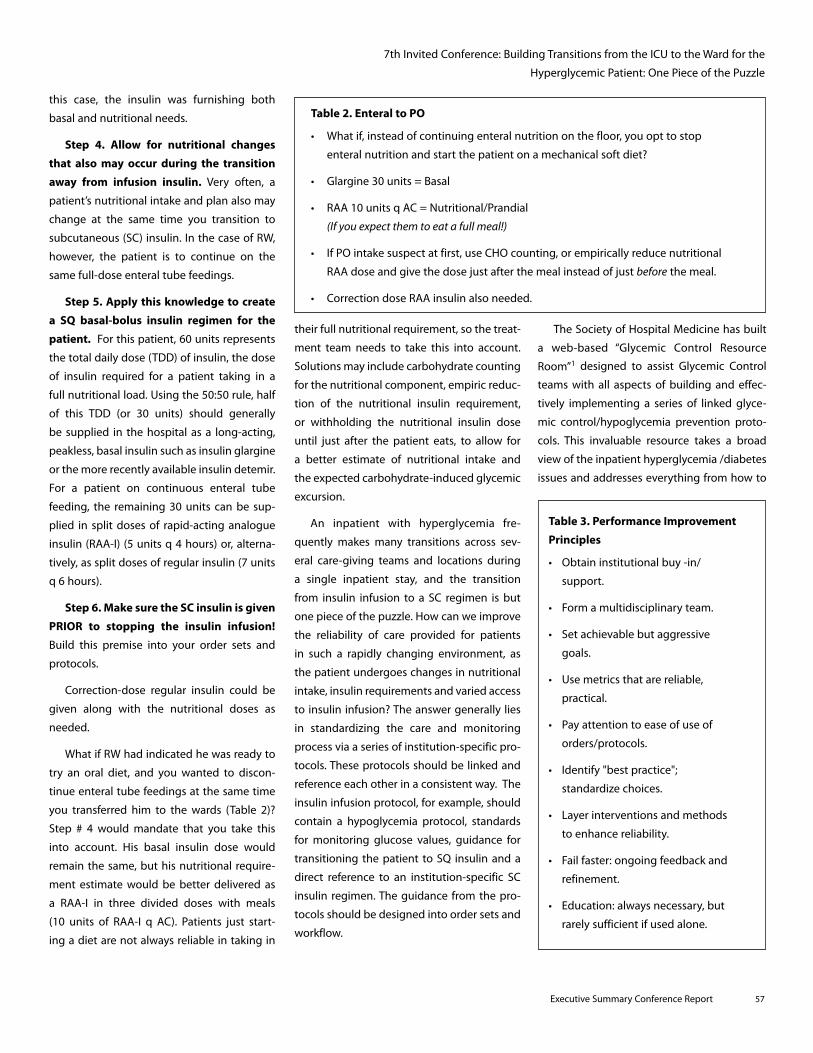
Executive Summary Conference Report 57
7th Invited Conference: Building Transitions from the ICU to the Ward for the
Hyperglycemic Patient: One Piece of the Puzzle
this case, the insulin was furnishing both
basal and nutritional needs.
Step 4. Allow for nutritional changes
that also may occur during the transition
away from infusion insulin. Very often, a
patient’s nutritional intake and plan also may
change at the same time you transition to
subcutaneous (SC) insulin. In the case of RW,
however, the patient is to continue on the
same full-dose enteral tube feedings.
Step 5. Apply this knowledge to create
a SQ basal-bolus insulin regimen for the
patient. For this patient, 60 units represents
the total daily dose (TDD) of insulin, the dose
of insulin required for a patient taking in a
full nutritional load. Using the 50:50 rule, half
of this TDD (or 30 units) should generally
be supplied in the hospital as a long-acting,
peakless, basal insulin such as insulin glargine
or the more recently available insulin detemir.
For a patient on continuous enteral tube
feeding, the remaining 30 units can be sup-
plied in split doses of rapid-acting analogue
insulin (RAA-I) (5 units q 4 hours) or, alterna-
tively, as split doses of regular insulin (7 units
q 6 hours).
Step 6. Make sure the SC insulin is given
PRIOR to stopping the insulin infusion!
Build this premise into your order sets and
protocols.
Correction-dose regular insulin could be
given along with the nutritional doses as
needed.
What if RW had indicated he was ready to
try an oral diet, and you wanted to discon-
tinue enteral tube feedings at the same time
you transferred him to the wards (Table 2)?
Step # 4 would mandate that you take this
into account. His basal insulin dose would
remain the same, but his nutritional require-
ment estimate would be better delivered as
a RAA-I in three divided doses with meals
(10 units of RAA-I q AC). Patients just start-
ing a diet are not always reliable in taking in
their full nutritional requirement, so the treat-
ment team needs to take this into account.
Solutions may include carbohydrate counting
for the nutritional component, empiric reduc-
tion of the nutritional insulin requirement,
or withholding the nutritional insulin dose
until just after the patient eats, to allow for
a better estimate of nutritional intake and
the expected carbohydrate-induced glycemic
excursion.
An inpatient with hyperglycemia fre-
quently makes many transitions across sev-
eral care-giving teams and locations during
a single inpatient stay, and the transition
from insulin infusion to a SC regimen is but
one piece of the puzzle. How can we improve
the reliability of care provided for patients
in such a rapidly changing environment, as
the patient undergoes changes in nutritional
intake, insulin requirements and varied access
to insulin infusion? The answer generally lies
in standardizing the care and monitoring
process via a series of institution-specific pro-
tocols. These protocols should be linked and
reference each other in a consistent way. The
insulin infusion protocol, for example, should
contain a hypoglycemia protocol, standards
for monitoring glucose values, guidance for
transitioning the patient to SQ insulin and a
direct reference to an institution-specific SC
insulin regimen. The guidance from the pro-
tocols should be designed into order sets and
workflow.
The Society of Hospital Medicine has built
a web-based “Glycemic Control Resource
Room”1 designed to assist Glycemic Control
teams with all aspects of building and effec-
tively implementing a series of linked glyce-
mic control/hypoglycemia prevention proto-
cols. This invaluable resource takes a broad
view of the inpatient hyperglycemia /diabetes
issues and addresses everything from how to
Table 2. Enteral to PO
• What if, instead of continuing enteral nutrition on the floor, you opt to stop
enteral nutrition and start the patient on a mechanical soft diet?
• Glargine 30 units = Basal
• RAA 10 units q AC = Nutritional/Prandial
(Ifyouexpectthemtoeatafullmeal!)
• If PO intake suspect at first, use CHO counting, or empirically reduce nutritional
RAA dose and give the dose just after the meal instead of just before the meal.
• Correction dose RAA insulin also needed.
Table 3. Performance Improvement
Principles
• Obtain institutional buy -in/
support.
• Formamultidisciplinaryteam.
• Setachievablebutaggressive
goals.
• Usemetricsthatarereliable,
practical.
• Payattentiontoeaseofuseof
orders/protocols.
• Identify"bestpractice";
standardize choices.
• Layerinterventionsandmethods
to enhance reliability.
• Failfaster:ongoingfeedbackand
refinement.
• Education:alwaysnecessary,but
rarely sufficient if used alone.
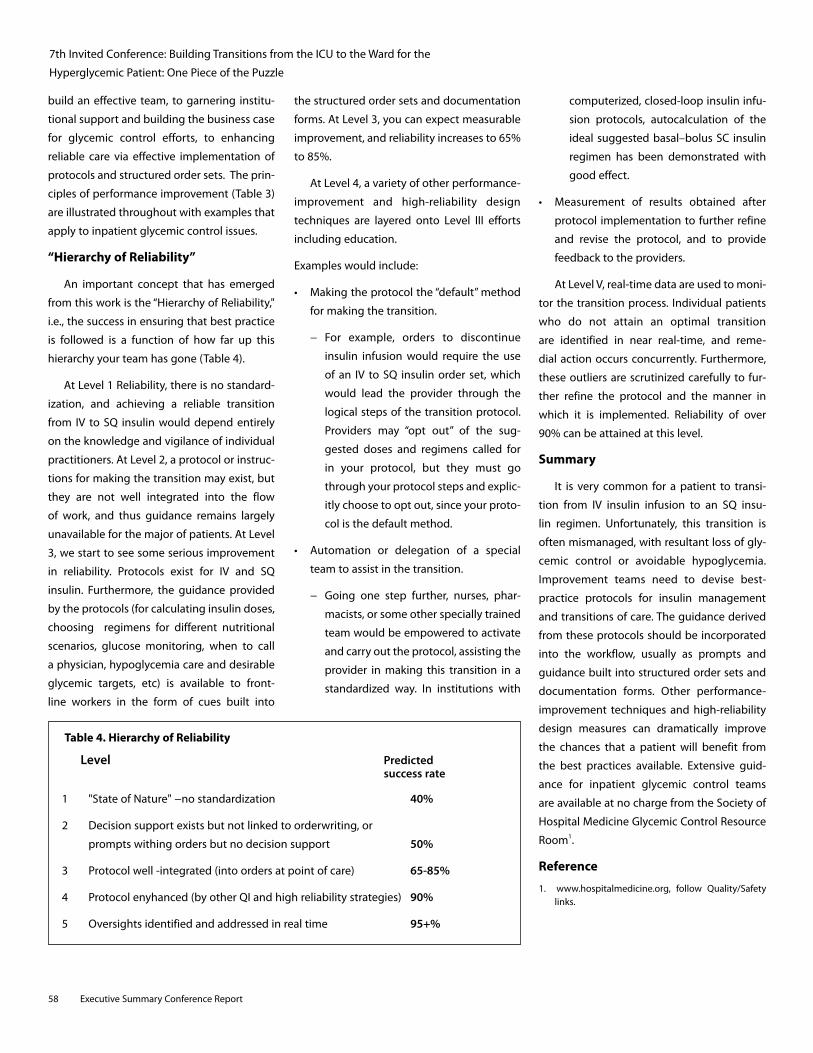
58 Executive Summary Conference Report
7th Invited Conference: Building Transitions from the ICU to the Ward for the
Hyperglycemic Patient: One Piece of the Puzzle
build an effective team, to garnering institu-
tional support and building the business case
for glycemic control efforts, to enhancing
reliable care via effective implementation of
protocols and structured order sets. The prin-
ciples of performance improvement (Table 3)
are illustrated throughout with examples that
apply to inpatient glycemic control issues.
“Hierarchy of Reliability”
An important concept that has emerged
from this work is the “Hierarchy of Reliability,"
i.e., the success in ensuring that best practice
is followed is a function of how far up this
hierarchy your team has gone (Table 4).
At Level 1 Reliability, there is no standard-
ization, and achieving a reliable transition
from IV to SQ insulin would depend entirely
on the knowledge and vigilance of individual
practitioners. At Level 2, a protocol or instruc-
tions for making the transition may exist, but
they are not well integrated into the flow
of work, and thus guidance remains largely
unavailable for the major of patients. At Level
3, we start to see some serious improvement
in reliability. Protocols exist for IV and SQ
insulin. Furthermore, the guidance provided
by the protocols (for calculating insulin doses,
choosing regimens for different nutritional
scenarios, glucose monitoring, when to call
a physician, hypoglycemia care and desirable
glycemic targets, etc) is available to front-
line workers in the form of cues built into
the structured order sets and documentation
forms. At Level 3, you can expect measurable
improvement, and reliability increases to 65%
to 85%.
At Level 4, a variety of other performance-
improvement and high-reliability design
techniques are layered onto Level III efforts
including education.
Examples would include:
• Makingtheprotocolthe“default”method
for making the transition.
− For example, orders to discontinue
insulin infusion would require the use
of an IV to SQ insulin order set, which
would lead the provider through the
logical steps of the transition protocol.
Providers may “opt out” of the sug-
gested doses and regimens called for
in your protocol, but they must go
through your protocol steps and explic-
itly choose to opt out, since your proto-
col is the default method.
• Automation or delegation of a special
team to assist in the transition.
− Going one step further, nurses, phar-
macists, or some other specially trained
team would be empowered to activate
and carry out the protocol, assisting the
provider in making this transition in a
standardized way. In institutions with
computerized, closed-loop insulin infu-
sion protocols, autocalculation of the
ideal suggested basal–bolus SC insulin
regimen has been demonstrated with
good effect.
• Measurement of results obtained after
protocol implementation to further refine
and revise the protocol, and to provide
feedback to the providers.
At Level V, real-time data are used to moni-
tor the transition process. Individual patients
who do not attain an optimal transition
are identified in near real-time, and reme-
dial action occurs concurrently. Furthermore,
these outliers are scrutinized carefully to fur-
ther refine the protocol and the manner in
which it is implemented. Reliability of over
90% can be attained at this level.
Summary
It is very common for a patient to transi-
tion from IV insulin infusion to an SQ insu-
lin regimen. Unfortunately, this transition is
often mismanaged, with resultant loss of gly-
cemic control or avoidable hypoglycemia.
Improvement teams need to devise best-
practice protocols for insulin management
and transitions of care. The guidance derived
from these protocols should be incorporated
into the workflow, usually as prompts and
guidance built into structured order sets and
documentation forms. Other performance-
improvement techniques and high-reliability
design measures can dramatically improve
the chances that a patient will benefit from
the best practices available. Extensive guid-
ance for inpatient glycemic control teams
are available at no charge from the Society of
Hospital Medicine Glycemic Control Resource
Room1.
Reference
1. www.hospitalmedicine.org, follow Quality/Safety links.
Table 4. Hierarchy of Reliability
Level Predicted success rate
1 "State of Nature" −no standardization 40%
2 Decision support exists but not linked to orderwriting, or
prompts withing orders but no decision support 50%
3 Protocol well -integrated (into orders at point of care) 65-85%
4 Protocol enyhanced (by other QI and high reliability strategies) 90%
5 Oversights identified and addressed in real time 95+%
Executive Summary Conference Report 59
PROCEEDINGS
Glucose Control and (Continuous) Glucose Monitoring in Critical Illness
Christophe De Block, MD Ph, Department of Diabetology, Antwerp University Hospital, and
the Antwerp Metabolic Research Unit, Antwerp University, Belgium
7th Invited Conference: Glucose Control and (Continuous) Glucose Monitoring in Critical Illness
Key points
• Stresshyperglycemiaoccursin50%to80%ofcriticallyillpatientsandhasbecomean
importanttherapeutictargetincriticallyillpatients.
• Aggressivetreatmentofhyperglycemiawithinsulinmaybelimitedbyanincreasedrisk
ofhypoglycemia.
• Afactorthatmaycontributetohypoglycemiaisinsufficientfrequencyofglucose
monitoring.
• Recentevidencesuggeststhatcontinuousmonitoringofglucoselevelsmayhelptosignal
glycemicexcursionsandeventuallytooptimizetitrationofinsulintherapyintheICU.
Stress hyperglycemia occurs in 50% to
80% of critically ill patients and has become
an important therapeutic target in critically
ill patients. Hyperglycemia is associated with
adverse outcome, not only after myocardi-
al infarction, coronary artery bypass graft,
stroke, and trauma, but also in the intensive
care unit (ICU). Intensive insulin therapy (IIT)
to maintain strict normoglycemia has been
shown to reduce morbidity and the length of
stay in the ICU and hospital. IIT may be associ-
ated with an increased risk of hypoglycemia.
The inherent clinical perturbations of criti-
cally ill patients result in frequent changes in
insulin needs that require extensive efforts
from nurses. Current insulin titration is based
upon discontinuous glucose measurements,
which may miss rapid changes in glycemia.
Continuous monitoring of glucose levels may
help to signal glycemic excursions and even-
tually to optimize titration of insulin therapy
in the ICU.
Clinical Impact of Hyperglycemia and Benefits of Insulin Therapy in the ICU
The studies of Van den Berghe et al.
showed that ITT to achieve normoglycemia
reduced the incidence of acute renal failure
and accelerated discharge from the ICU and
the hospital1,2. In contrast to the surgical ICU,
in the medical ICU, in-hospital mortality was
reduced only among patients staying for
three days or longer. Most likely, the benefi-
cial effects of IIT require time to be realized,
because insulin therapy is aimed not at cur-
ing disease but at preventing complications.
The impact of hyperglycemia on mortality
varies depending on the background severity
and type of illness.
Whether attainment of strict normoglyce-
mia or administration of insulin is the decisive
factor that explains the clinical benefits of IIT
is open for discussion. A linear correlation
between the degree of hyperglycemia and
the risk of death, which persisted after cor-
rection for insulin dose and severity of illness,
has been demonstrated3.
Aggressive treatment of hyperglycemia
with insulin may, however, be limited by an
increased risk of hypoglycemia. Recognition
of hypoglycemia in a patient who is receiv-
ing sedatives and analgesics and/or neu-
romuscular blocking agents in the ICU is
problematic, since the hypoglycemic state
may go unrecognized for a critical period
before treatment. The German VISEP trial was
stopped prematurely because no differences
in mortality and frequent hypoglycemia were
found in the intensive insulin therapy arm4.
Interestingly, no adverse clinical outcome
associated with hypoglycemia was reported
in any study. One factor that may contribute
to hypoglycemia is insufficient frequency of
glucose monitoring.
Management of Hyperglycemia
To achieve strict glycemic control in
critically ill patients, the implementation of
insulin infusion protocols based on frequent
glucose monitoring is required. First, precipi-
tating causes of stress hyperglycemia should
be identified and treated. Second, the patient
population in which insulin therapy may be
of benefit should be clearly defined. Third,
consensus should be obtained regarding the
glycemia target level. Fourth, glycemic excur-
sions should be carefully monitored, prefer-
ably on a continuous base, and a validated,
easily implementable insulin infusion proto-
col should be provided.
What level of glycemia should be the
target? The Society for Critical Care Medicine
recently recommended maintaining a blood
glucose level of < 150 mg/dL in patients with
60 Executive Summary Conference Report
7th Invited Conference: Glucose Control and (Continuous) Glucose Monitoring in Critical Illness
severe sepsis5. The target glycemia in the
Leuven studies was 80-110 mg/dL1,2. Krinsley
observed the lowest in-hospital mortality in
critically ill patients with a mean blood glu-
cose of 80-99 mg/dL6, whereas Finney et al.
observed a mortality benefit with a specula-
tive upper limit of 145 mg/dL in cardiotho-
racic surgery patients7. Data are difficult to
interpret because of the diverse clinical set-
tings, the varying methods of insulin admin-
istration, and different targets of glycemic
control. The American Diabetes Association
and the American College of Endocrinology
have published guidelines recommending
in-hospital IIT to maintain preprandial blood
glucose levels at ≤ 110 mg/dL in critical
care patients8. Postprandial glycemia should
be kept < 180 mg/dL in any hospitalized
patient.
Glucose control and monitoring in the ICU.
Insulin requirements vary widely in patients
depending on insulin sensitivity, caloric
intake, the nature and fluctuating severity of
the underlying illness and the administration
of medications. The analysis of the correct
amount of insulin to be administered requires
a relatively high degree of skill, and frequent
expert assessment will be needed as the clini-
cal situation changes9,10.
A standardized protocol that prompts
users to initiate an insulin drip for critically ill
patients to maintain normoglycemia should
be developed. Goldberg et al. proposed a
comprehensive, validated insulin infusion
protocol (IIP)9 that took into account the
current and previous blood glucose level to
calculate the rate of glycemic change, and
the current insulin infusion rate. IIPs add
significantly to the work of managing ICU
patients. Another obstacle to implementing
IIPs is the fear of hypoglycemia in patients
being treated. The transition from intrave-
nous (IV) to subcutaneous (SC) insulin should
be an integral part of any insulin infusion
protocol. This transition can be considered
in extubated patients who are taking regular
meals and do not have signs of infections,
provided that an infusion of ≤ 3 units/hr is
sufficient to maintain normoglycemia.
Current Methods to Evaluate Glycemic Control in the ICU
Glucose indices. To objectively assess glu-
cose control in acutely ill patients, the magni-
tude and duration of hyperglycemia should
be evaluated. Indices of glucose regulation
that have been used in acutely ill patients
are admission glucose regulation, maximum
and mean glucose. However, these indices
are based on either a single measurement or
on a subset of measurements, and thus are
not indicative of overall glycemia and give no
indication of blood glucose variability.
Continuous Glucose Monitoring Systems (CGMS) in the ICU
Rationale for use. A continuous display of
blood glucose levels seems to be essential for
optimal titration of insulin therapy in the ICU.
Besides giving an indication of overall glyce-
mia, it shows the variability and fluctuations
of blood glucose concentrations which may
affect patient outcome.
Technical requirements and validation for
the ICU. Data on the reliability of CGMS in
diabetic patients cannot be automatically
applied to a different situation such as the
ICU, where many variables can affect CGMS
performance (edema, hypotension, vasoac-
tive drugs, etc.). Necessary requirements for
a CGMS include immediate availability of
the measurement result, a high frequency of
measurements, and fast sensor signal stabil-
ity after application and over time11.
Current CGMS measure glucose in the
interstitial fluid. Changes of glucose concen-
trations in interstitial fluid lag behind those
in the blood by a few seconds to up to 15
minutes. The lag time seems to be consistent,
irrespective of increments/decrements in gly-
cemia and insulin levels12-14. In the ICU, the
hemodynamic alterations we encountered
(hypotension, shock, vasopressor/inotropic
need) did not worsen accuracy15. Instead,
such variables would affect the process of
subcutaneous glucose recovery, resulting in
a calibration issue, rather than in a sensor
performance issue. A lag time of < 10 min is
clinically acceptable since online adjustment
of insulin dose occurs every hour and should
be based on immediate detection by CGM of
unacceptable rates of change (> 25 mg/dL/
hour).
CGM accuracy improves with an increasing
number of calibration points15,16. Calibration
should also be performed in times of glucose sta-
bility (< 10% change in glucose over 9 minutes
for the GlucoDay®, and a rate of change in glu-
cose < 2 mg/dL/min for the CGMS and Freestyle
Navigator® Continuous Glucose Monitor).
Only a few studies used CGM in critically ill
patients15,17-20. In a pilot study using continu-
ous glucose monitoring (GlucoDay®) in the
medical ICU, rapid changes in glycemia were
noted immediately, whereas these were noted
much later (~1-3 hours) when only intermit-
tent blood glucose determinations were used.
Hyperglycemia was present in 74% of medical
ICU patients, and target glycemia (80-110 mg/
dL) was reached only 22% of the time, which
reveals the inadequacy of current insulin pro-
tocols to optimize glycemia and suggests the
potential of an accurate continuous glucose
monitoring system in this setting15. Similar
results were reported by Goldberg et al. using
the CGMS device (Medtronic MiniMed Inc.,
Northridge, CA) in a medical ICU17. The pres-
ence of edema or hypotension, and the use of
vasopressors did not affect sensor accuracy.
There were no serious adverse events report-
ed during the use of the CGMS. Vriesendorp
et al., who used the GlucoDay® device during
and after surgery, encountered a high techni-
cal failure rate18, which was mainly attributed
to breaking of the microdialysis fiber during
transfer from the surgical bench to the ICU
bed. Using CGMS, Baird et al. observed that
acute and final infarct volume change and
outcome were negatively affected in patients
with mean blood glucose levels ≥126 mg/
dL19.
Executive Summary Conference Report 61
7th Invited Conference: Glucose Control and (Continuous) Glucose Monitoring in Critical Illness
Chee et al. conducted a study to determine
if the CGMS device could be used in real-time
to control glycemia in five critically ill patients.
A closed-loop control system was constructed
to use CGMS in a real-time manner, coupled
with a proportional integral (PI) control algo-
rithm based on a sliding scale approach for
automatic IV insulin infusion. They concluded
that the automatic sliding scale approach of
closed-loop glycemic control is feasible in
ICU patients, but the algorithm needs refine-
ment and the sensor accuracy needs to be
improved20.
How to use data obtained with CGM? The
vast amount of data collected during CGM
must be presented in an understandable way
so that the physician can interpret it ade-
quately. First, the CGM System should display
the actual (real-time) glucose measurement,
and a warning alarm should be available if the
actual glucose value is outside a predefined
target value. Second, CGM provides trend
information, making it possible to predict
the course of glucose changes for over lon-
ger time periods. Third, CGM data not only
highlight the cumulative hyper- and hypo-
glycemia, but also show glucose fluctuations.
The use of CGMS in critically ill patients
looks promising. If further developed as a
"real-time" glucose sensor, CGMS technology
could ultimately prove clinically useful in the
ICU by providing alarm signals for impend-
ing glycemic excursions, rendering IIT easier
and safer. The development of a closed-loop
control system, with an accurate CGMS and
computer-assisted titration of insulin dose
based on glucose measurements, could per-
mit tight glycemic control without increas-
ing the workload of the nursing staff. Plank
et al. observed that, compared with rou-
tine protocols, treatment according to a fully
automated model-predictive-control (MPC)
algorithm resulted in a significantly higher
percentage of time within the target glycemic
range (80-110 mg/dL)21. The European com-
munity-funded CLINICIP (Closed Loop Insulin
Infusion for Critically Ill Patients) project aims
to develop a low-risk monitoring and control
system that allows health care providers to
maintain strict glycemic control in ICUs using
a SC-IV closed-loop system.
Conclusion
Stress hyperglycemia is highly prevalent
in the ICU and is associated with adverse
outcome. IIT to achieve normoglycemia may
reduce mortality and morbidity. Identification
of the hyperglycemic patient with timely,
cost-effective, and comprehensive evaluation
and risk stratification may facilitate appropri-
ate implementation of therapies and proce-
dures that may enhance outcome. Current
insulin titration is based upon discontinuous
glucose measurements, which may miss rapid
changes in glycemia. Recent evidence sug-
gests that continuous monitoring of glucose
levels may help to signal glycemic excursions
and eventually to optimize titration of insulin
therapy in the ICU.
References
1. Van den Berghe G, Wouters P, Weekers F, et al. Intensive insulin therapy in critically ill patients. NEnglJMed 2001; 345:1359–67.
2. Van den Berghe G, Wilmer A, Hermans G, et al. Intensive insulin therapy in the medical ICU. NEnglJMed2006; 354:449–61.
3. Van den Berghe G, Wouters PJ, Bouillon R, et al. Outcome benefit of intensive insulin therapy in the critically ill: insulin dose versus glycemic control. CritCareMed 2003; 31:359-66.
4. Brunkhorst FM, Kuhnt E, Engel C, et al., and the German Competence Network Sepsis (SepNet). Intensive insulin therapy in patients with severe sep-sis and septic shock is associated with an increased rate of hypoglycaemia – results from a randomized multicenter study (VISEP). Infection 2005; 33(Suppl 1):19.
5. Dellinger RP, Carlet JM, Masur H, et al. Surviving sepsis campaign guidelines for management of severe sepsis and septic shock. CritCareMed 2004; 32:858-73.
6. Krinsley JS. Association between hyperglycemia and increased hospital mortality in a heterogenous population of critically ill patients. Mayo Clin Proc 2003;78:1471-8.
7. Finney SJ, Zekveld C, Elia A, Evans TW. Glucose con-trol and mortality in critically ill patients. JAmerMedAssn 2003; 290:2041-7.
8. ACE/ADA Task Force on Inpatient Diabetes. American College of Endocrinology and American Diabetes Association consensus statement on inpa-tient diabetes and glycemic control. DiabetesCare 2006;29:1955-62.
9. Goldberg PA, Siegel M, Sherwin RS, et al. Implementation of a safe and effective insulin infusion protocol in a medical intensive care unit. DiabetesCare 2004; 27:461-67.
10. Clement S, Braithwaite SS, Magee MF, et al., on behalf of the Diabetes in Hospitals Writing Committee. Management of diabetes and hyperglycemia in hos-pitals. DiabetesCare 2004;27:553-91.
11. Koschinsky T, Heinemann L. Sensors for glucose monitoring: technical and clinical aspects. DiabetesMetabResRev 2001;17:113-23.
12. Steil GM, Rebrin K, Hariri F, et al. Interstitial fluid glucose dynamics during insulin-induced hypogly-caemia. Diabetologia 2005;48:1833-40.
13. Boyne MS, Silver DM, Kaplan J, et al. Timing of changes in interstitial and venous blood glucose measured with a continuous subcutaneous glucose sensor. Diabetes 2003;52:2790-4.
14. Rossetti P, Porcellati F, Fanelli CG, et al. Evaluation of the accuracy of a microdialysis-based glucose sensor during insulin-induced hypoglycaemia, its recovery, and post-hypoglycemic hyperglycemia in humans. DiabetesTechnolTher 2006;8:326-37.
15. De Block C, Manuel-y-Keenoy B, Van Gaal L, Rogiers P. Intensive insulin therapy in the intensive care unit. Assessment by continuous glucose monitor-ing.DiabetesCare 2006;29:1750-6.
16. Diabetes in Research Children Network (DirectNet) Study Group. Evaluation of factors affecting CGMS calibration. DiabetesTechnolTher 2006; 8:318-25.
17. Goldberg PA, Siegel M, Russell RR, et al. Experience with the continuous glucose monitoring system in a medical intensive care unit. DiabetesTechnolTher2004;6:339-47.
18. Vriesendorp T, DeVries J, Holleman F, et al. The use of two continuous glucose sensors during and after surgery. DiabetesTechnolTher 2005;7:315-22.
19. Baird TA, Parsons MW, Phanh T, et al. Persistent post-stroke hyperglycemia is independently associated with infarct expansion and worse clinical outcome. Stroke 2003; 34:2208-14.
20. Chee F, Fernando T, van Heerden PV. Closed-loop glucose control in critically ill patients using con-tinuous glucose monitoring system (CGMS) in real time. IEEETransInfTechnolBiomed 2003;7:43-53.
21. Plank J, Blaha J, Cordingley J, et al. Multicentric, ran-domized, controlled trial to evaluate blood glucose control by the model predictive control algorithm versus routine glucose management protocols in intensive care unit patients. Diabetes Care 2006; 29:271-6.
PROCEEDINGS
62 Executive Summary Conference Report
Key points
• Generalagreementnowexiststhatnormalizationofbloodglucoselevelsthroughinsulin
administrationisdesirableforallhyperglycemicpatients.
• Deliveringinsulinsafely(toavoidhypoglycemia)andeffectively(toachievetheincreasingly
strictglucosetargets)requiresmeticulousmonitoringofbloodglucoselevels,andglucose
sensorsareacriticalcomponentofaneffectiveglucosecontrolsystem.
• Comparedwithstandard,intermittentglucosechecks,continuousglucosemonitoring
providesfarmorefrequentchecks,whichcanmorepromptlydetectimportanttrendsin
bloodglucoselevels.
• TheFoodandDrugAdministrationlimitscurrentglucose-sensortechnologytoadjunctive
use,becauseofatime-lageffectcausedbyvariousfactors.
• Otherapproachestobloodglucosemeasurementbeingexploredincludeextracorporeal
methods,indwellingvenouscatheters,andnon-invasiveopticaltechnologies—allofwhich
requirefurthertestingbeforetheycanbeusedincritical-carepopulations.
• Ultimately,closed-loop,continuousglucosemonitoringsystemsarelikelytoreplaceall
ofthelabor-intensiveprotocolscurrentlyinuseandwillbeakeyfactorinimproving
hyperglycemiatherapy.
Normalization of blood glucose levels is
now generally considered desirable for all
hyperglycemic patients. Achieving this goal
frequently requires the use of insulin, par-
ticularly in hospitalized patients. Delivering
insulin safely (to avoid hypoglycemia) and
effectively (to achieve the increasingly strict
glucose targets) requires meticulous moni-
toring of blood glucose levels. Glucose sen-
sors are a critical component of an effective
glucose control system.
Compared with the current standard of
care that uses intermittent glucose checks,
continuous glucose monitoring offers far
more frequent monitoring. Hyperglycemic
patients present complex clinical challeng-
es, and less-frequent monitoring can fail to
detect important trends promptly.
Current State
In principle, an effective continuous glu-
cose monitoring system (CGMS) uses a glu-
cose electrode with the following characteris-
tics: 1) specificity for glucose, 2) sensitivity for
glucose, 3) a favorable signal-to-noise ratio,
4) accuracy, and 5) precision. Today, most
glucose electrodes are glucose-oxidase (GO)
based. Using additional innovative technolo-
gies such as selectively permeable mem-
branes, these sensors are now available com-
mercially to assist in the outpatient manage-
ment of diabetes.
Current CGMS require initial calibration
to an external reference, either a laboratory
value or, more commonly, a point-of-care
(POC) glucose-monitor result. If the latter
reference is used for calibration, the lower
precision of POC monitors may contribute
to CGMS inaccuracy. In addition, most elec-
trodes exhibit drift over time and require re-
calibration. Thus, stability is also an important
glucose-electrode characteristic.
Today the most prevalent approach is
interstitial fluid sensing, done either by a
“needle”-type sensor or a microdialysis cath-
eter inserted subcutaneously. With these sys-
tems, when glucose values change rapidly,
there may be differences between sensor val-
ues and a reference method. For example,
with the microdialysis method, the length
of the catheter and, thus, the time required
for the fluid to arrive at the sensor creates a
delay (usually in minutes) that must be taken
into account. Device software that averages
values to improve accuracy also may cause
delays. Finally, an “alternate-site-testing-like
effect” has been described. This term refers
to a variable time lag that was first reported
with standard, intermittent, POC monitoring,
when sampling sites other than fingertip (e.g.,
forearm) were tested. Because of this time-lag
effect, FDA clearance for current glucose-sen-
sor technology is limited to adjunctive use.
Glucose Sensor Technology: Current State and Future TrendsTimothy S. Bailey, MD, FACE, FACP, Advanced Metabolic Care and Research, Escondido, CA
7th Invited Conference: Glucose Sensor Technology: Current State and Future Trends
Executive Summary Conference Report 63
Future Trends
Several companies have used an extracor-
poreal approach that withdraws venous blood
from the patient for measurement. Earlier
techniques (Biostator® glucose-controlled
insulin-infusion system, Miles Laboratories)
did not return the blood to the patient and
could lead to anemia. Newer methods return
the blood to the patient.
Indwelling venous catheters are also
being studied, but these have the potential
for thrombus, embolism and infection. All of
these more-invasive methods may eliminate
the delays seen with less-invasive monitor-
ing and have the potential to simplify the
control system algorithms. Entirely non-in-
vasive approaches (mostly optical methods
utilizing near-infrared spectroscopy) are also
being explored. Due to the complexity in dis-
tinguishing the glucose signal, progress has
been slow.
Most sensor research has involved patients
who are not acutely ill. Critically ill patients in
the intensive care unit (ICU) are more com-
plex. They exhibit hemodynamic instability
and variable perfusion, and usually are treated
with many medications. For this reason, clini-
cal trials must be performed in this population
prior to adopting the technology in this set-
ting.
Ultimately, glucose sensors will routinely
serve as the input systems to closed-loop glu-
cose control therapy. Once the control system
algorithms have been clinically validated and
safety concerns have been addressed, these
closed-loop systems are likely to replace the
labor-intensive protocols currently in use.
Summary
Current developments in glucose moni-
toring sensors are promising and clinical tri-
als are underway. The future of emerging,
entirely non-invasive technologies, such as
optical or spectroscopic systems is still uncer-
tain; however, other minimally invasive and
invasive techniques are promising. They have
the potential to decrease the staff workload
inherent in frequent glucose monitoring and,
therefore, will be key to enabling nurses to
implement hyperglycemia therapy. Reduced
blood glucose variability and rates of hypogly-
cemia that result from more frequent glucose
monitoring, in turn, are likely to be associated
with better outcomes and greater patient
safety.
7th Invited Conference: Glucose Sensor Technology: Current State and Future Trends
PROCEEDINGS
64 Executive Summary Conference Report
Assessing the Accuracy and Confounding Factors in Critical Care Glucose Monitoring
Nam K. Tran, Nicole L. Gentile, Victor J. Abad, Richard F. Louie, and Gerald J. Kost. Point-of-Care Testing Center for Teaching and Research,
Department of Pathology and Laboratory Medicine, University of California-Davis, School of Medicine
7th Invited Conference: Assessing the Accuracy and Confounding Factors in Critical Care Glucose Monitoring
Key points
• Astheuseofpoint-of-care(POC)glucosemonitoringsystems(GMS)fortightglycemic
control(TGC)becomesmorecommonincriticallyillpatients,theaccuracyofthe
informationfrominstrumentsisimportant.
• Physiologicfactorsthatcanaffectaccuracyincludehematocrit,bloodpO2,bloodpressure,
samplesource(venous,arterial,capillary),pH,temperatureandthebloodmatrix(water,
lipid,cellular,andproteincontents).1
• Otherfactorsaffectingaccuracyincludedruginterferences,usererrorandharsh
environmentalconditions.
• TherearemanymethodstoevaluatetheaccuracyofPOCglucosemeterreadings,including
nationalandinternationalstandards,andillustrativeandstatisticalmethodstodetermineif
aGMSiscomparabletoareferenceinstrument.
• Manufacturersmustcontinuetodevelopmeasurestoadjustforfactorsthataffectaccuracy,
andhealthcareprofessionalsshouldbeawareofthelimitationsoftheGMStheyuseand
evaluateaccuracy.
• Newrange-specificanalyticalmethodsareneededtoassesstheaccuracyofGMSat
hypoglycemic,normoglycemicandTGCranges.
There is a need to address factors affect-
ing the accuracy of point-of-care (POC) glu-
cose monitoring systems (GMS). Several stud-
ies have shown that factors such as pO2
and hematocrit affect GMS accuracy. More
recently, new instruments that adjust for
these types of factors have shown improved
performance characteristics of the devices.1
Factors affecting accuracy may cause differ-
ent effects based on the detection method
used by a specific POC GMS. GMS commonly
use enzymes such as glucose dehydrogenase
(GD) or glucose oxidase (GO) in their biosen-
sors and rely on amperometry or photometry
to measure glucose. The blood sample types
used in different devices may also vary. Most
systems are designed to accept capillary,
arterial or venous blood samples, which make
them convenient tools for tight glycemic
control (TGC). With the frequent use of POC
glucose monitoring for TGC in critically ill
patients, there is a need for accurate instru-
ments that are resistant to the factors affect-
ing accuracy. The purpose of this article is to
provide a brief overview of these factors and
how to evaluate GMS accuracy.
Factors Affecting Accuracy
Exogenous and endogenous factors
affect the accuracy of GMS. Endogenous fac-
tors include specific physiological elements
such as hematocrit, blood pO2, blood pres-
sure, sample source (venous, arterial, capil-
lary), pH, temperature and the blood matrix
(water, lipid, cellular and protein contents)1.
Exogenous factors include drug interferenc-
es, user error and harsh environmental condi-
tions. In this article we highlight factors that
may cause errors in glucose monitoring.
Hematocrit. The amount of red blood cells
relative to plasma has an inverse effect on
measured glucose. Dacombe et al. found that
increases in hematocrit cause decreases in
glucose readings2. Conversely; decreases in
hematocrit were found to increase glucose
values. The mechanisms that cause this effect
may be diffusion-related or mechanical in
nature. A high hematocrit can decrease the
amount of glucose that diffuses into the bio-
sensor. The large amount of red blood cells in
high-hematocrit samples may also mechani-
cally impede the biosensor and reduce glu-
cose readings. Low-hematocrit samples can
cause increased diffusion of glucose towards
the biosensor, thereby leading to higher read-
ings on the GMS. Some instrument manufac-
turers address the hematocrit problem by
pre-lysing red blood cells before testing or by
compensating for hematocrit effects using
software algorithms1.
Executive Summary Conference Report 65
pO2 effects. Critically ill patients may be
receiving oxygen therapy and blood pO2 lev-
els may be higher than normal. GO-based sys-
tems originally had inaccuracies at extreme
pO2 levels. This was common in systems that
relied on reactions that generated a hydrogen
peroxide intermediate. Hydrogen peroxide
then disassociated into hydrogen ions, oxy-
gen and electrons (used to measure glu-
cose)3. As pO2 increased (>100 mmHg), the
disassociation reaction would become less
favorable and thus cause lower glucose read-
ings. Recent GO-based systems no longer use
an oxygen intermediate, thereby minimizing
or eliminating this confounding factor. The
opposite may also be true, where low pO2
(<40 mmgHg) can affect glucose results by
15% when using GO-based systems4.
Hypotension and hypoperfusion. Sylvain
et al. showed GD-based systems have sig-
nificantly different results (p < 0.001) when
testing capillary whole blood samples from
hypotensive patients compared to a reference
analyzer5. GO-based systems showed similar
results. In contrast, venous samples tested on
GMS did not show statistically significant dif-
ferences when compared to venous samples
tested using laboratory analyzers.
Sample source. Capillary blood is the most
common sample used for POC GMS. Several
studies have shown variations in accuracy
when comparing capillary versus venous
blood samples6. Recent GMS showed greater
accuracy with arterial samples compared to
capillary blood. In contrast, older GMS mod-
els showed similar results between the two
sample types. Results derived from venous
blood samples exhibited improved accuracy
compared to capillary blood for GD-based
GMS.
Specimen matrix. Water, lipid, protein
and cellular content may also affect accu-
racy. Glucose is more soluble in water and
high plasma water content can cause higher
glucose readings7. Lipid, proteins and cel-
lular components may impede photometric
systems by increasing the turbidity of the
sample. Such matrix effects may also alter
the viscosity and hence reduce the glucose
diffusion rate in both amperometric and pho-
tometric systems.
Drugs. Drugs that can oxidize or reduce
glucose biosensor electrodes can also inter-
fere with glucose results. Tang et al. deter-
mined the effect of 30 different drugs on
six different glucose meters8. High doses
of ascorbic acid were shown to yield lower
glucose values on GO-based systems.
Acetaminophen caused increased glucose
values in all tested GD-based systems and in
some GO-based systems. High doses of dop-
amine increased glucose values in GD-based
systems. Mannitol increased glucose values
in GO-based systems. Icodextrin has been
shown to generate falsely high glucose read-
ings because the drug being metabolized
to maltose, which is indistinguishable from
glucose with GD-based instruments9.
pH and temperature. Since most GMSs
use enzymes to catalyze the conversion of
glucose into a detectable signal, pH and
temperature may play a role in altering the
enzyme kinetics, thereby causing errors.
Kilpatric et al. found significant deviation
in glucose measurements for samples with
pH < 6.95 and > 7.8510. More recently, a new
5mg/dL median absolute difference standard
has been proposed. This standard is based on
a locally smoothed median absolute differ-
ence curve, a non-parametric mathematical
method to identify trends and biases within
large datasets20. Temperature can also play a
role. Oberg et al. suggest that cold tempera-
tures may also produce discrepancies but the
effects of fever are currently unknown4,11.
Other factors. User error and environ-
mental conditions can also affect accuracy.
Studies have shown that the potential for
operator error still exists despite advances
in more user-friendly instruments and pro-
tocols12. Environmental conditions have also
become more important with the use of
POC instruments under field conditions (e.g.,
disaster areas, war zones, rural areas). POC
instruments, including GMS, were used on
airborne hospitals to evacuate survivors after
the Asian Tsunami of 200413. Kost et al. have
suggested that conditions in post-Tsunami
Thailand and post-Hurricane Katrina New
Orleans were unacceptable for POC GMS use
because of high humidity and temperatures.
This has been verified by a study that tested
the robustness of POC instruments under
certain environmental stresses14.
Accuracy Assessment
Methods are available to evaluate the
accuracy of POC glucose meters. These
include national and international standards,
as well as illustrative and statistical meth-
ods to determine if a GMS is comparable to
a reference instrument. Illustrative methods
such as mountain plots, Clarke Error Grid,
and Bland-Altman plots are commonly used.
These illustrative methods may be coupled
to standards such as the Clinical Laboratory
Standards Institute (CLSI) and International
Organization for Standardization (ISO) 15197
criteria15,16. Examples of statistical methods
to evaluate accuracy include the Student’s
t-test, analysis of variance (ANOVA), and least
squares linear regression.
Illustrative methods. These methods allow
for quick determination of biases, trends
and errors. The mountain plot, also called an
empirical cumulative distribution plot, allows
for easy identification of the central 95% of
the data and provides clearer differentiation
of two distributions (e.g., GMS versus refer-
ence)3. It is generated by computing the per-
centile for each ranked difference between
the GMS and the reference. The plot shows
the median bias between the two methods,
while the tails of the plot show the propensity
for the new method to deviate from the refer-
ence method.
7th Invited Conference: Assessing the Accuracy and Confounding Factors in Critical Care Glucose Monitoring
66 Executive Summary Conference Report
The Clarke Error Grid divides a scatter plot
(GMS versus reference) into five zones (A, B,
C, D, and E)17. Data points falling into zones A
and B are considered acceptable, while data
falling into zone C indicate the GMS’ results
may prompt unnecessary corrections. Zone D
represents dangerous failure to detect a glu-
cose level and Zone E represents results caus-
ing erroneous treatment. There has recently
been the introduction of the continuous glu-
cose error grid that allows a user to evaluate
the accuracy of continuous glucose monitors.
The five zones are retained but the shape of
the error grid allows the investigator to also
evaluate the glucose rate (e.g., blood glucose
as a function of time)18.
The Bland-Altman plot is a bias plot (bias
versus reference)19. This method is useful in
that it shows biases, trends, and errors. When
coupled to the CLSI or ISO 15197 standards,
these plots serve to identify if an instrument
meets the acceptance criteria.
Accuracy standards. The CLSI and ISO
15197 standards are often cited in literature
when comparing laboratory instruments3,15,16.
For example, the ISO 15197 standard uses the
measurement of glucose concentrations from
capillary blood samples and provides proce-
dures to verify and validate performance. The
ISO criteria requires 95% of the data points
to have a bias of ±15 mg/dL at reference
glucose levels of < 75 mg/dL. For reference
values ≥75 mg/dL, the bias must be within
±20% of the reference value. In contrast, the
CLSI standard requires the bias to be ±15 mg/
dL for values < 100 mg/dL. For values ≥100
mg/dL, the bias must be within ±20% of the
reference. Originally the ISO standard was
commonly used outside the United States.
More recently, an October 2006 draft Food
and Drug Administration (FDA) guideline
describes the use of the ISO 15197 criteria for
GMS20.
7th Invited Conference: Assessing the Accuracy and Confounding Factors in Critical Care Glucose Monitoring
Statistical methods. Statistical tests can
provide p-values or correlation coefficients.
The Student’s t-test is an example of one sta-
tistical test.3 There are three kinds of t-tests:
one-sample, two-sample, and the t-test for
paired differences. For the purposes of com-
paring a GMS versus a reference analyzer, the
Student’s t-test for paired differences is used,
since results from the same blood sample
are being compared. The Student’s t-test for
paired differences assumes that the samples
are not independent (e.g., using the same
blood samples) and the data are distributed
normally.
ANOVA is another statistical method,
which compares the differences of three or
more groups of data. This is very useful for
comparing variations between different GMS
test strip lots. Both the Student’s t-test and
ANOVA generate a p-value, where p < 0.05 is
usually considered statistically significant21.
Least squares linear regression, commonly
referred to as linear regression, generates a
best-fit line onto a scatter plot (GMS versus
reference analyzer)3. The correlation coeffi-
cient (r), coefficient of determination (r2), and
equation of the line are generated on this
plot. The r2-value is commonly used, with
r2 ranging from 0 to 1, where 0 indicates a
non-linear relationship and 1 is a perfect fit.
Manufacturers strive to attain a very high
r2-value, because it indicates high correlation
between GMS and the reference. However,
it must be noted that least squares linear
regression is very susceptible to the weight-
ing effects of data points at extreme values.
For example, if a single value at a high refer-
ence range falls on the regression line, it may
provide a high r2-value. Removal of this data
point may then reveal the less-than-satisfac-
tory nature of a dataset. Therefore, investiga-
tors must be aware of the potential for data
to have poor agreement but still produce
relatively high correlations.
Conclusions
Manufactures must continue to develop
measures to adjust for confounding fac-
tors, and healthcare professionals need to
be aware of the limitations of the GMS they
use. There are methods to evaluate accu-
racy that are useful but may be misleading.
Instruments may show good correlation to
a reference standard, but this may not mean
that the results show agreement when using
other methods such as linear regression. As
instruments accommodate factors affecting
accuracy through biosensor and software
design, there may be a shift towards newer,
stricter methods to evaluate the accuracy of
GMS. Given the heterogeneity of physiologi-
cal conditions present in critically ill patients,
factors affecting accuracy may play a much
larger role in trying to achieve TGC. Accuracy
at the low-ranges, especially for pediatrics
and neonates, are also important consider-
ations. High accuracy near and within the TGC
ranges is also necessary for reliable glucose
monitoring in TGC protocols. Therefore, new
range-specific analytical methods are needed
to assess the accuracy of GMS at hypoglyce-
mic, normoglycemic and TGC ranges.
References
1. Dungan K, Braithwaite SS, Chapman J, et al. Glucose measurement: confounding issues in setting tar-gets for inpatient management. Diabetes Care 2007;30:403.
2. Dacombe CM, Dalton RG, Goldie DJ, et al. Effect of packed cell volume on blood glucose estimations. ArchDisChild 1981;56:789.
3. Tran NK, Promptmas C, Kost GJ. Biosensors, min-iaturization, and noninvasive techniques. In: Cook KW, Lehmann C, Schoeff L, Williams R. “ClinicalDiagnostic Technology: The Total Testing Process,Preanalytical,Analytical,andPost-AnalyticalPhases,Volume 3 of 3.”Washington DC: AACC; Chapter 7, 2006, p. 145-84.
4. Oberg D, Ostenson CG. Performance of glucose dehydrogenase—and glucose oxidase-based blood glucose meters at high altitude and low temperatures (letter). DiabetesCare 2005;28:1261.
Executive Summary Conference Report 67
5. Sylvain HF, Pokorny ME, English SM, et al. Accuracy of fingerstick glucose values in shock patients. AmJCritCare 1995;4:44.
6. Kuwa K, Makayama T, Hoshino T, et al. Relationships of glucose concentrations in capillary whole blood, venous whole blood and venous plasma. ClinChimActa2001;307:187.
7. D’Orazio P, Burnett RW, Fogh-Anderson N, et al. The International Federation of Clinical Chemistry Science Division Working Group on Selective Electrodes and Point of Care Testing: Approved IFCC recommendations on reporting results for blood glucose. ClinChem 2005;1573.
8. Tang Z, Du X, Louie RF, et al. Effects of drugs on glu-cose measurements with handheld glucose meters and a portable glucose analyzer. Am J Clin Pathol 2000;113:75.
9. U.S. Food and Drug Administration: FDA reminders for falsely elevated glucose readings from use of inappropriate test method, 2005. www.fda.gov/cdrh/oivd/news/glucosefalse.html. (Accessed on July 17, 2007)
10. Kilpatrick ES, Rumley AG, Smith EA. Variations in sample pH and pO2 affect ExacTech meter glucose measurements. DiabetMed1994;11:506.
11. Haupt A, Berg B, Paschen P, et al. The effects of skin temperature and testing site on blood glu-cose measurements taken by a modern blood glucose monitoring device. Diabetes Technol Ther2005;7:597.
12. Bergenstal R, Pearson J, Cembrowski GS, et al. Identifying variables associated with inaccurate self-monitoring of blood glucose: proposed guidelines to improve accuracy. DiabetesEdu 2000;26:981.
13. Kost GJ, Tran NK, Tuntideelert M, et al. Katrina, the tsunami, and point-of-care testing: optimizing rapid response diagnosis in disasters. Am J ClinPathol2006;126:513.
14. Sumner S, Louie R, Vo L, et al. Environmental Limits of POCT: Relevance to Disaster Readiness. AACC National Meeting, San Diego, CA. ClinChem 2007; Presentation Number, E-18.
15. Clinical Laboratory Standards Institute. www.nccls.org (Accessed July 15, 2007).
7th Invited Conference: Assessing the Accuracy and Confounding Factors in Critical Care Glucose Monitoring
16. International Organization for Standardization. www.iso.ch (Accessed July 15, 2007).
17. Clarke WL: The original Clarke error grid analysis (EGA). DiabertesTechnolTher2005;7:776.
18. Kovatchev BP, Cox DJ, Godner-Frederic LA, et al. Evaluating the accuracy of continuous glucose-monitoring sensors. DiabetesCare2004;27:1922.
19. Bland JM, Altman DG. Statistical methods for assessing agreement between two methods of clinical measurement. Lancet 1986;327:307.
20. Kost GJ, Tran NK, Abad VJ, et al. Evaluation of point-of-care glucose testing accuracy using locally-smoothed median absolute difference curves. ClinChimActa 2007. [in press]
21. Total Produce Life Cycle for Portable Invasive Blood Glucose Monitoring Systems. Draft FDA Guidance Document, October 24, 2006. http://www.fda.gov/cdrh/oivd/guidance/1603.html Accessed on 7/15/07.
22. Daniel WW. Biostatistics: a foundation for analysis in the health sciences. 8th ed. Hoboken, JN: Wiley, 2005.
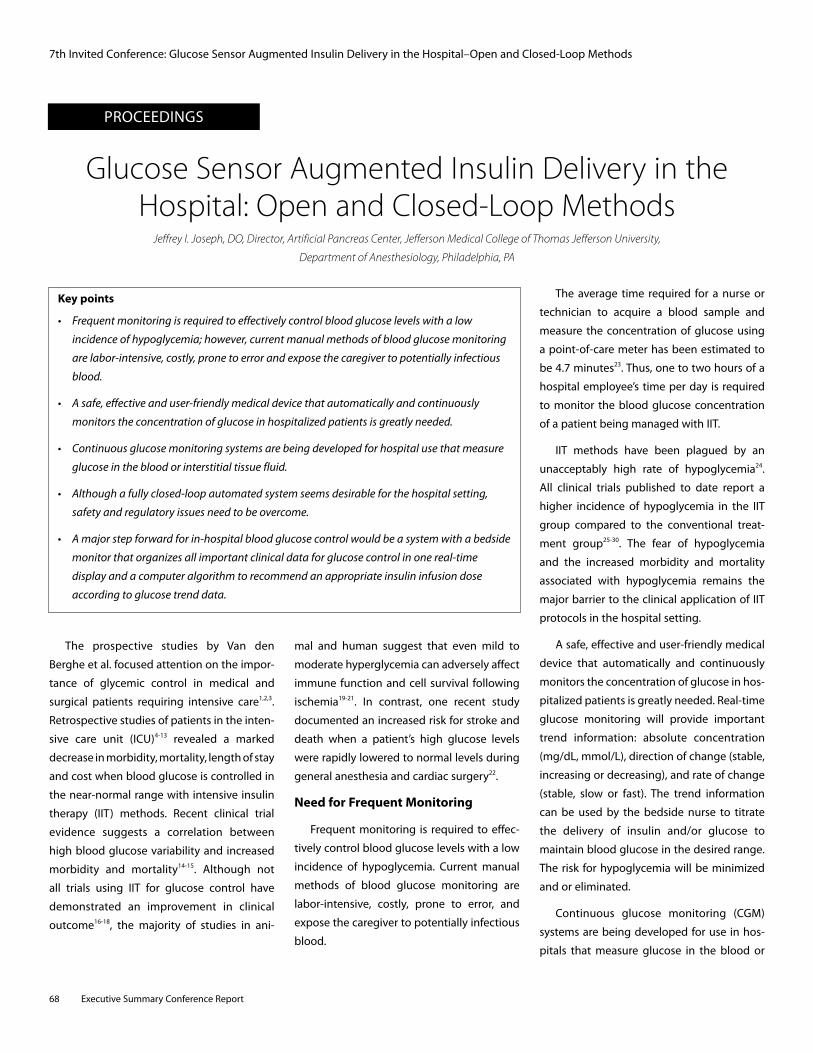
PROCEEDINGS
68 Executive Summary Conference Report
Glucose Sensor Augmented Insulin Delivery in the Hospital: Open and Closed-Loop Methods
Jeffrey I. Joseph, DO, Director, Artificial Pancreas Center, Jefferson Medical College of Thomas Jefferson University,
Department of Anesthesiology, Philadelphia, PA
7th Invited Conference: Glucose Sensor Augmented Insulin Delivery in the Hospital–Open and Closed-Loop Methods
Key points
• Frequentmonitoringisrequiredtoeffectivelycontrolbloodglucoselevelswithalow
incidenceofhypoglycemia;however,currentmanualmethodsofbloodglucosemonitoring
arelabor-intensive,costly,pronetoerrorandexposethecaregivertopotentiallyinfectious
blood.
• Asafe,effectiveanduser-friendlymedicaldevicethatautomaticallyandcontinuously
monitorstheconcentrationofglucoseinhospitalizedpatientsisgreatlyneeded.
• Continuousglucosemonitoringsystemsarebeingdevelopedforhospitalusethatmeasure
glucoseinthebloodorinterstitialtissuefluid.
• Althoughafullyclosed-loopautomatedsystemseemsdesirableforthehospitalsetting,
safetyandregulatoryissuesneedtobeovercome.
• Amajorstepforwardforin-hospitalbloodglucosecontrolwouldbeasystemwithabedside
monitorthatorganizesallimportantclinicaldataforglucosecontrolinonereal-time
displayandacomputeralgorithmtorecommendanappropriateinsulininfusiondose
accordingtoglucosetrenddata.
The prospective studies by Van den
Berghe et al. focused attention on the impor-
tance of glycemic control in medical and
surgical patients requiring intensive care1,2,3.
Retrospective studies of patients in the inten-
sive care unit (ICU)4-13 revealed a marked
decrease in morbidity, mortality, length of stay
and cost when blood glucose is controlled in
the near-normal range with intensive insulin
therapy (IIT) methods. Recent clinical trial
evidence suggests a correlation between
high blood glucose variability and increased
morbidity and mortality14-15. Although not
all trials using IIT for glucose control have
demonstrated an improvement in clinical
outcome16-18, the majority of studies in ani-
mal and human suggest that even mild to
moderate hyperglycemia can adversely affect
immune function and cell survival following
ischemia19-21. In contrast, one recent study
documented an increased risk for stroke and
death when a patient’s high glucose levels
were rapidly lowered to normal levels during
general anesthesia and cardiac surgery22.
Need for Frequent Monitoring
Frequent monitoring is required to effec-
tively control blood glucose levels with a low
incidence of hypoglycemia. Current manual
methods of blood glucose monitoring are
labor-intensive, costly, prone to error, and
expose the caregiver to potentially infectious
blood.
The average time required for a nurse or
technician to acquire a blood sample and
measure the concentration of glucose using
a point-of-care meter has been estimated to
be 4.7 minutes23. Thus, one to two hours of a
hospital employee’s time per day is required
to monitor the blood glucose concentration
of a patient being managed with IIT.
IIT methods have been plagued by an
unacceptably high rate of hypoglycemia24.
All clinical trials published to date report a
higher incidence of hypoglycemia in the IIT
group compared to the conventional treat-
ment group25-30. The fear of hypoglycemia
and the increased morbidity and mortality
associated with hypoglycemia remains the
major barrier to the clinical application of IIT
protocols in the hospital setting.
A safe, effective and user-friendly medical
device that automatically and continuously
monitors the concentration of glucose in hos-
pitalized patients is greatly needed. Real-time
glucose monitoring will provide important
trend information: absolute concentration
(mg/dL, mmol/L), direction of change (stable,
increasing or decreasing), and rate of change
(stable, slow or fast). The trend information
can be used by the bedside nurse to titrate
the delivery of insulin and/or glucose to
maintain blood glucose in the desired range.
The risk for hypoglycemia will be minimized
and or eliminated.
Continuous glucose monitoring (CGM)
systems are being developed for use in hos-
pitals that measure glucose in the blood or
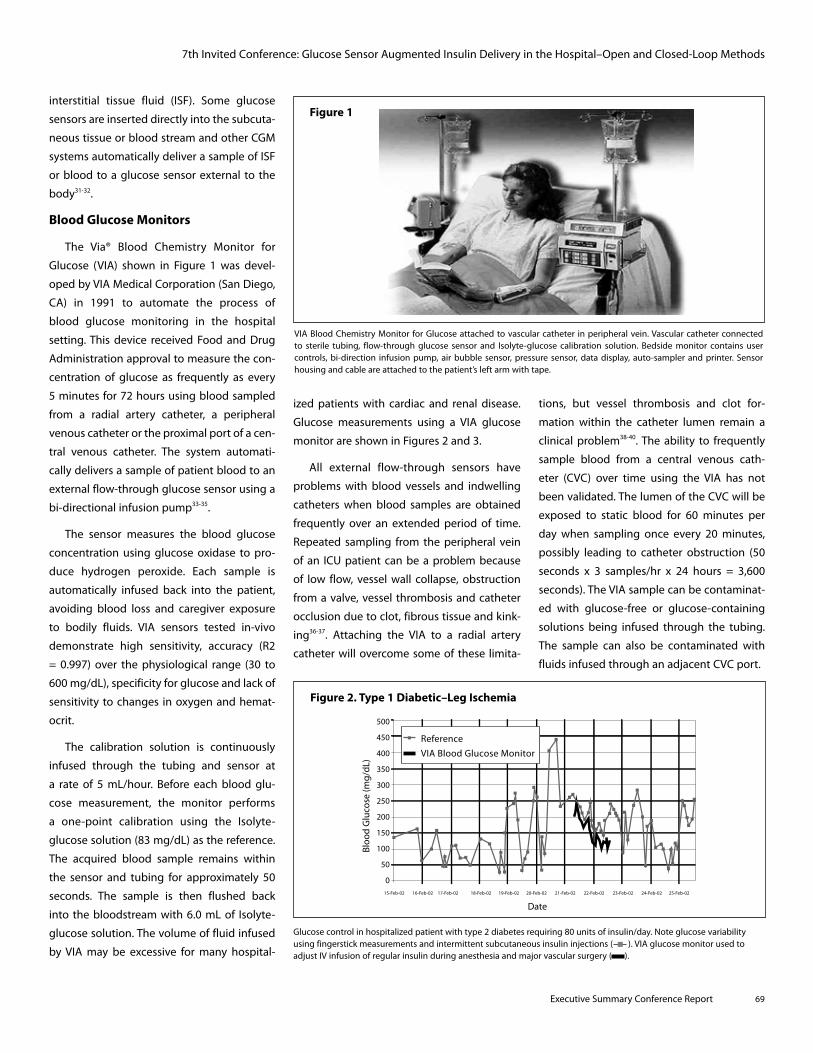
Executive Summary Conference Report 69
7th Invited Conference: Glucose Sensor Augmented Insulin Delivery in the Hospital–Open and Closed-Loop Methods
interstitial tissue fluid (ISF). Some glucose
sensors are inserted directly into the subcuta-
neous tissue or blood stream and other CGM
systems automatically deliver a sample of ISF
or blood to a glucose sensor external to the
body31-32.
Blood Glucose Monitors
The Via® Blood Chemistry Monitor for
Glucose (VIA) shown in Figure 1 was devel-
oped by VIA Medical Corporation (San Diego,
CA) in 1991 to automate the process of
blood glucose monitoring in the hospital
setting. This device received Food and Drug
Administration approval to measure the con-
centration of glucose as frequently as every
5 minutes for 72 hours using blood sampled
from a radial artery catheter, a peripheral
venous catheter or the proximal port of a cen-
tral venous catheter. The system automati-
cally delivers a sample of patient blood to an
external flow-through glucose sensor using a
bi-directional infusion pump33-35.
The sensor measures the blood glucose
concentration using glucose oxidase to pro-
duce hydrogen peroxide. Each sample is
automatically infused back into the patient,
avoiding blood loss and caregiver exposure
to bodily fluids. VIA sensors tested in-vivo
demonstrate high sensitivity, accuracy (R2
= 0.997) over the physiological range (30 to
600 mg/dL), specificity for glucose and lack of
sensitivity to changes in oxygen and hemat-
ocrit.
The calibration solution is continuously
infused through the tubing and sensor at
a rate of 5 mL/hour. Before each blood glu-
cose measurement, the monitor performs
a one-point calibration using the Isolyte-
glucose solution (83 mg/dL) as the reference.
The acquired blood sample remains within
the sensor and tubing for approximately 50
seconds. The sample is then flushed back
into the bloodstream with 6.0 mL of Isolyte-
glucose solution. The volume of fluid infused
by VIA may be excessive for many hospital-
ized patients with cardiac and renal disease.
Glucose measurements using a VIA glucose
monitor are shown in Figures 2 and 3.
All external flow-through sensors have
problems with blood vessels and indwelling
catheters when blood samples are obtained
frequently over an extended period of time.
Repeated sampling from the peripheral vein
of an ICU patient can be a problem because
of low flow, vessel wall collapse, obstruction
from a valve, vessel thrombosis and catheter
occlusion due to clot, fibrous tissue and kink-
ing36-37. Attaching the VIA to a radial artery
catheter will overcome some of these limita-
tions, but vessel thrombosis and clot for-
mation within the catheter lumen remain a
clinical problem38-40. The ability to frequently
sample blood from a central venous cath-
eter (CVC) over time using the VIA has not
been validated. The lumen of the CVC will be
exposed to static blood for 60 minutes per
day when sampling once every 20 minutes,
possibly leading to catheter obstruction (50
seconds x 3 samples/hr x 24 hours = 3,600
seconds). The VIA sample can be contaminat-
ed with glucose-free or glucose-containing
solutions being infused through the tubing.
The sample can also be contaminated with
fluids infused through an adjacent CVC port.
Figure 1
VIA Blood Chemistry Monitor for Glucose attached to vascular catheter in peripheral vein. Vascular catheter connected to sterile tubing, flow-through glucose sensor and Isolyte-glucose calibration solution. Bedside monitor contains user controls, bi-direction infusion pump, air bubble sensor, pressure sensor, data display, auto-sampler and printer. Sensor housing and cable are attached to the patient’s left arm with tape.
Figure 2. Type 1 Diabetic–Leg Ischemia
Glucose control in hospitalized patient with type 2 diabetes requiring 80 units of insulin/day. Note glucose variability using fingerstick measurements and intermittent subcutaneous insulin injections ( ). VIA glucose monitor used to adjust IV infusion of regular insulin during anesthesia and major vascular surgery ( ).
Bloo
d G
luco
se (m
g/dL
)
Date
15-Feb-02 16-Feb-02 17-Feb-02 18-Feb-02 19-Feb-02 20-Feb-02 21-Feb-02 22-Feb-02 23-Feb-02 24-Feb-02 25-Feb-02
500
450
400
350
300
250
200
150
100
50
0
ReferenceVIA Blood Glucose Monitor
300
250
200
150
100
50
008:0006:00 12:0010:00 16:0014:00 20:0018:00 00:0022:00 04:0002:00 08:0006:00 12:00 14:0010:00
Bloo
d G
luco
se (m
g/dL
)
Time (HH:MM)
Time (HH:MM)
ReferenceVIA Blood Glucose Monitor
Glu
cose
(Ins
ulin
d) C
once
ntra
tion,
mg/
dL (m
U/I) 300
250
200
150
100
50
0
12.0
10.0
8.0
6.0
4.0
2.0
0.08:24 9:36 10:48 12:00 13:12 14:24 15:36 16:48 18:00
Blood glucose concentrationPlasma Insulin (mU/I)MealsInsulin infusion rate
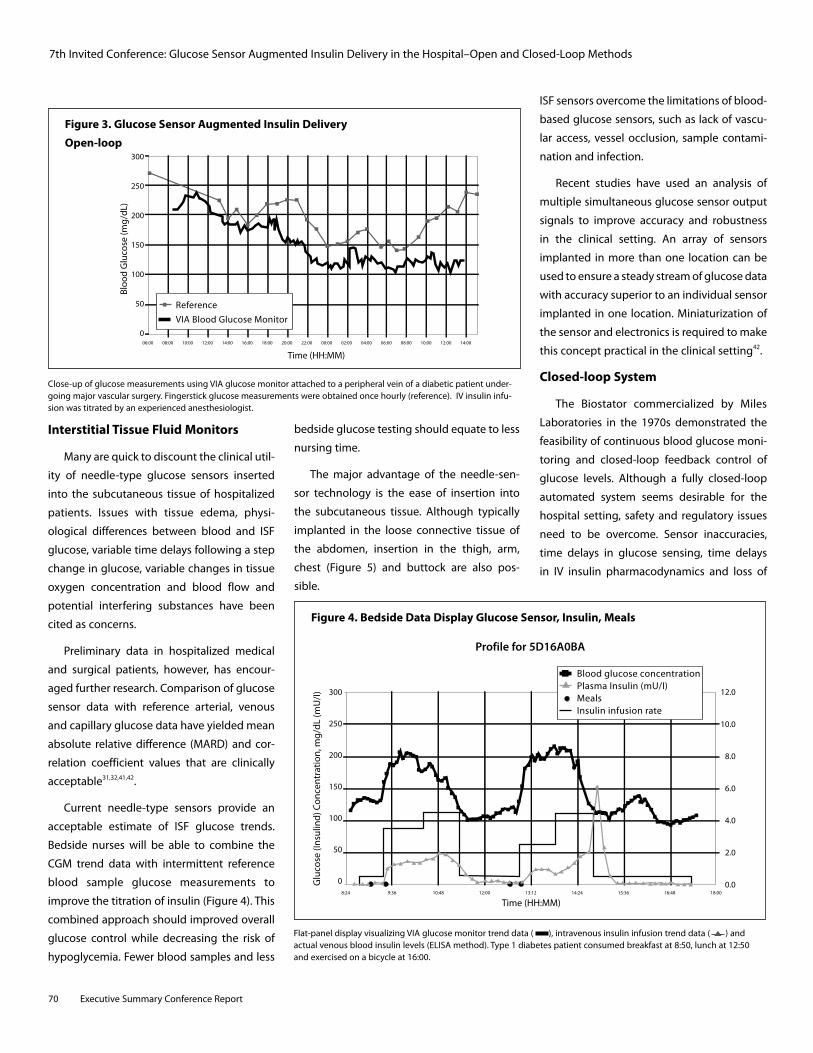
70 Executive Summary Conference Report
Interstitial Tissue Fluid Monitors
Many are quick to discount the clinical util-
ity of needle-type glucose sensors inserted
into the subcutaneous tissue of hospitalized
patients. Issues with tissue edema, physi-
ological differences between blood and ISF
glucose, variable time delays following a step
change in glucose, variable changes in tissue
oxygen concentration and blood flow and
potential interfering substances have been
cited as concerns.
Preliminary data in hospitalized medical
and surgical patients, however, has encour-
aged further research. Comparison of glucose
sensor data with reference arterial, venous
and capillary glucose data have yielded mean
absolute relative difference (MARD) and cor-
relation coefficient values that are clinically
acceptable31,32,41,42.
Current needle-type sensors provide an
acceptable estimate of ISF glucose trends.
Bedside nurses will be able to combine the
CGM trend data with intermittent reference
blood sample glucose measurements to
improve the titration of insulin (Figure 4). This
combined approach should improved overall
glucose control while decreasing the risk of
hypoglycemia. Fewer blood samples and less
bedside glucose testing should equate to less
nursing time.
The major advantage of the needle-sen-
sor technology is the ease of insertion into
the subcutaneous tissue. Although typically
implanted in the loose connective tissue of
the abdomen, insertion in the thigh, arm,
chest (Figure 5) and buttock are also pos-
sible.
ISF sensors overcome the limitations of blood-
based glucose sensors, such as lack of vascu-
lar access, vessel occlusion, sample contami-
nation and infection.
Recent studies have used an analysis of
multiple simultaneous glucose sensor output
signals to improve accuracy and robustness
in the clinical setting. An array of sensors
implanted in more than one location can be
used to ensure a steady stream of glucose data
with accuracy superior to an individual sensor
implanted in one location. Miniaturization of
the sensor and electronics is required to make
this concept practical in the clinical setting42.
Closed-loop System
The Biostator commercialized by Miles
Laboratories in the 1970s demonstrated the
feasibility of continuous blood glucose moni-
toring and closed-loop feedback control of
glucose levels. Although a fully closed-loop
automated system seems desirable for the
hospital setting, safety and regulatory issues
need to be overcome. Sensor inaccuracies,
time delays in glucose sensing, time delays
in IV insulin pharmacodynamics and loss of
Figure 3. Glucose Sensor Augmented Insulin Delivery
Open-loop
Close-up of glucose measurements using VIA glucose monitor attached to a peripheral vein of a diabetic patient under-going major vascular surgery. Fingerstick glucose measurements were obtained once hourly (reference). IV insulin infu-sion was titrated by an experienced anesthesiologist.
Bloo
d G
luco
se (m
g/dL
)
Date
15-Feb-02 16-Feb-02 17-Feb-02 18-Feb-02 19-Feb-02 20-Feb-02 21-Feb-02 22-Feb-02 23-Feb-02 24-Feb-02 25-Feb-02
500
450
400
350
300
250
200
150
100
50
0
ReferenceVIA Blood Glucose Monitor
300
250
200
150
100
50
008:0006:00 12:0010:00 16:0014:00 20:0018:00 00:0022:00 04:0002:00 08:0006:00 12:00 14:0010:00
Bloo
d G
luco
se (m
g/dL
)
Time (HH:MM)
Time (HH:MM)
ReferenceVIA Blood Glucose Monitor
Glu
cose
(Ins
ulin
d) C
once
ntra
tion,
mg/
dL (m
U/I) 300
250
200
150
100
50
0
12.0
10.0
8.0
6.0
4.0
2.0
0.08:24 9:36 10:48 12:00 13:12 14:24 15:36 16:48 18:00
Blood glucose concentrationPlasma Insulin (mU/I)MealsInsulin infusion rate
Flat-panel display visualizing VIA glucose monitor trend data ( ), intravenous insulin infusion trend data ( ) and actual venous blood insulin levels (ELISA method). Type 1 diabetes patient consumed breakfast at 8:50, lunch at 12:50 and exercised on a bicycle at 16:00.
Figure 4. Bedside Data Display Glucose Sensor, Insulin, Meals
Profile for 5D16A0BA
Bloo
d G
luco
se (m
g/dL
)
Date
15-Feb-02 16-Feb-02 17-Feb-02 18-Feb-02 19-Feb-02 20-Feb-02 21-Feb-02 22-Feb-02 23-Feb-02 24-Feb-02 25-Feb-02
500
450
400
350
300
250
200
150
100
50
0
ReferenceVIA Blood Glucose Monitor
300
250
200
150
100
50
008:0006:00 12:0010:00 16:0014:00 20:0018:00 00:0022:00 04:0002:00 08:0006:00 12:00 14:0010:00
Bloo
d G
luco
se (m
g/dL
)
Time (HH:MM)
Time (HH:MM)
ReferenceVIA Blood Glucose Monitor
Glu
cose
(Ins
ulin
d) C
once
ntra
tion,
mg/
dL (m
U/I) 300
250
200
150
100
50
0
12.0
10.0
8.0
6.0
4.0
2.0
0.08:24 9:36 10:48 12:00 13:12 14:24 15:36 16:48 18:00
Blood glucose concentrationPlasma Insulin (mU/I)MealsInsulin infusion rate
7th Invited Conference: Glucose Sensor Augmented Insulin Delivery in the Hospital–Open and Closed-Loop Methods
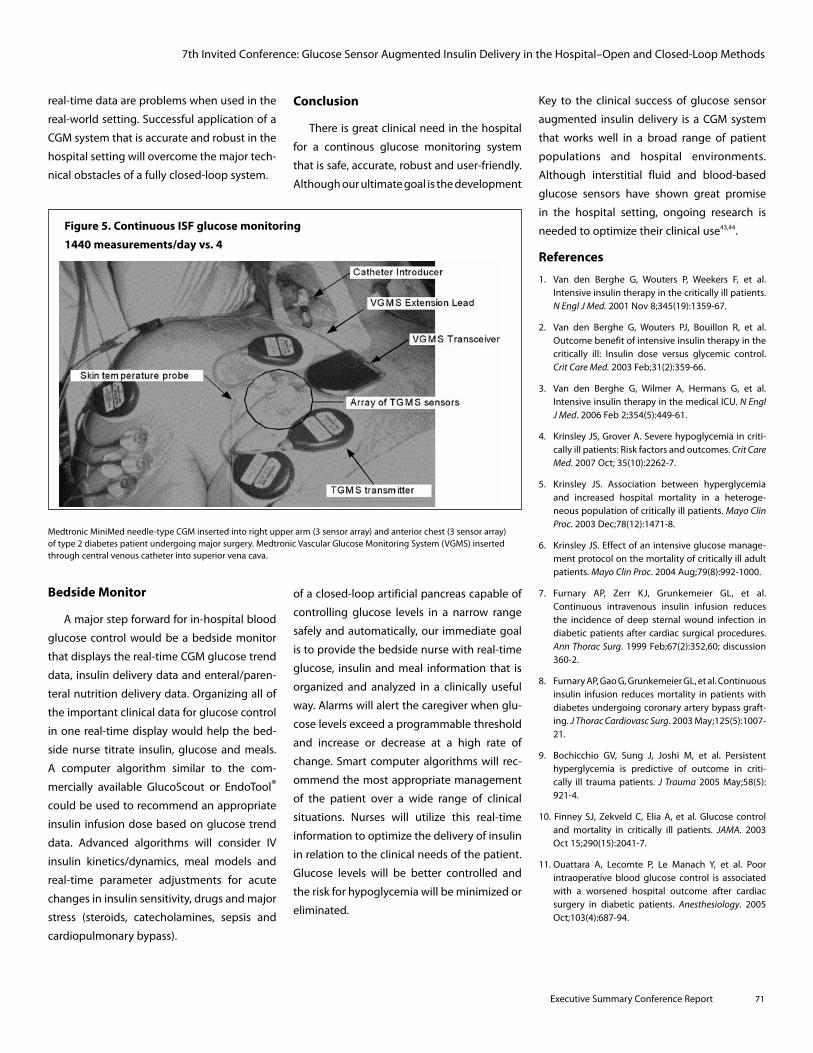
Executive Summary Conference Report 71
real-time data are problems when used in the
real-world setting. Successful application of a
CGM system that is accurate and robust in the
hospital setting will overcome the major tech-
nical obstacles of a fully closed-loop system.
Bedside Monitor
A major step forward for in-hospital blood
glucose control would be a bedside monitor
that displays the real-time CGM glucose trend
data, insulin delivery data and enteral/paren-
teral nutrition delivery data. Organizing all of
the important clinical data for glucose control
in one real-time display would help the bed-
side nurse titrate insulin, glucose and meals.
A computer algorithm similar to the com-
mercially available GlucoScout or EndoTool®
could be used to recommend an appropriate
insulin infusion dose based on glucose trend
data. Advanced algorithms will consider IV
insulin kinetics/dynamics, meal models and
real-time parameter adjustments for acute
changes in insulin sensitivity, drugs and major
stress (steroids, catecholamines, sepsis and
cardiopulmonary bypass).
Conclusion
There is great clinical need in the hospital
for a continous glucose monitoring system
that is safe, accurate, robust and user-friendly.
Although our ultimate goal is the development
of a closed-loop artificial pancreas capable of
controlling glucose levels in a narrow range
safely and automatically, our immediate goal
is to provide the bedside nurse with real-time
glucose, insulin and meal information that is
organized and analyzed in a clinically useful
way. Alarms will alert the caregiver when glu-
cose levels exceed a programmable threshold
and increase or decrease at a high rate of
change. Smart computer algorithms will rec-
ommend the most appropriate management
of the patient over a wide range of clinical
situations. Nurses will utilize this real-time
information to optimize the delivery of insulin
in relation to the clinical needs of the patient.
Glucose levels will be better controlled and
the risk for hypoglycemia will be minimized or
eliminated.
Figure 5. Continuous ISF glucose monitoring
1440 measurements/day vs. 4
Medtronic MiniMed needle-type CGM inserted into right upper arm (3 sensor array) and anterior chest (3 sensor array) of type 2 diabetes patient undergoing major surgery. Medtronic Vascular Glucose Monitoring System (VGMS) inserted through central venous catheter into superior vena cava.
Key to the clinical success of glucose sensor
augmented insulin delivery is a CGM system
that works well in a broad range of patient
populations and hospital environments.
Although interstitial fluid and blood-based
glucose sensors have shown great promise
in the hospital setting, ongoing research is
needed to optimize their clinical use43,44.
References
1. Van den Berghe G, Wouters P, Weekers F, et al. Intensive insulin therapy in the critically ill patients. NEnglJMed. 2001 Nov 8;345(19):1359-67.
2. Van den Berghe G, Wouters PJ, Bouillon R, et al. Outcome benefit of intensive insulin therapy in the critically ill: Insulin dose versus glycemic control. CritCareMed. 2003 Feb;31(2):359-66.
3. Van den Berghe G, Wilmer A, Hermans G, et al. Intensive insulin therapy in the medical ICU. NEnglJMed. 2006 Feb 2;354(5):449-61.
4. Krinsley JS, Grover A. Severe hypoglycemia in criti-cally ill patients: Risk factors and outcomes. CritCareMed. 2007 Oct; 35(10):2262-7.
5. Krinsley JS. Association between hyperglycemia and increased hospital mortality in a heteroge-neous population of critically ill patients. MayoClinProc. 2003 Dec;78(12):1471-8.
6. Krinsley JS. Effect of an intensive glucose manage-ment protocol on the mortality of critically ill adult patients. MayoClinProc. 2004 Aug;79(8):992-1000.
7. Furnary AP, Zerr KJ, Grunkemeier GL, et al. Continuous intravenous insulin infusion reduces the incidence of deep sternal wound infection in diabetic patients after cardiac surgical procedures. AnnThoracSurg. 1999 Feb;67(2):352,60; discussion 360-2.
8. Furnary AP, Gao G, Grunkemeier GL, et al. Continuous insulin infusion reduces mortality in patients with diabetes undergoing coronary artery bypass graft-ing. JThoracCardiovascSurg. 2003 May;125(5):1007-21.
9. Bochicchio GV, Sung J, Joshi M, et al. Persistent hyperglycemia is predictive of outcome in criti-cally ill trauma patients. JTrauma 2005 May;58(5): 921-4.
10. Finney SJ, Zekveld C, Elia A, et al. Glucose control and mortality in critically ill patients. JAMA. 2003 Oct 15;290(15):2041-7.
11. Ouattara A, Lecomte P, Le Manach Y, et al. Poor intraoperative blood glucose control is associated with a worsened hospital outcome after cardiac surgery in diabetic patients. Anesthesiology. 2005 Oct;103(4):687-94.
7th Invited Conference: Glucose Sensor Augmented Insulin Delivery in the Hospital–Open and Closed-Loop Methods
7th Invited Conference: Glucose Sensor Augmented Insulin Delivery in the Hospital–Open and Closed-Loop Methods
12. Umpierrez GE, Isaacs SD, Bazargan N, et al. Hyperglycemia: An independent marker of in-hos-pital mortality in patients with undiagnosed diabe-tes.JClinEndocrinolMetab. 2002 Mar;87(3):978-82.
13. Clement S, Braithwaite SS, Magee MF, et al. Management of diabetes and hyperglycemia in hospitals. DiabetesCare. 2004 Feb;27(2):553-91.
14. Egi M, Bellomo R, Stachowski E, et al. Variability of blood glucose concentration and short-term mor-tality in critically ill patients. Anesthesiology. 2006 Aug;105(2):244-52.
15. Hirsch IB, Brownlee M. Should minimal blood glu-cose variability become the gold standard of gly-cemic control? JDiabetesComplications. 2005 May-Jun;19(3):178-81.
16. GluControl study: Comparing the effects of two glucose control regimens by insulin in intensive care unit patients [homepage on the Internet]. U.S. National Institutes of Health [cited November 2007]. Available from: http://clinicaltrials.gov/show/NCT00107601.
17. Mitchell I, Finfer S, Bellomo R, et al. ANZICS Clinical Trials Group Glucose Management Investigators. Management of blood glucose in the critically ill in australia and New Zealand: A practice survey and inception cohort study.IntensiveCareMed. 2006 Jun; 32(6):867-74.
18. DeBrouwere R. Tight intraoperative glucose control does not improve outcome in cardiovascular sur-gery. JournalofCardiothoracic&VascularAnesthesia2000;14(4):479-81.
19. Golden SH, Peart-Vigilance C, Kao WH, et al. Perioperative glycemic control and the risk of infec-tious complications in a cohort of adults with diabe-tes. DiabetesCare. 1999 Sep;22(9):1408-14.
20. Pomposelli JJ, Baxter JK,3rd, Babineau TJ, et al. Early postoperative glucose control predicts nosocomial infection rate in diabetic patients. JPEN J ParenterEnteralNutr. 1998 Mar-Apr;22(2):77-81.
21. Lazar HL, Chipkin SR, Fitzgerald CA, et al. Tight glycemic control in diabetic coronary artery bypass graft patients improves perioperative outcomes and decreases recurrent ischemic events. Circulation. 2004 Mar 30;109(12):1497-502.
22. Gandhi G, Nuttall G, Abel M, et al. Intensive intra-operative insulin therapy versus conventional glu-cose management during cardiac surgery. AnnalsofInternalMed 2007:Vol146 (4)233-43.
23. Aragon D. Evaluation of nursing work effort and perceptions about blood glucose testing in tight glycemic control. Am J Crit Care 2006 Jul;15(4): 370-7.
24. Cryer PE. Hypoglycaemia: The limiting factor in the glycaemic management of the critically ill? Diabetologia. 2006 Aug;49(8):1722-5.
25. Braithwaite SS, Buie MM, Thompson CL, et al. Hospital hypoglycemia: Not only treatment but also prevention. Endocr Pract. 2004 Mar-Apr;10 Suppl 2:89-99.
26. Fischer KF, Lees JA, Newman JH. Hypoglycemia in hospitalized patients. causes and outcomes. NEnglJMed. 1986 Nov 13;315(20):1245-50.
27. Stagnaro-Green A, Barton MK, Linekin PL, et al. Mortality in hospitalized patients with hypoglyce-mia and severe hyperglycemia. MtSinaiJMed. 1995 Nov;62(6):422-6.
28. Thomas AN, Boxall EM, Twamley HW. Evaluation of short-term consequences of hypoglycemia in an intensive care unit. Crit Care Med. 2007 Apr;35(4):1218,9; author reply 1219.
29. Vriesendorp TM, DeVries JH, van Santen S, et al. Evaluation of short-term consequences of hypogly-cemia in an intensive care unit. CritCareMed. 2006 Nov;34(11):2714-8.
30. Wexler DJ, Meigs JB, Cagliero E, et al. Prevalence of hyper- and hypoglycemia among inpatients with diabetes: A national survey of 44 U.S. hospitals. DiabetesCare. 2007 Feb;30(2):367-9.
31. Goldberg PA, Segal M, Russel RR et al.Experience with the continuous glucose monitoring system in a medical intensive care unit. DiabetesTechologyandTherapeutics 2004;6:339-47.
32. Vriesendorp T, DeVries J, Holleman F et al. The use of two continuous glucose sensors during and after surgery. DiabetesTechnologyandTherapeutics 2005;7:315-22.
33. Ganesh A, Hipszer B, Loomba N, et al. Evaluation of the VIA® Blood Chemistry Monitor for Glucose in Healthy and Diabetic Volunteers (In Press) Journal of Diabetes Science and Technology 2008
34. Lucisano JY, Edelman SV, Quinto BD, et al. Development of a biosensor-based, patient-attached blood glucose monitoring system. ProcAmChemSoc. 1997;76:256.
35. VIA blood chemistry monitor for glucose VIA V-GLU 1 Operator’s manual. San Diego, CA: VIA Medical Corporation; 1998.
36. Kagel EM, Rayan GM. Intravenous catheter com-plications in the hand and forearm. JTrauma 2004 Jan;56(1):123-7.
37. Mohler M, Sato Y, Bobick K, et al. The reliability of blood sampling from peripheral intravenous infu-sion lines. complete blood cell counts, electrolyte panels, and survey panels. JIntravenNurs. 1998 Jul-Aug;21(4):209-14.
38 Cousins TR, O'Donnell JM. Arterial cannulation: A critical review. AANAJ. 2004 Aug;72(4):267-71.
39. Martin C, Saux P, Papazian L, et al. Long-term arterial cannulation in ICU patients using the radial artery or dorsalis pedis artery. Chest. 2001 Mar;119(3):901-6.
40. Wallach SG. Cannulation injury of the radial artery: Diagnosis and treatment algorithm. AmJCritCare.2004 Jul;13(4):315-9.
41. Hipszer B, Furlong K, Lessin J, et al. Continuous Glucose Monitoring in the Perioperative Period. AmericanSocietyofAnesthesiology, Abstract October 2006.
42. Hipszer B, Chervoneva I, Gratch D, et al. The Utility of Simultaneous Glucose Sensor Measurements. Diabetes Techology Society. Abstract November 2007.
43. Joseph JI. Anesthesia and Surgery in the Diabetic Patient, Chapter 31, Textbook of Type 2 Diabetes, Martin Dunitz Publisher, 2007.
44. Joseph JI. Future Management Approaches: New Devices in the Management of Diabetes, Chapter 36, Textbook of Type 2 Diabetes, Martin Dunitz Publisher, 2007.
72 Executive Summary Conference Report
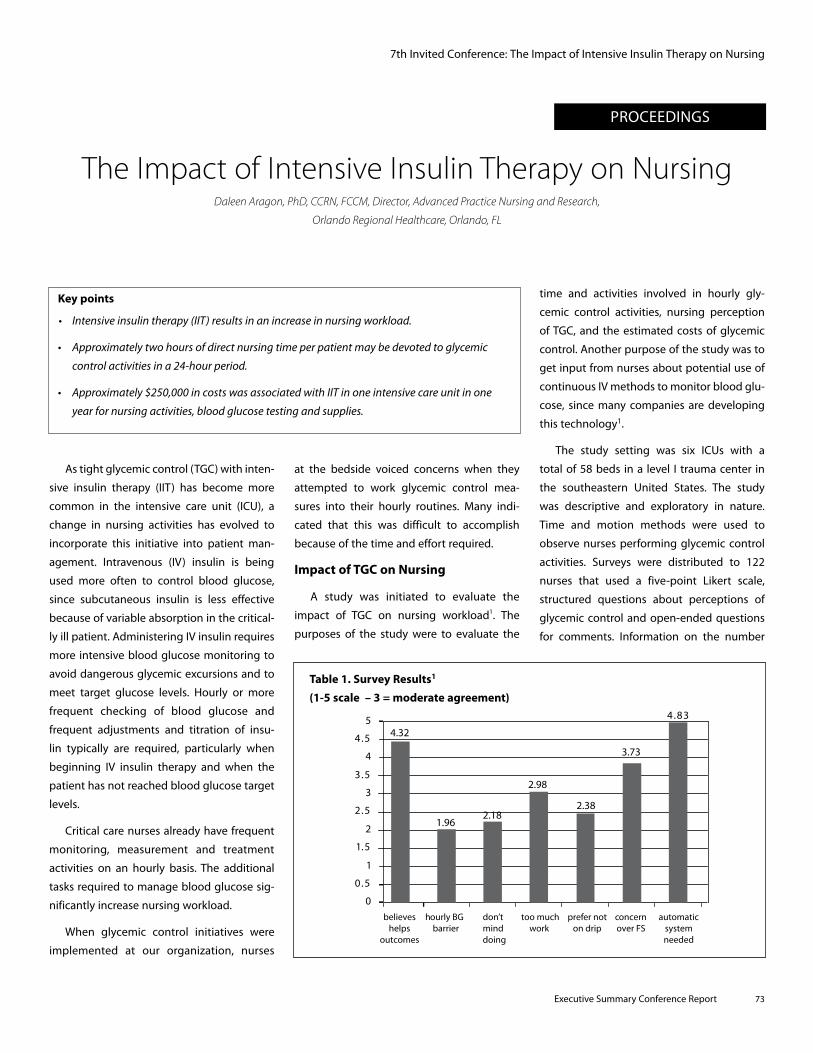
Executive Summary Conference Report 73
PROCEEDINGS
The Impact of Intensive Insulin Therapy on NursingDaleen Aragon, PhD, CCRN, FCCM, Director, Advanced Practice Nursing and Research,
Orlando Regional Healthcare, Orlando, FL
7th Invited Conference: The Impact of Intensive Insulin Therapy on Nursing
Key points
• Intensiveinsulintherapy(IIT)resultsinanincreaseinnursingworkload.
• Approximatelytwohoursofdirectnursingtimeperpatientmaybedevotedtoglycemic
controlactivitiesina24-hourperiod.
• Approximately$250,000incostswasassociatedwithIITinoneintensivecareunitinone
yearfornursingactivities,bloodglucosetestingandsupplies.
As tight glycemic control (TGC) with inten-
sive insulin therapy (IIT) has become more
common in the intensive care unit (ICU), a
change in nursing activities has evolved to
incorporate this initiative into patient man-
agement. Intravenous (IV) insulin is being
used more often to control blood glucose,
since subcutaneous insulin is less effective
because of variable absorption in the critical-
ly ill patient. Administering IV insulin requires
more intensive blood glucose monitoring to
avoid dangerous glycemic excursions and to
meet target glucose levels. Hourly or more
frequent checking of blood glucose and
frequent adjustments and titration of insu-
lin typically are required, particularly when
beginning IV insulin therapy and when the
patient has not reached blood glucose target
levels.
Critical care nurses already have frequent
monitoring, measurement and treatment
activities on an hourly basis. The additional
tasks required to manage blood glucose sig-
nificantly increase nursing workload.
When glycemic control initiatives were
implemented at our organization, nurses
at the bedside voiced concerns when they
attempted to work glycemic control mea-
sures into their hourly routines. Many indi-
cated that this was difficult to accomplish
because of the time and effort required.
Impact of TGC on Nursing
A study was initiated to evaluate the
impact of TGC on nursing workload1. The
purposes of the study were to evaluate the
time and activities involved in hourly gly-
cemic control activities, nursing perception
of TGC, and the estimated costs of glycemic
control. Another purpose of the study was to
get input from nurses about potential use of
continuous IV methods to monitor blood glu-
cose, since many companies are developing
this technology1.
The study setting was six ICUs with a
total of 58 beds in a level I trauma center in
the southeastern United States. The study
was descriptive and exploratory in nature.
Time and motion methods were used to
observe nurses performing glycemic control
activities. Surveys were distributed to 122
nurses that used a five-point Likert scale,
structured questions about perceptions of
glycemic control and open-ended questions
for comments. Information on the number
Table 1. Survey Results1
(1-5 scale – 3 = moderate agreement)
26%
38%
62% 59%
0
4000
3500
3000
2500
2000
1500
1000
500
0
0.1
0.2
0.3
0.4
0.5
0.6
0.7
Good for patient care
Worry for patients
Work Eort Monitoring
1.96
2.98
2.182.38
3.73
4.83
0
0.5
1
1.5
2
2.5
3
3.5
4
4.5
5
believeshelps
outcomes
hourly BGbarrier
don’tminddoing
too muchwork
prefer noton drip
concernover FS
automaticsystemneeded
issues
4.32
CVRR
ICU
BTICU
CCU
OctOct
SeptDec
Jan
NovFeb
MarApr
MayJu
neJu
lyAug
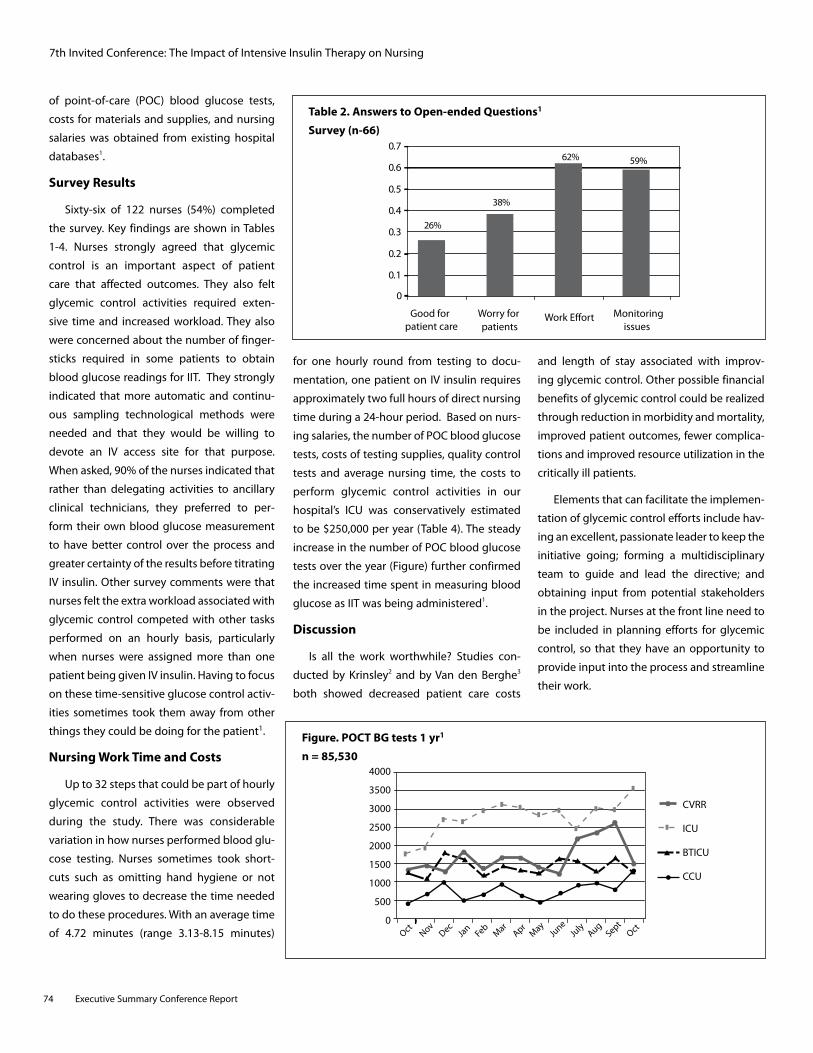
7th Invited Conference: The Impact of Intensive Insulin Therapy on Nursing
of point-of-care (POC) blood glucose tests,
costs for materials and supplies, and nursing
salaries was obtained from existing hospital
databases1.
Survey Results
Sixty-six of 122 nurses (54%) completed
the survey. Key findings are shown in Tables
1-4. Nurses strongly agreed that glycemic
control is an important aspect of patient
care that affected outcomes. They also felt
glycemic control activities required exten-
sive time and increased workload. They also
were concerned about the number of finger-
sticks required in some patients to obtain
blood glucose readings for IIT. They strongly
indicated that more automatic and continu-
ous sampling technological methods were
needed and that they would be willing to
devote an IV access site for that purpose.
When asked, 90% of the nurses indicated that
rather than delegating activities to ancillary
clinical technicians, they preferred to per-
form their own blood glucose measurement
to have better control over the process and
greater certainty of the results before titrating
IV insulin. Other survey comments were that
nurses felt the extra workload associated with
glycemic control competed with other tasks
performed on an hourly basis, particularly
when nurses were assigned more than one
patient being given IV insulin. Having to focus
on these time-sensitive glucose control activ-
ities sometimes took them away from other
things they could be doing for the patient1.
Nursing Work Time and Costs
Up to 32 steps that could be part of hourly
glycemic control activities were observed
during the study. There was considerable
variation in how nurses performed blood glu-
cose testing. Nurses sometimes took short-
cuts such as omitting hand hygiene or not
wearing gloves to decrease the time needed
to do these procedures. With an average time
of 4.72 minutes (range 3.13-8.15 minutes)
for one hourly round from testing to docu-
mentation, one patient on IV insulin requires
approximately two full hours of direct nursing
time during a 24-hour period. Based on nurs-
ing salaries, the number of POC blood glucose
tests, costs of testing supplies, quality control
tests and average nursing time, the costs to
perform glycemic control activities in our
hospital’s ICU was conservatively estimated
to be $250,000 per year (Table 4). The steady
increase in the number of POC blood glucose
tests over the year (Figure) further confirmed
the increased time spent in measuring blood
glucose as IIT was being administered1.
Discussion
Is all the work worthwhile? Studies con-
ducted by Krinsley2 and by Van den Berghe3
both showed decreased patient care costs
and length of stay associated with improv-
ing glycemic control. Other possible financial
benefits of glycemic control could be realized
through reduction in morbidity and mortality,
improved patient outcomes, fewer complica-
tions and improved resource utilization in the
critically ill patients.
Elements that can facilitate the implemen-
tation of glycemic control efforts include hav-
ing an excellent, passionate leader to keep the
initiative going; forming a multidisciplinary
team to guide and lead the directive; and
obtaining input from potential stakeholders
in the project. Nurses at the front line need to
be included in planning efforts for glycemic
control, so that they have an opportunity to
provide input into the process and streamline
their work.
26%
38%
62% 59%
0
4000
3500
3000
2500
2000
1500
1000
500
0
0.1
0.2
0.3
0.4
0.5
0.6
0.7
Good for patient care
Worry for patients
Work Eort Monitoring
1.96
2.98
2.182.38
3.73
4.83
0
0.5
1
1.5
2
2.5
3
3.5
4
4.5
5
believeshelps
outcomes
hourly BGbarrier
don’tminddoing
too muchwork
prefer noton drip
concernover FS
automaticsystemneeded
issues
4.32
CVRR
ICU
BTICU
CCU
OctOct
SeptDec
Jan
NovFeb
MarApr
MayJu
neJu
lyAug
Table 2. Answers to Open-ended Questions1
Survey (n-66)
Figure. POCT BG tests 1 yr1
n = 85,530
26%
38%
62% 59%
0
4000
3500
3000
2500
2000
1500
1000
500
0
0.1
0.2
0.3
0.4
0.5
0.6
0.7
Good for patient care
Worry for patients
Work Eort Monitoring
1.96
2.98
2.182.38
3.73
4.83
0
0.5
1
1.5
2
2.5
3
3.5
4
4.5
5
believeshelps
outcomes
hourly BGbarrier
don’tminddoing
too muchwork
prefer noton drip
concernover FS
automaticsystemneeded
issues
4.32
CVRR
ICU
BTICU
CCU
OctOct
SeptDec
Jan
NovFeb
MarApr
MayJu
neJu
lyAug
74 Executive Summary Conference Report
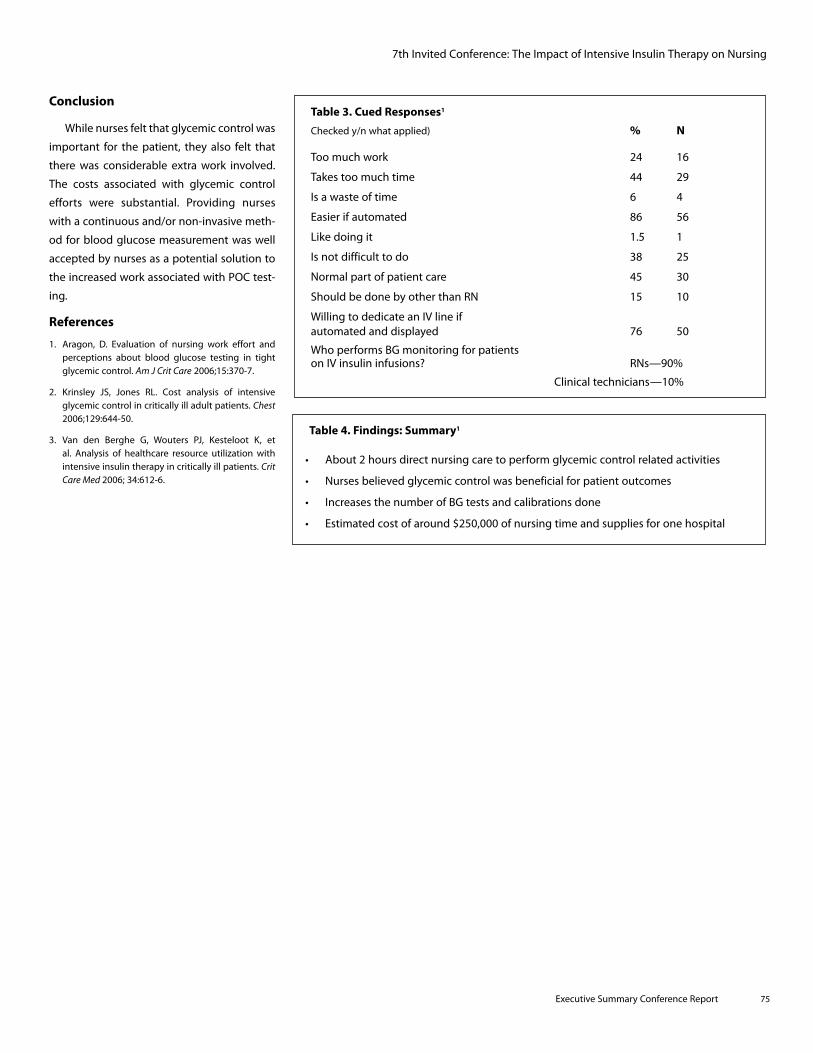
7th Invited Conference: The Impact of Intensive Insulin Therapy on Nursing
Table 4. Findings: Summary1
• About2hoursdirectnursingcaretoperformglycemiccontrolrelatedactivities
• Nursesbelievedglycemiccontrolwasbeneficialforpatientoutcomes
• IncreasesthenumberofBGtestsandcalibrationsdone
• Estimatedcostofaround$250,000ofnursingtimeandsuppliesforonehospital
Conclusion
While nurses felt that glycemic control was
important for the patient, they also felt that
there was considerable extra work involved.
The costs associated with glycemic control
efforts were substantial. Providing nurses
with a continuous and/or non-invasive meth-
od for blood glucose measurement was well
accepted by nurses as a potential solution to
the increased work associated with POC test-
ing.
References
1. Aragon, D. Evaluation of nursing work effort and perceptions about blood glucose testing in tight glycemic control. AmJCritCare 2006;15:370-7.
2. Krinsley JS, Jones RL. Cost analysis of intensive glycemic control in critically ill adult patients. Chest 2006;129:644-50.
3. Van den Berghe G, Wouters PJ, Kesteloot K, et al. Analysis of healthcare resource utilization with intensive insulin therapy in critically ill patients. CritCareMed2006; 34:612-6.
Table 3. Cued Responses1
Checked y/n what applied) % N
Too much work 24 16
Takes too much time 44 29
Is a waste of time 6 4
Easier if automated 86 56
Like doing it 1.5 1
Is not difficult to do 38 25
Normal part of patient care 45 30
Should be done by other than RN 15 10
Willing to dedicate an IV line if automated and displayed 76 50
Who performs BG monitoring for patients on IV insulin infusions? RNs—90%
Clinical technicians —10%
Executive Summary Conference Report 75
Nursing Education and Intensive Insulin TherapyCarol S. Manchester, MSN, APRN, BC-ADM, CDE, Diabetes Clinical Nurse Specialist University of Minnesota Medical Center,
Fairview University of Minnesota Children’s Hospital, Fairview, Minneapolis, Minnesota;
Adjunct Faculty, University of Minnesota School of Nursing, Minneapolis, Minnesota
7th Invited Conference: Nursing Education and Intensive Insulin Therapy
Key points
• CorecompetenciesrelatedtoTGCanddiabetescareincludetheproperuseofinsulinand
otherdiabetesmedications,medicalnutritiontherapy,point-of-caretesting,hypoglycemia
treatmentandconcomitanttherapies.
• EstablishmentofaninterdisciplinaryAcuteCareDiabetesAdvisoryCommitteewasthefirst
stepinaqualityimprovementprocess.
• Athoroughassessmentofeachprofessionaldiscipline’scurrentlevelofknowledgeandskills
isessentialtothedevelopmentofastrategicplanforglycemic-managementeducation.
• Challengesincludenurses’variedworkschedules,“informationacquisitionfatigue,”budget
constraintsandneedforadministrationtounderstandandsupporttheconceptoftraining
tocompetencyratherthantoaspecificperiodoftime.
• Aneducationalplanfordiabetesmanagementandtightglycemiccontrolcaninclude
employeeorientation,testsofmedicationknowledge,preceptorguidelinesandcurriculum,
annualcompetencytestingforalldisciplines,continuingeducationandremedialsupport.
• Acreativeandinnovativeapproachtoeducationiswelcomedbystaffandmoreeffectivefor
sustainedprofessionalgrowth.
Ensuring the professional competency of
the entire clinical staff is essential to suc-
cessfully delivering evidence-based, safe,
effective, respectful and appropriate diabe-
tes care. In this article, key elements of a
successful inpatient glycemic management
educational program are reviewed, including
core competencies, knowledge assessment,
development of a strategic educational plan
and continuing education.
Since nursing comprises the largest num-
ber of staff members at the frontline of care
delivery and the nurse is critical to the suc-
cess of diabetes care improvement initia-
tives, this article focuses on nursing educa-
tion. However, the information applies to all
healthcare disciplines, including pharmacy,
nutrition and medicine.
Inpatient Glycemic Management Improvement
The University of Minnesota Medical
Center (UMMC), Fairview, initiated an inpa-
tient glycemic management improvement
project in August, 2000. The average daily
census is 1,000 and 47% of the inpatient
population develop hyperglycemia.
The first step in quality improvement
process was to establish an interdisciplinary
Acute Care Diabetes Advisory Committee, co-
led by an endocrinologist and an advanced
practice nurse. Composed of individuals who
had a passion for diabetes and championed
tight glycemic control (TGC), the team had
ultimate accountability and responsibility for
all aspects of diabetes care. Complementary
knowledge and skills allowed the team to
build upon each other’s strengths in devel-
oping an educational program that would
disseminate the requisite knowledge and
training to ensure professional competency
throughout the care system.
Core Competencies
Core competencies related to TGC and
diabetes care include the proper use of insu-
lin and other diabetes medications, medi-
cal nutrition therapy, point-of-care testing,
hypoglycemia treatment and concomitant
therapies. Educational methods to success-
fully promote competency include case
scenarios with exercises that require critical
thinking and problem-solving skills to answer
the questions correctly, simulation exercises,
clinical rounding on all shifts, observation
and shadowing experiences and cross-disci-
pline training. Tables 1 and 2 provide exam-
ples of insulin competencies and a question
designed to promote critical thinking skills.
Assessing Level of Knowledge
Before developing a strategic plan for
glycemic-management education, the team
conducted a thorough assessment of each
professional discipline’s current knowledge
and skills and reviewed and inventoried the
76 Executive Summary Conference Report
PROCEEDINGS
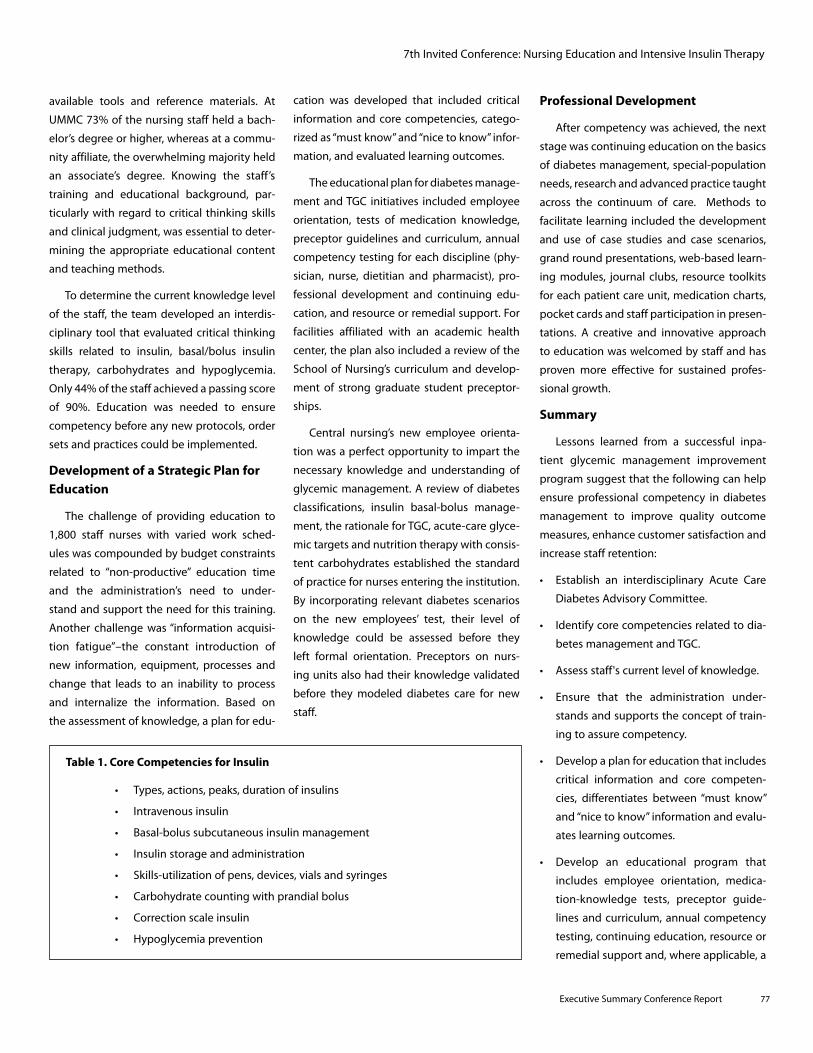
available tools and reference materials. At
UMMC 73% of the nursing staff held a bach-
elor’s degree or higher, whereas at a commu-
nity affiliate, the overwhelming majority held
an associate’s degree. Knowing the staff’s
training and educational background, par-
ticularly with regard to critical thinking skills
and clinical judgment, was essential to deter-
mining the appropriate educational content
and teaching methods.
To determine the current knowledge level
of the staff, the team developed an interdis-
ciplinary tool that evaluated critical thinking
skills related to insulin, basal/bolus insulin
therapy, carbohydrates and hypoglycemia.
Only 44% of the staff achieved a passing score
of 90%. Education was needed to ensure
competency before any new protocols, order
sets and practices could be implemented.
Development of a Strategic Plan for Education
The challenge of providing education to
1,800 staff nurses with varied work sched-
ules was compounded by budget constraints
related to “non-productive” education time
and the administration’s need to under-
stand and support the need for this training.
Another challenge was “information acquisi-
tion fatigue”–the constant introduction of
new information, equipment, processes and
change that leads to an inability to process
and internalize the information. Based on
the assessment of knowledge, a plan for edu-
cation was developed that included critical
information and core competencies, catego-
rized as “must know” and “nice to know” infor-
mation, and evaluated learning outcomes.
The educational plan for diabetes manage-
ment and TGC initiatives included employee
orientation, tests of medication knowledge,
preceptor guidelines and curriculum, annual
competency testing for each discipline (phy-
sician, nurse, dietitian and pharmacist), pro-
fessional development and continuing edu-
cation, and resource or remedial support. For
facilities affiliated with an academic health
center, the plan also included a review of the
School of Nursing’s curriculum and develop-
ment of strong graduate student preceptor-
ships.
Central nursing’s new employee orienta-
tion was a perfect opportunity to impart the
necessary knowledge and understanding of
glycemic management. A review of diabetes
classifications, insulin basal-bolus manage-
ment, the rationale for TGC, acute-care glyce-
mic targets and nutrition therapy with consis-
tent carbohydrates established the standard
of practice for nurses entering the institution.
By incorporating relevant diabetes scenarios
on the new employees’ test, their level of
knowledge could be assessed before they
left formal orientation. Preceptors on nurs-
ing units also had their knowledge validated
before they modeled diabetes care for new
staff.
Professional Development
After competency was achieved, the next
stage was continuing education on the basics
of diabetes management, special-population
needs, research and advanced practice taught
across the continuum of care. Methods to
facilitate learning included the development
and use of case studies and case scenarios,
grand round presentations, web-based learn-
ing modules, journal clubs, resource toolkits
for each patient care unit, medication charts,
pocket cards and staff participation in presen-
tations. A creative and innovative approach
to education was welcomed by staff and has
proven more effective for sustained profes-
sional growth.
Summary
Lessons learned from a successful inpa-
tient glycemic management improvement
program suggest that the following can help
ensure professional competency in diabetes
management to improve quality outcome
measures, enhance customer satisfaction and
increase staff retention:
• Establish an interdisciplinary Acute Care
Diabetes Advisory Committee.
• Identifycorecompetenciesrelatedtodia-
betes management and TGC.
• Assessstaff'scurrentlevelofknowledge.
• Ensure that the administration under-
stands and supports the concept of train-
ing to assure competency.
• Developaplanforeducationthatincludes
critical information and core competen-
cies, differentiates between “must know”
and “nice to know” information and evalu-
ates learning outcomes.
• Develop an educational program that
includes employee orientation, medica-
tion-knowledge tests, preceptor guide-
lines and curriculum, annual competency
testing, continuing education, resource or
remedial support and, where applicable, a
Table 1. Core Competencies for Insulin
• Types,actions,peaks,durationofinsulins
• Intravenousinsulin
• Basal-bolussubcutaneousinsulinmanagement
• Insulinstorageandadministration
• Skills-utilizationofpens,devices,vialsandsyringes
• Carbohydratecountingwithprandialbolus
• Correctionscaleinsulin
• Hypoglycemiaprevention
Executive Summary Conference Report 77
7th Invited Conference: Nursing Education and Intensive Insulin Therapy
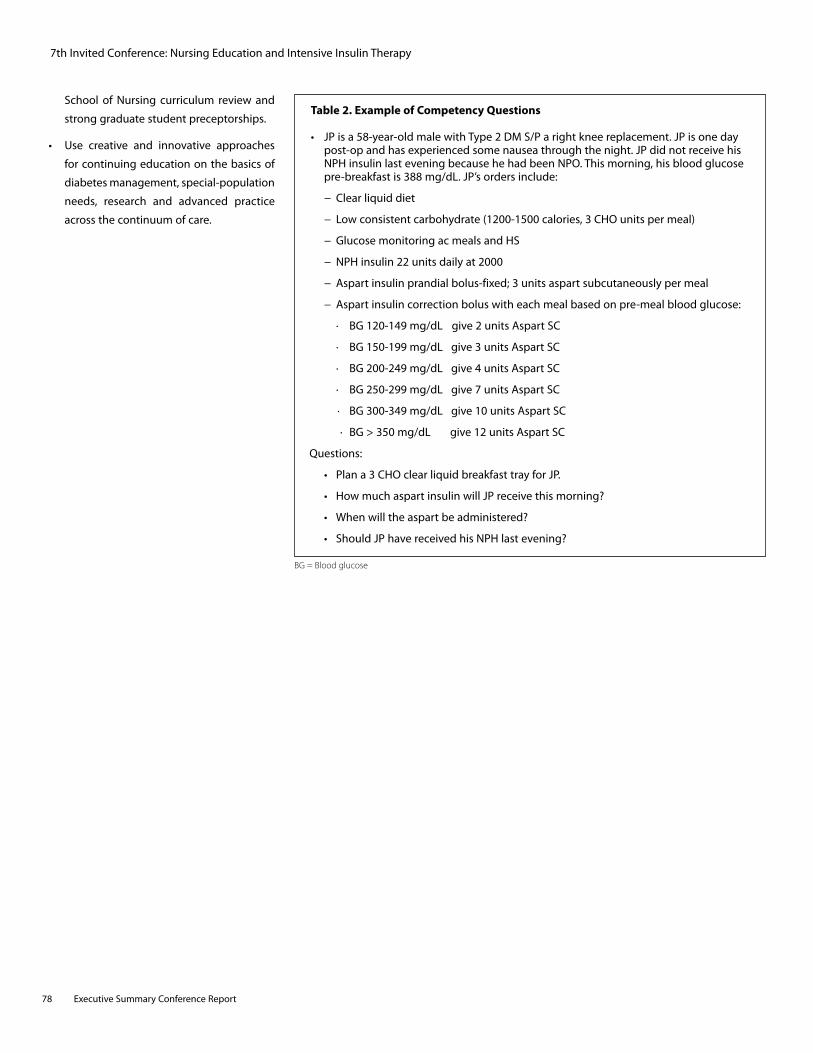
School of Nursing curriculum review and
strong graduate student preceptorships.
• Use creative and innovative approaches
for continuing education on the basics of
diabetes management, special-population
needs, research and advanced practice
across the continuum of care.
Table 2. Example of Competency Questions
• JPisa58-year-oldmalewithType2DMS/Parightkneereplacement.JPisoneday
post-op and has experienced some nausea through the night. JP did not receive his NPH insulin last evening because he had been NPO. This morning, his blood glucose pre-breakfast is 388 mg/dL. JP’s orders include:
− Clear liquid diet
− Low consistent carbohydrate (1200-1500 calories, 3 CHO units per meal)
− Glucose monitoring ac meals and HS
− NPH insulin 22 units daily at 2000
− Aspart insulin prandial bolus-fixed; 3 units aspart subcutaneously per meal
− Aspart insulin correction bolus with each meal based on pre-meal blood glucose:
· BG 120-149 mg/dL give 2 units Aspart SC
· BG 150-199 mg/dL give 3 units Aspart SC
· BG 200-249 mg/dL give 4 units Aspart SC
· BG 250-299 mg/dL give 7 units Aspart SC
· BG 300-349 mg/dL give 10 units Aspart SC
· BG > 350 mg/dL give 12 units Aspart SC
Questions:
• Plana3CHOclearliquidbreakfasttrayforJP.
• HowmuchaspartinsulinwillJPreceivethismorning?
• Whenwilltheaspartbeadministered?
• ShouldJPhavereceivedhisNPHlastevening?
7th Invited Conference: Nursing Education and Intensive Insulin Therapy
78 Executive Summary Conference Report
BG = Blood glucose
PROCEEDINGS
Applying Glucometrics to Tight Glycemic ControlJacqueline Thompson, MAS, RN, CDE, Director, Diabetes Service Line,
Sharp Healthcare, San Diego, CA
Key points
• "Glucometrics”istheassessmentofglucosecontrolthatincludesfourmeasures:glycemic
levels,efficacyofcontrol,rateofadverseeventsandtheimpactonclinicaloutcomes.
• Ourgoalwastoimproveglycemiccontrolwithoutincreasingtheriskofhypoglycemia.
• Atbaseline33%ofpatientshadpoorglucosecontrol,definedasatleastonedailyepisode
wherebloodglucose<65mg/dLor>200mg/dL,and18.2%experiencedextremeblood
glucoseexcursions(>300mg/dL).
• Glucometrics were developed for patients in the intensive care unit (ICU). Extreme values
weremodifiedtobloodglucose>180mg/dLor<50mg/dL.
• Resultsweresharedonamonthlybasisatalllevelsoftheorganization.
• From 2002 to 2006, a 30% reduction in out-of-control dayswas realized, suggesting that
theuseofGlucometricscanhelpimproveclinicalperformanceandpatientoutcomes.
Although glycemic target ranges have
been recommend for hospitalized acute- and
intensive-care patients, no consensus exists
as to how a single hospital or hospital system
can gauge its clinical performance compared
to others. “Glucometrics” is a way of assessing
glucose control that includes four measures:
glycemic levels, efficacy of control, rate of
adverse events and the impact on clinical
outcomes.
At Sharp, we initially set out to improve
the glycemic control of patients with a sec-
ondary diagnosis of diabetes without increas-
ing the risk for hypoglycemic events—the
concern most frequently expressed by
our medical staff with regard to achieving
improved glycemic control. To determine our
baseline for glycemic control, all laboratory
and point-of-care (POC) blood glucose data
were obtained from Sharp’s clinical informa-
tion system for calendar year 2002. Patients
were identified by DRG 250, which is a sec-
ondary diagnosis of diabetes. We included all
laboratory and bedside blood glucose values
and double-checked all glucose levels >600
mg/dL for coding error or missed diagnosis.
It was found that 33% of patients had poor
control, defined as at least one episode where
blood glucose was < 65 mg/dL or > 200 mg/
dL. It was also noted that 18.2% experienced
extreme blood glucose excursions, which was
defined as blood glucose > 300 mg/dL.
Sharp refined its Glucometrics for
the acute-care setting to include a “Well-
managed Day” (adequately monitored and
not out of control), added statistical analy-
sis of the data including mean and stan-
dard deviation and reported “extreme” data
(blood glucose < 60 and > 300 mg/dL).
Glucometrics were developed for use with
all patients admitted to the intensive care
unit (ICU) that show the distribution of blood
glucose levels. Extreme values have been
modified to blood glucose > 180 mg/dL or
< 50 mg/dL.
Results were shared each month at all
levels of the organization from executive
leadership, who receive a report summariz-
ing all Sharp hospitals, to individual hospitals,
which receive results benchmarked against
all other hospitals within Sharp, and to indi-
vidual patient care units. More information
can be obtained from the data-rich reposi-
tory to evaluate population subsets such as
trauma, cardiac and renal transplant patients
or physicians and medical groups.
During the four-year period from 2002 to
2006, a 30% reduction in out-of-control days
has been realized from using Glucometrics to
evaluate glucose management of inpatients.
This suggests that providing timely and accu-
rate clinical performance data to frontline
clinical teams can help improve clinical per-
formance and patient outcomes.
7th Invited Conference: Applying Glucometrics to Tight Glycemic Control
Executive Summary Conference Report 79
80 Executive Summary Conference Report
Roundtable
Intensive Insulin Therapy for Tight Glycemic ControlPhilip J. Schneider, MS, FASHP Editor
The value of a conference of this type is not only the
outstanding information presented in the lectures, but also
discussing the application of this information among the
distinguished presenters and invited guests. While consensus
seems to be emerging among experts in this field, much still
needs to be done to reach agreement on issues like the impact
on hospital costs, a reasonable target for treatment outcome,
methods, the administrative aspects needed to achieve tight
glycemic control, the risks and consequences of hypoglycemia
and the best method to measure blood glucose. What follows
are some of the comments from the discussions at this
roundtable about these six topics. Participants shared their
insights about how intensive insulin therapy might actually
be used to achieve tight glycemic control and debated issues
where consensus has yet to be reached.
Roundtable
What is the impact of intensive insulin therapy (IIT) on hospital costs?
My administrative colleagues will ask,
“What is this going to cost? What’s the
upfront cost?” I’m not talking about hos-
pital length of stay reductions and all
those other important things, because
the administrators, at least at my institu-
tion, don’t seem to be particularly fazed
or impressed by those data. They want
to know, “How much is this machine or
device or computer going to cost me?
What’s the capital investment up front?”
I need that answer if I’m going to con-
vince them to buy. Otherwise they’re
going to say, “Sorry, too much money.”
John P. Kress, MD
I’d be happy to answer “What is this
going to cost?” One ventilator-associated
pneumonia for you…for the whole hos-
pital.
W. Patrick Burgess,MD,PhD
IIT might be time-saving, because if
you achieve tight glycemic control, you
can avoid 40% of acute renal failures and
the need to start hemodialysis or hemo-
filtration. You can get your patient off
of the ventilator more quickly. It might
even save time if you have a good pro-
tocol and also if you could work with
continuous monitoring.
Christophe De Block, MD
We were interested in implementing
continuous monitoring for tight glyce-
mic control at our hospital, so I did look
into the cost. I was quoted a cost of $5
per day/per bed. The cost is not based on
whether your patient is using the device,
it’s based on the cost of your beds.
Jacqueline Thompson, MAS,RN,CDE
We looked into that, too. The server
alone was $12,000, and then we looked
at the cost per ICU bed. For our institu-
tion, the cost was about $50,000.
Kris Hedges, MBA
The savings is on the order of $20 to
$30 per bed, when you look at the reduc-
tion in the number of infections and
length of stay.
W. Patrick Burgess,MD,PhD
What is a reasonable target for
blood glucose control?
The range of 80-110 mg/dL has been
touted as a goal, but if you look at the
clinical experience to date, patients are
not in that range for very long—in some
cases less than half the time, or perhaps
40%.
Guy Soo Hoo, MD
If patients don’t have diabetes, our
glycemic range is about 80-130 mg/L;
80 fasting and maximum 130. We think
patients shouldn’t be outside the nor-
mal range of blood glucose variation
that non-diabetics have within a 24-hour
period.
Kalman Holdy, MD
There is huge inter-patient variation
in how people respond. When a patient
is really sick, blood sugar varies enor-
mously.
Simon Finfer, MB,BS,FRCP,FRCA,FJFICM
We have a commercially available
computerized program for insulin infu-
sion dosing and keep our patients at
goal about 60% of the time. We get our
patients to goal in about six hours at
80-110 mg/dL.
Judith Jacobi, PharmD,FCCM,FCCP,BCPS
Executive Summary Conference Report 81
82 Executive Summary Conference Report
Roundtable
What factors complicate glycemic
control in critically ill patients?
One factor is how the pharmacy pre-
pares a product. If the insulin infusion is
always mixed in 5% dextrose, a 50-mL
bag of 5% dextrose isn’t going to make
a big difference. But how many patients
also get antibiotics or other medications
that are provided in dextrose-based solu-
tions?
Judith Jacobi, PharmD,FCCM,FCCP,BCPS
Another factor is stopping TPN imme-
diately. You can’t adjust for that.
Bruce W. Bode, MD
Steroids certainly are a big question
with hyperglycemia that we encoun-
ter in most of our patients in the ICUs.
Generally the steroids are given as bolus
doses in the ICU. There’s a lag between
the time the steroids are administered,
and a different lag in terms of insulin
coverage.
Kalman Holdy, MD
We start with a somewhat higher
target blood glucose range of 80-150 mg/
dL. By starting with a higher target range
and mixing intermittent medications,
such as antibiotics, in normal saline, and
by standardizing the site where blood for
glucose testing is obtained, we were able
to obtain the goal of 80-150 mg/dL in
80% of tested blood glucose values, with
a hypoglycemia rate, i.e., blood glucose
< 40 mg/dL, less than 1%.
Rhonda S. Rea, PharmD
The glycemic control diet is really
based on the source of hyperglycemia
in the majority of patients who are ill.
In the majority of cases, the reason that
patients are hyperglycemic is not exog-
enous nutrition or glucose; it is endog-
enous production of glucose in the liver.
Kalman Holdy, MD
What are the administrative
aspects of an IIT program?
Right now with our computerized sys-
tem, every nurse is trained in a 15-minute
segment upon enrollment in the hospi-
tal. All our glucoses are done by medical
assistants or medical techs. Except in the
ICU on a one-to-one ratio, the nurse still
is very much involved in it. There’s really
almost no time involved except to set
up the device, which takes about three
minutes. So the true nursing time is very
minor; it’s not two to three hours a day
per patient at all. A lot of the work is
done by nursing partners, so the time to
do a glucose, get it back to the nurse and
input it would be probably three to five
minutes.
Bruce W. Bode, MD
We have a training tape on the web
that teaches the nurses how to use bed-
side testing, so that an institution can
train their new nurses by using the web-
based tutorials. We find that program-
ming the time into the software that
about 40% of the time, the Accu-Cheks
are every two hours. This reduces 40%
of the fixed cost of the disposables from
the point-of-care device because of less
frequent testing. That also saves the five
minutes times the 40%. We find that on
average, somewhere between 14 and 16
checks a day will keep a patient in con-
trol.
The decision-making takes some-
where between 10 and 15 seconds. The
nurse walks up to a computer and walks
away with an answer. It’s a few keystrokes
and they get used to doing it. The fewer
keystrokes they use, the faster they get.
W. Patrick Burgess, MD,PhD
Executive Summary Conference Report 83
Roundtable
I believe a fair number of low glu-
cose levels are not actually hypoglyce-
mic events, because when the glucom-
eter reading is checked against the lab
results, a high proportion of the glucom-
eters are under-reading. But the majority
of the glucometer readings are not being
checked.
Simon Finfer, MB,BS,FRCP,FRCA,FJFICM
Hospital meters err on the side of
being lower than laboratory values as a
protective mechanism. That’s why, when
you send your data to the lab, very few of
the readings were truly less than 40; they
were trending towards 60 but trending
toward the low range.
Bruce W. Bode, MD
The hypoglycemia risk does seem
higher in that setting, if you’re not giving
some basal glucose.
Judith Jacobi, PharmD,FCCM,FCCP,BCPS
The gold standard test of pituitary
function is an insulin tolerance test. And
the goal sugar is below 40 mg/dL. It’s
a diagnostic test to produce a pituitary
response, and the goal is to get the
blood sugar transiently below 40. There’s
a large body of experience over 30 years
with that particular test showing no
adverse effects from transient hypogly-
cemia.
Robert Osburne, MD
The treatment of hypoglycemia is
extremely labor-intense—with repeat-
ing glucoses every 15-20 minutes and
then implementing whatever interven-
tion is called for per your protocol.
R. Daniel Pollom, MD
We have a shortage of nurses. We’re
using 600 registry, or travel nurses in
our facilities and retraining isn’t going to
help us. We instituted a policy so that if
there is a low blood glucose reading and
the nurse does not validate it and ask
whether the patient really looks hypo-
glycemic, another nurse has to perform
a double-check.
Jacqueline Thompson, MAS,RN,CDE
What is the risk of
hypoglycemia with IIT?
The hypoglycemic rate using a com-
puter, EndoTool™ or Glucomander®, to
calculate the infusion rate is less than
1%, not only in the institutions where
they were promoted and designed but
also in other institutions. In the NICE-
SUGAR trial, the hypoglycemia rate is 5%.
Why would there be a difference in the
rates of hypoglycemia?
Chris Hogness, MD,MPH
We also have to take into account
the duration of the hypoglycemia. If you
measure glycemia on a continuous basis,
see it drop off to below 40, and correct it
immediately, there would probably not
be a problem. But if you don’t monitor
glycemia continuously or frequently and
your patient stays below 40 for more
than 30 minutes, then you have a prob-
lem.
Christophe De Block, MD
We are currently doing a study in
older type 2 diabetics with pacemakers,
and taking them from 150 mg/dL down
to 50 at a certain rate, then taking them
back up to 150 and down to 50 at a faster
rate, and people develop pretty signifi-
cant CNS symptoms between 60 and 65.
When you get them down to 50, they
often stop talking and they’re “spacey.”
We leave them at 50 for about half an
hour, and we’re looking to see if the EKG
changes.
The real issue is permanent injury, and
that’s fairly rare.
Jeffrey I. Joseph, DO
84 Executive Summary Conference Report
Roundtable
It would be a real shame if people
went away from this conference thinking
that there was any credible evidence at
all that one blood glucose of less than
40 was harmful. Because I don’t believe
there is any credible evidence.
Simon Finfer, MB,BS,FRCP,FRCA,FJFICM
What is the best way to
measure blood glucose
concentrations for IIT?
I think the quality of the technology
at the bedside for measuring glucose
is a really important point. At our unit,
wenoticed that we had a 20% to 30% dif-
ference between our glucometer results
and laboratory values.
The glucometers were telling us that
the patient’s values were fine, when in
fact the patient was hypoglycemic. We
did a quality analysis and realized that,
atleast in our population, the major rea-
son for the error was a high prevalence of
anemia in our patients.
We tested four different glucometers,
and all of them had an approximately
20% error rate. The manufacturer tells us,
“Well, 15% is okay.” That was true back
in the era of trying to keep diabetics
< 200mg/dL, but when you’re trying to
keep someone between 80 to 110 mg/
dL, you need to know that your measure-
ment is accurate. Checking glucometers
against laboratory reference values is
very important, because glucometers are
subject to a lot of error.
Heather Pidcoke, MD
We had an issue with the glucometers
at our hospital as well; we were getting
some erroneous readings. And when we
investigated it further, the blame was
placed on nursing, as if their technique
were inappropriate. But the truth was
that if an adequate blood sample wasn’t
applied, if it didn’t wick completely and
cover the yellow area completely, the
meter was capable of giving an errone-
ous reading by 54%, high or low.
Jacqueline Thompson, MAS,RN,CDE
I’ve heard a lot of criticism of the
meters, but we often will do a sample
in duplicate or triplicate with the same
meter and have a fairly small standard
deviation. The bigger issue is getting a
quality sample. The size of the drop on
the fingerstick is an issue, I agree, but we
actually had the smaller standard devia-
tion from the fingersticks.
If a patient is in shock and has low
blood pressure and cold hands, that’s an
issue. If you’re squeezing the blood, that
does alter the measurement. However,
I’m finding much more of an issue from
sampling from a radial arterial line or a
venous line. Everybody does it a little dif-
ferently. One, there’s a lot of phlebotomy
involved, and two, if there’s even a little
bit of residual in the stopcock or varia-
tion in how you’re doing it, this can result
in a low or high dilutional error.
Jeffrey I. Joseph, DO
Regarding the continuous glucose
monitoring, I’m sure when we have
results real-time and on a computer
screen, it will help. But another huge
advantage is that we can pull so much
data out of these devices — areas under
the curve, percentage of time in certain
glycemic ranges and indexes of variabil-
ity.
Christophe De Block, MD
When I tested our glucometers, I lined
up five and did them all at the same time.
They’re very consistent with each other.
The problem is they're precise but not
accurate. When I would send the sample
off to the lab, the glucometer results all
showed the same amount of difference
from the lab value.
Heather Pidcoke, MD
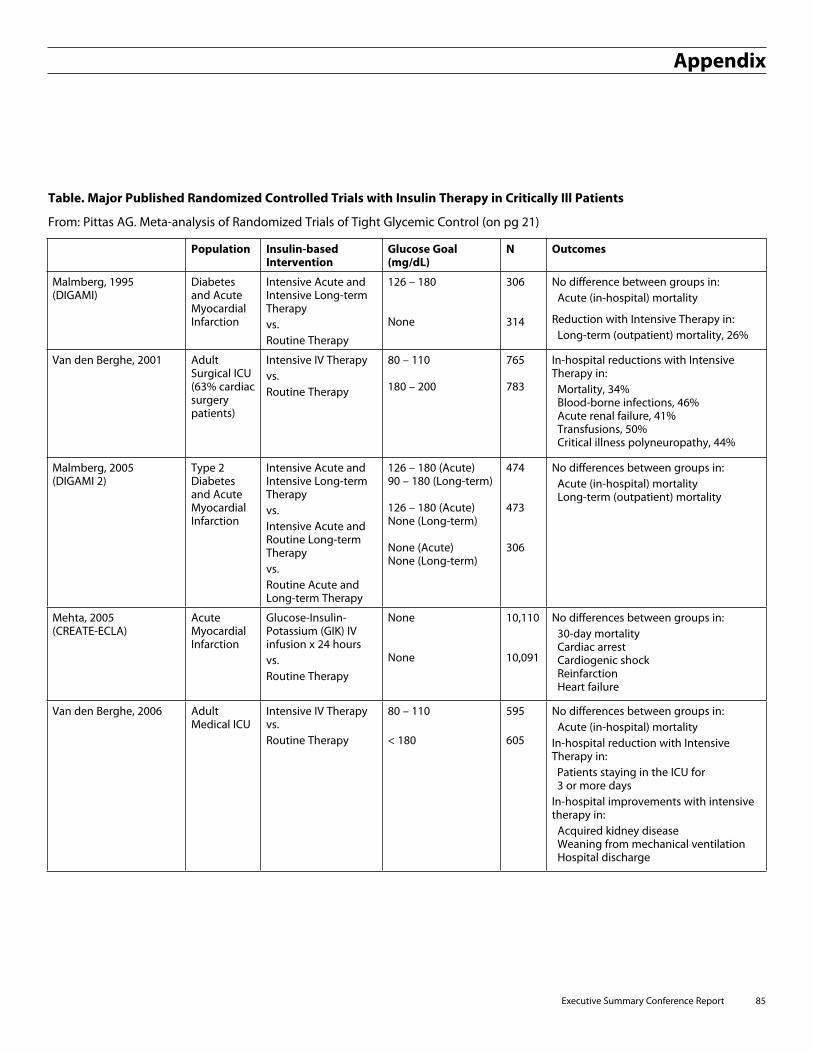
Executive Summary Conference Report 85
Table. Major Published Randomized Controlled Trials with Insulin Therapy in Critically Ill Patients
From: Pittas AG. Meta-analysis of Randomized Trials of Tight Glycemic Control (on pg 21)
Population Insulin-based Intervention
Glucose Goal (mg/dL)
N Outcomes
Malmberg, 1995 (DIGAMI)
Diabetes and Acute Myocardial Infarction
Intensive Acute and Intensive Long-term Therapy vs. Routine Therapy
126 – 180 None
306 314
No difference between groups in: Acute (in-hospital) mortality
Reduction with Intensive Therapy in: Long-term (outpatient) mortality, 26%
Van den Berghe, 2001 Adult Surgical ICU (63% cardiac surgery patients)
Intensive IV Therapyvs. Routine Therapy
80 – 110 180 – 200
765 783
In-hospital reductions with Intensive Therapy in: Mortality, 34% Blood-borne infections, 46% Acute renal failure, 41% Transfusions, 50% Critical illness polyneuropathy, 44%
Malmberg, 2005 (DIGAMI 2)
Type 2 Diabetes and Acute Myocardial Infarction
Intensive Acute and Intensive Long-term Therapy vs. Intensive Acute and Routine Long-term Therapy vs. Routine Acute and Long-term Therapy
126 – 180 (Acute) 90 – 180 (Long-term) 126 – 180 (Acute) None (Long-term) None (Acute) None (Long-term)
474 473 306
No differences between groups in: Acute (in-hospital) mortality Long-term (outpatient) mortality
Mehta, 2005 (CREATE-ECLA)
Acute Myocardial Infarction
Glucose-Insulin-Potassium (GIK) IV infusion x 24 hours vs.Routine Therapy
None None
10,110 10,091
No differences between groups in: 30-day mortality Cardiac arrest Cardiogenic shock Reinfarction Heart failure
Van den Berghe, 2006 Adult Medical ICU
Intensive IV Therapy vs.Routine Therapy
80 – 110
< 180
595
605
No differences between groups in: Acute (in-hospital) mortality In-hospital reduction with Intensive Therapy in:
Patients staying in the ICU for 3 or more days
In-hospital improvements with intensive therapy in: Acquired kidney disease Weaning from mechanical ventilation Hospital discharge
Appendix
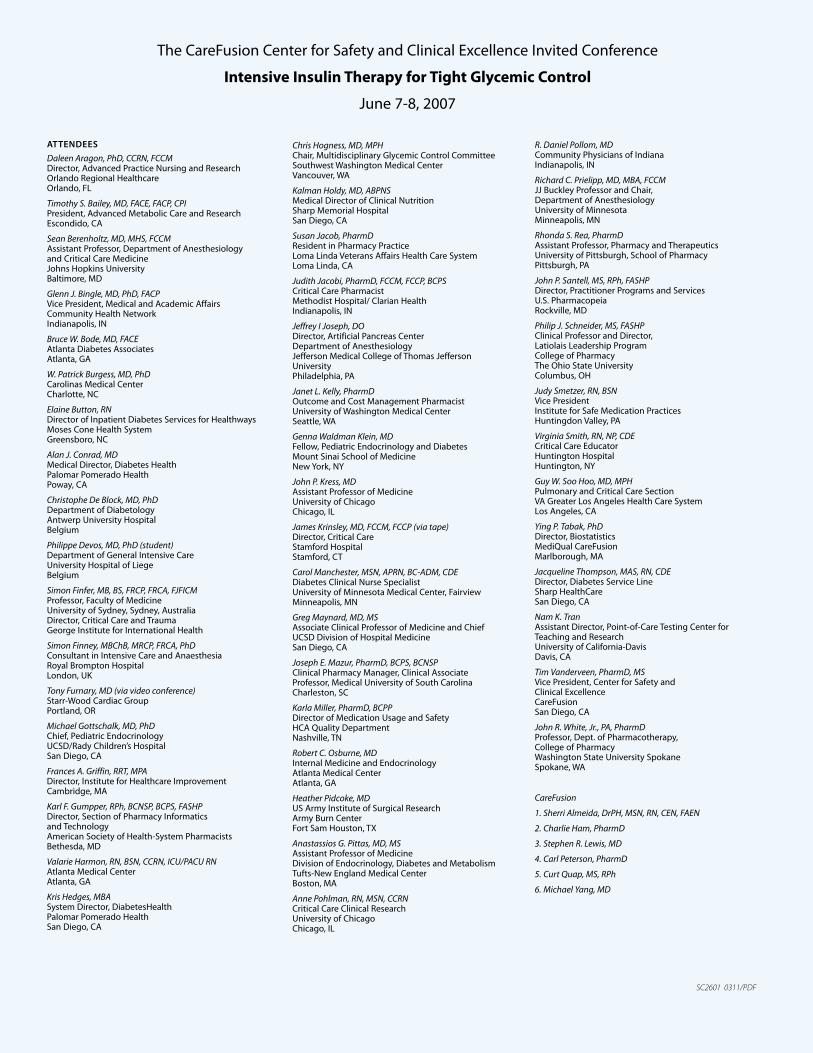
ATTENDEES
DaleenAragon,PhD,CCRN,FCCMDirector, Advanced Practice Nursing and Research Orlando Regional Healthcare Orlando, FL
TimothyS.Bailey,MD,FACE,FACP,CPIPresident, Advanced Metabolic Care and Research Escondido, CA
SeanBerenholtz,MD,MHS,FCCMAssistant Professor, Department of Anesthesiology and Critical Care Medicine Johns Hopkins University Baltimore, MD
GlennJ.Bingle,MD,PhD,FACPVice President, Medical and Academic Affairs Community Health Network Indianapolis, IN
BruceW.Bode,MD,FACEAtlanta Diabetes Associates Atlanta, GA
W.PatrickBurgess,MD,PhDCarolinas Medical Center Charlotte, NC
ElaineButton,RNDirector of Inpatient Diabetes Services for Healthways Moses Cone Health System Greensboro, NC
AlanJ.Conrad,MDMedical Director, Diabetes Health Palomar Pomerado Health Poway, CA
ChristopheDeBlock,MD,PhDDepartment of Diabetology Antwerp University Hospital Belgium
PhilippeDevos,MD,PhD(student)Department of General Intensive Care University Hospital of Liege Belgium
SimonFinfer,MB,BS,FRCP,FRCA,FJFICMProfessor, Faculty of Medicine University of Sydney, Sydney, Australia Director, Critical Care and Trauma George Institute for International Health
SimonFinney,MBChB,MRCP,FRCA,PhDConsultant in Intensive Care and Anaesthesia Royal Brompton Hospital London, UK
TonyFurnary,MD(viavideoconference)Starr-Wood Cardiac Group Portland, OR
MichaelGottschalk,MD,PhDChief, Pediatric Endocrinology UCSD/Rady Children’s Hospital San Diego, CA
FrancesA.Griffin,RRT,MPADirector, Institute for Healthcare Improvement Cambridge, MA
KarlF.Gumpper,RPh,BCNSP,BCPS,FASHPDirector, Section of Pharmacy Informatics and Technology American Society of Health-System Pharmacists Bethesda, MD
ValarieHarmon,RN,BSN,CCRN,ICU/PACURNAtlanta Medical Center Atlanta, GA
KrisHedges,MBASystem Director, DiabetesHealth Palomar Pomerado Health San Diego, CA
The CareFusion Center for Safety and Clinical Excellence Invited Conference
Intensive Insulin Therapy for Tight Glycemic Control
June 7-8, 2007
ChrisHogness,MD,MPHChair, Multidisciplinary Glycemic Control Committee Southwest Washington Medical Center Vancouver, WA
KalmanHoldy,MD,ABPNSMedical Director of Clinical Nutrition Sharp Memorial Hospital San Diego, CA
SusanJacob,PharmDResident in Pharmacy Practice Loma Linda Veterans Affairs Health Care System Loma Linda, CA
JudithJacobi,PharmD,FCCM,FCCP,BCPSCritical Care Pharmacist Methodist Hospital/ Clarian Health Indianapolis, IN
JeffreyIJoseph,DODirector, Artificial Pancreas Center Department of Anesthesiology Jefferson Medical College of Thomas Jefferson University Philadelphia, PA
JanetL.Kelly,PharmDOutcome and Cost Management Pharmacist University of Washington Medical Center Seattle, WA
GennaWaldmanKlein,MDFellow, Pediatric Endocrinology and Diabetes Mount Sinai School of Medicine New York, NY
JohnP.Kress,MD Assistant Professor of Medicine University of Chicago Chicago, IL
JamesKrinsley,MD,FCCM,FCCP(viatape)Director, Critical Care Stamford Hospital Stamford, CT
CarolManchester,MSN,APRN,BC-ADM,CDEDiabetes Clinical Nurse Specialist University of Minnesota Medical Center, Fairview Minneapolis, MN
GregMaynard,MD,MSAssociate Clinical Professor of Medicine and Chief UCSD Division of Hospital Medicine San Diego, CA
JosephE.Mazur,PharmD,BCPS,BCNSPClinical Pharmacy Manager, Clinical Associate Professor, Medical University of South Carolina Charleston, SC
KarlaMiller,PharmD,BCPPDirector of Medication Usage and Safety HCA Quality Department Nashville, TN
RobertC.Osburne,MDInternal Medicine and Endocrinology Atlanta Medical Center Atlanta, GA
HeatherPidcoke,MDUS Army Institute of Surgical Research Army Burn Center Fort Sam Houston, TX
AnastassiosG.Pittas,MD,MSAssistant Professor of Medicine Division of Endocrinology, Diabetes and Metabolism Tufts-New England Medical Center Boston, MA
AnnePohlman,RN,MSN,CCRNCritical Care Clinical Research University of Chicago Chicago, IL
R.DanielPollom,MDCommunity Physicians of Indiana Indianapolis, IN
RichardC.Prielipp,MD,MBA,FCCMJJ Buckley Professor and Chair, Department of Anesthesiology University of Minnesota Minneapolis, MN
RhondaS.Rea,PharmDAssistant Professor, Pharmacy and Therapeutics University of Pittsburgh, School of Pharmacy Pittsburgh, PA
JohnP.Santell,MS,RPh,FASHPDirector, Practitioner Programs and Services U.S. Pharmacopeia Rockville, MD
PhilipJ.Schneider,MS,FASHPClinical Professor and Director, Latiolais Leadership Program College of Pharmacy The Ohio State University Columbus, OH
JudySmetzer,RN,BSNVice President Institute for Safe Medication Practices Huntingdon Valley, PA
VirginiaSmith,RN,NP,CDECritical Care Educator Huntington Hospital Huntington, NY
GuyW.SooHoo,MD,MPHPulmonary and Critical Care Section VA Greater Los Angeles Health Care System Los Angeles, CA
YingP.Tabak,PhDDirector, Biostatistics MediQual CareFusion Marlborough, MA
JacquelineThompson,MAS,RN,CDEDirector, Diabetes Service Line Sharp HealthCare San Diego, CA
NamK.TranAssistant Director, Point-of-Care Testing Center for Teaching and Research University of California-Davis Davis, CA
TimVanderveen,PharmD,MSVice President, Center for Safety and Clinical Excellence CareFusion San Diego, CA
JohnR.White,Jr.,PA,PharmDProfessor, Dept. of Pharmacotherapy, College of Pharmacy Washington State University Spokane Spokane, WA
CareFusion
1.SherriAlmeida,DrPH,MSN,RN,CEN,FAEN
2.CharlieHam,PharmD
3.StephenR.Lewis,MD
4.CarlPeterson,PharmD
5.CurtQuap,MS,RPh
6.MichaelYang,MD
SC2601 0311/PDF


![Glycemic Control-Subcutaneous Regimen Adjustment [1758] · Page 3 of 18 GLYCEMIC CONTROL SUBCUTANEOUS REGIMEN ADJUSTMENT [1758] (11/23/15) PATIENT INFORMATION [ ] Insulin …](https://img.pdfslide.net/doc/110x75/5b5e10097f8b9a415d8bb3a2/glycemic-control-subcutaneous-regimen-adjustment-1758-page-3-of-18-glycemic.jpg)