Embed Size (px)
Citation preview

Inter-Cell Interference Mitigation in LTE
Downlink Using Static Interference Coordination:
Case of Addis Ababa
By
Michael Moges
A THESIS
Submitted to Addis Ababa University of the Addis Ababa
Institute of Technology, School of Electrical and Computer
Engineering in Partial Fulfillment of the Requirements for the
Degree of
Master of Science
in
Communication Engineering
January 2016
Inter-Cell Interference Mitigation in LTE Downlink Using Static
Interference Coordination: Case of Addis Ababa
Submitted by Michael Moges
For The Degree of
Master of Science
in
Communication Engineering
Approval by Board of Examiners
________________________ ______________
Chairman, School Graduate Signature
Committee
Dr. –Ing. Dereje Hailemariam ______________
Advisor Signature
Dr Yihenew Wondie ______________
Examiner Signature
Dr Yalemzewd Negash ______________
Examiner Signature
Declaration
I, the undersigned, declare that this thesis is my original work, has not been presented
for a degree in this or any other university, and all sources of materials used for the
thesis have been fully acknowledged.
Michael Moges ______________
Name Signature
Place: Addis Ababa
Date of Submission: ______________
This thesis has been submitted for examination with my approval as a university
advisor.
Dr.-Ing. Dereje Hailemariam ______________
Advisor’s Name Signature
iv | P a g e
ABSTRACT
Recently, Long Term Evolution (LTE) has been deployed by many operators to address
the growing data needs. Ethio telecom is among those operators that have deployed
LTE in Addis Ababa. As other new emerging technologies, LTE uses orthogonal
frequency division multiple access (OFDMA) technology to improve the system
performance. However, the currently deployed LTE network has low average downlink
throughput due to the deployment uses reuse factor of 1 in which every cell can provide
services over the entire system band. Associated with reuse factor of 1, therefore, there
will be inter-cell interference between neighbor eNodeBs when they try to use the same
resource blocks to their user equipment. For cell-edge users (CEUs), the effect of inter-
cell interference is especially severe. Therefore, to improve the throughput, inter-cell
interference must be mitigated. Different methods have been proposed to mitigate this
interference and interference coordination using static inter-cell interference
coordination (ICIC) algorithm is the main one. Hence, this thesis focuses on the
evaluation of static ICIC algorithms: hard fractional frequency reuse (Hard FFR), soft
frequency reuse (SFR), partial frequency reuse (PFR) and soft fractional frequency
reuse (SFFR) in already existed LTE network of Addis Ababa using simulation
software. For this case study, sample sites around Gotera area of Addis Ababa are
randomly selected. All these static ICIC algorithms are compared using the
performance metrics such as peak throughput, the carrier to interference plus noise ratio
(CINR) of the data channel and coverage probability. Simulation results shows that
static ICIC schemes have better performance than reuse 1 scheme and from static ICIC
algorithms, PFR algorithm has better average throughput and coverage probability of
throughput.
Key words: Cell-edge user (CEU); Inter-cell Interference coordination (ICIC); Hard
fractional frequency reuse; Partial frequency reuse (PFR); Soft frequency reuse
(SFR); Soft fractional frequency reuse (SFFR).

v | P a g e
ACKNOWLEDGEMENTS
This thesis is by far the most important achievement in my educational career. Firstly,
I would like to express my gratitude and my sincere thanks to my advisor Dr.-Ing.
Dereje Hailemariam for his valuable suggestion and guidance for finalizing my thesis.
His comments boosted my work and motivated me to strive hard in my endeavor. It is
my honor to be student under his supervision and his wise guidance. Secondly, I am
very thankful to colleagues from Ethio telecom for providing me research materials and
comments for my thesis work. Finally, I would like to extend my gratitude to my family
and friends for supporting and encouraging me to finalize my thesis work.

vi | P a g e
Table of Contents
ABSTRACT .............................................................................................. iv
ACKNOWLEDGEMENTS ........................................................................ v
LIST OF FIGURES ................................................................................ viii
LIST OF TABLES .................................................................................. viii
LIST OF ABBRIVATIONS ...................................................................... ix
CHAPTER 1. INTRODUCTION ........................................................... 1
1.1 Background .......................................................................................................... 1
1.2 Statement of the Problem ..................................................................................... 2
1.3 Motivation ............................................................................................................ 3
1.4 Objectives ............................................................................................................. 4
1.4.1 General Objective .......................................................................................... 4
1.4.2 Specific Objectives ........................................................................................ 4
1.5 Methodology ........................................................................................................ 4
1.6 Related Work........................................................................................................ 5
1.7 Scope and Limitation ........................................................................................... 6
1.8 Thesis Outline ...................................................................................................... 7
CHAPTER 2. LTE SYSTEM OVERVEIW .......................................... 8
2.1 LTE Network Architecture................................................................................... 8
2.2 LTE Protocol Architecture ................................................................................. 10
2.3 LTE Communication Channels .......................................................................... 11
2.3.1 Logical Channels ......................................................................................... 12
2.3.2 Transport Channels ...................................................................................... 12
2.3.3 Physical Channels ........................................................................................ 13
2.4 LTE Frame Structure .......................................................................................... 13
2.5 OFDMA Technology ......................................................................................... 15
2.6 Frequency Reuse ................................................................................................ 17
CHAPTER 3. INTERFERENCE SCENARIOS AND MITIGATION
TECHNIQUES ......................................................................................... 18
3.1 Interference Scenario.......................................................................................... 18
3.2 Interference Coordination .................................................................................. 19
3.2.1 Hard Fractional Frequency Reuse ............................................................... 20
3.2.2 Partial Frequency Reuse (PFR) ................................................................... 21
vii | P a g e
3.2.3 Soft Frequency Reuse (SFR) ....................................................................... 22
3.2.4 Soft Fractional Frequency Reuse (SFFR) .................................................... 23
CHAPTER 4. SYSTEM MODEL ......................................................... 25
4.1 Propagation Path Loss (PL) Models................................................................... 25
4.1.1 Standard Propagation Model ....................................................................... 25
4.1.2 Stanford University Interim (SUI) Model ................................................... 25
4.1.3 Cost -231 Hata Model .................................................................................. 26
4.2 Antenna Model ................................................................................................... 26
4.3 Shadowing Models ............................................................................................. 26
4.4 Scheduling Types ............................................................................................... 27
4.4.1. Round Robin (RR) ...................................................................................... 27
4.4.2. Proportional Fair (PF) ................................................................................. 27
4.4.3. Best CQI ..................................................................................................... 27
CHAPER 5. SIMULATION ANALYSIS AND RESULTS ............... 28
5.1 Performance Analysis ........................................................................................ 28
5.2 Performance Metrics .......................................................................................... 29
5.2.1 PDSCH Carrier to Interference Plus Noise Ratio ........................................ 29
5.2.2 Peak RLC Throughput ................................................................................. 29
5.2.3 Coverage Probability ................................................................................... 30
5.3 Simulation Setup ................................................................................................ 30
5.4 Simulation Results.............................................................................................. 31
5.4.1 Simulation by CINR level ........................................................................... 32
5.4.2 Simulation by Throughput ........................................................................... 36
5.4.3 Simulation by Coverage Probability............................................................ 39
CHAPTER 6. CONCLUTION AND FUTURE WORK .................... 41
6.1 Conclusion .......................................................................................................... 41
6.2 Future Work ....................................................................................................... 42
References ................................................................................................. 43

viii | P a g e
LIST OF FIGURES
2.1: EPS network elements .......................................................................................... 10
2.2: E-UTRAN protocol stack for user plane .............................................................. 11
2.3: E-UTRAN protocol stack for control plane . ........................................................ 11
2.4: LTE frame structure .............................................................................................. 14
2.5: OFDMA sub-carrier in a single resource block………………………………... 16
2.6: Frequency reuse 1 scheme……………………………………………………….17
3.1: Inter-cell interference scenario in OFDMA system …………………………... ..18
3.2: Hard fractional frequency reuse ........................................................................... 21
3.3: Partial frequency reuse .......................................................................................... 22
3.4: Soft frequency reuse ............................................................................................. 23
3.5: Soft fractional frequency reuse ............................................................................. 24
5.1: Antenna location of eNodeBs (Gotera area) used in simulation (Atoll
snapshot……………....................................................................................................31
5.2: Coverage prediction vs PDSCH C/ (I+N) level of static ICIC schemes ………..35
5.3: Coverage prediction vs peak RLC channel throughput (DL) of different static
ICIC schemes ............................................................................................................... 38
5.4: Coverage probability vs PDSCH C/(I+N) threshold ............................................ 39
5.5: Coverage probability vs peak RLC channel throughput ....................................... 40
LIST OF TABLES
Table 2.1: Resource block configuration of different bandwidths………………….15
Table 5. 1: KPI of whole LTE network on day May 26 2015……………………... 28
Table 5. 2: Sample eNodeBs position in Gotera area used for simulation………….30
Table 5. 3: General network parameters of eNodeBs in Addis Ababa to be used for the
simulation…………………………………………………………………………... 32
Table 5.4: Resource block configuration for different static ICIC………………….32
Table 5.5: Average RLC throughput of the area under the study…………………...39

ix | P a g e
LIST OF ABBRIVATIONS
3GPP 3rd Generation Partnership Project
CCU Cell Center User
CEU Cell Edge User
CINR Carrier to Interference plus Noise Ratio
CQI Channel Quality Indication
eNodeB Evolved NodeB
EPC Evolved Packet Core
EPS Evolved Packet System
EUTRAN Evolved UTRAN
FFR Fractional Frequency Reuse
GSM Global System for Mobile Communication
HII High Interference Indicator
ICI Inter-cell Interference
ICIC Inter-cell Interference Coordination
LTE Long term evolution
MAC Medium Access Control
MME Mobility Management Entity
OFDMA Orthogonal Frequency Division Multiple Access
OFDM Orthogonal Frequency Division Multiplexing
OI Overload Indicator
PF Proportional Fair
PFR Partial Frequency Reuse
PDCCH Physical Downlink Control Channel
x | P a g e
PDCP Packet Data Convergence Protocol
PDSCH Physical Downlink Shared Channel
P-GW Packet Data Network Gateway
PLMN Public Land Mobile Network
PRB Physical Resource Block
PRS Performance Report System
QAM Quadrature Amplitude Modulation
QoS Quality of Service
QPSK Quadrature Phase Shift Keying
RLC Radio Link Control
RNC Radio Network Controller
RR Round Robin
RRC Radio Resource Connection
RNTP Relative Narrow Band Transmit Power
SFFR Soft Fractional Frequency Reuse
SFR Soft Frequency Reuse
S-GW Serving Gateway
SINR Signal to Interference Plus Noise Ratio
TDMA Time Division Multiple Access
UE User Equipment
UMTS Universal Mobile Telecommunication System
UTRAN Universal Terrestrial Radio Access Network
WCDMA Wideband Code Division Multiple Access
1 | P a g e
CHAPTER 1. INTRODUCTION
1.1 Background
In recent years, the demand for high data rate services is growing rapidly and this
demand has motivated 3GPP to develop a new standard called Long Term Evolution
(LTE). LTE is an all IP broadband internet system with voice and other services are
built to ensure 3GPP’s competitiveness over other cellular technologies. Therefore, in
LTE Release 8, the peak data rate of 100 Mbps in the downlink and 50Mbps in the
uplink with a radio network delay of less than 5 ms is achieved. Furthermore, LTE can
support different bandwidths such as 1.4MHz, 3MHz, 5MHz, 10MHz, 15MHz and
20MHz and has improved spectrum efficiency [1]. In addition, LTE uses Orthogonal
Frequency Division Multiple Access (OFDMA) as the downlink multiple access
technology and Single Carrier Frequency Division Multiple Access (SC-FDMA) for
uplink. Besides, LTE supports frequency division duplex (FDD) and time division
duplex (TDD) for simultaneous transmission [2]. Since the radio bandwidth is the
scarce resource in wireless communications, many operators use frequency reuse one
in their cellular networks. However, under this scenario, the system performance is
severely degraded due to interference caused by neighboring cells [3]. Intra-cell
interference and inter-cell interference are the two main categories of interference in
cellular network. Since the LTE downlink system uses the OFDMA technology, intra-
cell interference is not an issue because of the orthogonally among sub-carriers.
However, the inter-cell interference which is caused by using the same frequency
between the serving cell and the neighbor cell can reduce the LTE performance in terms
of throughput and spectral efficiency, particularly for cell-edge users (CEU) [4]. Here,
CEUs are user equipment in a cell which are far from the serving eNodeB while cell-
center users (CCUs) are user equipment close to the serving eNodeB. Hence, inter-cell
interference mitigation is a very important point to improve the performance of the LTE
system. In this thesis, a static inter-cell interference mitigation based on fractional
frequency reuse taking the case of LTE network of Addis Ababa is presented. Static
inter-cell interference coordination usually classified into three broad categories: hard
fractional frequency reuse, soft frequency reuse and partial frequency reuse [5]. In hard
fractional frequency reuse, the whole bandwidth can be divided into three equal and

2 | P a g e
orthogonal parts and is allocated to sectors so that adjacent sectors always use different
resources in the bandwidth. This scheme is also called frequency reuse of 3 in some
literatures. This clustering obviously leads to low inter-cell interference, with a cost of
large capacity loss due to the restrictions imposed on the resources, where only one
third of the resources are used in each sector. In soft frequency reuse, each cell transmits
in the whole frequency band. Nevertheless, the cell uses high power in some frequency
sub-bands while reduced power is used in the rest of the frequency band. In PFR, a
common frequency band is used for cell-center users with a frequency reuse of 1 and
with equal power and the remaining major bands is allocated edge users. Basically, the
operator decides the power allocation of these sub-bands. In PFR, users at cell-edge are
fully protected from cell-center users to avoid interference. So, the PFR scheme does
not use the whole available frequency bandwidth, hence has limited bandwidth usage.
Furthermore, although SFR can utilize the whole available bandwidth, it may lead to
lower throughput than PFR because of interference between edge and center users.
Thus, a variation of SFR which is SFFR scheme was proposed which has characteristics
of both PFR and SFR. In SFFR, the resources which are allocated to cell-edge users are
allowed to be used by the other cells center users with reduced power [6].
1.2 Statement of the Problem
In LTE Release 8, 100Mbps peak data rate is realized in downlink and 50Mbps is
realized in uplink. It is confirmed that using 20 MHz bandwidth, a peak data rate of 150
Mbps in downlink can be achieved with 2x2 MIMO and 300 Mbps can be achieved if
4x4 MIMO is used also in uplink 75 Mbps can be reached with single transmit antenna
in UE [7].
Ethio telecom has deployed LTE in Addis Ababa in 13 clusters. This deployment uses
the 20MHz bandwidth and all eNodeBs with in the cluster will reuse the physical
resource blocks of the 20MHz bandwidth. However, performance analysis shows that
the average downlink data rate is very much lower than the maximum possible capacity.
In other words, this implementation results in low system capacity and low throughput
of the cellular network because of high interference from the neighbor eNodeBs as well
as limits what a user can benefit from the LTE technology.
3 | P a g e
Since the current deployment of LTE of Addis Ababa uses reuse 1 technique, with
increasing number of LTE subscribers there will be high probability of sharing the same
resource blocks between cell-edge users in the serving cells and the neighbor cells. This
condition results in slower data rate for services like video conferencing, video
streaming especially for users at cell-edge areas because of degraded CINR. Thus, to
improve the network performance we have to ensure that resource blocks are not shared
between the cell-edge users of the serving cell and neighbor cells.
Thus, this thesis intends to indicate the benefits of using inter-cell interference
mitigation techniques on LTE network of Addis Ababa.
1.3 Motivation
Because of its high data rate, LTE deployment gives us many benefits for the growth
of data traffic. Also, OFDMA-based networks are suitable for practical deployment
because of efficient usage of frequency resources. However, there are technical
challenges on many operators LTE deployment such as low system performance. Ethio
telecom is one of the operators that also have technical challenges in its LTE
deployment. Reduced average downlink throughput is one of the challenges that
persists on the currently deployed LTE network of Addis Ababa. Although there are
many factors for this very low data rate, inter-cell interference plays significant role not
to achieve high data rate and reduces user satisfaction. Consequently, mitigating inter
cell interference will be one of the solutions for improving the system performance.
4 | P a g e
1.4 Objectives
1.4.1 General Objective
Ethio telecom has deployed LTE in Addis Ababa recently. However, this deployment
has reduced downlink data rate. The main aim of this thesis is to investigate the
downlink throughput of LTE network deployed in Addis Ababa and propose inter-cell
interference mitigation method to enhance the network capacity and improves the
downlink throughput.
1.4.2 Specific Objectives
The specific objectives of this thesis are to:
Evaluate the system performance of currently deployed LTE network using
performance metrics such as downlink throughput.
Understand different inter-cell interference mitigation techniques in LTE
networks.
Compare the CINR and throughput of LTE network for no ICIC and static
ICIC algorithms.
Recommend which static ICIC method is better to implement in Addis Ababa
LTE deployment scenario.
1.5 Methodology
Methodologies to be used in order to achieve the objectives of this research are:
Literature review: includes reading books, journals, thesis and white papers
about interference scenario and inter-cell interference coordination in LTE and
how the static inter-cell interference algorithms such as hard fractional
frequency reuse, soft frequency reuse and partial frequency reuse work.
Data Collection: involves collecting the real network data of sample eNodeBs
from Ethio telecom network management system. It includes global data such
as duplex types and operating band and specific parameters such as cell
parameters, transmitter parameters and antenna parameters.
Simulation Setup: involves importing the digital map of Addis Ababa into
Atoll software, its clutter class and clutter height. Then, configuration of the
network parameters and static ICIC schemes on the selected sample 7 eNodeBs
5 | P a g e
are performed. Besides, resource blocks are configured for different sectors
based on different static ICIC algorithms.
Simulation and interpretation of the result: involves the simulation of the
static ICIC algorithms in sample eNodeBs of Addis Ababa using peak RLC
throughput, peak CINR and coverage probability. We will use Matlab for
comparison of coverage probability between different ICIC algorithms. Then,
the results are analyzed using those performance metrics.
1.6 Related Work
A. Daeinabi, K. Sandrasegaran and X.Zhu [8] proposed a joint resource block and
transmit power allocation scheme in LTE downlink networks. In this paper, they tried
to implement the idea first by calculating the priority of the user using QoS and
interference level to schedule users into specified sub-bands in each cell. Then,
eNodeBs dynamically control the transmit power using fuzzy logic system and by the
exchange of interference information. Also in this paper, non-inter-cell coordination
and inter-cell coordination schemes is surveyed. However, they had given the
simulation of cell throughput and interference level only for reuse 1 and SFR schemes
in which the SFR scheme outperforms the reuse 1 scheme.
Dai Kimura and Hiroyuki Seki [9] suggested the ICIC standardization and interference
coordination method using user distribution in which LTE eNodeB automatically
optimizes the cell-edge band by using received power distribution of user. In their
simulations, they have evaluated the cell-edge performance by using only frequency
reuse factor of 3 and 4 for cell-edge users without considering other static ICIC
methods.
Chandra Thapa and Chandrasekhar.C [10] presented comparative evaluation on FFR
and traditional frequency reuse system in LTE downlink. In their paper, they proposed
FFR for interference management. They have evaluated the performance by creating a
simulation environment of 15 eNodeBs without assuming real time scenario. In their
simulation, they showed that FFR scheme have better performance than traditional
frequency reuse scheme by using only two metrics i.e coverage probability and
probability of acceptance.
6 | P a g e
Abdelbaset S. Hamza et.al [11] presented a survey on inter-cell interference
coordination techniques in OFDMA-based cellular networks. This paper reviews the
various ICIC avoidance schemes in the downlink of OFDMA-based cellular networks.
In particular, the paper introduces new parameterized classifications of ICIC avoidance
and uses these classifications to review and categories different static (frequency reuse-
based) and dynamic (cell coordination-based) ICIC schemes. However, simulation
results are not included in his paper.
Zhang [12] proposed a classification for interference avoidance schemes with four
categorizes that are static schemes, low level dynamic schemes, intermediate level
dynamic scheme and high level dynamic scheme. A scheme is categorized to one of
these four categories based on the flexibility to adjust to network environments. In his
paper, Zhang only introduced the static interference avoidance schemes without
providing the performance analysis.
Katzela et al. [13] surveyed the different channel allocation schemes and different
channel reuse schemes without giving much emphasis on the problem of ICI. Katzela
et al. divides the channel allocation schemes into the following three categories: fixed
channel allocation, dynamic channel allocation and hybrid channel allocation.
However, the methods discussed in the survey were evaluated on multi-cell traditional
cellular networks like GSM but not on OFDMA systems such as LTE or LTE-Adv
which make the methods doubtful to perform on these systems.
1.7 Scope and Limitation
This thesis addresses the importance of inter-cell interference mitigation for improving
average downlink throughput of LTE deployment of Addis Ababa. It gives insight of
different static inter-cell interference mitigation techniques of LTE network. The results
are based on Atoll simulation software using the real LTE network data of Addis Ababa.
In addition, due to the constraints of Atoll simulation software not having other static
ICIC schemes, only four of them are evaluated in this thesis. Also, since Atoll will take
more time for calculation of coverage predictions, only seven eNodeBs are used for the
purpose of simulation.
7 | P a g e
1.8 Thesis Outline
The rest of the thesis is organized as follows:
Chapter 2 gives the LTE system overview. In this chapter, the architecture of
LTE, the LTE frame structure, LTE protocol structure, LTE communication
channels, OFDMA technology and frequency reuse are overviewed.
Chapter 3 describes about the interference scenario and mitigation techniques.
Particularly, the static ICIC such as hard fractional frequency reuse (reuse 3),
soft frequency reuse, partial frequency reuse and soft fractional frequency reuse
is described in detail.
Chapter 4 provides the system model used in this thesis with the focus of
propagation path loss models, antenna models, shadowing models and types of
schedulers.
In Chapter 5, the performance analysis, the performance metrics and system
simulation is described in details. The simulation setup and simulation
parameters are also described here. In addition, simulation results are discussed
in details. Besides, the performance comparison of throughput and CINR of the
static ICIC algorithms are presented.
Finally, the conclusions are drawn in Chapter 6. In addition, future work is
presented in this thesis work in order to continue the research in this area.

8 | P a g e
CHAPTER 2. LTE SYSTEM OVERVEIW
Before discussing the interference scenarios and mitigation techniques of LTE
deployment of Addis Ababa, the fundamental concept of LTE network with particular
focuses on network architecture, protocol architecture, communication channel, frame
structure, frequency reuse and OFDMA technology will be firstly overviewed in this
chapter.
2.1 LTE Network Architecture
The LTE network architecture consists of four domains. These are user equipment
(UE), evolved UTRAN (E-UTRAN), Evolved Packet Core Network (EPC) and Service
domain. UE, E-UTRAN and EPC form Internet Protocol (IP) Connectivity Layer.
These domains are also called as Evolved Packet System (EPS) [14].
USER EQUIPMENT (UE). User equipment (UE) is the device that is used for voice or
data communication. The device could be a handheld device or a wireless data card or
a modem. Each user is provided with Universal Subscriber Identity Module (USIM).
USIM identifies one UE from other UEs and holds the authentication and security keys
[15].
E-UTRAN NodeB (eNodeB). eNodeB is a base station that controls and manages all
radio related functions of the EPS. All of the radio protocols from UE terminate at
eNodeB. As a terminating node for the radio protocols, it sets Radio Resource
Connection (RRC) and performs radio resource allocations to the users with QoS based
prioritization. In addition, eNodeB is used for mobility management, encryption and
decryption of user plane and control plane data and IP header compression and
decompression of user plane data. Comparing with UTRAN, eNodeB has the functions
of both NodeB and the Radio Network Controller (RNC). This function of eNodeB
simplifies the network structure and reduces the latency in the network. The eNodeBs
are connected to their neighboring eNodeBs with X2 interface which is used for
handover and dynamic interference management [15].

9 | P a g e
Mobile Management Entity (MME). MME is a control plane element in EPC and is
connected to eNodeBs with S1 interface and Home Subscription Server (HSS) via S6a
interface as it is shown in Fig 2.1. MME performs user authentication and security
related functions in the network with the help of HSS. MME also involves in the intra-
system handover [16].
Serving Gateway (S-GW). It is a user plane element and is connected to eNodeB through
S1 interface and has an important role in inter-frequency handover. During the
handover, the MME commands the S-GW to switch data tunnel from current eNodeB
to the target eNodeB. It is also used as a relay for data transmission between the serving
eNodeB and P-GW. When the UE goes to IDLE mode from the CONNECTED mode
while receiving the data packets from the P-GW for a data path, S-GW holds the data
packet in buffer. In the meantime, it also requests MME to page the particular IDLE
UE. Once the UE resumes to the CONNECTED mode, the buffered packets are
delivered and S-GW starts to relay the data from P-GW. In addition, during handover,
it performs the indirect forwarding of the downlink data, when direct inter-eNodeB
connection is not available. It also acts as a tapping point for monitoring and security
related issues. Moreover, the packet flow through S-GW can also be used for charging
purposes [16].
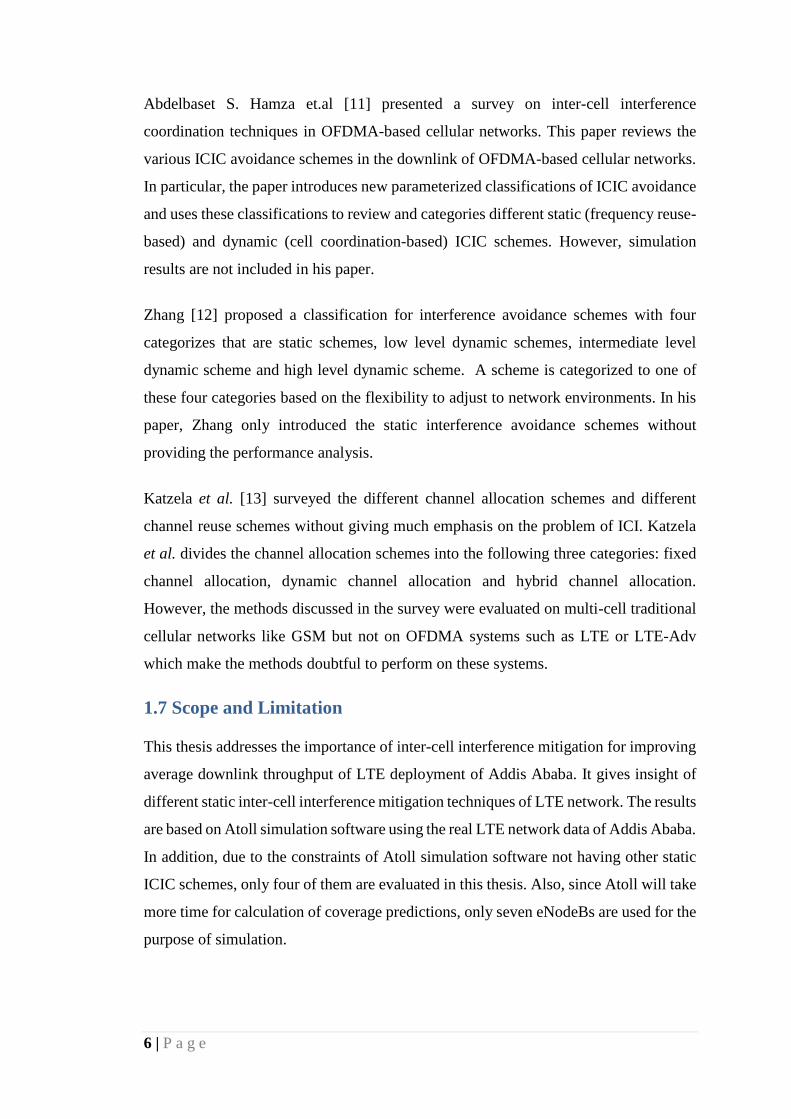
Packet Data Network Gateway (P-GW). P-GW is the element of EPS that connects the
EPS to the external data network. It can be considered as a router that connects EPS to
external network. It allocates IP addresses to the UE attached to the EPS using the
Dynamic Host Control Protocol (DHCP). In addition, P-GW interacts with the PCRF
for appropriate policy control information. It also used as a bearer when the UE
switches from one S-GW to another. Similar to S-GW, the P-GW can also be used for
monitoring and charging purposes [17].
10 | P a g e
Fig 2.1: EPS network elements [18]
2.2 LTE Protocol Architecture
The radio interface protocols are needed to set up, reconfigure and release the radio
bearer services which are used for communication between UE and network and
maintain end to end connection. The protocol layers are physical layer (Layer 1), the
data link layer (Layer 2) and the network layer (Layer 3). For control plane, Layer 2
contains Media Access Control (MAC) protocol, Radio Link Control (RLC) protocol
and Packet Data Convergence Protocol (PDCP) and Layer 3 consists of one protocol
called Radio Resource Control (RRC) which belongs to only to control plane [17].
Radio Resource Control (RRC). Radio Resource Control (RRC) messages comprise the
major part of control signaling between UE and network core. RRC messages carry all
parameters required to set up, modify and release Layer 2 and Layer 1 protocol entities
(MAC, RLC and PDCP). In addition, RRC control all procedures related to
establishment and release of connection including paging and configuration
measurements and reporting for handovers [19].
Packet Data Convergence Control (PDCP). The PDCP layer is used for header
compression and decompression for user plane data, ciphering and deciphering for user
and control plane PDUs and reordering it in handover [20].
11 | P a g e
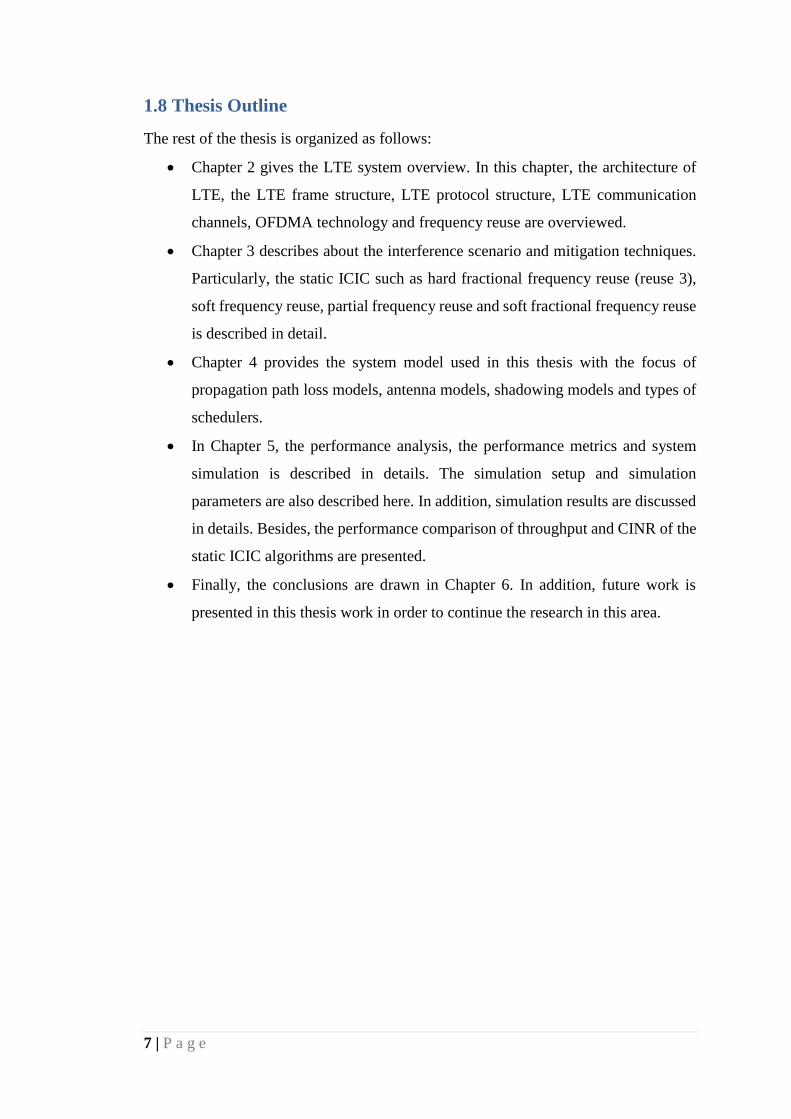
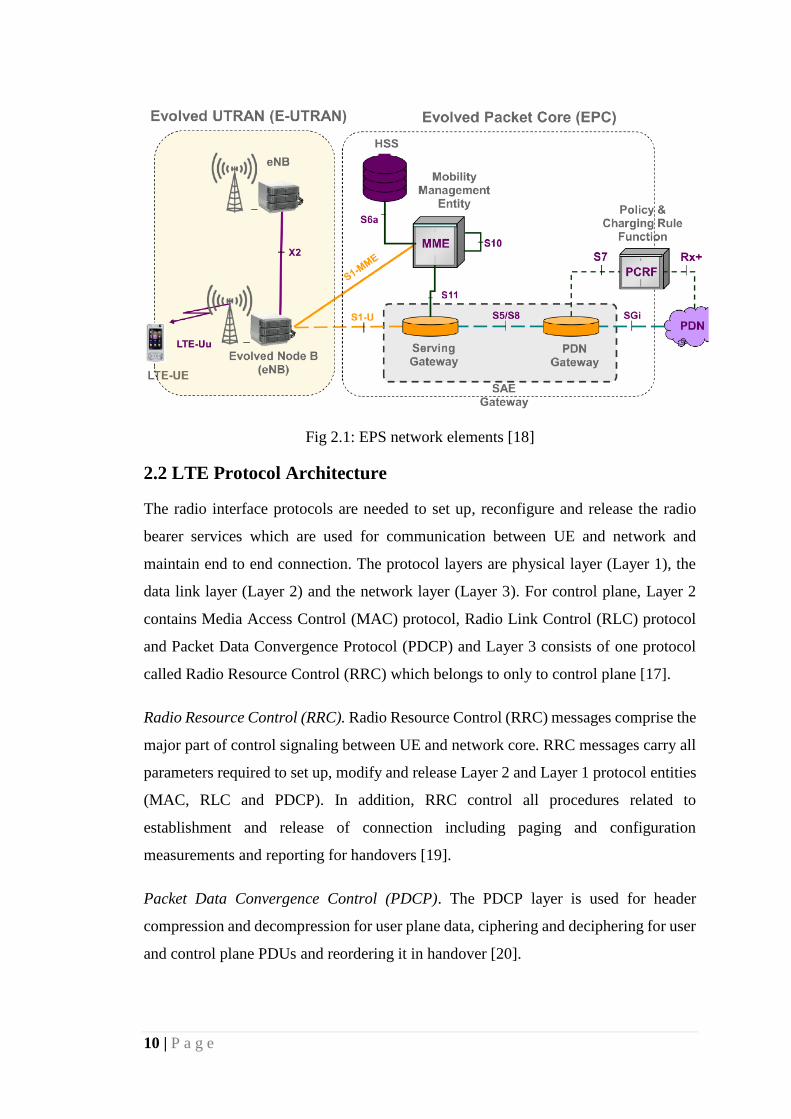
Radio Link Control (RLC). The RLC layer reformats PDCP PDU in order to fit MAC
layer size. Thus, RLC segments and/or concatenates the PDCP PDUs and then
reassembles the RLC PDUs to reconstruct PDCP PDUs [21].
Medium Access Layer (MAC). The Mac Layer maps logical channels and transport
channels and selects appropriate transport format for each transport channel depending
on the instantaneous data rate. It is also used for multiplexing and demultiplexing of
RLC Payload Data Units (PDUs) [21].
Fig 2.2: E-UTRAN protocol stack for user plane [22]
Fig 2.3: E-UTRAN protocol stack for control plane [22]
2.3 LTE Communication Channels
LTE uses several different types of logical, transport and physical channel which are
identified by the kind of information they carry and by the way in which the
information is processed.

12 | P a g e
2.3.1 Logical Channels
The logical channels are control channels which are located between MAC and RLC
layers. These are:
Paging Control Channel (PCCH). It is a downlink control channel that is used for
paging information when the network does not know the location of the UE [23].
Broadcast Control Channel (BCCH). It is a downlink Control channel for providing
system control information all UE connected to the eNodeB [23].
Common Control Channel (CCCH). It is an uplink channel for transmitting control
information between UEs and system which is used for random access information such
as setting up a connection [23].
Dedicated Control Channel (DCCH). It is a dedicated point-to-point bi-directional
control channel that transmits user-specific control information between a UE and the
network [23].
2.3.2 Transport Channels
The transport channels are located between mac and physical layer to carry data and
signaling messages. These channels are:
Paging Channel (PCH). It is a downlink channel used to carry PCCH. PCCH is used
for discontinuous reception and for saving power of UE. It is broadcasted in the entire
cell coverage area [23].
Broadcast Channel (BCH). It is a downlink channel with fixed and pre-defined
transport format that is broadcasted with in the entire cellular coverage area and is
mapped to BCCH [24].
Downlink Shared Channel (DL-SCH). It is a downlink channel that supports Hybrid
ARQ (Automatic Repeat Request) and dynamic link adaptation by changing the
modulation, coding and transmit power. It also supports both dynamic and semi-static
resource allocation and discontinuous reception of UE [24].
13 | P a g e
2.3.3 Physical Channels
Data and signaling messages are carried on physical channels between the different
levels of the physical layer. Basically they are divided into physical data channels and
control channels.
Physical control format indicator channel (PCFICH). PCFICH informs the UE about
the format of the signal being received. It indicates the number of OFDM symbols used
for the PDCCHs. The information within the PCFICH is also used to inform UEs about
the size of the control region [24].
Physical downlink shared channel (PDSCH). PDSCH is the main data carrying channel
which is dynamically assigned to users. These channel use QPSK, 16QAM, 64QAM as
modulation types [25].
Physical downlink control channel (PDCCH). The main purpose of this physical
channel is to carry mainly scheduling information such as downlink resource
scheduling, uplink power control instructions and uplink resource grant indication for
paging or system information [25].
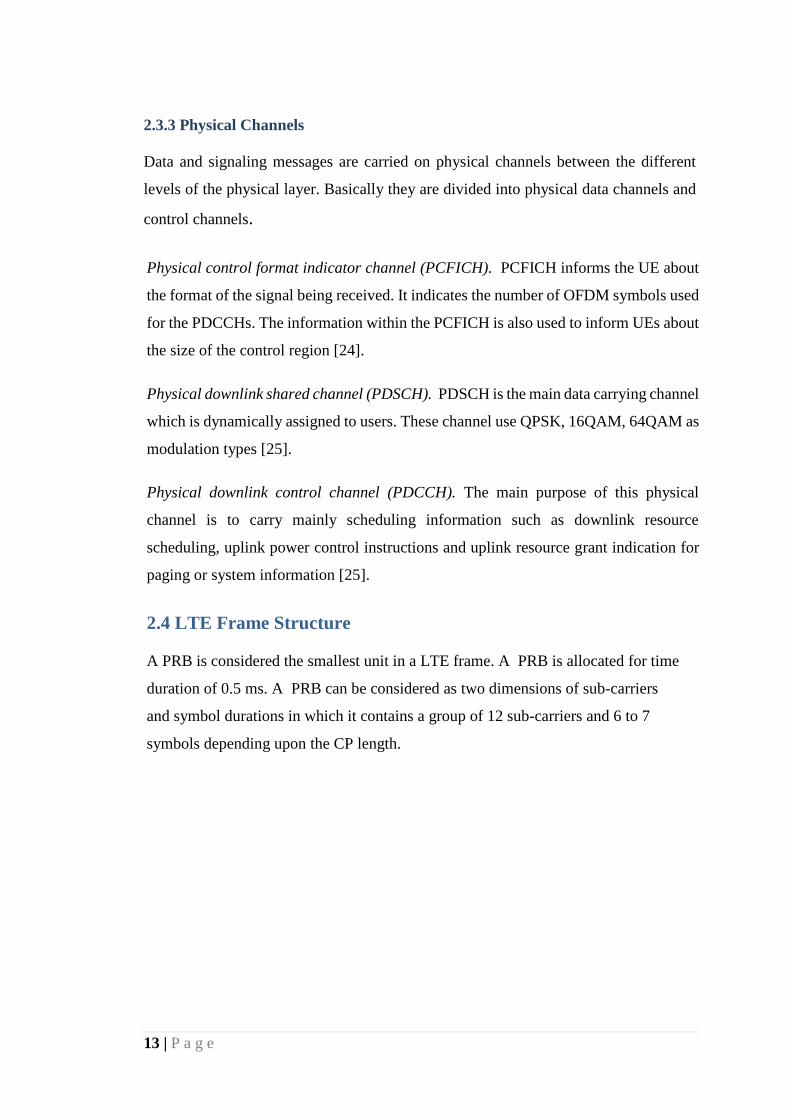
2.4 LTE Frame Structure
A PRB is considered the smallest unit in a LTE frame. A PRB is allocated for time
duration of 0.5 ms. A PRB can be considered as two dimensions of sub-carriers
and symbol durations in which it contains a group of 12 sub-carriers and 6 to 7
symbols depending upon the CP length.
14 | P a g e
Fig 2.4: LTE frame structure [38]
In LTE frame structure, one PRB is called slot. Two slots make a sub-frame with
duration of 1 ms. An LTE frame contains 20 slots which is 10 ms long. The frame
structure is same for the downlink (OFDMA) and the uplink (SC-FDMA). The
reference symbols are placed with specific pattern in the PRBs for the efficient channel
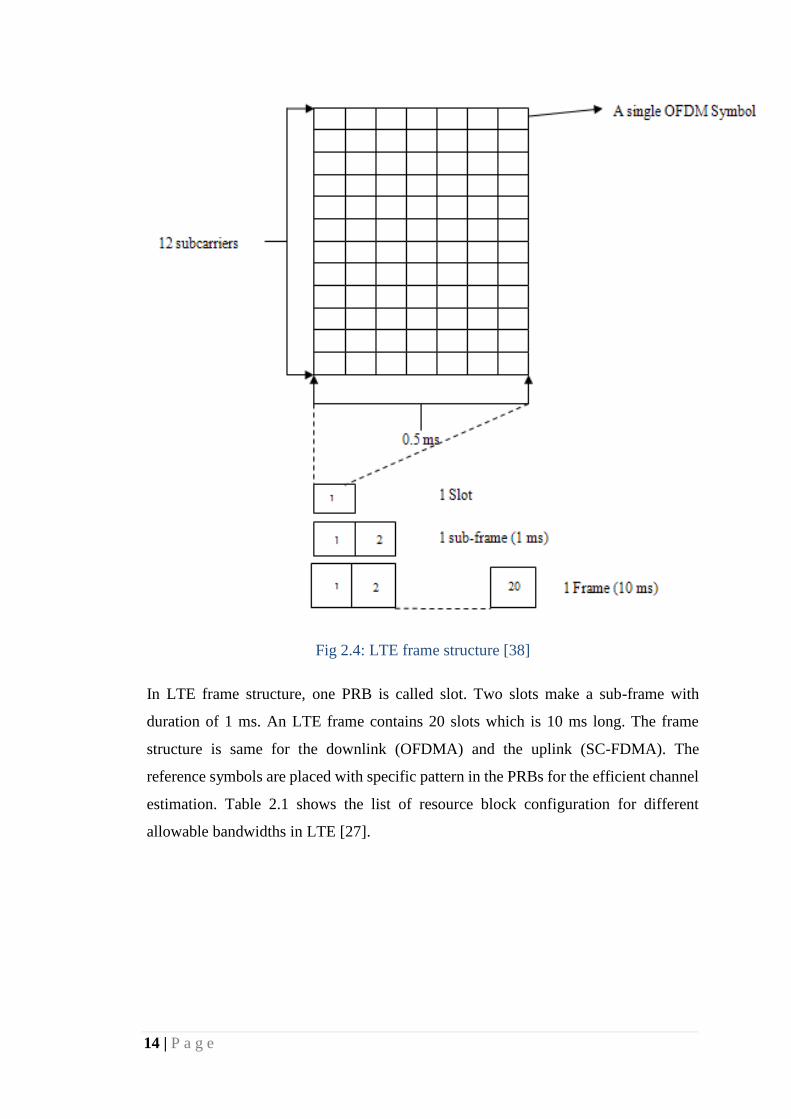
estimation. Table 2.1 shows the list of resource block configuration for different
allowable bandwidths in LTE [27].
15 | P a g e
Bandwidth 1.4MHz 3MHz 5MHz 10MHz 15MHz 20MHz
Sub-carriers 72 180 300 600 900 1200
Sampling
Rate(MHz)
1.92 3.84 7.68 15.36 23.04 30.72
Samples per Slot 960 1920 3840 7680 11520 15360
Resource blocks 6 15 25 50 75 100
Table 2.1: Resource block configuration of different bandwidths [28]
2.5 OFDMA Technology
GSM technology uses the TDMA with frequency division multiplexing as multiple
access whereas UMTS uses WCDMA as the multiple access technique. These
technologies have their own advantages and disadvantages. Most of multiple access
methods in the legacy network technologies have limitation on capacity (coverage) and
throughput of the system. OFDMA technology is brought in due to necessity to modify
the multiple access technology with 3GPP LTE specification requirements [29].
In frequency division multiplexing, users are separated from one another spectrally with
each signal modulated onto a different carrier frequency using separate frequency
channels and channel bandwidth being equal to the transmission bandwidth. Multiple
frequency channels are arranged serially in simpler form of FDMA Organization. To
prevent adjacent channel interference, the channels are separated by guard bands which
are unused portions of the spectrum and ultimately increase the frequency range of the
system and reduce the spectral efficiency [29].
16 | P a g e
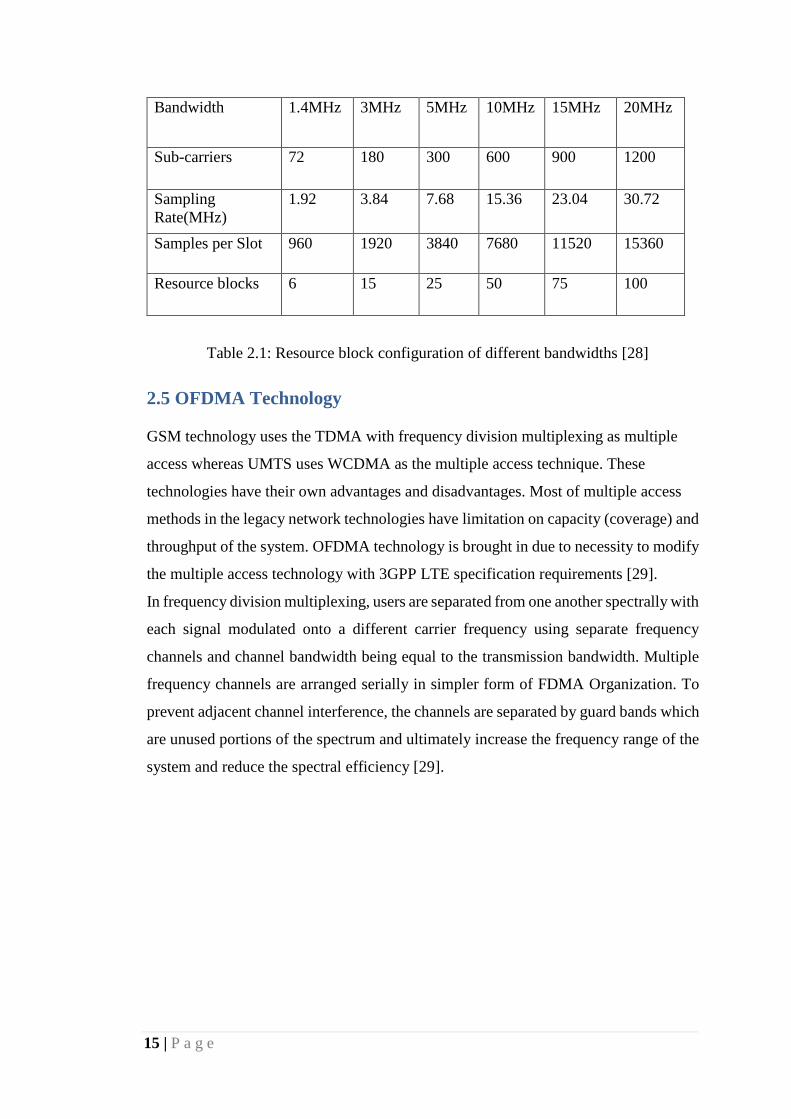
Fig 2.5: OFDMA sub-carrier in a single resource block [30]
The basic idea here is that OFDMA divides spectrum into large number of tightly
packed narrowband sub-carriers. Figure 2.5 shows the orthogonal sub-carriers placed
together overlapping each other in such way that the interference experienced in each
sub-carrier due to the neighboring sub-carriers during the sampling is minimum. The
sub-carrier spacing in the above figure is 15 kHz i.e. the spacing between the peaks of
each sub-carrier and is the best found tradeoff at which sub-carrier interference is
reduced. At the peak of each sub-carrier, all other sub-carriers have amplitude zero to
avoid sub-carrier interference. For example, in LTE 20MHz, there are 1200 sub-
carriers. Inter symbol interference is caused by multipath propagations which causes
long channel delay spread. This causes the bits to interfere to each other and degrade
the received signal. To prevent this, a Cyclic Prefix (CP) is added to the symbol which
is a copy of the tail of the same symbol added at the start of the symbol. CP is a guard
interval which separates the symbols in time domain to neutralize the delay spread
caused by the multipath. This is because, with the use of guard interval, the receiver
filter has to consider the delay added to the delay spread. Again, with the use of CP, the
data stream becomes continuous and shortens the receiver filter delay. Based on their
duration, there are two types of CP used; Extended CP with a duration of 16.67 μs
which is used in large cells where there is long delay spread and Normal CP with a
17 | P a g e
duration of 5.2 μs for the first symbol and 4.67 μs for the other symbols. The main
advantages that make OFDMA a better choice for radio access such as LTE are:
Better tolerance against frequency selective fading without the need of
complex equalization filter due to the use of multiple sub-carriers;
Link adaptation and frequency domain scheduling ;
Simpler receiver architecture based on Digital Signal Processing (DSP)
[30].
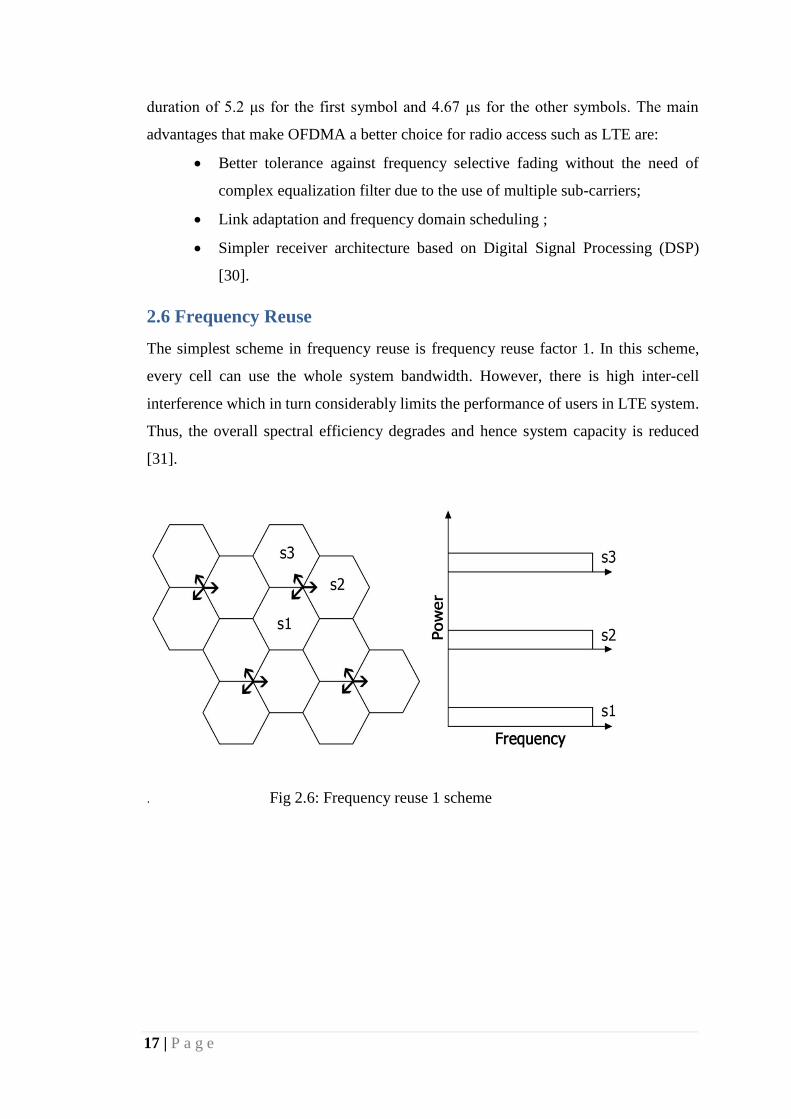
2.6 Frequency Reuse
The simplest scheme in frequency reuse is frequency reuse factor 1. In this scheme,
every cell can use the whole system bandwidth. However, there is high inter-cell
interference which in turn considerably limits the performance of users in LTE system.
Thus, the overall spectral efficiency degrades and hence system capacity is reduced
[31].
. Fig 2.6: Frequency reuse 1 scheme
18 | P a g e
CHAPTER 3. INTERFERENCE SCENARIOS AND
MITIGATION TECHNIQUES
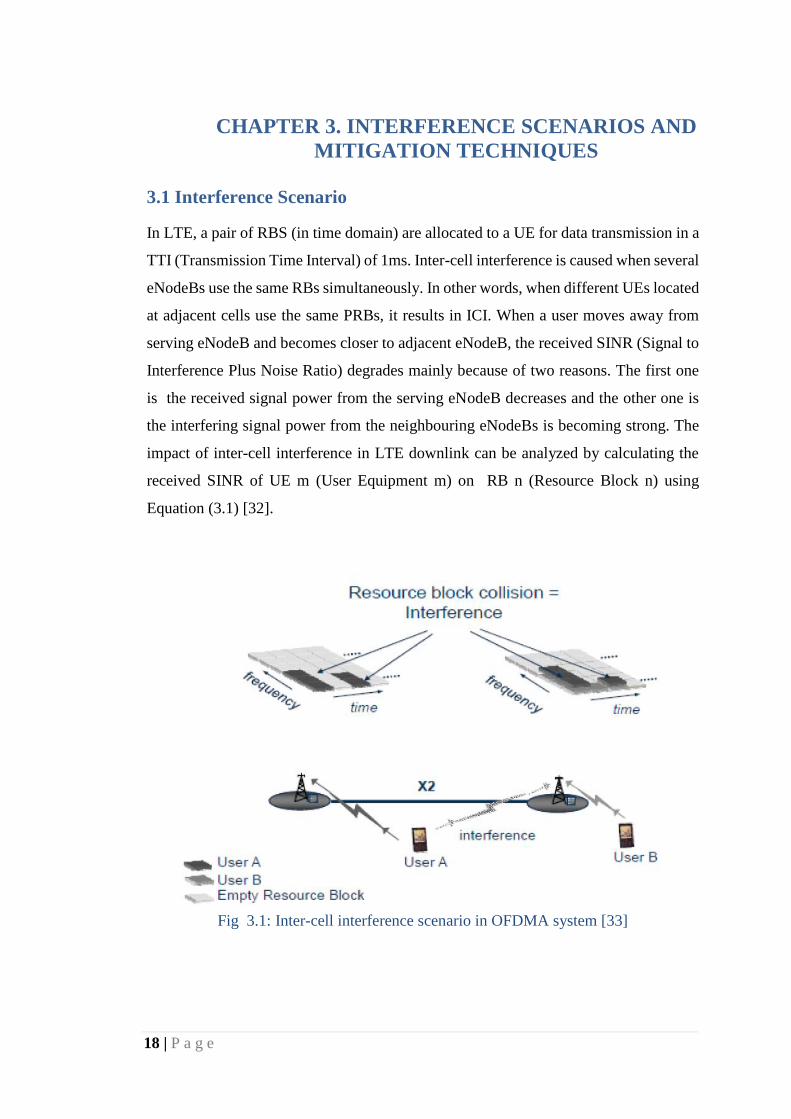
3.1 Interference Scenario
In LTE, a pair of RBS (in time domain) are allocated to a UE for data transmission in a
TTI (Transmission Time Interval) of 1ms. Inter-cell interference is caused when several
eNodeBs use the same RBs simultaneously. In other words, when different UEs located
at adjacent cells use the same PRBs, it results in ICI. When a user moves away from
serving eNodeB and becomes closer to adjacent eNodeB, the received SINR (Signal to
Interference Plus Noise Ratio) degrades mainly because of two reasons. The first one
is the received signal power from the serving eNodeB decreases and the other one is
the interfering signal power from the neighbouring eNodeBs is becoming strong. The
impact of inter-cell interference in LTE downlink can be analyzed by calculating the
received SINR of UE m (User Equipment m) on RB n (Resource Block n) using
Equation (3.1) [32].
Fig 3.1: Inter-cell interference scenario in OFDMA system [33]

19 | P a g e
𝑆𝐼𝑁𝑅𝑚,𝑛 =𝑃𝑛
𝑆𝐺𝑚,𝑛𝑆
∑ 𝑃𝑛𝑘
𝐾≠𝑆 𝐺𝑚.𝑛𝑘 𝛿𝑛
𝑘 +𝑃𝑁…………………………..(3.1)
Where, 𝑃𝑛𝑆 is the received signal power of serving cell S on RB n, 𝐺𝑚,𝑛
𝑆 is the channel
gain from serving cell S on user equipment m using resource block n, 𝐺𝑚,𝑛𝑘 is the
channel gain from neighbor cell K on user equipment m using resource block n, 𝑃𝑁 is
the noise power and 𝛿𝑛𝑘 is an indicator which is set to 1 or 0 to specify the neighboring
cell k allocates RB n to UE m or not.
From Equation 3.1, it can be seen that there are three main factors named channel gain,
transmit power and RB allocation scheme that affect the value of SINR of UE. In other
words, the value of SINR can be decreased in three situations such as when UE moves
far away from serving eNodeB which in turn decreases channel gain, when transmit
power of neighboring eNodeB on a RB increases there by increase in interference and
when the neighboring eNodeB assign the same RB to their UEs with the serving cell.
Thus, the SINR of cell-center users (CCU) located nearer to their serving eNodeB are
better as compared with users located at cell-edges.
3.2 Interference Coordination
Inter-cell interference coordination is a method of improving the signal quality at cell
edges by using different resource blocks at cell-edge of potentially interfering cells.
Power and frequency allocation strategies can be used for cell-center and cell-edge
users to mitigate ICI. Though an increase in transmit power can improve the signal to
interference and noise ratio, it may considerably increase the overall interference of the
system. Therefore, for cell-edge user equipment, increasing transmit power may
decrease the overall performance of the network. There are two main categories of
inter-cell interference coordination techniques used in OFDMA systems: static and
dynamic inter-cell interference coordination. In many ICI mitigation techniques,
frequency reuse technique is taken as the main idea. Static interference coordination is
implemented by using fractional frequency reuse techniques. Fractions of a channel are
allocated to different sectors at cell-edges. This channel allocation does not change over
time. On the other hand, in dynamic interference coordination or interference-aware
scheduling, there is no fixed frequency allocation for each sector. Resources which are
20 | P a g e
allocated to cell-edge users are determined by the schedulers based on network
conditions dynamically. Dynamic ICIC is implemented by exchange of X2 messages,
which carries interference information, with neighbor eNodeB after each ICIC periods.
X2 interface is an interface between two neighbor eNodeBs. Then, the eNodeBs can
learn the interference status of their neighbors from the messages and allocate radio
resources such as frequency and transmission power to their UEs in such a way that
would avoid inter-cell interference. These X2 messages are Relative Narrowband Tx
Power (RNTP), High-Interference Indicator (HII) and Overload Indicator (OI) [34].
RNTP. Indicates resource blocks (RBs) that will have high transmission power for DL
during the next ICIC time period. During the current ICIC period, power strength of
each RB is measured and shown in bits i.e. 0 for low and 1 for high [35].
HII. Similar to RNTP, it also shows resource blocks (RBs) that will have high
transmission power during the next ICIC time period. But, it is used for UL direction.
To avoid interference with neighbor cells, UEs at cell-edge use RBs with high power.
The power strength of each RB is measured and indicated by bits i.e. 0 for low and 1
for high [35].
OI. Indicates resource blocks (RBs) that had interference during the last ICIC period.
The interference measured in each RB are marked as Low, Medium or High. RNTP
and HII are information about interference to be caused by a cell to its neighbor cell.
However, OI is information about interference that has already been caused by the
neighbor cell [35].
3.2.1 Hard Fractional Frequency Reuse
In hard FFR, all the power is used on some resource blocks, while other resource blocks
are not transmitted at all. In hard FFR scheme, the whole frequency band can be divided
into three equal, orthogonal sub-bands, allocated to sectors so that adjacent sectors
always use different frequency sub-bands. This setup is called reuse of 3 scheme or
hard FFR scheme. However, due to only one third of frequency resources are used in
each sector, it has reduced capacity [36].

21 | P a g e
Fig 3.2: Hard fractional frequency reuse [37]
3.2.2 Partial Frequency Reuse (PFR)
There are different methods of improving cell-edge performance. One of the method is
using different frequency reuse factor for cell-edge and cell-center users. For example,
a FRF greater than one for the cell-edge regions and a FRF of one for the cell-center
regions. In partial frequency reuse (PFR), some frequency resources are not used in
some users at all. In this scheme (shown in Fig 3.3), total bandwidth is divided into four
sub-bands. Cell-center UEs are allocated the frequency band using reuse factor of 1.
Cell-edge UEs are allocated the remaining frequency bands using reuse factor of 3.
This scheme is also called FFR with full isolation as the cell-edge users cannot use the
frequency band of cell-center users. This strategy highly reduces interference between
cell-center and cell-edge uses at the expense of bandwidth usage [38].

22 | P a g e
Fig 3.3: Partial frequency reuse [39]
3.2.3 Soft Frequency Reuse (SFR)
Since in PFR scheme cell-edge users does not share resources with center-users, it
results in under utilization of available frequency resources. Therefore, soft frequency
reuse (SFR) was proposed to compromise the available bandwidth between hard
fractional frequency reuse and the PFR schemes. It avoids the high ICI associated with
the unity FRF configurations, while providing more flexibility to the PFR scheme. SFR
is implemented by adjusting and dividing the power between the frequencies used in
the center and edge bands [40].
In SFR, a frequency reuse factor of 1 is used for the central users of a cell, while
frequency reuse factor greater than 1 is used for cell-edge user. Unlike the PFR scheme,
however, the frequency and transmission power used in SFR for cell-center and cell-
edge users do not change. For example, in a 3-sector cell sites shown in Figure 3.4, the
cell-edge band (major band) uses one third of the available resource which is orthogonal
to those in the neighboring cells and form reuse factor of 3. The cell-center band (minor
band) in any sector consists of the frequencies used in the cell-edge band of adjacent
sectors. In other words, the minor band is allocated for center users only, but the major
band can be used in the cell-center as well if it is not used by the cell-edge UE, resulting
in a frequency reuse factor of 1 for cell-center user (Fig 3.4). Both major and minor
band is assigned transmission power such that the power of major band group is higher
than the power of the minor band while keeping the total transmission power fixed as
23 | P a g e
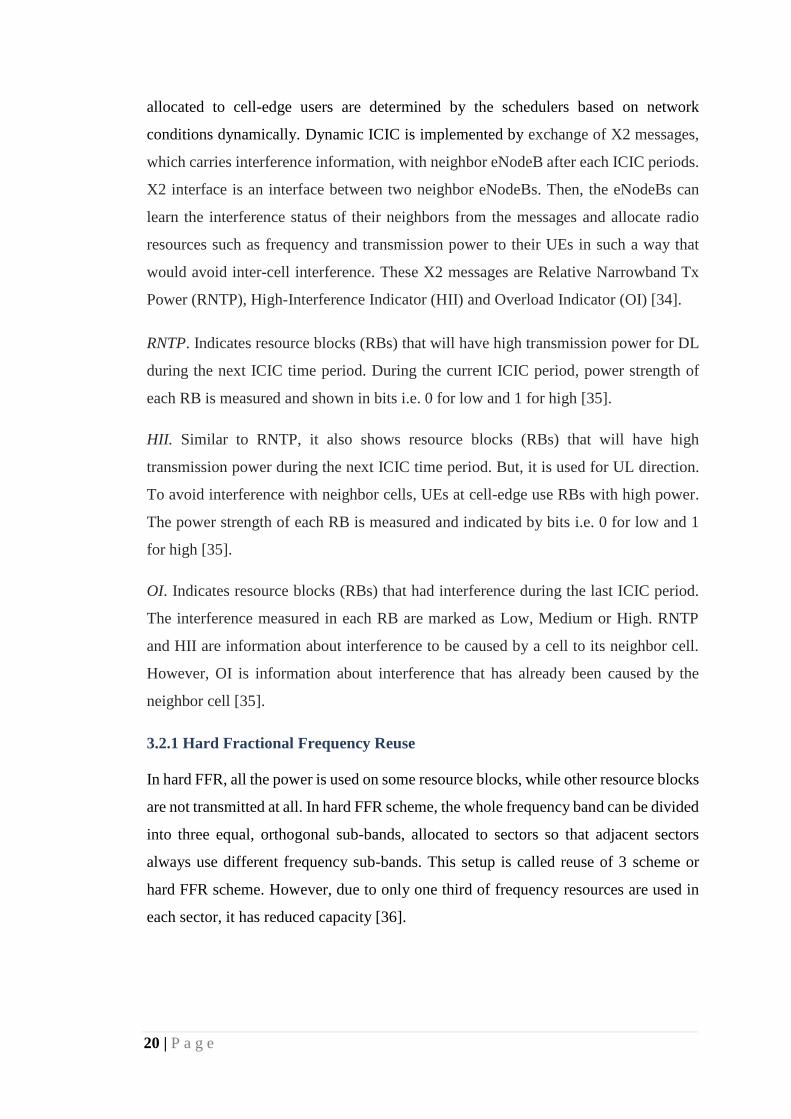
shown in Fig 3.4. Consequently, a less ICI at the cell-edge is achieved at the expense
of spectrum utilization [41].
Fig 3.4: Soft frequency reuse [42]
3.2.4 Soft Fractional Frequency Reuse (SFFR)
The static PFR and SFR algorithms can improve the throughput of cell-edge users by
minimizing the ICI occurring in users in that region. The static PFR algorithm does not
use the whole available frequency bandwidth and may leads to reduced spectrum
efficiency. Moreover, although SFR can use the whole bandwidth available in the cell,
and therefore have better spectrum efficiency compared to that of the PFR algorithm;
however, the overall cell throughput of SFR scheme may be lower than that of PFR.
Unlike PFR scheme, SFFR uses the sub-bands allocated to the outer region in the
adjacent cells. It uses these sub-bands for center-users but with low power levels as
shown in Fig 3.5. Therefore, SFFR is similar to SFR in that they both use high power
levels for some sub-bands and low power levels for other sub-bands. However, the
SFFR uses the common sub-band to increase the throughput of center users [43].

24 | P a g e
Fig 3.5: Soft fractional frequency reuse [44]

25 | P a g e
CHAPTER 4. SYSTEM MODEL
4.1 Propagation Path Loss (PL) Models
Propagation path loss (PL) models are the reference formulas used to describe the
propagation loss encountered in the downlink between transmitter (eNodeB) and
receiver (MUE). Path loss (PL) models can be summarized as follows:
4.1.1 Standard Propagation Model
Standard Propagation Model in a propagation model based on Okumura-Hata models
which support frequencies higher than 1500 MHz. It is used in Asset and Atoll
softwares. Standard Propagation Model (SPM) is based on empirical formulas and the
parameters are set to their default values [45]. However, it is possible to tune the
parameters of SPM according to the actual propagation conditions. In this thesis, also,
this PL model is used. SPM is formulated as
𝐿𝑚𝑜𝑑𝑒𝑙= 𝐾1+ 𝐾2𝑙𝑜𝑔 d + 𝐾3𝑙𝑜𝑔 (𝐻𝑇𝑥𝑒𝑓𝑓𝑥) + 𝐾4 ∗𝐷𝑖𝑓𝑓𝑟𝑎𝑐𝑡𝑖𝑜𝑛 𝑙𝑜𝑠𝑠+𝐾5 (𝑙𝑜𝑔𝑑∗ 𝑙𝑜𝑔
𝐻𝑇𝑥𝑒𝑓𝑓 + 𝐾6 𝐻𝑇𝑥𝑒𝑓𝑓 + 𝐾𝑐𝑙𝑢𝑡𝑡𝑒𝑟𝑓𝑐𝑙𝑢𝑡𝑡𝑒𝑟 ………………………………………… (4.1)
Where, 𝐾1 is frequency constant (dB), 𝐾2 is distance attenuation constant, d is the
distance between the receiver and transmitter (m), 𝐾3 and 𝐾4 are correction coefficient
of height of mobile station antenna, 𝐾5 and 𝐾6 are correction coefficient of height of
base station antenna, 𝐾𝑐𝑙𝑢𝑡𝑡𝑒𝑟 is correction coefficient of clutter attenuation, 𝑓𝑐𝑙𝑢𝑡𝑡𝑒𝑟 is
average of weighted losses due to clutter, 𝐻𝑇𝑥𝑒𝑓𝑓 is the effective antenna height of a
mobile. Diffraction loss is loss due to diffraction over an obstructed path (dB).
4.1.2 Stanford University Interim (SUI) Model
Stanford University Interim (SUI) model is developed jointly by IEEE 802.16 group
and Stanford University. It is used for WiMAX application and for frequencies above
1900MHz. In this propagation model, three different groups of terrains are considered.
Terrain A represents an area with maximum path loss and it can be a highly dense
populated and heavy tree while terrain B denotes an area with moderate path loss (sub-
urban environment). Terrain C represents a rural or flat area i.e the least path loss areas.
The SUI model is formulated as:
26 | P a g e
PL= A+ 10 γ log (𝑑/𝑑𝑜) +𝑋𝑓+𝑋ℎ+𝑆…………………………………………….. (4.2)
Where, PL represents Path Loss in dBs, d is the distance between the transmitter and
receiver, 𝑑𝑜 is the reference distance taken as 100, 𝑋𝑓 is the frequency correction factor,
𝑋ℎ is the correction factor for base station height, S represents shadowing and γ
represents the path loss component [46].
4.1.3 Cost -231 Hata Model
The COST-Hata model which is also known as the COST-231 models [47] is a radio
propagation model that extends the Hata-Okumura model to cover a more extended
range of frequencies. It supports a range of frequency of 1500 MHz to 2000 MHz, a
base station antenna height from 30m to 200m, a mobile station antenna height from 1
to 10m and a link distance of 1 to 30km. The COST-Hata model is formulated as:
Path Loss (L) = 46.3 + 33.9 𝑙𝑜𝑔10 𝑓 – 13.82 𝑙𝑜𝑔10(ℎ𝑏) –a(ℎ𝑚) + (44.9 - 6.55
log(ℎ𝑚)log10(d) + C [dB]……………… ………………………………………. (4.3)
Where, L is path loss in decibel (dB), f is a frequency of transmission in MHz, ℎ𝑏 is
the base station antenna effective height in meter (m), d is the link distance in killo
meter (km), ℎ𝑚 is mobile station antenna effective height (m) and a(ℎ𝑚) is a mobile
station antenna height correction factor as described in the Hata model for urban
areas.
4.2 Antenna Model
There are various antenna models which are used in mobile communications. In this
thesis, 1800MHz antenna with horizontal beam width of 65 degree with gain of 17dbi
is used.
4.3 Shadowing Models
Shadowing or slow fading is signal loss along a path that is caused by obstructions in
the surrounding and it is not taken into consideration by the propagation model. Even
when a receiver remains in the same location or in the same clutter class, there are
variations in reception due to the surrounding environment.

27 | P a g e
The Atoll simulation software uses a standard deviation with the cell-edge coverage
probability to model shadowing and thereby generate coverage predictions that are
reliable more than fifty percent of the time. The additional losses or gains caused by
shadowing called shadowing margin. The shadowing margin is added to the path losses
calculated by the propagation model. In this thesis, a cell-edge coverage probability of
75 percent with standard deviation of 4.72 for all models are used.
4.4 Scheduling Types
4.4.1. Round Robin (RR)
In RR scheduling, UEs are assigned the resource blocks in round fashion (one after
another) without considering Channel Quality Indication (CQI). It is a simple procedure
of giving the best fairness. Fairness is achieved in this scheduling by providing an equal
share of packet transmission time to each user. However, cell throughput significantly
decreased as the scheduler does not depend on the instantaneous downlink SNR values
for determining the number of bits to be transmitted [48].
4.4.2. Proportional Fair (PF)
The main aim of Proportional Fair algorithm is to balance between throughput and
fairness among all UEs. This algorithm tries to maximize total cell throughput while at
the same time it provides minimal level of service for all UEs. Proportional Fair (PF)
scheduling is performed by allocating more resources to a user with better channel
quality. This is done by giving a scheduling priority to each data flow that is inversely
proportional to its predicted resource consumption. Therefore, PF scheduling may be
the best option [48].
4.4.3. Best CQI
This scheduling algorithm is used to assign resource blocks to the user with the best
radio link conditions. The resource blocks assigned by this scheduler to the user will
have the highest CQI on that RB. To perform best CQI calculations, the UEs must send
the CQI to the BS. Basically in the downlink, the BS transmits downlink reference
signal to UEs which is used by UEs for the calculation of the CQI. A higher CQI value
means better channel condition [48].

28 | P a g e
CHAPER 5. SIMULATION ANALYSIS AND RESULTS
5.1 Performance Analysis
Table 5.1 is taken from Huawei iManager PRS (Performance Report System) which is
used for performance analysis of different network element (GSM, UMTS and LTE).
It shows that the Key Performance Index (KPI) of the whole eNodeBs of Addis Ababa
on one specific day for each hour interval. According to the data, the average downlink
throughput is far more less than the theoretical LTE network capacity which is
100Mbps and requires improvement.
Table 5.1: KPI of whole LTE network on day May 26 2015
TimeWhole
Network
Cell Traffic
Volume_DL(G
bits)
DL Average
Throughput(K
bps)
DL Cell PDCP
Layer Average
Throughput(kb
it/s)
L.Thrp.Ti
me.Cell.
DL(s)
05/26/2015 00:00 Whole Network 102.4388 18917.0779 533.4633 192026
05/26/2015 01:00 Whole Network 63.3245 19620.9139 486.3636 130200
05/26/2015 02:00 Whole Network 31.9075 17368.3111 357.0747 89358
05/26/2015 03:00 Whole Network 10.8678 9158.211 157.7054 68912
05/26/2015 04:00 Whole Network 18.1222 12664.0061 211.4409 85708
05/26/2015 05:00 Whole Network 24.1978 14771.3534 219.3335 110324
05/26/2015 06:00 Whole Network 58.447 18254.2116 411.7057 141963
05/26/2015 07:00 Whole Network 82.6091 18294.9702 414.2362 199425
05/26/2015 08:00 Whole Network 127.0893 20472.7473 486.0588 261469
05/26/2015 09:00 Whole Network 237.2771 24180.6146 750.25 316264
05/26/2015 10:00 Whole Network 234.2764 21748.0811 672.8542 348183
05/26/2015 11:00 Whole Network 227.7513 22407.7036 674.6308 337594
05/26/2015 12:00 Whole Network 194.8376 22684.3743 607.1977 320880
05/26/2015 13:00 Whole Network 252.379 21805.6547 796.8923 316704
05/26/2015 14:00 Whole Network 218.4929 19650.6017 628.9212 347409
05/26/2015 15:00 Whole Network 225.3506 18602.0879 590.8401 381407
05/26/2015 16:00 Whole Network 148.6987 17448.7749 467.7942 317872
05/26/2015 17:00 Whole Network 169.0046 17155.9187 473.7779 356717
05/26/2015 18:00 Whole Network 187.1798 20205.6367 588.3031 318169
05/26/2015 19:00 Whole Network 210.1441 21620.8119 629.4416 333858
05/26/2015 20:00 Whole Network 208.8884 19402.4926 541.4127 385821
05/26/2015 21:00 Whole Network 279.6679 19327.1403 701.6536 398584
05/26/2015 22:00 Whole Network 214.0266 18446.6404 623.4644 343286
05/26/2015 23:00 Whole Network 190.8066 20289.6578 719.9761 265018

29 | P a g e
5.2 Performance Metrics
5.2.1 PDSCH Carrier to Interference Plus Noise Ratio
LTE is designed to work on environments where there are peripheral interferences.
System performance reduces as the PDSCH C/I (i.e. Carrier interference ratio) is
decreased. However, it may be acceptable in places where there is zero or negative C/I.
In reuse 1, every site and sector in LTE systems can use the same resource block. As
the result, there will be interference from other sectors within the system. As the result,
in the border areas where there is overlapping coverage between sectors there will be 0
dB CINR or below. The carrier to interference plus noise (CINR) is the ratio of the
carrier signal of best serving eNodeB for a user among neighbor eNodeBs and all the
interference plus noise.
𝐶𝐼𝑁𝑅𝑚,𝑘 =𝑃𝑀,𝑘 𝐺𝑚,𝑀,𝑘
𝑁0∆𝑓+ ∑ 𝑃𝑀′,𝑘𝐺𝑚,𝑀′,𝑘𝑀′………………………………. (5.1)
Where, PM,k and PM′,k are transmit power of serving eNodeB M and neighboring
eNodeB M΄ on sub-carrier k respectively. Gm,M,k is channel gain between macro user
m and serving eNodeB M on sub-carrier k. Channel gain from neighboring eNodeBs
are denoted by Gm,M′,k. N0 is white noise spectral density and Δf is sub-carrier spacing.
5.2.2 Peak RLC Throughput
One of the performance metrics used in this thesis is the peak RLC throughput and it
is defined as
𝑅𝑅𝐿𝐶 𝑚𝑎𝑥 = 𝑅𝑊𝐼𝑁 (𝑁𝑅𝐿𝐶 𝑃𝐷𝑈−𝑁𝑅𝐿𝐶 ℎ𝑒𝑎𝑑𝑒𝑟)
𝑅𝑇𝑇+𝑇𝑆𝑃……………………….. (5.2)
Where, RWIN is RLC window size in number of RLC PDUs, NRLC PDU is the size of
the RLC PDU, NRLC header is the size of the RLC PDU header, RTT is the round trip
time and TSP is the timer status prohibit. By increasing RLC PDU size, the maximum
RLC data rate can be increased. However, for cell-edge users if the UE has a reduced
power, this large PDU may not be transmitted.

30 | P a g e
5.2.3 Coverage Probability
The coverage probability is the probability that a mobile user is able to achieve some
SINR threshold, i.e. it is the complementary cumulative distribution function (CCDF).
𝑃 = 𝑃(𝑆𝐼𝑁𝑅 > 𝐻)……………………………… (5.3)
Where, the right-hand side denotes the coverage probability that the SINR is greater
than some SINR threshold H.
5.3 Simulation Setup
For the simulation purpose, 7 eNodeBs around Gotera area of Addis Ababa with total
area of 3.758 km square is randomly selected which is our focus zone. Each eNodeB
consists of 3 hexagonal sectors such that each hexagonal sector is served by a different
directional antenna. The static inter-cell interference coordination algorithms are tested
in this selected eNodeBs.
Site Name Site ID Longitude Latitude
112077 AA TEP049 38.7521 8.98418
111217 AA 286G 38.7582 8.98703
111047 AA ZTEG 240 38.76465 8.98293
111127 AA 279G 38.7526 8.98006
111099 AA ZTEG027E 38.75836 8.97971
111206 AA 304G 38.74688 8.98028
111203 AA 301G 38.74963 8.97113
Table 5.2: Sample eNodeBs position in Gotera area used for simulation
31 | P a g e
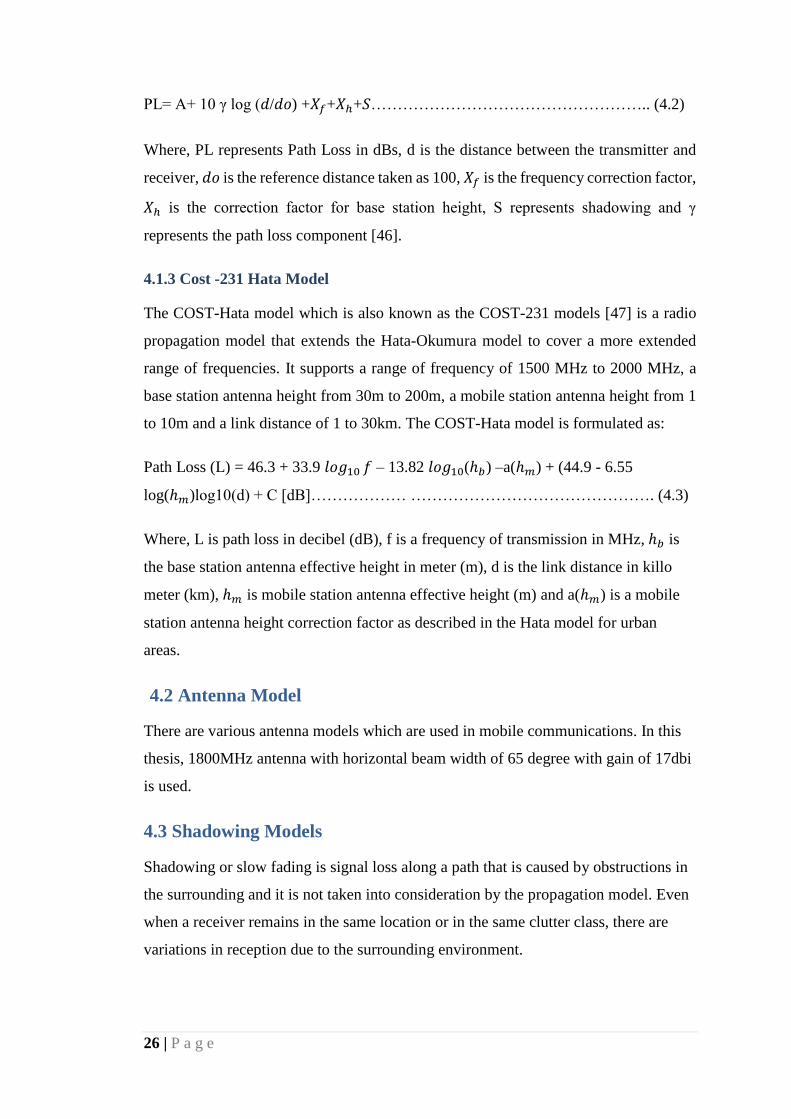
Fig 5.1: Antenna location of eNodeBs (Gotera area) used in the simulation (Atoll
snapshot)
5.4 Simulation Results
General simulation parameters are presented in Table 5.3. The simulation is run on
Atoll software by using the network parameters eNodeBs around Gotera area. In
addition, it is assumed that proportional fair algorithm is used as a scheduler type,
PDCCH overload is taken as 1 symbol duration per sub-frame and standard propagation
model is taken as a propagation model for all eNodeBs in the simulation. Moreover, the
simulation is performed taking the assumption of Mobile user which is fixed and is
using high speed internet. The eNodeBs calculate the difference in path loss for cell to
consider the user as the cell-edge and it is taken as 5dB in this simulation.

32 | P a g e
Number of eNodeBs 7
Sector per eNodeBs 3
Channel Number 1765
E-UTRA Band 3
Power (dbm) 43
Antenna model 65deg17dbi1800MHZ
Channel bandwidth 20 MHz
Number of resource blocks 100
Spectrum of resource blocks 180 kHz
Number of sub-channels 1200
Subcarrier spacing 15 KHz
Noise figure (DB) 5
Number of Antenna port Transmission 2
Reception 2
Table 5. 3: General network parameters of eNodeBs in Addis Ababa to be used for the
simulation
The table below shows the resource block configuration of different static ICIC
algorithms for the data channel (PDSCH) used in the simulation.
ICIC
Mode
Frequency
Blocks Group 0 Group 1 Group 2
Hard FFR 100 1-34 35-67 68-100
SFR 100 1-34 35-67 68-100
PFR 100 51-67 68-84 85-100
SFFR 100 51-67 68-84 85-100
Table 5.4 Resource block configuration for different static ICIC
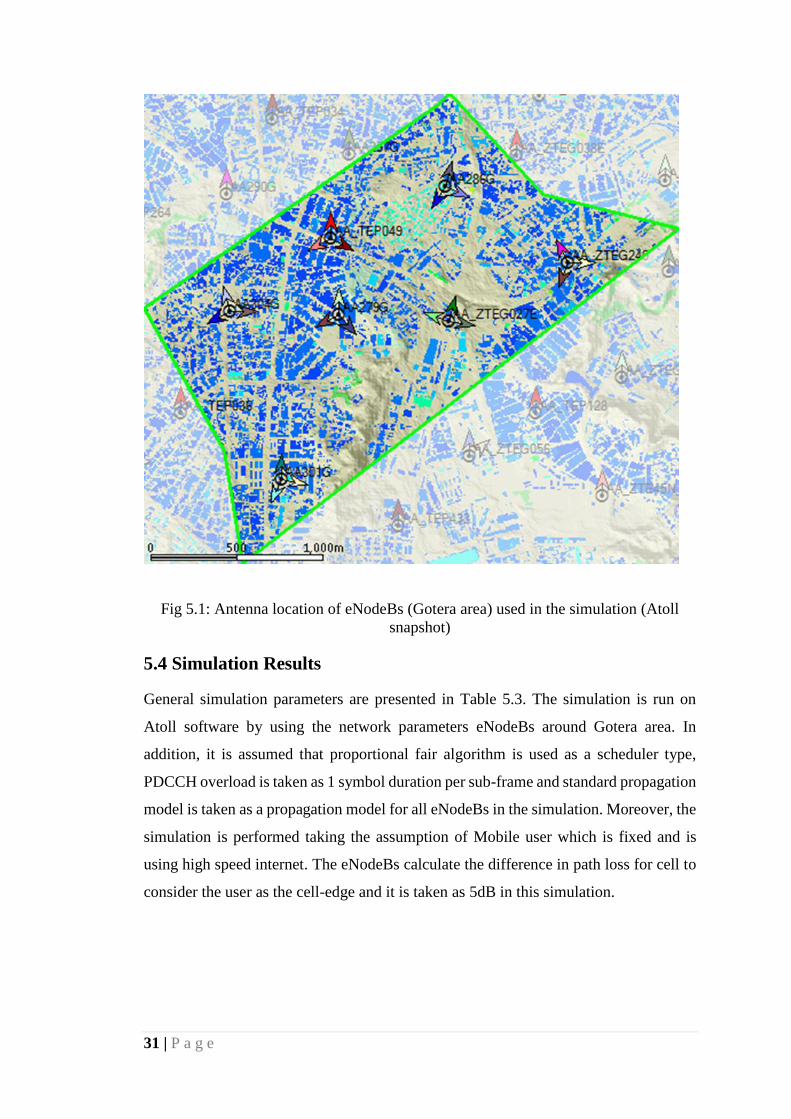
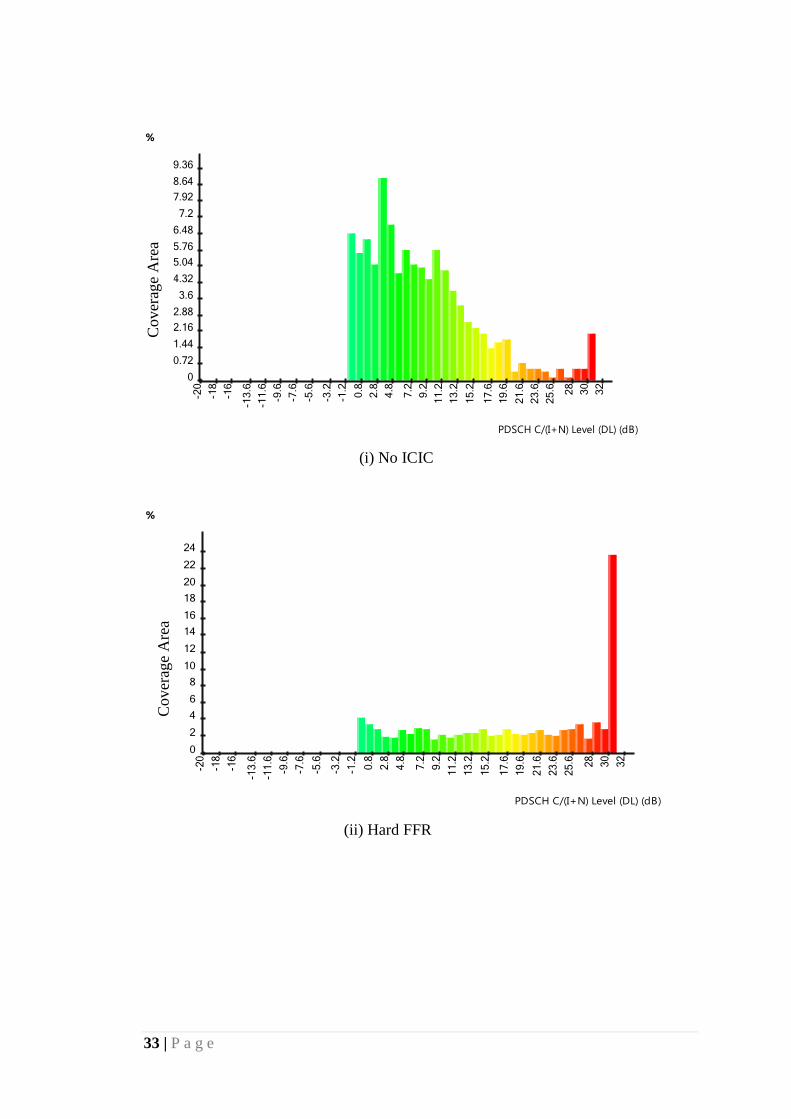
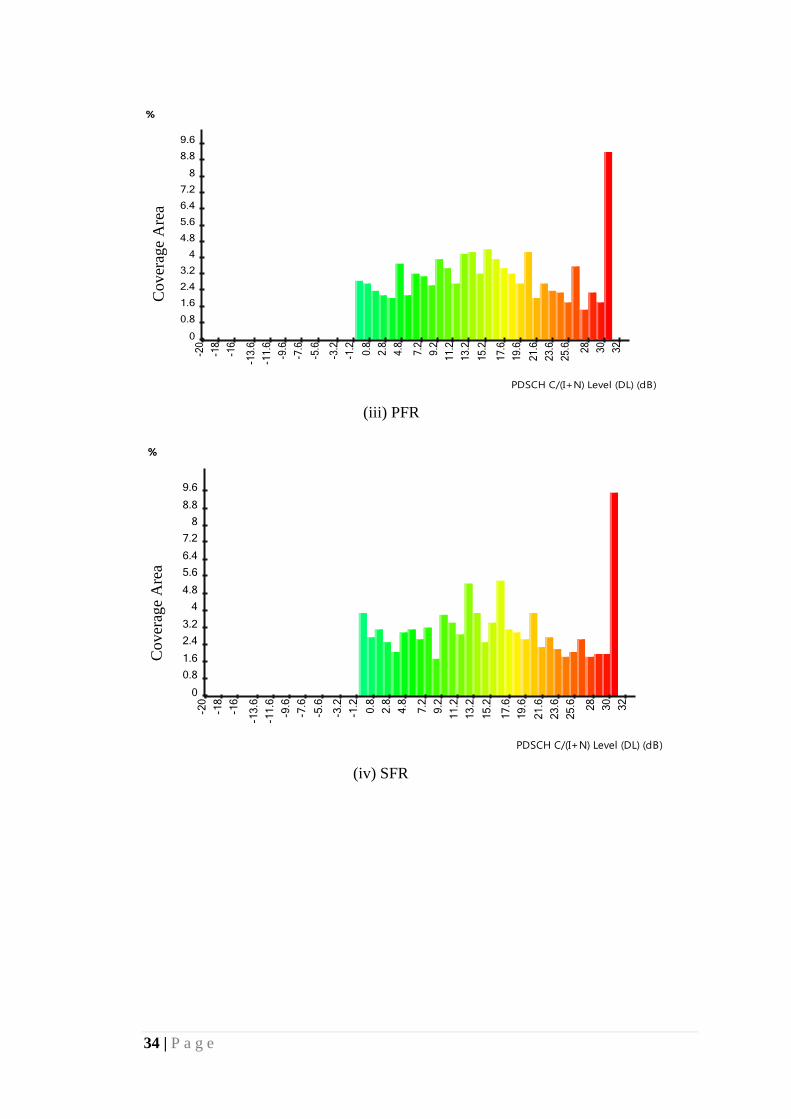
5.4.1 Simulation by CINR level
This simulation result shows different PDSCH C/ (I+N) levels in the downlink and
their respective percentage in the coverage area for different static ICIC schemes i.e
No ICIC, Hard FFR, PFR, SFR, and SFFR.
33 | P a g e
(i) No ICIC
(ii) Hard FFR
%
0
0.72
1.44
2.16
2.88
3.6
4.32
5.04
5.76
6.48
7.2
7.92
8.64
9.36
-20
-18
-16
-13.6
-11.6
-9.6
-7.6
-5.6
-3.2
-1.2
0.8
2.8
4.8
7.2
9.2
11.2
13.2
15.2
17.6
19.6
21.6
23.6
25.6 28
30
32
PDSCH C/(I+N) Level (DL) (dB)
%
0
2
4
6
8
10
12
14
16
18
20
22
24
-20
-18
-16
-13.6
-11.6
-9.6
-7.6
-5.6
-3.2
-1.2
0.8
2.8
4.8
7.2
9.2
11.2
13.2
15.2
17.6
19.6
21.6
23.6
25.6 28
30
32
PDSCH C/(I+N) Level (DL) (dB)
Co
ver
age
Are
a
Cover
age
Are
a
34 | P a g e
(iii) PFR
(iv) SFR
%
0
0.8
1.6
2.4
3.2
4
4.8
5.6
6.4
7.2
8
8.8
9.6
-20
-18
-16
-13.6
-11.6
-9.6
-7.6
-5.6
-3.2
-1.2
0.8
2.8
4.8
7.2
9.2
11.2
13.2
15.2
17.6
19.6
21.6
23.6
25.6 28
30
32
PDSCH C/(I+N) Level (DL) (dB)
%
0
0.8
1.6
2.4
3.2
4
4.8
5.6
6.4
7.2
8
8.8
9.6
-20
-18
-16
-13.6
-11.6
-9.6
-7.6
-5.6
-3.2
-1.2
0.8
2.8
4.8
7.2
9.2
11.2
13.2
15.2
17.6
19.6
21.6
23.6
25.6 28
30
32
PDSCH C/(I+N) Level (DL) (dB)
Cover
age
Are
a C
over
age
Are
a

35 | P a g e
(v) SFFR
Fig 5.2: Coverage prediction vs PDSCH C/ (I+N) level of static ICIC schemes.
According to Figure 5.2, about 24 percent of the area under the study is predicted to
have 30dB CINR when we are using Hard FFR whereas about only 1 percent of it can
get 30dB CINR when we are using no ICIC techniques. Similarly, for this CINR the
figure is about 9.4, 9.5, and 9.5 percent for SFR, PFR and SFFR respectively. This
result implies that using static ICIC algorithms more percentage of the area can get
better CINR than using No ICIC algorithms and it is particularly high for Hard FFR
algorithm since in this algorithm the center and edge-users of one sector does not share
resources with another sector users, hence reducing interference.
%
0
0.72
1.44
2.16
2.88
3.6
4.32
5.04
5.76
6.48
7.2
7.92
8.64
9.36
-20
-18
-16
-13.
6
-11.
6
-9.6
-7.6
-5.6
-3.2
-1.2 0.8
2.8
4.8
7.2
9.2
11.2
13.2
15.2
17.6
19.6
21.6
23.6
25.6 28 30 32
PDSCH C/(I+N) Level (DL) (dB)
Cover
age
Are
a

36 | P a g e
5.4.2 Simulation by Throughput
i) No ICIC
(ii) Hard FFR
%
0
2
4
6
8
10
12
14
16
18
20
22
24
260
2,0
80
4,1
60
6,2
40
8,3
20
10,4
00
12,4
80
14,5
60
16,6
40
18,7
20
20,8
00
22,8
80
24,9
60
27,0
41
29,1
21
31,2
01
33,2
81
35,3
61
37,4
41
39,5
21
41,6
01
43,6
81
45,7
61
47,8
41
49,9
21
52,0
01
Peak RLC Channel Throughput (DL) (kbps)
%
0
1.4
2.8
4.2
5.6
7
8.4
9.8
11.2
12.6
14
15.4
16.8
0
2,0
80
4,1
60
6,2
40
8,3
20
10,4
00
12,4
80
14,5
60
16,6
40
18,7
20
20,8
00
22,8
80
24,9
60
27,0
41
29,1
21
31,2
01
33,2
81
35,3
61
37,4
41
39,5
21
41,6
01
43,6
81
45,7
61
47,8
41
49,9
21
52,0
01
Peak RLC Channel Throughput (DL) (kbps)
Cover
age
Are
a C
over
age
Are
a
37 | P a g e
(iii) PFR
(iv) SFR
C
over
age
Are
a C
over
age
Are
a
38 | P a g e
(v) SFFR
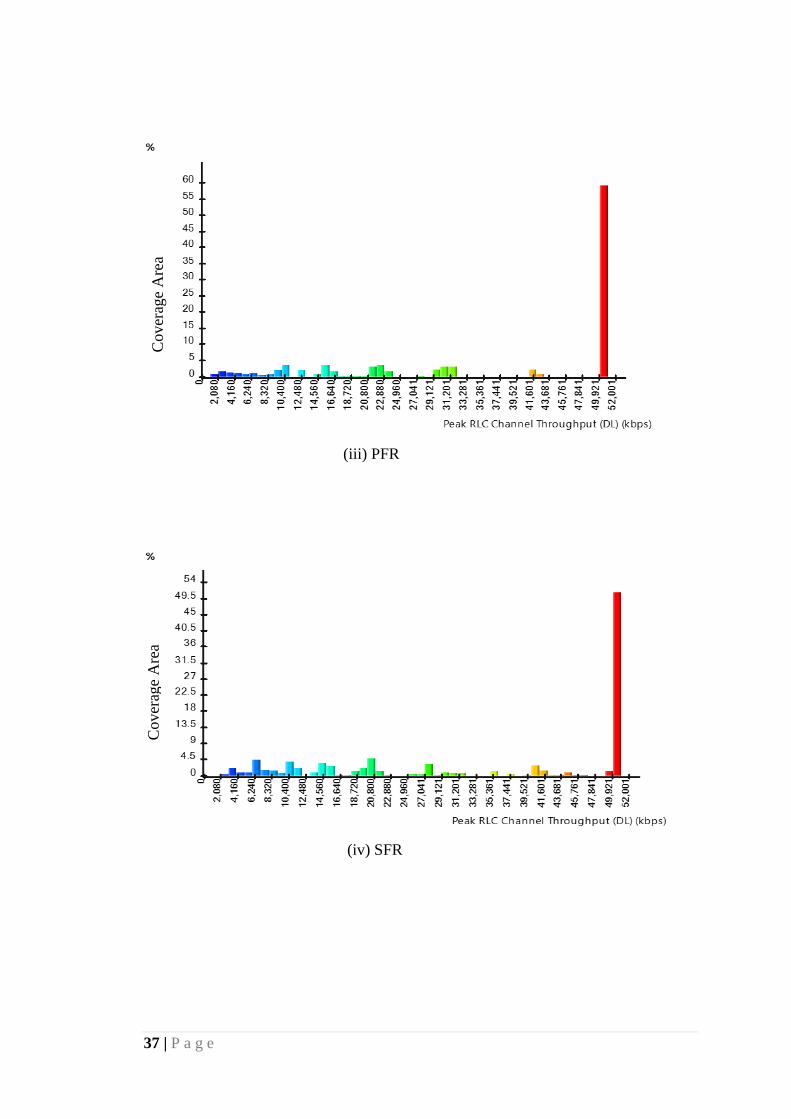
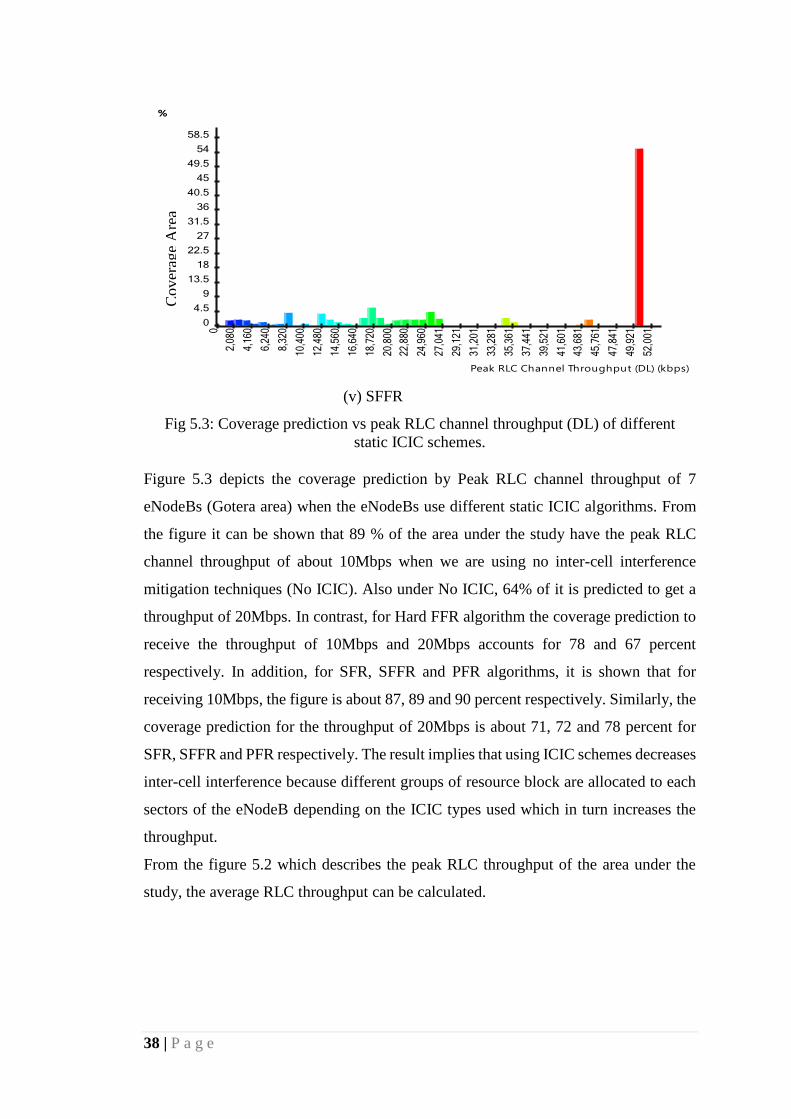
Fig 5.3: Coverage prediction vs peak RLC channel throughput (DL) of different
static ICIC schemes.
Figure 5.3 depicts the coverage prediction by Peak RLC channel throughput of 7
eNodeBs (Gotera area) when the eNodeBs use different static ICIC algorithms. From
the figure it can be shown that 89 % of the area under the study have the peak RLC
channel throughput of about 10Mbps when we are using no inter-cell interference
mitigation techniques (No ICIC). Also under No ICIC, 64% of it is predicted to get a
throughput of 20Mbps. In contrast, for Hard FFR algorithm the coverage prediction to
receive the throughput of 10Mbps and 20Mbps accounts for 78 and 67 percent
respectively. In addition, for SFR, SFFR and PFR algorithms, it is shown that for
receiving 10Mbps, the figure is about 87, 89 and 90 percent respectively. Similarly, the
coverage prediction for the throughput of 20Mbps is about 71, 72 and 78 percent for
SFR, SFFR and PFR respectively. The result implies that using ICIC schemes decreases
inter-cell interference because different groups of resource block are allocated to each
sectors of the eNodeB depending on the ICIC types used which in turn increases the
throughput.
From the figure 5.2 which describes the peak RLC throughput of the area under the
study, the average RLC throughput can be calculated.
%
0
4.5
9
13.5
18
22.5
27
31.5
36
40.5
45
49.5
54
58.5
0
2,08
0
4,16
0
6,24
0
8,32
0
10,4
00
12,4
80
14,5
60
16,6
40
18,7
20
20,8
00
22,8
80
24,9
60
27,0
41
29,1
21
31,2
01
33,2
81
35,3
61
37,4
41
39,5
21
41,6
01
43,6
81
45,7
61
47,8
41
49,9
21
52,0
01
Peak RLC Channel Throughput (DL) (kbps)
Cover
age
Are
a C
over
age
Are
a
39 | P a g e
ICIC Schemes Average throughput (Mbps)
NO ICIC 26.5
Hard FFR 31.4
SFR 34.5
SFFR 34
PFR 37
Table 5.5: Average RLC throughput of the area under the study
As can be seen from the table, when we use no ICIC, the area is predicted to have an
average throughput of about 26.5 Mbps. However, the average throughput is 31.4, 34.5,
34 and 37 Mbps for Hard FFR, SFR, SFFR and PFR respectively. This result indicates
that PFR scheme has improved the average downlink throughput by 10.5 Mbps when
compared to No ICIC case and by 5.6Mbps compared to Hard FFR scheme.
5.4.3 Simulation by Coverage Probability
The Figure 5.4 below shows the coverage probability of the area at different DL
PDSCH CINR level for different static ICIC algorithms.
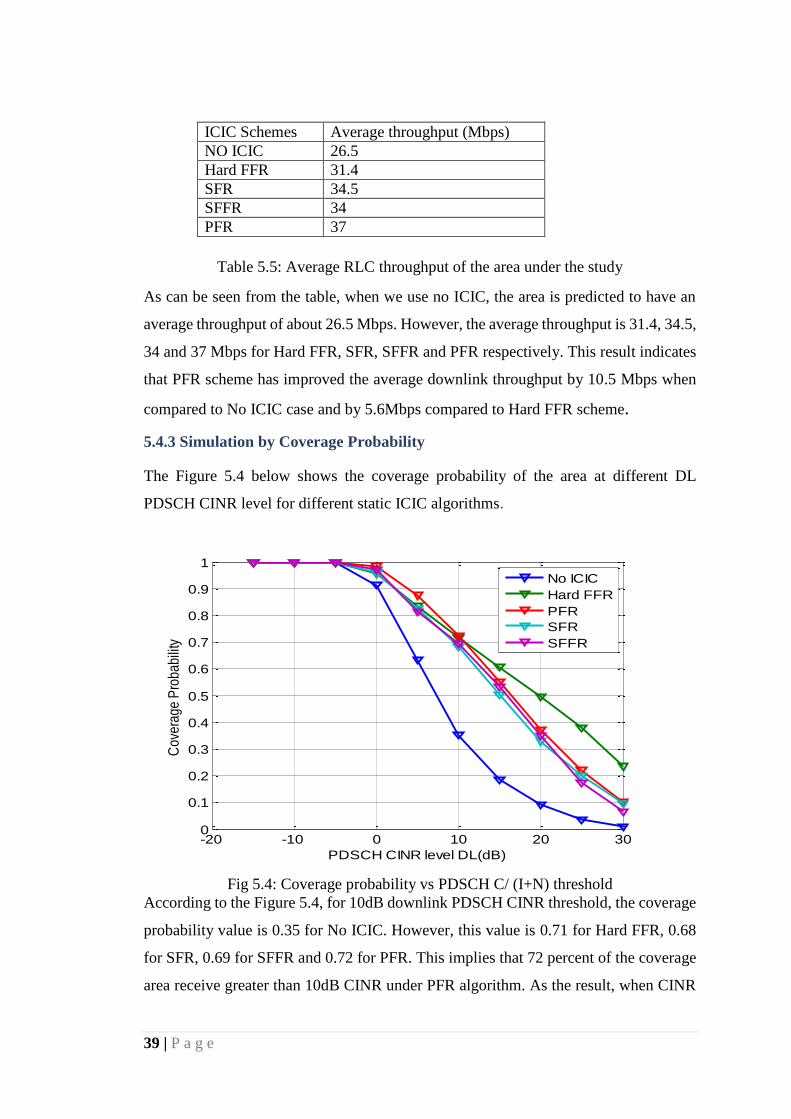
Fig 5.4: Coverage probability vs PDSCH C/ (I+N) threshold
According to the Figure 5.4, for 10dB downlink PDSCH CINR threshold, the coverage
probability value is 0.35 for No ICIC. However, this value is 0.71 for Hard FFR, 0.68
for SFR, 0.69 for SFFR and 0.72 for PFR. This implies that 72 percent of the coverage
area receive greater than 10dB CINR under PFR algorithm. As the result, when CINR
-20 -10 0 10 20 300
0.1
0.2
0.3
0.4
0.5
0.6
0.7
0.8
0.9
1
PDSCH CINR level DL(dB)
Cov
erag
e P
roba
bilit
y
No ICIC
Hard FFR
PFR
SFR
SFFR

40 | P a g e
is decreasing (close to cell-edge), using PFR algorithm is more preferable compared to
other algorithms. However, the figure also shows that for 20dB downlink CINR
threshold, Hard FFR (reuse 3) algorithm has the coverage probability of 0.49 whereas
the values are 0.37 for PFR, 0.32 for SFR and 0.35 for SFFR. This indicates that under
Hard FFR algorithm, more percentage of areas near the center have more than 20DB
CINR compared to other algorithms. This is due to considerable decrease of
interference for center-users in neighboring sectors because Hard FFR algorithm totally
divides the whole cell into three sector and no sharing of resources blocks between
users of neighbor sectors.
Fig 5.5: Coverage probability vs peak RLC channel throughput
In Figure 5.5, the probability of coverage by peak RLC channel throughput under
different static interference coordination algorithms is compared. If we consider a point
where peak RLC channel throughput is 20Mbps, the probability of coverage for SFR is
at 0.71, for Hard FFR it is at 0.65, for SFFR it is at 0.72, for No ICIC it is at 0.64 and
for PFR it is at 0.78 which is more compared to others. This implies that using PFR
algorithm the coverage has a probability of 78 percent for receiving more than 20Mbps.
Basically, this result is due to the fact that under PFR algorithm cell-edge users cannot
use resources of center-users and also edge-users of neighbor cells use different
resource blocks helping for reducing interference thereby increase in throughput.
0 10 20 30 40 500
0.1
0.2
0.3
0.4
0.5
0.6
0.7
0.8
0.9
1
Peak RLC throughput(DL)(Mbps)
Co
vera
ge
Pro
ba
bili
ty
No ICIC
Hard FFR
PFR
SFR
SFFR
41 | P a g e
CHAPTER 6. CONCLUTION AND FUTURE WORK
6.1 Conclusion
This thesis addressed a research topic which is inter-cell interference mitigation in LTE
downlink network considering the case of Addis Ababa using static inter-cell
interference coordination algorithms to increase the data rate specially for cell-edge
users. It is indicated previously that the currently deployed LTE network of Addis
Ababa uses reuse 1 techniques and has low average downlink throughput. In this thesis,
we have created a simulation environment in Atoll simulation software by taking the
real network (eNodeB) data of Addis Ababa and we have used Matlab software for
performance comparison. Different algorithms of the static ICIC techniques which is
based on frequency domain are analyzed and interpreted. As can be seen from the result
of case study, the following conclusions are drawn:
Using the static ICIC algorithms have better CINR coverage than using no ICIC
algorithm (reuse 1) and among the static inter-cell interference algorithms PFR
algorithm has better CINR coverage for low CINR values (near cell-edge) and
Hard FFR algorithm (reuse 3) will give us better probability of coverage for
high CINR values(near center region).
Using PFR algorithm as a static ICIC technique can provide considerably better
average throughput than the other static ICIC techniques because PFR scheme
balances the requirements of interference reduction and resource utilization
efficiently.
From a practical perspective, static ICIC techniques are a very attractive
alternative for currently deployed LTE network of Addis Ababa since it is not
complex to implement because it is based on managing the resource blocks and
it doesn’t involve signaling massage exchange.
Implementing the static ICIC schemes on currently deployed LTE network of
Addis Ababa can improve the average downlink throughput.
42 | P a g e
6.2 Future Work
The following points have been proposed as a future work to further complete and
investigate this important thesis work.
Studying and implementing other proposed FFR schemes such as Incremental
frequency reuse (IFR) for reducing ICI.
Studying the enhanced inter-cell interference coordination algorithm to mitigate
interference in LTE-Advanced heterogeneous networks.
Studying the impact of changing the power level of resource blocks for cell-
edge users relative to cell-center users.
Studying and implementing dynamic interference coordination which uses real
time cell coordination to allocate resources on LTE deployment of Addis
Ababa.
Studying the uplink static and dynamic inter-cell interference coordination
techniques.
Studying and implementing time domain based inter-cell interference
coordination techniques in LTE deployment of Addis Ababa.
43 | P a g e
References
[1] Aderemi A. Atayero, Juliet O. Iruemi, Matthew K. Luka, Martha K. Orya,
“3GPP Long Term Evolution: Architecture, Protocols and Interfaces,” International
Journal of Information and Communication Technology Research, Vol. 1, No. 7,
November 2011.
[2] Muhammad M.Rahman and Shalima B.Manir, “Performance Analysis of Sc-FDMA
and OFDMA in LTE Frame Structure,” International Journal of Computer
Applications, Vol. 45, No. 23, May 2012.
[3] Chandra Thapa and Chandrasekhar.C, “Comparative evaluation of fractional
frequency reuse (FFR) and Traditional Frequency Reuse in 3GPP-LTE downlink,”
International Journal of Mobile Network Communications & Telematics (IJMNCT),
Vol. 2, No. 4, page 45, August 2012.
[4] Farhana Afroz, H. Al Kim and Kumbesan Sandrasegaran, “Interference
management on LTE downlink Networks,” International Journal of Wireless & Mobile
Networks (IJWMN), Vol. 7, No. 1, February 2015.
[5] Ashley Mills, David Lister and Marina De Vos, “Understanding static inter-cell
interference coordination mechanisms,” Journal of communications, Vol. 6, No. 4,
Page 312, July 2011.
[6] Abdelbaset S. Hamza, Haitham S. Hamza, Khaled Elsayed and Shady S. Khalifa,
“A Survey on Inter-Cell Interference Coordination Techniques in OFDMA-based
Cellular Networks: 4G++ Project”, Cairo University, March 19 2013.
[7] Rysavy Research, 3G Americas. HSPA to LTE Advanced. September 2009, p.5.
[8] A. Daeinabi, K. Sandrasegaran and X.Zhu ,“An Intercell Interference Coordination
Scheme in LTE Downlink Networks based on User Priority and Fuzzy Logic System,”
International Journal of Wireless & Mobile Networks (IJWMN), Vol. 5, No. 4, August
2013.
[9] Dai Kimura and Hiroyuki Seki, “ICIC Technology,” FUGITSU since tech Journal,
Vol. 48, No. 1, January 2012.
[10] Chandra Thapa and Chandrasekhar.C, “Comparative evaluation of fractional
frequency reuse (FFR) and Traditional Frequency Reuse in 3GPP-LTE downlink,”
International Journal of Mobile Network Communications & Telematics (IJMNCT),
Vol. 2, No. 4, August 2012.
44 | P a g e
[11] Abdelbaset S. Hamza et al., “A Survey on Inter-Cell Interference Coordination
Techniques in OFDMA-based Cellular Networks: 4G++ Project”, Egypt, May 2013.
[12] S. Zhang, “Inter-cell Interference Coordination in Indoor LTE Systems." Masters
Thesis, Royal Institute of Technology, Sweden, 2011.
[13] I. Katzela and M. Naghshineh, “Channel assignment schemes for cellular mobile
telecommunication systems: a comprehensive survey," IEEE Personal
Communications, Vol. 3, No. 3, pp. 10-31, 1996.
[14] Beming P., Frid L., Hall G., Malm P., Noren T., Olsson M., et al., “LTE-SAE
architecture and performance,” October 2007, Ericsson Review 3, http://
www.ericsson.com.
[15] Lescuyer P. and Lucidarme T. Evolved Packet System (EPS), The LTE and SAE
Evolution of 3G UMTS. Chippenham, England, John Wiley & Sons Ltd, 2008, P.338.
[16] Bogineni K., Ludwig R., Mogensen P., Nandlall V., Vucetic V., Yi B.K. & Zvonar
Z. (2009, February). “LTE Part I: Core Network.” [Online]. IEEE Communications
Magazine, Pages 40-49.
[17] “3GPP TR 25.913: Requirements for Evolved UTRA (E-UTRA) and Evolved
UTRAN (EUTRAN)”, 2009.
[18] Ghaleb et al., “LTE Network Planning and Optimization: Case Study”, University
of Taiz, Yemen, 2014, p. 21.
[19] Shah D.S., “LTE Evolved UTRAN (EUTRAN) and LTE Self Organizing
Networks: A White Paper”, USA, 2010.
[20] EventHelix.com Inc. “3GPP LTE Packet Data Convergence Protocol (PDCP) Sub
Layer.” 2009. [Online]. Available: www.eventhelix.com/lte/presentations/3GPP-LTE-
PDCP.pdf].
[21] Alcatel-Lucent. (2009). The LTE Network Architecture. [Online]. Available:
www.alcatel-lucent.com.
[22] Sainju P. Man, “LTE performance analysis on 800 & 1800 MHZ bands.” Masters
thesis, Tampere University of Technology, p.9, 2012.
[23] “3GPP Technical Specification 36.321- version 11.3.0- Evolved Universal
Terrestrial Radio Access (E-UTRA); Medium Access Control (MAC) protocol
specification,” 2013.
45 | P a g e
[24] Jim Zyren, “Overview of 3GPP Long Term Evolution Physical Layer: A White
Paper”, 2007, p. 19.
[25] “3GPP Technical Specification 36.213 -version 11.4.0- Evolved Universal
Terrestrial Radio Access (E-UTRA); Physical layer procedures”, 2013.
[26] Sainju P. Man, “LTE performance analysis on 800 & 1800 MHZ bands.” Masters
thesis, Tampere University of Technology, 2012.
[27] “ETSI TS 136 101 V10.5.0 Release 10, LTE Evolved Universal Terrestrial Radio
Access (E-UTRA): User Equipment (UE) radio transmission and reception”, January
2012.
[28] Jim Zyren, “Overview of 3GPP Long Term Evolution Physical Layer: A White
Paper”, 2007, p. 15.
[29] Soltani N., “Comparison of Single-Carrier FDMA vs. OFDMA as 3GPP Long-
Term Evolution: A White Paper”, 2009.
[30] IXIA., “SC-FDMA Single Carrier FDMA in LTE: A White Paper on SC-FDMA
technology, its use in LTE and its extension from OFDM”, 2009.
[31]Farhana Afroz, H. Al Kim and Kumbesan Sandrasegaran, “Interference
management on LTE downlink Networks,” International Journal of Wireless & Mobile
Networks (IJWMN), Vol. 7, No. 1, p.95, February 2015.
[32] A. Daeinabi, K. Sandrasegaran and X. Zhu. “Survey of Intercell Interference
Mitigation Techniques in LTE Downlink Networks,” Australasian Telecommunication
Networks and Applications Conference, November 2012, pp.1-6.
[33] A. Rácz, A. Simonsson, C. Koutsimanis, G. Fodor, N. Reider, and W. Müller,
“Inter-cell Interference Coordination in OFDMA Networks and in the 3GPP Long Term
Evolution System,” Journal of Communications, Vol. 4(7), p. 445, 2009.
[34] Anders Furuskar, David Astely, Erik Dahlman, Magnus Lindstrom, Stefan
Parkvall, Ylva Jading, “LTE: the evolution of mobile broadband,” IEEE Journal, Vol.
47, Issue 4, pp. 44-51, 2009.
[35] H. Yanikomeroglu and M. Rahman, “Enhancing cell-edge performance: a
downlink dynamic interference avoidance scheme with inter-cell coordination,” IEEE
Transaction on Wireless Communications, Vol. 9, No. 4, pp.1414-1425, 2010.
[36] A.S. Hamza, H. S. Hamza, K. Elsayed, S.S. Khalifa, “ A Survey on Inter-Cell
Interference Coordination Techniques in OFDMA-Based Cellular Networks,” IEEE
Communications Surveys & Tutorials,Vol.15(4), pp.1642-1670, 2013.
46 | P a g e
[37] Ghaleb et al., “LTE Network planning and optimization: Case Study”, University
of Taiz, Yemen, 2014, p. 43.
[38] F. Khan, LTE for 4G Mobile Broadband: in Air Interface Technologies and
Performance, Cambridge University Press, 2009.
[39] Hamza et al., “Advanced Performance Boosting Techniques in 4th Generation
Wireless System: 4G ++ Project”, Egypt, p. 16.
[40] Huawei, “3GPP R1-050841- Further Analysis of Soft Frequency Reuse Scheme,”
2005.
[41] Huawei, “3GPP R1-050507- Soft Frequency Reuse Scheme for UTRAN LTE,”
2005.
[42] Ghaleb et al., “LTE Network Planning and Optimization: Case Study”, University
of Taiz, Yemen, 2014, p. 46.
[43] IEEE 802.16 Broadband, "Fractional Frequency Reuse in Uplink," LG Electronics,
2008.
[44] Hamza et al., “Advanced Performance Boosting Techniques in 4th Generation
Wireless System: 4G ++ Project”, Egypt, p. 19.
[45] Hormoz Parsian. “Comparison of Asset and Atoll Cellular Planning Tools for LTE
Network Planning.” Masters Thesis, AALTO UNIVERSITY, 2012.
[46] Behara S. VVRK, K.Suresh and Rani M.Suneetha, “Comparison of Standard
Propagation Model (SPM) and Stanford University Interim (SUI) Radio Propagation
Models for Long Term Evolution (LTE),” International Journal of Advanced and
Innovative research (IJAIR), pages 221-228, 2012.
[47] Nkordeh N.S et al. “LTE Network Planning using the Hata-Okumura and the
COST-231 Hata Pathloss Models,” in Proceedings of the World Congress on
Engineering (WCE), July 2014.
[48] M. C. Patel and Ronak D. Trivedi, “Comparison of Different Scheduling Algorithm
for LTE,” International Journal of Emerging Technology and Advanced Engineering,
Vol.4, Issue 5, May 2014.

47 | P a g e
![LTE PHY Layer Measurement Guide...4 LTE PHY Layer Measurement Guide LTE Downlink The LTE downlink can be set on six different frequency profiles, as follows: Channel Bandwidth [MHz]](https://img.pdfslide.net/doc/110x75/5e9903898496907a812cd628/lte-phy-layer-measurement-guide-4-lte-phy-layer-measurement-guide-lte-downlink.jpg)