Embed Size (px)
Citation preview


PHENOMENA IN
edited by Emile Pefferkorn lnnstitut Charles Sadron
Strasbourg, France
M A R C E L
MARCEL DEKKER, INC.
D E K K E R
NEW YORK - BASEL

ISBN: 0-8247-1947-6
This book is printed on acid-free paper.
HeadquartersMarcel Dekker, Inc.270 Madison Avenue, New York, NY 10016tel: 212-696-9000; fax: 212-685-4540
Eastern Hemisphere DistributionMarcel Dekker AGHutgasse 4, Postfach 812, CH-4001 Basel, Switzerlandtel: 44-61-261-8482; fax: 44-61-261-8896
World Wide Webhttp://www.dekker.com
The publisher offers discounts on this book when ordered in bulk quantities. For moreinformation, write to Special Sales/Professional Marketing at the headquarters addressabove.
Copyright 1999 by Marcel Dekker, Inc. All Rights Reserved.
Neither this book nor any part may be reproduced or transmitted in any form or by anymeans, electronic or mechanical, including photocopying, microfilming, and recording,or by any information storage and retrieval system, without permission in writing fromthe publisher.
Current printing (last digit):10 9 8 7 6 5 4 3 2 1
PRINTED IN THE UNITED STATES OF AMERICA

SURFACTANT SCIENCE SERIES
FOUNDING EDITOR
MARTIN J. SCHICK1918–1998
SERIES EDITOR
ARTHUR T. HUBBARDSanta Barbara Science Project
Santa Barbara, California
ADVISORY BOARD
DANIEL BLANKSCHTEINDepartment of Chemical EngineeringMassachusetts Institute of TechnologyCambridge, Massachusetts
S. KARABORNIShell International Petroleum
Company LimitedLondon, England
LISA B. QUENCERThe Dow Chemical CompanyMidland, Michigan
JOHN F. SCAMEHORNInstitute for Applied Surfactant
ResearchUniversity of OklahomaNorman, Oklahoma
P. SOMASUNDARANHenry Krumb School of MinesColumbia UniversityNew York, New York
ERIC W. KALERDepartment of Chemical EngineeringUniversity of DelawareNewark, Delaware
CLARENCE MILLERDepartment of Chemical EngineeringRice UniversityHouston, Texas
DON RUBINGHThe Procter & Gamble CompanyCincinnati, Ohio
BEREND SMITShell International Oil Products B.V.Amsterdam, The Netherlands
JOHN TEXTERStrider Research CorporationRochester, New York

1. Nonionic Surfactants, edited by Martin J. Schick (see also Volumes 19, 23,and 60)
2. Solvent Properties of Surfactant Solutions, edited by Kozo Shinoda (seeVolume 55)
3. Surfactant Biodegradation, R. D. Swisher (see Volume 18)4. Cationic Surfactants, edited by Eric Jungermann (see also Volumes 34, 37,
and 53)5. Detergency: Theory and Test Methods (in three parts), edited by W. G.
Cutler and R. C. Davis (see also Volume 20)6. Emulsions and Emulsion Technology (in three parts), edited by Kenneth J.
Lissant7. Anionic Surfactants (in two parts), edited by Warner M. Linfield (see Volume
56)8. Anionic Surfactants: Chemical Analysis, edited by John Cross9. Stabilization of Colloidal Dispersions by Polymer Adsorption, Tatsuo Sato
and Richard Ruch10. Anionic Surfactants: Biochemistry, Toxicology, Dermatology, edited by
Christian Gloxhuber (see Volume 43)11. Anionic Surfactants: Physical Chemistry of Surfactant Action, edited by E. H.
Lucassen-Reynders12. Amphoteric Surfactants, edited by B. R. Bluestein and Clifford L. Hilton (see
Volume 59)13. Demulsification: Industrial Applications, Kenneth J. Lissant14. Surfactants in Textile Processing, Arved Datyner15. Electrical Phenomena at Interfaces: Fundamentals, Measurements, and Ap-
plications, edited by Ayao Kitahara and Akira Watanabe16. Surfactants in Cosmetics, edited by Martin M. Rieger (see Volume 68)17. Interfacial Phenomena: Equilibrium and Dynamic Effects, Clarence A. Miller
and P. Neogi18. Surfactant Biodegradation: Second Edition, Revised and Expanded, R. D.
Swisher19. Nonionic Surfactants: Chemical Analysis, edited by John Cross20. Detergency: Theory and Technology, edited by W. Gale Cutler and Erik
Kissa21. Interfacial Phenomena in Apolar Media, edited by Hans-Friedrich Eicke and
Geoffrey D. Parfitt22. Surfactant Solutions: New Methods of Investigation, edited by Raoul Zana23. Nonionic Surfactants: Physical Chemistry, edited by Martin J. Schick24. Microemulsion Systems, edited by Henri L. Rosano and Marc Clausse25. Biosurfactants and Biotechnology, edited by Naim Kosaric, W. L. Cairns, and
Neil C. C. Gray26. Surfactants in Emerging Technologies, edited by Milton J. Rosen27. Reagents in Mineral Technology, edited by P. Somasundaran and Brij M.
Moudgil28. Surfactants in Chemical/Process Engineering, edited by Darsh T. Wasan,
Martin E. Ginn, and Dinesh O. Shah29. Thin Liquid Films, edited by I. B. Ivanov30. Microemulsions and Related Systems: Formulation, Solvency, and Physical
Properties, edited by Maurice Bourrel and Robert S. Schechter31. Crystallization and Polymorphism of Fats and Fatty Acids, edited by Nissim
Garti and Kiyotaka Sato

32. Interfacial Phenomena in Coal Technology, edited by Gregory D. Botsarisand Yuli M. Glazman
33. Surfactant-Based Separation Processes, edited by John F. Scamehorn andJeffrey H. Harwell
34. Cationic Surfactants: Organic Chemistry, edited by James M. Richmond35. Alkylene Oxides and Their Polymers, F. E. Bailey, Jr., and Joseph V.
Koleske36. Interfacial Phenomena in Petroleum Recovery, edited by Norman R. Morrow37. Cationic Surfactants: Physical Chemistry, edited by Donn N. Rubingh and
Paul M. Holland38. Kinetics and Catalysis in Microheterogeneous Systems, edited by M. Grätzel
and K. Kalyanasundaram39. Interfacial Phenomena in Biological Systems, edited by Max Bender40. Analysis of Surfactants, Thomas M. Schmitt (see Volume 96)41. Light Scattering by Liquid Surfaces and Complementary Techniques, edited
by Dominique Langevin42. Polymeric Surfactants, Irja Piirma43. Anionic Surfactants: Biochemistry, Toxicology, Dermatology. Second Edition,
Revised and Expanded, edited by Christian Gloxhuber and Klaus Künstler44. Organized Solutions: Surfactants in Science and Technology, edited by Stig
E. Friberg and Björn Lindman45. Defoaming: Theory and Industrial Applications, edited by P. R. Garrett46. Mixed Surfactant Systems, edited by Keizo Ogino and Masahiko Abe47. Coagulation and Flocculation: Theory and Applications, edited by Bohuslav
Dobiáð48. Biosurfactants: Production · Properties · Applications, edited by Naim Ko-
saric49. Wettability, edited by John C. Berg50. Fluorinated Surfactants: Synthesis · Properties · Applications, Erik Kissa51. Surface and Colloid Chemistry in Advanced Ceramics Processing, edited by
Robert J. Pugh and Lennart Bergström52. Technological Applications of Dispersions, edited by Robert B. McKay53. Cationic Surfactants: Analytical and Biological Evaluation, edited by John
Cross and Edward J. Singer54. Surfactants in Agrochemicals, Tharwat F. Tadros55. Solubilization in Surfactant Aggregates, edited by Sherril D. Christian and
John F. Scamehorn56. Anionic Surfactants: Organic Chemistry, edited by Helmut W. Stache57. Foams: Theory, Measurements, and Applications, edited by Robert K. Prud'-
homme and Saad A. Khan58. The Preparation of Dispersions in Liquids, H. N. Stein59. Amphoteric Surfactants: Second Edition, edited by Eric G. Lomax60. Nonionic Surfactants: Polyoxyalkylene Block Copolymers, edited by Vaughn
M. Nace61. Emulsions and Emulsion Stability, edited by Johan Sjöblom62. Vesicles, edited by Morton Rosoff63. Applied Surface Thermodynamics, edited by A. W. Neumann and Jan K.
Spelt64. Surfactants in Solution, edited by Arun K. Chattopadhyay and K. L. Mittal65. Detergents in the Environment, edited by Milan Johann Schwuger

66. Industrial Applications of Microemulsions, edited by Conxita Solans andHironobu Kunieda
67. Liquid Detergents, edited by Kuo-Yann Lai68. Surfactants in Cosmetics: Second Edition, Revised and Expanded, edited by
Martin M. Rieger and Linda D. Rhein69. Enzymes in Detergency, edited by Jan H. van Ee, Onno Misset, and Erik J.
Baas70. Structure-Performance Relationships in Surfactants, edited by Kunio Esumi
and Minoru Ueno71. Powdered Detergents, edited by Michael S. Showell72. Nonionic Surfactants: Organic Chemistry, edited by Nico M. van Os73. Anionic Surfactants: Analytical Chemistry, Second Edition, Revised and
Expanded, edited by John Cross74. Novel Surfactants: Preparation, Applications, and Biodegradability, edited by
Krister Holmberg75. Biopolymers at Interfaces, edited by Martin Malmsten76. Electrical Phenomena at Interfaces: Fundamentals, Measurements, and Ap-
plications, Second Edition, Revised and Expanded, edited by Hiroyuki Oh-shima and Kunio Furusawa
77. Polymer-Surfactant Systems, edited by Jan C. T. Kwak78. Surfaces of Nanoparticles and Porous Materials, edited by James A.
Schwarz and Cristian I. Contescu79. Surface Chemistry and Electrochemistry of Membranes, edited by Torben
Smith Sørensen80. Interfacial Phenomena in Chromatography, edited by Emile Pefferkorn81. Solid–Liquid Dispersions, Bohuslav Dobiáð, Xueping Qiu, and Wolfgang von
Rybinski82. Handbook of Detergents, editor in chief: Uri Zoller
Part A: Properties, edited by Guy Broze83. Modern Characterization Methods of Surfactant Systems, edited by Bernard
P. Binks84. Dispersions: Characterization, Testing, and Measurement, Erik Kissa85. Interfacial Forces and Fields: Theory and Applications, edited by Jyh-Ping
Hsu86. Silicone Surfactants, edited by Randal M. Hill87. Surface Characterization Methods: Principles, Techniques, and Applications,
edited by Andrew J. Milling88. Interfacial Dynamics, edited by Nikola Kallay89. Computational Methods in Surface and Colloid Science, edited by Maù-
gorzata Borówko90. Adsorption on Silica Surfaces, edited by Eugène Papirer91. Nonionic Surfactants: Alkyl Polyglucosides, edited by Dieter Balzer and
Harald Lüders92. Fine Particles: Synthesis, Characterization, and Mechanisms of Growth,
edited by Tadao Sugimoto93. Thermal Behavior of Dispersed Systems, edited by Nissim Garti94. Surface Characteristics of Fibers and Textiles, edited by Christopher M.
Pastore and Paul Kiekens95. Liquid Interfaces in Chemical, Biological, and Pharmaceutical Applications,
edited by Alexander G. Volkov

96. Analysis of Surfactants: Second Edition, Revised and Expanded, Thomas M.Schmitt
97. Fluorinated Surfactants and Repellents: Second Edition, Revised and Ex-panded, Erik Kissa
98. Detergency of Specialty Surfactants, edited by Floyd E. Friedli99. Physical Chemistry of Polyelectrolytes, edited by Tsetska Radeva
100. Reactions and Synthesis in Surfactant Systems, edited by John Texter101. Protein-Based Surfactants: Synthesis, Physicochemical Properties, and Ap-
plications, edited by Ifendu A. Nnanna and Jiding Xia102. Chemical Properties of Material Surfaces, Marek Kosmulski103. Oxide Surfaces, edited by James A. Wingrave104. Polymers in Particulate Systems: Properties and Applications, edited by Vin-
cent A. Hackley, P. Somasundaran, and Jennifer A. Lewis105. Colloid and Surface Properties of Clays and Related Minerals, Rossman F.
Giese and Carel J. van Oss106. Interfacial Electrokinetics and Electrophoresis, edited by Ángel V. Delgado107. Adsorption: Theory, Modeling, and Analysis, edited by József Tóth108. Interfacial Applications in Environmental Engineering, edited by Mark A.
Keane109. Adsorption and Aggregation of Surfactants in Solution, edited by K. L. Mittal
and Dinesh O. Shah110. Biopolymers at Interfaces: Second Edition, Revised and Expanded, edited by
Martin Malmsten111. Biomolecular Films: Design, Function, and Applications, edited by James F.
Rusling112. Structure–Performance Relationships in Surfactants: Second Edition, Re-
vised and Expanded, edited by Kunio Esumi and Minoru Ueno
ADDITIONAL VOLUMES IN PREPARATION
Liquid Interfacial Systems: Oscillations and Instability, Rudolph V. Birikh,Vladimir A. Briskman, Manuel G. Velarde, and Jean-Claude Legros
Novel Surfactants: Preparation, Applications, and Biodegradability: SecondEdition, Revised and Expanded, edited by Krister Holmberg
Colloidal Polymers: Preparation and Biomedical Applications, edited by Ab-delhamid Elaissari
Preface
Chromatography is largely employed in characterization and separation methodsin the biomedical, industrial, and environmental domains, and the technical devel-opment has called for diversified detection and analysis procedures. Concerningprinciples, the major efforts to improve separation efficiency have been directedto (1) the establishment of specific interactions between groups of the stationaryphase and groups belonging to molecules present in the mobile phase and (2)the elimination of all specific interactions between constituents of the stationaryphase and those of the mobile phase. A great number of books and reviews havebeen devoted to the improvement of chromatographic stationary phases.
The present book is aimed at the presentation of different chromatographymethods in which interactions between the stationary and mobile phases are em-ployed to enhance and/or control separation selectivity. Obviously, separationrequires the stationary phase to be well characterized from the physicochemicaland structural viewpoints.
The principles of gas chromatography are presented first to show the multiplic-ity of information on the gas–solid interaction provided by the use of the viralcoefficient theory. Since efficient separation requires the best adhesion (adsorp-tion, retention, etc.) of the solute in the stationary phase, inverse gas chromatogra-phy has been directed toward the optimization of the properties of fibers andfillers for reinforced materials, but it may serve as a convenient technique forcharacterization of stationary phases used in liquid chromatography. Inverse gaschromatography has been applied to fibers and fillers in order to determine thedifferent components of their surface free energy. It has been employed to deter-mine the modifications resulting from chemical surface treatments of natural and
iii

iv Preface
synthetic fibers as well to detect the particularities of amorphous and crystallinepowders. General and particular results are presented and discussed in Part I.
Interaction phenomena in liquid chromatography have been found to be effi-cient in the separation of colloids and solutes as a function of size and chemicalnature. Interfacial interactions between silica and solutes have been suppressedthrough adsorption and grafting methods to allow for the use of silica beads insize exclusion chromatography. The separation efficiency of the inverse method,which is based on the development of strong or solvent-modulated solid–soluteinteractions, has been tested. In Part II, as in Part I, general and particular aspectsof the different methods are presented.
The book presents results related to the less explored possibilities offered byestablishing and/or designing interfacial phenomena in chromatography. Separa-tion processes in industrial and biomedical applications are expected to benefitgreatly from these new methods, and environmental areas requiring better deter-mination of the multiple selective interactions of gaseous and liquid species withsoil constituents should also benefit.
Emile Pefferkorn

Contents
Preface iiiContributors vii
Part I Stationary Phase Characteristics
1. Henry’s Law Behavior in Gas–Solid Chromatography: A VirialApproach 1Thomas R. Rybolt and Howard E. Thomas
2. Inverse Gas Chromatography as a Tool to Characterize Dispersive andAcid–Base Properties of the Surface of Fibers and Powders 41Mohamed Naceur Belgacem and Alessandro Gandini
3. Interactions in Cellulose-Polyethylene Papers as Obtained ThroughInverse Gas Chromatography 125Bernard Riedl and Halim Chtourou
4. Inverse Gas Chromatography: A Method for the Evaluation of theInteraction Potential of Solid Surfaces 145Eugene Papirer and Henri Balard
Part II Characterization and Separation Methods
5. Chromatography of Colloidal Inorganic Nanoparticles 173Christian-Herbert Fischer
v
vi Contents
6. Chromatographic Behavior and Retention Models of PolyaromaticHydrocarbons in HPLC 227Yu. S. Nikitin and S. N. Lanin
7. Polymer-Modified Silica Resins for Aqueous Size ExclusionChromatography 263Yoram Cohen, Ron S. Faibish, and Montserrat Rovira-Bru
8. Polycation-Modified Siliceous Surfaces for Protein Separations 311Yingfan Wang and Paul L. Dubin
9. Adsorption Processes in Surface Area Exclusion Chromatography 329Emile Pefferkorn, Abdelhamid Elaissari, and Clarisse Huguenard
10. Separation of Polymer Blends by Interaction Chromatography 387Harald Pasch
Index 435

Contributors
Henri Balard Institute of Chemistry of Surfaces and Interfaces, French Na-tional Center of Scientific Research, ICSI–CNRS, Mulhouse, France
Mohamed Naceur Belgacem Department of Paper Science and Technol-ogy, University of Beira Interior, Covilha, Portugal
Halim Chtourou* Department of Wood Science, CERSIM, Laval University,Quebec City, Quebec, Canada
Yoram Cohen Department of Chemical Engineering, University of Califor-nia, Los Angeles, Los Angeles, California
Paul L. Dubin Department of Chemistry, Indiana University—Purdue Uni-versity, Indianapolis, Indiana
Abdelhamid Elaissari Chemistry of Supports, CNRS–Biomerieux (UMR-103), Lyon, France
Ron S. Faibish Department of Chemical Engineering, University of Califor-nia, Los Angeles, Los Angeles, California
* Current affiliation: Retec Inc., Granby, Quebec, Canada.
vii
viii Contributors
Christian-Herbert Fischer Department of Solid State Physics, Hahn-Meitner-Institut Berlin, Berlin, Germany
Alessandro Gandini Department of Polymeric Materials, Ecole Francaisede Papeterie et des Industries Graphiques, St. Martin d’Heres, France
Clarisse Huguenard Laboratoire RMN et Chimie du Solide, UniversiteLouis Pasteur, Strasbourg, France
S. N. Lanin Department of Chemistry, M. V. Lomonosov State University ofMoscow, Moscow, Russia
Yu. S. Nikitin Department of Chemistry, M. V. Lomonosov State Universityof Moscow, Moscow, Russia
Eugene Papirer Institute of Chemistry of Surfaces and Interfaces, FrenchNational Center of Scientific Research, ICSI–CNRS, Mulhouse, France
Harald Pasch Department of Polymer Analysis, German Plastics Institute,Darmstadt, Germany
Emile Pefferkorn Institut Charles Sadron, Strasbourg, France
Bernard Riedl Department of Wood Science, CERSIM, Laval University,Quebec City, Quebec, Canada
Montserrat Rovira-Bru Department of Chemical Engineering, University ofCalifornia, Los Angeles, Los Angeles, California
Thomas R. Rybolt Department of Chemistry, University of Tennessee atChattanooga, Chattanooga, Tennessee
Howard E. Thomas Department of Chemistry, Erskine College, Due West,South Carolina
Yingfan Wang Department of Chemistry, Indiana University—Purdue Uni-versity, Indianapolis, Indiana

1Henry’s Law Behavior in Gas–SolidChromatography: A Virial ApproachTHOMAS R. RYBOLT Department of Chemistry, University of Tennesseeat Chattanooga, Chattanooga, Tennessee
HOWARD E. THOMAS Department of Chemistry, Erskine College,Due West, South Carolina
I. Introduction 2
II. Theoretical Background 3A. Adsorption and the second gas–solid virial coefficient 3B. Gas–solid chromatography 4C. Flat single-surface model 6D. Flat two-surface model 7E. Parallel plate model 8F. Cavity model 9
III. Experimental 12A. Apparatus 12B. Experimental considerations 13C. Data collection 15D. Conversion to B2s 16
IV. Analysis and Discussion 18A. Single-surface approach 18B. Two-surface approach 20C. Cavity model 26D. Comparison of flat, parallel plate, and cavity models 30E. Correlations with other physical properties 33
References 37
1

2 Rybolt and Thomas
I. INTRODUCTION
Changes in the distribution of molecules between the gas and adsorbed phasesas a function of pressure and temperature have been used for many years to studysurface area, surface structure, and gas–solid interactions. Gas–solid chromatog-raphy provides a useful alternative to conventional adsorption experiments andcan serve as a method to study these aspects of physical adsorption.
In the virial coefficient treatment of physical adsorption, the moles of gasadsorbed per gram of adsorbent, na, are related to the second gas–solid virialcoefficient, B2s, which is a measure of the interaction of isolated gas mole-cules with a solid surface. Adsorption isotherms or gas chromatographic reten-tion times measured in the Henry’s law region of low adsorption can be usedto provide values of second gas–solid virial coefficients. In this chapter we willexplore the theoretical basis of the second gas–solid virial coefficient, how thesevalues are determined from gas–solid chromatography experiments, and howan analysis of these values and their temperature dependence for various ad-sorbate gases can provide adsorbent structural information, solid surface areas,and measures of gas–surface interactions. In addition, we will examine howretention times and B2s values can be correlated with other physical or structuralproperties.
In the pulse flow technique, a gas or vapor is injected into a flowing carriergas. The adsorbate flows through a powder-packed column, and molecules aredistributed between an adsorbed form and the gas phase. The retention time de-pends on the magnitude of the equilibrium between the adsorbed and free formsof the adsorbate. As we shall see in the theory section, the second gas–solidvirial coefficient depends on the corrected flow rate of the carrier gas through thecolumn, the retention time of the sample gas measured relative to a noninteractingreference gas, and the mass of powder in the column.
The virial coefficient treatment of physical adsorption was developed primar-ily by Steele and Halsey [1] and others [2–4], discussed by Steele [5], and thor-oughly reviewed by Pierotti and Thomas [6] who covered the exact statisticalthermodynamic basis of this approach. The importance of a Henry’s law approachto studies of surface heterogenity has been discussed by Bakaev and Chelnokova[7]. An excellent review of the historical background and approaches used in avirial analysis of adsorption is provided by Rudzinski et al. [8]. Although mostearly work used volumetric or gravimetric adsorption techniques, chromato-graphic studies included work by Boucher and Everett [9], Rudzinski et al. [10],and Ross et al. [11].
Since the introduction of the virial coefficient theory [1–4], continued atten-tion has been given to physical adsorption and the application of the virial coeffi-cient theory [8,12–14]. Adsorption in micropores has been studied at variouspressures and temperatures [15,16], and the size and shape of the micropores

Henry’s Law Behavior in GSC 3
[17–20], as well as their formation and structure [21,22], have also been studied.Virial coefficients have been used to analyze experimental data [23,24], and cal-culations have been carried out to compare the adsorption in slit-like pores toflat surfaces and to find surface areas and volumes of the solids [25]. Other studieshave been conducted to analyze Henry’s law constant [7] and the energy aspectsof adsorption [24,26,27].
A variety of studies have used gas–solid chromatography to determine secondor second and third virial coefficients for gases interacting with solid surfaces[10,28–37]. Other studies have examined the theoretical basis of the virial ap-proach or used traditional adsorption experiments to determine virial coefficientsor Henry’s law constants [8,24,38–52]. The use of gas chromatography to deter-mine equilibrium properties and second virial coefficients for gases was reviewedby Conder [45]. Gas–solid chromatography has been used by Rybolt and Thomasto determine B2s values, find powder surface areas, specify the gas–solid interac-tion energies, determine structural parameters for microporous solids, determinethe relative amounts of higher and lower energy surfaces on two-surface solids,and correlate B2s values or adsorption energies obtained from B2s values withother molecular physical properties [28,29,32,37,53].
II. THEORETICAL BACKGROUND
A. Adsorption and the Second Gas–Solid VirialCoefficient
A virial approach to physical adsorption and gas–solid chromatography is basedon the following equation:
na i1
Bi1, s( f /RT)i (1)
where na is the moles of gas (adsorbate) adsorbed per gram of solid adsorbent,f is the fugacity, R is the gas constant, T is the temperature, and Bi1, s is the(i 1)th gas–solid virial coefficient [6]. B2s represents the interaction of oneadsorbate molecule with the surface, B3s represents a pair of gas molecules inter-acting with each other and the surface, B4s represents a triplet of adsorbate mole-cules, and so forth. In the Henry’s law region of adsorption where only a smallportion of the surface is covered with adsorbate, the adsorbate–adsorbate interac-tion is negligible and the higher order terms drop out of the power series in theprevious equation.
As the pressure, P, approaches zero, Eq. (1) may be simplified and writtenas [6]:
na B2s(P/RT) (2)
4 Rybolt and Thomas
B2s values vary with temperature and contain information about the structure ofthe solid as well as the strength and nature of the gas–solid interactions. Theprobably more familiar Henry’s law constant, KH, relates pressure to moles ad-sorbed as na KH P where B2s/RT KH. As we shall show in this chapter, B2s
values have an exact definition based on statistical thermodynamic considerationsthat make them useful in analyzing gas–solid interactions.
In order to extract the maximum amount of information about a solid, it isnecessary to have adsorption data or gas chromatographic data for several differ-ent adsorbates over a range of temperature. Sets of B2s–temperature pairs forvaried gases on a particular adsorbent can be generated from careful experimentalmeasurements of corrected retention times, corrected flow rates, and the mass ofthe powder in the packed column.
Experimental values of B2s are related to the surface structure and gas–solidinteraction through the integral expression:
B2s V
[exp(u1s/kT) 1]dV (3)
u1s is the gas–solid interaction potential, k is the Boltzmann constant, and dV isthe volume element in the gas phase [5]. Note that B2s values may be calculatedfrom Henry’s law constants but have the useful feature of being related to thegas–solid interact potential by an exact statistical thermodynamic derivation[5,6]. Approximations enter into the equation only as one develops specific equa-tions to represent u1s.
Given the functional form of u1s and the appropriate parameters to characterizethe solid surface and gas–solid interaction, one can calculate B2s values and pre-dict adsorption and chromatographic data. However, the approach discussed be-low is based on the availability of experimental B2s data and the desire to extractgas–solid molecular parameters from these data. In the following sections, wewill show how B2s is related to chromatographic retention times and focus onfour different models that have been used to represent the gas–solid interaction.These models are by necessity simplified versions of the surface structure butcan nevertheless provide useful data and insights into unique methods to calculatesurface area, surface structural parameters, and gas–solid interaction parameters.The theoretical equations for the flat single-surface, flat two-surface, cavity, andparallel plate models are presented in this section while applications are presentedlater, in the analysis section.
B. Gas–Solid Chromatography
The diffusion of an adsorbate pulse transported through an adsorbent packedcolumn by an inert carrier gas stream is given by [11,54–56]:
ngc/nac L/tv (4)

Henry’s Law Behavior in GSC 5
where ngc is the moles of the unadsorbed gas in the column, nac is the moles ofadsorbed gas in the column, L is the length of the powder packed column, v isthe interstitial gas velocity, and t is the retention time of the adsorbate pulse.Eberly and Spencer [56] showed that the previous equation is the solution to thelinear partial differential equation that describes the mass conservation betweenthe adsorbed and desorbed or free phases in a pulse flow system where theGaussian distribution is approximated by an infinitesimally narrow pulse. Rosset al. [11] showed that Eq. (4) may be rewritten as:
ngc/nac Vg/tF1 (5)
where F1 is the actual flow through the column and Vg is the interstitial volumein the column. Using the ideal equation of state to model the adsorbate gas gives:
Vg ngc RT1/P1 (6)
where P1 is the average pressure of the sample gas in the packed column, R isthe gas constant, and T1 is the column temperature.
In the Henry’s law region, the virial equation of state for adsorption from Eq.(2) may be written as:
nac mB2s(P1/RT1) (7)
since nac mna where m is the mass of powder in the packed column and na
is the moles of sample gas (adsorbate) adsorbed per gram of solid adsorbent.Substituting Eq. (6) and Eq. (7) into Eq. (5) gives:
B2s tF1/m (8)
The adsorbate retention time is given by
t ts tm (9)
where tm is the time from injection to detection of pulse maximum of suitablemarker gas with negligible gas–solid interaction and ts is the time from injectionto detection of pulse maximum of sample gas. This subtraction corrects the sam-ple pulse time to the residence time, t, that arises due to sample gas adsorptionin the column.
Since the measured flow rate, Fm, is determined outside the column, it is neces-sary to calculate F1 from Fm. The corrections to the measured flow rate must takeinto account the pressure drop across the column, outlet and atmosphere pressuredifference in the flow meter, and the temperature of the column compared to theflow meter temperature. The corrected column flow rate, F1, is given by:
F1 1.5 Fm(T1/Tf)(Po /Pa)[(Pi/Po)2 1]/[(Pi /Po)3 1] (10)
where Pi is the inlet pressure, Po is the outlet pressure, Pa is the atmosphericpressure, and Tf is the temperature of the flow meter [57–59].

6 Rybolt and Thomas
Equations (8)–(10) can be used in conjunction with experimental measure-ments to obtain values of the second gas–solid virial coefficient for differentadsorbates over a range of temperature for a variety of solid adsorbents. In theremainder of this section, we will show how these values of B2s may be expressedin terms of gas–solid energetic and solid structural parameters.
C. Flat Single-Surface Model
Since we are limiting our consideration to physical adsorption due to van derWaals interaction [60], we do not need to consider the formation of chemicalbonds. We will limit our work to nonspecific intermolecular forces and use thesimplest possible potential to describe the adsorbate–adsorbent interactions. TheLennard-Jones (m, n) potential has been used to represent gas–gas as well asgas–solid interactions. While various simple potentials can be used to representthe interaction of a molecule with a solid, we are concerned with obtaining fromthermodynamic adsorption data a set of simple parameters that can be used tocharacterize the gas–solid interaction potential and solid surface and used to pre-dict B2s values. For these purposes, a Lennard-Jones (m, n) potential has provenadequate [52].
For the special case of a flat, uniform surface, the relation between B2s andthe gas–solid interaction potential in Eq. (3) can be expressed as:
B2s A z[exp(u1s(z)/kT ) 1]dz (11)
where A is the area of the surface, z is the axis normal to the surface plane, andu1s(z) is the gas–solid interaction potential as the gas molecule approaches thesurface [5,6]. For computational purposes, it is more convenient to express thisintegral as:
B2s Az* y
[exp(u1s(y)/kT ) 1]dy (12)
given in the terms of the reduced distance, y, where y (z/z*) and z* is theequilibrium distance of the center of the adsorbate molecule to the nuclei of theoutermost atoms of the flat surface [48].
If a Lennard-Jones (m, n) potential is assumed between the adsorbate and thesurface, then the equilibrium separation can be expressed as
z* (n/m)1/(nm)z0 (13)
where z0 is the adsorbate–adsorbent or gas–solid distance of closest approachwhere u1s, is equal to zero. The gas–solid interaction potential, u1s, is definedby a Lennard-Jones potential as [50]:

Henry’s Law Behavior in GSC 7
u1s(y)/k E*[n/(n m)](n/m)[m/(nm)]
yn(n/m)[n/(mn)] ym(n/m)[m/(mn)](14)
where ε*1s is the depth of the gas–solid interaction potential at equilibrium separa-tion and E* is the interaction energy or depth of the gas–solid potential well atequilibrium separation in temperature units (E* ε*1s/k).
To evaluate the integral in Eq. (12) and calculate B2s it is necessary to specifythe parameters m, n, E*, T, A, and z*. Notice that if B2s can be calculated thenthe retention time for an adsorbate peak also can be calculated using Eq. (8) andEq. (9). Alternatively, if retention times are measured using gas–solid chromatog-raphy then Eq. (8) and Eq. (9) can be used to determine B2s at various tempera-tures. Given an appropriate selection for n and m, B2s values can be used to findz*, E*, and the surface area A. Hence, gas–solid chromatography combined witha virial approach provides a useful means to study gas–solid interactions andsurface properties.
In general, we may represent the combination of Eq. (12) and Eq. (14) as:
B2s Az* I(E*, T) (15)
where A is the area, z* is the equilibrium separation between the adsorbate andadsorbent surface, E* is the interaction energy divided by the Boltzmann con-stant, T is the temperature and I(E*, T ) is an integral function of T and E* [3,5,6].Az* should not vary with temperature. Using experimental values of B2s at differ-ent temperatures one can find the best value of E* such that Az* is the mostconsistent as the temperature is varied because Az* B2s /I(E*, T). To avoidsize bias the best-fit interaction energy, E*, is selected to minimize the value ofthe standard deviation of log(Az*) for a given adsorbate. Examples of this ap-proach will be provided in Section IV of this chapter.
D. Flat Two-Surface Model
In the two-surface approach, the experimental second gas–solid virial coefficient,B2s, can be separated into two additive contributions:
B2s B12s B2
2s (16)
where B12s and B2
2s are the second gas–solid virial coefficients for surface one andsurface two, respectively. Surface two has an interaction energy, E*2 , which isgreater than the surface one interaction energy, E*1 . Er is the ratio of the gas–solid interaction energies (Er E*2 /E*1 ) [61]. This relation in combination withEq. (15) gives:
B2s(T ) A1z*I1(E*1 , T) A2 z* I2(E*2 , T) (17)

8 Rybolt and Thomas
where the total surface area, A, is the sum of A1 the lower energy surface areaand A2 the higher energy surface area [61].
If x is defined as the percentage of the area for surface two, then A1 (1 x)A and A2 xA, and
Az* B2s(T )/[(1 x)I1(E*1 , T) xI2(E*2 , T )] (18)
Each of the integral functions above is defined by Eq. (12) and Eq. (14). SinceAz* is not dependent on temperature, the best-fit interaction energy, E*1 , can befound to minimize the value of the standard deviation of log(Az*) for a givenadsorbate provided the values of x and Er are known or selected. For the samesolid adsorbent with different gases as adsorbates, both the ratio of E*2 to E*1 ,Er , and the surface area, A, should be constant because these parameters dependon the surface structure of the adsorbent and not the adsorbate [50].
Since the surface area is independent of the gas used, x and Er may be deter-mined by finding the minimum value of the standard deviation of the log ofsurface area, SD(log A), of all the gas systems combined. Analysis using thetwo-surface model uses numerical integration and iterative algorithms to scan arange of x and Er values. Because the value n 16 gave a more consistent fitof monatomic gases on P33 carbon than any lower value of n [52], generally aLennard-Jones [3,16] potential has been used in our work to represent the gas–solid interaction potential. Although the repulsive potential value is strictly em-pirical, the value m 3 has a theoretical basis related to the van der Waalsinteraction of an adatom with a solid [52].
E. Parallel Plate Model
The integral expression for B2s may be adapted to represent specific adsorbentsurfaces. For a parallel plate model, B2s can be expressed as:
B2s A ∫ [e(u1s(r)/kT) 1]dr (19)
where A is the surface area of one of the parallel plates and r is the internuclearseparation between the adsorbate and the center of the pore. For an adsorbentsurface composed of slit-like pores, this model represents the surface structureas two flat parallel plates. Using this model, B2s can now be expressed as:
B2s 2aA ∫ [e(u1s(y)/kT ) 1]dy (20)
where y is a reduced variable that represents the separation between the adsorbateand the center of the pore (y r/a) and 2a is the separation between the parallelplates [49]. The limits of integration, originally a to a in Eq. (19), were changedto 1 to 1 and then to 0 to 1 by taking advantage of the symmetry between theparallel plates and by introducing a 2 in front of the integral as shown in Eq. (20).

Henry’s Law Behavior in GSC 9
The distance from the molecule to the closer plate is expressed as a r, wherea is half the distance between the two plates and r is the distance from the mole-cule to the center between the plates. The distance from the molecule to thefarther plate is then expressed as a r. The two interaction potentials can beexpressed as:
u1s(a r)/k E*[n/(n m)][n/m][m/(nm)]
[n/m][n/(mn)] [r*/(a r)]n (21)
[n/m][m/(mn)] [r*/(a r)]m
u1s(a r)/k E*[n/(n m)][n/m][m/(nm)]
[n/m][n/(mn)] [r*/(a r)]n (22)
[n/m][m/(mn)] [r*/(a r)]m
where n is the repulsive power, m is the attractive power, E* is the potential atthe equilibrium distance, and r* is the equilibrium distance from the moleculeto the closer plate [49]. The combined interaction potential, u1s, is the sum ofEq. (21) and Eq. (22).
At equilibrium, the distance to the closer plate is given as a r r* andto the more distant plate as a r 2a r*. Therefore the interaction potentialsat equilibrium separation can be expressed as the sum of the closer w1(r*) andmore distant w2(2a r*) potentials, and are combined to give:
[w1(r*) w2(2a r*)]/k E*[n/(n m)][n/m][m/(nm)]
[n/m][n/(mn)] 1 [1/(2V* 1)]n (23)
[n/m][m/(mn)] 1 [1/(2V* 1)]m
where the reduced variable, V* a/r*, is used [49]. Equation (23) is used foru1s/k when the adsorbate is at the equilibrium separation from the closer plate.
Once specific n and m values have been selected, the parallel plate model maybe represented as:
B2s 2aAIp(E*, V*, T ) (24)
where Ip is the parallel plate model integral using Eqs. (21)–(23).
F. Cavity Model
Stroud et al. [62] suggested that the Lennard-Jones and Devonshire (LJD) celltheory of fluids [63,64] is appropriate to model the behavior of an isolated ad-sorbate molecule inside a cavity (such as a zeolite cavity). Consider an adsorbent

10 Rybolt and Thomas
that is composed of a collection of identical cavities. In this case, the secondgas–solid virial coefficient may be written as:
B2s Ns b2s (25)
where b2s is the virial coefficient for a single cavity and Ns is the number ofcavities per gram of adsorbent [51]. Using the LJD theory, b2s may be writtenas:
b2s exp(w(0)/kT) a
0exp[(w(r) w(0))/kT]4πr 2dr (26)
where a is the radius of the spherical cavity, w(0) is the average potential at thecenter of the cavity, r is the distance of the center of the adsorbate molecule fromthe center of the cavity, and w(r) is the average of the adsorbate potential whenthe adsorbate is at a distance r from the center of the cavity [65,66].
Note that the previous equation is analogous to Eq. (3) but the 1 term isnot included. The strong gas–solid interaction term for cavity interaction wherethe adsorbent surrounds the adsorbate gas makes it possible to ignore this termand simplify the expression. In the noble gas–13X zeolite analysis reported laterin this chapter, the work was duplicated with and without the 1 term and thedifference was found to be insignificant. As in previous work [62], we also ignorethe 1 term in the cavity model.
Lattice summation calculations of Derrah and Ruthven [67] have shown thatthe assumption of a spherical cavity is reasonable for gas–zeolite interactions.Since the LJD cell theory assumes that the liquid nearest neighbors are in fixedpositions surrounding one moving liquid molecule, the LJD cell theory is actuallymore appropriate for the gas–solid cavity system than for a liquid. To apply thistheory, we need to express the integral in the previous equation in parametersthat can represent the structure of the cavity and the energy of the gas–cavityinteraction.
If the Lennard-Jones [6,12] potential is used to represent the pairs of gas atomand cavity atom interaction, the potential w(r) can be written as:
w(r) ε*1sπ
0[(r*/R)12 2(r*/R)6][sin θ/2]dθ (27)
where ε*1s is the adsorbate molecule–cavity interaction energy at equilibrium sep-aration, r* is the equilibrium separation between the center of the adsorbate mole-cule and the atoms forming the interior wall of the cavity, θ is the angle usedto define the position of the adsorbate relative to a line of length a from the centerof the cavity to the nucleus of a cavity wall atom, and R is the adsorbate center–cavity wall atom nucleus separation given by R2 r 2 a2 2 arc cos θ [68].

Henry’s Law Behavior in GSC 11
An evaluation of Eq. (26) and Eq. (27) [51,65,66,69] gives:
w(0) ε*1s[(V*)4 2(V*)2] (28)
w(r) w(0) ε*1s[(V*)4 L(y) 2(V*)2 M(y)] (29)
where y, the reduced distance, is
y (r/a)2 (30)
V* reduced volume is
V* (a/r*)3 (31)
L(y) (1 12y 25.2y2 12y3 y4)(1 y)10 1 (32)
and
M(y) (1 y)(1 y)4 1 (33)
The interaction potential at equilibrium separation, w(r*), is given by
w(r*) ε*1s(1/20)V*11/3 [(1 V*1/3)10 (1 V*1/3)10]
(1/4)V*5/3 [(1 V*1/3)4 (1 V*1/3)4](34)
Changing the variable from r to the reduced variable y in Eq. (26), using thereduced volume, V*, in Eq. (31), substituting Eq. (28) and Eq. (29) into Eq. (26),and finally substituting into Eq. (25), gives:
B2s cIc(E*, V*, T) (35)
c 2πa3Ns (36)
and
Ic(E*, V*, T ) exp(E*/T )[V*4 2V*2]
1
0exp(E*/T )[V*4 L(y) 2V*2 M(y)]y1/2 dy
(37)
where a is the radius of the spherical cavity, Ns is the number of cavities pergram of adsorbent, and Ic(E*, V*, T) is an integral dependent on E*, V*, andT as shown above.
To evaluate Eq. (35), it is necessary to carry out a numerical integration wherethe parameters V* and E* are specified. If a best choice can be made for theseparameters, then a value of the constant c (independent of temperature and ad-sorbate) is found from c B2s/Ic(E*, V*, T ). If a value for r* can be estimatedbased on the size of the adsorbate molecule and adsorbent surface atoms, thena can be found from V* and Eq. (31). Finally Ns can be calculated from valuesof a, c, and Eq. (36).

12 Rybolt and Thomas
The cavity model potential is based on an integral summation of pairwiseLennard-Jones [6,12] potentials between the adatom and cavity. However, theflat model and parallel plate model are based on a Lennard-Jones [3,16] or otherlarge value of the repulsive parameter n. A summation of adatom–solid atom[6,12] potentials yield a [3,9] potential but a larger repulsive term has been shownto be more appropriate [52].
Finally, it is useful to make the connection between the isosteric heat in thelimit of low coverage, q0
st, the gas–cavity interaction at equilibrium separation,w(r*), and the B2s temperature dependence. Derrah and Ruthven [67] used
q0st RT w(r*) (38)
to determine the isosteric heats of monatomic gases with a 5A zeolite. The isost-eric heat in the limit of low coverage can be given as [6]:
q0st RT R[d ln B2s/d(1/T )] (39)
Combining these two equations allows us to write w(r*) as
|w(r*) | [d ln B2s/d(1/T)] (40)
and using these relationships, a plot of ln B2s versus 1/T can be used to find bothq0
st and w(r*).
III. EXPERIMENTAL
A. Apparatus
Determination of B2s requires accurate experimental measurement of correctedretention time, flow rate, and adsorbent temperature. In addition, in order to cor-rect the flow rate, measurements must be made of room temperature, columninlet pressure, and column outlet pressure.
Retention times are readily and conveniently determined using an electronicintegrator, e.g., a Hewlett-Packard 3392A or later model. Electronic integratorsare useful in that they also provide a measure of the adsorbate sample size which,it will be noted later, is required for some systems.
In a situation that is somewhat unusual for chromatographic measurements,determination of flow rate is as important as retention time. Flow rates havebeen determined using a soap bubble flow meter connected to the exhaust ventof the detector. This method of measurement requires that the detector not affectthe flow rate. The detector that has been used in most studies is the thermalconductivity detector. The more sensitive flame ionization detector cannot beused because it introduces hydrogen and air into gases exiting the column andhence changes the flow rate. Use of the soap bubble flow meter is somewhattedious and for some measurements it could be replaced by a far more convenientelectronic digital flow meter. The electronic flow meter has the advantage of

Henry’s Law Behavior in GSC 13
providing a continuous reading of the flow rate, although it is not quite as preciseas a bubble flow meter.
The room temperature, needed in the correction of flow rates, is the tempera-ture of the soap bubble flow meter. This temperature is conveniently measuredby attaching a mercury thermometer or a calibrated thermocouple to the flowmeter tube at the midpoint of the monitored volume. Measuring the flow rateusing a bubble flow meter saturates the gas from the column with water vapor.A correction is made for this, assuming that the soap solution has a vapor pressurenot significantly different from that of pure water.
It should be mentioned that some modern thermal conductivity detectors workby alternating reference and adsorbent column helium flow through the detector.This type of detector does not allow an accurate measurement of the requiredadsorbent column flow rate.
Correction of the measured room temperature flow rate to a column flow raterequires measurements of the inlet and outlet gas pressures on the chromato-graphic column. The outlet pressure is assumed to be equal to that in the flowmeter, which equals atmospheric pressure less the vapor pressure of water. Baro-metric atmospheric pressure readings are corrected to standard temperature usingavailable barometer temperature correction tables [70]. Some gas chromatogramshave built-in pressure gauges that measure the column head pressure directly ora calibrated electronic pressure gauge can be used. As a simple alternative, adevice to measure the pressure can be made by epoxying a syringe needle to theopen port of a pressure gauge. The pressure can then be measured by insertingthe needle through the septum. This measurement disrupts the gas flow in thesystem, especially if the pressure gauge has a large internal volume, and it cantake some time for the pressure to return to its steady-state value. Because mea-surement disturbs the steady-state system, it should be carried out only after reten-tion time and flow rate measurements have been completed for a particularadsorbate–temperature combination. The measured pressure, or ‘‘septum pres-sure,’’ depends on the carrier gas pressure, the column packing, and the tempera-ture. The inlet pressure equals the septum pressure plus atmospheric pressure.
Ultrapure helium is used as a carrier gas. It is led through a two-stage gasregulator, a 5A molecular sieve drying tube, and a needle value to the injectionport on the gas chromatograph.
B. Experimental Considerations
In early studies, columns were packed with adsorbent in house. However, thesecolumns sometimes gave inconsistent results and occasionally became blocked.Now it is preferable to have the columns packed commercially. Companies suchas Supelco will pack the columns and will also give the mass of adsorbent usedin the packing to 0.01 g.
14 Rybolt and Thomas
Initial outgassing of the adsorbent is carried out under helium flow using themanufacturer’s specifications with regard to temperature gradient and maximumtemperature. During data collection, it is routine to outgas the column overnightunder helium flow.
The easiest method of injecting adsorbate samples is to use a 25-µL gas sy-ringe. Adsorbate gas samples are stored in 250-mL round-bottomed flasks thatare sealed with rubber septa. It is important to be able to vary the amount ofadsorbate injected and it is often the case that very small sample sizes are needed.These goals are achieved by varying the size of sample injected and by varyingthe pressure of adsorbate gas in the storage flask. Adsorbate gas pressure in thestorage flask is varied by initially filling the flask with adsorbate gas and thenadding an inert gas, usually neon, to dilute the adsorbate gas until injections givesample sizes in the right range. An added advantage of this dilution method isthat neon is a convenient marker gas, one that does not interact significantlywith the adsorbent at the temperatures studied. The difference between the pulsemaximum peak of the adsorbate and that of neon gives the corrected retentiontime for the adsorbate. A more sophisticated gas dosing system, which wouldallow a more controlled variation of sample size, would consist of a gas injectionvalve with a vacuum/gas-handling system attached.
In order to conform to the theoretical model used in analysis, the adsorbatechromatographic peaks should be Gaussian in shape. Some systems, particularlythose where the adsorbent has a low surface area or where the corrected retentiontime is long, tend to give non-Gaussian peaks, often characterized by pronounced‘‘tailing’’ of the peaks. It is believed that this phenomenon arises because ofnonequilibrium distribution between the mobile and stationary phases or the ef-fect of surface heterogeneity. These systems have been avoided, either by movingto a higher temperature range or by using another adsorbent.
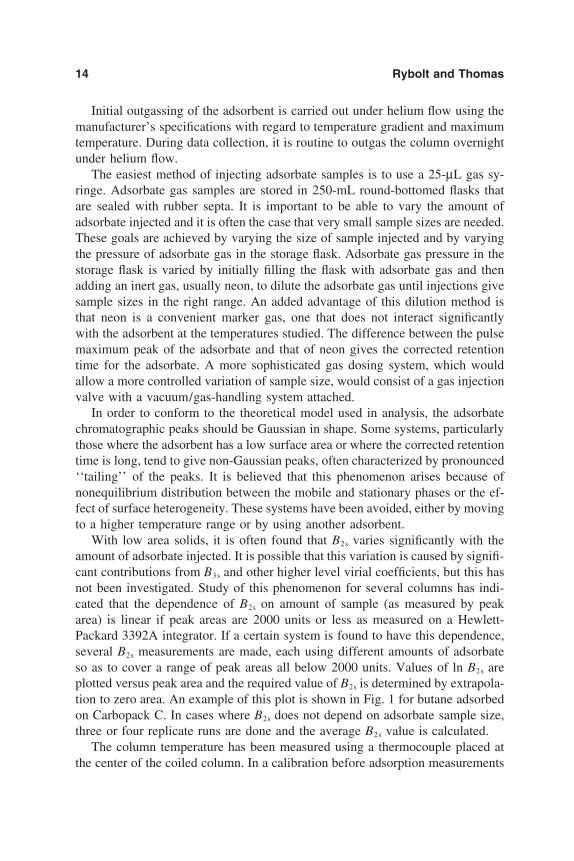
With low area solids, it is often found that B2s varies significantly with theamount of adsorbate injected. It is possible that this variation is caused by signifi-cant contributions from B3s and other higher level virial coefficients, but this hasnot been investigated. Study of this phenomenon for several columns has indi-cated that the dependence of B2s on amount of sample (as measured by peakarea) is linear if peak areas are 2000 units or less as measured on a Hewlett-Packard 3392A integrator. If a certain system is found to have this dependence,several B2s measurements are made, each using different amounts of adsorbateso as to cover a range of peak areas all below 2000 units. Values of ln B2s areplotted versus peak area and the required value of B2s is determined by extrapola-tion to zero area. An example of this plot is shown in Fig. 1 for butane adsorbedon Carbopack C. In cases where B2s does not depend on adsorbate sample size,three or four replicate runs are done and the average B2s value is calculated.
The column temperature has been measured using a thermocouple placed atthe center of the coiled column. In a calibration before adsorption measurements

Henry’s Law Behavior in GSC 15
FIG. 1 Sample size dependence for butane adsorbed on Carbopack C at 398 K. Ln B2s
versus peak area with areas determined from Hewlett-Packard 3392A integrator.
are started, the reading of the thermocouple in the center of the coil is related tothe average temperature of the column obtained by averaging the temperaturemeasured at four points around the coil. In this way, allowance is made for possi-ble temperature variations in the thermostatting oven.
One factor that can compromise measurements very quickly is a leaking sep-tum. The performance of the septa is carefully monitored so that, if possible,septa can be replaced before they fail. Leaking septa result in irreproducible flowrates and retention times and non-Gaussian peaks.
C. Data Collection
Prior to a day’s measurements, the column is outgassed overnight under heliumflow at a temperature at or below the maximum temperature specified for theadsorbent. Most adsorbents have been outgassed at 623 K. The column is de-tached from the detector during this outgassing.
To start a series of runs, the column is connected to the detector and the heliumcarrier gas is set to the required flow rate. The column temperature, detectortemperature, and interface temperature controls are set to their correct values. Toprevent possible condensation, the detector block should be the hottest of theseregions. Initial thermal equilibration takes an hour or more, largely due to theslow heating of the detector block. Subsequently, reequilibration after a columntemperature change takes no more that about 20 min.
16 Rybolt and Thomas
Adsorbate samples are drawn with a gas syringe from the storage flasks andinjected into the gas chromatograph while at the same time the integrator isstarted. Retention times and peak areas are measured for both neon, the markergas, and the adsorbate. After the integrator has completed measurements of theadsorbate peak area, the flow rate is determined by measuring the time taken for10 or 20 mL of gas flow through the soap bubble flow meter. Room temperatureat the flow meter is also recorded as is the column temperature. If B2s is notdependent on sample size, these measurements are repeated two or three timesand an average value computed. If B2s is sample size–dependent then a series ofmeasurements is made at different sample sizes and the value of B2s is determinedby extrapolation to zero, as shown in Fig. 1.
After a series of runs on a given system have been completed, a measurementof septum pressure is taken. This measurement takes about 10 min to equilibrate.The helium pressure at the regulator is kept constant, but the inlet pressure fora given column depends on the column temperature.
If a number of adsorbates are being studied, it is most efficient to run alladsorbates at one temperature before setting the gas chromatograph to anothertemperature. Using mixtures of gases to get two or three B2s values per run hasnot been efficient in our measurements.
When studying the temperature dependence of B2s it is prudent to randomizeselection of temperatures rather than do measurements in order of increasing ordecreasing temperatures. Also, it is prudent to check one of the first measurementstoward the end of data collection to check for the possibility of gradual surfacechanges.
The calculation of B2s can be easily programmed into a computer or hand-held calculator so one may follow the reliability of data as they are collected.
D. Conversion to B2s
Calculation of B2s from laboratory data can best be illustrated by example. Atypical set of raw laboratory data is given below. Here we have chosen to illustratethe calculation using units encountered in typical laboratory measurements ratherthan convert to SI units.
Experimental DataColumn temperature 130.5°CSoap bubble flow time 54.2 s (10.0 mL volume)Retention time of butane 1.153 minRetention time of neon 0.471 minCorrected retention time 0.682 minAtmospheric pressure 742.3 mm HgVapor pressure water 21.1 mm Hg (at 23°C)

Henry’s Law Behavior in GSC 17
Mass of adsorbent 2.96 gRoom temperature 23.0°CSeptum pressure 21.1 psi
Calculation of B2s can be broken down to 10 steps:
1. Temperature correction of measured barometric pressure: (742.3 2.9) 739.4 mm Hg (739.4/760) 14.696 14.298 psi. The 2.9 value is acorrection based on the actual temperature of the barometer and barometrictemperature correction tables for thermal expansion of mercury since pres-sure scale is based on 0°C column of mercury.
2. Calculation of outlet pressure, which equals atmospheric pressure minus thevapor pressure of water, converted to psi: [(739.4 21.1)/760] 14.696 13.89 psi.
3. Calculation of inlet pressure, which equals atmospheric pressure (in psi)plus septum pressure (in psi): 14.298 21.1 35.4 psi.
4. Column temperature: 130.5 273.15 403.7 K; room temperature 23.0 273.15 296.2 K.
5. Flow rate at room temperature 10.00 mL/flow time(s) 10.00/54.2 0.1845 mL/s.
6. Flow rate corrected to column temperature from Eq. (10): 0.1845 (403.7/296.2) 0.2515 mL/s
7. Flow rate corrected for pressure drop across column from Eq. (10): 0.2515 1.5 [(35.4/13.89)2 1]/[(35.4/13.89)3 1] 0.2515 1.5 0.3533 0.1333 mL/s
8. Calculation of B2s for whole sample from Eq. (8): B2s column flow rate corrected retention time 0.1333 mL/s 0.682 min 60 s/min 5.455 cm3 per sample
9. Pressure ratio correction for presence of water vapor in flow meter: 5.455 [(742.3 21.1)]/742.3 5.30 cm3 per sample
10. Calculation of B2s per gram adsorbent 5.30/2.96 1.79 cm3/g
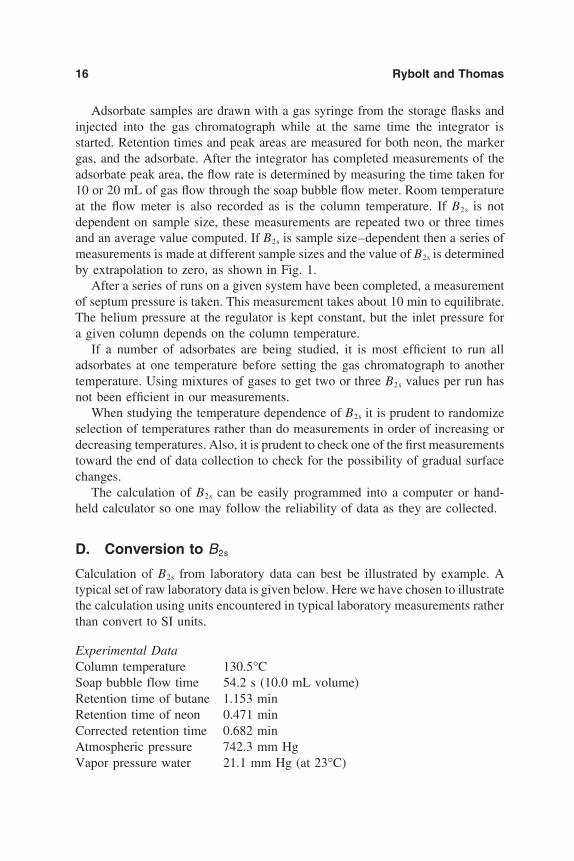
Plots can be made to check the consistency of the data prior to detailed analy-sis. The plot of ln B2s versus 1/T should be linear for a given adsorbate–adsorbentsystem in the temperature ranges that are normally studied. An example of thistype of plot is shown in Fig. 2 where ln B2s values for pentane, butane, propane,and ethane [48] are plotted and linear regressions are produced. The slopes ofthe lines are 2667 K, 3501 K, 4235 K, and 5146 K for ethane, propane, butane,and pentane, respectively. As shown in Eqs. (39) and (40), these slopes are pro-portional to the isosteric heats. A comparison of these values to some other prop-erty to which they should correlate, such as the number of carbon atoms in ahomologous series or possibly the boiling point of the adsorbates, provides auseful check on the consistency of B2s data.
18 Rybolt and Thomas
FIG. 2 For 13X zeolite adsorption ln B2s versus the inverse of temperature for, fromleft to right, pentane, butane, propane, and ethane.
IV. ANALYSIS AND DISCUSSION
A. Single-Surface Approach
In physical adsorption, van der Waals forces are responsible for interactions be-tween gas molecules and solid [60,71]. If only the fluctuating dipole–dipole inter-actions are considered between an adatom and an adsorbent atom, then the attrac-tive portion of the pair potential is inversely related to the sixth power of theatom–atom separation [72]. If the attractive forces are assumed to be pairwiseadditive, the attraction of a single atom or molecule to solid decays as the thirdpower of the adsorbate–adsorbent separation [73].
The repulsive forces do not lend themselves to the straightforward approachoutlined above and the common choice of a Lennard-Jones (6, 12) potential todescribe pairwise interaction in physical adsorption is based primarily on mathe-matical convenience. An adsorbate atom attracted to a solid can be approximatedas a summation of pairwise attractions to all of the atoms in the solid and anintegration considering a semiinfinite solid would result in the conversion of anLJ (6, 12) potential to an LJ (3, 9) potential of adsorbate–solid attraction. Al-though an LJ (3, 9) potential can be used in conjunction with Eqs. (12) and (14)

Henry’s Law Behavior in GSC 19
to model the B2s values [32], given the arbitrary nature of the repulsive potentialthere is no reason to expect this to be the best potential [51].
In previous work [52], an LJ (3, 16) or LJ (3, 17) potential was found to givethe best fit of Ne, Ar, Kr, and Xe B2s values adsorbed on the graphitized carbonblack P33 (2700). The gas–solid interaction energies were also found using amodified Buckingham potential, which uses an exponential decay. The Lennard-Jones potential is used more frequently because it is more convenient to imple-ment. In this work [52], a surface area was found for the P33 (2700) carbon blackof 10.8 m2/g. This solid adsorbent consists of truncated polygonal bipyramidsmade up of stacked graphite lattices. It presents a nearly homogeneous surfaceto adsorbate molecules and has been used in a variety of studies [2,74,75]. Thesurface area of this powder was obtained without any assumption of the packingarea of the adsorbate molecules, but it is necessary to have a value for z*.The gas–solid equilibrium separation, z*, can be based on use of Eq. (13) todetermine z* from z0 and finding z0 from z0 (rg rs)/2 where rg is the gasradius and rs is the surface atom radius. The ability to determine surface areaindependent of a cross-sectional packing area is one advantage of the virial ap-proach.
Kiselev and coworkers included dipole–quadrupole and quadrupole–quadru-pole terms in an expression of the gas–solid interaction [76]. From studies ofthe heats of adsorption of gases on a graphitic surface they found these termscontributed 10% and 1%, respectively, to the overall interaction. A Lennard-Jones (3, n) potential includes only dipole–dipole interactions; however, the con-stant in front of the attraction term contains implicit contributions from highermultipole terms and so the depth of the potential well and the shape of the poten-tial when substituted in Eq. (12) gives suitable solid surface areas and appropriateestimates of the gas–solid interaction energies.
The single-surface analysis is based on Eqs. (12), (14), and (15) where numeri-cal integration uses an approach such as QUANC8, a quadrature adaptive New-ton-Cotes eight-panel method [77], as expressed in Fortran or other suitable soft-ware language. If a Lennard-Jones potential in Eq. (14) can be specified byselecting appropriate n and m values such as n 16 and m 3, then u1s(y)/kcan be found as the reduced gas–solid separation, y, is varied over a range from0 to 10. Beyond y 10, there is no significant contribution toward the gas–solidinteraction potential.
Since the value of E* is not known, the program used must cycle throughvalues of E* until the best-fit value is found. At each trial value of E* and for aspecific experimental temperature T, the integral I(E*, T ) is calculated.B2s /I(E*, T) is equal to a constant, c, which is Az*. Since the constant shouldnot vary with temperature, the correct choice of E* is the one that minimizesthe variation of c. To avoid size bias, the minimization of the standard deviationof log c, SD(log c), is used as a measure of the variation of c. Experimental

20 Rybolt and Thomas
values of B2s at different temperatures are used. A Fortran or other suitable soft-ware language program is designed to cycle through values for E* by succes-sively smaller increments until the minimum SD(log c) is found.
Once the value of the constant c is found for each gas, then the surface areais determined from the z* value [28]. This process can be repeated for a seriesof adsorbate molecules on a given solid providing a series of E* and A values.Variation in the calculated A values provides a further measure of the appropriate-ness of the selected parameters.
B. Two-Surface Approach
1. Computational StrategyTo calculate the two-surface area of Carbopack C-HT, values of B2s, T, z*,n, and m must be known or selected. As shown in Eqs. (17) and (18), the remain-ing variables are x, E*1 , and E*2 . E*1 and E*2 are linked as the ratio Er whereEr E*2 /E*1 . Searches are made that maximize the agreement given by differentadsorbates for the surface area. These searches involved the use of a programthat calculates the surface area of the solid for each adsorbate at chosen valuesof x and Er. The average and standard deviation of these areas for a series ofadsorbates are calculated and reported. This process is repeated to find the combi-nation of x and Er that gives the lowest value for the standard deviation of logA, SD(log A), and thus the best fit. Repeated evaluations are made by scanningthrough different ranges of x and Er values while making incremental changesin E*1 to minimize SD(log A) [50,61].
2. Basal Plane and Edge Sites of Boron NitrideAs noted previously, P33 graphite consists of truncated polygonal bipyramidsmade up of stacked graphite lattices and presents a nearly homogeneous surfacewhere physical adsorption can take place [52]. In contrast, hexagonal boron ni-tride (BN), consists of basal plane and edge surfaces; thus these BN plateletsprovide two distinct surfaces where physical adsorption occurs [61,78]. In thissection we describe how B2s data for multiple adsorbates over a range of tempera-tures can be used to distinguish and characterize these two types of surfaces.Jaroniec et al. [79] have shown that the effect of heterogeneity on the secondgas–solid virial coefficient is significant.
Since Az* in Eq. (18) is not dependent on the temperature, the best-fit interac-tion energy, E*, can be found to minimize the value of the standard deviationof log(Az*) for a given adsorbate provided values of x and Er(E r E*2 /E*1 ) canbe selected. For a solid adsorbent with different gases as adsorbates, both the Er
ratio and the surface area, A, should be constant because these parameters dependon the surface structure of the adsorbent and not the absorbate [50].

Henry’s Law Behavior in GSC 21
Since the surface area is independent of the gas used, the best-fit percentagearea, x, and the ratio of the interaction potential of two surfaces, Er, may bedetermined by finding the minimum value of the standard deviation of the surfacearea of all gas systems. The typical analysis involves numerical integration anditerative algorithms used to scan a range of x and Er values. Based on previousstudies, an LJ (3, 16) was chosen to represent the potential. A value of n 16gave a more consistent fit of monatomic gases on P33 carbon than any lowervalue of n [52].
A pair of x and Er values is selected and for this pair a series of E*1 valuesis used to calculate integrals I1 and I2 indicated in Eq. (17). Experimentalvalues of B2s at each available temperature are divided by the sum of the inte-grals as indicated in Eq. (18) over the range of experimental temperatures. Aseries of Az* values are produced for each gas–solid system and the minimumof the standard deviation of the logarithm of Az*, SD(log Az*), is found for eachgas.
The best value of E*1 is selected by minimizing SD(log Az*) at each value ofx and Er. By repeating this for a series of gases adsorbed on the same solid, itis possible to select the best x and Er values by minimizing SD(log A) for a seriesof gases. Er and x should be independent of the gas adsorbate and the surfacearea, A, should remain consistent as the gas is varied. The best parameters x, Er ,and E*1 are the ones that give the minimum variation in surface area as the ad-sorbate is varied. The equilibrium separation must be estimated by some othermeans.
An LJ (3, 9) potential was used and monatomic gas–boron nitride data wereanalyzed using a single-surface approach (x 0). This gave the surface areas(m2/g) equal to 1.87, 1.55, and 0.99 for Ar-BN, Kr-BN, and Xe-BN, respectively.A two-surface approach gave surface areas (m2/g) equal to 2.419, 2.422, 2.424for Ar-BN, Kr-BN, and Xe-BN, respectively [80]. Obviously, the two-surfacemodel gives more consistent surface areas and is most appropriate for the boronnitride [50].
For BN with an LJ (3, 16) the best-fit values were: Er 1.71, x 0.030, andcorresponding average surface area of 3.56 (m2/g). This surface area based onthe LJ (3, 16) potential is in closer agreement to the surface area measured bythe independent BET method of 5.0 (m2/g) than the previous graphical BN analy-sis [61] based on the LJ (3, 9) potential, which gave 2.62 (m2/g). For P33 withLJ (3, 16), and using a two-surface approach, the best-fit values were found to beEr 1.0 and x 0, and the corresponding average surface area of 10.9 (m2/g).By definition, either x 0.0 or Er 1.0 is equivalent to a single-surface solid.Values of x from 0.00 to 0.10 and Er from 1.0 to 2.5 were used in this analysisbecause all the best-fit parameters were found to fall within this range. Theseresults demonstrate that the P33 graphite presents a single uniform surface,
22 Rybolt and Thomas
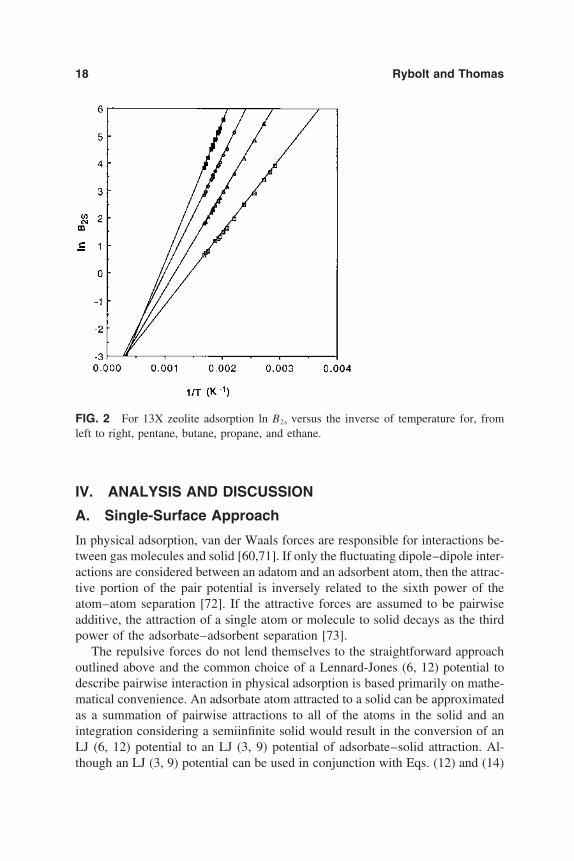
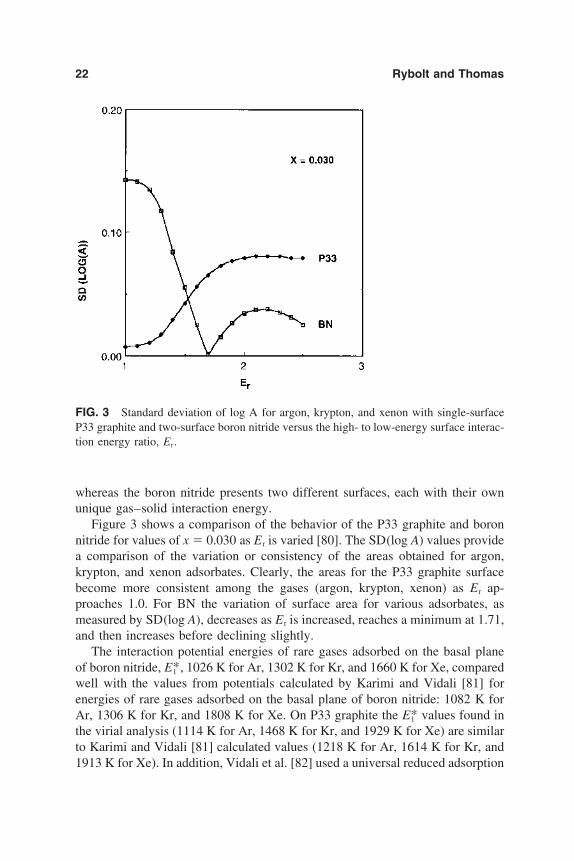
FIG. 3 Standard deviation of log A for argon, krypton, and xenon with single-surfaceP33 graphite and two-surface boron nitride versus the high- to low-energy surface interac-tion energy ratio, Er.
whereas the boron nitride presents two different surfaces, each with their ownunique gas–solid interaction energy.
Figure 3 shows a comparison of the behavior of the P33 graphite and boronnitride for values of x 0.030 as Er is varied [80]. The SD(log A) values providea comparison of the variation or consistency of the areas obtained for argon,krypton, and xenon adsorbates. Clearly, the areas for the P33 graphite surfacebecome more consistent among the gases (argon, krypton, xenon) as Er ap-proaches 1.0. For BN the variation of surface area for various adsorbates, asmeasured by SD(log A), decreases as Er is increased, reaches a minimum at 1.71,and then increases before declining slightly.
The interaction potential energies of rare gases adsorbed on the basal planeof boron nitride, E*1 , 1026 K for Ar, 1302 K for Kr, and 1660 K for Xe, comparedwell with the values from potentials calculated by Karimi and Vidali [81] forenergies of rare gases adsorbed on the basal plane of boron nitride: 1082 K forAr, 1306 K for Kr, and 1808 K for Xe. On P33 graphite the E*1 values found inthe virial analysis (1114 K for Ar, 1468 K for Kr, and 1929 K for Xe) are similarto Karimi and Vidali [81] calculated values (1218 K for Ar, 1614 K for Kr, and1913 K for Xe). In addition, Vidali et al. [82] used a universal reduced adsorption

Henry’s Law Behavior in GSC 23
potential to calculate 1103 K, 1428 K, and 1912 K for Ar, Kr, and Xe withgraphite.
The differences between the graphite and boron nitride have been previouslycharacterized [83,84] and the distinctive differences in behavior have beencharacterized because of the known heterogeneity of the BN [78,84–86]. Thesetwo adsorbents are useful model systems to distinguish differences in surfacestructure and test models that do not make prior assumptions of surface differ-ences. No prior knowledge of the nature of the surface structure is assumed inthe analysis and yet it is possible to clearly identify the P33 graphite as a one-surface solid and the boron nitride as a two-surface solid. The results given aboveindicate that a virial analysis of B2s data for several adsorbates over a range oftemperature can be used to determine gas–solid interaction energy parametersand solid structural parameters, as well as to determine something of the surfaceheterogeneity.
3. Chlorofluorocarbons and a Microporous CarbonTo further test this two-surface model, gas–solid virial coefficients obtained fromgas–solid chromatography for ethane (C2H6), propane (C3 H8), fluoromethane(CH3F), chloromethane (CH3 Cl), Freon-22 (CHClF2), Freon- 12 (CCl2F2), anddichloromethane (CH2 Cl2) with a microporous carbon, Super Sorb, were ana-lyzed [37]. Previous studies of chlorofluorocarbon adsorption have been of boththeoretical and applied interest, including several patents directed at removinglow concentrations of these molecules from the air [37]. Using the same approachoutlined previously, the best two-surface approach yielded Er 2.5 (range 1.0–2.9 examined) and x 0.03.
For every Er it is possible to obtain the fraction of high-energy surface area,x, that gives a best fit of the data as judged by minimizing SD(log A). As Er isincreased, the corresponding x value from the best-fit tends to decrease and theaverage surface area found for the seven gas–solid systems increases. The z*values ranging from 0.409 nm for CH3 F to 0.478 nm for CCl2F2 were calculatedbased on the additivity of carbon and gas radii. The gas radii were found frommolecular weight, liquid bulk density, and an empty space correction factor [37].The radii for the adsorbate molecules determined by this approach agreed within10% of values obtained from an energy minimization molecular modeling pro-gram.
The two-surface model gives a better representation of B2s data as judged bythe value of SD(log A), although the difference is not nearly as significant asfor the monatomic gas and boron nitride systems. The microporous carbon is acomplicated structure; however, assumptions of flat uniform surface have beenuseful in providing relative surface areas. While maintaining a simple model, theaddition of a second, high-energy surface yields a significant improvement insurface areas determined.

24 Rybolt and Thomas
The one-surface model gives an area (m2/g) and standard deviation of 127 83 and the two-surface model gives 1513 502 for the seven gas–solid systems.The two-surface model gives a more consistent area and a value much closerto the traditional BET area of 3169 m2/g for the Super Sorb. The one-surface mo-del gives an area that is 4.0% of the value of the BET area. The two-surfacemodel gives an area that is 48% of the area of the BET area. As previouslyobserved, the virial surface area is expected to be less than the BET area becausethe BET area includes a contribution from condensation in micropores and thevirial area is more representative of the geometric area [25,87]. For a high-sur-face-area microporous carbon, the virial area might be expected to be in the rangeof one-fourth to one-half of the BET area.
The application of this two-surface model to the halogenated hydrocarbon–microporous B2s data shows that the two-surface model can be applied to morecomplicated adsorbate–adsorbent systems and provides a method to explore theheterogeneity of solid surfaces. In the next section we will examine one moreapplication of the two-surface model to study surface heterogeneity.
4. Lower and Higher Energy Sites on Carbopack C andCarbopack C-HT
Gas–solid chromatography was used to determine the second gas–solid virialcoefficients for normal propane, butane, pentane, and hexane with Carbopack C(Supelco, 10 m2/g) and Carbopack C-HT (Supelco, 10 m2/g), and one-surfaceand two-surface virial analyses were compared [53]. Carbopack C is a graphitizedcarbon black powder and Carbopack C-HT is produced by flowing hydrogen overCarbopack C heated to temperatures above 1273 K. Previous work using thesesolids as adsorbents showed that there are high-energy ‘‘active sites’’ located onthe surface of both Carbopack C [88–93] and Carbopack C-HT [91,93], whichimplies that there are two types of surface. Since the treatment of Carbopack Cto produce Carbopack C-HT removes some of the high-energy sites from thesurface, these two surfaces provide a useful comparison of single-surface andtwo-surface models. Lin and Parcher [88–90] found that modifying the surfaceof Carbopack C removed many of the active sites and that these are due to bothchemical and physical imperfections in the surface.
The alkanes used in this study were selected to provide nonspecific adsorbates.As expected, due to the van der Waals interactions in physical adsorption, reten-tion time increased with increasing adsorbate size Also as is typical, retentiontimes decreased with increasing temperature. Plots of ln B2s versus 1/T were linearand the slopes increased in order from propane, butane, pentane, and hexane.
Using the single-surface equations and analysis procedure discussed in theprevious section, the average single-surface area and standard deviation forthe four gases were found to be A 0.69 0.81 m2/g for Carbopack C andA 1.6 1.5 m2/g for Carbopack C-HT [53]. This single-surface model as-
Henry’s Law Behavior in GSC 25
sumes a homogeneous surface. On the other hand, the two-surface model assumesthe majority of the solid surface has a homogeneous energy with isolated regionsof high-energy sites, or ‘‘hot spots.’’ Higher energy sites could be due to thepresence of oxygen and sulfur on the surface or due to surface features such assteps, crevices, or edge sites.
Results of the two-surface method discussed above gave the best agreementof the adsorbate areas for the four gases when x 0.015 (1.5% of the surfacearea due to higher energy sites) and Er 1.80 for Carbopack C-HT. The averagesurface area was found to be 13.9 2.0 m2/g.
For Carbopack C-HT and C, values of E*1 and E*2 (and thus Er) should be thesame because hydrogen treatment only removes some of the active sites but doesnot alter the energy of the rest of the surface. Using the same values of Er ,E*1 , E*2 , and z* as in the Carbopack C-HT analysis, only the value of x wasvaried. For each value of x, the standard deviation of the areas for the four ad-sorbates was divided by the corresponding average area. An x 0.026 gave theminimum value of this ratio. For this x the surface area was 13.2 1.7 m2/gfor Carbopack C. The best E*1 values for this two-surface analysis were 2030 Kfor propane, 2488 K for butane, 2839 K for pentane, and 3140 K for hexane [53].
Earlier literature BET values for the surface areas of Carbopack C of 13.7m2/g [94] and 12.5 m2/g [95] agree with this two-surface area of 13.2 m2/g. ForCarbopack C-HT the reported BET value of 13.6 m2/g by Vidal-Madjur et al.[96] is in good agreement with our value of 13.9 m2/g found using the two-surface method. Confirmation of the presence of high-energy active sites on boththe Carbopack C and the Carbopack C-HT causes dramatic improvement in thesurface area calculations by changing from a single-surface to a two-surfacemodel—1.6 to 13.9 m2/g for Carbopack C-HT and 0.7 to 13.2 m2/g for Carbo-pack C.
The high-temperature hydrogen treatment removes some of the higher energysites, or hot spots, from the surface of the Carbopack C (x 2.6%) when it ischanged into Carbopack C-HT (x 1.5%). The higher energy sites were foundto have an average energy 1.8 times greater (E r 1.8) than the more commonlow-energy sites.
Previous work [88–93] suggested that these graphitized carbon black powdershave surface impurities that create high-energy sites. An ESCA (electron spec-troscopy for chemical analysis) analysis of these two surfaces showed only acarbon peak and no oxygen or sulfur [53]. However, they could be present inamounts, as reported by Kraus [94] and DiCorcia et al. [92], which are belowthe ESCA detection limits (0.2% sulfur atoms and 0.1% oxygen atoms) of theanalysis on these samples. The fraction of the surface that could be covered withsulfur or oxygen atoms is too small to account for the number of high-energysites. So an additional factor could be due to surface imperfections. It is possiblethat the hot spots are a mixture of surface imperfections and surface impurities.

26 Rybolt and Thomas
The isosteric heats of adsorption at zero coverage on Carbopack C have beenreported as 27.4, 34.4, 41.7, and 49.6 kJ/mol for propane, butane, pentane, andhexane, respectively [97]. The E* (depth of gas–solid interaction) values fromthe one-surface analysis are 26.6, 35.9, 45.3, and 51.7 kJ/mol, respectively.
C. Cavity Model
1. ZeolitesZeolite molecular sieves are of great interest in examining virial theories ofadsorption for microporous solids because they possess regular crystalline struc-ture [98–101]. The low coverage, Henry’s law, physical adsorption of argon,krypton, and xenon with the 5A and 13X zeolites has been represented with avirial equation [51]. In this section we show how B2s values such as those obtainedby gas adsorption or gas–solid chromatography can be used to obtain the ener-getic and structural parameters that characterize Henry’s law behavior in zeolitesystems.
Henry’s law B2s data for zeolites have the advantage that the adsorbate occupa-tion of cavities averages less than one gas molecule per cavity and thus ad-sorbate–adsorbate interactions can be ignored. If we consider a zeolite to consistof a series of interconnected spherical cavities, the structure can be characterizedby only two parameters—the cavity radius, a, and the number of cavities pergram of adsorbent, Ns [69].
X-ray crystallographic data for the 5A and 13X zeolites show that their struc-tures are a collection of identical approximately spherical cavities [102–104].Each cavity in the 5A structure is formed by eight interconnected sodalite unitswith access to each central cavity via six openings or windows of mean diameterless than 0.5 nm. Each cavity in the 13X structure is formed from 10 intercon-nected sodalite units with access to the central cavity via four windows of meandiameter about 1.0 nm [105].
Many previous studies modeling adsorbate–zeolite interactions were based onlattice summation calculations [62,67,98,106–112]. These calculations are basedon atom–atom and atom–ion interactions and include attractive and repulsivedispersion as well as electrostatic induction terms. Such calculations require exactstructural information, i.e., the location of all cavity atoms and ions that are con-sidered to contribute significantly to the adsorbate–cavity interaction. These lat-tice summation calculations have been used to generate potential profiles alongdifferent symmetry axes as well as to calculate a variety of thermodynamic prop-erties. Kiselev and Du [109] have compared experimental and calculated Henryconstants for Ar, Kr, and Xe in type X zeolites and found that the experimentalHenry constants average 0.93 of the calculated lattice summation values. Includ-ing this correction term, they were able to correctly calculate thermodynamicvalues from lattice summation calculations.

Henry’s Law Behavior in GSC 27
2. Application of the Lennard-Jones and DevonshireCell Model
Stroud [62] used an integral procedure along with the Lennard-Jones and Dev-onshire (LJD) cell model [63,64] to generate a potential to represent the sorbate-cavity interaction and included multiple cavity occupancy so that adsorbate–adsorbate interactions were also included. Soto [105,111] used the LJD cell modelto replace the dispersion summation with an integral and used lattice summationto represent only the adsorbate-cation electrostatic inductive interaction. Yangand Pierotti [69] began with thermodynamic data in the form of second gas–solid virial coefficients and used the LJD model to extract from these data themolecular and structural parameters for the Ar, Kr, and Xe zeolite 5A systems.
Soto [105] observed that ignoring electrostatic interactions and using only theLJD cell model integrand to represent the adsorbate–cavity interaction led tovalues of the cavity diameter and the gas–cavity interaction energy that were toosmall. However, this result was based on fixing the strength of the adsorbatecavity atom interactions based on dispersion forces.
As we show below, a modification of the approach developed by Yang andPierotti [69] has been used to extract reasonable molecular and structural parame-ters from the temperature dependence of virial coefficient thermodynamic data[51]. In this work, it is essential to allow the depth of the potential to be deter-mined by fitting the data and not by making prior assumptions about the natureof the atom–atom interactions.
Equations (35)–(37) can be used to express the Henry’s law isotherm, Eq.(1), in terms of four parameters: a, Ns, r*, and E*. To evaluate Eq. (37), onemust carry out a numerical integration where the parameters V* and E* are speci-fied. With a unique selection of values for these parameters and a value of r*based on atomic radii, it is possible to determine the cavity radius, a, from Eq.(31) and finally the value of Ns from the constant, c, from Eq. (36). Equation(34) provides a connection between E* and V* values that can be utilized if theinteraction at equilibrium separation, w(r*) is known. Any generated pair of E*and V* values must give the expected value of w(r*) as shown in Eq. (40).
If a value of V* is chosen, then a unique selection for E* can be made fromthe B2s–temperature data for a given gas–solid system. Since c in Eq. (36) in-volves only the structural parameters a and Ns, then c should not vary with tem-perature. An iterative procedure is employed to find the value of E* that givesthe minimum value of the standard deviation of log(c) for selected values of V*for each of the six gas–zeolite systems. Evaluation of the integral, Eq. (37), iscarried out by numerical integration [77].
For V* values (in a range of 4–12) for each gas–zeolite system the best valueof the interaction energy, E* was found, within the nearest 1 K, by finding thestandard deviation of log(c) for each trial of E*. Values of the constant c are

28 Rybolt and Thomas
found from Eq. (35) by dividing experimental values of B2s by the calculatedfunctions Ic at each temperature for which B2s values are available. The minimumof the standard deviation of log(c) is associated with the best fit of E* becausethis indicates that the structural parameters a and Ns are—for this value of E*—the least affected by changes in the temperature.
For any selected value of V* there is an unambiguous choice of the best-fitE* value. However, it is not possible to select the best-fit pair of V* and E*values in this same manner because a series of such pairs are not much differentin the quality of their fit. In other words, for any V* an E* can be found thatgives a good fit of the data, although some values of V* and E* may be unreason-able. As V* becomes smaller then the selected E* will also become smaller. Itis necessary to find a unique pair of V and E*.
Equation (34) is used to calculate w(r*) for each V* and E* (E* ε*1s/k)pair and find the pair that gives the appropriate w(r*) value based on the B2s
data and Eq. (40). For any gas–zeolite system w(r*) can be determined as afunction of V*. Table 1 shows the results of this approach with values of w(r*)/k, E*, V*, and SD(log c). For the 5A and 13X zeolites the interaction energiesfollow the expected trend of increasing as the size of the monatomic adsorbateis increased [51].
The mean values of c along with the corresponding structural parameters—the cavity radius, a, and the number of cavities, Ns—are shown in Table 2. Thebest-fit V* and E* values from Table 1 for each gas–zeolite system and thecorresponding experimental values of B2s(T ) are used with Eq. (35) to generatea series of c values from which the average c is determined. Since V* (a/r*)3,Eq. (31), one can calculate the cavity radius from r* and V* values for eachgas–zeolite system. For a Lennard-Jones [6,12] potential the equilibrium separa-tion, r*, is related to the distance of closest approach, ro, as r* (2)1/6ro.
It is commonly assumed that the Lorentz-Berthelot combining rules are validand that gas–solid hard sphere separation is the arithmetic mean of the gas–gas
TABLE 1 Cavity Model Parameters from Virial Analysis of Zeolites
Gas w(r*)/k V* E*(K) SD(log c)
5A ZeoliteArgon 1213 8.18 12901 0.07275Krypton 1859 7.90 18404 0.07447Xenon 2694 7.72 25555 0.14040
13X ZeoliteArgon 1267 8.04 13006 0.03508Krypton 1780 7.79 17517 0.08173Xenon 2267 7.77 21754 0.08089

Henry’s Law Behavior in GSC 29
TABLE 2 Cavity Model Zeolite Structure Parameters from Virial Analysis
Ns 1020
Gas c(cm3/g) r*(nm) a(nm) (cavities/g)
5A ZeoliteArgon 0.619 0.343 0.691 2.99Krypton 0.304 0.355 0.708 1.37Xenon 0.154 0.374 0.739 0.608
13X ZeoliteArgon 0.298 0.343 0.687 1.47Krypton 0.304 0.355 0.704 1.38Xenon 0.460 0.374 0.740 1.80
and solid–solid diameters [76]. Soto [105] determined gas–solid ro values usingthe oxygen–oxygen surface diameter as 0.276 nm and estimating gas diametersof Ar, Kr, and Xe as 0.335, 0.357, and 0.390 nm, respectively. These values areused to find the r* values shown in Table 2. Ns values are found from cavityradii and c values using Eq. (36). The average values for the 5A zeolite are a 0.712 nm and Ns 1.66 1020 cavities/g and for the 13X zeolite are a 0.711nm and Ns 1.55 1020 cavities/g.
The structural parameters obtained from this approach can be compared to thevalues obtained from x-ray crystallographic studies. The best-fit average values of0.712 nm for the 5A and 0.711 nm for the 13X compare well to experimentalcavity radii for the closest oxygen atoms 0.704 nm and 0.709 nm for the interiorof the 5A and 13X, respectively [102,103,105].
The values of Ns, the number of cavities per gram, are not as accurate as thecavity radius, a, values. Values for Ns 1020 (cavities/g) were 1.66 1.22 forthe 5A and 1.55 0.22 for the 13X. The corresponding exact values from x-raycrystallographic measurements are 3.59 and 3.64 for the 5A and 13X, respec-tively. The calculated values represent only 46% and 43% of the expected valuesfor the 5A and 13X. However, the interior cavity wall surface is effectively re-duced due to the six 5A windows and four 13X windows by approximately 40–60%. If this factor were included in Eq. (36) for the constant c then the valuesof Ns would be approximately doubled and agree closely with the known values.
Lattice summation calculations for the 5A system by Derrah and Ruthven [67]showed a significant variation in calculated values of w(r*) depending on theformula used to find the dispersion interaction energies. The Slater-Kirkwoodformula generated values of w(r*) 1700, 2150, and 2500 K, for Ar, Kr, andXe, respectively [69]. This compares to our values of 1213, 1859, 2694 in Table 1.A much better comparison is obtained for Ar values by using their London valueof 1100.

30 Rybolt and Thomas
Work by Soto and others [105,111] using atomic parameters to calculate Hen-ry’s law constants led them to conclude that the LJD cell model could be usedto represent dispersion forces, but that electrostatic forces must be treated by alattice summation and could not be replaced by a sphericalization procedure.While the propriety of including the electrostatic induction in the potential isclear in a procedure beginning with atomic parameters and attempting to calculatethermodynamic data, it is interesting to note that in the reverse procedure (ther-modynamic to atomic) one can ignore the detailed origins of the interaction en-ergy and merely allow the fitting procedure to pick out a potential well of suffi-cient depth to include whatever forces that may contribute to the adsorbate–cavityinteraction. For the Kr-13X system Soto [111] found the interaction energy atthe maximum potential well depth, E* 22600 K, to be due to 8800 fromdispersion energy and 13800 from electrostatic energy. Using our fitting proce-dure we found a value of E* 17157 K. While not identical, our E* value isincluding an implicit contribution from electrostatic interactions. This approachthat was found to be useful for the zeolites can be modified to be used with othermicroporous solids where the structure cannot be characterized as well.
D. Comparison of Flat, Parallel Plate, andCavity Models
In previous research [49] a comparison was made of three different virial models(flat, parallel plate, and cavity) applied to argon B2s values for seven differentsolids, including graphitized carbon black P33 (P33), Mexican graphite (MG),5A-zeolite (5A), 13X-zeolite (13X), Nuchar-SC (SC), Nuchar-SA (SA), and Su-per Sorb (SS). The seven powders represented three surface types: low-surface-area carbons with flat surfaces (MG, P33), microporous carbons (SC, SA, SS),and zeolites containing interconnected spherical cavities (5A, 13X).
For each model, B2s is equal to some constant, c, times the value of an integraldependent on the selected n and m values, T, and E*. For the parallel plate andcavity models there is also the structural parameter, a, which represents the dis-tance from the wall to the center of the parallel plates or the radius of cavity.The analysis involves an iterative computer process where the E* value is varied,the integral is computed at each temperature using numeric integration [77],and the B2s value at each temperature is divided by the integral to find the con-stant, c. The constant c is Az*, 2aA, or 2πa3 Ns for the flat, parallel plate, andcavity models, respectively.
E* is cycled through a range of values to give the parameters for the integralsthat produce c values that give the smallest standard deviation of the log(c). Sincec depends on surface structure and area, it should not depend on temperature.Therefore, the best parameters give the most consistent c values for B2s–tempera-ture data over a range of temperatures.
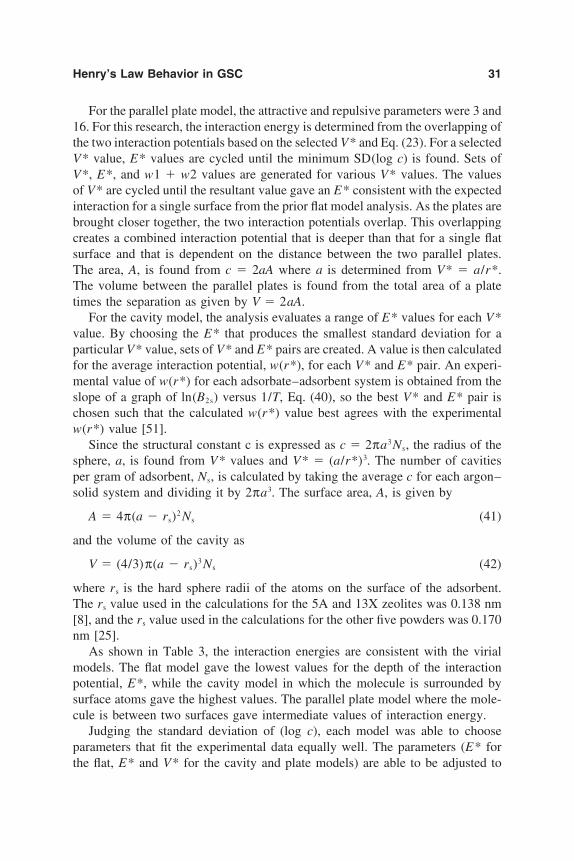
Henry’s Law Behavior in GSC 31
For the parallel plate model, the attractive and repulsive parameters were 3 and16. For this research, the interaction energy is determined from the overlapping ofthe two interaction potentials based on the selected V* and Eq. (23). For a selectedV* value, E* values are cycled until the minimum SD(log c) is found. Sets ofV*, E*, and w1 w2 values are generated for various V* values. The valuesof V* are cycled until the resultant value gave an E* consistent with the expectedinteraction for a single surface from the prior flat model analysis. As the plates arebrought closer together, the two interaction potentials overlap. This overlappingcreates a combined interaction potential that is deeper than that for a single flatsurface and that is dependent on the distance between the two parallel plates.The area, A, is found from c 2aA where a is determined from V* a/r*.The volume between the parallel plates is found from the total area of a platetimes the separation as given by V 2aA.
For the cavity model, the analysis evaluates a range of E* values for each V*value. By choosing the E* that produces the smallest standard deviation for aparticular V* value, sets of V* and E* pairs are created. A value is then calculatedfor the average interaction potential, w(r*), for each V* and E* pair. An experi-mental value of w(r*) for each adsorbate–adsorbent system is obtained from theslope of a graph of ln(B2s) versus 1/T, Eq. (40), so the best V* and E* pair ischosen such that the calculated w(r*) value best agrees with the experimentalw(r*) value [51].
Since the structural constant c is expressed as c 2πa3Ns, the radius of thesphere, a, is found from V* values and V* (a/r*)3. The number of cavitiesper gram of adsorbent, Ns, is calculated by taking the average c for each argon–solid system and dividing it by 2πa3. The surface area, A, is given by
A 4π(a rs)2 Ns (41)
and the volume of the cavity as
V (4/3)π(a rs)3 Ns (42)
where rs is the hard sphere radii of the atoms on the surface of the adsorbent.The rs value used in the calculations for the 5A and 13X zeolites was 0.138 nm[8], and the rs value used in the calculations for the other five powders was 0.170nm [25].
As shown in Table 3, the interaction energies are consistent with the virialmodels. The flat model gave the lowest values for the depth of the interactionpotential, E*, while the cavity model in which the molecule is surrounded bysurface atoms gave the highest values. The parallel plate model where the mole-cule is between two surfaces gave intermediate values of interaction energy.
Judging the standard deviation of (log c), each model was able to chooseparameters that fit the experimental data equally well. The parameters (E* forthe flat, E* and V* for the cavity and plate models) are able to be adjusted to
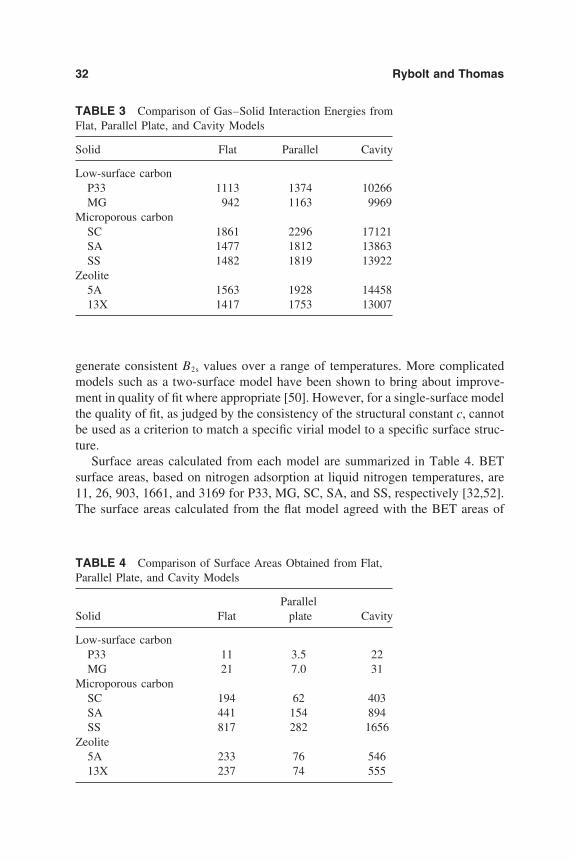
32 Rybolt and Thomas
TABLE 3 Comparison of Gas–Solid Interaction Energies fromFlat, Parallel Plate, and Cavity Models
Solid Flat Parallel Cavity
Low-surface carbonP33 1113 1374 10266MG 942 1163 9969
Microporous carbonSC 1861 2296 17121SA 1477 1812 13863SS 1482 1819 13922
Zeolite5A 1563 1928 1445813X 1417 1753 13007
generate consistent B2s values over a range of temperatures. More complicatedmodels such as a two-surface model have been shown to bring about improve-ment in quality of fit where appropriate [50]. However, for a single-surface modelthe quality of fit, as judged by the consistency of the structural constant c, cannotbe used as a criterion to match a specific virial model to a specific surface struc-ture.
Surface areas calculated from each model are summarized in Table 4. BETsurface areas, based on nitrogen adsorption at liquid nitrogen temperatures, are11, 26, 903, 1661, and 3169 for P33, MG, SC, SA, and SS, respectively [32,52].The surface areas calculated from the flat model agreed with the BET areas of
TABLE 4 Comparison of Surface Areas Obtained from Flat,Parallel Plate, and Cavity Models
ParallelSolid Flat plate Cavity
Low-surface carbonP33 11 3.5 22MG 21 7.0 31
Microporous carbonSC 194 62 403SA 441 154 894SS 817 282 1656
Zeolite5A 233 76 54613X 237 74 555

Henry’s Law Behavior in GSC 33
the flat surfaces, P33 and MG, while the surface areas calculated from the cavitymodel were approximately half of the BET areas of the surfaces composed ofmicroporous carbons. This result is consistent with the observation that the virialmodel represents geometric area whereas the BET area includes a significantcontribution from condensation in pores, and so the BET areas are greater thanthe virial areas.
The surface areas from the parallel plate model underestimated the areas rela-tive to the flat and cavity models. However, the surface areas for all three modelsshowed a clear distinction between the flat surfaces (P33 and MG) relative tothe microporous surfaces. In other words, even without any prior knowledge ofsurface structure, a virial analysis can be expected to distinguish between a low-and high-surface-area solid. A low-surface-area solid can be more appropriatelyanalyzed by the flat model, whereas a high-surface-area solid can be more appro-priately analyzed by the cavity model.
E. Correlations with Other Physical Properties
Given the ability to obtain B2s values through gas–solid chromatography and touse the temperature and adsorbate variation of these values to determine some-thing of surface area, adsorbent structure, and the nature of the gas–solid interac-tion, it would also be advantageous to be able to predict B2s values from adsorbateproperties. By predicting B2s we could predict the extent of adsorption, na, at anytemperature using Eq. (2) and also the adsorbate retention time, t, and the abilityto separate a mixture of gases using Eqs. (8)–(10) where t mB2s/F1.
Gas–solid chromatography was used to obtain virial coefficients for sevenalkanes, seven halogenated hydrocarbons, two ethers, and sulfur hexafluoride[28]. B2s values in the temperature range 314–615 K were found with the adsor-bent Carbopack B (Supelco, 100 m2/g). In the analysis of these data, an alterna-tive to the numerical integration is provided by an equation derived by Hansen[113–115]. This approximation is most applicable as E*/T takes on larger values.Hansen has shown that the integral in Eq. (12) that has been expressed as a powerseries of gamma functions [6] can be approximated by the simple analytical ex-pression and it has been shown [28] that combining his expression with Eq. (13)gives
B2s Az*(2π/mn)1/2 (T /E*)1/2 exp(E*/T) (43)
This equation can be used as an approximation to Eq. (15) which represents anexact integral.
Combining Eq. (43) with Eq. (18) gives an approximation of the two-surfacemodel where
B2s Az*(2π/mn)1/2 [(1 x)(T /E*1 )1/2 exp(E*1 /T)
x(T /E*2 )1/2 exp(E*2 /T )](44)

34 Rybolt and Thomas
The use of Hansen’s analytical solution for Eq. (18) in place of numerical integra-tion greatly simplifies the computation required to find the best-fit x, E*1 , andE*2 parameters. Although Eq. (44) is an approximation, it may provide a usefulmeans to correlate and predict B2s values for a set of molecules.
As shown before, the gas hard sphere size can be calculated by combiningthe gas and solid radii rgs rg rs, where rs 0.170 nm is the radius of carbonbased on graphite layer size [25]. The gas radius, rg, may be estimated by
rg [(3/4π)(CW/DL)]1/3 (45)
where W is the molecular weight of adsorbate molecule, D is the liquid bulkdensity, L is Avogadro’s constant, and C is an empty space packing correctionfactor [28]. In one study [37], the best correction factor, C, was found to be0.4590 by comparing calculated rg values for methane, ethane, propane, dichloro-difluoromethane, argon, krypton, and xenon with available values [28]. Then z*can be calculated from zo(zo rgs) and Eq. (13).
Since the surface area, A, the percentage of the area for surface two, x, andthe ratio of E*2 to E*1 , Er, are structural features of the solid, they should beconstant for the same solid with different gases [50]. The Er and x values thatbest described the Carbopack B solid were determined using the previously de-scribed two-surface method. The best pair of Er and x, Er 2.12 and x 0.008,gave an area of 101 m2/g and a standard deviation of 43. However, with themethylether outlier removed, the area and SD(A) became 92 24 m2/g. TheBET area is 100 m2/g. The two-surface model was a significant improvementover the area determined by the single-surface approach.
In previous work, Berezin [116] has shown that there should be a correlationbetween gas–solid interaction energy and the ratio of critical temperature dividedby the square root of critical pressure, Tc/P1/2
c . As shown in Fig. 4, E*1 adsorptionenergies can be correlated well by Tc/P1/2
c for 17 gases—seven alkanes, sevenhalogenated hydrocarbons, two ethers, and sulfur hexafluoride on adsorbent Car-bopack B—(correlation coefficient, r 0.985). A microporous solid like theCarbopack B probably allows for a diverse set of molecules to be grouped to-gether in a way that may not be possible for a low-surface-area solid. However,since B2s is very sensitive to interaction energy values, it is difficult to group allof the gases together to get E*1 for different groups precisely enough to predictexact B2s values. Only for a structurally similar series is it possible to have ageneral equation to get B2s values.
In this set of 17 molecules, the structure of the molecules are too different tobe combined together. E*1 can be approximated from the critical constant ratioand z* approximated from molecular modeling. With a knowledge of A, x, Er,n, and m the two-surface Hansen equation can only be used to accurately calculateB2s for a similar series of adsorbates. While the expression of B2s based on Han-sen’s equation is most valid at higher E*/T ratios, this type of analytical expres-

Henry’s Law Behavior in GSC 35
FIG. 4 Correlation of gas–solid interaction energy for lower energy surface, E*1 , withratio of critical constants Tc /P0.5
c for 17 adsorbate molecules with a microporous carbon,Carbopack B.
sion provides a simplicity lacking in the numerical expression and provides arational basis for a simple graphical approach of plotting Ln B2s versus 1/T.
In previous work [37] the E* values based on B2s values determined fromgas–solid chromatography for seven different hydrocarbons and chlorofluoro-carbons were correlated with the adsorbate molecular structures. The structurewas represented by
E*cal nCEC nH EH nF EF nCl ECl (DM)EDM (46)
where nC is the number of carbon atoms, nH is the number of hydrogens, nF isthe number of fluorines, nCl is the number of chlorines, DM is the dipole momentin Debye, EC is the energy contribution of each carbon atom, EH is the energyper hydrogen, EF is the energy per fluorine, ECl is the energy per chlorine, andEDM is the energy per Debye of dipole moment. This equation assumes that eachatom makes a unique and additive contribution to the overall adsorbate–solidinteraction energy [28].
Experimental values of E* are used in conjunction with known values of nC,nH, nF, nCl, and DM to solve a series of simultaneous equations to find the bestvalues of EC, EH, EF, ECl, and EDM. Once the energy factors are determined,E*cal is calculated from Eq. (46) and then the experimental E* is plotted versus
36 Rybolt and Thomas
E*cal to find out how well the equation works to correlate E* values. A plotof E* versus E*cal gives a slope of 1.000 and a correlation coefficient of 0.976.When the dipole moment factor is excluded the fit is much poorer.
A plot of E* values for the same seven adsorbates versus the boiling pointof the molecules gives r 0.932 [37]. Both adsorption and boiling point arerelated to the strength of van der Waals attraction, so it is reasonable that theycorrelate with each other. Critical constant, boiling point, and structural correla-tions have been compared for other gas–solid systems and are all reasonablyeffective. However, on a silica gel surface where specific interactions with OHbonds are important, a comparison of aromatics, aliphatic hydrocarbons, and alco-hols reveals that only the structural approach is useful in correctly correlatingB2s values [117].
In future work, it may be possible to develop a more general means of pre-dicting B2s values from a limited set of parameters that are dependent on molecu-lar structure and physical properties. However, more success is likely in dealingwith a set of structurally similar molecules and developing an equation to calcu-late B2s that is specific for a limited set of similar adsorbate molecules.
Another useful approach to correlating gas–solid chromatographic data is toconsider relative retention times and correlate with some appropriate property orcombinations of properties. For a given flow rate and column temperature, theretention times are converted to a series of relative values by, for example, scalingthe longest retention time to a value of 500 and then scaling the other timesproportionally. The resulting values are sometimes referred to as retention index(RI) values or relative retention times (RRT) Previous studies have used a varietyof physical properties or molecular descriptors to correlate or predict RRT orRI. These properties have included vaporization enthalpy [118]; connectivityindex and bending energy of molecules [119]; connectivity index, ionization po-tential, molecular size, and quadrupole moment [120]; molecular polarizability[121]; and molecular mass and selected structural fragments [122]. These studiesare examples of a specific type of quantitative structure–activity relationship(QSAR), sometimes referred to as quantitative structure–retention relationship(QSRR). The prediction of relative chromatographic retention times and separa-tion effectiveness is a key objective of QSRR.
Future QSRR studies may benefit from a virial approach that takes advantageof the theoretical basis of B2s as it relates to surface structure and gas–solid inter-actions. The combination of the B2s virial approach with QSRR may lead to betterselections of descriptors for predicting chromatographic separation parametersand also help us better understand and utilize gas–solid chromatography.
ACKNOWLEDGMENT
We would like to express deep appreciation for the inspiration provided by ourrespective research advisors, Robert A. Pierotti and Douglas H. Everett, and rec-

Henry’s Law Behavior in GSC 37
ognize the valuable contributions of the many undergraduate students who haveworked with us on related research projects over the years.
REFERENCES
1. W. A. Steele and G. D. Halsey, Jr. J. Chem. Phys. 22:979 (1954).2. J. R. Sams, Jr., G. Constabaris, and G. D. Halsey, Jr. J. Phys. Chem. 64:1689 (1960).3. J. R. Sams, Jr., G. Constabaris, and G. D. Halsey, Jr. J. Chem. Phys. 36:1334 (1962).4. J. A. Barker and D. H. Everett, Trans. Faraday Soc. 58:1608 (1962).5. W. A. Steele, in The Solid-Gas Interface Volume 1 (E. A. Flood, ed.), Dekker, New
York, 1967, pp. 199–220.6. R. A. Pierotti and H. E. Thomas in Surface and Colloid Science Vol. 4. (E. Mati-
jevic, ed.), Wiley-Interscience, New York, 1971, pp 93–259.7. V. A. Bakaev and O. V. Chelnokova, Surf. Sci. 215:521 (1989).8. W. Rudzinski, J. Jagiello, J. Michalek, S. Milonjic, and M. Kopecni. J. Colloid
Interface Sci. 104:297 (1985).9. E. A. Boucher and D. H. Everett. Trans. Faraday Soc. 67:2720 (1971).
10. W. A. Rudzinski, A. Waksmundzki, Z. Suprynowicz, and J. Rayss. J. Chromatogr.72:221 (1972).
11. S. Ross, J. K. Saelens, and J. P. Oliver. J. Phys. Chem. 66:696 (1962).12. S. J. Gregg. Colloids Surf. 21:109 (1986).13. M. Jaroniec, R. Madey, J. Choma, B. McEnaney, and T. J. Mays. Carbon. 27:77
(1989).14. F. Rodriguez-Reinoso and A. Linares-Solano. Chem. Phys. Carbon. 21:1 (1989).15. W. van Megan and I. K. Snook. Mol. Phys. 54:741 (1985).16. N. Avgul, A. G. Bezus, E. S. Dobrova, and A. V. Kiselev. J. Colloid Interface Sci.
42:486 (1973).17. V. Biba, Z. Spitzer, and O. Kadlec. J. Colloid Interface Sci. 69:9 (1979).18. M. Jaroniec and J. Choma. Mater Chem. Phys. 19:267 (1988).19. R. W. Innes, J. R. Fryer, and H. F. Stoeckli. Carbon. 27:71 (1989).20. J. Fernandez-Colinas, R. Denoyel, Y. Grillet, F. Rouquerol, and J. Rouquerol.
Langmuir. 5:1205 (1989).21. B. McEnaney and K. J. Masters. Thermochim Acta. 82:81 (1984).22. S. Ozeki. Langmiur. 5:186 (1989).23. P. B. Balbuena and D. A. McQuarrie. J. Phys Chem. 92:4165 (1988).24. J. H. Cole, D. H. Everett, C. T. Marshall, A. R. Paniego, J. C. Powl, and F. Rodri-
guez-Reinoso. J. Chem. Soc. Faraday Trans. I. 70:2154 (1974).25. D. H. Everett and J. C. Powl. J. Chem. Soc. Faraday Trans I. 72:619 (1976).26. L. F. Smirnova, V. A. Bakaev, and M. M. Dubinin. Carbon. 25:599 (1987).27. A. Patrykiejew, S. Sokolowski, J. Stawinski, and Z. Sokolowski. J. Colloid Inter-
face Sci. 124:371 (1988).28. T. R. Rybolt, M. T. Epperson, H. W. Weaver, H. E. Thomas, S. E. Clare, B. M.
Manning, J. T. McClung. J. Colloid Interface Sci. 173:202 (1995).29. T. R. Rybolt, M. D. Wall, H. E. Thomas, J. W. Bramblett, M. Phillips. J. Colloid
Interface Sci. 138:113 (1990).30. C. Vidal-Madjar and A. Jaulmes. Pure Appl. Chem. 61: 2005 (1989).

38 Rybolt and Thomas
31. D. Poskus. Zh. Fiz. Khim. 61:3303 (1987).32. T. R. Rybolt and R. A. Pierotti AIChE J. (1984), 30(3), 510–1333. R. Leboda. Chem. Anal. (Warsaw) 21:1001 (1976).34. S. Sokolowski, R. Leboda, A. Waksmundzki. Rocz. Chem. 50:1565 (1976).35. Z. Suprynowicz, M. Jaroniec, and J. Gawdzik, Chromatographia 9:161 (1976).36. W. Rudzinski, Z. Suprynowicz, and J. Rayss. J. Chromatogr. 66:1 (1972).37. T. R. Rybolt, X. Zhang, M. D. Wall, H. E. Thomas, L. E. Mullinax and J. R. Lee,
J. Colloid Interface Sci., 149:359 (1992).38. T. Takaishi, T. Okada, and K. Nonaka. J. Chem. Soc., Faraday Trans. 93:1251
(1997).39. M. S. Sun, O. Talu, D. B. Shah. J. Phys. Chem. 100:17276 (1996).40. T. Ohgushi, H. Yokoyama. J. Chem. Soc., Faraday Trans. 88:3095 (1992).41. H. B. Abdul-Rehman, M. A. Hasanain, and K. F. Loughlin, Ind. Eng. Chem. Res.
29:1525 (1990).42. O. M. Dzhigit, A V. Kiselev, and T. A. Rakhmanova. Zeolites 4:389 (1984).43. R. Harlfinger, D. Hoppach, U. Quaschik, and K. Quitzsch. Zeolites 3:123 (1983).44. R. Harlfinger, D. Hoppach, H. P. Hofmann, R. Schoellner, and K. Quitzsch. Z.
Phys. Chem. (Leipzig) 261:65 (1980).45. J. R. Conder. Advan. Anal. Chem. Instrum. 6:209 (1967).46. S. Ross, I. D. Morrison, H. B. Hollinger. Adv. Colloid Interface Sci. 5:175 (1976).47. R. A. Pierotti. Chem. Phys. Lett. 2:420 (1968).48. T. R. Rybolt and D. R. Olson. J. Colloid Interface Sci. 163:303 (1994).49. D. R. Olson, T. R. Rybolt, D. S. Bodine, and M. D. Wall. J. Colloid Interface Sci.
159:205 (1993).50. X. Zhang and T. R. Rybolt. J. Colloid Interface Sci. 150:575 (1992).51. T. R. Rybolt, R. L. Mitchell, and C. M. Waters. Langmuir. 3:326 (1987).52. T. R. Rybolt and R. A. Pierotti. J. Chem. Phys. 70:4413 (1979).53. C. D. Bruce, T. R. Rybolt, H. E. Thomas, T. E. Agnew, and B. S. Davis. J. Colloid
Interface Sci. 194:448 (1997).54. S. A. Greene in Principles and Practice of Gas Chromatography (R. L. Pecsok,
ed.), John Wiley & Sons, New York, 1959. pp. 28–47.55. A. J. P. Martin and R. L. M. Synge. Biochemical J. 35:1358 (1941).56. P. E. Eberly and E. H. Spencer. Faraday Soc. London Trans. 57:289 (1961).57. D. Atkinson and G. Curthoys. J. Chem. Educ. 55:564 (1978).58. A. T. James and A. J. P. Martin. Biochemical J. 50:679 (1951).59. A. B. Littlewood, C. S. G. Phillips, and D. T. Price. J. Chem. Soc. London. 55:
1480 (1955).60. J. N. Israelachvili, Intermolecular and Surface Forces, Academic Press, London,
1985, pp. 65–85.61. A. C. Levy, T. R. Rybolt, and R. A. Pierotti. J. Colloid Interface Sci. 70:74 (1979).62. H. J. F. Stroud, E. Richards, P. Limcharoen, and N. G. Parsonage. J. Chem. Soc.
Faraday Trans. I 72:942 (1976).63. J. E. Lennard-Jones and A. F. Devonshire, Proc. Roy. Soc. London A. 163:53
(1937).64. J. E. Lennard-Jones and A. F. Devonshire, Proc. Roy. Soc. London A. 165:1
(1938).

Henry’s Law Behavior in GSC 39
65. J. O. Hirschfelder, C. F. Curtiss, and R. B. Bird, Molecular Theory of Gases andLiquids; John Wiley & Sons, New York, 1954, pp. 293–298.
66. R. Fowler and E. A. Gugenheim, Statistical Thermodynamics, Cambridge Univer-sity Press, London, 1949, pp. 336–342.
67. R. I. Derrah and D. M. Ruthven. Can. J. of Chem. 53:996 (1975).68. T. L. Hill, An Introduction to Statistical Thermodynamics; Addison-Wesley, Read-
ing, Massachusetts, 1960, p. 293.69. C. C. Yang, Ph. D. Thesis; Georgia Institute of Technology, Atlanta, Georgia, 1979.70. David R. Lide, ed. CRC Handbook of Chemistry and Physics 72nd edition, CRC
Press, Boca Raton, Florida, 1991.71. A. D. Crowell, in The Solid -Gas Interface Volume 1 (E. A. Flood, ed.), Dekker,
New York, 1967, pp. 175–202.72. F. London. Z. Phys. 63:245 (1930).73. F. London. Z. Phys. Chem. Abt. B. 11:222 (1931).74. R. N. Ramsey, Ph.D. Thesis; Georgia Institute of Technology, Atlanta, Georgia,
1970.75. A. C. Levy, Ph.D. Thesis; Georgia Institute of Technology, Atlanta, Georgia, 1976.76. D. M. Young and A. D. Crowell, Physical Adsorption of Gases, Butterworth, Lon-
don, 1962.77. G. E. Forsythe, M. A. Malcolm, and C. B. Moler, Computer Methods for Mathemat-
ical Computations; Prentice-Hall, Englewood Cliffs, New Jersey, 1997; pp. 84–105.
78. R. N. Ramsey, H. E. Thomas, and R. A. Pierotti. J. Phys. Chem. 76:3171 (1972).79. M. Jaroniec, X. Lu, and R. Madey. J. Colloid Interface Sci. 146:580 (1991).80. T. R. Rybolt and X. Zhang in Fundamentals of Adsorption: Proceedings of Fourth
International Conference on Fundamentals of Adsorption (M. Suzuki, ed.), Kodan-sha, Tokyo, 1993, pp. 553–558.
81. M. Karimi and G. Vidali, Phys. Rev. B. 36:7576 (1987) Erratum: M. Karimi andG. Vidali, Phys. Rev. B. 42:1462 (1990).
82. G. Vidali, M. W. Cole, and J. R. Klein. Phys. Rev. B. 28:3064 (1983).83. D. Graham, and W. S. Kay, J. Coll. Sci. 16:182 (1961).84. N. Dupont-Pavlovsky, C. Bockel, and A. Thomy Surf. Sci. 160:12 (1985).85. M. Karimi and G. Vidali. Phys. Rev. B, Condensed Matter. 34:2794 (1986).86. H. E. Thomas, R. N. Ramsey, and R. A. Pierotti. J. Chem. Phys. 59:6163 (1973).87. K. S. Sing, D. H. Everett, R. A. W. Haul, L. Moscou, R. A. Pierotti, J. Rouquerol
and T. Siemieniewska. Pure Appl. Chem. 57:603 (1985).88. P. J. Lin and J. F. Parcher. J. Colloid Interface Sci. 91:76 (1983).89. P. J. Lin and J. F. Parcher. Anal Chem. 57:2085 (1985).90. J. F. Parcher and P. J. Lin. J. Chromatography 250:21 (1982).91. F. Bruner, G. Bertoni, and P. Ciccioli. J. Chromatography 120:307 (1976).92. A. D. DiCorcia, R. Samperi, E. Sebastiana, and C. Severini. Anal. Chem. 52:1345
(1980).93. K. J. Hyver, J. F. Parcher, D. M. Johnson, and P. J. Lin. J. Chromatography 328:
63 (1985).94. G. Kraus. J. Phys. Chem. 59:343 (1955).95. M. H. Polley, W. D. Schaeffer, and W. R. Smith. J. Phys. Chem. 57:469 (1953).

40 Rybolt and Thomas
96. C. Vidal-Madjur, M. Gonnard, F. Benchah, and G. Guichon, J. Chromatogr. Sci.16:190 (1978).
97. M. Lal and D. Spencer. J. Chem. Soc. Faraday Trans. II 70:910 (1974).98. A. V. Kiselev, in Molecular Sieve Zeolites–II, Adv. Chem. Ser. 102; Am. Chem.
Soc., Washington, D. C., 1971, pp. 37–68.99. W. M. Meier, in Molecular Sieves; Soc. of Chem. Ind., London, 1968, pp. 10–27.
100. D. A. Whan, Chem. in Britian. 17:532 (1981).101. J. M. Newsam. Science. 231:1093 (1986).102. L. Brousard and D. P. Shoemaker, J. Am. Chem. Soc. 82:1041 (1960).103. K. Seff and D. P. Shoemaker. Acta Cryst. 22:162 (1967).104. K. Seff. Acc. Chem. Res. 9:121 (1976).105. J. L. Soto, Ph. D. Thesis; University of Pennsylvania, 1979.106. P. Broier, A. V. Kiselev, E. A. Lesnik, and A. A. Lopatkin. Russ. J. Phys. Chem.
(English Transl) 42:1350 (1968).107. P. Broier, A. V. Kiselev, E. A. Lesnik, and A. A. Lopatkin, Russ. J. Phys. Chem.
(English Transl) 43:844 (1969).108. A. G. Bezus, A. V. Kiselev, A. A. Lopatkin, and P. Q. Du. J. Chem. Soc. Faraday
Trans. 2. 74:367 (1978).109. A. V. Kiselev and P. Q. Du. J. Chem. Soc. Faraday Trans. 2. 77:1 (1981).110. A. V. Kiselev and P. Q. Du. J. Chem. Soc. Faraday Trans. 2. 77:17 (1981).111. J. L. Soto, P. W. Fisher, A. J. Glessner, and A. L. Myers. J. Chem. Soc. Faraday
Trans. 1. 77:157 (1981).112. A. V. Kiselev and A. A. Lopatkin, in Molecular Sieves; Soc. of Chem. Ind., London,
1968, pp. 252–266.113. R. S. Hansen, J. A. Murphy, and T. C. McGee. Trans. Faraday Soc. 60:579 (1964).114. R. S. Hansen. J. Phys. Chem. 63:743 (1959).115. R. S. Hansen and J. A. Murphy. J. Chem. Phys. 39:1642 (1963).116. G. I. Berezin. Russian J. Phys. Chem. 57:233 (1983).117. O. R. Meeks and T. R. Rybolt. J. Colloid Interface Sci. 196:103 (1997).118. M. P. Elizalde-Gonzalez, M. Hutfliess, and K. Hedden. J. High Resolut. Chro-
matogr. 19:345 (1996).119. R. Corbella, M. A. Rodriguez, M. J. Sanchez, F. Garcia Montelongo. Chromato-
graphia 40:532 (1995).120. A. Bemgard, A. Colmsjoe, and K. Wrangskog. Anal. Chem. 66:4288 (1994).121. H. Lamparczyk and A. Radecki. J. High Resolut. Chromatogr. Chromatogr. Com-
mun. 6:390 (1983).122. N. Dimov and M. Moskovkina. J. Chromatogr. 552:59 (1991).
2Inverse Gas Chromatography as aTool to Characterize Dispersive andAcid–Base Properties of the Surfaceof Fibers and PowdersMOHAMED NACEUR BELGACEM Department of Paper Science andTechnology, University of Beira Interior, Covilha, Portugal
ALESSANDRO GANDINI Polymeric Materials, Ecole Francaise dePapeterie et des Industries Graphiques, St. Martin d’Heres, France
I. Introduction 42
II. History and Principles of IGC 44
III. Advantages and Limitations of IGC 45
IV. Column Preparation 46
V. Instrumentation 46
VI. Methodology and Technical Precautions 47
VII. Probes and Their Relevant Characteristics 48A. Dispersive properties 48B. Surface area 48C. Acid–base properties 52
VIII. Calculation Procedures 54A. Determination of retention time 54B. Determination of retention volume 55C. Determination of dispersive properties 56D. Determination of thermodynamic parameters 59E. Determination of acid–base properties 61F. Determination of the fiber–matrix interaction parameter 67
IX. Dispersive Properties 68A. Characterization of fibers 68B. Characterization of organic fillers and powders 85
41
42 Belgacem and Gandini
C. Characterization of inorganic fillers and powders 95
X. Acid–Base Properties 108A. Fibers 108B. Fillers and powders 112
XI. Interaction Parameters in Composites and Blends 113
XII. Conclusions 113
Symbols and Abbreviations 116
References 118
I. INTRODUCTION
After the end of World War II, science and technology related to polymers under-went a spectacular development that resulted in the production of a wide varietyof materials covering a vast domain of applications. These thermoplastic andthermoset materials present many advantages compared with metallic, ceramic,and glassy counterparts, e.g., among others, a much lower density, and the easeof processing by simple procedures. During the last three decades, attention hasbeen focused on the combination of these polymers with natural or syntheticfibers and fillers in order to obtain high-added-value materials.
Whereas fiber-based composites ensure a considerable improvement of themechanical properties, which can reach those of metallic structures and provideapplications, e.g., in transport and space technology, the addition of powdersto polymers is particularly useful in the formulation of paints, inks, elastomers,coatings, blends, etc.
It is well known that the performance of both types of composite, particularlytheir mechanical properties, depends on the properties of the individual compo-nents (fiber and matrix) as well as on their surface compatibility. The latter pointis of great relevance because the physical and chemical nature of the interactionsbetween the continuous phase (matrix) and the reinforcing fibers or fillers deter-mines the quality of the interface. In fact, the work of adhesion between thematrix and the fibers (or fillers) is directly related to the surface energy (includingboth the dispersive and the nondispersive contributions) of each component.Therefore, in order to optimize the properties of a composite, it is essential todetermine accurately the surface properties of its matrix and reinforcing agent,i.e., the various factors making up the free energy of their surfaces.
In summary, the surface properties of fibers and fillers, used in the elaborationof polymer composites, emulsions, suspensions or blends, must be characterizedby three types of analyses, namely (1) their chemical composition, (2) their spe-cific area, and (3) their surface energy.

IGC and Surface Properties of Fibers 43
The chemical characteristics of the surface of fibers and fillers owe their rele-vance to the possibility of establishing specific interactions with the matrix likeacid–base exchanges, hydrogen bonding, or, indeed, covalent linkages. Thestronger these interactions, the more adhesive will be the interface and, conse-quently, the better the mechanical properties of the composite, which will tendto show only cohesive failure.
There are several techniques [1–4] that provide precise information about thesurface composition of solids in the form of fibers, powders and films. The mostcommon among them are Fourier transform infrared (FTIR) and Raman spectros-copy, x-ray photoelectron spectroscopy (XPS) and secondary ion mass spectrom-etry (SIMS). As shown in Table 1, each technique is characterized by a specificdepth of penetration from the surface. Thus, for example, the use of FTIR spec-troscopy working in the multiple reflection mode gives very poor informationabout surface chemistry because it analyzes down to about 1 µm, which corre-sponds to over 1000 molecular layers. Therefore, the inspection of surfaces thathave been subjected to chemical modification (grafting, oxidation, etc.) by thistechnique will not clearly reveal these changes unless the yields are particularlyhigh. Conversely, XPS gives more precise details about the chemical compositionof surfaces thanks to the low depth associated with the penetration of the scanningelectrons, i.e., approximately 3 nm, which corresponds to a few molecular layers.This advantage is often overshadowed by the considerable difference in cost and inmanipulation complexity between the two techniques favoring FTIR spectroscopy.
TABLE 1 Comparison of Different Techniques Used to Characterize Solid Surfaces
Depth ofanalysis
Technique (nm) Probe/response Information
FTIR 1000 hν/hν Chemical structure (func-tional groups)
Raman 50 hν/hν Chemical bonds andstructure
XPS 3 x-ray/photoelectrons Chemical bonds andstructure
SIMS 1 Ion/ion Chemical structureWettability — Molecule/molecule Surface energy and acid–
base propertiesIGC (gas adsorption) — Molecule/molecule Surface energy, acid–base
properties and surfacearea
BET — Molecule/molecule Surface area
FT, Fourier transform infrared; XPS, x-ray photoelectron spectroscopy; SIMS, secondary ion massspectrometry; IGC, inverse gas chromatography; BET, Brunauer–Emmet–Teller.
44 Belgacem and Gandini
The classical method used to characterize the surface area of powders andfibers is the BET (Brunauer–Emmet–Teller) technique, based on the determina-tion of the adsorption isotherms of different gases (nitrogen, argon, krypton, etc.)on the solid surface [5].
The surface free energy of solids is usually evaluated using static and dynamiccontact angle (CA) measurements [6–8]. However, this technique is not adaptedto porous or rough solid surfaces or to materials such as fibers and powders thatcannot be converted to continuous flat surfaces. The macroscopic character of theCA technique can, moreover, be the source of erroneous evaluations of surfaceproperties. Examples in this context are (1) the partial degradation of polymersduring the processing of films or plates that will influence CA values more thanthe actual surface composition; (2) the atmospheric contamination of high-energysurfaces like metals, oxides etc., which again gives rise to abnormally largechanges in CA values; and (3) the partial migration to the surface of additivespresent in polymeric materials.
An additional problem associated with the CA technique is the fact that itcannot intrinsically provide the actual value of the total surface energy, γ. Differ-ent authors (Fowkes [8], Van Oss [9], Zisman [10], Owens-Wendt [11]) haveproposed alternative approaches aimed at obtaining reliable values of the disper-sive and nondispersive contributions to γ, using different assumptions. The resultsobtained by applying these treatments often differ considerably among each otherand it is difficult therefore to assess their respective merits and drawbacks ingeneral terms.
The use of a more recent technique, namely, inverse gas chromatography(IGC) [12–15], to characterize surface properties has opened a new stimulatingfield of research because of the advantages it offers, coupled with a relativelysimple experimental setup.
This chapter deals with the use of IGC to determine surface properties offibrous materials, such as cellulose, glass, carbon, and aramid fibers, and pow-derous materials, such as synthetic polymers, lignins, and organic and inorganicpigments and fillers. The properties discussed here are on the one hand the disper-sive component of the free energy of the surface and on the other hand its acid–base character, as obtained from measurements at infinite dilution conditions.Before dealing with these issues, we will discuss the historical development ofthe technique, its principle, its advantages and limitations, the experimental meth-odology it requires, the instrumentation used and the calculation proceduresadopted to exploit its data.
II. HISTORY AND PRINCIPLES OF IGC
Conventional gas–liquid chromatography (GLC) was introduced in 1952 byJames and Martin and was not applied to the study of polymers because of their
IGC and Surface Properties of Fibers 45
low volatility. Fifteen years later, Kiselev [16] invented the IGC technique, whichremained unexploitable up to 1969, when Smidsrød and Guillet [17], developedits theory and methodology. The word inverse indicates that the material of inter-est constitutes the stationary phase rather than injected volatile probes. The col-umn containing the material under investigation is placed between the injectorand the detector of any conventional GLC equipment, and measurements consistof injecting volatile probes possessing known properties through the column viaan inert carrier gas. The retention time of each probe is related to the propertiesof the surface of the stationary phase.
The IGC technique can be carried out under two different conditions: (1) atinfinite dilution (or zero coverage), for which Henry’s law is rigorously applica-ble, and (2) at finite concentration. The infinite dilution conditions are based onthe injection of a very small quantity of the vapor of a given probe (106–107
mol) into the column which contains material with a large surface area. In theseconditions, the adsorbate–adsorbate interactions are neglected and the adsorp-tion-desorption phenomena occur only within a monolayer. These conditions en-able experiments to be carried out at low vapor concentrations with a surfacecoverage approaching zero. Measurements at finite concentrations are not rele-vant to the present context.
In addition to the surface properties of solid materials, IGC has been exten-sively used to characterize bulk properties of polymers, such as transition temper-atures, their degree of crystallinity, as well as the interaction parameters of somepolymer solvents [18,19] and/or polymer–polymer systems [20,21].
III. ADVANTAGES AND LIMITATIONS OF IGC
IGC was found to be a good complementary method for surface properties charac-terization that presents numerous advantages, namely:
1. Simplicity2. Lack of sensitivity to surface rugosity compared to CA measurements3. Applicability to materials that cannot be cast in the form of films4. No surface contamination of samples under investigations from the sur-
rounding atmosphere5. Relative rapidity of data collection6. Accuracy of results7. Data collection over an extended temperature range8. A large variety of probes, with different acid–base or neutral character9. Ease of temperature control, and
10. Low capital investment for the basic tool, i.e., GLC equipment
However, IGC has also some limitations because it requires a well-definedparticle size range and cannot be applied to high-surface-energy materials be-

46 Belgacem and Gandini
cause of chemisorption. Materials that cannot be easily ground to a fine powderare also not suitable for IGC.
IV. COLUMN PREPARATION
There are three types of IGC columns: packed, capillary and fiber [22]. The firsttype requires the preparation of a concentrated solution of the substrate and itsadsorption onto the solid support or the capillary column walls. This falls outsidethe scope of this book and will not be treated here.
To carry out the IGC characterization of fibers and powders, the most com-monly used columns are made of stainless steel or Pyrex and have an internaldiameter of 3–7 mm. Their length can vary from 20 to 400 cm. Packing thecolumn will vary with the size of the material under study. Fibers and particlesof 200–400 µm prevent the plugging of the column. Long fibers are cut andsieved before packing. Some synthetic polymers have also been studied in theform of particles with a 200- to 500-µm size. Particles were obtained by crushingand sieving the initial coarse polymer grains [23].
In the case of film-like materials (paper, cellophane, etc.) that are 20–40 µmthick, small ‘‘confetti’’ discs are prepared using a cleaned paper tape punch ma-chine. This confetti (1–1.5 mm) is then collected and introduced into thecolumn [24].
When the average particle size is too small (a few micrometers), two methodsof column loading have been reported to avoid plugging: (1) the fine powder ismixed with standard glass beads (200–300 µm) at a known ratio and the columnsloaded with this mixture [25]. A dummy column filled with the same glass beadsis then used for calibrations [25]. (2) Alternatively, powders can be compressedinto pellets, which are then crushed and sieved to select the fraction of agglomer-ates with diameters between 200 and 400 µm [26].
A small glass fiber stopper is usually placed at each of the two ends of thecolumn. Columns are obviously weighed before and after packing to determinethe quantity of packed substrate. The reader should keep in mind that in all casesthe goal is to provide the maximum possible fiber or powder surface areas withoutplug formation.
V. INSTRUMENTATION
A standard GLC apparatus equipped with a flame ionization detector (FID) iscommonly used to carry out IGC data collection. Thermal conductivity detectors(TCDs) have been also used for this purpose [27,28]. Inert carrier gases are typi-cally helium or nitrogen, but hydrogen has also been employed. To measure theflow rate of the carrier gas, usually a soap bubble flow meter is used. The pressureat the inlet of the column is given by the internal manometer of the GLC equip-
IGC and Surface Properties of Fibers 47
ment, whereas the outlet pressure of the column is taken as the atmospheric pres-sure and is usually measured by a mercury barometer. The oven temperature isconventionally measured with a Pt resistance thermometer. Oven, injector, anddetector are always thermostated. Recently, automatic systems for sample injec-tion and data storage have become commercially available.
VI. METHODOLOGY AND TECHNICALPRECAUTIONS
The filled columns are usually conditioned overnight at 105–110°C, but in certaincases the conditioning temperature can be lower or higher. To measure the reten-tion time for a given probe, a small quantity of its own vapor and the marker(1–5 µl) are injected into the column using a 10-µl microsyringe. Experimentsare usually repeated at least in triplicate for each probe. Then the retention timeis taken from the chromatograms, which are usually recorded with an integratoror a microcomputer. The dead volume is usually determined by the injection ofa nonadsorbing marker. The retention volume for the marker should be tempera-ture-independent so that any adsorption phenomenon can be considered negli-gible.
There are some technical requirements for the success of the IGC experimentsand the obtention of exploitable data. Before starting data collection, the validityof the IGC method for a given material should be verified from specific experi-mental observations, namely:
1. Chromatographic peaks for polar as well as nonpolar probes and for thenoninteracting marker should be reproducible, so that permanent sorbtion ofthe probes onto the solid under investigation can be neglected.
2. Peaks for all probes, including the marker, should be sharp and symmetricalto testify the absence of their diffusion inside the investigated materials.
3. The retention volume of a given probe should remain constant when the flowrate of the carrier gas is increased or decreased, confirming once again theabsence of diffusion into the bulk of the materials under scrutiny.
4. Permanent surface contamination of the substrate should be avoided. Thiscan be checked by injecting again a neutral probe at the end of the series ofexperiments with different neutral, acidic, basic, and amphoteric probes. Itsretention time should remain unchanged.
5. The volume of the injected vapor should not affect the retention time, whichshould be constant within the range of 1–10 µl, in order to confirm thatthe zero coverage conditions are respected and that there are no adsorbate–adsorbate interactions.
These observations ought to be valid for experiments conducted at all tempera-tures and under different carrier gas flow rates.

48 Belgacem and Gandini
VII. PROBES AND THEIR RELEVANTCHARACTERISTICS
Neutral, acidic, basic, and amphoteric volatile probes are used to investigate thedispersive and acid–base properties of surfaces by IGC. The n-alkane series (neu-tral probes) used to determine the dispersive energy usually consists of the normalisomers of hexane, heptane, octane, and nonane, but higher n-alkanes, such asdecane, undecane, and dodecane, have also been used. Lewis acid probes areusually chloroform, methylene chloride, and carbon tetrachloride. The family ofLewis base probes is formed essentially by tetrahydrofuran and diethyl oxide(ether). Finally, acetone and ethyl acetate are used as amphoteric probes. Themost commonly used marker is methane, but propane has also been reported[29–32]. The relevant characteristics of these probes, which are used in the calcu-lation of dispersive and acid–base properties, are discussed below.
A. Dispersive Properties
The dispersive contribution to the surface tension of the probes in the liquid stateis determined by CA and Wilhelmy plate measurements. The dispersive energyvalues of the probes are summarized in Table 2, which also includes their boilingpoint and vapor pressure at 25°C, because these parameters are also used in IGCcalculations.
B. Surface Area
The surface area, a, (A2) that a molecule of adsorbate occupies on the solid sub-strate was first calculated by Emmet and Brunauer [33] from the density of thecorresponding liquids according to the following empirical equation:
a(A2) 1.091[M/ρN]2/31016 (1)
where M is the molecular weight of the sorbate (g/mol), ρ its density in the liquidstate (g/m3), and N Avogadro’s number. The effect of the density term is tomake a temperature-dependent although in practice a appeared to be practicallyinsensitive to temperature.
Gray et al. [24,34,35] determined the specific area of cellulosic materials fromadsorbtion isotherms of organic molecules onto the fibers’ surface. They usedEq. (1) to estimate the surface area of the adsorbed probes and found that thevalues obtained from nitrogen adsorbtion were systematically about 20% largerthan those obtained from the isotherms of the organic vapors. They concludedthat the values obtained from Eq. (1) were underestimated and introduced a cor-rection factor of 22%. Thus:
ac 1.22a (2)

IGC and Surface Properties of Fibers 49
TABLE 2 Values of Boiling Temperatures at 1 Atm, Vapor Pressure at 25°C and theDispersive Component of Surface Energy of Compounds Commonly Used as Probes inIGC
bp P0 γDL Acid–base
Molecule (°C) (kPa) (mJ/m2) properties
n-Pentane 36 91.7 15.5 Neutraln-Hexane 68.7 20.2 17.9 Neutraln-Heptane 98.5 6.09 20.3 Neutraln-Octane 125.6 1.86 21.3 Neutraln-Nonane 150.8 0.57 22.7 Neutraln-Decane 174.1 0.17 23.4 Neutraln-Undecane 195.9 — 24.6 Neutraln-Dodecane 259 — — NeutralCyclohexane 80.7 13.0 24.7 NeutralMethylene chloride 40.0 58.2 27.2 AcidicCloroform 61.1 26.2 26.7 AcidicCarbon tetrachloride 76.8 15.2 26.4 AcidicBenzene 80.0 12.7 28.2 AcidicToluene 110.6 3.79 27.9 Acidicp-Xylene 138.3 1.19 — AcidicChlorobenzene 131.7 1.60 — AcidicNitromethane 101.1 4.79 — AcidicMethanol 64.6 16.9 22.1 AcidicEthanol 78.2 7.87 22.0 AcidicPropanol 97.2 2.76 23.3 Acidicn-Butanol 117.7 0.86 24.9 AcidicTetrahydrofuran 65.0 21.6 22.5 BasicDiethyl oxide 34.5 71.7 16.7 BasicTriethylamine 89.0 7.70 20.2 BasicPyridine 115.2 2.76 36.6 Basicn-Butylamine 77.0 12.2 23.4 Basic1,4-Dioxane 101.5 4.95 — BasicAcetonitrile 81.6 11.9 — BasicAcetone 56.0 30.8 20.7 AmphotericEthyl acetate 77.1 12.6 20.5 Amphoteric2-Butanone 79.5 12.6 — AmphotericWater 100 3.17 21.1 Amphoteric
Table 3 reports the values of the surface area of molecules commonly usedas probe, as obtained from different approaches.
Hill [36] calculated the surface area of some probes on the basis of the corre-sponding atomic van der Waals radii (Table 3). This method, which is based on

50 Belgacem and Gandini
TABLE 3 Values of the Molecular Surface Area of Compounds Commonly Used asProbes in IGC According to Different Approaches
Surface area (A2)
As calculated according to As measured by
Emmet Hill Gray Snyder BET SchultzProbe [33] [36] [24] [39] [38] [42]
n-Pentane 36.2 37.2 44.2 50.2 49.2 —n-Hexane 39.6 42.2 48.3 57.8 56.2 51.5n-Heptane 42.5 46.6 51.9 65.5 63.1 57.0n-Octane 45.7 51.6 55.8 73.1 64.6 62.8n-Nonane 48.5 56.3 59.2 80.8 84.4 68.9n-Decane 51.4 61.0 62.7 87.6 86.0 —n-Undecane 54.1 65.5 66.2 95.2 — —n-Dodecane 57.0 69.9 69.6 102.9 — —Cyclohexane 34.7 36.5 42.4 51.0 41.7 —CH2Cl2 24.5 26.4 29.9 34.9 — —Chloroform 28.5 29.4 34.8 42.5 27.9 44.0CCl4 32.2 34.2 39.3 42.5 39.2 46.0Benzene 30.5 32.6 37.2 51.0 43.6 46.0Toluene 34.3 38.0 41.9 57.8 55.2 —p-Xylene 37.9 43.3 46.2 64.6 — —Chlorobenzene 33.3 37.2 40.7 57.8 — —Nitromethane 21.8 29.8 26.6 32.3 — —Methanol 18.0 21.9 22.0 26.4 21.9 —Ethanol 23.0 26.4 28.1 34.0 28.3 —n-Propanol 27.2 30.5 33.1 41.7 32.8 —n-Butanol 31.1 34.9 37.9 49.3 35.4 —THF 28.7 30.6 35.0 42.5 — 45.0Diethyl oxide 33.8 35.1 41.2 38.3 42.0 47.0TEA 41.1 43.5 50.1 — 43.0 —Pyridine 28.5 31.6 34.8 49.3 39.0 —Butylamine 32.7 34.6 39.8 49.3 — —1,4-Dioxane 29.6 32.2 36.1 51.0 — —Acetonitrile 21.4 32.2 26.1 85.0 — —Acetone 27.1 31.3 33.0 35.7 — 42.5Ethyl acetate 31.5 36.3 38.5 48.5 — 48.02-Butanone 30.6 35.0 37.4 39.1 — —Water 10.5 13.1 12.8 — 12.5 —
BET: Brunauer–Emmet–Teller technique.

IGC and Surface Properties of Fibers 51
the size of atoms in the absence of any adsorbate, excludes the interactions ofthe probe with the substrate. This work showed that the surface areas related tothe three-dimensional van der Waals constant, b, through the following equation:
a Π2 3b
2Π2/3
(3)
where b can be expressed as a function of the critical temperature, Tc (°K) andpressure, Pc (atm), to give Eq. (4):
a 6.354 Tc
Pc
2/3
(4)
The values thus obtained are also reported in Table 3.Avgul et al. [37] have also determined the surface area of the n-alkane probes.
They gave a value of 45 A2 for n-pentane and an increment of 6 A2 for eachadditional methylene group in the series. McClellan and Harnsberger [38] deter-mined this parameter by projecting the molecular model of the given probe andmeasuring the surface area of the projected molecular using a planimeter. Thevalues thus obtained were much lower than those obtained from liquid density[33] [eq. (1)] and van der Waals radii [36] Eq. (3)] and depended strongly onthe spatial configuration of the probe. McClellan and Harnsberger [38] summa-rized, for comparison, the average values of the surface area of different probemolecules as obtained from BET measurements as shown in Table 3.
Snyder [39] has also reported the value of the surface area of some probesmaking the assumption that there is a total adsorption of the probe on a planesurface. He did not take into account the specific conformation that a given probecan acquire when it is in contact with the surface. In this work the author deter-mined the surface area of different groups (methyl, methylene, nitro, mercapto,etc.) and expressed the surface area of the adsorbed molecules as the sum of thecontributions from each group (ai) following Eq. (5):
a i
ai (5)
Finally, Schultz et al. [40–42] have undertaken the same task and obtainedthe values of the surface area for a series of neutral and polar probes. Theseauthors used neutral reference surfaces like polytetrafluoroethylene (PTFE) orpolyethylene and used Eq. (6) to calculate a:
a RT ln VN
2N √γDS γD
L
(6)

52 Belgacem and Gandini
where γDS is the dispersive contribution to the energy of the reference solid surface
determined by CA and VN the net retention time of a given probe (see below).Two major limitations can be ascribed to this approach, i.e., (1) a universal refer-ence surface is needed and (2) the surface energy of PTFE used in Eq. (6), wasobtained from CA measurements which always give lower values of γD
S than thoseobtained from IGC.
Table 3 summarizes the values of the surface area of probe molecules as ob-tained from models or other different approaches.
It is worth noting that the molecular area of a probe remains a key parameterin IGC measurements because it can vary with the nature of adsorbent. Thus, afluctuation of 20% in the values of this parameter induces an error of 56% inthe calculated γD
S value.
C. Acid–Base Properties
The acid–base properties of the probes used for IGC surface investigations arebased mostly on Gutmann’s approach [43]. Gutmann determined acceptor (AN)and donor (DN) numbers of polar molecules, but his approach has been the sub-ject of discussion because AN and DN values are determined by two completelydifferent methods.
AN concerns the acidity (or the electron acceptor capacity) of a substance(mostly solvents). It is determined from the 31P NMR chemical shift of triethylphosphine oxide (C2H5)3 P O (TPO) in its presence according to the follow-ing interaction:
Et
EtPO :→ acceptor (7)
Et
TPO is taken as a base (or electron donor) reference. When its oxygen atominteracts with an acceptor, the electron density at the phosphorus atom decreasesand induces a downfield chemical shift (δ) of 31P in the corresponding NMRspectrum. Gutmann has extrapolated the values of δ to infinite dilution and usedhexane as a reference solvent to which he assigned an AN value of 0. The δvalues of the other solvents were corrected for the difference in volume suscepti-bilities with respect to hexane. Gutmann used antimony pentachloride in 1,2-dichloroethane as the strongest Lewis acid, to which the value of 100 was attrib-uted. The other solvents were related to this arbitrary scale following Eq. (8):
AN δcorr ∗ 100δcorr (TPO.SbCl5)
2.348 ∗ δcorr (8)

IGC and Surface Properties of Fibers 53
The Gutmann acid number concept is difficult to interpret from the point of viewof absolute values of AN, since, for example, pyridine, which is well known asa rather strong Lewis base, has an AN value of 14.2. Recently, Rieddle andFowkes [44] raised some problems related to the AN scale and proposed correctedvalues of AN, noted AN*. This new parameter takes into account the dispersiveeffect of the investigated acid. In fact, they showed that liquids with only disper-sive properties, such as hexane, induce a significant shift in the 31P NMR spectrumof TPO. With this correction, the AN value for pyridine fell from 14.2 to 0.5.Rieddle and Fowkes [44] also showed that the corrected values of AN can becorrelated to the enthalpy of formation of the TPO–acid adduct. Thus, AN* andDN can now be expressed with the same units (see below). They also proposeda correlation between the two scales:
AN* ∆H(ATPO) 0.288(AN AN d) (9)
where AN is the original Gutmann number and AN d that related to the dispersioncontribution and reported by Rieddle and Fowkes [44].
The values of AN* for probes used in IGC are reported in Table 4. The acid–
TABLE 4 Values of the Acid–Base Numbers of Molecules Commonly Used asProbes in IGC According to Gutmann’s [43], Fowkes’ [44] and Drago’s [49]Approaches
Gutmann DragoFowkes
Probes AN DN AN* CA EA CB EB
Methylene chloride 20.4 0 3.9 — — — —Chloroform 23.1 0 5.4 0.15 3.31 — —Carbon tetrachloride 8.6 0 0.7 — — — —Benzene 8.2 0.1 0.17 — — 0.707 0.486p-Xylene — — — — — 1.78 0.574Nitromethane 20.5 2.7 4.3 — — — —Methanol 41.5 19.0 12.0 — — — —Ethanol 37.9 20.0 10.3 — — — —n-Butanol 36.8 — 9.1 1.12 0.05 — —Tetrahydrofuran 8.0 20.0 0.5 — — 4.27 0.978Diethyl oxide 3.9 19.2 1.4 — — 3.25 0.963Triethylamine — 61.0 — — — 11.09 0.991Pyridine 14.2 33.1 0.14 — — 6.4 1.17Acetonitrile 19.3 14.1 4.7 — — 1.34 0.8861,4-Dioxane 10.8 14.8 0 — — 2.38 1.09Acetone 12.5 17.0 2.5 — — 2.33 0.987Ethyl acetate 9.3 17.1 1.5 — — 1.74 0.975Water 54.8 18.0 15.1 2.45 0.33 — —

54 Belgacem and Gandini
base concept, applied to the solid surfaces, were reviewed recently in a specialbook edited to celebrate the 75th birthday of Professor Frederick M. Fowkes [45].In the same book, Fowkes [46] recommended the use of chloroform as an acidprobe and of diethyl ether or triethylamine as basic probes because they possessthe weakest energy of self-association.
DN, which reflects the basicity (or electron donor) ability, is determined asthe molar enthalpy for the reaction of the given electron donor probe in a 103
M solution in 1,2-dichloroethane [43] with the very strong acceptor SbCl5 takenas a reference:
D SbCl5 D ⋅ SbCl5(∆HD ⋅SbCl5 DN) (10)
The acceptor and donor numbers are dimensionless parameters even if DNshould be expressed in J/mol. For the systematic comparison between a referencematerial and its modified forms, this approach can provide interesting informa-tion.
Some authors [47,48] have used the Drago [49] approach to select the acidand basic probes. The four-parameter equation proposed by Drago predicts theenthalpy of formation of the one-to-one molecular adduct in the gas phase or innoncoordinating solvents:
∆HAB CACB EA EB (11)
where the C parameters represent the covalent contributions and the E ones thosearising from the electrostatic interactions between the acid and the basic compo-nents of the adduct.
In reality many molecules have both acceptor and donor sites, but amphotericprobes have not been taken into account in this formalism. Table 4 gives thevalues of C and E for different probe molecules used in IGC measurements toestablish the acid–base characteristics of a solid surface.
VIII. CALCULATION PROCEDURES
A. Determination of Retention Time
For perfectly symmetrical peaks, the simplest method for retention time (tr) deter-mination consists of taking the time corresponding to their maximum intensity.For asymmetrical peaks, Conder et al. [50] have introduced the skew ratio η,which is a simple measure of asymmetry. This parameter is the ratio of the slopeof the trailing (last eluted) edge of the peak to that of the leading (first eluted)edge, both edges being measured at the respective points of inflexion. The skewratio is therefore equal to a/b as shown in Fig. 1. For symmetrical peaks η isobviously equal to unity. Conder and Young [51] recommended the use of thepeak maximum method when the skew ratio varies from 0.7 to 1.3. The retention

IGC and Surface Properties of Fibers 55
FIG. 1 Determination of the skew ratio (η) and the retention time (t r ) from assymetricalpeaks. (From Ref. 51.)
time of asymmetrical peaks with a skew ratio lower than 0.7 or higher than 1.3is best given by [51]:
t r t1 t 2
2(12)
where t1 and t 2 are the times at which the tangents to the leading and trailingside of the peak intercept the baseline, respectively, as shown in the typical chro-matogram of Fig. 1.
Recently, Kamdem and Riedl [52] carried out a comparative investigationusing peak maxima and Conder and Young’s method and calculated thermody-namic parameters of lignocellulosic fibers coated with thermosetting polymers.The results of this work are reported in appropriate Sec. IX.A.2 below.
B. Determination of Retention Volume
The IGC chromatograms provide the following information: (1) the retentiontime, t r , of a given probe; (2) the retention time, t o, of the noninteracting marker;(3) the carrier gas flow rate, F; and (4) the inlet (Pi ) and outlet (Po) pressure ofthe column. These experimental data allow the calculation of the net retention

56 Belgacem and Gandini
volume, VN, which is the key thermodynamic parameter of IGC measure-ments [53]:
VN FD(t r t o) (13)
where D is the James-Martin correction factor [54] for gas compressibility, whichcan be calculated from Eq. (14):
D
3Pi
Po
2
12Pi
Po
3
1(14)
C. Determination of Dispersive Properties
Two approaches have been elaborated to calculate the dispersive component ofthe surface energy of solids investigated by IGC at infinite dilution conditions.Both are based on the fundamental Fowkes’ formalism, which considers thatthe surface energy of any substance can be written as a sum of dispersive andnondispersive (or specific) contributions [55]:
γS γDS γ SP
S (15)
The same approach has been extended to the work of adhesion (WA) betweentwo phases [55,56]:
WA W DA W SP
A (16)
Dorris and Gray [57] have assumed that the free energy of adsorption of amethylene group (∆G (CH2 )
A ) can be correlated to its work of adhesion with thesurface of the solid under investigation as follows:
∆G (CH2)A Na(CH2) W
(CH2)A (17)
where a(CH2) is the surface area of a methylene group and N Avogadro’s number.According to Girifalco and Good [58], the dispersive work of adhesion can
be expressed as:
W DA 2 √γD
S γDL (18)
Combining Eqs. (17) and (18) leads to
∆G (CH2 )A
Na(CH2)
2 √γD(CH2)γD
S (19)

IGC and Surface Properties of Fibers 57
or
γDS
(∆G (CH2)A )2
4N 2(aCH2)2γ(CH2)
(20)
where γ (CH2) is the surface energy of polyethylene-type polymers with a finitemolecular weight, given by Eq. (21) [59]:
γ (CH2) 34.0 0.058T(mJ/m2) (21)
where T is expressed in °C.The free energy ∆GA was correlated either to the surface partition coefficient,
Ks, which characterizes the adsorbate–adsorbent interaction, or as a function ofthe net retention volume, VN, as follows:
∆GA RT lnKsps, g
Πs (22)
or:
∆GD ∆GA RT lnVN P0
Smπ0 (23)
where ∆G is the free energy of desorption (or adsorption) of 1 mol of solutefrom a reference state, defined by the bidimensional spreading pressure π0 of theadsorbed film, to a reference gas phase state, defined by the partial pressure P0
of the solute; ps, g is the adsorbate vapor pressure in the gas phase; Πs is thespreading or surface pressure of the adsorbed gas in the standard adsorption state(see below); S is the specific area and m the weight of the substrate in the column.
Two reference states are generally considered, i.e., that defined by Kemballand Ridel [60], where P0 1.013 105 Pa and π0 6.08 105 N/m, and thatproposed by De Boer [61], where P0 1.013 105 Pa and π0 3.38 104 N/m.
Equations (22) and (23) each contain five constants and they can be easilysimplified to give:
∆GA RT ln Ks C1 (24)
∆GA RT ln VN C2 (25)
Dorris and Gray [57] introduced the free energy corresponding to a methylenegroup, ∆G (CH2)
A , as:
∆G (CH2)A ∆G (Cn1H2n4)
A ∆G (CnH2n2)A (26)

58 Belgacem and Gandini
and from Eqs. (24) and (25) they deduced the free energy corresponding to amethylene group, ∆G (CH2)
A , as:
∆G (CH2)A RT lnK (Cn1H2n4)
s
K (CnH2 n2)s
(27)
or:
∆G (CH2)A RT lnV (Cn1H2n4)
N
V (CnH2n2)N
(28)
Combining Eqs. (20) and (27) on the one hand and Eqs. (20) and (28) on theother, the London component of the surface energy can be written following Eqs.(29) and (30), respectively, as follows:
γ SD
RT lnK (Cn1H2n4)s
K (CnH2n2)s
2
4N 2(aCH2)2γ(CH2)
(29)
or
γDS
RT lnV (Cn1H2n4)
N
V (CnH2n2)N
2
4N 2(aCH2)2γ(CH2)
(30)
Figure 2 shows a schematic representation of the approach proposed by Dorrisand Gray [57].
The value of 6 A2 is the most widely used for the cross-sectional area of CH2,but other values have been also put forward. Thus, according to Groszek’s model[62], based on the calculation of the surface area of the hexagon in the graphitebasal plane, the surface area of a methylene unit is 5.2 A2. Two years later, Clint[63] studied the adsorption of hydrocarbons on graphitized carbon and found anincrement per CH2 group of 5.5 A2. It is worth mentioning that the use of Gros-zek’s or Clint’s value of the surface area of a methylene group induces an increaseof the dispersive component γD
S of 30% and 20%, respectively.Schultz et al. [40–42] have proposed a second method for the determination
of the dispersive component of the surface free energy of the adsorbate underinvestigation. They used the assumption of Dorris and Gray [see Eq. (17)] andcorrelated it to the free energy of adsorption-desorption determined by Eq. (25):
RT ln VN 2Na √γDS γD
L C (31)
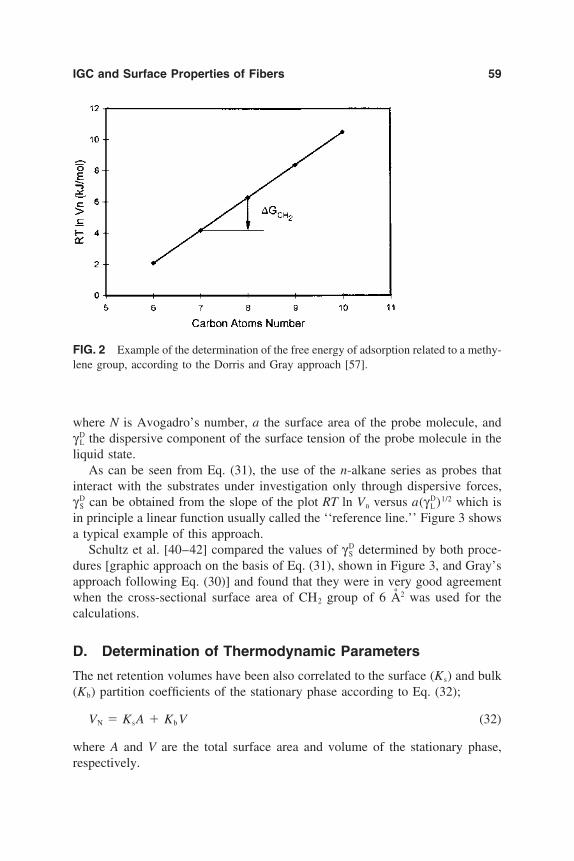
IGC and Surface Properties of Fibers 59
FIG. 2 Example of the determination of the free energy of adsorption related to a methy-lene group, according to the Dorris and Gray approach [57].
where N is Avogadro’s number, a the surface area of the probe molecule, andγD
L the dispersive component of the surface tension of the probe molecule in theliquid state.
As can be seen from Eq. (31), the use of the n-alkane series as probes thatinteract with the substrates under investigation only through dispersive forces,γD
S can be obtained from the slope of the plot RT ln Vn versus a(γDL )1/2 which is
in principle a linear function usually called the ‘‘reference line.’’ Figure 3 showsa typical example of this approach.
Schultz et al. [40–42] compared the values of γDS determined by both proce-
dures [graphic approach on the basis of Eq. (31), shown in Figure 3, and Gray’sapproach following Eq. (30)] and found that they were in very good agreementwhen the cross-sectional surface area of CH2 group of 6 A2 was used for thecalculations.
D. Determination of Thermodynamic Parameters
The net retention volumes have been also correlated to the surface (Ks) and bulk(Kb) partition coefficients of the stationary phase according to Eq. (32);
VN KsA Kb V (32)
where A and V are the total surface area and volume of the stationary phase,respectively.

60 Belgacem and Gandini
FIG. 3 Example of the determination of the dispersive contribution to the surface energy,according to Schultz et al. [41].
In IGC conditions the solution of the probe in the stationary phase is negligibleand Eq. (32) reduces to:
VN Ks A (33)
The surface partition coefficient that characterizes the adsorbate–adsorbentinteraction may therefore be determined for different probes if A has been previ-ously determined.
The three fundamental thermodynamic parameters related to the adsorption–desorption processes are often used to evaluate the physicochemical affinity be-tween the probe and the sorbent. These parameters are (1) the standard free energychange, ∆GA, (2) the enthalpy change, ∆HA, and (3) the standard entropy change,∆SA which can be determined from the partition coefficient Ks and/or the netretention volume of adsorption–desorption. We report below the experimentalapproaches and the calculation procedures used to obtain these parameters andtheir use to determine the acid–base properties of solid substrates.

IGC and Surface Properties of Fibers 61
1. Determination from the Partition CoefficientThe partition coefficient Ks can be correlated to the thermodynamic parametersof the solid surface [64] using Eqs. (34)–(36):
∆GA/RT ln Ks C (34)
d ln (Ks)
d1T
∆HA
R (35)
∆SA ∆HA ∆GA
T (36)
2. Determination from the Net Retention VolumeAs mentioned above, the retention volume of a given probe, VN, is related tothe free energy of adsorption by Eq. (25). Carrying out experiments at differenttemperatures, the free enthalpy ∆HA and the free entropy of desorption ∆SA canbe obtained by applying Eq. (37):
∆GA ∆HA T∆SA (37)
Plotting ∆GA versus T (Fig. 4), the values of ∆HA and ∆SA can be deducedfrom the intercept and the slope, respectively, according to Eq. (37). Equation(38) can also be used for this purpose:
∆GA
T∆HA
T ∆SA (38)
E. Determination of Acid–Base Properties
In addition to dispersive interactions, polar probes are injected to study possibledonor–acceptor interactions with the solid surfaces studied. These interactionsshow up as a deviation from the straight line (reference alkane line) behaviorand can be quantified by the free energy, ∆GA, of adsorption–desorption of thespecific polar probe [40]:
∆GA ∆G DA ∆G SP
A NaW DA NaW SP
A (39)
The dispersive free energy of adsorption can be expressed as:
∆G DA NaW D
A RT ln VNref (40)

62 Belgacem and Gandini
FIG. 4 Example of the determination of the enthalpies of adsorption ∆HA for differentpolar probes, according to Schultz et al. [41]. Ac, acetone; Eth, diethyloxide. (FromRef. 41.)
The combination of Eqs. (25), (39), and (40) gives:
RT ln VN RT ln VNref NaW SPA (41)
or
∆G SPA NaW SP
A RT ln VN
ln VNref (42)
where VN is the retention volume of the corresponding polar probe and VNref thatderived from the n-akanes reference line, at the value of a(γD
L )1/2 correspondingto the polar probe used, as shown in Fig. 5.
In order to assess the acid–base characteristics of solid surfaces by IGC differ-ent approaches have been proposed in the literature. The simplest one consistsin studying the specific interactions between the surface investigated and tworeference polar molecules, i.e., a donor probe and an acceptor one. The quantity

IGC and Surface Properties of Fibers 63
FIG. 5 Schematic determination of the specific free energy of adsorption, ∆G sp of polarprobes according to Schultz et al. [41].
∆GA determined for each probe is related to the corresponding ANs and DNs valuesfor the solid [eqs. (43) and (44)]. It is assumed that these parameters describethe acid and the basic character of the surface [65] respectively, and thus theratio ANs /DNs gives an indication of their relative importance [eq. (45)].
∆G SPA donor ANs (43)
∆G SPA acceptor DNs (44)
∆G SPA donor
∆G SPA acceptor
ANs
DNs (45)
The following arbitrary acid–base scale has been proposed [65]:
ANs /DNs 1.1 acid surface (46)
ANs /DNs 0.9 basic surface (47)
0.9 ANs /DNs 1.1 amphoteric surface (48)
ANs DNs 0 neutral (nonpolar) surface (49)

64 Belgacem and Gandini
The donor and acceptor couples most often used are tetrahydrofuran/chloro-form [32,65,66] and diethyloxide/methylene chloride [67].
Although the above approach is somewhat arbitrary, it gives interestinginformation. Thus, for example, an increase in the ANs /DNs ratio after a givensurface modification means that the applied treatment increased its acidic char-acter.
The second approach was proposed by Schultz et al. [40–42]. It was deducedfrom the acid–base theory introduced by Gutmann [43] and applied to the polarprobes. In fact, these authors elaborated a semiquantitative approach to character-ize the acid–base properties of solid surfaces based on the correlation of ∆Hsp
with the acid–base properties of polar probes (DN, AN) and those of the investi-gated surface, following Saint Flour and Papirer [68]:
∆Hsp KA DN KB AN (50)
where KA and KB describe, respectively, the acid and base characteristics of thesolid surface and are the slope and the intercept of the plot ∆Hsp /AN versus AN/DN (Fig. 6) according to:
∆Hsp
AN KA
DN
AN KB (51)
More recent investigations have reported results on the determination of acidand base numbers of solid surfaces using the corrected AN* parameters [44].
The third approach was developed by Boluk and Schreiber [47] on the basisof Drago’s acid–base concept [49]. These authors determined the interaction pa-rameter, Ω, of homologous series of alcohols, used as acidic probes, and amines,used as basic ones. This interaction parameter reflects the acid–base propertiesof the solid surface and is defined as follows: for acidic surfaces, the specificretention volume (V 0
g), of the basic probe exceeds that of the acidic alcohol (n-butylamine and n-butyl alcohol are commonly used to calculate Ω) and thus Ωis negative:
Ω 1 (V 0
g)b
(V 0g)a
0 (52)
For basic surfaces, the retention volume of the acidic probe exceeds that of thebasic amine, yielding a positive value of Ω:
Ω 1 (V 0
g)a
(V 0g)b
1 0 (53)
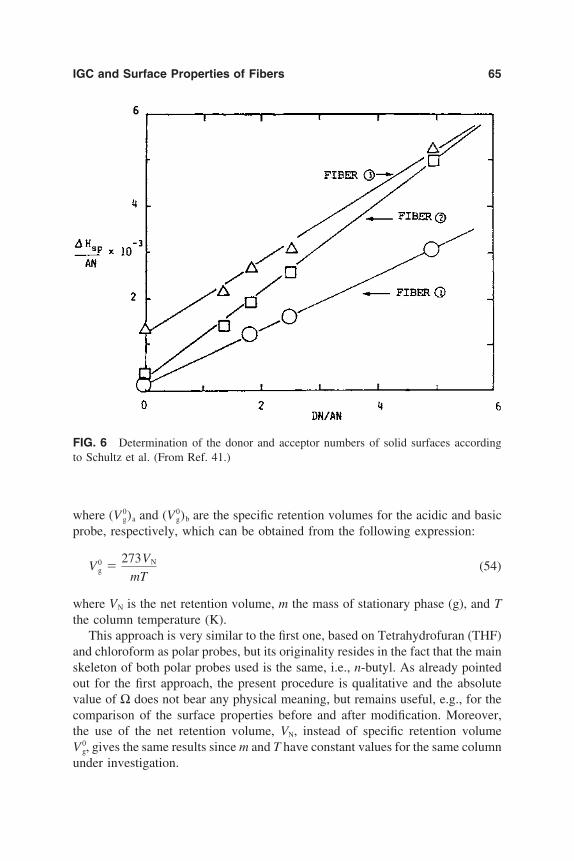
IGC and Surface Properties of Fibers 65
FIG. 6 Determination of the donor and acceptor numbers of solid surfaces accordingto Schultz et al. (From Ref. 41.)
where (V 0g)a and (V 0
g)b are the specific retention volumes for the acidic and basicprobe, respectively, which can be obtained from the following expression:
V 0g
273VN
mT(54)
where VN is the net retention volume, m the mass of stationary phase (g), and Tthe column temperature (K).
This approach is very similar to the first one, based on Tetrahydrofuran (THF)and chloroform as polar probes, but its originality resides in the fact that the mainskeleton of both polar probes used is the same, i.e., n-butyl. As already pointedout for the first approach, the present procedure is qualitative and the absolutevalue of Ω does not bear any physical meaning, but remains useful, e.g., for thecomparison of the surface properties before and after modification. Moreover,the use of the net retention volume, VN, instead of specific retention volumeV 0
g, gives the same results since m and T have constant values for the same columnunder investigation.

66 Belgacem and Gandini
The fourth approach was proposed by St. Flour and Papirer [69] and consistsof the calculation of a specific interaction parameter (Isp) between a given polarprobe and the substrate surface. This parameter is determined from the plot ofthe free energy change associated with the polar probe against the logarithm ofthe vapor pressure under standard conditions (∆GA versus log p0), as shown inFig. 7. The comparison between the values of Isp of an acceptor and a donorprobe gives an indication of the nature of the surface under investigation.
Very recently, Vidal et al. [70] proposed another approach to calculate thespecific interaction parameter (Isp), which differs only by the fact that these au-thors plotted ∆GA versus the surface area of the adsorbed molecule. They obtainedthe n-alkane reference line and used Eq. (42) to calculate the specific interactionparameter Isp (Fig. 8).
Tiburcio and Manson [48,71] also proposed a novel way to determine theacid–base properties of solid surfaces based on Drago’s four constants [Eq. (11)].They determined the enthalpies of adsorption associated with the acid–base inter-actions between polar probes and the solid surface using polar probes and neutralmodel ones with very similar molecular sizes:
∆H AB (∆Hexp ∆H D)probe (∆Hexp ∆H D)model (55)
FIG. 7 Determination of the specific interaction parameter Isp of polar probes accordingto St. Flour and Papirer [69].

IGC and Surface Properties of Fibers 67
FIG. 8 Determination of the specific interaction parameter Isp of polar probes accordingto Vidal et al. [70].
where ∆Hexp is the enthalpy of adsorption determined experimentally [eqs. (37)and (38)] and ∆H D the enthalpy of vaporization of the probe taken from theliterature [72] or calculated following Truton’s rule [73] or Riedel’s equa-tion [74]:
VN kexp∆Hexp
RT (56)
The model probe was carbon tetrachloride for chloroform and methylene chlo-ride (acidic) and n-propane and n-pentane for the acetone and diethyl ether (basic)[48,71].
F. Determination of the Fiber–Matrix InteractionParameter
Knowing the acceptor and the donor numbers for both fibers and matrix of agiven composite material, it is easy to deduce, by analogy with the St. Flour and
68 Belgacem and Gandini
Papirer approach [68] [eq. (50)], the interaction parameter A, which describesthe acid–base interactions between the fibers (f) and the matrix (m) [40–42]:
A KA(f)KB(m) KB(f) KA(m) (57)
where KA(f) and KA(m) are the acid numbers of the fibers and matrix, respectively,and KB(f) and KB(m) are their corresponding basic numbers.
As expected, Schultz and Lavielle [40–42] have shown that the mechanicalproperties based on epoxy resin–containing carbon fibers could be improved byincreasing the interaction parameter A (see also Sec. XI).
In the context of paints and inks, Lara and Schreiber [65] proposed an empiri-cal expression to calculate the interaction parameter of a given pigment (p) withthe surrounding resin (r):
Isp √AN rDNp √ANp DNr (58)
where AN and DN are, respectively, the acceptor and donor numbers, as deter-mined above by Eqs. (43) and (44).
IX. DISPERSIVE PROPERTIES
A. Characterization of Fibers
1. Cellulose FibersCellulosic fibers are used extensively in papermaking, textiles, productions etc.In many cases, these fibers are submitted to a specific surface treatment, e.g., inpaper coating where a thin layer of filled polymer emulsion is deposited on thesheet. These processes are in part conditioned by the surface properties of cellu-losics. Moreover, recently, cellulose fibers have received much attention as rein-forcing elements in different types of polymeric matrices in order to obtain com-posites with good mechanical properties. The reasons that justify the use of thesenatural fibers are, among others, the widespread availability of cheap fibers withdifferent morphologies, their low density, and the possibility of burning the corre-sponding composites without the obvious problems associated to the same opera-tion applied to glass fibers-based composites. In addition, these fibers possessmany other advantages such as good mechanical properties and ease of isolationdirectly from any plant material (i.e., major renewable resources associated withthe biological activity which produces through photosynthesis about 3 1011
tonnes/year of vegetal biomass containing more than 45% fibers).As cellulose is a highly hydrophilic natural polymer, its incorporation into
hydrophobic matrices must be carried out in such a way as to protect the ensuingcomposite from water uptake. Thus, compatibilization between the surfaces ofthese fibers and that of synthetic matrices like polyethylene, polypropylene, or

IGC and Surface Properties of Fibers 69
polystyrene is essential to optimize the performances of these novel materials.Corona [75,76] or plasma [77] treatment or specific chemical modifications[32,78,79] of either the fiber surface or the matrix have been applied to improvethe quality of the cellulose–polyolefin interface.
Dorris and Gray [57] were the first to investigate cellulose fibers by IGC. Theystudied cotton fibers and found a dispersive component of surface energy of about50 mJ/m2 at 40°C. This value was in good agreement with that obtained frommeasurements at finite concentration and slightly higher than those deduced fromCA measurements.
Lee and Luner [80] studied the surface properties of ‘‘confetti’’ from What-man No. 1 chromatographic paper extracted with THF and sized with a solution ofalkylketene dimer (AKD) (Structure I). The dispersive contribution to the surfaceenergy of the pristine cellulose (Table 5) was about 48 mJ/m2, which is veryclose to the value obtained by Dorris and Gray [57]. This parameter increasedsubstantially to 60 mJ/m2 after the AKD treatment and subsequent extraction byTHF, but decreased when the THF extraction was not applied after sizing. Theauthors explained these results through a mechanism involving the interaction ofthe alkane chains among grafted AKD molecules giving a weak brush-type net-work. However, we feel that the extent of the grafted AKD molecules after extrac-tion was far too low (0.02–0.04%) to justify the proposed mechanism. Moreover,the authors did not mention whether they analyzed the shape of the peaks, whichshould have become asymmetrical (through mechanical retention of the probes)if such an interaction had indeed occurred.
The same authors [81] investigated the same cellulosic substrate after differentcycles of solvent treatment. The initial confetti were swollen in water for 2 days,after which the water was exchanged with ethanol which was in turn exchangedsuccessively with acetone, toluene, and n-heptane. The confetti were kept in eachsolvent for 2 days and each solvent was replaced twice by the next fresh solvent.The final confetti were dried under vacuum at 105°C for 3 days. The value ofthe dispersive energy was almost three times as high as that obtained in the previ-ous studies discussed above [57,80] (Table 5). These authors excluded artefactsrelated to diffusion of the probes into microcapillarity of the substrate since thenet retention time remained constant when they varied the flow rate of the carriergas from 11.5 to 16.5 ml/min. They attributed these high values to the fact that

70 Belgacem and Gandini
TA
BL
E5
Val
ues
ofth
eD
ispe
rsiv
eC
ompo
nent
ofth
eSu
rfac
eE
nerg
yof
Cel
lulo
sics
Tra
dena
me
orno
tatio
nγD S
at(T°C
)
dγD S
/dT
Mat
eria
lan
dsu
pplie
rT
reat
men
tor
calc
ulat
ion
met
hod
(mJ/
m2)
(mJ/
m2°C
)R
ef.
Cot
ton
Wha
tman
no.
1N
one
49.9
(40°
C)
—57
Cel
lulo
se(c
ell)
Wha
tman
no.
1N
one
48.4
(25°
C)
0.21
80Si
zing
with
AK
D(A
KD
/cel
l
0.02
6%)
60.6
(30°
C)
—80
Sizi
ngw
ithA
KD
(AK
D/c
ell
0.
043%
)51
.2(3
0°C
)—
80Si
zing
with
AK
D,
unex
trac
ted
38.6
(30°
C)
—80
Solv
ent
exch
ange
d11
1.9
(30°
C)
0.85
81A
mor
phou
sce
llulo
sebe
ads
Wha
tman
CF-
11Su
rfac
ear
eaa
cons
tant
71.5
(50°
C)
0.36
82–8
4a
from
liqui
dde
nsity
70.9
(50°
C)
0.37
82–8
4a
aspe
rfec
tga
s62
.8(5
0°C
)0.
4882
–84
aas
real
gas
44.2
(50°
C)
0.82
82–8
4N
one
70.5
(50°
C)
—85
Tri
fluor
oeth
oxya
ceta
tece
ll(D
S
1.0)
32.4
(50°
C)
—85
Fluo
rina
tion
#1
(DS
0.
5)39
.0(5
0°C
)—
85Fl
uori
natio
n#
2(D
S
0.1)
43.6
(50°
C)
—85
Eth
oxya
ceta
tece
ll.(D
S
0.2)
42.8
(50°
C)
—85
Con
dens
erpa
per
Non
e39
.0(4
0°C
)0.
2087
A
l 2O
378
.5(4
0°C
)0.
0887
T
iO2
41.5
(40°
C)
0.12
87G
raft
ing
with
EG
-SiO
240
.0(4
0°C
)0.
1487
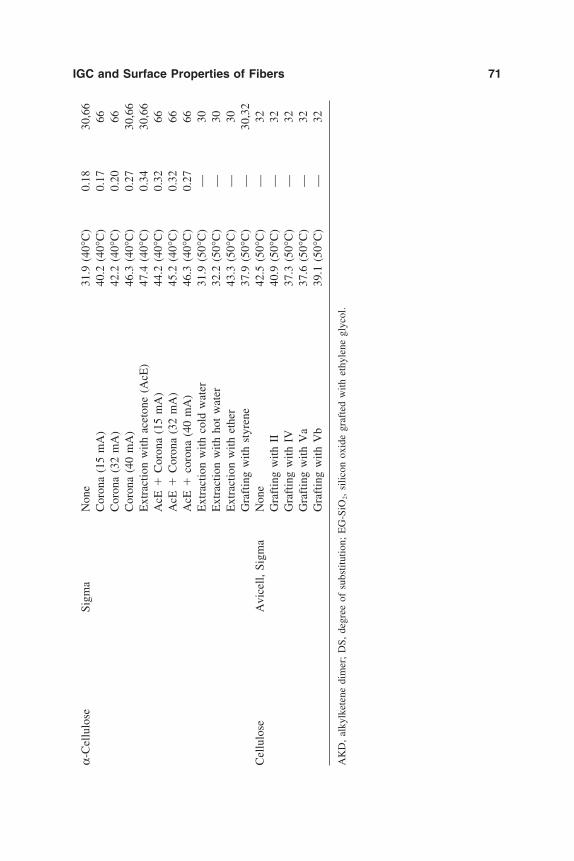
IGC and Surface Properties of Fibers 71α-
Cel
lulo
seSi
gma
Non
e31
.9(4
0°C
)0.
1830
,66
Cor
ona
(15
mA
)40
.2(4
0°C
)0.
1766
Cor
ona
(32
mA
)42
.2(4
0°C
)0.
2066
Cor
ona
(40
mA
)46
.3(4
0°C
)0.
2730
,66
Ext
ract
ion
with
acet
one
(AcE
)47
.4(4
0°C
)0.
3430
,66
AcE
C
oron
a(1
5m
A)
44.2
(40°
C)
0.32
66A
cE
Cor
ona
(32
mA
)45
.2(4
0°C
)0.
3266
AcE
co
rona
(40
mA
)46
.3(4
0°C
)0.
2766
Ext
ract
ion
with
cold
wat
er31
.9(5
0°C
)—
30E
xtra
ctio
nw
ithho
tw
ater
32.2
(50°
C)
—30
Ext
ract
ion
with
ethe
r43
.3(5
0°C
)—
30G
raft
ing
with
styr
ene
37.9
(50°
C)
—30
,32
Cel
lulo
seA
vice
ll,Si
gma
Non
e42
.5(5
0°C
)—
32G
raft
ing
with
II40
.9(5
0°C
)—
32G
raft
ing
with
IV37
.3(5
0°C
)—
32G
raft
ing
with
Va
37.6
(50°
C)
—32
Gra
ftin
gw
ithV
b39
.1(5
0°C
)—
32
AK
D,
alky
lket
ene
dim
er;
DS,
degr
eeof
subs
titut
ion;
EG
-SiO
2,si
licon
oxid
egr
afte
dw
ithet
hyle
negl
ycol
.
72 Belgacem and Gandini
in the micropores the contact area for methylene groups may be higher than ona flat surface. We disagree with this interpretation because 6 A2 is the highestarea that a CH2 group can cover based on the fact that it is calculated frombonding length. Moreover, the authors evoked a slow diffusion of the probes intomicropores, which contradicts their macroscopic findings excluding the possibil-ity of diffusion artefacts.
Garnier and Glasser [82–85] also studied the surface energy of dried amor-phous cellulose. They measured the dispersive contribution to the surface energyof the substrate at different temperatures (Table 5) and found that the temperaturedependence was five times higher than that observed with conventional tech-niques such as contact angle or surface tension of polymers in the melt [7,86].The authors correlated this strong dependence to the fact that the assumption thatthe surface area of the adsorbed molecule is independent of the temperature isnot always verified [82–84]. They calculated the surface energy of the substratefrom the corresponding retention volumes using an a parameter (1) calculatedconsidering that the probes are alternatively liquids, perfect gases, and real gases,or (2) obtained in a previous investigation [41]. Through this comparison theyreached the conclusion that the most correct values of the dispersive energy areobtained when the surface areas are those determined by Schultz et al. [41]. Ina very recent work [85], the same authors investigated the surface propertiesof pristine cellulose and four different derivatives namely: (1) fluorinated, (2)trifluoroethoxyacetate, (3) ethoxyacetate, and (4) laurate [85]. They showed thatγD
S decreased from 70 mJ/m2 to about 30 mJ/m2 for fluorinated cellulose and to40 mJ/m2 for the other derivatives.
Ignatova et al. [87] investigated papers for condensers as such and with threedifferent fillers, namely, Al2O3, TiO2, and SiO2 ‘‘grafted’’ with diethylene glycol.Whereas the first filler produced a substantial increase in the surface energy ofthe paper from 39 to 48 mJ/m2, the other two did not induce any appreciablechange.
More recently, Belgacem et al. [30,32,66] studied the surface properties ofdifferent types of cellulose fibers as such, purified by extraction with differentsolvents, grafted with different coupling agents, or corona-treated. The dispersivecomponents of the surface energy of these materials are summarized in Table 5.As can be seen from these data, γD
S of α-hardwood cellulose fibers increasedfrom about 35 to 50 mJ/m2 when they had been acetone-extracted or corona-treated at a discharge level of 40 mA [66]. In the second publication [30],the authors showed that the efficiency of purification of α-hardwood cellulosefibers by diethyl ether is slightly lower than that attained with acetone. They alsoreported that water (cold or hot) did not remove the impurities from the fibersurface. In another study [32], microgranular cellulose (MGC) was also investi-gated as such and after grafting with four different coupling agents (structuresII–V):

IGC and Surface Properties of Fibers 73
The dispersive properties of MGC and its grafted derivatives remained practicallyunchanged (Table 5).
Finally, Borch [88] reviewed the use of IGC at zero coverage conditions inthe characterization of cellulosic materials.
2. Lignocellulosic FibersLignocellulosic fibers have also attracted the attention of researchers. They havebeen the subject of different investigations dealing with their surface properties

74 Belgacem and Gandini
in view of their use as reinforcing elements as an alternative to pure cellulose,but keeping the same basic advantages.
Dorris and Gray studied the adsorbtion behavior of thermomechanical pulps(TMPs) [57] and found that these materials have lower dispersive energy (38.8mJ/m2) than that of pure cellulose, as reported in Table 6.
Lignocellulosic fibers, as obtained from wood delignification and after modi-fication (bleaching, beating, grafting, etc.), have also been characterized [52,89–100]. Garnagul and Gray [89] studied the surface properties of bleached kraftpulps from black spruce before and after mechanical beating at four differentbeating energies and found that the dispersive surface energy of the pulps wasnot sensitive to this parameter (see Table 6). Kamdem and Riedl determined thedispersive component of the surface energy of chemithermomechanical pulps(CTMPs) obtained from hardwood and softwood (50% spruce and 50% balsamfir), as received or treated by different phenol-formaldehyde resins (PFR) or poly-methyl methacrylate (PMMA) [90,91]. The values of γD
S as a function of tempera-ture are given in Table 6. These data indicate that the dispersive component ofthe treated fibers tended to reach those of the corresponding polymer. The sameauthors reported data on the effect of grafting CTMP fibers with PMMA [90].Hydrogen peroxide–treated CTMP fibers showed a higher dispersive energy(40.1 mJ/m2) compared with that of the untreated substrate (36.4 mJ/m2) becausethis reagent extracted some lignin and hemicellulose fragments from their surface(Table 6). Grafting with PMMA tended to increase γD
S , which reached a maximumvalue of 46.0 mJ/m2 when grafting attained 50% w/w, and decreased there-after [91].
These authors [52] applied the peak maximum [50] and Conder and Young’s
TABLE 6 Values of the Dispersive Component of the Surface Energy of WoodFibers
γDS at (T °C) dγD
S /dTMaterial Treatment or calculation method (mJ/m2) (mJ/m2 °C) Ref.
TPM None 38.8 (30°C) — 57CTMP None 25.2 (40°C) 0.33 90
None 36.4 (25°C) — 91None 46.2 (23°C) — 98Peak maxima method (PM) 37.0 (20°C) — 52Conder-Young method (CY) 37.9 (20°C) — 52Cleaning with H2 O2 27.6 (40°C) — 90Cleaning with H2 O2 40.1 (25°C) — 91Coating with PFR (PM) 38.6 (20°C) — 52Coating with PFR (CY) 39.5 (20°C) — 52

IGC and Surface Properties of Fibers 75
TABLE 6 Continued
γDS at (T °C) dγD
S /dTMaterial Treatment or calculation method (mJ/m2) (mJ/m2 °C) Ref.
Coating with 8% PFR-A 31.2 (40°C) 0.45 90Coating with 8% PFR-B 35.3 (40°C) — 90Coating with 20% PFR-A 38.3 (40°C) 0.49 90Coating with 20% PFR-B 42.5 (40°C) 0.63 90Grafting with PMMA (30%) 42.3 (25°C) 0.57 91Grafting with PMMA (50%) 46.0 (25°C) 0.70 91Grafting with PMMA (60%) 34.2 (25°C) 0.76 91Grafting with PMMA (100%) 46.0 (25°C) — 92Grafting with PMMA (130%) 33.0 (25°C) — 92a from liquid density 100 (50°C) — 96a from Dorris correction 71.5 (50°C) — 96a from BET fit 45.9 (50°C) — 96Using of Eq. (30) 39.1 (50°C) — 96
Kraft pulps (KP) None 45.1 (20°C) — 89None 6.8 (50°C) 0.07 97Beating for 3000 revolutions 45.1 (20°C) — 89Beating for 6000 revolutions 46.0 (20°C) — 89Beating for 9000 revolutions 46.7 (20°C) — 89Beating for 11000 revolutions 46.7 (20°C) — 89
Wood birch None 43.8 (20°C) — 93Bleached sulfite None 44.0 (40°C) — 94
pulps (BSP) None 45.1 (60°C) — 95ASA 33.0 (40°C) — 94Plasma, NH3, 5 mn 43.2 (60°C) — 95Plasma, NH3, 15 mn 42.5 (60°C) — 95Plasma, NH3, 60 mn 40.7 (60°C) — 95Plasma, N2, 5 mn 43.7 (60°C) — 95Plasma, N2, 15 mn 43.1 (60°C) — 95Plasma, N2, 60 mn 41.0 (60°C) — 95Plasma, MMA, 5 mn 40.1 (60°C) — 95Plasma, MMA, 15 mn 36.9 (60°C) — 95Plasma, MMA, 60 mn 38.2 (60°C) — 95
Explosion pulps None 9.8 (50°C) 0.25 97Softwood KP Bleaching with ClO2 47.8 (50°C) — 98
Bleaching with H2 O2 44.5 (50°C) — 98Bleaching with O3 43.8 (50°C) — 98
Hardwood KP Bleaching with O3 47.6 (50°C) — 98
TMP, thermomechanical pulps; CTMP, chemithermomechanical pulps; PFR, phenol-formaldehyderesin; PFR-A, phenol-formaldehyde resin A, low molecular weight PFR; PFR-B, phenol-formalde-hyde resin B, high molecular weight PFR; ASA, alkenylsuccinic anhydride; PMMA, polymethylmethacrylate; MMA, methyl methacrylate.
76 Belgacem and Gandini
[51] methods to calculate the surface properties of the CTMP fibers and foundthat there was little difference in the ensuing γD
S values (see Table 6). Kamdemet al. [92,93] determined the dispersive and acid–base properties of the surfaceof white birch wood meal. As shown in Table 6, these authors found results verysimilar to those obtained for CTMP materials.
Felix et al. investigated the dispersive and acid–base properties of the surfaceof bleached sulfite pulps obtained from 60% beechwood and 40% birchwood[94,95]. The lignocellulosic fibers were purified by Sohxlet extraction withtoluene and treated with alkenylsuccinic anhydride (ASA, structure II) [94],or treated by plasma under different atmospheres and for different times [95].They studied the divergence between the DCA and IGC measurements andshowed that the latter technique gives higher values of the dispersive contributionto the surface energy [94]. They correlated this behavior to the specificity of theIGC data obtained at infinite dilution. In fact, at zero coverage conditions thedetection of high-energy sites is more efficient. As expected, the treatment ofthese fibers by ASA was found to decrease the dispersive energy of the fibersas shown in Table 6. The different plasma treatments of bleached sulfite pulpfibers produced a very slight change in their γD
S as shown by the values reportedin Table 6.
Jacob and Berg [96] characterized the surface energy of CTMPs and softwoodbleached kraft pulp (SWKPs) fibers. They calculated the corresponding γD
S usingdifferent surface areas of the adsorbed molecules. They concluded that the mostsatisfactory values were obtained when the surface areas of the adsorbed mole-cules were determined from a fit of the BET model to adsorption of n-alkanesonto the surface of CTMP fibers. They also obtained good results when they usedDorris and Gray’s approach with a value of the surface area of a methylene groupof 6 A2.
Chtourou et al. [97] have studied kraft and steam explosion pulps and foundextremely low values of the dispersive energy (about 10 and 7 mJ/m2, respec-tively, at 50°C). These authors did not give an explanation for this surprisingresult. As reported in Table 6, the extrapolation of their data to 20°C gives γD
S
of 20 and 10 mJ/m2, respectively, which are clearly unrealistic.Lunqvist et al. [98] determined γD
S of softwood and hardwood kraft pulpsbleached with different bleaching agents (ClO2, H2O2, O3). The values obtainedand reported in Table 6 showed very similar and quite high surface energies,which indicates that the use of less conventional bleaching agents is as efficient(at least in terms of the resulting surface energy) as working with chlorine (thecommonly used bleaching agent that is now being proscribed). Jacob and Berg[99] also studied CTMP fibers and found results very similar to those reportedin the literature [89,93–95] (see Table 6).
Finally, Simonsen et al. [100] studied the surface energy of wood flour from

IGC and Surface Properties of Fibers 77
Douglas fir (T14) and TMP fibers from western hemlock as such and after deposi-tion of different amounts of polystyrene. They showed that the dispersive surfaceenergy of T14 increased from about 35 to 60 mJ/m2 with increased depositedpolystyrene, whereas that of TMP decreased very slightly from about 34 to 30mJ/m2, as shown in Fig. 9. Since the surface energy of polystyrene at roomtemperature is known to be about 35 mJ/m2, the growing values of γD
S with poly-styrene-coated T14 do not seem coherent.
3. Carbon FibersCarbon fibers have found extensive use in the elaboration of composite materials,mostly based on epoxy resins. As for all composites, the final properties stronglydepend on the surface properties of the constituents and their interfacial compati-bility. To reach highly resistant materials, carbon fibers are usually subjected tochemical or physical treatment. IGC was found to be a good complementary
FIG. 9 London component of the surface energy for Douglas fir and TMP fibers as afunction of polystyrene loading as reported by Simonsen et al. [100].

78 Belgacem and Gandini
technique to characterize their surface properties before and after such modifica-tions.
Vukov and Gray [64,101,102] have studied the adsorption behavior of twocommercial polyacrylonitrile-based carbon fibers. They examined two differentuntreated and unsized fibers as received and after cleaning by thermal treatmentunder nitrogen for 100–120 h. γD
S was found to increase substantially after clean-ing with both type of fibers, as shown by the data reported in Table 7.
Schultz et al. [40–42,103] studied the surface properties of high-resistancepolyacrylonitrile-derived carbon fibers as such (designed as untreated fibers), oxi-dized, oxidized and sized, electrolytically oxidized, coated, and subjected to enzy-matic treatment. The authors investigated these fibers in order to optimize com-posite materials with epoxy resin as a matrix. The resin was based on diglycidylether of bisphenol A and two types of hardener: (1) 35 parts by weight diaminodi-phenyl sulfone (resin I) and (2) 55 parts by weight polyamine amide (resin II).The resins were used as powders (200–300 µm) for IGC measurements. Thedispersive contribution to the surface energy according to their own approach[Eq. (31)] was compared to that obtained with Gray’s formalism [Eq. (30)]. Theensuing values of γD
S are summarized in Table 7. From these data, two mainconclusions can be drawn: (1) the values of the dispersive properties accordingto Gray’s and Schultz’s approaches are very close, and (2) wetting measurementsalso gave very similar results compared to IGC. The untreated fibers had a dis-persive energy of 50 mJ/m2, whereas most treatments induced a decreasein γD
S , except the electrolytic oxidation which produced an increase in surfaceenergy.
Bolvari and Ward [104,105] studied the effect of grafting of carbon fibersby silane-type coupling agents (VI). They investigated three commercial PAN-derived carbon fibers, namely) untreated fibers and two commercial varieties of
surface-modified fibers. One of them, along with the untreated sample, was sub-mitted to grafting with coupling agent VI. The dispersive component of the sur-face energy was calculated from measurements at zero coverage conditions ac-cording to Eq. (30) (Dorris and Gray’s approach [57]). The values of thisparameter, which are reported in Table 7, showed that the surface grafting wasefficient because γD
S decreased from about 60 to 26 mJ/m2.Wilkinson and Ward [106] studied the surface properties of seven types of
intermediate-modulus carbon fibers from two different suppliers as such and aftera heat treatment, and found very similar results to those obtained by Vukov and

IGC and Surface Properties of Fibers 79T
AB
LE
7V
alue
sof
the
Dis
pers
ive
Com
pone
ntof
Surf
ace
Ene
rgy
ofC
arbo
nFi
bers
γD Sat
(T°C
)
dγD S
/dT
Fibe
rty
peT
reat
men
tor
calc
ulat
ion
met
hod
(mJ/
m2)
(mJ/
m2°C
)R
ef.
PAN
-bas
edN
one
38.8
(50°
C)
—64
Non
e36
.2(5
0°C
)—
102
Non
e36
.3(5
0°C
)—
101
Non
e50
.0(5
0°C
)—
40–4
2,10
3H
eatin
g(h
t)(1
60°C
)76
.8(5
0°C
)—
64C
lean
ing
70.9
(50°
C)
—10
2C
lean
ing
74.9
(50°
C)
—10
1H
t(1
05°C
)52
.0(4
7°C
)—
109
Ht
(150°C
)72
.0(4
7°C
)—
109
Ht
(200°C
)75
.0(4
7°C
)—
109
Oxi
datio
n(o
x)49
.0(2
5°C
)—
42E
lect
roch
emic
alox
ht
(105°C
)56
.0(4
7°C
)—
109
Ele
ctro
chem
ical
ox
ht(1
50°C
)81
.0(4
7°C
)—
109
Ox
si
zing
(si)
36.0
(25°
C)
—41
,42,
103
Coa
ting
(co)
29.0
(25°
C)
—42
Ox
co
ht
(105°C
)36
.0(4
7°C
)—
109
Ox
co
ht
(150°C
)32
.0(4
7°C
)—
109
Ele
ctro
lytic
ox(e
lox)
59.0
(25°
C)
—42
Enz
ymat
ic36
.0(2
5°C
)—
40N
one
54.7
–65
.1—
104,
105
Not
repo
rted
39.3
–47
.5—
104,
105
Gra
ftin
gw
ithsi
lane
agen
tV
I23
.3–
26.3
—10
4,10
5H
eatin
g(s
ampl
eA
)85
.0(4
0°C
)—
106
A
50%
surf
ace
trea
tmen
t(S
T)
45.0
(40°
C)
—10
6A
50
%ST
he
atin
g56
.0(4
0°C
)—
106
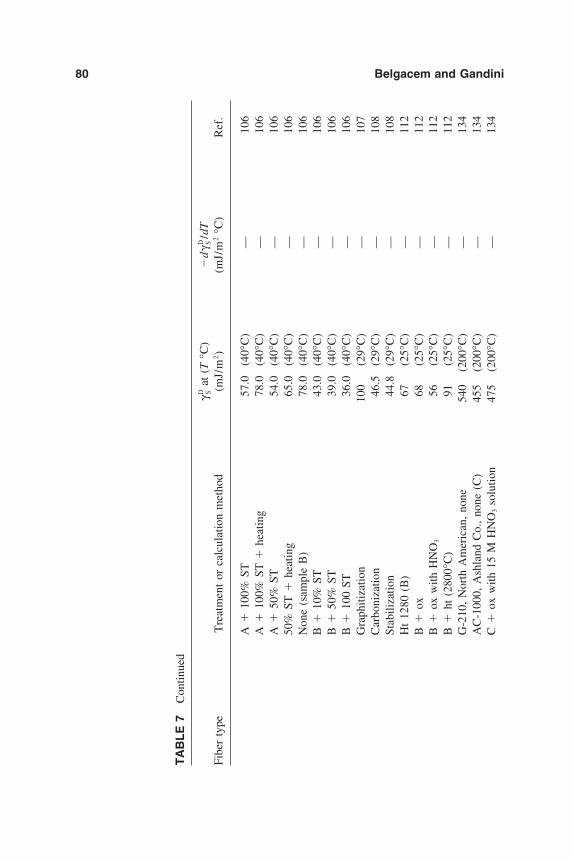
80 Belgacem and Gandini
TA
BL
E7
Con
tinue
d
γD Sat
(T°C
)
dγD S
/dT
Fibe
rty
peT
reat
men
tor
calc
ulat
ion
met
hod
(mJ/
m2)
(mJ/
m2°C
)R
ef.
A
100%
ST57
.0(4
0°C
)—
106
A
100%
ST
heat
ing
78.0
(40°
C)
—10
6A
50
%ST
54.0
(40°
C)
—10
650
%ST
he
atin
g65
.0(4
0°C
)—
106
Non
e(s
ampl
eB
)78
.0(4
0°C
)—
106
B
10%
ST43
.0(4
0°C
)—
106
B
50%
ST39
.0(4
0°C
)—
106
B
100
ST36
.0(4
0°C
)—
106
Gra
phiti
zatio
n10
0(2
9°C
)—
107
Car
boni
zatio
n46
.5(2
9°C
)—
108
Stab
iliza
tion
44.8
(29°
C)
—10
8H
t12
80(B
)67
(25°
C)
—11
2B
ox
68(2
5°C
)—
112
B
oxw
ithH
NO
356
(25°
C)
—11
2B
ht
(280
0°C
)91
(25°
C)
—11
2G
-210
,N
orth
Am
eric
an,
none
540
(200°C
)—
134
AC
-100
0,A
shla
ndC
o.,
none
(C)
455
(200°C
)—
134
C
oxw
ith15
MH
NO
3so
lutio
n47
5(2
00°C
)—
134
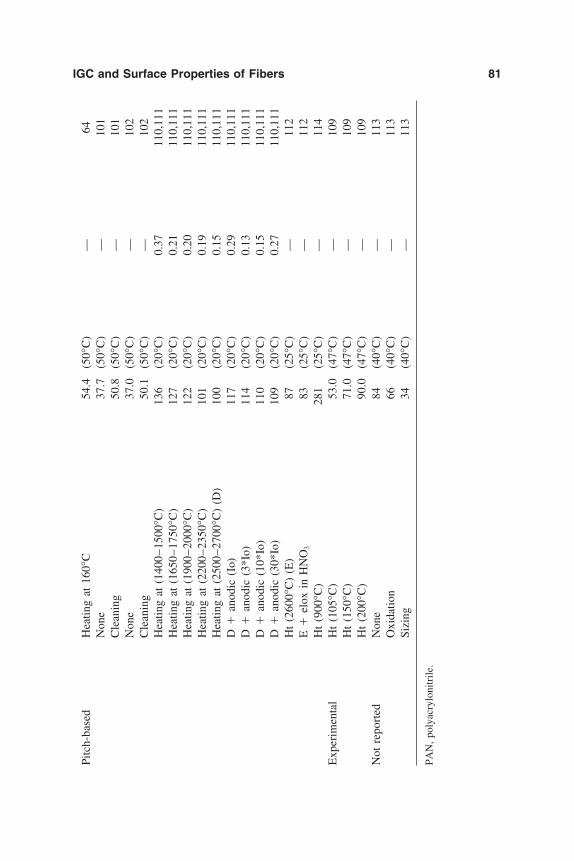
IGC and Surface Properties of Fibers 81Pi
tch-
base
dH
eatin
gat
160°
C54
.4(5
0°C
)—
64N
one
37.7
(50°
C)
—10
1C
lean
ing
50.8
(50°
C)
—10
1N
one
37.0
(50°
C)
—10
2C
lean
ing
50.1
(50°
C)
—10
2H
eatin
gat
(140
0–1
500°
C)
136
(20°
C)
0.37
110,
111
Hea
ting
at(1
650
–175
0°C
)12
7(2
0°C
)0.
2111
0,11
1H
eatin
gat
(190
0–2
000°
C)
122
(20°
C)
0.20
110,
111
Hea
ting
at(2
200
–235
0°C
)10
1(2
0°C
)0.
1911
0,11
1H
eatin
gat
(250
0–2
700°
C)
(D)
100
(20°
C)
0.15
110,
111
D
anod
ic(I
o)11
7(2
0°C
)0.
2911
0,11
1D
an
odic
(3*I
o)11
4(2
0°C
)0.
1311
0,11
1D
an
odic
(10*
Io)
110
(20°
C)
0.15
110,
111
D
anod
ic(3
0*Io
)10
9(2
0°C
)0.
2711
0,11
1H
t(2
600°
C)
(E)
87(2
5°C
)—
112
E
elox
inH
NO
383
(25°
C)
—11
2H
t(9
00°C
)28
1(2
5°C
)—
114
Exp
erim
enta
lH
t(1
05°C
)53
.0(4
7°C
)—
109
Ht
(150°C
)71
.0(4
7°C
)—
109
Ht
(200°C
)90
.0(4
7°C
)—
109
Not
repo
rted
Non
e84
(40°
C)
—11
3O
xida
tion
66(4
0°C
)—
113
Sizi
ng34
(40°
C)
—11
3
PAN
,po
lyac
rylo
nitr
ile.

82 Belgacem and Gandini
Gray [64,101,102]. Dong et al. [107] determined the dispersive energy of graphi-tized carbon fibers and found a value close to 100 mJ/m2. Nardin et al. [108]studied carbonized and stabilized carbon fibers and found a value of about 45mJ/m2, which is close to that obtained by Lavielle and Schultz [109] for PAN-based fibers before thermal treatment (see Table 7). These authors [109] showedthat the dispersive component of the surface energy of thermally treated fibersincreased with the treatment temperature. Donnet and coworkers [110,111] alsostudied pitch-base carbon fibers before and after thermal and anodic oxidationtreatments and found exactly the inverse trend than that of Lavielle and Schultz[109]. In fact, the dispersive contribution to the surface energy of the fibers de-creased after heating. They also found that the increase of the current intensityof anodic treatment induced a corresponding decrease in the dispersion energyof the surface. More recently, Tsutsumi and Ban [112] studied the same materialwith the same type of treatment and found results very similar to those reportedby several laboratories and in opposition to those published by Donnet et al.[110,111]. These values are also summarized in Table 7.
Very recently, Jacobasch et al. [113] and Park and Brendle [114] also studiedthe surface energetics of carbon fibers. In the first study it was shown that thedispersive energy of fibers before and after sizing were in very good agreementwith those obtained by almost all previous reports except again for that of Donnetand coworkers [110,111]. In the second investigation [114], the authors showedthat the thermal treatment of carbon fibers can induce an increase in their disper-sive properties up to a value of 280 mJ/m2. These data are resumed in Table 7,which gives all of the values found in the literature concerning the surface energyof carbon fibers as determined by IGC at infinite dilution.
4. Glass FibersGlass fibers are also used as a reinforcing element in different polymeric matrices.The most common matrix in this context is made with unsaturated glyceroph-thalic polyesters that are crosslinked by their radical copolymerization with sty-rene. Again, the mechanical properties of the composite will depend on the prop-erties of the glass fibers and polyester matrices and the quality of the interfacethat they can establish. These fibers are usually submitted to a specific surfacetreatment before they are incorporated into the matrix. By far the most commonsurface modification involves the use of silanes as OH coupling agents as shownbelow [115].
Papirer et al. [116–118] studied the surface characteristics of glass fibers be-fore different treatments, namely, (1) heating, (2) washing with water or aqueousacidic (HCl, AlCl3), basic (NaOH), and EDTA solutions, and (3) grafting withstyrene-butadiene (SB), γ-aminopropyltriethoxysilane (VII) and isopropyltris(tridecylbenzenesulfonyl) (VIIIa) and isopropyltris(dodecylbenzenesulfonyl)titanate (VIIIb) (see Table 8).

IGC and Surface Properties of Fibers 83
TABLE 8 Values of the Dispersive Component of the Surface Energy of GlassFibers
γDS at (T °C)
Fiber type Supplier Treatment or calculation method (mJ/m2) Ref.
Short Rockwool None 50 (60°C) 116,117,118Washing (ws) with water 51 (100°C) 116Ws with 0.01 N HCl for 1 h 36 (100°C) 116Ws with 0.1 N NaOH for 1 h 40 (100°C) 116Ws with 100 ppm AlCl3, 6 h 30 (100°C) 116Ws with EDTA 45 (100°C) 116Heating (ht) at 54°C 38 (100°C) 116Ht at 59°C 30 (100°C) 116Ht at 68°C 18 (100°C) 116Ht at 71°C 17 (100°C) 116Ht at 85°C 42 (100°C) 116Ht at 97°C 29 (100°C) 116Ht at 500°C 21 (100°C) 116Grafting by SBR in cyclo- 42.9 (40°C) 116hexane
E glass Ashai None 49 (25°C) 119Grafting by VI 48 (25°C) 119Grafting by VII 40 (25°C) 119Grafting by IX 38 (25°C) 119Grafting by X 39 (25°C) 119Grafting by XI 69 (25°C) 119Grafting by XII 24 (25°C) 119
SBR, styrene-butadiene resin; EDTA, ethylenediaminetetraacetic acid.
The authors showed that the dispersive energy of the fibers’ surface increasedwhen they washed it with water and HCl solution; decreased by washing withan EDTA solution, grafting with SB, and heating at 500°C for 24 h; but remainedunchanged when washed with NaOH and AlCl3 or grafted by VII and VIII. Thevariation of γD
S with temperature [116] is shown in Fig. 10.

84 Belgacem and Gandini
FIG. 10 Effect of the temperature on the dispersive contribution to the surface energyof glass fibers. (From Ref. 116.)
Tsutsumi and Oshuga [119] also studied glass fibers before and after graftingwith six different silane coupling agents (VI, VII, and IX–XII).
In this work, the London component of the surface energy decreased from 40mJ/m2 to about 30 mJ/m2 for grafted materials. Two exceptions were noted,however, as expected: grafting with coupling agents XI and XII gave, respec-tively, 55 and 19 mJ/m2.
5. Polyamide FibersThanks to its very high modulus and low density, aramid fibers have found alarge success in the elaboration of composite materials for aeronautics. The most

IGC and Surface Properties of Fibers 85
abundant aramid fibers are made with poly (p-phenylene terephthalamide)(PPTA, Kevlar). The surface energetics of this material have been studied essen-tially by Williams and coworkers [120–124] who found that the dispersive contri-bution to the surface energy of pristine uncleaned fibers was about 35 mJ/m2
while cleaning by solvent extraction (acetone, water, haxane, etc.) raised the en-ergy to about 55 mJ/m2.
Very recently, Tate et al. [125] studied nylon-66 fibers spun with differentdraw ratios in dry and humid atmospheres and found that these fibers had anaverage value of the dispersive component of their surface energy of about 40mJ/m2 (see Table 9).
6. Polyethylene Terephthalate FibersTo the best of our knowledge, only Anhang and Gray [126,127] and Yang andWard [128] have studied the surface properties of polyethylene terephthalate(PET) fibers by IGC at zero coverage conditions. These papers reported that thedispersive energy of PET fibers is very close to that found for nylon-66, i.e.,about 40 mJ/m2 as shown in Table 9.
7. Polyethylene FibersThe surface properties of polyethylene fibers have been studied by Chtourou etal. [97,129]. They examined commercial low-density PE fibers as received andafter modification by ozone in aqueous solution for 2 and 3 h and by fluorine gas.Surprisingly, the dispersive component of the surface energy of these materialsremained constant even after the fluorine modification, as shown in Table 9. Theauthors emphasized that the most significant change in the surface propertiesshould be reflected on the acid–base interactions, as discussed below.
8. Cellulose Acetate FibersCellulose acetate fibers and fibrils have been investigated by Yang and Ward[128] who found a γD
S values of 30 and 20 mJ/m2, respectively (Table 9). Thelatter value seems unusually low for that polymer structure.
9. Cellophane FilmTo the best of our knowledge, only Katz and Gray [130] have studied the disper-sive energy of cellophane by IGC at zero coverage conditions. They found avalue of 42 mJ/m2 at 20°C (Table 9), which is very reasonable.
B. Characterization of Organic Fillers and Powders
1. Activated CarbonsCarbon black is constituted by very porous solid particles (varying in size from5 to 50 nm) that possess very interesting adsorption properties [131] becausethey contain a wide range of pores of different sizes and shapes that give riseto specific characteristics such as molecular sieve behavior. Additionally, these

86 Belgacem and Gandini
TA
BL
E9
Val
ues
ofth
eD
ispe
rsiv
eC
ompo
nent
ofth
eSu
rfac
eE
nerg
yof
Poly
amid
es,
Poly
ethy
lene
Ter
epht
hala
tean
dPo
ly(e
thyl
ene)
Fibe
rs
γD Sat
(T°C
)
dγD S
/dT
Fibe
rty
peD
escr
iptio
nor
supp
lier
Tre
atm
ent
orca
lcul
atio
nm
etho
d(m
J/m
2)
(mJ/
m2°C
)R
ef.
Kev
lar
49R
ovin
gty
pe96
8D
ryin
g33
.3(3
0°C
)—
120
Du
Pont
deN
emou
rsN
one
32.0
(20°
C)
—12
1,12
4R
ovin
gty
pe96
8-71
00de
nier
Dry
ing
32.0
(20°
C)
—12
2R
ovin
gty
pe96
8So
lven
tex
trac
tion
54.1
(30°
C)
—12
0D
uPo
ntde
Nem
ours
Solv
ent
extr
actio
n42
.0(2
0°C
)—
121
Rov
ing
type
968-
7100
deni
erE
xtra
ctio
nw
ithhe
xane
dr
ying
43.4
(20°
C)
—12
2R
ovin
gty
pe96
8-71
00de
nier
Ext
ract
ion
with
wat
er
dryi
ng52
.5(2
0°C
)—
122,
124
Rov
ing
type
968-
7100
deni
erE
xtra
ctio
nw
ithac
eton
e
dryi
ng65
.1(2
0°C
)—
122,
124
Fabr
icty
pe35
3-C
S800
Dry
ing
36.3
(30°
C)
—12
0T
ype
353
clot
h,C
S800
,11
50de
nier
Dry
ing
37.5
(20°
C)
—12
2Fa
bric
type
755-
CS8
16D
ryin
g35
.2(3
0°C
)—
120
Fabr
icty
pe75
5-C
S800
Dry
ing
37.7
(30°
C)
—12
0Fa
bric
type
755-
CS8
00So
lven
tex
trac
tion
55.2
(30°
C)
—12
0

IGC and Surface Properties of Fibers 87St
yle
710,
CS8
00N
one
37.0
(20°
C)
—12
3St
yle
755,
CS8
00N
one
37.2
(20°
C)
—12
3St
yle
755
Solv
ent
extr
actio
n35
.7(2
0°C
)—
123
Styl
e75
5,C
S815
Non
e34
.1(2
0°C
)—
123
Styl
e75
5,C
S816
Non
e37
.4(2
0°C
)—
123
Styl
e75
5,C
S800
SSN
one
57.7
(20°
C)
—12
3N
ylon
-66
Mon
sant
oC
ompa
nyD
raw
n(1
time)
at0%
RH
38.3
(30°
C)
—12
5D
raw
n(1
time)
at60
%R
H42
.2(3
0°C
)—
125
Dra
wn
(4tim
es)
at0%
RH
34.2
(30°
C)
—12
5D
raw
n(4
times
)at
60%
RH
37.8
(30°
C)
—12
5PE
TD
uPo
ntM
ylar
wa.
(MeO
H-W
ater
),ex
t.ac
eton
e42
.6(1
5°C
)0.
1812
6,12
7H
oech
stC
elan
ese
Co.
Non
e41
.0(0°C
)0.
2512
8PE
Du
Pont
Non
e32
.7(5
0°C
)0.
3497
,129
Aqu
eous
ozon
atio
n(2
h)37
.1(5
0°C
)0.
4897
Aqu
eous
ozon
atio
n(3
h)28
.9(5
0°C
)0.
2797
,129
Fluo
rina
tion
#132
.8(5
0°C
)0.
3197
Fluo
rina
tion
#231
.3(5
0°C
)0.
3397
,129
Cel
lulo
seac
etat
eH
oech
stC
elan
ese
Co.
Inth
efo
rmof
fiber
s30
(0°C
)—
128
Inth
efo
rmof
fiber
s20
(0°C
)—
128
Cel
loph
ane
Bri
tish
Cel
loph
ane
Ltd
.Fi
lmcu
tin
the
form
ofco
nfet
ti42
(20°
C)
—13
0
PE,
poly
ethy
lene
;PE
T,
poly
ethy
lene
tere
phth
alat
e;w
a.,
was
hing
.

88 Belgacem and Gandini
particles bear different polar groups at their surface (OH, C O, COOH, SH,NH2, etc.), depending on the way in which they were prepared and/or treatedafter isolation. They find a large spectrum of applications as fillers, radical traps(e.g., in tires formulations), reinforcing materials, printing ink pigments, etc.These applications require a good knowledge of the adsorption features and sur-face energy of carbon black because in all cases its particles interact with thesurrounding matrix; thus, the quality of the ensuing dispersion and/or interfacewill be conditioned by the compatibility of the two phases.
The most important investigations in the surface characterization of graphiticfillers were carried out by a reseach team led by Donnet, Vidal, and Jagiello [70,114,132–146]. These authors have published a series of papers in which they in-vestigated the surface energy of carbon black from different sources, before andafter different types of modification, namely, (1) heating, (2) microwave plasmatreatment, (3) nitric acid oxidation, (4) solvent extraction, (5) mechanical com-pression, and (6) grafting with bis(3-triethoxysilylpropyl)tetrasulfane (TSPTS).
The values of the dispersive surface energy of these pristine and treated materialsare summarized in Table 10. These data suggest the following general remarks:
1. The dispersive surface properties of initial carbonaceous materials can varyfrom about 100 to 500 mJ/m2, depending on their source [114,134,137,146].
2. Thermal treatment induces a substantial increase in the dispersive surfaceenergy of carbon black [132,133,137,140]. This is roughly linear up to500°C, after which it tends to be less pronounced [140].
3. Microwave plasma treatment seems to be effective only when it is precededby a thermal treatment or when it is applied under oxidative atmosphere (air)[114,135,141] because of residual adsorbed hydrocarbons on the surface ofthe carbon particles.
4. Nitric acid oxidation produces a slight decrease (about 10–15%) in the dis-persive energy of the surface of carbon black [134,135,144].
5. Acetone, toluene, 1,2-dichlorobenzene, and acetophenone were found to bethe most efficient solvents for the surface purification of carbon particles[70], whereas water and n-alcanes were ineffective [70].
6. The mechanical compression of carbon black, previously extracted with tolu-ene, induces an increase in its dispersive energy from 140 to 475 mJ/m2
[142]. The compression of the pristine material appeared to be ineffectivesince the dispersive component gained only about 30% after being com-pressed under maximum load [142].
7. Grafting with silane coupling agent TSPTS induced a decrease in the disper-sive energy from 140 to about 120 mJ/m2 [143].
2. Lignin PowdersRecently, Belgacem et al. [30] studied the dispersive properties of different lig-nins obtained by conventional processes, such as kraft or sulfite pulping andnew delignification refineries like steam explosion and organosolv cooking. They
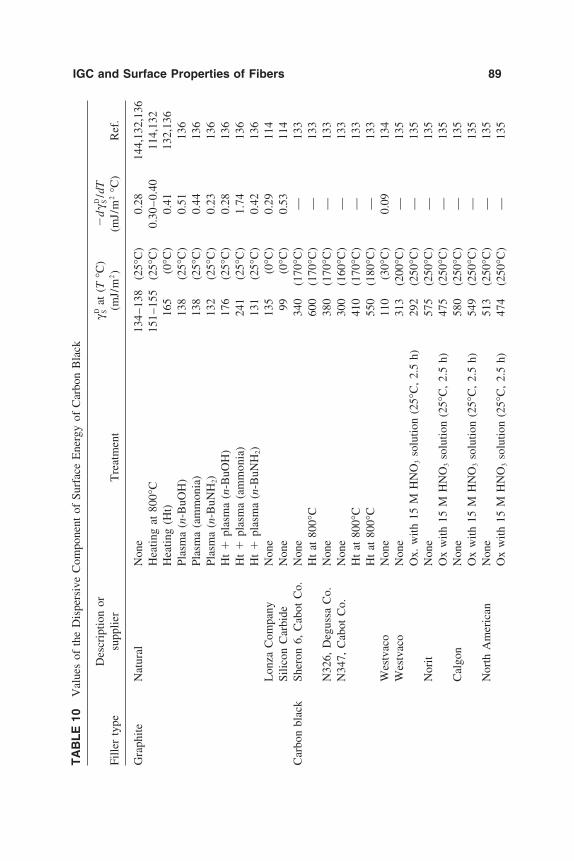
IGC and Surface Properties of Fibers 89T
AB
LE
10V
alue
sof
the
Dis
pers
ive
Com
pone
ntof
Surf
ace
Ene
rgy
ofC
arbo
nB
lack
Des
crip
tion
orγD S
at(T°C
)
dγD S
/dT
Fille
rty
pesu
pplie
rT
reat
men
t(m
J/m
2)
(mJ/
m2°C
)R
ef.
Gra
phite
Nat
ural
Non
e13
4–1
38(2
5°C
)0.
2814
4,13
2,13
6H
eatin
gat
800°
C15
1–1
55(2
5°C
)0.
30–0
.40
114,
132
Hea
ting
(Ht)
165
(0°C
)0.
4113
2,13
6Pl
asm
a(n
-BuO
H)
138
(25°
C)
0.51
136
Plas
ma
(am
mon
ia)
138
(25°
C)
0.44
136
Plas
ma
(n-B
uNH
2)13
2(2
5°C
)0.
2313
6H
t
plas
ma
(n-B
uOH
)17
6(2
5°C
)0.
2813
6H
t
plas
ma
(am
mon
ia)
241
(25°
C)
1.74
136
Ht
pl
asm
a(n
-BuN
H2)
131
(25°
C)
0.42
136
Lon
zaC
ompa
nyN
one
135
(0°C
)0.
2911
4Si
licon
Car
bide
Non
e99
(0°C
)0.
5311
4C
arbo
nbl
ack
Sher
on6,
Cab
otC
o.N
one
340
(170°C
)—
133
Ht
at80
0°C
600
(170°C
)—
133
N32
6,D
egus
saC
o.N
one
380
(170°C
)—
133
N34
7,C
abot
Co.
Non
e30
0(1
60°C
)—
133
Ht
at80
0°C
410
(170°C
)—
133
Ht
at80
0°C
550
(180°C
)—
133
Wes
tvac
oN
one
110
(30°
C)
0.09
134
Wes
tvac
oN
one
313
(200°C
)—
135
Ox.
with
15M
HN
O3
solu
tion
(25°
C,
2.5
h)29
2(2
50°C
)—
135
Nor
itN
one
575
(250°C
)—
135
Ox
with
15M
HN
O3
solu
tion
(25°
C,
2.5
h)47
5(2
50°C
)—
135
Cal
gon
Non
e58
0(2
50°C
)—
135
Ox
with
15M
HN
O3
solu
tion
(25°
C,
2.5
h)54
9(2
50°C
)—
135
Nor
thA
mer
ican
Non
e51
3(2
50°C
)—
135
Ox
with
15M
HN
O3
solu
tion
(25°
C,
2.5
h)47
4(2
50°C
)—
135

90 Belgacem and Gandini
TA
BL
E10
Con
tinue
d
Des
crip
tion
orγD S
at(T°C
)
dγD S
/dT
Fille
rty
pesu
pplie
rT
reat
men
t(m
J/m
2)
(mJ/
m2°C
)R
ef.
N11
0,D
egus
saN
one
404
(200°C
)—
137
N22
0,D
egus
saN
one,
colu
mn
144
7(2
00°C
)—
137
N22
0,D
egus
saN
one,
colu
mn
250
5(2
00°C
)—
137
N33
0,D
egus
saN
one
241
(200°C
)—
137
N33
0A
,D
egus
saN
one
300
(200°C
)—
137
N33
0B
,D
egus
saN
one
241
(200°C
)—
137
N33
0C
,D
egus
saN
one
213
(200°C
)—
137
N66
0,D
egus
saN
one,
colu
mn
111
5(2
00°C
)—
137
N66
0,D
egus
saN
one,
colu
mn
211
8(2
00°C
)—
137
N77
4,D
egus
saN
one
95(2
00°C
)—
137
N77
2,D
egus
saN
one
140
(80°
C)
—70
,142
Non
e14
7(8
0°C
)0.
614
3E
xtra
ctio
nw
ithn-
alka
nes
143
(80°
C)
—70
Ext
ract
ion
with
ethe
r13
0(8
0°C
)—
70E
xtra
ctio
nw
ithch
loro
form
146
(80°
C)
—70
Ext
ract
ion
with
acet
one
162
(80°
C)
—70
Ext
ract
ion
with
tolu
ene
(ExT
l)16
5(8
0°C
)—
70E
xtra
ctio
nw
ith1,
2-di
chlo
rben
zene
166
(80°
C)
—70
Ext
ract
ion
with
ethy
lben
zene
160
(80°
C)
—70
Ext
ract
ion
with
acet
ophe
none
173
(80°
C)
—70
Ht
at18
0°C
150
(120°C
)—
140
Ht
at30
0°C
210
(120°C
)—
140
Ht
at50
0°C
305
(120°C
)—
140

IGC and Surface Properties of Fibers 91H
tat
700°
C42
0(1
20°C
)—
140
Ht
at90
0°C
460
(120°C
)—
140
Pres
sing
at60
0M
Pa(P
r600
M)
185
(80°
C)
—14
2E
xTl
Pr
600M
475
(80°
C)
—14
2E
xTl
pr
essi
ngat
100
MPa
225
(80°
C)
—14
2E
xTl
pr
essi
ngat
200
MPa
375
(80°
C)
—14
2E
xTl
pr
essi
ngat
400
MPa
425
(80°
C)
—14
2G
raft
ing
with
TSP
TS
121
(80°
C)
0.55
143
N55
0G,
Deg
ussa
Non
e13
6(2
00°C
)—
137
Non
e15
0(1
00°C
)—
141
Ht
at90
0°C
for
4h
(ht9
-4)
250
(100°C
)—
137
Plas
ma
(hyd
roge
n)15
2(1
00°C
)—
141
Plas
ma
(air
)30
5(1
00°C
)—
141
Plas
ma
(am
mon
ia)
112
(100°C
)—
141
Plas
ma
(arg
on)
152
(100°C
)—
141
Ht9
-4
plas
ma
(hyd
roge
n)27
5(1
00°C
)—
141
Ht9
-4
plas
ma
(air
)40
3(1
00°C
)—
141
Ht9
-4
plas
ma
(am
mon
ia)
455
(100°C
)—
141
Ht9
-4
plas
ma
(arg
on)
440
(100°C
)—
141
none
47.9
(90°
C)
—14
4O
xw
ith25
%H
NO
3so
lutio
n(3
h)48
.9(9
0°C
)—
144
Ox
with
25%
HN
O3
solu
tion
(3h)
49.4
(90°
C)
—14
4A
ctiv
eC
arbo
niza
tion
offu
r-Fo
rmul
atio
n1
560.
5(2
5°C
)1.
8314
6fu
ryl
alco
hol
Form
ulat
ion
244
8.7
(25°
C)
2.03
146
Form
ulat
ion
340
5.4
(25°
C)
1.21
146
Form
ulat
ion
441
9.5
(25°
C)
1.72
146
TSP
TS,
bis(
3-tr
ieth
oxys
ilylp
ropy
l)te
tras
ulfa
ne;
Ox,
oxid
atio
n.
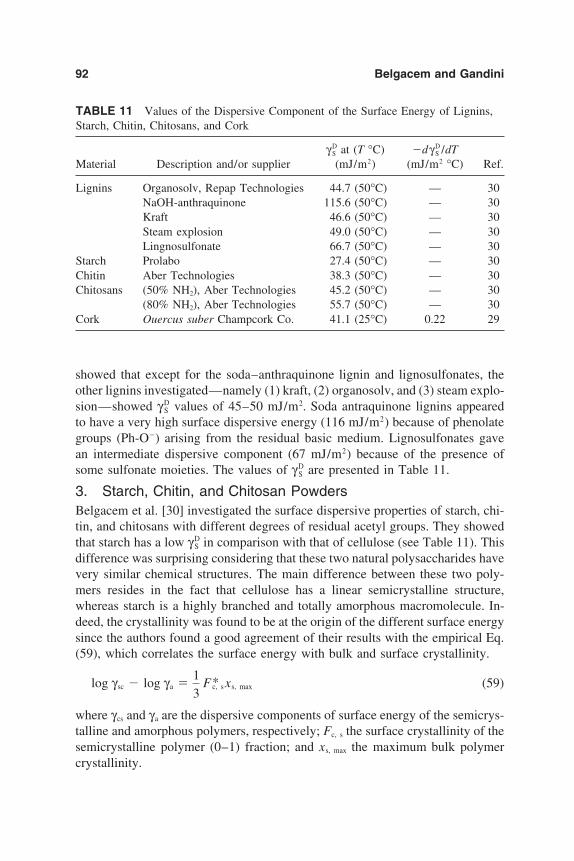
92 Belgacem and Gandini
TABLE 11 Values of the Dispersive Component of the Surface Energy of Lignins,Starch, Chitin, Chitosans, and Cork
γDS at (T °C) dγD
S /dTMaterial Description and/or supplier (mJ/m2) (mJ/m2 °C) Ref.
Lignins Organosolv, Repap Technologies 44.7 (50°C) — 30NaOH-anthraquinone 115.6 (50°C) — 30Kraft 46.6 (50°C) — 30Steam explosion 49.0 (50°C) — 30Lingnosulfonate 66.7 (50°C) — 30
Starch Prolabo 27.4 (50°C) — 30Chitin Aber Technologies 38.3 (50°C) — 30Chitosans (50% NH2), Aber Technologies 45.2 (50°C) — 30
(80% NH2), Aber Technologies 55.7 (50°C) — 30Cork Ouercus suber Champcork Co. 41.1 (25°C) 0.22 29
showed that except for the soda–anthraquinone lignin and lignosulfonates, theother lignins investigated—namely (1) kraft, (2) organosolv, and (3) steam explo-sion—showed γD
S values of 45–50 mJ/m2. Soda antraquinone lignins appearedto have a very high surface dispersive energy (116 mJ/m2) because of phenolategroups (Ph-O) arising from the residual basic medium. Lignosulfonates gavean intermediate dispersive component (67 mJ/m2) because of the presence ofsome sulfonate moieties. The values of γD
S are presented in Table 11.
3. Starch, Chitin, and Chitosan PowdersBelgacem et al. [30] investigated the surface dispersive properties of starch, chi-tin, and chitosans with different degrees of residual acetyl groups. They showedthat starch has a low γD
S in comparison with that of cellulose (see Table 11). Thisdifference was surprising considering that these two natural polysaccharides havevery similar chemical structures. The main difference between these two poly-mers resides in the fact that cellulose has a linear semicrystalline structure,whereas starch is a highly branched and totally amorphous macromolecule. In-deed, the crystallinity was found to be at the origin of the different surface energysince the authors found a good agreement of their results with the empirical Eq.(59), which correlates the surface energy with bulk and surface crystallinity.
log γsc log γa 13
F*c, sxs, max (59)
where γcs and γa are the dispersive components of surface energy of the semicrys-talline and amorphous polymers, respectively; Fc, s the surface crystallinity of thesemicrystalline polymer (0–1) fraction; and xs, max the maximum bulk polymercrystallinity.

IGC and Surface Properties of Fibers 93
FIG. 11 RT ln Vn versus a(γDS)1/2 plots for chitin and chitosans at 50°C. (From Ref. 30.)
The same authors [30] reported results related to the surface energy of chitinand two chitosans (see Table 11). As expected, they found that chitin showed aslightly lower value of γD
S (38.3 mJ/m2) compared with that of cellulose (XIII).In fact, chitin (XIV) and cellulose have again very similar structures except forthe fact that one of the secondary hydroxy groups of cellulose has been trans-formed into a secondary amide function in chitin. The lower intermolecular cohe-sive energy of the amide group (lack of mobile hydrogens) with respect to thatof the hydroxy function inevitably induces a decrease in the value of γD
S . Thesurface energy of chitosans (XV), which are a product of the partial deacetylationof chitin, increased by increasing the degree of deacetylation to reach 55.7 mJ/m2 for chitosans with only 20% of residual amide groups (x 0.8), i.e., a valuehigher than that of cellulose. Figure 11 shows the results of these determinations.This results from the fact that the primary amino groups give rise to a highercohesive energy than that induced by OH functions. In other words, the intermo-lecular hydrogen bonding in cellulose is somewhat less energetic than that oc-curring in highly deacetylated chitosans.

94 Belgacem and Gandini
4. Cork PowdersCordeiro et al. [29] studied the dispersive properties of cork from Quercus suberL. The values of γD
S at different temperature are reported in Table 11. As seenfrom these data, the dispersive contribution to the surface energy of cork extrapo-lated to 25°C is about 40 mJ/m2.
5. Synthetic PolymersIn the literature, the majority of studies dealing with the surface characterizationof polymers has been carried out by adsorbing them onto commercial chro-mosorbs. This type of column falls outside the present scope and these investiga-tions will not be discussed here. Nevertheless, IGC can be a very suitable tech-nique to investigate polymers that do not display film-forming properties becauseof their insoluble and infusible character, as well as those that can be degradedwhen submitted to film processing (e.g., thermal degradation under extrusion).
The most thoroughly studied powderous polymers are polyconjugated struc-tures reported by Chehimi and coworkers [147–151]. Only a recent publicationby Voelkel et al. [23] has been devoted to more common macromolecular materi-als such as polymethyl methacrylate (PMMA). The dispersive component ofthese polymers as such and after different modifications (doping with chloride

IGC and Surface Properties of Fibers 95
salts, p-toluenesulfonate etc., annealing under helium or air) were determined byIGC at zero coverage conditions, as summarized in Table 12. From these datathe following remarks can be given:
1. Polypyrrole (PPy) doped by an aqueous solution of FeCl3 (PPyCl) showeda decrease in its dispersive properties from 55 to 35 mJ/m2 [147,148]. Thecharge generation associated with doping casts serious doubts about the reli-ability of this result. Indeed, 3 years later, the same group of researcherscommunicated that the dispersive contribution to the surface energy of PPyClis about 140 mJ/m2 [150,151] without any comment concerning the enor-mous discrepancy with their previous value of 35 mJ/m2!
2. The doping of PPy with sodium p-toluenesulfonate was more efficient be-cause it induced an increase in the dispersive component up to about 90 mJ/m2 [149].
3. The coating of PPy with PMMA decreased its dispersive component of thesurface energy. At a high ratio of the adsorbed layer of PMMA, the dispersivecomponent tended to reach that of pure PMMA, i.e., 39 mJ/m2 [23,150,151].
4. The annealing under helium or air of six different acrylic polymers and onecopolymer (see Table 12) produced very little difference in their surfaceenergetics [23].
C. Characterization of Inorganic Fillers and Powders
1. Silicas and Other OxidesOxide surfaces have been used for a long time as adsorbents in chromatographicprocesses, catalysts or catalyst supports, fillers for polymeric matrices, etc. Atfirst, they were used as such and later they were subjected progressively to moreand more specific treatments in order to either (1) improve their surface compati-bility with the matrix and thus enhance the adhesion strength at the interface or(2) disperse homogeneously the particles in such applications as paints or coatingcompositions. In all cases, their surface properties must be assessed in order topredict the mechanical, optical, and other properties of the materials in whichthey are to be added [152–154]. The benefits of using IGC in the surface charac-terization of pigments have been recently reviewed [155–158].
The most significant work in the area of the characterization of the energeticsof oxide surfaces has been carried out by Papirer and coworkers who investigatedsilicas, clays, kaolinites, illites, mica, talc, etc. [26,157–177]. In addition, otherstudies on the same topic have appeared in the literature [178–193]. Since Dr.Papirer also contributes to this book, we will give here only a very brief outlineof the application of IGC to these materials. The interested reader will find moredetails in the appropriate chapter. The surface properties of different untreatedsilicas from various sources have been examined before subjecting them to sev-

96 Belgacem and Gandini
TA
BL
E12
Val
ues
ofth
eD
ispe
rsiv
eC
ompo
nent
ofth
eSu
rfac
eE
nerg
yof
Som
eSy
nthe
ticPo
lym
ers
γD Sat
(T°C
)
dγD S
/dT
Poly
mer
Tre
atm
ent
(mJ/
m2)
(mJ/
m2°C
)R
ef.
Poly
pyrr
ole
Non
e58
(48°
C)
0.01
147
Dop
ing
byFe
Cl 3
37(4
8°C
)0.
1514
7D
opin
gby
FeC
l 314
4(4
7.6°
C)
—15
0,15
1D
opin
gby
p-to
luen
esul
fona
te88
.5(2
4.6°
C)
0.16
149
Coa
ting
with
aso
lutio
nof
PMM
Ain
:T
etra
hydr
ofur
ane
69.4
(47.
6°C
)—
150,
151
1,4-
Dio
xane
39.2
(47.
6°C
)—
150,
151
Tol
uene
45.4
(47.
6°C
)—
150,
151
Tet
rach
loro
met
hane
32.7
(47.
6°C
)—
150,
151
1,2-
Dic
hlor
oeth
ane
54.1
(47.
6°C
)—
150,
151
Met
hyle
nech
lori
de70
.4(4
7.6°
C)
—15
0,15
1C
hlor
ofor
m55
.0(4
7.6°
C)
—15
0,15
1PB
DM
Non
e27
.0(5
0°C
)0.
0323
Ann
ealin
gun
der
He
at80°C
27.6
(50°
C)
0.07
23A
nnea
ling
unde
rH
eat
160°
C28
.0(5
0°C
)0.
0423
Ann
ealin
gun
der
air
at80°C
26.2
(50°
C)
0.03
23A
nnea
ling
unde
rai
rat
160°
C28
.4(5
0°C
)0.
0323
PPD
MN
one
30.1
(50°
C)
0.06
23A
nnea
ling
unde
rH
eat
80°C
30.3
(50°
C)
0.02
23A
nnea
ling
unde
rH
eat
160°
C31
.5(5
0°C
)0.
0723
Ann
ealin
gun
der
air
at80°C
28.4
(50°
C)
0.01
523
Ann
ealin
gun
der
air
at16
0°C
32.9
(50°
C)
0.09
523

IGC and Surface Properties of Fibers 97PO
ED
MN
one
26.5
(50°
C)
0.07
523
Ann
ealin
gun
der
He
at80°C
25.7
(50°
C)
0.08
523
Ann
ealin
gun
der
He
at16
0°C
24.8
(50°
C)
0.05
523
Ann
ealin
gun
der
air
at80°C
25.6
(50°
C)
0.08
523
Ann
ealin
gun
der
air
at16
0°C
25.0
(50°
C)
0.05
23PT
ED
MN
one
25.1
(50°
C)
0.05
23A
nnea
ling
unde
rH
eat
80°C
26.9
(50°
C)
0.08
23A
nnea
ling
unde
rH
eat
160°
C31
.7(5
0°C
)0.
0723
Ann
ealin
gun
der
air
at80°C
26.8
(50°
C)
0.07
23A
nnea
ling
unde
rai
rat
160°
C31
.1(5
0°C
)0.
0723
PND
MN
one
39.8
(50°
C)
0.06
523
Ann
ealin
gun
der
He
at80°C
40.1
(50°
C)
0.06
23A
nnea
ling
unde
rH
eat
160°
C41
.4(5
0°C
)0.
0823
Ann
ealin
gun
der
air
at80°C
40.4
(50°
C)
0.02
23A
nnea
ling
unde
rai
rat
160°
C44
.7(5
0°C
)0.
155
23P(
BD
M-c
o-M
A)
Non
e24
.8(5
0°C
)0.
025
23A
nnea
ling
unde
rH
eat
80°C
26.5
(50°
C)
0.05
23A
nnea
ling
unde
rH
eat
160°
C27
.4(5
0°C
)0.
0523
Ann
ealin
gun
der
air
at80°C
25.8
(50°
C)
0.04
523
Ann
ealin
gun
der
air
at16
0°C
26.3
(50°
C)
0.04
23PM
MA
Non
e36
.1(5
0°C
)0.
0323
Ann
ealin
gun
der
He
at80°C
37.2
(50°
C)
0.04
523
Ann
ealin
gun
der
He
at16
0°C
37.6
(50°
C)
0.06
523
Ann
ealin
gun
der
air
at80°C
37.0
(50°
C)
0.02
23A
nnea
ling
unde
rai
rat
160°
C37
.4(5
0°C
)0.
025
23
PBD
M,
poly
(but
ane-
1,4-
diol
dim
etha
cryl
ate)
;PP
DM
,po
ly(p
enta
ne-1
,5-d
iol
dim
etha
cryl
ate)
;PO
ED
M,
poly
(2,2′-o
xybi
seth
anol
dim
etha
cryl
ate)
;PT
ED
M,
poly
(2,2′-t
hiob
iset
hano
ldi
met
hacr
ylat
e);
PND
M,
poly
(N-m
ethy
ldie
than
olam
ine
dim
etha
cryl
ate)
;P
(BD
M-c
o-M
A),
BD
M-c
o-m
alei
can
hydr
ide
copo
lym
er;
PMM
A,
poly
(met
hyl
met
hacr
ylat
e).

98 Belgacem and Gandini
eral modifications, namely, (1) heat treatment, (2) grinding, and (3) grafting withpolyethylene glycols of different lengths or with perfluorosilane agents.
From these results (see Table 13), the following general remarks can be drawn:
1. The London component of the surface energy of illites from differentsources varies from about 140 to 185 mJ/m2 [26].
2. The dispersive surface energy of various kaolinites was found to fall in therange of 155–240 mJ/m2 [26].
3. The surface energy of titanium oxide varied from 25 to 55 mJ/m2
[30,65,183,188,192,193]. The plasma treatment induced a decrease of thedispersive surface energy (about 35 mJ/m2) when the treatment was carriedout under CH4 or C2 F4 but not when Ar or ammonia was used [192,193].
4. The dispersive contribution to the surface energy of aluminas from varioussources varied from about 40 to 165 mJ/m2 [67,156,169,187].
5. The dispersive component of the surface energy of untreated mica (musco-vite) is about 30 mJ/m2 [159,177]. This parameter increased up to about100 mJ/m2 when the material was ground for 75 h in different solvents andsolutions, as shown in Fig. 12 [159,177].
6. Untreated amorphous silica, from different sources, has a dispersive en-ergy between 30 and 100 mJ/m2 [160,161,165,168,175,179,180,184–186,189,191].
7. Crystalline silicas gave a γDS between 175 and 220 mJ/m2 [165,175].
8. The dispersive contribution to the surface energy of γ-alumina was about92 mJ/m2 [167].
9. Magnesium and zinc oxides were found to have a dispersive energy of about97 and 85 mJ/m2, respectively [170].
10. Grafting of silicas with perfluorinated agents reduced considerably theirdispersive properties, all the way down to 21 mJ/m2 [171].
11. Talc has a dispersive component of surface energy of between 150 and 200mJ/m2 [172,174,176]. Its grafting with methanol increased γD
S slightly,whereas its coupling with long-chain alcohols (pentanol and dodecanol), aswell as its surface treatment with sodium carbonate and O2/SiH4, decreasedthis parameter down to about 45 mJ/m2 [172,179]. The thermal treatmentof talc decreased its γD
S to 74 mJ/m2.12. The dispersive contribution to the surface energy of α-alumina was found
to be about 45 mJ/m2. The grinding of this material increased it up to about160 mJ/m2 [173].
13. The surface energy of ceramic superconductor powder of YBa2 Cu3Ox wasfound to be extremely low compared with the values commonly reportedfor oxides. These values were in the range 14–24 mJ/m2 [178].
14. The dispersive surface energy of natural clays (smectites from bentonites)was in the range of 160 mJ/m2 [181,182]. The adsorbtion of furfuryl alcohol

IGC and Surface Properties of Fibers 99T
AB
LE
13V
alue
sofγD S
ofD
iffe
rent
Silic
asan
dO
ther
Oxi
des
γD Sat
(T°C
)
dγD S
/dT
Mat
eria
lSu
pplie
rT
reat
men
t(m
J/m
2)
(mJ/
m2°C
)R
ef.
Mic
asB
ihar
,In
dia
Non
e30
(25°
C)
—15
9,17
7N
one
49.2
(100°C
)—
156
Silic
asA
eros
ilA
300,
Deg
ussa
Non
e76
(60°
C)
0.30
161
(Ger
man
y)G
raft
ing
by5%
ofPE
G-2
000
43(6
0°C
)0.
2016
1G
raft
ing
by7%
ofPE
G-4
000
36(6
0°C
)0.
0816
1G
raft
ing
by17
%of
PEG
-200
038
(60°
C)
0.15
161
Gra
ftin
gby
23%
ofPE
G-2
000
36(6
0°C
)0.
0816
1G
raft
ing
by56
%of
PEG
-200
030
(60°
C)
0.10
161
Gra
ftin
gby
57%
ofPE
G-1
0000
30(6
0°C
)0.
1016
1G
raft
ing
by72
%of
PEG
-400
030
(60°
C)
0.10
161
Gra
ftin
gby
75%
ofPE
G-1
0000
32(6
0°C
)0.
1316
1G
raft
ing
bym
onoe
thyl
ene
glyc
ol51
(60°
C)
—16
1G
raft
ing
bydi
ethy
lene
glyc
ol60
(60°
C)
—16
1G
raft
ing
bytr
ieth
ylen
egl
ycol
40(6
0°C
)—
161
Gra
ftin
gby
tetr
aeth
ylen
egl
ycol
39(6
0°C
)—
161
Gra
ftin
gby
1,4-
buta
nedi
ol63
(60°
C)
—16
1G
raft
ing
by1,
6-bu
tane
diol
40(6
0°C
)—
161
Gra
ftin
gby
1,4-
hexa
nedi
ol40
(60°
C)
—16
1G
raft
ing
by1,
8-oc
tane
diol
44(6
0°C
)—
161
Gra
ftin
gby
1,10
-dec
aned
iol
49(6
0°C
)—
161
Aer
osil
A13
0,D
egus
saN
one
40(8
0°C
)—
175
Non
e75
.3(2
0°C
)0.
3216
0,17
9G
raft
ing
with
met
hano
l70
.2(2
0°C
)0.
3216
0,17
9G
raft
ing
with
hexa
deca
nol
38.7
(20°
C)
0.10
160,
179
Rho
nePo
ulen
cN
one
98.2
(20°
C)
0.41
160,
179

100 Belgacem and GandiniT
AB
LE
13C
ontin
ued
γD Sat
(T°C
)
dγD S
/dT
Mat
eria
lSu
pplie
rT
reat
men
t(m
J/m
2)
(mJ/
m2°C
)R
ef.
Gra
ftin
gw
ithm
etha
nol
68.2
(20°
C)
0.29
160,
179
Gra
ftin
gw
ithhe
xade
cano
l35
.6(2
0°C
)0.
0616
0,17
9N
one
54.3
(65°
C)
0.24
168
Aer
osil
A15
0,D
egus
saG
raft
ing
with
TM
ED
OM
SI45
.2(6
5°C
)0.
2116
8N
one
50.6
(110°C
)—
186
Aer
osil
A20
0,D
egus
saG
raft
ing
byhe
xam
ethy
diso
loxa
ne36
.2(1
10°C
)—
186
Non
e41
(200°C
)—
180
Dav
idso
n95
2H
eatin
gat
600°
C38
(200°C
)—
180
Hea
ting
at80
0°C
31(2
00°C
)—
180
Hea
ting
at60
0°C
87(2
00°C
)—
180
Ald
rich
Non
e29
.6(1
00°C
)0.
1519
1Si
lica
C18
Non
e30
.4(1
00°C
)0.
0719
1L
ichr
opre
pR
P18
Non
e31
.0(1
00°C
)0.
1619
1L
ichr
opre
pSi
100
Non
e80
(20°
C)
—17
1X
OB
75G
raft
ing
with
TD
FOM
DS
30(2
0°C
)—
171
Rho
nePo
ulen
cG
raft
ing
with
PDFD
MC
S24
(20°
C)
—17
1Sm
ectit
esB
ento
nite
sSa
tura
tion
with
1N
NaC
lso
lutio
n(M
)15
9(1
80°C
)—
181
M
ws
with
Al(
OH
) 3so
lutio
n(M
I)17
1(1
80°C
)—
181
MI
he
atin
gat
400°
C(M
A)
160
(180°C
)—
181
M15
5(1
50°C
)—
182
MA
153
(150°C
)—
182
MA
FA
po
lym
eriz
atio
n,PO
L(M
AP)
122
(150°C
)—
182
M
FA
POL
he
atin
gat
700°
C(M
C)
232
(150°C
)—
182
MA
P
htat
700°
C(M
AC
)37
(150°C
)—
182
Hyd
roca
lcite
sM
g-A
l-C
O3
Mg/
Al
2
(H2)
65(1
50°C
)—
182
Mg-
Al-
CO
3,M
g/A
l
3(H
3)51
(150°C
)—
182

IGC and Surface Properties of Fibers 101H
2
FA
POL
(H2P
)14
1(1
50°C
)—
182
H3
FA
PO
L(H
3P)
142
(150°C
)—
182
H2
FA
PO
L
htat
700°
C(H
2C)
231
(150°C
)—
182
H3
FA
PO
L
htat
700°
C(H
2C)
165
(150°C
)—
182
Alu
min
asPe
chin
eyal
umin
umN
one
65–1
62—
67D
egus
saγ-
Alu
min
as,
none
92(1
00°C
)—
167
Ht
at30
0°C
125
(100°C
)—
167
Ht
at30
0°C
85(1
00°C
)—
167
Non
e92
(100°C
)—
169
Pech
iney
alum
inum
α-al
umin
as,
none
50(1
00°C
)—
173
htat
450°
C70
(100°C
)—
173
Gri
ndin
gup
to16
0—
173
Ald
rich
Non
e72
(200°C
)—
180
Ht
at60
0°C
89(2
00°C
)—
180
Illit
esV
osge
s,Fr
ance
Non
e17
7(8
0°C
)0.
1026
Szab
adsa
g,H
unga
ryN
one
174
(80°
C)
0.15
26B
rive
,Fr
ance
Non
e13
8(8
0°C
)0.
0326
Kao
linite
sC
hare
nte,
Fran
ceN
one
211
(80°
C)
0.28
26Pl
oem
eur,
Fran
ceN
one
198
(80°
C)
0.34
26Pr
ovin
s,Fr
ance
Non
e15
4(8
0°C
)0.
0126
SPS
Inte
rnat
iona
lC
oatin
gw
ith10
part
sSB
-lat
ex
1pa
rtC
MC
28(5
0°C
)—
203
SPS
Inte
rnat
iona
lC
oatin
gw
ith10
part
sst
arch
55(5
0°C
)—
203
TiO
2Si
cpa
Non
e39
.7(5
0°C
)—
30N
one
25–5
5—
65,1
83,1
88,1
92,1
93N
one
50–1
24—
155
ZnO
Rho
nePo
ulen
cN
one
85.3
(25°
C)
0.4
170
MgO
Mer
ckN
one
95.6
(25°
C)
0.2
170
PEG
,pol
yeth
ylen
egl
ycol
;TM
ED
OM
SI,t
etra
met
hyle
thyl
ened
ioxy
dim
ethy
lsila
ne;T
DFO
MD
S,tr
idec
afluo
rooc
tylm
ethy
ldic
hlor
osila
ne;P
DFD
MC
S,pe
ntad
e-ca
fluor
odec
ylm
ethy
ldic
hlor
osila
ne;
FA,
furf
uryl
alco
hol;
SB,
styr
ene-
buta
dien
e;C
MC
,ca
rbox
ymet
hylc
ellu
lose
.

102 Belgacem and Gandini
FIG. 12 γDS of muscovite surface as a function of grinding time in different solvents.
(From Ref. 159 for top and Ref. 177 for bottom.)
(FA) on the surface of these materials and its subsequent polymerizationlowered the surface energy to 37 mJ/m2. The carbonization of these parti-cles restored a high surface energy of 120–230 mJ/m2 [182]. Synthetichydrotalcites were also investigated and showed different results from thoseobtained on natural smectites since the initial materials had a γD
S of 50–65mJ/m2 and their surface coating by a layer of polyFA yielded a γD
S of 140mJ/m2. The carbonization of these particles again produced an increase ofγD
S [182].

IGC and Surface Properties of Fibers 103
FIG. 13 Variation of the dispersive contribution to the surface energy of amorphoussilicas heat-treated at increasing temperature. (A) aerosil, (G) gel, and (P) precipitated.(From Ref. 165.)
15. The dispersive component of the surface energy of fumed silica decreasedfrom 51 to 36 mJ/m2 when the materials were grafted with hexamethyldisi-lazane as coupling agents [184–186]. γD
S increased when these particleswere submitted to heat treatment up to 600°C, as shown in Fig. 13 [165].The same trend was observed with other types of silica (Fig. 14) [186].
16. The dispersive surface energy of grafted silica was found to be a linearfunction of the surface concentration of silane [190].
17. Grafting silicas with alcohols bearing different n-alkyl chains resulted inthe behavior shown in Fig. 15 which emphasizes the role of the specific(short) length of the carbon chain on the actual value of γD
S .
2. AluminumThere are only two papers that have reported the surface energy of aluminum asdetermined by IGC at infinte dilution conditions. The values of γD
S obtained wereabout 120 mJ/m2 for base-treated samples and 140 mJ/m2 for acid-treated ones[194,195].
3. Calcium Carbonate and Calcium OxideThe fact that calcium carbonate is frequently used in paper coating and as a fillerfor thermoplastics and composite materials justifies the need of a good knowledgeof its surface properties, which have indeed been investigated [157,158,196,197].As for most fillers, before its incorporation into plastics, calcium carbonate isusually subjected to a specific surface treatment in order to facilitate its disper-

104 Belgacem and Gandini
FIG. 14 Variation of γDS of fumed silica under heating. (From Ref. 186.)
sion. The most commonly used coupling agent for calcium carbonate is stearicacid [198]. IGC has been used for the determination of the surface energy ofcalcium carbonate [192,193,199–203].
From these investigations one can extract the following:
1. Untreated calcium carbonate has a surface energy in the range 45–70 mJ/m2
[30,157,158,192,193,199,203].2. Plasma-treated calcium carbonate yields particles with lower dispersive sur-
face energy (about 30 mJ/m2) when the treatment is carried out under CH4 orC2 F4 whereas when Ar or ammonia is used no significant change is observed[192,193].
3. The treatment of calcium carbonate with stearic acid decreases its dispersivecomponent of the surface energy down to 25–35 mJ/m2 [199,200,202].
4. The thermal treatment of calcium carbonate leads to an increase of its surfaceenergy. In fact, for a sample conditioned at 300°C the γD
S reached 250mJ/m2 [201].
5. The adsorption of styrene-butadiene latex as a binder on calcium carbonateparticles induces a decrease of their γD
S to 25 mJ/m2, whereas their coatingwith starch does not bring about any substantial change [203].

IGC and Surface Properties of Fibers 105
FIG. 15 Variation of γDS of silica grafted with n-alkyl chains of growing size. (From
Ref. 163 for 15a and Ref. 164 for 15b.)
6. The surface energy of calcium oxide was found to increase with grindingtime (200 h) from 42 to 60 mJ/m2 [204].
These data are summarized in Table 14.
4. Printing Ink PigmentsThe quality of the dispersion of printing ink pigments into organic vehicles de-pends on their energetic and acid–base surface properties [205]. There is littleinformation published about these parameters except for very recent papers[30,65] which reported that the dispersion of common printing ink pigments (ma-genta, cyan, violet, green, yellow) was about 35 mJ/m2, as shown in Table 14.

106 Belgacem and GandiniT
AB
LE
14V
alue
sofγD S
ofD
iffe
rent
Fille
rs,
Pigm
ents
,an
dM
isce
llane
ous
Mat
eria
ls
Mat
eria
lSu
pplie
rT
reat
men
tγD S
(mJ/
m2 )
Ref
.
CaC
O3
Solv
ayN
one
52.0
(50°
C)
157,
158
Om
yaN
one
48.0
(50°
C)
157,
158
Lab
orat
ory
Non
e58
.0(2
0°C
)19
9G
raft
ing
byst
eari
cac
id50
%co
vera
ge33
.0(2
0°C
)19
975
%co
vera
ge28
.0(2
0°C
)19
910
0%co
vera
ge27
.0(2
0°C
)19
9N
one
44.4
(70°
C)
200
Gra
ftin
gby
stea
ric
acid
29.0
(70°
C)
200
Lab
orat
ory
Prec
ipita
tion
(P)
50(1
00°C
)20
1P
and
heat
ing
at30
0°C
250
(100°C
)20
1M
arbl
eH
eatin
gat
100°
C50
(100°C
)20
1H
eatin
gat
300°
C95
(100°C
)20
1C
halk
IH
eatin
gat
100°
C18
0(1
00°C
)20
1H
eatin
gat
300°
C20
0(1
00°C
)20
1C
halk
IIH
eatin
gat
100°
C13
5(1
00°C
)20
1H
eatin
gat
300°
C15
0(1
00°C
)20
1L
abor
ator
yN
one
(A)
50.3
(60°
C)
202
A
1m
onol
ayer
AK
D35
.6(6
0°C
)20
2N
one
(B)
52.6
(60°
C)
202
B
1/4
mon
olay
erA
KD
48.9
(60°
C)
202
B
1m
onol
ayer
AK
D37
.3(6
0°C
)20
2O
mya
none
(C)
68(5
0°C
)20
3C
10
part
sSB
-lat
ex25
(50°
C)
203
C
5pa
rts
SB-l
at.
1
part
CM
C44
(50°
C)
203
C
10pa
rts
SB-l
at.
1
part
CM
C27
(50°
C)
203

IGC and Surface Properties of Fibers 107C
10
part
sSB
-lat
.
1pa
rtC
MC
25(5
0°C
)20
3C
10
part
sst
arch
58(5
0°C
)20
3Pr
olab
oN
one
21.3
(50°
C)
30Si
cpa
Unk
now
n68
.6(5
0°C
)30
CaO
Non
e42
.4(2
0°C
)20
4G
rind
ing
for
10h
48.6
(20°
C)
204
Gri
ndin
gfo
r20
h49
.5(2
0°C
)20
4G
rind
ing
for
100
h54
.5(2
0°C
)20
4G
rind
ing
for
200
h60
.8(2
0°C
)20
4H
eatin
gat
400°
C50
.0(2
0°C
)20
4H
eatin
gat
600°
C45
.2(2
0°C
)20
4H
eatin
gat
800°
C40
.8(2
0°C
)20
4H
eatin
gat
1000°C
38.5
(20°
C)
204
Mag
enta
Non
e26
.5(6
0°C
)65
Vio
let
Non
e29
.8(6
0°C
)65
Gre
enN
one
43.0
(60°
C)
65M
agen
taSi
cpa
Non
e40
.3(5
0°C
)30
Cya
nSi
cpa
Non
e38
.4(5
0°C
)30
Yel
low
Sicp
aN
one
34.4
(50°
C)
30T
heop
hylli
neSi
gma
Non
e50
.8(3
5°C
)20
6C
affe
ine
Sigm
aN
one
39.9
(35°
C)
206
α-L
acto
seL
acto
chem
Non
e42
(29°
C)
207
Hea
ting
at40°C
42(2
9°C
)20
7St
ainl
ess
Pass
ivat
ion
105
(40°
C)
208
Ele
ctro
polis
hing
(coi
led)
49(4
0°C
)20
8E
lect
ropo
lishi
ng(l
inea
r)43
(40°
C)
208
Allt
ech
Non
e33
(40°
C)
208
Salb
utan
olG
laxo
Bat
ch1,
heat
ing
at40°C
83(2
9°C
)20
9su
lfat
eB
atch
2,he
atin
gat
40°C
38(2
9°C
)20
9
AK
D,
alky
lket
ene
dim
er;
CM
C,
carb
oxym
ethy
lcel
lulo
se;
SB-l
atex
;St
yren
e-bu
tadi
ene
late
x.

108 Belgacem and Gandini
5. MiscellaneousIn addition to the above substances, IGC has been very recently applied to lesscommon products. Thus, the dispersive properties of theophylline, caffeine, α-lactose monohydrate, stainless steel, submatol sulfate, and petroleum pitches havebeen reported [206–210]. The values of the corresponding γD
S are summarized inTable 14.
X. ACID–BASE PROPERTIES
The acid–base properties of fibers and fillers are also of great interest in theelaboration of composites and blends. IGC is undoubtedly a good technique toevaluate these properties starting from classical acid–base concepts as discussedin Sec. VIII.E. In this survey we will report only acid–base numbers as obtainedusing St. Flour and Papirer’s approach [68] [Eq. (50)] and the interaction parame-ter Ω according to Schreiber’s formalism [47] [Eqs. (52) and (53)]. This choiceis motivated by the fact that KA and KB are temperature-independent and that Ωis always obtained from the same acid–base probes, i.e., n-BuOH as an acid andn-BuNH2 as a base [47]. These considerations facilitate the comparison betweenthe data reported in the literature. The other acid–base parameters are less homo-geneous because they are temperature- and probe-dependent, which renders anyquantitative comparison impossible.
A. Fibers
1. Cellulose and Pulp FibersKamdem et al. [93] studied the acid–base properties of extractive-free white birchwood meal and found that this material had an acidic surface (KA/KB 1.5) asshown in Table 15, which collects the KA /KB values for these and other fibers.
Felix and Gatenholm reported the acid–base properties of bleached softwoodpulp fibers before and after grafting them with ASA and detected an increase inthe acidity component [94] (see Table 15). The authors did not give a rationalexplanation of this behavior because they simply evoked the fact that KA and KB
decreased by 44% and 83%, respectively, due to the coverage of hydroxy andglucosidic groups on the surface of the fibers. From our point of view, a morelogical interpretation, while accepting that the decrease of these parameters isrelated to the surface grafting, explains the important quantitative evidence thatKA /KB increased form 1.29 to 4.25 in terms of the presence of the carboxylicacid groups arising from the esterification between the anhydride functions ofASA (Structure II) and the OH groups of cellulose. The same research teaminvestigated bleached softwood pulp fibers before and after treatment with plasmaunder different atmospheres [95]. They found, as expected, that the plasma treat-ment in the presence of ammonia and nitrogen increased the surface basicity,

IGC and Surface Properties of Fibers 109
TABLE 15 Acid–Base Properties of Different Modified and Untreated Fibers
Material Treatment KA KB KA/KB Ref.
Birch wood meal None 4.40 3.00 1.47 93Bleached softwood None 0.31 0.24 1.29 94
pulp Grafted by ASA 0.17 0.04 4.25 94None 0.25 0.23 1.09 95NH3 plasma for:
5 s 0.14 0.28 0.50 9515 s 0.09 0.31 0.29 9560 s 0.16 0.22 0.73 95
N2 plasma for5 s 0.22 0.27 0.81 9515 s 0.16 0.30 0.53 9560 s 0.19 0.22 0.86 95
MMAc plasma for5 s 0.30 0.20 1.5 9515 s 0.33 0.15 2.2 9560 s 0.39 0.10 3.9 95
α-Hardwood None — — 3.0 66cellulose Acetone extraction (AcE) — — 2.4 66
Corona treatment at:15 mA — — 4.8 6632 mA — — 3.9 6640 mA — — 3.3 66
AcE corona treated at:15 mA — — 4.1 6632 mA — — 3.3 6640 mA — — 2.5 66
Explosion pulp None 2.4 12.1 0.2 97Kraft pulp None 5.5 5.0 1.1 97Carbon fibers None 6.5 1.5 4.3 40–42,103
Oxidation 10.0 3.2 3.1 40–42,103Enzymation 8.6 13.0 0.7 40Coating 8.6 13.0 0.7 40–42,103Coating 9.1 9.3 1.0 41–42,103Carbonization 1.0 1.4 0.7 108Stabilization 1.5 1.3 1.2 108Heating at 1500°C (A) 6.5 8.0 0.8 110Heating at 1800°C (B) 5.4 6.6 0.8 110Heating at 2100°C (C) 4.6 6.2 0.75 110Heating at 2400°C (D) 4.4 6.2 0.7 110Heating at 2700°C (E) 3.6 5.2 0.7 110E anodic oxidation
at Io current 8.6 9.0 0.75 110

110 Belgacem and Gandini
TABLE 15 Continued
Material Treatment KA KB KA/KB Ref.
at 3 ∗ Io current 9.9 10.0 1.0 110at 10 ∗ Io current 12.1 7.6 1.6 110at 30 ∗ Io current 8.6 4.6 1.9 110
Carbonization at 1280°C (F) 343 84 4.1 112F oxidation with O2 (G) 359 292 1.2 112G oxidation with HNO3 908 277 3.3 112Carbonization at 2600°C (H) 0 0 — 112H oxidation with HNO3 192 255 0.85 112None 0.1 0.7 0.1 113Oxidation 0.5 0.7 0.7 113Sizing 1.1 0.8 1.4 113Sizing 0.9 2.2 0.4 113
Polyethylene fibers None 0 0 — 97Ozonation for 2 h 3.5 0.8 4.4 97Ozonation for 3 h 3.3 1.0 3.3 97Fluorination 1 7.3 2.5 2.9 97Fluorination 2 10.3 9.2 1.1 97
ASA, alkylsuccinic anhydride; MMAc, methyl methacrylic acid.
whereas the surface acidity of the fibers was found to increase when the treatmentwas carried out in a methacrylic acid medium [95] (see Table 15).
More recently, Belgacem et al. [66] reported the acid–base surface propertiesof different types of cellulosic fibers as such, purified by acetone extraction andcorona-treated. The acid–base properties changed significantly as summarized inTable 15.
Finally, Chtourou et al. [97] investigated unbleached steam-explosed and kraftpulps and found that they had KA /KB ratios of 0.2 and 1.1, respectively. Thestrong basic character of the steam-explosed pulps was not interpreted.
2. Carbon FibersSchultz et al. [40–42,103] were the first to investigate the acid-base propertiesof carbon fibers in the form of commercial polyacrylonitrile-based fibers corre-sponding to different stages of manufacture. The values of KA and KB thus ob-tained are resumed in Table 15. From these values it can be concluded that thesurface of carbon fibers before and after an oxidizing treatment has an acidiccharacter (KA/KB 3–4), whereas coating with epoxy resins gives a neutralsurface (KA /KB 1). The enzymatic treatment of these fibers yielded a surfaceof high basicity (KA /KB 0.66).
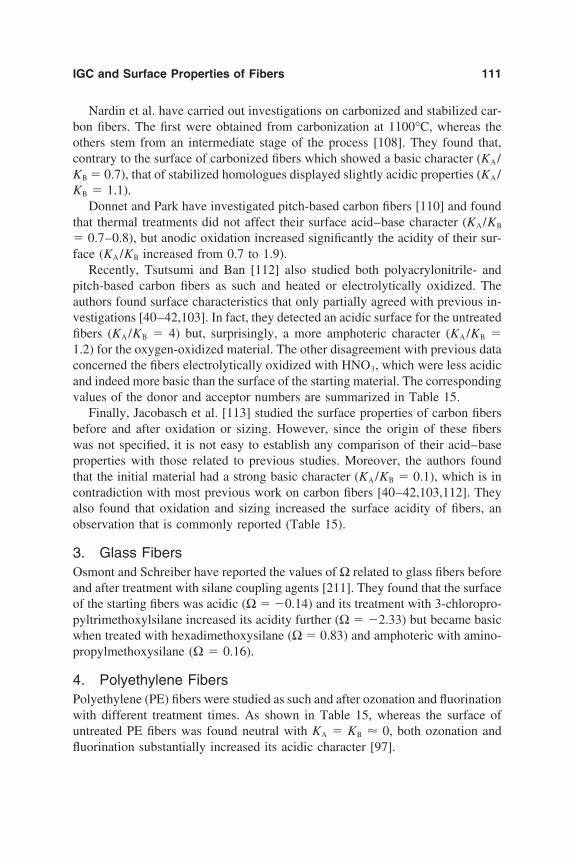
IGC and Surface Properties of Fibers 111
Nardin et al. have carried out investigations on carbonized and stabilized car-bon fibers. The first were obtained from carbonization at 1100°C, whereas theothers stem from an intermediate stage of the process [108]. They found that,contrary to the surface of carbonized fibers which showed a basic character (KA /KB 0.7), that of stabilized homologues displayed slightly acidic properties (KA /KB 1.1).
Donnet and Park have investigated pitch-based carbon fibers [110] and foundthat thermal treatments did not affect their surface acid–base character (KA/KB
0.7–0.8), but anodic oxidation increased significantly the acidity of their sur-face (KA /KB increased from 0.7 to 1.9).
Recently, Tsutsumi and Ban [112] also studied both polyacrylonitrile- andpitch-based carbon fibers as such and heated or electrolytically oxidized. Theauthors found surface characteristics that only partially agreed with previous in-vestigations [40–42,103]. In fact, they detected an acidic surface for the untreatedfibers (KA /KB 4) but, surprisingly, a more amphoteric character (KA /KB 1.2) for the oxygen-oxidized material. The other disagreement with previous dataconcerned the fibers electrolytically oxidized with HNO3, which were less acidicand indeed more basic than the surface of the starting material. The correspondingvalues of the donor and acceptor numbers are summarized in Table 15.
Finally, Jacobasch et al. [113] studied the surface properties of carbon fibersbefore and after oxidation or sizing. However, since the origin of these fiberswas not specified, it is not easy to establish any comparison of their acid–baseproperties with those related to previous studies. Moreover, the authors foundthat the initial material had a strong basic character (KA /KB 0.1), which is incontradiction with most previous work on carbon fibers [40–42,103,112]. Theyalso found that oxidation and sizing increased the surface acidity of fibers, anobservation that is commonly reported (Table 15).
3. Glass FibersOsmont and Schreiber have reported the values of Ω related to glass fibers beforeand after treatment with silane coupling agents [211]. They found that the surfaceof the starting fibers was acidic (Ω 0.14) and its treatment with 3-chloropro-pyltrimethoxylsilane increased its acidity further (Ω 2.33) but became basicwhen treated with hexadimethoxysilane (Ω 0.83) and amphoteric with amino-propylmethoxysilane (Ω 0.16).
4. Polyethylene FibersPolyethylene (PE) fibers were studied as such and after ozonation and fluorinationwith different treatment times. As shown in Table 15, whereas the surface ofuntreated PE fibers was found neutral with KA KB 0, both ozonation andfluorination substantially increased its acidic character [97].

112 Belgacem and Gandini
B. Fillers and Powders
1. Activated CarbonDonnet et al. studied the donor–acceptor properties of natural graphite as such,heated at 800°C and plasma-treated under vapors of nBuOH, ammonia, andnBuNH2 [136]. The main points that can be drawn from these results, given inTable 16, are:
1. The surface of virgin natural graphite is acidic (KA /KB 1.5).2. Heating this material gives rise to a basic surface (KA /KB 0.6).3. Plasma treatment in the presence of vapors of nBuOH did not affect the
surface of untreated carbon (KA /KB 1.5) but increased the surface acidityof heated samples (KA /KB 1.2).
4. Plasma treatment in the presence of vapors of nBuNH2 increased the basiccharacter of the surface of both heated and unheated samples.
2. Calcium CarbonateSchreiber et al. have reported values of the interaction parameter Ω of CaCO3
as received and plasma-treated [212–214], and showed that the initial surface ofthis filler possessed a basic character (Ω 0.30). This parameter increased whenthe filler was plasma-treated in the presence on nBuNH2 and ammonia (Ω
TABLE 16 Acid–Base Properties of Different Materials
Material Treatment KA KB KA/KB Ref.
Natural None (A) 1.24 0.83 1.49 136graphite A nBu-OH plasma 1.37 0.89 1.54 136
A NH3 plasma 0.49 0.90 0.54 136A nBu-NH2 plasma 0.38 0.87 0.44 136Heating at 800°C (B) 0.59 0.94 0.63 136B nBu-OH plasma 1.18 0.96 1.23 136B NH3 plasma 0.79 1.72 0.46 136B nBu-NH2 plasma 0.47 1.02 0.45 136
Polypyrrole Doping by p-toluenesulfonate 0.273 0.026 10.5 149Doping by aq. sol. of FeCl3 0.261 0.436 0.6 149
Polyoctylthio- None 0.0138 0.298 0.46 149phene
α-Alumina Pure acidic (Bayer process) 12.2 6.3 1.9 157,15820.5 8.1 2.5 157,158
Cork None 0.32 0.29 1.1 29Theophylline None 0.072 0.105 0.68 206Caffeine None 0.051 0.034 1.55 206
aq. sol., aqueous solution.

IGC and Surface Properties of Fibers 113
1.75 and 0.70, respectively) and decreased when nBuOH and ethylene were usedas gas for plasma treatment (Ω 0 with both). The use of argon gave a moreamphoteric surface (Ω 0.19).
3. Polymeric PowdersThe surface properties of p-toluenesulfonate-doped polypyrrole was found to beara very acidic character (KA/KB 10.5), whereas those of chloride-doped polypyr-role and poly(3-octylthiophene) were basic (KA/KB 0.6 and 0.5, respectively)[149] (see Table 16).
4. CorkCordeiro et al. [29] studied the acid–base properties of cork powders and foundthat cork has a slightly acidic surface (KA/KB 1.3), as shown in Table 16.
5. MiscellaneousWhereas the surface of theophylline powder was found to be basic (KA /KB 0.7), that of caffeine appeared to be acidic (KA /KB 1.6) [206] (see Table 16).
XI. INTERACTION PARAMETERS IN COMPOSITESAND BLENDS
Schultz et al. [40–42,103] have also characterized the acid–base properties ofdifferent carbon fibers according to Eq. (50). The values of KA and KB thus ob-tained were used to calculate the interaction parameter A [Eq. (57)] and it wasshown that the interfacial shear strength (τ) increased when A increased as illus-trated in Fig. 16.
Lara and Schreiber [65] have also correlated the interaction parameter Isp, [Eq.(58)] between pigments and vehicles (liquid matrix) to the adsorption capacityof various resins and found a linear relationship between these two parameters,as shown in Fig. 17.
These two examples show the importance of IGC in the search for correlationsbetween the physical chemistry of the surface of both matrix and filler or fiberand the macroscopic properties of the resulting blends or composites.
XII. CONCLUSIONS
By writing this survey, we wished to emphasize the importance of IGC as atechnique for the surface characterization of fibers and fillers. We pointed outthe fact that IGC is suitable for materials that have no film forming ability and/or those that lose their original surface properties where they are cast. Of course,there are some peculiarities of this method and the values obtained from IGCmeasurements are not always readily comparable with those obtained from other

114 Belgacem and Gandini
FIG. 16 Interfacial shear resistance versus specific interaction parameter (A) betweenan epoxy resin matrix and carbon fibers as defined by Schultz et al. [41].
techniques. Nonetheless, the microscopic character of IGC (adsorption at infi-nitely dilute conditions) provides much information that more conventional tech-niques are not able to detect. The main conclusion that we want to convey is thatthe reader should keep in mind that IGC is not only a useful complementary tech-nique, but in some instances it is the only method that can be applied to study the sur-face properties of a material. If more laboratories are stimulated to adapt theirconventional GC equipment to IGC, we will consider that we have reached thegoal that we outlined when we accepted the invitation to contribute to this book.
FIG. 17 Rationalizing adsorption of different resins onto the surface of various pigmentsusing the interaction parameter Isp as defined by Lara and Schreiber [65]. (a) S1 is a polyes-ter with Mn of 1800 and an acid value (AV ) of 8.0. (b) A3 is a polyester with Mn of 1200and an AV of 0.7. A3 was modified by amine group backbones. (c) A1 and (d) A2 arevery similar to A3, except that they have an AV of 7.7 and 7.6, respectively.

IGC and Surface Properties of Fibers 115

116 Belgacem and Gandini
ADDENDUM
Since this review was sent to the editor, some papers relevant to its aim haveappeared in the literature [215–217]. Thus, data concerning fully bleached soft-wood kraft pulps [215] and chemicothermomechanical pulps (CTMP) [216] andother, different modifications have been reported. More recently, Botaro and Gan-dini [217] proposed an original approach for preparing composite materials rein-forced by cellulosic fibers, based on the idea of introducing polymerizable alkenylmoieties at the surface of the fibers. The aim of this operation was to promotethe subsequent participation of these unsaturations in polymerizations involvingconventional monomers i.e., the in situ synthesis of a matrix bearing covalentlinks with the fibers. From the data of this report, the main information relevantto the present chapter is the fact that the γD
S of pristine material was slightly higherthan that measured after modification and that the acidic character of the initialfibers was reduced considerably.
SYMBOLS AND ABBREVIATIONS
Symbols
γDS dispersive component of the surface energy of solid surface.γD
L dispersive component of the surface energy of the probes in theliquid state.
AN acid or acceptor number of the probe molecules according toGutmann [43].
DN basic or donor number of the solid probe molecules (Gutmann [43]).ANs acid or acceptor number of the solid surface (Lara and
Schreiber [65]).DNs basic or donor number of the solid surface (Lara and Schreiber [65]).KA acid or acceptor number of the solid surface (St. Flour and Papirer
[68]).KB basic or donor number of the solid surface (St. Flour and Papirer
[68]).Ks surface partition coefficient.Ω acid–base interaction parameter according to Lara and Schreiber
[65].A interaction parameter between matrix and fibers (Schultz et al. [40–
42,103]).Isp interaction parameter between matrix and filler (Lara and Schreiber
[65]).t r net retention time of a given probe molecule.V 0
g specific retention volume of a given probe molecule.

IGC and Surface Properties of Fibers 117
Vn net retention volume of a given probe molecule.∆GA free energy of adsorption of a given probe molecule.∆G (CH2)
A free energy of adsorption of a methylene group.∆G sp
A specific (polar) free energy of adsorption of a given probe molecule.aCH2
surface area of a given probe molecule.aCH2 surface area of a methylene group∆HA free enthalpy of adsorption of a given probe molecule∆SA free entropy of adsorption of a given probe molecule
Abbreviations
AKD alkylketene dimerASA alkenylsuccinic anhydrideCMC carboxymethylcelluloseCTMP chemithermomechanical pulpDS degree of substitutionEDTA ethylenediaminetetraacetic acidEG-SiO2 ethylene glycol–modified silicon oxideFA furfuryl alcoholMMAc methyl methacrylic acidPAN polyacrylonitrilePBDM polybutane-1,4-diol dimethacrylateP(BDM-co-MA) BDM-co-maleic anhydride copolymerPE polyethylenePDFDMCS pentadecafluorodecylmethyldichlorosilanePEG polyethylene glycolPET polyethylene terephthalatePFR phenol-formaldehyde resinPFR-A low molecular weight PFRPFR-B high molecular weight PFRPMMA polymethyl methacrylatePNDM polyN-methyldiethanolamine dimethacrylatePOEDM poly(2,2′-oxybisethanol dimethacrylate)POT polyoctylthiophenePPDM polypentane-1,5-diol dimethacrylatePTEDM poly-2,2′-thiobisethanol dimethacrylateSBR styrene-butadiene copolymerTDFOMDS tridecafluorooctylmethyldichlorosilaneTMP thermomechanical pulpTMEDOMSI tetramethylethylenedioxydimethylsilaneTSPTS bis(3-triethoxysilylpropyl)tetrasulfane

118 Belgacem and Gandini
REFERENCES
1. W. J. Feast, H. S. Munro, and R. W. Richard, Polymer Surface and Interfaces,Vol. 2, John Wiley and Sons, Chichester, 1993.
2. F. Garbassi, M. Morra, and E. Occhiello, Polymer Surfaces, From Physics to Tech-nology, John Wiley and Sons, Chichester, 1994.
3. W. Neagle and D. R. Randell, Surface Analysis Techniques and Applications, RoyalSociety of Chemistry, U.M.I.S.T., Manchester, 1989.
4. D. Briggs, Polymer 25:1379 (1984).5. S. Brunauer, P. H. Emmet, and E. Teller, J. Amer. Chem. Soc. 60:309 (1938).6. M. E. Schrader and G. I. Loeb, Modern Approaches to Wettability: Theory and
Applications, Plenum Press, London, 1992.7. S. Wu, Polymer Interface and Adhesion, Marcel Dekker, New York, 1982.8. F. M. Fowkes, Adv. Chem. Ser. 43:99 (1964).9. C. J. Van Oss, in Ref 1. Chap. 11, pp. 267–290.
10. W. A. Zisman, Adv. Chem. Ser. 43:1 (1964).11. D. K. Owens and R. C. Wendt, J. Appl. Polym. Sci. 13:1741 (1969).12. J. M. Braun and J. E. Guillet, Adv. Polym. Sci. 21:108 (1976).13. D. G. Gray, Prog. Polym. Sci. 5:1 (1977).14. D. R. Lloyd, T. C. Ward and H. P. Schreiber, Inverse Gas Chromatography, ACS
Symp. Series No. 391, American Chemical Society, Washington, D.C., 1989.15. Z. Y. Al-Saigh, Polym. News 19:269 (1994).16. A. V. Kiselev, in Advances in Chromatography (J. C. Gidding and R. A. Keller,
eds.), Marcel Dekker, New York, 1967.17. O. Smidsrød and J. E. Guillet, Macromolecules 2:272 (1969).18. D. Patterson, Y. B. Tewari, H. P. Schreiber, and J. E. Guillet, Macromolecules 4:
356 (1971).19. W. R. Summers, Y. B. Tewari, and H. P. Schreiber, Macromolecules 5:12
(1972).20. H. P. Schreiber, Y. B. Tewari, and D. Patterson, J. Polym. Sci., Polym. Chem. Ed.
11:15 (1973).21. H. P. Schreiber and D. R. Lloyd, in Ref. 14, Chap. 1, pp. 1–10.22. A. E. Bolvari, T. C. Ward, P. A. Koning, and D. P. Sheehy, in Ref. 14, Chap. 2,
pp. 12–19.23. A. Voelkel, E. Andrzejewska, R. Maga, and M. Andrzejewski, Polymer 37:455
(1996) and 39:3499 (1998).24. G. M. Dorris and D. G. Gray, J. Colloid Interface Sci. 71:93 (1979).25. H. P. Schreiber, M. R. Wertheimer, and M. Lambla, J. Appl. Polym. Sci. 27:2269
(1982).26. A. Saada, E. Papirer, H. Balard, and B. Shiffert, J. Colloid Interface Sci. 175:212
(1995).27. C.-T. Chen and Z. Y. Al-Saigh, Macromolecules 22:2974 (1989).28. M. F. Grenier-Loustalot, Y. Barthomieu, and P. Grenier, Surf. Interface Anal. 14:
187 (1989).29. N. Cordeiro, C. Pascoal Neto, A. Gandini, and M. N. Belgacem, J. Colloid Interface
Sci. 174:246 (1995).

IGC and Surface Properties of Fibers 119
30. M. N. Belgacem, A. Blayo, and A. Gandini, J. Colloid Interface Sci. 182:431(1996).
31. N. Cordeiro, P. Aurenty, M. N. Belgacem, A. Gandini, and C. Pascoal Neto, J.Colloid Interface Sci. 187:498 (1997).
32. J. A. Trejo O’Reilly, J.-Y. Cavaillet M. N. Belgacem, and A. Gandini, J. Adhesion67:359 (1998).
33. P. H. Emmet and S. Brunauer, J. Am. Chem. Soc. 59:1553 (1937).34. G. Dorris and D. G. Gray, J. Chem. Soc., Faraday Trans. 177:413 (1981).35. G. Dorris and D. G. Gray, J. Chem. Soc., Faraday Trans. 1:77:725 (1981).36. T. L. Hill, J. Chem. Phys. 16:181 (1948).37. N. N. Avgul, G. I. Berezin, A. V. Kiselev, and I. A. Lygina, Izu. Akad. Nauk. SSSR,
Otd. Khi. Nauk 1021 (1957).38. A. L. McClellan and H. F. Harnsberger, J. Colloid Interface Sci. 23:577 (1967).39. L. R. Snyder, Principle of Adsorption Chromatography, Marcel Dekker, New York,
1968, pp. 194–195.40. J. Schultz, L. Lavielle, and C. Martin, J. Chimie Phys. 84:231 (1987).41. J. Schultz, L. Lavielle, and C. Martin, J. Adhesion 23:45 (1987).42. J. Schultz and L. Lavielle, in Ref. 9, Chap. 14, pp. 186–202.43. V. Gutmann, The Donor–Acceptor Approach to Molecular Interactions, Plenum
Press, New York, 1978.44. F. L. Riddle and F. M. Fowkes, J. A. Chem. Soc. 112:3259 (1990).45. K. L. Mittal and H. R. Anderson, Acid–Base Interactions: Relevance to Adhesion
Science and Technology, VSP, Utrecht, The Netherlands, 1991.46. F. M. Fowkes, in Ref. 45, pp. 93–115.47. Y. M. Boluk and H. P. Schreiber, Polym. Comp. 7:295 (1986).48. A. C. Tiburcio and J. A. Manson, J. Appl. Polym. Sci. 42:427 (1991).49. R. S. Drago, G. G. Vogel, and T. E. Needham, J Am. Chem. Soc. 93:6014
(1971).50. J. R. Conder, S. McHale, and M. A. Jones, Anal. Chem. 58:2663 (1989).51. J. R. Conder and C. L. Young, Physicochemical Measurements in Gas Chromatog-
raphy, John Wiley and Sons, New York, 1979.52. D. P. Kamdem and B. Riedl, J. Colloid Interface Sci. 150:507 (1992).53. J. E. Lipson and J. E. Guillet, in Development in Polymer Characterization (J. V.
Dawkins, ed.), 3rd ed. Vol. 3, Chap. 2, Applied Science, New York, 1982, pp. 33–74.
54. A. T. James and A. J. P. Martin, Biochem. J. 50:679 (1952).55. F. M. Fowkes, Ind. Eng. Chem. 56:40 (1964).56. F. M. Fowkes, J. Phys. Chem. 6:382 (1982).57. G. M. Dorris and D. G. Gray, J. Colloid Interface Sci. 77:353 (1980).58. L. A. Girifalco and R. J. Good, J. Phys. Chem. 61:904 (1957).59. R. J. Aveyard, J. Colloid Interface Sci. 52:621 (1975).60. C. Kemball and E. K. Rideal, Proc. Roy. Soc. A 187:53 (1946).61. J. H. De Boer and S. Kruyer, Proc. K. Ned. Akad. Wet. B 55:451 (1952).62. A. J. Groszek, Proc. Roy. Soc. A 314:473 (1970).63. H. J. Clint, Trans. Faraday Soc. 68:2239 (1972).64. A. J. Vukov and D. G. Gray, Langmuir 4:743 (1988).
120 Belgacem and Gandini
65. J. Lara and H. P. Schreiber, J. Coating Technol. 63:81 (1991).66. M. N. Belgacem, G. Czeremuszkin, S. Sapieha, and A. Gandini, Cellulose 2:145
(1996).67. E. Papirer, J. M. Perrin, B. Siffert, and G. Philipponeau, J. Colloid Interface Sci.
144:263 (1991).68. C. Saint-Flour and E. Papirer, Ind. Eng. Chem. Prod. Res. Dev. 21:666 (1982).69. C. Saint-Flour and E. Papirer, J. Colloid Interface Sci. 91:69 (1983).70. A. Vidal, W. Wang, and J. B. Donnet, Kautschuk Gummi Kunststoffe 46:770 (1993).71. A. C. Tiburcio, Polym. Ma. Sci. Eng., 70, 462 (1993).72. D. R. Little (ed.), CRC Handbook of Chemistry and Physics, 76th ed., CRC Press,
Boca Raton, 1995.73. W. J. Moore, Physical Chemistry, 4th ed., Printice-Hall, Englewood Cliffs, NJ,
1972, p. 213.74. L. Riedel, Chem. Ing. Tech. 26:679 (1954).75. C. Y. Kim, G. Surani, and D. A. I. Goring, J. Polym. Sci., Part C 30:533 (1992).76. M. N. Belgacem, P. Bataille, and S. Sapieha, J. Appl. Polym. Sci. 53:379 (1994).77. X. Tu, A. Young, and F. Denes, Cellulose 1:87 (1994).78. J. M. Felix and P. Gatenholm, J. Appl. Polym. Sci. 42:609 (1991).79. R. G. Raj and B. V. Kokta, in Viscoelasticity of Biomaterials (W. Glasser and
H. Hatakeyama, eds.), ACS Symp. Series No. 489, American Chemical Society,Washington, D.C., 1992, pp. 99–117.
80. H. L. Lee and P. Luner, Nordic Pulp Paper Res. J. 9:164 (1989).81. H. L. Lee and P. Luner, J. Wood Chem. Technol. 13:127 (1993).82. G. Garnier and W. G. Glasser, Polym. Mat. Sci. Eng. 70:507 (1993).83. G. Garnier and W. G. Glasser, J. Adhesion 46:165 (1994).84. G. Garnier and W. G. Glasser, Proc. International Symposium on the Interface,
16th Annual Meeting of the Adhesion Society, Williamsburg, VA, February 21–26, 1993, pp. 135–137.
85. G. Garnier and W. G. Glasser, Polym. Eng. Sci. 36:885 (1996).86. J. Brandrup and E. H. Immergut, Polymer Handbook, 3rd ed., John Wiley and Sons,
New York, 1989.87. T. D. Ignatova, V. V. Gorichko, L. A. Kaptioukh, A. L. Komarovski, and A. E.
Hesterov, Sb. Nauch. Trud. Ukr. Bum. Prom. 99 (1988).88. J. Borch, Proc. Papermaking 10th. Fund. Res. Symp., Oxford, UK, September 20–
24, 1993, pp. 209–236.89. N. Gurnagul and D. G. Gray, Can. J. Chem. 65:1935 (1987).90. D. P. Kamdem and B. Riedl, Colloid Polym. Sci. 269:595 (1991).91. D. P. Kamdem and B. Riedl, J. Wood Chem. Technol. 11:57 (1991).92. B. Riedl and D. P. Kamdem, J. Adhesion Sci. Technol. 6:1053 (1992).93. D. P. Kamdem, S. K. Bose, and P. Luner, Langmuir 9:3039 (1993).94. J. M. Felix and P. Gatenholm, Nordic Pulp and Paper Res. J. 8:200 (1993).95. J. M. Felix, P. Gatenholm, and H. P. Schreiber, J. Appl. Polym. Sci. 51:285
(1994).96. P. N. Jacob and J. C. Berg, Langmuir 10:3086 (1994).97. H. Chtourou, B. Riedl, and V. K. Kokta, J. Adhesion Sci. Technol. 9:551 (1995).98. A. Lundqvist, L. Odberg, and J. C. Berg, Tappi J. 78:139 (1995).
IGC and Surface Properties of Fibers 121
99. P. N. Jacob and J. C. Berg, J. Adhesion 54:115 (1995).100. J. Simonsen, Z. Hong, and T. G. Rials, Wood Fiber Sci. 29:75 (1997).101. A. J. Vukov and D. G. Gray, Proc. 4th Int. Carbon Conf., Baden-Baden, 1986,
pp. 394–396.102. A. J. Vukov and D. G. Gray, in Ref. 14, Chap. 13, pp. 168–184.103. J. Schultz, L. Lavielle, and C. Martin, Proc. 10th Annual Meeting of the Adhesion
Society, Williamsburg, VA, February 22–27, 1987, pp. 513–528.104. A. E. Bolvari and T. C. Ward, Polym. Mat. Sci. Eng. 58:655 (1988).105. A. E. Bolvari and T. C. Ward, in Ref. 14, Chap. 16, pp. 217–229.106. S. P. Wilkinson and T. C. Ward, Proc. 35th International SAMPE Symposium,
April 2–5, 1990, pp. 1180–1192.107. S. Dong, M. Brendle, and J. B. Donnet, Chromatographia 28:469 (1989).108. M. Nardin, H. Balard, and E. Papirer, Carbon 28:43 (1990).109. L. Lavielle and J. Schultz, Langmuir 7:978 (1991).110. J.-B. Donnet and S.-J. Park, Carbon 29:955 (1991).111. R.-Y. Qin and J.-B. Donnet, Carbon 32:165 (1994).112. K. Tsutsumi and K. Ban, Surf. Sci. Catal., 80:679 (1993).113. H.-J. Jacobasch, K. Grundke, P. Uhlmann, F. Simon, and E. Mader, Composite
Interfaces 3, 293 (1996).114. S.-J. Park and M. Brendle, J. Colloid Interface Sci. 188:336 (1997).115. E. P. Plueddemann, Silane Coupling Agents, Plenum Press, New York, 1982.116. E. Papirer, in Composite Interface (H. Ishida and J. L. Koening, eds.), Elsevier,
New York, 1986.117. E. Papirer, H. Balard and A. Vidal, Eur. Polym. J. 24:783 (1988).118. E. Papirer and H. Balard, in Ref. 44, pp. 191–205.119. K. Tsutsumi and T. Oshuga, Colloid Polym. Sci. 268:38 (1990).120. P. J. C. Chappell and D. R. Williams, ICCM/ECCM Conference, Elsevier, London,
July 1987, pp. 346–355.121. B. J. Briscoe, S. Roach and D. R. Williams, in Interfacial Phenomena in Composite
Materials (F. Jones, ed.), Butterworth, Guilford Press 1989, pp. 132–137.122. P. J. C. Chappell and D. R. Williams, J. Colloid Interface Sci. 128:336 (1989).123. P. J. C. Chappell and D. R. Williams, J. Adhesion Sci. Technol. 4:7 (1990).124. D. R. Williams, in Controlled Interface Composite Materials (H. Ishida, ed.), Elsev-
ier, New York, 1990, pp. 219–232.125. M. L. Tate, Y. K. Kamath, S. P. Wesson, and S. B. Ruetsch, J. Colloid Interface
Sci. 177: 579 (1996).126. J. Anhang and D. G. Gray, J. Appl. Polym. Sci. 27: 71 (1982).127. J. Anhang and D. G. Gray, Physico-chemical Aspects of Polymer Surfaces, Proc.
Int. Symp., 1983, pp. 659–667.128. Y. Yang and T. C. Ward, Polym. Mater. Sci. Eng. 58:237 (1988).129. H. Chtourou, B. Riedl, and B. V. Kokta, Polym. Mater. Sci. Eng. 70:509 (1990).130. S. Katz and D. G. Gray, J. Colloid Interface Sci. 82:318 (1981).131. S. L. Gregg and K. S. W. Sing, Adsorption Surface Area and Porosity, Academic
Press, London, 1982.132. J. B. Donnet, S. J. Park, and H. Balard, Chromatographia 31:434 (1991).133. E. Papirer, S. Li, H. Balard, and J. Jagiello, Carbon 29:1135 (1991).

122 Belgacem and Gandini
134. J. Jagiello, T. J. Bandosz, and J. A. Schwarz, Chromatographia 33:441 (1992).135. J. Jagiello, T. J. Bandosz, and J. A. Schwarz, Carbon 30:63 (1992).136. J. B. Donnet, S. J. Park, and M. Brendle, Carbon 30:263 (1992).137. J. B. Donnet and C. M. Lansinger, Kautsch. Gummi, Kunstst. 45:459 (1992).138. H. Balard, W. D. Wang, and E. Papirer, Polym. Mater. Sci. Eng. 70:468 (1993).139. M.-J. Wang and S. Wolff, Rubber Chem. Technol. 64:714 (1991).140. J. B. Donnet, W. Wang, A. Vidal, and M. J. Wang, Kautsch. Gummi, Kunstst. 46:
866 (1993).141. W. Wang, A. Vidal, J. B. Donnet, and M. J. Wang, Kautsch. Gummi, Kunstst. 46:
933 (1993).142. W.-D. Wang, B. Haidar, A. Vidal, and J. B. Donnet, Kautsch. Gummi, Kunstst.
47:238 (1994).143. W.-D. Wang, A. Vidal, G. Nanse, and J. B. Donnet, Kautsch. Gummi, Kunstst. 47:
493 (1994).144. S. Asai, K. Sakata, M. Sumita, K. Miyasaka, and A. Sawatari, Nippon Kagaku
Kaishi 12:1672 (1991).145. M.-J. Wang and S. Wolff, Rubber Chem. Technol. 65:890 (1992).146. F. J. Lopez-Garzon, M. Pyda, and M. Domingo-Garcia, Langmuir 9:531 (1993).147. M. M. Chehimi, E. Pigois-Landureau, and M. Delamar, J. Chim. Phys. 89:1173
(1992).148. M. M. Chehimi and E. Pigois-Landureau, J. Mat. Chem. 4:741 (1994).149. M. M. Chehimi, S. Lascelles, and P. Armes, Chromatographia 41:671 (1995).150. M. M. Chehimi, M. L. Abel, and Z. Sahraoui, J. Adhesion Sci. Technol. 10:287
(1996).151. M. M. Chehimi, M. L. Abel, M. Delamar, J. F. Watts, and P. A. Zhdan, AIP Confer-
ence Proceedings 354:351 American Institute of Physics (1996).152. G. Kraus, Reinforcement of Elastomers, Interscience, New York, 1965.153. K. K. Unger, Porous Silicas, Elsevier, New York, 1979.154. R. K. Iler, The Chemistry of Silica, John Wiley and Sons, New York, 1979.155. C. R. Hegedus and I. L. Kamel, J. Coating Technol. 820:23 (1993).156. C. R. Hegedus and I. L. Kamel, J. Coating Technol. 820:31 (1993).157. H. Balard and E. Papirer, Proc. Organic Coatings Science and Technology, 18th
International Conference, Athens, Greece, July 1992, pp. 13–32.158. H. Balard and E. Papirer, Prog. Org. Coatings 22:1 (1993).159. E. Papirer, P. Roland, M. Nardin, and H. Balard, J. Colloid Interface Sci. 113:62
(1986).160. A. Vidal, E. Papirer, M. J. Wang, and J. B. Donnet, Chromatographia 23:121
(1987).161. E. Papirer, H. Balard, Y. Rahmani, A. P. Legrand, L. Faccini, and H. Hommel,
Chromatographia 23:639 (1987).162. H. Balard, M. Sidqi, E. Papirer, J. B. Donnet, A. Tual, H. Hommel, and A. P.
Legrand, Chromatographia 25:707 (1988).163. H. Balard, M. Sidqi, E. Papirer, J. B. Donnet, A. Tual, H. Hommel, and A. P.
Legrand, Chromatographia 25:712 (1988).164. M. Sidqi, H. Balard, E. Papirer, A. Tual, H. Hommel, and A. P. Legrand, Chromato-
graphia 27:311 (1989).

IGC and Surface Properties of Fibers 123
165. G. Linger, A. Vidal, H. Balard, and E. Papirer, J. Colloid Interface Sci. 133:200(1989).
166. G. Linger, A. Vidal, H. Balard, and E. Papirer, J. Colloid Interface Sci. 134:486(1990).
167. E. Papirer, G. Linger, H. Balard, A. Vidal, and F. Mauss, in Chemically ModifiedOxide Surfaces (D. E. Leyden and W. T. Collins, eds.), Gordon and Breach, NewYork, 1990, pp. 15–26.
168. F. Joachim, A. Vidal, and E. Papirer, in Chemically Modified Oxide Surfaces(D. E. Leyden and W. T. Collins, eds.), Gordon and Breach, New York, 1990, pp.361–373.
169. E. Papirer, J. M. Perrin, B. Siffert, and G. Philipponneau, Prog. Colloid Polym.Sci. 84:257 (1991).
170. J. Kuczynski and E. Papirer, Eur. Polym. J. 27:653 (1991).171. E. Papirer, H. Balard, and M. Sidqi, J. Colloid Interface Sci. 159:238 (1993).172. E. Papirer, H. Balard, J. Jagiello, R. Baeza, and F. Clauss, in Chemically Modified
Surfaces (H. A. Mottola and J. R. Steinmetz, eds.), Elsevier, New York, 1992, pp.351–368.
173. E. Papirer, J. M. Perrin, B. Siffert, G. Philipponneau, and J. M. Lamerant, J. ColloidInterface Sci. 156:104 (1993).
174. H. Balard, D. Yeates, E. Papirer, M. Gastiger, P. Bouard, F. Clauss, and R. Baeza,Proc. Mineral and Organic Functional Fillers in Polymers: International Sympo-sium, Namur, Belgium, April 13–16, 1993.
175. H. Hadjar, H. Balard, and E. Papirer, Colloid Surfaces A99:45 (1995).176. H. Balard, A. Saada, J. Hartmann, O. Aoudj, and E. Papirer, Makromol. Chem.,
Macromol. Symp. 108:63 (1996).177. H. Balard, O. Aouadj, and E. Papirer, Langmuir 13:1251 (1997).178. J. L. Oteo, J. Rubio, J. Tartaj, J. F. Fernandez, and C. Moure, Bol. Soc. Esp. Ceram.
Vidrio 30:458 (1991).179. A. Voelkel, Crit. Rev. Anal. Chem. 22:411 (1991).180. Cr. Contescu, J. Jagiello, and J. A. Schwarz, J. Catalysis 131:433 (1991).181. T. J. Bandoz, J. Jagiello, B. Andersen, and J. A. Schwarz, Clays and Clay Minerals
40:306 (1992).182. T. J. Bandoz, K. Putyera, J. Jagiello, and J. A. Schwarz, Microporous Materials
1:73 (1993).183. F. Bosse, A. Eisenberg, Z. Deng, and H. P. Schreiber, J. Adhesion Sci. Technol.
7:1139 (1993).184. M. A. Zumbrum, Polym. Mater. Sci. Eng. 70:500 (1993).185. M. A. Zumbrum, Proc. International Symposium on the Interface, 16th Annual
Meeting of the Adhesion Society, Williamsburg, VA, February 21–26, 1993, p. 140.186. M. A. Zumbrum, J. Adhesion 46:181 (1994).187. H. Ping, W. Y. Fu, and Y. Fushan, J. Liaoning Normal Univ. 18:312 (1995).188. M. Fafard, M. El-Kindi, and H. P. Schreiber, J. Adhesion Sci. Technol. 7:1139
(1993).189. A. B. Scholten, H. G. Janssen, J. W. de Haan, and C. A. Cramers, J. High Res.
Chromatogr. 17:77 (1994).190. W. Wasiak, A. Voelkel, and I. Rykowska, J. Chromatography A690:83 (1995).

124 Belgacem and Gandini
191. G. Liu and Z. Xin, Chromatographia 42:290 (1996).192. H. P. Schreiber and F. St. Germain, J. Adhesion sci. Technol. 4:319 (1990).193. H. P. Schreiber and F. St. Germain, in Acid–Base Interactions: Relevance to Adhe-
sion Science and Technology, VSP, Utrecht, The Netherlands, 1991, pp. 273–285.194. J. H. Burness and J. G. Dillard, Langmuir 10:1713 (1991).195. J. H. Burness and J. G. Dillard, Langmuir 10:1894 (1994).196. J. P. Casey, Pulp and Paper, Chemistry and Chemical Technology, 3rd ed., Vol.
4, Wiley-Interscience, New York, 1983.197. D. H. Solomon and D. G. Hawthorne, Chemistry of Pigments and Fillers, John
Wiley and Sons, New York, 1983.198. H. S. Katz and J. V. Milewski, Handbook of Fillers and Reinforcement for Plastics,
Van Nostrand-Reinhold, New York, 1978.199. E. Papirer, J. Schultz and C. Turchi, Eur. Polym. J. 20:1155 (1984).200. P. Schmitt, E. Koerper, J. Schultz, and E. Papirer, Chromatographia 25:786 (1988).201. D. S. Keller and P. Luner, Tappi Proceedings, Coating Conferences, 1992,
pp. 349–359.202. M. Pyda, M. Sidqi, D. S. Keller, and P. Luner, Tappi J. 76:79 (1993).203. A. Lundqvist and L. Odberg, Pol. International Paper and Coating Chemistry Sym-
posium, 1996, pp. 29–34.204. Z. Fu and S. Wei, Guisuayan Xyebao 17:308 (1989).205. R. H. Leach and R. J. Pierce, The Printing Ink Manual, 5th ed., Blueprint, London,
1993.206. J. W. Dove, G. Buckton, and C. Doherty, Int. J. Pharmaceut. 138:199 (1996).207. M. D. Ticehurst, P. York, R. C. Rowe, and S. K. Dwivedi, Int. J. Pharamaceut.
141:93 (1996).208. E. Papirer, H. Balard, E. Brendle, and J. Lignieres, J. Adhesion Sci. Technol. 10:
1401 (1996).209. M. D. Ticehurst, R. C. Rowe, and P. York, Int. J. Pharamaceut. 111:241 (1994).210. L. C. Matveivich, R. Z. Bakhtisina, F. Kh. Koudacheeva, and G. A. Berg, Khim.
Tverd. Topl. 2:95 (1989).211. E. Osmont and H. P. Schreiber, Polym. Mat. Sci. Eng. 58, 730 (1988).212. H. P. Schreiber, M. R. Wertheimer, and M. Lambla, J. Appl. Polym. Sci. 17:2269
(1982).213. H. P. Schreiber, C. Richard, and M. R. Wertheimer, in Physico-Chemical Aspects
of Polymer Surfaces, Vol. 2 (Mittal ed.), Plenum Press, New York, 1983, pp. 739–748.
214. C. Richard, K. Hing, and H. P. Schreiber, Polym. Composites 6:201 (1985).215. A. Lundqvist and L. Odberg, in The Fundamentals of Papermaking Materials
(C. F. Baker ed.), Vol. 2, Pira International, Surrey, UK, 1997, pp. 751–769.216. L. Boras and P. Gatenholm, Nordic Pulp Paper Res. J., 12:220 (1997).217. V. Botaro and A. Gandini, Cellulose 5:65 (1998).

3Interactions in Cellulose-PolyethylenePapers as Obtained Through InverseGas ChromatographyBERNARD RIEDL and HALIM CHTOUROU* Department of WoodScience, CERSIM, Laval University, Quebec City, Quebec, Canada
I. Introduction 126
II. Literature Review 126A. Early work 126B. Dispersive interactions 127C. Acid–base interactions 127D. Results on fiber, especially cellulose-based fiber 128
III. Theory and Fundamentals 128A. Inverse gas chromatography 128B. Contact angle measurements 131
IV. Experimental 131A. IGC measurement details 131B. Contact angle measurements 132C. Materials 132
V. Results and Discussion 133A. IGC 133B. Dispersive component 133C. Donor–acceptor component 135
* Current affiliation: Retec Inc., Granby, Quebec, Canada.
125

126 Riedl and Chtourou
D. Comparison with wetting characteristics 138E. Correlation with paper physical characteristics 139
VI. Conclusion 140
Symbols and Acronyms 141
References 142
I. INTRODUCTION
In chromatography, one is concerned with the eluting or mobile phase, whichcontains the substance to be analyzed. It is also possible to characterize the non-mobile phase, using the mobile phase and molecular probes it carries; thus thename inverse gas chromatography (IGC). Variation in surface chemistry of thenonmobile phase will change the elution characteristics of the probes. IGC canbe used to measure dispersive and acceptor–donor interactions on surfaces, withsubsequent correlation with adhesion between surfaces, as obtained through me-chanical properties of composites. It is particularly suited to fibrous or powderysubstrates, which may be difficult to characterize by other surface characteriza-tion techniques such as contact angle measurements, because of a rough surfacebut also due to wicking phenomena. The temperature variable is easy to vary inIGC and thus enthalpies of adsorption and related parameters are not difficult toobtain.
In this chapter, we will illustrate how it is possible to compare dispersive andacid–base contributions to adhesion in various lignocellulosic (LG) and polyeth-ylene (PE) fibers, both virgin and chemically modified, as well as in compositepapers. These interactions are measured by IGC.
II. LITERATURE REVIEW
A. Early Work
We will not try to encompass all previous work on IGC. There are several goodreviews on the subject [1–4]. We will limit ourselves to measurements done atinfinite dilution of the molecular probes although it is possible to do measure-ments at finite dilution.
Guillet [1] was among the first to use gas chromatography to detect the glasstransition in polymers. Olabisi [5] applied IGC to the study of polymer–polymerinteractions as had done Patterson and coworkers [6]. In these studies, the poly-

Cellulose-Polyethylene Papers and IGC 127
mer or blend is coated on a so-called inert support. Munk [7] did extensive studieson whether the support, probes, and general technique did influence results. Instudies of polymer blends, the elution behavior of volatile organic compounds,called ‘‘molecular probes’’ and injected in very small quantities in the carriergas stream, is determined for the two or more pure polymers and compared tothat of the polymer blend. If the retention time of a probe is less than the linearcombination of retention times for the respective pure polymers, with respect tovolume ratio, then there is a negative or favorable interaction between the poly-mers. An excess retention can thus be interpreted in terms of interpolymer interac-tions.
B. Dispersive Interactions
Generally interactions between surfaces are either of the dispersive (also calledLifshitz–van der Waals, or nonpolar) type and polar (or acid–base, or acceptor–donor). Some authors differentiate polar and donor–acceptor interactions. How-ever, Fowkes [8] showed that polar interactions are small or nil compared todonor–acceptor interactions.
C. Acid–Base Interactions
Donor–acceptor interactions in IGC are obtained by subtracting the dispersiveinteraction from the total interaction. The dispersive component is obtained withn-alkanes. For instance, the dispersive component of the heat of adsorption ona substrate is obtained from the temperature dependence of the elution volumesof a series of alkanes. These values are subtracted from the heats of adsorptionof different polar probes with different acceptor, donor, or amphoteric properties.What remains is deemed only to be due to donor–acceptor interactions betweenthe polar probes and the polar surface. Volumes of retention for a series of polarprobes on PE fiber follow a regular progression with increasing size of the n-alkane probe. It was observed that polar probes were only retained as to theproportion of the dispersive component of their surface tension [9,10]. On polarsurfaces, probes with donor characteristics are retained more on surfaces withacceptor surface properties and vice versa. The donor–acceptor characteristicsof the probes are known, whereas those of the surface are not. There are severalscales or ways of classifying the donor–acceptor numbers of probes. Drago [11]and Gutmann [12] defined scales for such use. Furthermore, donor and acceptorcharacteristics of the substrate surface can be obtained from a correlation of thepolar probe retention characteristics and their donor–acceptor number. Thus thetrue surface properties of the surface of the substrate can be related to surfaceadhesion–enhancing treatments and adhesion with other substrates [2].

128 Riedl and Chtourou
D. Results on Fiber, Especially Cellulose-Based Fiber
Fiber or fiber mixture is a bit of an ideal system for performance of IGC, com-pared to thermoplastic composites or blends where one has partial interpenetra-tion of surfaces. In fibrous mixtures, surfaces remain neat and separate. Also,performing contact angles studies on fibers and papers is difficult because ofirregular surface, small substrate size for fibers, and wicking phenomena. IGCdoes not suffer from those limitations. Fiber, chemically modified or not, ispacked into a column and times of retention of various probes are studied, as forany other polymeric substrate. There are several instances in the literature of IGCstudies on paper fiber, especially in terms of the dispersive components [13–15].
Lundqvist et al. [16] showed that the surface properties of various bleachedpulp fiber could be broken down in dispersive and donor–acceptor contributions.The dispersive component was found to be approximately 45–48 mJ/m2 and thepaper had an acid surface. Birch wood meal has a predominantly acid (acceptor)surface but does have basic sites. The acceptor number (KA) was 4.40 and thedonor number (KB) 3.00 [17]. Other work will be mentionned in the discussionsection.
III. THEORY AND FUNDAMENTALS
A. Inverse Gas Chromatography
In this technique a small amount of a gas, referred to as a (molecular) probe, isinjected into a column packed with the substrate of interest, called the nonmobilephase, while an inert carrier gas sweeps away the probe. A long retention timeindicates that the probe is in strong interaction with the nonmobile phase, whereasa short retention time indicates low interaction. In general, retention time in-creases with probe and nonmobile phase polarities. It is supposed that probe vapormolecules interact with the nonmobile phase surface winhout interacting withother probe molecules, thus the term ‘‘infinite dilution.’’ To ensure flash vapor-ization, the temperature of the injection ports of the chromatograph is around300°C, which is 50°C above the boiling point of the probes used. The probesused to evaluate the dispersive component of the surface energy of the stationaryphases are n-alkanes ranging from n-hexane to n-decane, whereas a series ofpolar probes are used to evaluate donor–acceptor interactions.
Calculations are as follows [2]: By assuming that the retention mechanism isonly due to surface adsorption, the net retention volume, VN, the fundamentalvariable in IGC, which is the volume of the carrier gas required to elute the probefrom the column, is given by:
VN KsA Q(tr tm) (1)
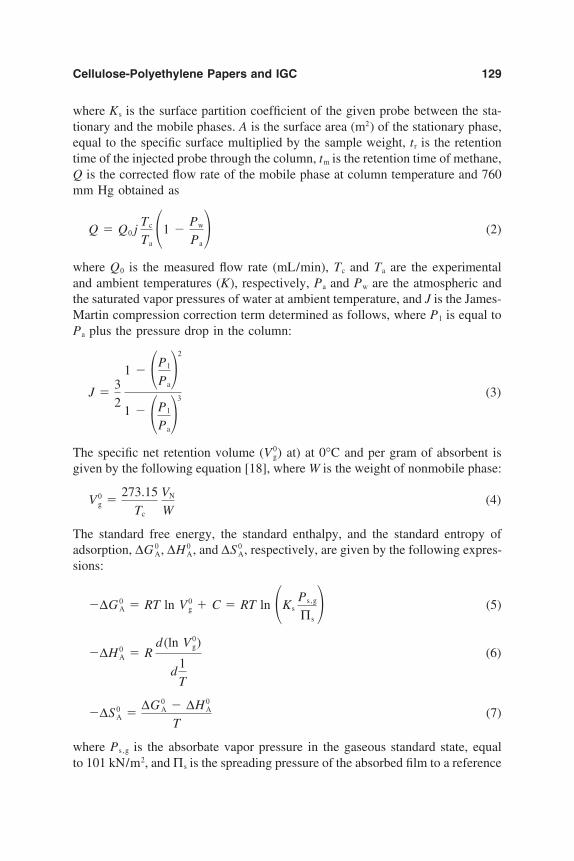
Cellulose-Polyethylene Papers and IGC 129
where Ks is the surface partition coefficient of the given probe between the sta-tionary and the mobile phases. A is the surface area (m2) of the stationary phase,equal to the specific surface multiplied by the sample weight, tr is the retentiontime of the injected probe through the column, tm is the retention time of methane,Q is the corrected flow rate of the mobile phase at column temperature and 760mm Hg obtained as
Q Q0 jTc
Ta1
Pw
Pa (2)
where Q0 is the measured flow rate (mL/min), Tc and Ta are the experimentaland ambient temperatures (K), respectively, Pa and Pw are the atmospheric andthe saturated vapor pressures of water at ambient temperature, and J is the James-Martin compression correction term determined as follows, where P1 is equal toPa plus the pressure drop in the column:
J 32
1 P1
Pa
2
1 P1
Pa
3(3)
The specific net retention volume (V 0g) at) at 0°C and per gram of absorbent is
given by the following equation [18], where W is the weight of nonmobile phase:
V 0g
273.15Tc
VN
W(4)
The standard free energy, the standard enthalpy, and the standard entropy ofadsorption, ∆G 0
A, ∆H 0A, and ∆S 0
A, respectively, are given by the following expres-sions:
∆G 0A RT ln V 0
g C RT ln KsPs ,g
Πs (5)
∆H 0A R
d (ln V 0g)
d1T
(6)
∆S 0A
∆G 0A ∆H 0
A
T(7)
where Ps ,g is the absorbate vapor pressure in the gaseous standard state, equalto 101 kN/m2, andΠs is the spreading pressure of the absorbed film to a reference

130 Riedl and Chtourou
gas phase state defined by the pressure Ps ,g of the solute, equal to 0.338 mN/m[19].
A linear variation of ∆G 0A (or RT ln VN) as a function of the number of
carbon atoms in the nonpolar probes (n-alkanes) is a common observation. Thefree energy of adsorption corresponding to one methylene group,∆G 0
A(CH2), was obtained through the injection of a homologous series ofn-alkane probes:
∆G 0A(CH2) RT ln
VN(Cn1H2n4)VN(CnHn2)
(8)
The London dispersive component (γDS ) of the surface energy of the stationary
phase is calculated by the following equation [20]:
γDS
14∆G 0
A(CH2)2
γ(CH2)N 2a2(9)
where N is Avogadro’s number, a is the area of an absorbed methylene group,and γ(CH2) is the surface energy of pure methylene group surface [20], γ(CH2) 35.6 0.058 (293 T), in mJ/m2.
St. Flour and Papirer [21] found that linearity is usually obtained when plottingRT ln(VN) as a function of ln (P0) in the case of n-alkane probes. In addition,Schultz et al. [22] found a linear relation by plotting RT ln(VN) as a function ofa(γD
L )1/2, where a is the surface area of the probe and γDL is its dispersive component
of surface energy in the liquid state. These correlations are observed because n-alkanes at infinite dilution behave nearly as ideal gases.
To determine the contribution of the surface specific interactions to the totalsurface energy it is necessary to inject polar probes in the column, in additionto n-alkanes. By assuming that alkanes are involved in only dispersive interac-tions and also assuming that dispersive and polar components of surface energyare additive, the alkane line may be taken as a reference for the determinationof the dispersive component for the polar probes. The difference of ordinatesbetween the alkane straight line and the polar probe gives ∆G SP
A or ∆H SPA , corre-
sponding to the specific interaction.As noted by Fowkes, the specific interactions are all acid–base. Schultz et al.
[22] characterized solid surfaces by an acidic constant KA and a basic constant KB,using Gutmann’s [12] acid–base concepts, and proposed the following equation:
∆H SPA KADN KBAN (10)
where ∆H SPA is the enthalpy of adsorption component corresponding to specific
interactions KA and KB, which are, respectively, equivalent to a AN (acceptor oracid number) and DN (donor or basic number) of molecules at the surface of thenonmobile phase, in this case paper. According to Lewis, an acid is an electron

Cellulose-Polyethylene Papers and IGC 131
acceptor and a base an electron donor. The DN expressed in kilojoules per moleis the molar enthalpy of interaction between a base and a reference acceptorSbCl5, in a dilute solution of 1,2-dichloroethane. Unlike the DN, the AN is inarbitrary units set at zero for the NMR shift induced by hexane and at 100 forSbCl3 in dilute solutions of 1,2-dichloroethane [12]. ∆H SP
A is obtained from asubtraction of the dispersive contribution of the probe from the overall heat ofadsorption.
Once the donor and acceptor numbers have been determined for each fiberfrom Eq. (10), a specific interaction parameter can be obtained for the mixtureof two fibers in equal proportions as:
I SP KPEA K Lig
B K PEB KLig
A (11)
Note that there is something missing in this last equation: If a fiber has bothacceptor and donor sites, there can be interaction between these, and it will con-tribute to the strength of the paper.
A linear combination of these can be done according to concentration, as de-tailed in Refs. 10 and 23:
I SP [2P 2PE K PE
A K PEB ] [2PPEPlig(PPE
A K LigB K PE
B KLigA )] [2P 2
ligK ligA K Lig
B ] (12)
where P refers to the concentration of each fiber. Thus the first term representsthe contribution of contacts between PE fibers, the second term represents thecontribution of the PE/LG contacts, i.e., unlike fibers, and the last term representsthe contribution of contacts between LG fibers.
B. Contact Angle Measurements
Contact angle measurements can be made indirectly by the Wilhelmy balancetechnique. Fiber, as such or as paper, is immersed in a probe liquid where theforce F, less the buoyancy, exerted on the sample is:
F Lγw cos θ (13)
where L is the perimeter of the sample, γw the surface tension of the probe liquid,and θ the contact angle of the solvent or probe liquid with the paper sample. Inthe case of n-hexane as probe liquid, the angle is essentially zero and the we canobtain the perimeter of the sample from Eq. (13).
IV. EXPERIMENTAL
A. IGC Measurement Details
The chromatographic measurements were carried out at infinite dilution with aHewlett-Packard 5700A apparatus equipped with dual flame ionization detectorsmaintained at 300°C. A 1-µl microsyringe is filled repeatedly with probe vapor
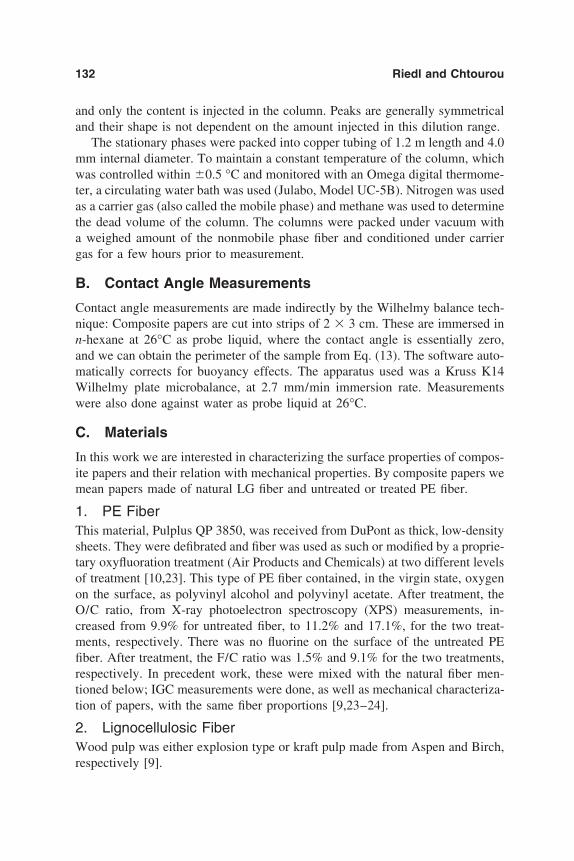
132 Riedl and Chtourou
and only the content is injected in the column. Peaks are generally symmetricaland their shape is not dependent on the amount injected in this dilution range.
The stationary phases were packed into copper tubing of 1.2 m length and 4.0mm internal diameter. To maintain a constant temperature of the column, whichwas controlled within 0.5 °C and monitored with an Omega digital thermome-ter, a circulating water bath was used (Julabo, Model UC-5B). Nitrogen was usedas a carrier gas (also called the mobile phase) and methane was used to determinethe dead volume of the column. The columns were packed under vacuum witha weighed amount of the nonmobile phase fiber and conditioned under carriergas for a few hours prior to measurement.
B. Contact Angle Measurements
Contact angle measurements are made indirectly by the Wilhelmy balance tech-nique: Composite papers are cut into strips of 2 3 cm. These are immersed inn-hexane at 26°C as probe liquid, where the contact angle is essentially zero,and we can obtain the perimeter of the sample from Eq. (13). The software auto-matically corrects for buoyancy effects. The apparatus used was a Kruss K14Wilhelmy plate microbalance, at 2.7 mm/min immersion rate. Measurementswere also done against water as probe liquid at 26°C.
C. Materials
In this work we are interested in characterizing the surface properties of compos-ite papers and their relation with mechanical properties. By composite papers wemean papers made of natural LG fiber and untreated or treated PE fiber.
1. PE FiberThis material, Pulplus QP 3850, was received from DuPont as thick, low-densitysheets. They were defibrated and fiber was used as such or modified by a proprie-tary oxyfluoration treatment (Air Products and Chemicals) at two different levelsof treatment [10,23]. This type of PE fiber contained, in the virgin state, oxygenon the surface, as polyvinyl alcohol and polyvinyl acetate. After treatment, theO/C ratio, from X-ray photoelectron spectroscopy (XPS) measurements, in-creased from 9.9% for untreated fiber, to 11.2% and 17.1%, for the two treat-ments, respectively. There was no fluorine on the surface of the untreated PEfiber. After treatment, the F/C ratio was 1.5% and 9.1% for the two treatments,respectively. In precedent work, these were mixed with the natural fiber men-tioned below; IGC measurements were done, as well as mechanical characteriza-tion of papers, with the same fiber proportions [9,23–24].
2. Lignocellulosic FiberWood pulp was either explosion type or kraft pulp made from Aspen and Birch,respectively [9].

Cellulose-Polyethylene Papers and IGC 133
V. RESULTS AND DISCUSSION
In this section, we will illustrate some situations where IGC can be a powerfultechnique to characterize modified LG and PE surfaces. We will present someresults from the literature and some of our own results on both dispersive anddonor–acceptor interactions.
A. IGC
More complete data on the following can be found in precedent publications[9,10,23,24]. IGC technique was applied to investigation of chemically modifiedand unmodified PE fiber and cellulose fiber.
B. Dispersive Component
Pioneering work on measurements of dispersive components of surface tensionof cellulose fibers in the presence and absence of water was done through IGCby Dorris and Gray [25,26]. It was found that the surface properties of the water–cellulose system became independent of the amount of water at moisture contentsabove 20%. Heats of adsorption of alkanes on fibers were higher at high moisturecontents.
The standard free energy for the zero-coverage adsorption of n-nonane onvarious fibers is listed in Table 1, second to last column. Values of PE fiber,treated or not, are very similar, near 28–30 kJ/mol, although they do increaseas the concentration of oxygen and fluorine increases at the surface. The chemicaltreatment done on these fibers increases to a quite large degree their donor–acceptor numbers, as the two preceding columns show. Note that these numbersfor untreated PE are near zero, although it does have some oxygen at the surface.The conclusion is that to an increasing extent the polarity of a fiber does notnecessarily contribute to its dispersive properties. This leads credence to the as-sumption that dispersive and polar effects are additive and more or less indepen-dent of each other. This can also be seen in the dispersive component of thesurface tension (last column of the table), which does not vary much either, forthe PE fibers, irrespective of treatment. Again on the natural fibers, kraft andexplosion pulps, the value of heats of adsorption, and dispersive components ofsurface tension do not vary by much. Treatments with some more hydrophobicagents can change the dispersive component in a substantial way [27]. Lee andLuner [15] with treatment with alkylketene dimer, a hydrophobic sizing agent,increased γd
s of cellulose fiber from 47.4 to 60.4 mN m1.Dispersive interactions can still be very useful in exploring the surface charac-
teristics of composites. For instance, in thermoplastic fiber composites, if thereinforcing fiber and the continuous phase have markedly different values of thedispersive components, one can vary the amount of polymer grafted or coated

134 Riedl and Chtourou
TABLE 1 Contact Angles of Water on Composite Papers at 26°C as a Function ofContent in Explosion Pulp, for Papers Made with PE Pulp Using First- and Second-Degree Oxyfluoration, as Well as Donor (KB) and Acceptor (KA) Numbers, StandardFree Energy for the Zero-Coverage Adsorption (n-Nonane), and DispersiveComponents of Surface Tension for Unmixed Fibers
Contact angleθ, paper, ∆G 0
A
26°C, against nC9 50°C γDs 50°C
water KA KB (kJ/mol) (mJ/m2)
Untreated PE fiber — 0 0 29.2 32.7PE, 1st treatment level (121) 7.3 2.5 28.0 32.8PE, 2nd treatment level (100) 10.3 9.2 27.8 31.3Kraft pulp — 5.5 5.0 19.4 6.8Explosion pulp 69 2.4 12.1 20.6 9.8Mixed paper, %, explosion pulp:Treatment 1:
25 11050 8875 77
Treatment 2:25 9350 8675 75
Values in parentheses were obtained by regression on contact angles versus composition.Source: IGC data from Refs. 10 and 24.
on the fiber and record the variation of the dispersive components or heats ofadsorption. When the value reaches that of the continuous phase, then we caninfer from the amount of polymer grafted, knowing the specific surface of thefiber, the thickness of the interfacial layer. At that stage it will also be necessaryto graft more polymer on the fiber surface. In earlier work [28,29], we grafted,with the free radical mechanism, polymethylmethacrylate (PMMA) onto cellu-lose fibers, with up to 140% polymer loading on the fiber. The purpose was toverify at what level of loading, e.g., thickness, the properties of the grafted fiberat the surface would become like those of the bulk phase. As can be seen in Fig.1, which shows the dispersive component of the surface tension of paper CTMPfiber as a function of PMMA fiber loading, this value ceases to vary when thepolymer loading is near 140% (which means the composite contains 50% PMMAas wt%). At that point, the properties of the grafted PMMA become like thoseof the bulk phase (the isolated points on the lower right corner of the figure). Atthat loading level, the figure additionally shows the O/C ratio of the surface,obtained from photoelectron spectroscopy, which also becomes like that of pure
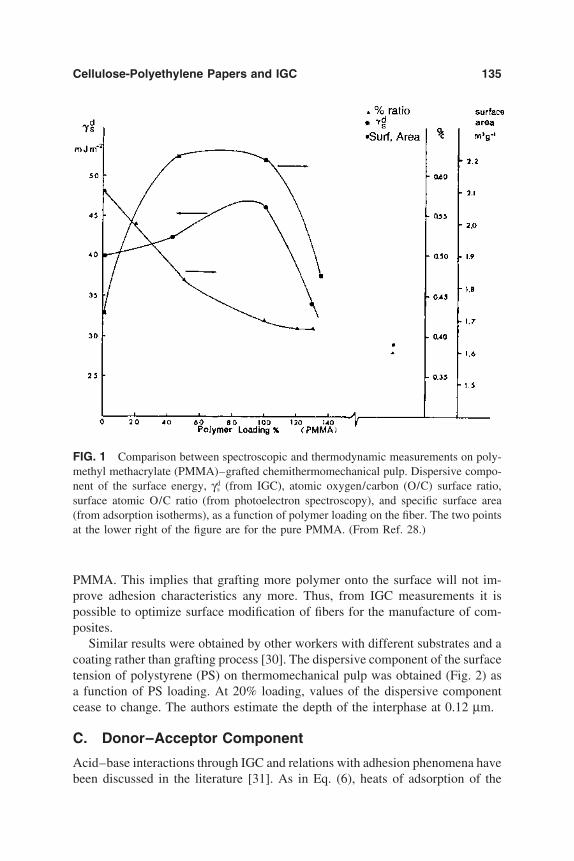
Cellulose-Polyethylene Papers and IGC 135
FIG. 1 Comparison between spectroscopic and thermodynamic measurements on poly-methyl methacrylate (PMMA)–grafted chemithermomechanical pulp. Dispersive compo-nent of the surface energy, γd
s (from IGC), atomic oxygen/carbon (O/C) surface ratio,surface atomic O/C ratio (from photoelectron spectroscopy), and specific surface area(from adsorption isotherms), as a function of polymer loading on the fiber. The two pointsat the lower right of the figure are for the pure PMMA. (From Ref. 28.)
PMMA. This implies that grafting more polymer onto the surface will not im-prove adhesion characteristics any more. Thus, from IGC measurements it ispossible to optimize surface modification of fibers for the manufacture of com-posites.
Similar results were obtained by other workers with different substrates and acoating rather than grafting process [30]. The dispersive component of the surfacetension of polystyrene (PS) on thermomechanical pulp was obtained (Fig. 2) asa function of PS loading. At 20% loading, values of the dispersive componentcease to change. The authors estimate the depth of the interphase at 0.12 µm.
C. Donor–Acceptor Component
Acid–base interactions through IGC and relations with adhesion phenomena havebeen discussed in the literature [31]. As in Eq. (6), heats of adsorption of the

136 Riedl and Chtourou
FIG. 2 Variation of the dispersive component of the surface tension of paper fiber withincreasing loading in polystyrene. (From Ref. 30.)
probes can be obtained from the temperature dependence of the volume of reten-tions. An example of this is given in Fig. 3 [10,24] for kraft pulp. First, n-alkanesshow a linear variation with respect to the horizontal axis, which is in α(γd
s )1/2,a measure of the dispersive surface area of the probes. Other horizontal scaleshave been used by different authors [2]. The other probes as electron donors andacceptors, or both (amphoteric), do show an additional interaction with the fibersurface. With an untreated PE surface, even the untreated PE surface examinedhere, which does show, in XPS, surface oxygen, all probes nearly line up onthe n-alkane reference line [10,24]. With treatment with oxygen and fluorine anadditional enthalpic contribution appears, which increases with the degree oftreatment. The difference between the n-alkane baseline and the actual value forthe polar probes is called the specific contribution to the heat of adsorption andis a function of both the donor–acceptor characteristics of the probe and thesurface of the nonmobile phase From Eq. (10) the donor and acceptor numberof the surface can be ascertained (see Table 1). An electron donor (basic) probewill have a large heat of adsorption on a surface with a high concentration ofelectron acceptor (acid) sites. For instance, kraft pulp has a high donor numberof 5.0, and with the probe in Fig. 3 gives the largest value of the heat of adsorp-tion, CH3NO2 has the largest acceptor number, 20.5, of the probes used. Thus,IGC shows (see Table 1) that the surface electron acceptor and donor characteris-tics of the PE fiber does increase with chemical treatment, and a large contributionof these donor–acceptor interactions to the mechanical properties or adhesioncan be expected.
With Eq. (12), this reasoning can be further expanded. Contributions to theIsp can be broken down in several contributions due to PE–PE contacts, PE–LG‘‘unlike’’ contacts, and LG–LG contacts. In Fig. 4, such a distribution has been

Cellulose-Polyethylene Papers and IGC 137
FIG. 3 Plot of ∆H 0A for the n-alkanes and the polar probes on kraft pulp fiber. (From
Refs. 10 and 24.)
FIG. 4 Variation in donor–acceptor interaction parameter, Isp, as a function of degreeof oxyfluoration of PE fiber (T.L. 0 corresponds to no treatment, T.L. 1 and T.L. 2 corre-spond to level 1 and 2 of treatment, respectively), for 50:50 blend of explosion and PEpulp, and broken down in contributions due to the three different types of fiber–fibercontacts. (Data from Ref. 10.)

138 Riedl and Chtourou
done (in the figure ‘‘CELL’’ stands for LG). With no treatment on the fiber, thereare no contributions to Isp from the PE fiber, only from the LG–LG contacts, asthese fibers have both donor and acceptor surface properties. With treatment 1,there is a dominant contribution (67%) to Isp contacts from unlike interfiber con-tacts. With further treatment of the PE fiber, this last contribution is still dominant(54%), but the contribution of PE–PE (35%) is stronger. Of course, the contribu-tion of LG–LG contacts is constant because their surface remains the same. Notethat if one fiber had only donor sites and the other only acceptor sites, only theunlike contacts contribution will contribute to Isp. Thus, although the PE fiber isless strong mechanically than the LG fiber, as far as the paper is concerned, themechanical properties can still be increased by increased adhesion between fibers,as will be seen in the last section.
D. Comparison with Wetting Characteristics
There are few comparisons between surface energy measurements by IGC andwetting measurements. Felix and Gatenholm [27] did such a study on cellulosefibers. From IGC, γD
s was 44.0 mJ/m2, whereas a corresponding value of 25.5mJ/m2 was found with wetting measurements. This difference was attributed toa fundamental difference between IGC and wetting measurements as the formeris more sensitive to surface high-energy sites than the latter [32]. Similar differ-ences were seen for treated fibers. Shi et al. [33] also compared, as obtainedthrough IGC and column wicking (capillary rise) measurements, acceptor–donorcharacteristics of hardwood fiber and automobile fluff (automobile shredder resi-due). Both techniques showed fluff surface as predominantly acidic, with woodfiber having a dispersive component value of 43–49 mJ/m2.
Quillin et al. [34] did an intensive study on Pulpex fiber. They assessed surfaceproperties through wetting (contact angle measurements). They found a posi-tive correlation between donor–acceptor work of adhesion and the internalbond strength of the composite papers. Haidara et al. [35] did a study of thetemperature dependence of interfacial tensions with the Wilhelmy plate method.The entropic effects involved were large and results were correlated with acid–base properties. There is also a discussion of donor–acceptor effects in wettingby Berg [36].
With our composite papers, we did not characterize evolution of surfacetension by wetting with treatment of PE or proportion of LG fiber. However, wedid some angle of contact measurements with water on composite papers, whichare shown in Table 1, first column. The angle of contact decreases with a higherproportion of LG fibers in composite papers, being lowest on pure explosion pulpfiber paper. The contact angle also decreases with increasing treatment and polar-ity of PE, but remains high. This suggests that a high proportion of hydrophobic

Cellulose-Polyethylene Papers and IGC 139
sites have not been affected by the treatment, although the polarity of the treatedfiber, no. 2, is about as high (KB) or higher (KA) as that of explosion pulp.
E. Correlation with Paper Physical Characteristics
There are several instances of strong correlations between donor–acceptor char-acteristics and mechanical properties. One of the best examples is the work ofSchultz and Lavielle [22]: The interfacial shear strength for carbon fiber rein-forced epoxy is linearly related to an interaction parameter similar to that givenin Eq. (11). Other authors have shown such correlations [37]. We have shownin precedent work [23] that tear index and burst strength of composite papers,previously discussed here, are much increased by oxyfluoration treatments, asshown in Fig. 5. These properties are also linearly related with the specific inter-action parameter, Isp, as can be seen in Fig. 6 (where degree of treatment pro-gresses from left to right, in both parts of the figure). In this case chemical treat-ments result in increased interfiber-specific interactions, which end up increasingthe mechanical properties of the papers, without change in the mechanical proper-ties of the individual fibers. From the initial values of mechanical properties with
FIG. 5 Tear index of paper as a function of the oxyfluoration of PE pulp, and LG/PEpulp proportions. , 0% PE; , 25% PE; , 50% PE; , 75% PE; , 100% PE. (FromRefs. 10 and 23.)

140 Riedl and Chtourou
FIG. 6 Strength properties of LG/PE pulp paper, for 75:25% blend, as a function of thespecific donor–acceptor interaction parameter, as changed through surface oxyfluorationof PE pulp fiber. , Tear index (mN.m2/g); , B. length (km); , Burot index (kPa.m2/g). (From Refs. 10 and 23.)
a proportion of 25% untreated PE fiber, properties increase anywere from 30%to 50% with treatment 2 on PE fiber, and this correlates well with concomitantincreases in Isp values obtained from IGC. In composite papers such as these,any increase in mechanical properties must come from an increase in interfiberadhesion, in this case related to donor–acceptor interactions.
VI. CONCLUSION
IGC results correlate well with experimental mechanical properties of compositepapers. Although oxyfluoration treatments increase donor–acceptor interactionsto a large extent, the dispersive characteristics of the treated fibers did not changemuch. The contact angle with water shows decreasing values with enhancedoxyfluorine treatment of fiber, which is consistent with enhanced surface polarity.
The dispersive component is not very sensitive or influenced by chemical treat-ments, but it can be put to good use, e.g., measuring the depth of the interphase,because of this relative insensitivity.
The donor–acceptor surface characteristics can be somewhat more difficult toobtain but can be highly sensitive to chemical surface modification. This is

Cellulose-Polyethylene Papers and IGC 141
closely related to adhesion properties generated across the interface. These char-acteristics can be further broken down in acid–base or base–acid contributiondue to both phases, remembering that many substrates, especially natural ones,have an amphoteric nature.
ACKNOWLEDGMENT
The authors gratefully acknowledge the financial help of the Conseil de recher-ches en sciences naturelles et en genie du Canada, of the Faculte de foresterieet de geomatique de l’Universite Laval and of the Fonds pour la formation dechercheurs et l’aide a la recherche du Quebec.
SYMBOLS AND ACRONYMS
A surface area of stationary phaseAN acceptor number of probeθ angle of contact of fiber paper with waterDN donor number of the probeF force exerted on sampleγw surface tension of water∆G 0
A standard free energy of adsorption of probe∆G 0
A(CH2) free energy of adsorption of one methylene group∆H 0
A standard enthalpy of adsorption of the probe∆H SP
A enthalpy of adsorption component of the probe due tospecific interactions
Isp interaction (donor–acceptor) parameterIGC inverse gas chromatographyj James-Martin compression correction termKa acid (acceptor) number of nonmobile phaseKb basic (donor) number of nonmobile phaseK lig
A acid (acceptor) number of paper fiberK lig
B basic (donor) number of paper fiberKPE
A acid (acceptor) number of modifed polyethyleneKPE
B basic (donor) number or modifed polyethyleneKs partition coefficientL perimeter of sampleLG lignocellulosicPa atmospheric pressurePs ,g absorbate (probe) vapor pressure in gaseous standard statePw saturated vapor pressure of water at ambient temperatureP l pressure drop in the column Pa
PE polyethylene
142 Riedl and Chtourou
PMMA polymethyl methacrylatePS polystyreneΠs spreading pressure of absorbed filmQ corrected flow rate of carrier gasQ0 measured flow rate∆S 0
A standard entropy of adsorption of probet time of retention of the gas probe in columnTa ambient temperatureTc temperature of columntm time of retention of methane in columnVN volume of retentionVN(Cn1H2n4) volume of retention of an incremental methylene unitVN(CnHn2) volume of retention of an alkaneV 0
G specific net retention volumeW weight of nonmobile phaseXPS X-ray photoelectron spectroscopy
REFERENCES
1. J. E. Guillet, in New developments in Gas Chromatography (J. H. Purnell, ed.),Wiley-Interscience, New York, 1973, p. 187.
2. D. R. Lloyd, T. C. Ward, H. P. Schreiber, and C. C. Pizana, Inverse Gas Cromatogra-phy Characterization of Polymers and Other Materials, ACS Symposium Series No.391, American Chemical Society, Washington, D.C., 1989.
3. D. J. Gray, in Progress in Polymer Science, Vol. 5 (A. D. Jenkins, ed.), PergamonPress, Oxford, 1977, p. 1.
4. J. M. Braun and J. E. Guillet, Adv. Polym. Sci. 21:108 (1976).5. O. Olabisi, Macromolecules 8:316 (1975).6. D. Patterson, Y. B. Tewari, H. P. Schreiber, and J. E. Guillet, Macromolecules 4:
356 (1971).7. Z. Y. Al-Saigh and P. Munk, Macromolecules 17:803 (1984).8. F. M. Fowkes, J. Adhesion Sci. Technol. 1:7 (1987)9. H. Chtourou, B. Riedl, and B. V. Kokta, J. Colloid Interface Sci. 158:96 (1993).
10. H. Chtourou, Ph.D. thesis, Universite Laval, Quebec, Canada, 1994.11. R. S. Drago, G. C. Vogel, and T. E. Needham. J. Am. Chem. Soc. 93:6014 (1971).12. V. Gutmann, The Donor–Acceptor Approach to Molecular Interactions, Plenum
Press, New York, 1983.13. H. K. Lee and P. Luner, Nordic Pulp Paper Res. J. 2:164 (1989)14. H. K. Lee and P. Luner, J. Colloid Inter. Sci. 146:195 (1991).15. H. K. Lee and P. Luner, J. Wood Chem. Technol. 13:127 (1993).16. A. Lundqvist, L. Odberg, and J. C. Berg, Tappi J. 78:139 (1995).17. D. P. Kamdem, S. K. Bose, and P. Luner, Langmuir 9:3039 (1993).18. D. G. Gray and J. E. Guillet, Macromolecules 3:316 (1972).
Cellulose-Polyethylene Papers and IGC 143
19. J. H. De Boer, The Dynamic Character of Adsorption, Oxford University Press(Clarendon), Oxford, 1953.
20. G. M. Dorris, Ph.D. thesis, McGill University, Montreal, Quebec, Canada, 1979.21. Saint-Flour and C. Papirer, Ind. Eng. Chem. Prod. Res. Dev. 21:666 (1982).22. J. Schultz and L. Lavielle, in Inverse Gas Cromatography Characterization of Poly-
mers and Other Materials (D. R. Lloyd, T. C. Ward, H. P. Schreiber, and C. C.Pizana, eds.), ACS Symposium Series No. 391, American Chemical Society, Wash-ington, D.C., 1989, pp. 185–202.
23. H. Chtourou, B. Riedl, and B. V. Kokta, Tappi J. 80:141 (1997).24. H. Chtourou, B. Riedl, and B. V. Kokta, J. Adhesion Sci. Technol. 9:551 (1995);
also appeared as chapter in Polymer Surface Modification: Relevance to Adhesion(K. L. Mittal, ed.) VSP, Utrecht, Netherlands, 1996, pp. 455–478.
25. G. M. Dorris and D. G. Gray, Chem. Soc. Faraday Trans. I 77:725 (1981).26. G. M. Dorris, and D. G. Gray. J. Colloid Interface Sci. 71:93 (1979).27. J. Felix and P. Gatenholm, Nord. Pulp Paper Res. J. 8:200 (1993).28. B. Riedl and P. D. Kamdem, J. Adhesion Sci. Technol. 6:1053 (1992); also published
in Contact Angle, Wettability and Adhesion (K. L. Mittal, ed.), VSP, Utrecht, Nether-lands, 1993, pp. 625–638.
29. P. D. Kamdem and B. Riedl, J. Wood Chem. Technol. 11:57 (1991).30. J. Simonsen, Z. Hong, and T. G. Rials, Wood Fiber Sci. 29:75 (1997).31. W. B. Jensen, in Surface and Colloid Science in Computer Technology (K. L. Mittal,
ed.), Plenum Press, New York, 1987.32. J. Borch, J. Adhesion Sci. Technol. 5: 523 (1991).33. Q. Shi, D. G. Gardner, and J. Z. Wang, in Fourth International Conference on
Woodfiber-Plastic Composites, Forest Products Society, Madison, Wisconsin, 1997,pp. 245–256.
34. D. T. Quillin, D. F. Caulfield, and J. A. Koutsky, Mat. Res. Soc. Symp. Proc. 266:113 (1992).
35. H. Haidara, M. -F. Pinhas and J. Schultz, J. Adhesion 54:155 (1995).36. J. C. Berg, in Wettability (J. C. Berg, ed.), Surfactant Science Series No. 49, Marcel
Dekker, New York, 1993, pp. 75–148.37. A. E. Bolvari and T. C. Ward, in Inverse Gas Cromatography Characterization of
Polymers and Other Materials (D. R. Lloyd, T. C. Ward, H. P. Schreiber, and C. C.Pizana, eds.), ACS Symposium Series No. 391, American Chemical Society, Wash-ington, D.C., 1989, pp. 12–19.


4Inverse Gas Chromatography: AMethod for the Evaluation of theInteraction Potential of Solid SurfacesEUGENE PAPIRER and HENRI BALARD Institute of Chemistry ofSurfaces and Interfaces, French National Center of Scientific Research,ICSI–CNRS, Mulhouse, France
I. Introduction 146
II. Inverse Gas Chromatography 147A. Definition 147B. Practice of IGC 148
III. IGC at Infinite Dilution (IGC-ID) 149A. Fundamental equation of IGC at infinite dilution conditions 149B. London interaction potential 150C. Specific interaction potential 152D. Importance of the surface nanomorphology 157
IV. IGC at Finite Concentration Conditions 160A. Acquisition of the adsorption isotherms using IGC-FC 161B. Thermodynamic quantities calculated from the isotherms 162C. Estimation of the solid’s surface heterogeneity using
adsorption energy distribution functions 163D. Examples of distribution functions of the adsorption energies:
influence of the nature of the probe on the distribution functionshape 164
V. Advantages and Limitations of IGC 168
VI. Conclusion 168
References 169
145

146 Papirer and Balard
I. INTRODUCTION
The role of solid–solid, solid–liquid, and solid–gas interfaces is presently wellrecognized in numerous phenomena, especially in chromatographic processes,and in numerous applications of divided solid surfaces such as fine-powderedmineral oxides used as fillers in elastomers or paints, catalysts supports, andthixotropic agents. For instance, the rheological behavior of powder mixes, eitherin the dry state or in suspension in liquids, clearly depends on the particle mor-phology, size, and size distribution, but also on the physicochemical interactionsbetween particles themselves or with their environment. Similarly, the stability ofcolloidal dispersions is influenced by a complex balance between various forces(attractive and repulsive van der Waals, electrostatic forces, hydrophobic forces,acid–base interaction forces) that act in the dispersion. Efficient gas adsorptionphenomena that allow high selectivity in gas chromatography, and hence fineseparation, are essentially due to specific interactions between adsorbent and ad-sorbate. Major efforts have consequently been spent to reach a better insightinto and description of those forces. However, the experimental evaluation of theinteraction potential of a solid surface involving those forces is far from beingevident, especially for powders. The development of the surface force apparatus[1] and, more recently, of near field electron microscopes [2], as well as newtheories [3], has given new impetus in this research domain. These methods applyfairly well to ‘‘model’’ surfaces such as cleaved muscovite in the case of boththe surface force apparatus and the atomic force microscope, but so far dividedsolids cannot be simply examined with these methods. The most familiar waysof determining the surface energy (potential for reversible or physical interac-tions) are wetting or contact angle measurements. Here, drops of liquids of knowncharacteristics are deposited on a flat and nonporous solid surface and the contactangles are evaluated using well-accepted procedures leading to the determinationof the surface energy value [4]. Such a procedure hardly applies to powders,even when they are compressed in a platelet form on which liquid drops may bedeposited, because it is quite impossible to prepare surfaces of adequate smooth-ness. In all cases, careful and time-consuming verifications of the surface smooth-ness are required [5] before reaching meaningful conclusions.
For the study of powders, which are the preferred supports for chromatographypurposes, one generally calls on either gas adsorption or calorimetric methodsfor the evaluation of their interaction potential, which in turn allows the predictionof interaction energy. Immersion calorimetry, combined with a gas adsorptionmethod [6] monitoring the degree of solid surface coverage, delivers enthalpiesand entropies of adsorption. But again, these methods require special equipmentand skill. Inverse gas chromatography (IGC) is, at least at first sight, a straightfor-ward technique for the characterization of a variety of solid surfaces indepen-

IGC and Solid Surfaces 147
dently of the extent of their specific surface area or of the particle or fiber mor-phology.
In this chapter, first we shall recall the physicochemical quantities that areaccessible through IGC measurements and then we shall illustrate the possibilitiesof IGC in terms of examples of studies performed essentially in our laboratory.Finally, we shall state the advantages and limitations of that method.
II. INVERSE GAS CHROMATOGRAPHY
A. Definition
The term inverse relates to the fact that chromatography is performed in an un-usual way. Commonly, chromatography is applied for the separation and possibleidentification of the components of a given mix. Generally, limited attention ispaid to the chromatographic phase that fills the column as long as it operatesproperly. In IGC, the situation is exactly the ‘‘inverse’’ because one becomesinterested in the chromatographic support and in order to characterize it one in-jects solutes of known properties. For instance, when injecting alkanes, only Lon-don-type or dispersive interactions are susceptible to intervene whatever the na-ture of the GC column filling. Intuitively already, it seems obvious that a longretention time (duration necessary for the alkane to cross the column) is indicativeof intense London interactions between the alkane probe molecule and the solid’ssurface. Solutes other than alkanes may be used as molecular probes to test thesolid surface’s other characteristics such as its specific interaction (polar, acid–base, etc.) capacity.
IGC has been used for years for the measurement of solution thermodynamicsof polymers that are coated on an inert chromatographic support; for the determi-nation of their physical characteristics such as glass transition temperature, crys-tallinity, and melting point; but also for the evaluation of adsorption isothermson various oxides or carbons, etc. Several books describe these possibilities [7,8]and in recent years a symposium was devoted to this peculiar type of chromatog-raphy [9].
IGC may be practiced in two different ways: The first method is IGC at infinitedilution conditions (IGC-ID) when injecting minor amounts of gaseous solutes,at the limit of detection of the most sensitive detectors. Hence, we are operatingunder conditions that give us the unique possibility of performing measurementsat true infinite dilution condition, for which the theories are usually established.For the physicochemical surface characterization of a solid support, we see alsoadvantages because the very few adsorbed probe molecules will be well separatedfrom each other, avoiding the complication of interpretation due to lateral interac-tions between adsorbed neighboring molecules.
148 Papirer and Balard
The second method is IGC at finite concentration conditions (IGC-FC). Herewe inject a known quantity of liquid solute, sufficient to entirely cover the solid’ssurface. This mode will allow the determination of adsorption isotherms provid-ing complementary information.
B. Practice of IGC
A commercial gas chromatographic apparatus, equipped with a highly sensitiveflame ionization detector, is generally used for IGC studies, with a precisionmanometer for monitoring the input pressure of the chromatographic column.Helium is the most used carrier gas, at a flow rate depending on the diameter ofthe chromatographic column (about 20 mL/min for a 1/8-in, column and 60 mL/min for a 1/4-in, column). Depending on the size of the stationary particles inthe column, which governs the pressure drop through the column, the length ofthe column varies from 5 cm (particles having a mean diameter around 5 µm)to 1 m (for coarse particles having a mean diameter of 500 µm). However, fora given chromatographic support, the most suitable flow rate, corresponding tothe highest GC efficiency, needs to be determined in the usual way from the vanDempter curve, which links the theoretical plate number of the chromatographiccolumn to the flow rate of the carrier gas.
It is important to point out a major difficulty in the IGC practice originatingmainly from the elaboration of solid particles having adequate size for the columnfilling. If commercial chromatographic silicas can be used as purchased, oftenparticles of the solid of interest are too small (diameter 2 µm) for being directlyemployed as chromatographic supports. In that case, pellets may be prepared,either by solvent agglomeration of a particle slurry or by powder compressionunder a pressure of about 100 Pa, that are then carefully hand-crushed and sievedto select the fraction of particles having diameters between 250 and 400 µm. Forthe former technique, the solvent chosen has to be as inert as possible towardthe solid; otherwise, the physicochemical surface properties may be modifiedduring the agglomeration process. For the latter, good mechanical properties ofthe elementary particles are required to prevent grinding or sintering of the solidduring the compression process. This process could not be applied to a very softmineral-like talc but was successfully used in the case of pyrogenic silicas [10]or clay minerals [11]. When neither compression process nor agglomeration canbe used, then one can fill short columns of 10 cm length and a 4-mm innerdiameter. This technique was successfully employed for micas [12] and talc [13].
The probes used for checking the surface properties of the powder are gener-ally common molecules such as alkanes (for the evaluation of the dispersiveinteractions) and their branched isomers (for the determination of the solid’s sur-face nanomorphology), or polar probes (determination of specific interactions)like chloroform, ether, terahydrofuran, alcohols, short oligomers [10], and so on.
IGC and Solid Surfaces 149
The choice is limited by the necessity of having volatile solutes, showing noirreversible adsorption on the solid of interest and allowing the probe to be elutedfrom the chromatographic column in a reasonable time. This is a serious limita-tion, especially in the case of solids exhibiting a high surface energy, particularlywhen looking at the surface properties using polar probes. It strongly restrictsthe choice of polar probes and consequently the IGC ability to provide entireinformation on the capacity of the studied solid to exchange specific interactions.
For chromatographic experiments at infinite dilution conditions, a very smallamount (about 10 µL of vapor) of the probe is injected in the column, so thatintermolecular probe interactions can be neglected. On the contrary, for IGC atfinite concentration conditions, some µL of liquid solutes, from 0.2 µL to about 20µL, depending on the extent of the solid’s surface area contained in the column, isinjected.
III. IGC AT INFINITE DILUTION (IGC-ID)
A. Fundamental Equation of IGC at Infinite DilutionConditions
The net retention time t′r of the probe is the fundamental physical quantity mea-sured by IGC-ID. It is equal to:
t′r tr t0 (1)
where tr is the retention time of the probe and t0 the retention time of a nonretainedmolecule, generally methane (measurement of the dead volume of the chromato-graphic column). The retention volumes Vn (volume of carrier gas necessary topush the probe through the column) is related to the net retention time by:
Vn JDtr (2)
where D is the flow rate at the column output at the temperature of measurement,J is the James-Martin coefficient given by J (1 P/Pa
2/(1 P/Pa)3, whereP is the input and Pa is the output pressure (atmospheric pressure). This coeffi-cient takes into account the gas compressibilty. Finally, the retention volume Vn
is related, at equilibrium, to the surface partition coefficient K between the gas-eous and adsorbed phases and to the area of the sorbent actually accessible tothe probe by the equation:
Vn KA (3)
where A is the total surface area of the powder in the chromatographic column.Intuitively, it is already understandable that a larger Vn will correspond to a
higher affinity of the chromatographic support for the alkanes. Thermodynami-

150 Papirer and Balard
cally, affinity indicates a standard variation in the free energy of adsorption(∆G 0
a). ∆G 0a and Vn are related by:
∆G 0a RT ln(Vn/C) (4)
where C is a constant depending on A and on the choice of a reference state forthe adsorbed alkane molecule. When the chosen reference state is that of Kemballand Rideal [14], ∆G 0
a, expressed in kJ/mol, and Vn(cm3) are related by:
∆G 0a RT ln 8.186.104[Vn/(TmSρ)] (5)
In this expression, T is the temperature of measurement, m the amount of powderin the column, S its specific surface area, and ρ the density of the powder. Becausea perfect surface smoothness of the solid is assumed in that theory, it is notobvious that this bidimensional reference state will be valid for all of the studiedsolid surfaces, especially in the case of grafted solid surfaces or solid surfacesthat are rough at a molecular level.
The use of thermodynamic values derived from the study of the variationsof the free adsorption energy with an experimental parameter (temperature ormolecular probe parameters) is the simplest way to overcome the difficulty en-countered with the choice of the bidimensional reference state.
The temperature of measurement can easily be changed in IGC experiments.This constitutes one of the main advantages of the IGC technique. So, from thevariation of ∆G 0
a with temperature, the enthalpy of adsorption can readily becomputed according to:
∆Ha ∂(∆G 0a/T)/∂T R∂(ln(Vn))/∂T (6)
The study of the variation of the adsorption enthalpies of probes is very usefulto understand the evolution of the surface properties of solids submitted to ther-mal or grafting treatments [15,16]. Transition phenomena such as a glassy tem-perature transition or melting point can be detected using IGC measurements ofadsorption enthalpies [17,18]. Moreover, looking at the influence of some molec-ular parameters on the free energy values, such as polarizability, acid–base prop-erties, or stereochemistry of the probe, is another way to get additional informa-tion on the surface interaction capacity according to the nature of the interactionforces that take place between the probe and the surface: London forces, specificinteraction, or size exclusion effects.
B. London Interaction Potential
The London interactions, also called dispersive, nonspecific, or universal interac-tions, originate from the existence of instantaneous dipoles due to instantaneousdistributions of electrons with respect to the positively charged nucleus. The gen-
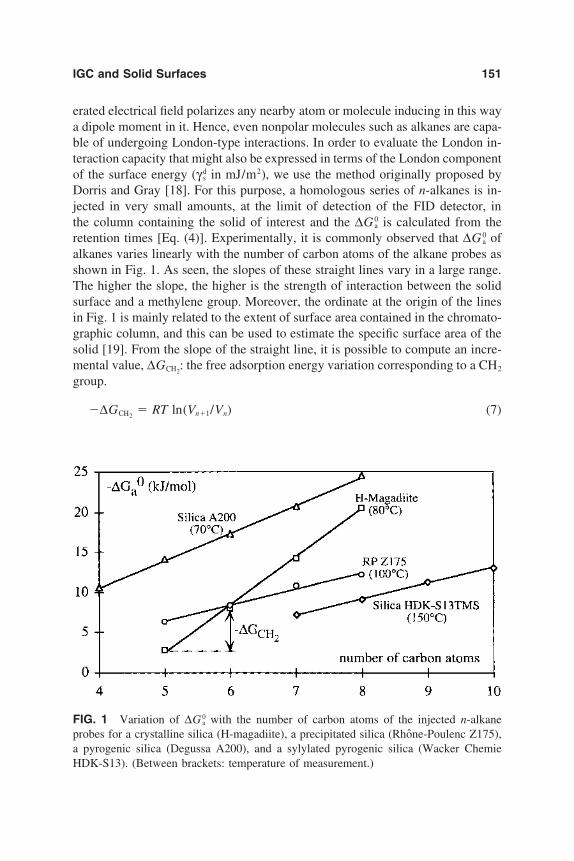
IGC and Solid Surfaces 151
erated electrical field polarizes any nearby atom or molecule inducing in this waya dipole moment in it. Hence, even nonpolar molecules such as alkanes are capa-ble of undergoing London-type interactions. In order to evaluate the London in-teraction capacity that might also be expressed in terms of the London componentof the surface energy (γ d
s in mJ/m2), we use the method originally proposed byDorris and Gray [18]. For this purpose, a homologous series of n-alkanes is in-jected in very small amounts, at the limit of detection of the FID detector, inthe column containing the solid of interest and the ∆G 0
a is calculated from theretention times [Eq. (4)]. Experimentally, it is commonly observed that ∆G 0
a ofalkanes varies linearly with the number of carbon atoms of the alkane probes asshown in Fig. 1. As seen, the slopes of these straight lines vary in a large range.The higher the slope, the higher is the strength of interaction between the solidsurface and a methylene group. Moreover, the ordinate at the origin of the linesin Fig. 1 is mainly related to the extent of surface area contained in the chromato-graphic column, and this can be used to estimate the specific surface area of thesolid [19]. From the slope of the straight line, it is possible to compute an incre-mental value, ∆GCH2
: the free adsorption energy variation corresponding to a CH2
group.
∆GCH2 RT ln(Vn1/Vn) (7)
FIG. 1 Variation of ∆G 0a with the number of carbon atoms of the injected n-alkane
probes for a crystalline silica (H-magadiite), a precipitated silica (Rhone-Poulenc Z175),a pyrogenic silica (Degussa A200), and a sylylated pyrogenic silica (Wacker ChemieHDK-S13). (Between brackets: temperature of measurement.)
152 Papirer and Balard
This in turn is related to γ ds according to the following equation:
γ ds
1γCH2
∆GCH2
2NaCH2
2
(8)
In this equation all is known (aCH2, the area of an adsorbed CH2 group; N Avo-
gadro’s number; γCH2, the surface energy of a solid made entirely of CH2 groups,
i.e., polyethylene) or measurable (∆GCH2), except γ d
s . The γ ds value found for a
pyrogenic silica sample amounts to 70 mJ/m2. This value compares fairly wellwith the one obtained by Kessaissia et al [22] who applied a totally differentmethod (contact angle or wettability measurements). Since a macroscopic method(wettability) and a molecular method (IGC) deliver the same value for γ d
s , onemay conclude that this silica sample exhibits a rather molecular smooth surface atleast at the scale of the probing molecule, thus corresponding to the applicabilityrequirements of the Dorris and Gray method.
The dispersive component of surface energy was determined for a series ofsolids and the results are collected in Table 1. γ d
s values vary in a very large rangefrom 20 mJ/m2 for a silica silylated with a perfluorinated silane, up to more than400 mJ/m2 for carbon blacks. The variations of γ d
s upon treatment of a givensample are caused by modification of the polarizability of surface atoms or sur-face atoms groups. This is based on the supposition that there are no other influ-encing factors, such as a change in accessibility of the surface or steric factors,pertaining to the molecular probe itself.
C. Specific Interaction Potential
IGC should also allow the estimation of the specific interaction potential of apolar solid surface just by injecting polar probes of known characteristics. In fact,this possibility exists but its application is far from evident for the followingreasons: A polar probe will exchange, with a polar surface, London and specificinteractions that contribute to its retention on the solid. Yet we collect just onechromatographic peak that contains the information from both types of interac-tions. The problem is to find a way to separate and evaluate both contributions.Several proposals may be found in the literature, but before entering in this fieldit might be useful to clarify the term specific interactions. It includes all typesof interactions except London interactions. ‘‘Specific’’ also means that the typesof interactions susceptible to be exchanged relate only to the two partners incontact.
A nonpolar surface will be able to undergo only London-type interactionseven when the partner is polar. But with a polar surface, numerous possibilitiesappear, i.e., dipolar, H-bond-type, acid–base, metallic, magnetic, and hydropho-bic interactions. Usually, for IGC, one operates in dry atmosphere that means
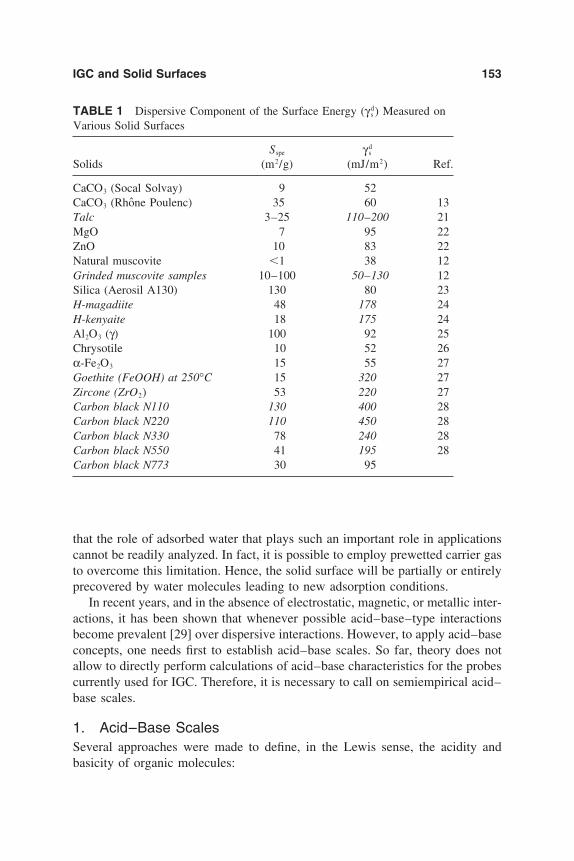
IGC and Solid Surfaces 153
TABLE 1 Dispersive Component of the Surface Energy (γ ds ) Measured on
Various Solid Surfaces
Sspe γ ds
Solids (m2/g) (mJ/m2) Ref.
CaCO3 (Socal Solvay) 9 52CaCO3 (Rhone Poulenc) 35 60 13Talc 3–25 110–200 21MgO 7 95 22ZnO 10 83 22Natural muscovite 1 38 12Grinded muscovite samples 10–100 50–130 12Silica (Aerosil A130) 130 80 23H-magadiite 48 178 24H-kenyaite 18 175 24Al2O3 (γ) 100 92 25Chrysotile 10 52 26α-Fe2O3 15 55 27Goethite (FeOOH) at 250°C 15 320 27Zircone (ZrO2) 53 220 27Carbon black N110 130 400 28Carbon black N220 110 450 28Carbon black N330 78 240 28Carbon black N550 41 195 28Carbon black N773 30 95
that the role of adsorbed water that plays such an important role in applicationscannot be readily analyzed. In fact, it is possible to employ prewetted carrier gasto overcome this limitation. Hence, the solid surface will be partially or entirelyprecovered by water molecules leading to new adsorption conditions.
In recent years, and in the absence of electrostatic, magnetic, or metallic inter-actions, it has been shown that whenever possible acid–base–type interactionsbecome prevalent [29] over dispersive interactions. However, to apply acid–baseconcepts, one needs first to establish acid–base scales. So far, theory does notallow to directly perform calculations of acid–base characteristics for the probescurrently used for IGC. Therefore, it is necessary to call on semiempirical acid–base scales.
1. Acid–Base ScalesSeveral approaches were made to define, in the Lewis sense, the acidity andbasicity of organic molecules:

154 Papirer and Balard
The hard–soft acid base scale of Pearson [30]The E-C relation of Drago [31]The donor–acceptor numbers of Gutmann [32]The solvatochromic parameters [33]
It would be out of scope to describe in detail those scales. A recent review byMukhopadhyay and Schreiber [34] discusses all of these points. Only limitedinformation will be given in this instance.
The hard–soft acid–base scale of Pearson [30] is based on quantum mechani-cal considerations or molecular orbital theories where the absolute hardness of amolecule is defined as equal to half the negative rate at which its electronegativitychanges with a change of its electron population, at constant potential. Pearson-derived laws allowing one to predict the orientation of organic reactions betweenelectron donor and electron acceptor molecules or groups. So far his conceptshave not been used for IGC given the rather unknown and complex nature ofsolid surfaces.
The four-parameter semiempirical equation of Drago [31], on the contrary,is most valuable for surface characteristic determinations. The equation predictsacid–base reaction enthalpies in the gas phase or in poorly solvating solvents:
∆HAB EA EB CA CB (9)
The acid A and the base B are characterized by two parameters: an E value,which represents the ability of A and B to participate in electrostatic bonding(hardness), and a C value (softness), which indicates their tendency to form cova-lent links. Taking iodine as a reference substance for which CA EA and makinga series of calorimetric measurements leads to C and E values of tens of mole-cules. The Drago approach has been used with success, starting from wettabilitymeasurements, for the evaluation of surface properties of oxides [35], yet notthrough IGC. But there is no peculiar reason for that. One major drawback ofthe Drago scale comes from the fact that a molecule is allowed to be either anacid or a base. In reality, most molecules exhibit amphoteric properties: theysimultaneously possess partial acid and base behaviors. In that respect, the scaleof Gutmann [32], which is also semiempirical, shows advantages.
The Gutmann electron acceptor (AN) and donor numbers (DN) that stand foracid and base properties of a molecule or substance, respectively, are determinedexperimentally. AN is defined as the enthalpy of formation of a 1:1 molecularadduct of a given molecule with a reference Lewis acid (SbCl5). DN is measuredby the nuclear magnetic resonance (NMR) shift of P when the given moleculeis mixed with a solution of oxotriethylphosphine (Et3PO), with the shift beingnormalized by taking the value 0 for the solvent (1,2-dichloroethane) and 100for SbCl5. Knowing AN of a pure acid and DN of a pure base, one may simplycalculate the enthalpy of interaction using the following relation:

IGC and Solid Surfaces 155
∆HAB AN ⋅ ND/10 (10)
For amphoteric molecules having respectively (AN)1 and (AN)2 as acceptor num-bers and (DN)1 and (DN)2 as donor numbers, we [36] proposed use of the follow-ing equation:
∆Hsp (AN)1 ⋅ (DN)2/100 (DN)1 ⋅ (AN)2/100 (11)
This relation has since been often used in the literature for the evaluation of theacid–base properties of numerous supports; supplementary examples will begiven later on.
The method of Kamlet and Taft [33] is called the solvatochromic method be-cause the measurements were initially performed by spectrometry. Based on lin-ear solvation energy relationships, the chromatographic stationary phase hydro-gen bond acidity and basicity as well as its polarizability (London interactions)can be evaluated. Such analysis was performed by IGC, e.g., on modified silicasurfaces [37].
But in all cases, neither of these methods will give complete information onthe mechanism of interaction, in particular on the way the selected solute ormolecular IGC probe contacts the solid surface. In other terms, factors limitingthe access of the chosen molecular probe such as surface roughness or nanomor-phology should be taken into account.
2. Acid–Base Measurements on Solid SurfacesMost acid–base evaluations on chromatographic supports are based on the appli-cation of the relation:
∆Hsp (AN)p(DN)s/100 (DN)p(AN)s/100 (12)
In this relationship, ∆Hsp is the specific enthalpy of interaction: the one that isdue to the sole specific interactions between the probe (p) and the surface (s).Of course, this raises the problem of the identification of ∆Hsp. In practice, oneinjects a polar probe in the column containing the polar support of interest. Asmentioned before, this probe will exchange with the support both London andspecific interactions. Yet only a single peak will be recorded that contains thecontributions of both London and specific interactions. For example, various at-tempts were made to solve the problem by comparing the behaviors of linearalkanes and polar probes of the same molecular weights. We [38] suggested touse the vapor pressure as a molecular descriptor of the properties of the solutes.The first reason of that choice is obviously the fact that volatility is a perquisitefor a solute in an IGC experiment and that vapor pressure values are readilyfound in the literature. However, the vapor pressure at saturation reflects onlythe molecular interactions that similar molecules are able to undergo and thisunderlines the limits of our method. Various improvements have been proposed:

156 Papirer and Balard
1. The use [39] of a corrected vaporization enthalpy: the ∆Hv being correctedfor London-type interactions
2. The use [40,41] of the molar deformation polarizability of probes. This ap-proach is based on van der Waals theory that states that London interactionsare proportional to the polarizabilities of the partners in interaction.
3. The use [42] of a quantity a(γL)1/2 where a is the area of the adsorbed probeand γL the London component of the surface energy of the liquid probe, withthe difficulty being to evaluate for each new support the true value of theadsorbate’s section
4. The use [43] of topology indices of the probes. This procedure that looksmost promising is under current investigation in our laboratory.
All of these different descriptors of the probe molecule characteristics are appliedas illustrated in Fig. 2. From the ∆Gsp values determined, from the departurefrom the alkane line of the representative point of the polar probe, at severaltemperatures, one readily calculates the ∆Hsp by application of Eq. (6), and thedonor and acceptor numbers of the chromatographic support using Eq. (12).
The determination of specific interaction parameter is based on the comparisonof the retention properties of polar probes and n-alkane probes. One supposesthat both types of molecules will have access to the same area of adsorption, i.e.,that no size exclusion effects occur during the chromatographic process due toa particular nanomorphology of the surface. We shall see that this condition isnot always filled, thus leading to erroneous values.
FIG. 2 Determination of the specific interaction parameter (Isp) on natural graphite at63.5°C.

IGC and Solid Surfaces 157
D. Importance of the Surface Nanomorphology
As pointed out by Papirer et al. [20,44], the common assumption of surfaceplaneity cannot be assumed for solids having a lamellar structure such as crystal-line silicas or talc. Partial insert on of the flexible alkanes between silica layerdefects takes place on the crystal edges and very efficient adsorption of alkaneswill take place. From this insertion phenomena, it results that unexpected highvalues of γ d
s were determined on those materials and correlatively some negativeIsp, especially in the case of bulky molecules such as chloroform or α,ω-dienesthat do not have access to the same adsorption sites [44]. Similar size exclusionphenomena were observed on other lamellar solids like muscovite [12], talc [45],or clays [11], but also on carbon blacks. Each time, ‘‘abnormal’’ values of γ d
s
were calculated (see values in italic in Table 1) that cannot be accounted for bysimple physical considerations. Rapidly, a particular surface structure and theexistence of very efficient adsorption sites for alkanes were suspected to be atthe origin of the unexpected γ d
s values determined on those materials [46]. In thecase of carbon blacks, which also exhibit very high values of γ d
s , scanning tunnel-ing microscopy [47] demonstrated that the surface of carbon black is made ofscales of polyaromatic nature, on the boarder of which n-alkanes strongly andpreferentially adsorb. Molecular modeling studies confirm the preferential ad-sorption possibilities of linear hydrocarbons at the edges of those scales.
Hence, since in infinite dilution conditions only very few probe molecules areused to estimate γ d
s , the information, extracted from their retention volume (Vn),will only concern mainly the more active adsorption sites. Taking into accountthat the residence time of a molecule on an adsorption site is proportional to theexponential of its energy of interaction [following Eq. (13)], they will contributemainly to the retention time of the probe:
τ τ0 exp(ε/RT) (13)
where τ0 is a constant and ε the interaction energy of the molecule. The retentiontime is mainly dependent on the number of sites having the highest energy; thethermodynamic values calculated from the former are nonrepresentative of theinteraction capacity of the whole solid surface.
For lamellar solids, partial insertion of n-alkanes between crystal layers ispossible. Those inserted probes will be submitted to a much stronger force field,in comparison with molecules adsorbed on a flat surface, and will thus be moreefficiently retained; following, the calculated γ d
s will take abnormal values. There-fore, it is necessary to define a morphology index that would relate the accessibil-ity of the solid surface on the one hand and the shape or morphology of themolecular probe on the other hand [44]. Theoretical considerations do not allowsolution of the problem because little is known about the surface morphology ofdivided amorphous solids. A semiempirical method was therefore proposed

158 Papirer and Balard
based, on the one hand, on the definition and choice of a reference silica surfaceand, on the other hand, on the use of molecular probes of known morphologies,with the values (retention volumes) determined on this model silica surface beingtaken as references. By model silica surface, one understands a silica surfacethat is smooth and chemically homogeneous considering the dimensions of themolecular probe used to test it. Pyrogenic silicas, such as Aerosil from Degussa orHDK from Wacker (Germany), apparently meet these requirements. ConcerningAerosil, several experimental facts plead in its favor. For instance, the behaviorof grafted alcohol and diols is only explainable if the silica surface is indeed flatat the molecular level [48].
Moreover, Barthel et al. [49] determined a fractal dimension of pyrogenicsilicas using a series of analytical methods like gas adsorption and small-anglex-ray scattering. Their results point to a fractal dimension of 2.0. Comparatively,the fractal dimension of a precipitated silica is close to 3.0.
Coming back to the fundamental equation [Eq. (3)] of IGC at infinite dilution,one may write the ratio:
V BN
V LN
KB AB
KL AL(14)
where KB and K L are the equilibrium constants for branched and linear hydrocar-bons, respectively; A B and A L being the corresponding actual areas of adsorbedmolecules. By definition, the morphology index is given by:
Im 100V B
N
V LN
V L
NrefV B
Nref(15)
where V LNref and VB
Nref are the retention volumes measured on the reference sur-face, i.e., pyrogenic silica. The branched alkanes commonly used are tetrameth-ylbutane (Te MB), 2,2,4-trimethylpentane (224 TMP), 2,2,4-trimethylpentane(234 TMP), and 2,5-dimethylhexane (25 DMH). Some values of morphologyindexes are reported in Table 2. The lower the nanomorphology index, the higheris the surface roughness of the solid. It is seen that the precipitated silica is morerugged than the pyrogenic silica. However, the most significant differences arenoted with lamellar minerals, i.e., surfaces that also exhibit very high values ofIGC-measured γ d
s . To highlight a possible relationship between γ ds values and the
nanomorphology index, we plotted (Fig. 3) the variation of γ ds versus the variation
of the nanomorphology index for three families of solids.Indeed, a clear correlation between the γ d
s values and the index of morphologyis observed for carbon blacks, for grinded muscovite samples, and for clays,demonstrating that a high value of γ d
s , when measured using IGC-DI, is relatedto insertion phenomena of n-alkane probes. Nonetheless, it was observed recentlyin the laboratory that abnormally high γ d
s values, determined on iron oxides, are

IGC and Solid Surfaces 159
TABLE 2 Morphology Index for Some Powders
Te MB 25 DMH Ref.
Aerosil (A130)a 100 100Precipitated silica 72.9 90 20H-kenyaite 0.6 2.1 20H-magadiite 0.02 0.09 19Talc 13.7 40.9 44Muscovite — 50–60 12Illite 11 to 23 26 to 58 11Kaolinite 7 to 19 39 to 53 11
a By definition.
not systematically related to such insertion phenomena. Ionic solids having semi-conductive superficial properties also lead to such abnormal γ d
s values. These lastconsiderations highlight the importance of the knowledge of the surface charac-teristics of the solid itself on the interpretation of thermodynamic values calcu-lated from IGC-DI results, keeping in mind that the fundamental equation ofIGC-DI totally ignores surface heterogeneity. Therefore, the problem to be solvedis to estimate the level of heterogeneity of a solid: IGC at finite concentrationconditions (IGC-FC) may held promise of a solution.
FIG. 3 Evolution of the γ ds values with the index of nanomorphology (Im) for three fami-
lies of solids: carbon blacks, grinded muscovite samples, and clays.
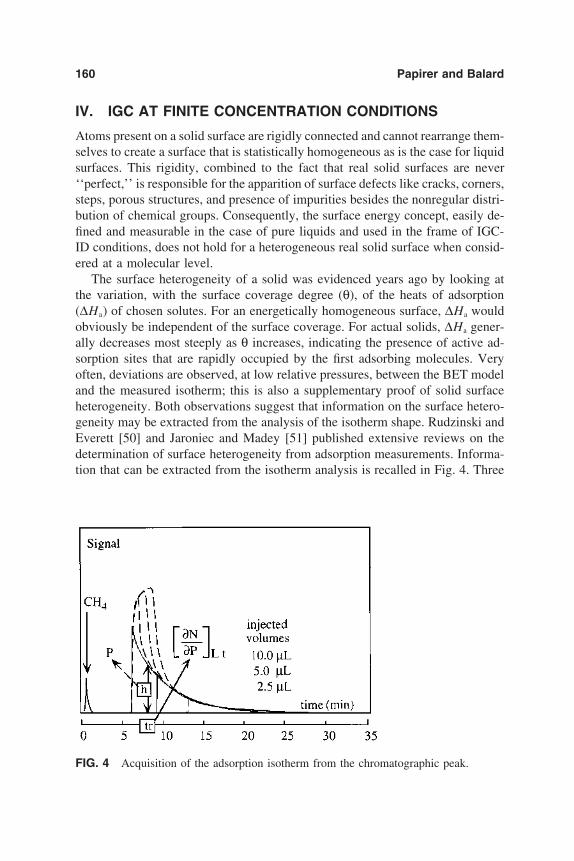
160 Papirer and Balard
IV. IGC AT FINITE CONCENTRATION CONDITIONS
Atoms present on a solid surface are rigidly connected and cannot rearrange them-selves to create a surface that is statistically homogeneous as is the case for liquidsurfaces. This rigidity, combined to the fact that real solid surfaces are never‘‘perfect,’’ is responsible for the apparition of surface defects like cracks, corners,steps, porous structures, and presence of impurities besides the nonregular distri-bution of chemical groups. Consequently, the surface energy concept, easily de-fined and measurable in the case of pure liquids and used in the frame of IGC-ID conditions, does not hold for a heterogeneous real solid surface when consid-ered at a molecular level.
The surface heterogeneity of a solid was evidenced years ago by looking atthe variation, with the surface coverage degree (θ), of the heats of adsorption(∆Ha) of chosen solutes. For an energetically homogeneous surface, ∆Ha wouldobviously be independent of the surface coverage. For actual solids, ∆Ha gener-ally decreases most steeply as θ increases, indicating the presence of active ad-sorption sites that are rapidly occupied by the first adsorbing molecules. Veryoften, deviations are observed, at low relative pressures, between the BET modeland the measured isotherm; this is also a supplementary proof of solid surfaceheterogeneity. Both observations suggest that information on the surface hetero-geneity may be extracted from the analysis of the isotherm shape. Rudzinski andEverett [50] and Jaroniec and Madey [51] published extensive reviews on thedetermination of surface heterogeneity from adsorption measurements. Informa-tion that can be extracted from the isotherm analysis is recalled in Fig. 4. Three
FIG. 4 Acquisition of the adsorption isotherm from the chromatographic peak.

IGC and Solid Surfaces 161
main techniques can be used for the experimental acquisition of an adsorptionisotherm in the case of a powder: volumetric measurement, the most widely usedmethod; gravimetric measurement; and IGC-FC. We prefer IGC-FC.
A. Acquisition of the Adsorption IsothermsUsing IGC-FC
Different IGC exploitation possibilities for the determination of adsorption iso-therms have been reviewed by Conder [7]. The simplest and the most efficientone, from the point of view of the analysis duration, is the elution characteristicpoint (ECP) method, which allows the acquisition of a part of the desorptionisotherm from a unique chromatographic peak. Using this method, the first deriva-tive of the adsorption isotherm can be readily calculated starting from the reten-tion times and the signal height of characteristic points taken on the diffuse de-scending front of the chromatogram as shown in Fig. 5. The first derivative ofthe adsorption isotherm is obtained according to the following equation:
∂N∂P
JDt′rmRT
(16)
where N is the number of absorbed molecules, P the pressure of the probe at theoutput of the column, t′r the net retention time of a characteristic point on the
FIG. 5 Exploitation of chromatographic peaks using the elution characteristic pointmethod.

162 Papirer and Balard
rear diffuse profile of the chromatogram, J the James-Martin coefficient thatallows correction of data for gas compression in the column, D the output flowrate, and m the mass of adsorbent in the column.
An alternative method that calls on the same equation consists of measurementof the retention times of the chromatographic peaks corresponding to increasinginjected solute amounts. This method is, of course, highly time consuming be-cause a chromatographic experiment has to be done for each point of the wantedisotherm. Furthermore, it is not necessarily more accurate because of the unavoid-able slight variations of experimental conditions from one analysis to anotherover a long period.
Whatever the chosen method, the experimental conditions have to be carefullycontrolled in order to obtain a physically meaningful first derivative of the iso-therm. In particular, one must pay special attention to the analysis temperature,which should be chosen so that the contribution of the probe to the total flowrate can be considered negligible, i.e., less than 5% at the maximum chromato-graphic peak. On the other hand, the injected amount has to be sufficient in orderto reach coverage ratios corresponding to the monolayer domains—a requiredcondition for the calculation of the main isotherm characteristics using BET the-ory. Finally, the shape analysis of the calculated isotherm will also lead to adsorp-tion energy distribution functions that may be considered as fingerprints of thesurface heterogeneity and that may be used, for the sake of comparison, for thestudy of the influence of physical or chemical treatments on the solid’s surfaceheterogeneity as will be seen below.
B. Thermodynamic Quantities Calculated fromthe Isotherms
From the adsorption isotherm, it is possible to compute the specific surface areaand the BET constant for an organic probe and, by linearization of the initialpart of the isotherm, the Henry constant becomes available. Table 3 gathers thevalues of the Henry and BET constants and of the specific surface areas, deter-mined from the IGC desorption isotherms, using four different probes, on a pyro-genic silica HDK-S13 (Wacker):
n-Heptane, an apolar moleculeBenzene, a weak basic moleculeHexamethyldisiloxane (HMDS), a weak basic and sterically hindered moleculePropanol-2, which can exchange strong hydrogen bonds with the silanol groups
From this table, it is worth pointing out that
1. The specific surface area, which gives essentially texture information, is quiteindependent from the nature of the probe, taking into account that the exact

IGC and Solid Surfaces 163
TABLE 3 Molecular Section (A), Specific SurfaceArea (S), BET, and Henry’s Constants (C)
Amol Sspe CHenry
Probes (A2)a (m2/g) CBET (µmol/Pa)
n-Heptane 54 119 5 0.85Benzene 42 110 7 0.99HMDS 84b 130 29 0.29Propanol-2 37 132 180 3.10
a Average molecular area from Ref. 52.b Calculated from the nitrogen BET surface.HMDS, hexamethyldisiloxane.
value of the molecular areas of the adsorbed probes are not well known and,moreover, that they vary with the physicochemical properties of the solidsurface itself [52].
2. The BET constant, which leads to information about the interaction capacityof the solid surface at high surface coverage ratio, increases with the specificinteraction capacity and with the molar mass of the probe. Therefore, a lowvalue is observed for n-heptane and a high one for propanol-2.
3. Henry’s constant, which is related to the interaction capacity at very lowcoverage ratios, follows the increasing order of the polarity of the probes.
Knowing two adsorption isotherms at two close temperatures [53], the isostericheat of adsorption of a probe can be calculated. Its variation with the coverageratio gives a first evaluation of the surface heterogeneity, as pointed out earlier,but the determination of the distribution function of the adsorption energies bringsmore information on this important characteristic of the solid surface.
C. Estimation of the Solid’s Surface HeterogeneityUsing Adsorption Energy Distribution Functions
All approaches described in the literature for the estimation of the distributionfunctions of the adsorption energies are based on a physical model that supposesthat an energetically heterogeneous surface, with a continuous distribution ofadsorption energies, may be described in simple terms as a series of homogeneousadsorption patches. Hence, the amount of adsorbed molecules (probes) is givenby the following integral equation:
N(Pm, Tm) N0 εmax
εmin
θ(ε, Pm, Tm) χ (ε)dε (17)

164 Papirer and Balard
where: N(Pm, Tm) is the number of molecules adsorbed at pressure Pm and temper-ature Tm of measurement, N0 is the number of molecules needed for the formationof a monolayer, θ(ε, Pm, Tm) is the local isotherm (generally the Langmuir iso-therm), ε the adsorption energy of a site, and χ(ε) is the distribution function(DF) of the sites seen by the probe. The range of adsorption energies is includedbetween minimal (εmin) and maximal (εmax) values.
From a mathematical point of view, solving the former integral equation isnot a trivial task because there is no general solution. The simplest way to solvethis equation is to admit the condensation approximation χCA (DFCA) insteadof the Langmuir isotherm as kernel of the integral equation. The condensationapproximation supposes that the sites of adsorption of given energy are unoccu-pied below a characteristic pressure and entirely occupied above it. DFCA isdirectly related to the first derivative of the isotherm, which can be computedeasily from the desorption profile of the chromatographic peak.
This approximation is all the better as the temperature of measurement ap-proaches absolute zero. But at the usual chromatographic measurement tempera-ture, we are far away from those conditions. Then the actual distribution functioncan be approached using various calculation techniques [50,51,54–56]. One ofthem, the extended approximation of Rudzinski-Jagiello [57], supposes theknowledge of the even derivatives of the DFAC, which may be determined usingFourier transforms. This procedure provides an efficient way to separate the sig-nal from the experimental noise [58].
D. Examples of Distribution Functions of theAdsorption Energies: Influence of the Nature ofthe Probe on the Distribution Function Shape
The reduced adsorption isotherms of n-heptane, benzene, HMDS, and propanol-2 on a pyrogenic silica HDK-S13 from Wacker are plotted in Fig. 6. It is seenthat the more polar probe induces the highest curvature of the recorded isotherms.From the first derivative of these adsorption isotherms, the adsorption distributionfunctions were calculated according to the extended Rudzinski-Jagiello approxi-mation.
Figure 7 displays the distribution functions of the adsorption energies calcu-lated for the n-heptane, benzene, the HMDS, and propanol-2 chromatographicpeaks measured on silica HDK-S13. Only the distribution function (FD) of propa-nol-2 is clearly bimodal. This bimodality suggests that the HDK-S13 silica sur-face is not energetically homogeneous but exhibits two types of domains. Thefirst type is rich in siloxane bridges and correlatively poor in silanol groups. Itis possibly related to the peak centered around 18 kJ/mol, which is relativelynarrow because of the weak variation of dispersive interaction with the chemicalnature of the solid surface. The second type is rich in silanol groups that interact
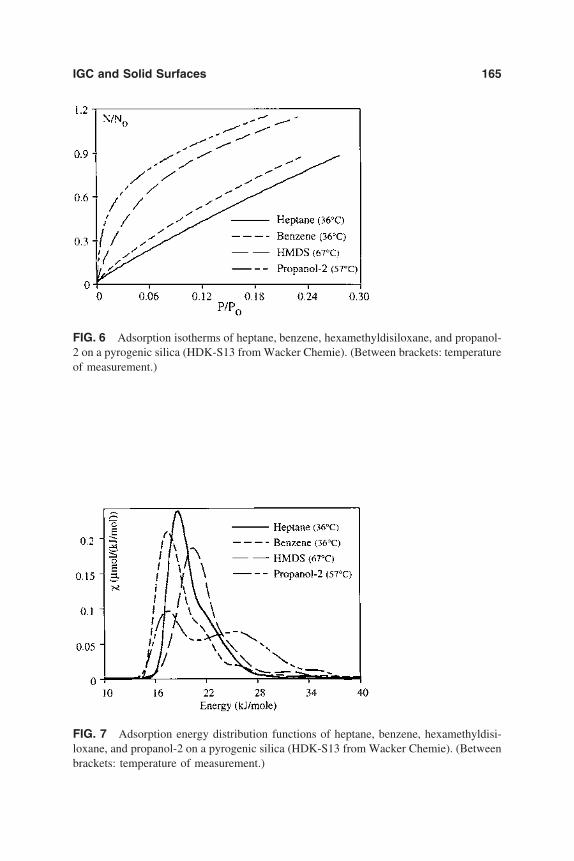
IGC and Solid Surfaces 165
FIG. 6 Adsorption isotherms of heptane, benzene, hexamethyldisiloxane, and propanol-2 on a pyrogenic silica (HDK-S13 from Wacker Chemie). (Between brackets: temperatureof measurement.)
FIG. 7 Adsorption energy distribution functions of heptane, benzene, hexamethyldisi-loxane, and propanol-2 on a pyrogenic silica (HDK-S13 from Wacker Chemie). (Betweenbrackets: temperature of measurement.)

166 Papirer and Balard
mainly through hydrogen bonds leading to higher energies of interaction. There-fore, the broad peak centered around 22 kJ/mol is attributed to this type of adsorp-tion site. Its width is obviously related to the large range of silanol group environ-ments that can take place on a silica surface.
Less interactive probes, like n-heptane, HMDS, or benzene, which interactwith the surface mainly through dispersives forces, always lead to almost mono-modal distribution functions (see silica DF in Ref. 59), sometimes showing ashoulder in the high-energy part of the FD. This lack of selectivity is again tobe attributed to the lack of sensitivity of the dispersive forces, comparatively tothe polar forces toward the solid surface. One may conclude that such probes donot give much information on the surface heterogeneity of a solid.
This is true when the surface heterogeneity is mainly related to the local varia-tion of the chemical composition and structure that is in a short range from thepoint of view of the molecular size. However, n-heptane, HMDS, and benzenemay become interesting probes for the study of a solid exhibiting surface hetero-geneity on a larger scale. Such long-range heterogeneity may, for instance, stemfrom the crystalline structure and are encountered in the case of lamellar productssuch as talc [59] or ground mica samples [60]. Here we may speak about ‘‘macro-heterogeneity,’’ which is due to the presence of both basal and lateral surfacescorresponding to much higher dimensions in comparison with the probe size.The fact that lateral surfaces are generally largely more interactive than basalones leads to bimodal distribution functions. This long-range heterogeneity doesnot exclude a concomitant short-range heterogeneity on both basal and especiallyon the lateral surfaces that is not as well defined as the former. An example ofsuch a distribution function that permits the estimation of the lateral/basal surfacearea ratio is shown in Fig. 8 for a grinded muscovite sample.
Another way to increase the surface heterogeneity is to substitute part of thesurface chemical functions by noninteractive groups such as aliphatic groups. Inthe case of silica, this modification can be easily performed by a partial andcontrolled surface silylation of the silanol groups with trimethylchlorosilane. Thedistribution function of such trimethylsilylated silica is displayed in Fig. 9 andcompared with that of the initial unmodified silica. Comparison with the distribu-tion function recorded on the initial silica shows that the partial silylation leadsto the emergence of a second peak in the lower energy domain. By partial silyla-tion, some silylated domains become much larger than the probe itself and thisleads to surface structures with a significantly lower interaction potential withthe HMDS probe. Additional examples that highlight the great interest of thismethod for the evaluation of clays [61] or carbon blacks can be found in theliterature.
IGC-FC, combined with IGC-ID measurements, seems to be a very promisingmethod to improve our level of knowledge of solid surface interaction capacities.Nevertheless, this method has certain limitations.

IGC and Solid Surfaces 167
FIG. 8 Adsorption energy distribution functions of n-octane on a grinded muscovitesample.
FIG. 9 Comparison of adsorption energy distribution functions of hexamethyldisiloxane,at 57°C, on an initial (HDK-S13) silica and on a partially trimethylsilylated sample (1.0TMS/nm2).

168 Papirer and Balard
V. ADVANTAGES AND LIMITATIONS OF IGC
IGC presents advantages. When the column is prepared, i.e., when the supportof interest has been adequately conditioned and introduced in the column (anoperation that is not always evident), then the measurements are rapid, usuallyreproducible, and accurate. The conditioning of the column under inert gas flowallows one to prepare surfaces freed from adsorbed gases and volatile pollutants.Moreover, solids may be modified in situ with adequate chemicals just beforebeing characterized again. In addition, carrier gases with known amounts of hu-midity may be prepared, permitting examination of the alteration of the adsorp-tion process of chosen probes. This is most important because divided solidsoften operate in the presence of humidity in actual applications. Since the experi-ments are rapid, series of probes may be selected to explore, at the molecularlevel, the surface peculiarities of a solid surface. Furthermore, the amounts ofsolute injected may be precisely controlled. In other terms, when injecting minoramounts, at the limit of detection, we are operating at infinite dilution conditions.This is a rather unique possibility of performing physicochemical measurementsat true infinite dilution conditions, for which the theories are usually established.For the surface characterization of a solid support we see also advantages becausethe very few adsorbed probe molecules will be separated from each other, thusavoiding complications of interpretation due to lateral interactions between ad-sorbed neighboring solutes. On the other hand, we may inject known quantitiesof solutes sufficient to entirely cover the solid’s surface providing complementaryinformation such as adsorption energy distribution functions. Finally, as previ-ously mentioned, the solid acting as the chromatographic support may be chemi-cally modified inside the column or heat-treated, without return to the atmospherebefore renewed control. Last but not least, the IGC equipment needed to performthose evaluations is available in most laboratories. Indeed, the number of situa-tions that may be analyzed using IGC is impressive depending on the skill andimagination of the person applying it.
The limitations of IGC are twofold: the necessity to select volatile probesand nonvolatile stationary phases withstanding the GC temperature conditions.In addition, difficulties of interpretation of complex IGC peaks (tailing due tononideality of the chromatographic process) may also show up and need specialconsideration. Even so, for difficult situations (solids of low surface area, solidsof high morphological or energetic heterogeneities) it is worth trying IGC inorder to learn more about the interaction potential of those solids.
VI. CONCLUSION
The application of IGC for the characterization of solid surfaces has been ex-plored since the early 1960s. IGC at finite concentration was then used to deter-mine principally adsorption isotherms that were exploited for the calculation of
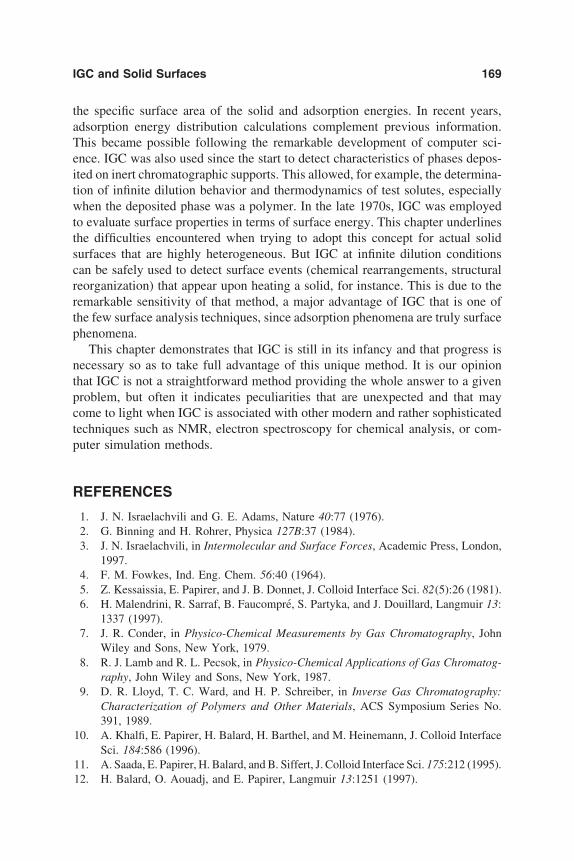
IGC and Solid Surfaces 169
the specific surface area of the solid and adsorption energies. In recent years,adsorption energy distribution calculations complement previous information.This became possible following the remarkable development of computer sci-ence. IGC was also used since the start to detect characteristics of phases depos-ited on inert chromatographic supports. This allowed, for example, the determina-tion of infinite dilution behavior and thermodynamics of test solutes, especiallywhen the deposited phase was a polymer. In the late 1970s, IGC was employedto evaluate surface properties in terms of surface energy. This chapter underlinesthe difficulties encountered when trying to adopt this concept for actual solidsurfaces that are highly heterogeneous. But IGC at infinite dilution conditionscan be safely used to detect surface events (chemical rearrangements, structuralreorganization) that appear upon heating a solid, for instance. This is due to theremarkable sensitivity of that method, a major advantage of IGC that is one ofthe few surface analysis techniques, since adsorption phenomena are truly surfacephenomena.
This chapter demonstrates that IGC is still in its infancy and that progress isnecessary so as to take full advantage of this unique method. It is our opinionthat IGC is not a straightforward method providing the whole answer to a givenproblem, but often it indicates peculiarities that are unexpected and that maycome to light when IGC is associated with other modern and rather sophisticatedtechniques such as NMR, electron spectroscopy for chemical analysis, or com-puter simulation methods.
REFERENCES
1. J. N. Israelachvili and G. E. Adams, Nature 40:77 (1976).2. G. Binning and H. Rohrer, Physica 127B:37 (1984).3. J. N. Israelachvili, in Intermolecular and Surface Forces, Academic Press, London,
1997.4. F. M. Fowkes, Ind. Eng. Chem. 56:40 (1964).5. Z. Kessaissia, E. Papirer, and J. B. Donnet, J. Colloid Interface Sci. 82(5):26 (1981).6. H. Malendrini, R. Sarraf, B. Faucompre, S. Partyka, and J. Douillard, Langmuir 13:
1337 (1997).7. J. R. Conder, in Physico-Chemical Measurements by Gas Chromatography, John
Wiley and Sons, New York, 1979.8. R. J. Lamb and R. L. Pecsok, in Physico-Chemical Applications of Gas Chromatog-
raphy, John Wiley and Sons, New York, 1987.9. D. R. Lloyd, T. C. Ward, and H. P. Schreiber, in Inverse Gas Chromatography:
Characterization of Polymers and Other Materials, ACS Symposium Series No.391, 1989.
10. A. Khalfi, E. Papirer, H. Balard, H. Barthel, and M. Heinemann, J. Colloid InterfaceSci. 184:586 (1996).
11. A. Saada, E. Papirer, H. Balard, and B. Siffert, J. Colloid Interface Sci. 175:212 (1995).12. H. Balard, O. Aouadj, and E. Papirer, Langmuir 13:1251 (1997).

170 Papirer and Balard
13. H. Balard, A. Saada, J. Hartmann, O. Aouadj, and E. Papirer, Makromol. Chem.,Makromol Symposia, 108:63 (1996).
14. C. Kemball and E. K. Rideal, Proc. Roy. Soc. A 187:53 (1948).15. G. Ligner, A. Vidal, H. Balard and E. Papirer, J. Colloid Interface Sci. 134:486
(1990).16. E. Papirer, H. Balard, A. P. Legrand, L. Facchini, and H. Hommel, Chromatographia
23:639 (1987).17. E. Papirer, H. Balard, and M. Sidqi, J. Colloid Interface Sci. 169:238 (1993).18. G. M. Dorris and D. G. Gray, J. Colloid Interface Sci. 77:353 (1980).19. H. Hadjar, H. Balard, and E. Papirer, Colloids Surf. 99:45 (1995).20. G. Ligner, A. Vidal, H. Balard, and E. Papirer, J. Colloid Interface Sci. 133:200
(1989).21. J. Jagiello and E. Papirer, J. Colloid Interface Sci. 142:232 (1991).22. Z. Kessaissia and E. Papirer, J. Chim. Phys. 75:709 (1974).23. E. Papirer, H. Balard, J. Jagiello, R. Baeza, and F. Clauss, in Chemically Modified
Surfaces, A. Mottola and J. R. Steimetz (eds.), Elsevier, Amsterdam, 1992, p.334.24. J. Kuczinski and E. Papirer, Eur. Polym. J., 27:653 (1991).25. E. Papirer, J. M. Perrin, B. Siffert, and G. Philipponneau, J. Phys. III:697 (1991).26. E. Papirer, A. Eckhardt, F. Muller, and J. Yvon, J. Mat. Sci., 25:5109 (1990).27. E. Brendle and E. Papirer J. Colloid Interface Sci. (in preparation).28. C. Lansinger, Ph.D. thesis, Mulhouse, 1990.29. F. M. Fowkes and M. A. Mostafa, Ind Eng. Chem. 17:3 (1978).30. R. G. Pearson, J. Am. Chem. Soc. 110:7684 (1988).31. R. S. Drago and B. Wayland, J. Amer. Chem. Soc. 87:3571 (1965).32. V. Gutmann, in The Donor–Acceptor Approach to Molecular Interactions, Plenum
Press, New York, 1978.33. M. J. Kamlet and R. W. Taft, J. Am. Chem. Soc. 98:377 (1976).34. P. Mukhopadhyay and H. P. Schreiber, Colloids Surf. 100:47 (1995).35. M. J. Marmo, M. Mostafa, H. Jinnal, F. M. Fowkes, and J. A. Manson, Ind. Eng.
Chem. Prod. Res. Dev. 15:206 (1976).36. E. Papirer, in Composite Interfaces, Elsevier, New York, to appear in 1998.37. J. H. Park and Y. C. Weon, Anal. Sci. 12:733 (1996).38. C. Saint Flour and E. Papirer, J. Colloid Interface Sci. 91:69 (1983).39. M. Chehimi and E. Pigois-Landureau, J. Mat. Sci. 47:41 (1994).40. J. B. Donnet, S. J. Park, and H. Balard, Chromatographia 31:434 (1991).41. S. Dong, M. Brendle, and J. B. Donnet, Chromatographia 28:85 (1989).42. J. Schultz, L. Lavielle, and C. Martin, J. Adhesion 23:45 (1987).43. E. Brendle and E. Papirer, J. Colloid Interface Sci. 194:217 (1997).44. H. Balard and E. Papirer, Progr. Org. Coat. 22:1 (1993).45. E. Papirer and H. Balard, in Adsorption and Chemisorption on Inorganic Sorbents
(A. Dabrovski and T. Tertykh, eds.), Elsevier, Amsterdam, 1995, pp. 479–502.46. G. Ligner, M. Sidqi, J. Jagiello, H. Balard, and E. Papirer, Chromatographia 29:35
(1990).47. J. B. Donnet and E. Custodero, Carbon 30(5):813 (1992).48. H. Balard, M. Sidqi, E. Papirer, J. B. Donnet, A. Tuel, H. Hommel, and A. P. Le-
grand, Chromatographia 25:707 (1988).
IGC and Solid Surfaces 171
49. H. Barthel, M. Heinemann, L. Rosch, and J. Weiss, Proc. Eurofillers 95, Mulhouse,France, 1995.
50. W. Rudzinski and D. H. Everett, Adsorption of Gases on Heterogeneous Surfaces,Academic Press, London, 1992.
51. M. Jaroniec and R. Madey, Physical Adsorption on Heterogeneous Solids, Elsevier,Amsterdam, 1988.
52. A. L. McClellan and H. F. Harnsberger, J. Colloid Interface Sci. 23:577 (1967).53. Z. Kessaissia, E. Papirer, and J. B. Donnet, J. Colloid Interface Sci. 82(2):526
(1981).54. M. V. Szombathely, P. Brauer, and M. Jaroniec, J. Comput. Chem. 13(1):17 (1992).55. J. Jagiello, Langmuir 10:2778 (1994).56. N. M. Nederlof, W. H. Riemsdjik, and K. Koopal, J. Colloid Interface Sci. 135(2):
410 (1991).57. J. Jagiello and J. A. Schwarz, J. Colloid Interface Sci. 146(2):415 (1991).58. H. Balard, Langmuir 13:1260 (1997).59. H. Balard, A. Saada, J. Hartmann, O. Aouadj, and E. Papirer, Makromol. Chem,
Makromol. Symp. 108:63 (1996).60. H. Balard, O. Aouadj, and E. Papirer, Langmuir 13:1251 (1997).61. H. Balard, A. Saada, B. Siffert, and E. Papirer, Langmuir 13:1256 (1997).


5Chromatography of ColloidalInorganic NanoparticlesCHRISTIAN-HERBERT FISCHER Department of Solid State Physics,Hahn-Meitner-Institut Berlin, Berlin, Germany
I. Introduction 174
II. Size Exclusion Chromatography 174A. Size determination 175B. Comparing transmission electron microscopy and size
exclusion chromatography 190C. Concentration effects in size exclusion chromatography of
colloidal inorganic nm particles 195D. Memory effect 195E. Investigation of the electrical double layer on nm particles by
size exclusion chromatography 198F. Kinetics 202G. On-line optical spectroscopy 205H. Preparative size exclusion chromatography for monodisperse
nm particles 212I. General considerations for establishing size exclusion
chromatography conditions for colloidal inorganic nm particles 215
III. Hydrodynamic Chromatography 216A. Classical hydrodynamic chromatography 216B. Wide-bore hydrodynamic chromatography 218
IV. Optical Chromatography 219
V. Comparison of Different Methods for Size Analysis of nm Particles 222
References 224
173

174 Fischer
I. INTRODUCTION
Dispersed particles can exist as colloids because repulsion by surface chargesor steric effects prevent coagulation and flocculation. Inorganic particles in thenanometer (nm) size regime are interesting for several reasons. Colloidal silicais commercially applied as a protection colloid, inorganic binder, and for flameprotection. Iron oxide colloids can be used in medicine as contrast medium fornuclear spin tomography. Semiconductor particles have a potential in solar en-ergy conversion, and applications in electronics are being discussed. Finally,over the last 15 years so-called Q particles of semiconductors and metals in thelower nm size regime have become a rapidly growing topic of physicochemicalresearch in their own right because of their extraordinary properties, such as size-dependent optical absorption or fluorescence (size quantization or Q effect; seebelow Sec. II.G.1). These investigations are closely connected with the namesof Henglein, Brus, and others [1].
For all applications, control of particle size is crucial. Several methods existfor its determination. The classical method for size determination is transmissionelectron microscopy (TEM). It provides a direct image that can be measured.However, there are also disadvantages, such as lengthy sample preparation andmeasurement, tedious particle measuring and counting (if no image processingis available), possible radiation damage to the objects in the TEM itself [2], andrather bad statistics. There is a need for fast methods, especially when unstable(i.e., rapidly growing) colloidal particles are under investigation.
II. SIZE EXCLUSION CHROMATOGRAPHY
Since Porath and Flodin [3] and Moore [4] introduced crosslinked dextran (1959)and polystyrene gels (1964), respectively, size exclusion chromatography (SEC)has become a standard method for molar weight determination of dissolved or-ganic polymers. Also, size separation of organic particles, e.g., latex, has beenwidely used. Though aqueous SEC is well studied [5] and polymer ferric hydrox-ide nitrate was already investigated by SEC in 1966 [6], inorganic compounds[7] have been characterized much less frequently than organic ones and especiallyinorganic particles have been rarely analyzed until the research on Q particlesintensified. Reasons might be lack of such materials and problems with adsorptionat the stationary phase.
SEC works with porous column packings. The sample particles are passedwith the mobile phase along the packing surface. If they are not excluded fromthe pores, they are able to enter them (Fig. 1). The smaller they are, the deeperthey can diffuse and the longer they stay in the stagnant liquid without forwardmotion. As a consequence, smaller particles elute later than larger ones. All ana-lytes leave the column between the elution of the interstitial volume (excluded

Chromatography of Colloidal Inorganic Nanoparticles 175
FIG. 1 Mechanism of size exclusion chromatography (SEC). Separation within a singlepore. (Modified from Ref. 8.)
species) and the elution of the total permeation volume (smallest species). Theo-retical treatment of SEC can be found, e.g., in Tijssen and Bos [8].
A. Size Determination
1. Silica, Polysilicic Acid, SiloxanesIn 1970, Tarutani described the application of SEC to the study of the polymeriza-tion of monosilicic acid [9]. The separation was carried out on Sephadex G25or G100, respectively, with 0.1 mol/L NaCl/H2O as eluent adjusted with HCl topH 2. Fractions were taken and the content of silicic acid determined colorimetri-cally with the molybdate reagent after conversion of polysilicic acid to the mono-mer. Hamielec and Singh [10] published a general study of axial dispersion phe-nomena in chromatography of suspensions. Colloidal organic and silica particleswere investigated; material and particle size of the column packing as well asflow rates were varied. The eluent consisted of Aerosol OT as anionic surfactantand potassium nitrate, both at a concentration of 1 g/L. Figure 2 shows a calibra-tion plot of log diameter versus elution volume, which resembles those of dis-solved organic polymers concerning the linear relationship in a certain range.Remarkably, in this universal calibration, the values for materials as different assilica, polystyrene (PS), styrene-methacrylic acid copolymer (SMA), and butadi-ene-acrylonitrile (BD/AN) copolymer lay more or less on the same curve. Thiswas due to a rather low ionic strength and the fact that the stationary phase sawthe same surface of adsorbed surfactant molecules for all kinds of colloidal parti-cles. (Here ‘‘universal calibration’’ is not used in the same sense Benoit used it.Dispersed rigid inorganic particles do not affect viscosity.) The chromatographicpeak was considered as Gaussian and its variance was taken as a direct measureof axial dispersion. The variance increased with flow rate and with particle size.
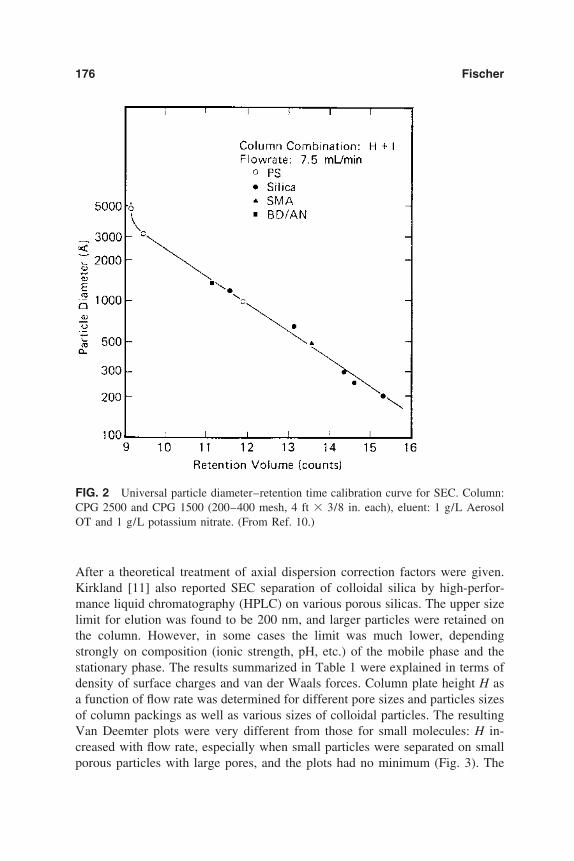
176 Fischer
FIG. 2 Universal particle diameter–retention time calibration curve for SEC. Column:CPG 2500 and CPG 1500 (200–400 mesh, 4 ft 3/8 in. each), eluent: 1 g/L AerosolOT and 1 g/L potassium nitrate. (From Ref. 10.)
After a theoretical treatment of axial dispersion correction factors were given.Kirkland [11] also reported SEC separation of colloidal silica by high-perfor-mance liquid chromatography (HPLC) on various porous silicas. The upper sizelimit for elution was found to be 200 nm, and larger particles were retained onthe column. However, in some cases the limit was much lower, dependingstrongly on composition (ionic strength, pH, etc.) of the mobile phase and thestationary phase. The results summarized in Table 1 were explained in terms ofdensity of surface charges and van der Waals forces. Column plate height H asa function of flow rate was determined for different pore sizes and particles sizesof column packings as well as various sizes of colloidal particles. The resultingVan Deemter plots were very different from those for small molecules: H in-creased with flow rate, especially when small particles were separated on smallporous particles with large pores, and the plots had no minimum (Fig. 3). The
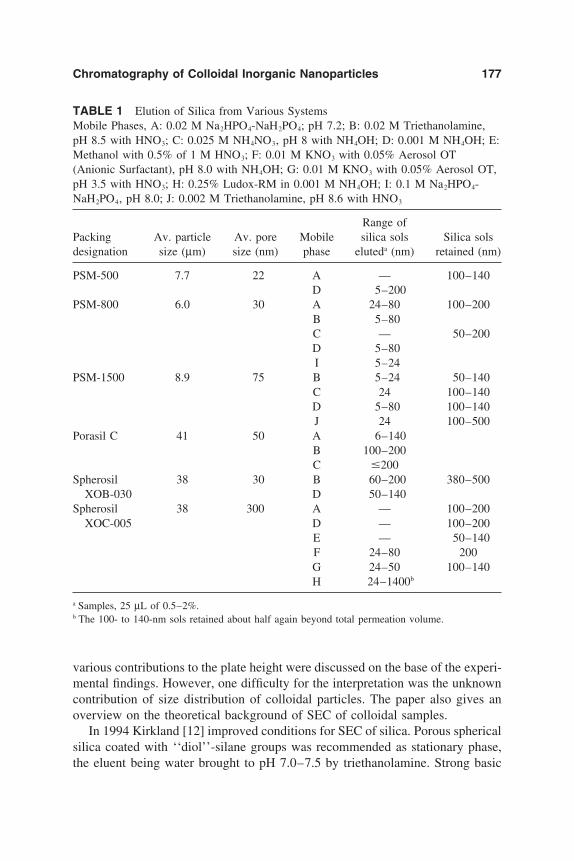
Chromatography of Colloidal Inorganic Nanoparticles 177
TABLE 1 Elution of Silica from Various SystemsMobile Phases, A: 0.02 M Na2HPO4-NaH2PO4; pH 7.2; B: 0.02 M Triethanolamine,pH 8.5 with HNO3; C: 0.025 M NH4NO3, pH 8 with NH4OH; D: 0.001 M NH4OH; E:Methanol with 0.5% of 1 M HNO3; F: 0.01 M KNO3 with 0.05% Aerosol OT(Anionic Surfactant), pH 8.0 with NH4OH; G: 0.01 M KNO3 with 0.05% Aerosol OT,pH 3.5 with HNO3; H: 0.25% Ludox-RM in 0.001 M NH4OH; I: 0.1 M Na2HPO4-NaH2PO4, pH 8.0; J: 0.002 M Triethanolamine, pH 8.6 with HNO3
Range ofPacking Av. particle Av. pore Mobile silica sols Silica solsdesignation size (µm) size (nm) phase eluteda (nm) retained (nm)
PSM-500 7.7 22 A — 100–140D 5–200
PSM-800 6.0 30 A 24–80 100–200B 5–80C — 50–200D 5–80I 5–24
PSM-1500 8.9 75 B 5–24 50–140C 24 100–140D 5–80 100–140J 24 100–500
Porasil C 41 50 A 6–140B 100–200C 200
Spherosil 38 30 B 60–200 380–500XOB-030 D 50–140
Spherosil 38 300 A — 100–200XOC-005 D — 100–200
E — 50–140F 24–80 200G 24–50 100–140H 24–1400b
a Samples, 25 µL of 0.5–2%.b The 100- to 140-nm sols retained about half again beyond total permeation volume.
various contributions to the plate height were discussed on the base of the experi-mental findings. However, one difficulty for the interpretation was the unknowncontribution of size distribution of colloidal particles. The paper also gives anoverview on the theoretical background of SEC of colloidal samples.
In 1994 Kirkland [12] improved conditions for SEC of silica. Porous sphericalsilica coated with ‘‘diol’’-silane groups was recommended as stationary phase,the eluent being water brought to pH 7.0–7.5 by triethanolamine. Strong basic

178 Fischer
FIG. 3 Plate height versus mobile phase velocity plots for porous silica microspherecolumn with 30-nm pores. Column: PSM-800 (6 µm), 10 0.85 cm, mobile phase: 0.001mol/L NH4OH; sample 6.9 µL 2% 6 nm silica sol (Ludox-RB) and 5 mg/mL acetone.(From Ref. 11.)
or acidic mobile phases should be avoided, as negatively charged surfaces resultin ion exclusion effects, and positively charged ones in irreversible retention ofthe negatively charged colloids. Under these conditions silica particles with diam-eters larger than 60 nm were irreversibly retained. The Rf method was suggestedto improve the precision of the measurement, i.e., an internal standard such aspotassium dichromate is added and the ratio of its retention time to that of thecolloid is used.
Burgy and Calzaferri [13] separated spherical silsesquioxanes (HSiO3/2)n(n 8–18) abbreviated as HT8-HT18 with diameters between 0.96 and 1.64 nm bySEC on PLGel (5-µm, 5-nm pore size) with toluene or hexane (Fig. 4). In additionto the preparative fractionation, these species were used as test cases for the hard-sphere solute SEC retention theory [14]. The radii of the various silsesquioxaneswere calculated as follows:

Chromatography of Colloidal Inorganic Nanoparticles 179
FIG. 4 Comparison of chromatograms of silsesquioxanes (HSiO3/2)n obtained on PLGel,(pore size 5 nm) with hexane. Product synthesized in benzene (top), in toluene (bottom).Abbreviations: numbers n HTn (HSiO3/2)n, P Polymer, S solvent. Peaks onand to the right of the dashed line belong to the solvent. (From Ref. 13.)
VR V0 KSECVi (1)
where VR is retention volume; V0 is moving volume of the mobile phase; KSEC
is equilibrium constant for the SEC process, representing the ratio of the averagesolute concentration in the pores to that outside the pores, and Vi is stagnantvolume of the mobile phase.
The following distribution coefficients Ke for pores of different geometricalshape were used:
Ke (1 r/ac)2 for cylindrical pores (2)
Ke (1 2r/3as)3 for spherical pores (3)
Ke exp (2r/ae) for random plane pores (4)

180 Fischer
TABLE 2 Values for the Equilibrium Constants andCalculated and Structural Molecular Radii (A)
Molecule KSEC r rstruct
HT8 0.7237 3.7 4.8HT10 0.6614 4.7 5.5HT12 0.5968 5.7 6.1HT14 0.5425 6.6 6.8HT16 0.4952 7.4 7.5HT18 0.4559 8.1 8.2
where ac, as, ae are the radii of the pore types, and rf is the radius of a solutemolecule. Neglecting surface effects Ke equals KSEC. The resulting radii assumingcylindrical pores with ac 2.5 nm were in good agreement with the radii rstruct
from geometrical construction (Table 2). The reverse procedure, calculation ofthe pore sizes from rstruct and KSEC also for other pore shapes [Eqs. (3) and (4)]showed best fit with the expected 2.5 nm for cylindrical pores (Table 3). Finally,it should be mentioned that SEC can be used for studies of sol-gel processes,e.g., controlled hydrolysis of tetraethyl orthosilicate [15].
2. Cadmium SulfideSize exclusion chromatography of nanoparticles has been used more frequentlywith the developments in the field of Q particles. Many of the latter are relativelystable only in the presence of complex forming stabilizers, e.g., polyphosphates,polyvinyl alcohol, alkanethiols, etc., which cover the surface and protect it againstdirect contact with other particles. This mostly prevents coagulation and precipi-tation. However, these bonds to the surface are usually not very strong, so thatcomplexes are in equilibrium with free ligands. In a chromatographic process theligands would be separated from the particles resulting in a destabilization of the
TABLE 3 Values of the Pore Radii (A), Calculatedfrom rstruct and KSEC
Molecule ac as ae
HT8 32.1 31.3 29.7HT10 29.4 28.5 26.6HT12 26.8 25.7 23.6HT14 25.8 24.6 22.2HT16 25.3 23.9 21.3HT18 25.2 23.7 20.9

Chromatography of Colloidal Inorganic Nanoparticles 181
colloid. Particle combination would lead to alteration; in the worst case, grownparticles would be filtered off by the column. Furthermore, the free particle sur-face is often very active, so that reversible or even irreversible adsorption at thecolumn material can occur, disturbing the pure SEC mechanism. In contrast towater-soluble organic polymers, this problem can be solved only partially byadding electrolytes to the eluent because colloids are quite sensitive to high ionicstrength (their protective electrical double layer would collapse, leading to precip-itation). Therefore other approaches were suggested, such as the addition of stabi-lizer to the mobile phase and nonpolar stationary phases. The first separations ofQ particles were carried out by Fischer et al. [16,17] with CdS colloids by low-pressure chromatography on Sephacryl gel S200S300S500, the mobile phasebeing 6 103 mol/L sodium polyphosphate (referring to the phosphate units)and 1 103 mol/L cadmium perchlorate in water. Optical detection operatedat 250 nm, where CdS particles have the same extinction coefficient regardlessof their size.
For colloid chemists the diameter is more conspicuous and useful than themolar weight because the particles are rigid and do not swell or shrink as polymercoils do. Therefore, analogous expressions as in polymer chemistry were used:weight average diameter dw, number average diameter dn, and diameter polydis-persity Dd [Eq. (5)–(9)]:
dw ∑nidiwi/∑niwi (5)
wi d 3i (6)
dw ∑nid4i /∑nid
3i (7)
dn ∑nidi/∑ni (8)
Dd dw/dn (9)
where ni number of particles in class interval i with diameter di and weightwi.
In order to calibrate the system several colloid samples of different particlesize and narrow size distribution were injected onto the SEC column. At the sametime they were investigated by TEM to determine the weight average diametersdw. In Fig. 5, top, the overlay chromatograms of seven CdS colloids are presented.From retention times and TEM diameters, a typical semilogarithmic calibrationplot log d f(t) was obtained as shown in Fig. 5, bottom. Afterward the columncan be used for the size analysis of unknown colloids of the same material.
The time scale of the method only allows analysis of quite stable or slowlygrowing samples [17]. Moreover, the Sephacryl gel bed becomes compressedwith use, leading to changing calibrations. These arguments encouraged testswith HPLC, especially with wide-pore silica, because of its good mechanical

182 Fischer
FIG. 5 (top) Low-pressure chromatograms of seven CdS colloids used for calibration.Conditions: column, Sephacryl S200, S300, and S500; eluent, 1 mol/L Cd(ClO4)2, 6 mol/L sodium polyphosphate. (bottom): Calibration of the system. Mean particle diameter wasdetermined by TEM. (From Ref. 17.)
stability. The surface activity of bare silica resulting in peak tailing was stronglyreduced by alkyl-modified silica such as Nucleosil C4 or C18. For the same sizeregime of CdS particles, packings with larger pores were recommended (50 100 nm) [27]. From the normalized chromatograms in Fig. 6 the influence of theeluent composition can be seen [18]: The same CdS colloid was injected fourtimes onto the same column combination (Nucleosil C4 500 Nucleosil C4 1000,7 µm) using the following mobile phases:

Chromatography of Colloidal Inorganic Nanoparticles 183
FIG. 6 Optimization of the eluent. Normalized chromatograms of the same aqueous CdSsol (stabilizer polyphosphate) on Nucleosil 500C4 Nucleosil 1000C4 (7 µm) with fourdifferent eluent compositions: water, water with 1 mmol/L polyphosphate (PP), water with1 mmol/L Cd(ClO4)2 (Cd2), water with 1 mmol/L Cd(ClO4)2 plus 6 mmol/L polyphos-phate (Cd2/PP). Only the time range between 2.5 and 4.7 min is shown. Elution fromleft to right. (From Ref. 18.)
1. H2O2. Sodium polyphosphate (6 103 mol/L) /H2O(‘‘PP’’)3. Cd(ClO4)2 (1 103 mol/L) /H2O (‘‘Cd2’’)4. Sodium polyphosphate (6 103 mol/L), Cd(ClO4)2 (1 103 mol/L) /
H2O (‘‘Cd2/PP’’)
With water many CdS particles coagulated during the passage due to the lossof stabilizer, indicated by a second peak at earlier retention time. WithCd(ClO4)2/H2O the situation was even worse: Most of the particles were eitherirreversibly adsorbed at the stationary phase or were coagulated and filtered off.The bad recovery was evident from the low signal-to-noise ratio. Ions adsorbedat the surface of the colloidal particles decreased net surface charge and loweredstabilizing repulsion. In the presence of the stabilizer polyphosphate one largelate peak eluted. It is known from the preparation of CdS colloids that smallerspecies are formed with an excess of cadmium ions over sulfide ions. Also in

184 Fischer
SEC the addition of some Cd(ClO4)2 to the polyphosphate let a second peakappear at longer retention time and improved the resolution. Therefore this eluentcomposition became the standard and for other colloidal sulfides the perchlorateof the relevant cation was used.
Calibration of the system was carried out by means of TEM as describedfor low-pressure SEC. Figure 7 shows chromatograms and calibration plot. Thefollowing advantages are obvious as compared to the Sephacryl separations (Fig.
FIG. 7 (top) HPLC chromatograms of four CdS samples with narrow size distribution.Conditions: column, Nucleosil 500C4 Nucleosil 1000C4 (7 µm), eluent: water with 6mmol/L sodium polyphosphate and 1 mmol/L Cd(ClO4)2. (bottom). Calibration plot from11 CdS samples, the histograms of which were determined by TEM. (From Ref. 27.)

Chromatography of Colloidal Inorganic Nanoparticles 185
5): The peaks are more symmetrical and narrower, resulting in a higher resolution,and the reduction of the analysis time from 80 min to 4 min allows the investiga-tion of very unstable colloids. It was checked that particles leave the columnunchanged. Only very small CdS particles of about 1.3 nm grew during the pas-sage through the C4 column, whereas the same material outside the column re-mained unchanged [18]. In the diode array detector the eluted colloid showed anabsorption spectrum shifted by about 30 nm to longer wavelengths, indicating aparticle growth (size quantization effect; see below). The growth seemed to becatalyzed by nonmodified silanol groups on the packing surface. This effect didnot occur on a C18 stationary phase, where the silica is better shielded. Inorganiccolloidal particles can also be stabilized by organic compounds (e.g., alkanethi-ols) and then behave like organics with respect to solubility [19]. In these cases,bare silica columns were recommended in order to avoid nonpolar interactions[18]. For SEC of CdS stabilized in such a way the eluent consisted of the particu-lar thiol and Cd(ClO4)2, both in a concentration of 1 mmol/L in tetrahydrofuran(THF) (Fig. 8). It should be mentioned that negative peaks can occur at the reten-tion time of the alkanethiol if a sample contains less thiol than the mobilephase [19].
3. Zinc SulfideAqueous ZnS stabilized with polyphosphate was separated under analogous con-ditions to CdS on Nucleosil C4 (7 µm), pore size 50 nm and 100 nm [18]. The
FIG. 8 Chromatograms of four CdS sols (solid lines) of various particle sizes in tetrahy-drofuran with dodecanethiol as stabilizer. Columns: Nucleosil 500 Nucleosil 1000;eluent 1 mM CdClO4/1 mmol/L dodecanethiol/THF. Dotted line: dodecanethiol. (FromRef. 1.)

186 Fischer
eluent consisted of an aqueous solution of sodium polyphosphate (6 mmol/L)and Zn(ClO4)2 (1 mmol/L). Figure 9 gives the calibration plot for ZnS and CdS.The scattering of the ZnS data is due to the occurrence of two crystal shapes.For a better fit, form factors have to be used. One can clearly see that calibrationdepends strongly on the material probably due to different surface charges.
4. Ferric Hydroxides Nitrates and Magnetic FluidsIn 1966 particles of polymer ferric hydroxide nitrate between 6 and 12 nm wereseparated from low molecular compounds by SEC [7]. Nunes et al. reported thefractionation of commercial magnetic fluids by SEC on Sepharose C1-4B 200.They found a change of magnetic properties as a function of particle size [20,21].
5. Gallium ArsenideGallium arsenide is a semiconductor with very good transport properties and istherefore of great industrial interest. Colloidal nm particles of GaAs prepared byKher and Wells [22] were fractionated by SEC on silica with 10- and 30-nmpore size, the mobile phase being methanol with 1 mmol/L LiCl. The colored
FIG. 9 SEC calibration for ZnS and CdS colloids on Nucleosil 500C4 Nucleosil1000C4. Eluent: water with 6 mmol/L sodium polyphosphate and 1 mmol/L Zn(ClO4)2
or Cd(ClO4)2, respectively. (From Ref. 18.)
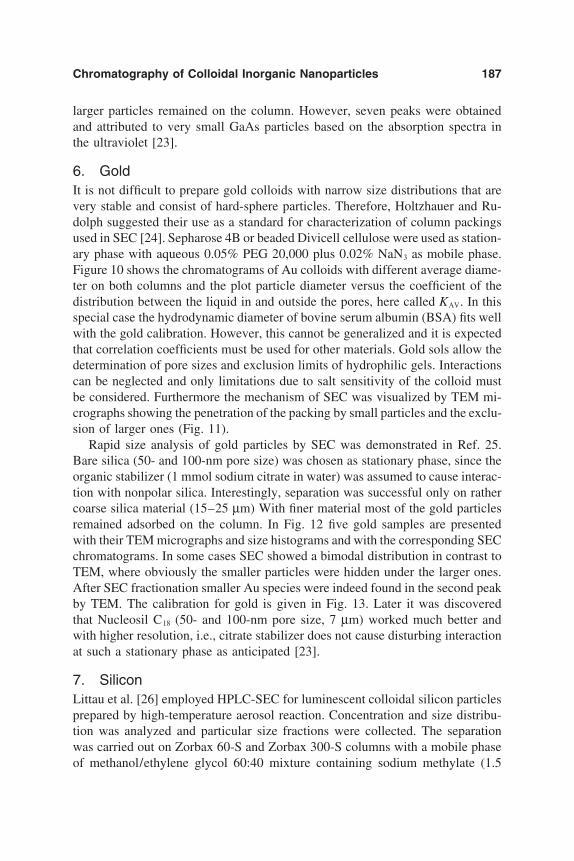
Chromatography of Colloidal Inorganic Nanoparticles 187
larger particles remained on the column. However, seven peaks were obtainedand attributed to very small GaAs particles based on the absorption spectra inthe ultraviolet [23].
6. GoldIt is not difficult to prepare gold colloids with narrow size distributions that arevery stable and consist of hard-sphere particles. Therefore, Holtzhauer and Ru-dolph suggested their use as a standard for characterization of column packingsused in SEC [24]. Sepharose 4B or beaded Divicell cellulose were used as station-ary phase with aqueous 0.05% PEG 20,000 plus 0.02% NaN3 as mobile phase.Figure 10 shows the chromatograms of Au colloids with different average diame-ter on both columns and the plot particle diameter versus the coefficient of thedistribution between the liquid in and outside the pores, here called KAV. In thisspecial case the hydrodynamic diameter of bovine serum albumin (BSA) fits wellwith the gold calibration. However, this cannot be generalized and it is expectedthat correlation coefficients must be used for other materials. Gold sols allow thedetermination of pore sizes and exclusion limits of hydrophilic gels. Interactionscan be neglected and only limitations due to salt sensitivity of the colloid mustbe considered. Furthermore the mechanism of SEC was visualized by TEM mi-crographs showing the penetration of the packing by small particles and the exclu-sion of larger ones (Fig. 11).
Rapid size analysis of gold particles by SEC was demonstrated in Ref. 25.Bare silica (50- and 100-nm pore size) was chosen as stationary phase, since theorganic stabilizer (1 mmol sodium citrate in water) was assumed to cause interac-tion with nonpolar silica. Interestingly, separation was successful only on rathercoarse silica material (15–25 µm) With finer material most of the gold particlesremained adsorbed on the column. In Fig. 12 five gold samples are presentedwith their TEM micrographs and size histograms and with the corresponding SECchromatograms. In some cases SEC showed a bimodal distribution in contrast toTEM, where obviously the smaller particles were hidden under the larger ones.After SEC fractionation smaller Au species were indeed found in the second peakby TEM. The calibration for gold is given in Fig. 13. Later it was discoveredthat Nucleosil C18 (50- and 100-nm pore size, 7 µm) worked much better andwith higher resolution, i.e., citrate stabilizer does not cause disturbing interactionat such a stationary phase as anticipated [23].
7. SiliconLittau et al. [26] employed HPLC-SEC for luminescent colloidal silicon particlesprepared by high-temperature aerosol reaction. Concentration and size distribu-tion was analyzed and particular size fractions were collected. The separationwas carried out on Zorbax 60-S and Zorbax 300-S columns with a mobile phaseof methanol/ethylene glycol 60:40 mixture containing sodium methylate (1.5

188 Fischer
FIG. 10 SEC of colloidal gold on (A) Divicell (beaded cellulose) and (B) Sepharose4B (beaded agarose); eluent: water containing 0.05% PEG 20,000 and 0.02% NaN3. Elu-tion profiles for the respective gold sols: thick solid lines, Au (14 nm); dashed lines, Au(10 nm); thin dotted lines, Au (4 nm). Vo, elution volume for blue dextran 2000 (voidvolume); BSA, elution volume for bovine serum albumin; V t, elution volume for DNP-Ala (total volume). (C) Plot of Kav versus particle diameter for colloidal gold on Divicell(circles, solid line) and Sepharose 4B (triangles, dotted line). Square respective hydro-dynamic diameter and Kav values for BSA, run on the same column. (From Ref. 24.)

Chromatography of Colloidal Inorganic Nanoparticles 189
FIG. 11 TEM (original magnification 58,000) of partial exclusion of larger particles(mean diameter 14 nm) from Divicell beads (A) and complete penetration of colloidalgold (mean diameter 4 nm) in the matrix (B). (C) schematic representation of A and B,respectively. The rectangles illustrate the cut of the surface area of cellulose beads asshown in A and B. Bars represent 200 nm. (From Ref. 24.)
mmol/L) and tetrabutylammonium bromide (0.1 mol/L). It was assumed that thebase ionizes the surface hydroxyl groups on both the colloidal particles and thepacking, preventing adsorption. When ionic strength was lower, poor resolutionand low pore volume was observed because of a thick electrical double layer(see below) and ionic repulsion between particles and stationary phase. Sodiumpolystyrene sulfonate standards of different molar weight were injected underthe same conditions and the equivalent hard-sphere diameter of each polymerwas used for calibration [14]. In Fig. 14 the separation of a Si colloid with threesize populations is shown.

190 Fischer
FIG. 12 Electron micrographs, histograms of size distribution obtained by TEM, andchromatograms obtained by monitoring the absorption of different gold sols at 520 nm.Conditions: column, Nucleosil 500 and Nucleosil 1000 (15–25 µm); eluent: 1 mmol/Lsodium citrate in water. Scale bar 20 nm. (From Ref. 25.)
B. Comparing Transmission Electron Microscopyand Size Exclusion Chromatography
1. Average Size and Size DistributionIn order to compare the results of SEC with those of TEM, colloids were mea-sured by both methods [27]. Figure 15 shows the electron micrographs and theSEC size distributions as well as the distribution histograms of two CdS samples.
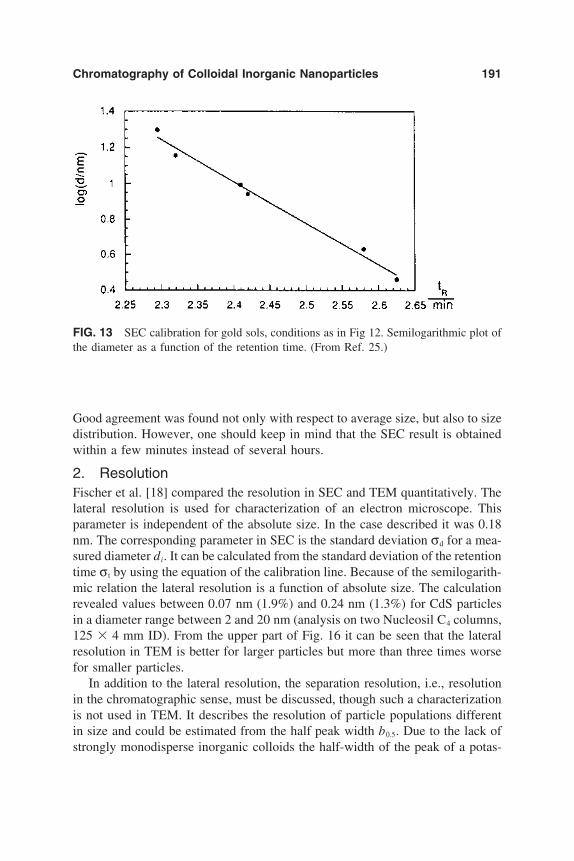
Chromatography of Colloidal Inorganic Nanoparticles 191
FIG. 13 SEC calibration for gold sols, conditions as in Fig 12. Semilogarithmic plot ofthe diameter as a function of the retention time. (From Ref. 25.)
Good agreement was found not only with respect to average size, but also to sizedistribution. However, one should keep in mind that the SEC result is obtainedwithin a few minutes instead of several hours.
2. ResolutionFischer et al. [18] compared the resolution in SEC and TEM quantitatively. Thelateral resolution is used for characterization of an electron microscope. Thisparameter is independent of the absolute size. In the case described it was 0.18nm. The corresponding parameter in SEC is the standard deviation σd for a mea-sured diameter di. It can be calculated from the standard deviation of the retentiontime σ t by using the equation of the calibration line. Because of the semilogarith-mic relation the lateral resolution is a function of absolute size. The calculationrevealed values between 0.07 nm (1.9%) and 0.24 nm (1.3%) for CdS particlesin a diameter range between 2 and 20 nm (analysis on two Nucleosil C4 columns,125 4 mm ID). From the upper part of Fig. 16 it can be seen that the lateralresolution in TEM is better for larger particles but more than three times worsefor smaller particles.
In addition to the lateral resolution, the separation resolution, i.e., resolutionin the chromatographic sense, must be discussed, though such a characterizationis not used in TEM. It describes the resolution of particle populations differentin size and could be estimated from the half peak width b0.5. Due to the lack ofstrongly monodisperse inorganic colloids the half-width of the peak of a potas-
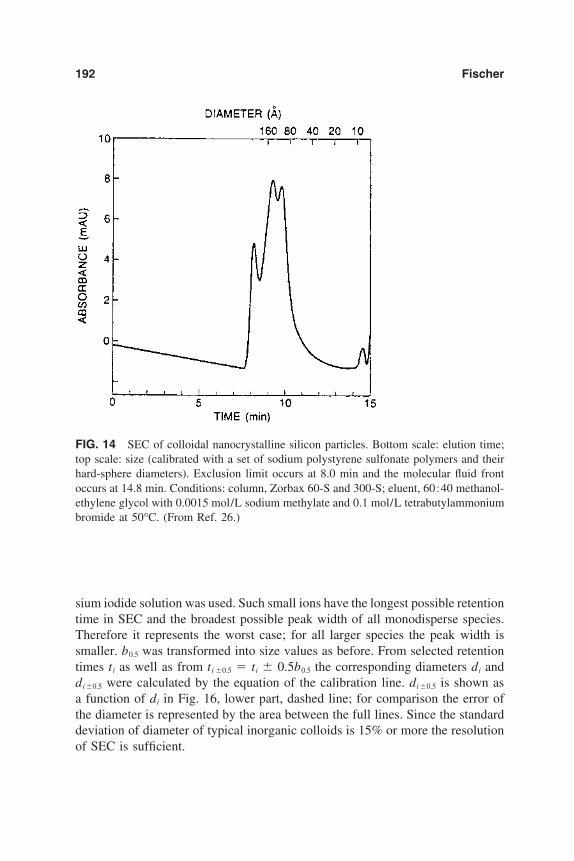
192 Fischer
FIG. 14 SEC of colloidal nanocrystalline silicon particles. Bottom scale: elution time;top scale: size (calibrated with a set of sodium polystyrene sulfonate polymers and theirhard-sphere diameters). Exclusion limit occurs at 8.0 min and the molecular fluid frontoccurs at 14.8 min. Conditions: column, Zorbax 60-S and 300-S; eluent, 60:40 methanol-ethylene glycol with 0.0015 mol/L sodium methylate and 0.1 mol/L tetrabutylammoniumbromide at 50°C. (From Ref. 26.)
sium iodide solution was used. Such small ions have the longest possible retentiontime in SEC and the broadest possible peak width of all monodisperse species.Therefore it represents the worst case; for all larger species the peak width issmaller. b0.5 was transformed into size values as before. From selected retentiontimes ti as well as from ti 0.5 ti 0.5b0.5 the corresponding diameters di anddi 0.5 were calculated by the equation of the calibration line. di 0.5 is shown asa function of di in Fig. 16, lower part, dashed line; for comparison the error ofthe diameter is represented by the area between the full lines. Since the standarddeviation of diameter of typical inorganic colloids is 15% or more the resolutionof SEC is sufficient.

Chromatography of Colloidal Inorganic Nanoparticles 193
FIG. 15 TEM micrographs of two samples of colloidal CdS (left). Integral and differen-tial size distributions from SEC (right, upper part). Mass distributions of the two samples,obtained by TEM and SEC, respectively. (From Ref. 27.)

194 Fischer
FIG. 16 Resolution of TEM and SEC as a function of particle diameter. Aqueous CdSsols (stabilizer polyphosphate) on Nucleosil 500C4 Nucleosil 1000C4. (top) Absoluteand relative lateral resolution in ELMI and absolute and relative standard deviation of themeasured diameter in SEC as a function of the diameter. (bottom) Lateral and separationresolution in SEC as a function of di. The full lines enclose the area between diσ anddiσ. The area inbetween the dotted lines is limited by ti 0.5 and ti 0.5. (From Ref. 18.)

Chromatography of Colloidal Inorganic Nanoparticles 195
C. Concentration Effects in Size ExclusionChromatography of Colloidal Inorganic nmParticles
In preparative SEC experiments with colloids it was found that recovery de-creased with increasing sample concentration [28]. Fischer and Siebrands investi-gated the concentration effects in analytical scale SEC of CdS by dilution experi-ments [29]. They found that recovery was good up to CdS concentrations of 5mmol/L but dropped dramatically above 10 mmol/L CdS (Fig. 17, top). Thisloss was primarily due to the higher concentration of the accompanying electro-lytes present from the colloid preparation [Eq. (10)]. A higher ionic strengthdestabilizes colloids leading
Cd(ClO4)2 H2S →Na-polyphosphate
CdS 2HClO4 (10)
to irreversible and reversible adsorption at the stationary phase. The reversibleadsorption became evident from increasing peak width and tailing. Fortunately,no preferential adsorption of certain particle sizes was found on reinjection. Wheninstead of water a solution of all electrolytes present in the original sample (poly-phosphate and perchloric acid) was used for dilution of a concentrated colloid,the CdS peak area was almost proportional to the CdS concentration (Fig. 17,bottom), but the recovery was generally lower than for samples diluted with wa-ter. In other words, particle concentration has practically no effect on recovery.These findings on adsorption of inorganic colloids in a flow system are in agree-ment with previous results obtained by Freundlich et al. [30] and Buzagh [31]on stationary experiments with iron trioxide and arsenic trisulfide on silica, re-spectively. They found adsorption to be independent of particle concentration aslong as the ionic strength was constant. The effect of sample concentration onthe retention time was not very strong. However, when water was used for dilu-tion both particle and electrolyte concentrations were changed and retention in-creased with increasing concentration due to decreasing thickness of the electricaldouble layer (see below). When the electrolyte concentration was kept constant,retention decreased with increasing particle concentration, probably because ofweak and reversible agglomeration. No comparable effect was observed on silicawith small pores (Nucleosil 120 C4), where adsorption should be predominantover any SEC mechanism.
D. Memory Effect
Closely connected to the adsorption described in the previous chapter is a memoryeffect of the column generally referred to as conditioning which is extraordinarilypronounced in this case [29]. When the same sample was injected five times onextensively purged Nucleosil C4 columns, the CdS peak area increased by about

196 Fischer
FIG. 17 SEC of a CdS sol at different concentrations (conditions: column, Nucleosil500C4 Nucleosil 1000C4 (7 µm); eluent, water with 6 mmol/L sodium polyphosphateand 1 mmol/L Cd(ClO4)2). (top) A 12 mM CdS sol stepwise diluted with water. Area() and half-width () of the CdS peak as a function of the CdS concentration. Thedifference area () is the loss of CdS calculated as the difference between the area curveand its extrapolated initial slope. (bottom) A 12 mM CdS sol stepwise diluted with (a)water (), (b) 72 mM polyphosphate (), or (c) 72 mM polyphosphate/24 mM perchloricacid () solutions. Normalized CdS peak area (referring to the peak area of the undilutedoriginal sample). (From Ref. 29.)

Chromatography of Colloidal Inorganic Nanoparticles 197
10% to a plateau, i.e., the surface of the packing was more and more coveredby a CdS layer, which had a lower surface activity than the original C4-silica.This adsorption was proved by injections of methanol–water mixtures. They wet-ted the C4 phase and enhanced desorption resulting in an eluting peak that showsthe typical CdS absorption spectrum in the diode array detector.
The pronounced memory effect was also demonstrated in a dilution experi-ment of a CdS colloid where ionic strength was kept constant (Fig. 18). Theseries was injected twice, once in increasing order of CdS concentration and oncein decreasing order. Between both series the column was purged extensively.Whenever the same sample saw a cleaner column packing, the peak area wassmaller than in the case of a stationary phase covered by CdS. This effect wasmost dramatic for the most diluted samples, where the relative loss was up to50%.
FIG. 18 Memory effect of the column. SEC of a CdS sol (12 mmol/L) stepwise dilutedwith a polyphosphate/perchloric acid solution 2 mmol/L and 24 mmol/L, respectively.(conditions: column, Nucleosil 500C4 Nucleosil 1000C4 (7 µm); eluent, water with 6mmol/L sodium polyphosphate and 1 mmol/L Cd(ClO4)2). Order of injection: increasingconcentration (); decreasing concentration (). Before each series the column waspurged extensively. Peak area as a function of CdS concentration. (From Ref. 29.)

198 Fischer
E. Investigation of the Electrical Double Layer on nmParticles by Size Exclusion Chromatography
1. TheoryAt all interfaces between a charged solid phase and a liquid phase containingelectrolytes, a so-called electrical double layer is formed by the charge of thesurface and that of dissolved counterions being concentrated toward the interface.SEC of particles is strongly affected by this phenomenon. On the other hand,SEC offers a unique tool for its investigation and visualization. In the field oforganic polymers the influence of ionic strength on chromatographic behaviorhas been widely discussed [32–38]. Theoretical considerations about electrostaticdouble layer interactions for spherical colloids in cylindrical pores were publishedby Smith and Deen [39,40].
In analogy to the Debye-Huckel model, the Gouy-Chapman model describesthe potential distribution by combining the Boltzmann distribution of energy andthe Poisson equation, which describes the relation between potential and chargedensity [41]. For a flat surface the potential Ψ at a distance x from the interfaceis given by
Ψ ΨOeκx (11)
where ΨO is the potential at x 0. For a spherical surface (with radius a) thepotential distribution is given as a function of the radial coordinate, r, by
Ψ Ψa(a/r) eκ(ar) (12)
In both equations, parameter κ is
κ (8 πnz2e2/ εkT)0.5 (13)
with number of ions n, their valency z, elemental charge e, dielectric constant ε,Boltzmann constant k, and temperature T. Equation (12) is valid as long as theproduct a κ is not much larger than unity.
From Eqs. (12) and (13) the electrical potential as a function of the distancefrom the surface and its dependence on electrolyte valency and concentration canbe calculated. The potential Ψ drops to Ψ0/e at distance x 1/κ, which is calledthe thickness of the diffuse double layer, or Debye length. 1/κ is dependent onthe ionic strength J (which is J 0.5∑ z 2
i mi, with mi, the molarity of the ions):
1/κ J0.5 (14)
For dilute electrolyte solutions the thickness of the double layer, 1/κ, is in therange of 103–102 nm, for more concentrated ones about 1–101 nm.
One could say that colloidal particles wear a coat of ions that is thinner thehigher the ionic strength. For the stability of colloids this double layer is essentialas its repulsion avoids direct contact of surfaces with the same charge, which

Chromatography of Colloidal Inorganic Nanoparticles 199
would lead to coagulation or adsorption. Therefore, high ionic strengths destabi-lize colloids. It has been shown in chromatography of polyelectrolytes that thedouble layer is quite rigid. Its influence on SEC is striking. An effective particlesize dp,eff has to be considered, which is the sum of particle core diameter dp andtwice the double layer thickness ddl. In other words, the colloidal peak elutesearlier than expected for the core size due to repulsion between particles plussurrounding ions and the packing.
2. Retention Time Dependence of ElectrolyteConcentration in the Mobile Phase
When nanoparticles migrate through the SEC column, they are immediately sepa-rated from the small ions present in the sample and are surrounded by the eluentwith given electrolyte content. Thus Fischer and Kenndler [42] brought colloidalCdS particles in media of well-defined ionic strengths and observed the resultingchange of dp ,eff in terms of retention time. Figure 19, top, shows chromatogramsof a CdS sol (average size 5.7 nm) obtained on the same column combination,whereby NaCl was added at concentrations from 3 mmol/L to 30 mmol/L tothe standard eluent (1 mmol/L Cd(ClO4)2, 6 mmol/L sodium polyphosphate).Increasing retention times were found with increasing ionic strength together withdecreasing recovery due to irreversible particle adsorption at the stationary phase(the double layer also acts as a protection coat against adsorption at the packing).Unchanged size of eluting particles was checked by reinjection and several fac-tors indicated that the eluting particles were not much affected by adsorption.When MgSO4 was added to the mobile phase instead of NaCl, retention timesincreased much more quickly (Fig. 19, center). This was in accordance with the-ory [Eq. (14)] predicting an inverse proportionality between 1/κ and z2 (valency).
3. Comparison of the Chromatographically MeasuredDouble-Layer Thickness with the Debye Length
Since the SEC system was calibrated under standard conditions for CdS corediameters by TEM, a calibration for the effective particle size dp ,eff was necessary.The retention times of the same CdS sol increased with increasing salt concentra-tion in the eluent and reached saturation at about 20 to 25 mmol/L NaCl (Fig.19, middle). The similarity to the dependence of the Debye length on electrolyteconcentration can be seen from Fig. 19, bottom. The ionic strength of the standardeluent was determined to be J 8 mmol/L. For ionic strengths about 30 mmol/L 1/κ is still about 1.8 nm (Fig. 19, bottom). Therefore the following approxima-tion was made: When the retention time no longer increases with increasing ionicstrength, the effective particle size dp ,eff equals the core diameter dp plus 1.8 nmfor the double-layer thickness in this concentration range. Thus a calibration plotwas constructed from dp plus 1.8 nm and the particular maximum retention timescorresponding to the plateau for several CdS samples (Fig. 20). The linear fit in

200 Fischer

Chromatography of Colloidal Inorganic Nanoparticles 201
FIG. 20 SEC calibration for particle core diameters dp and effective diameters dp,eff ofCdS sols on Nucleosil 500C4 plus Nucleosil 1000C4. Full triangles: Standard calibration.Diameter of the particle core dp, determined by TEM as a function of retention time withstandard eluent composition (1 mM Cd(ClO4)2/6 mM sodium polyphosphate). Open trian-gles: effective diameters dp,eff as a function of the plateau retention time tmax in Fig. 19,center, obtained with NaCl added to the standard eluent in high concentration (typicalionic strength of the eluent J 0.03 M). dp,eff was calculated from the diameter of theparticle dp, determined from SEC under standard conditions (standard calibration basedon TEM) plus 1.8 nm, the theoretical Debye length 1/κ for an ionic strength J 0.03M. These samples were different from those for standard calibration. Both retention timeswere obtained under different conditions (with and without NaCl in the eluent). (FromRef. 42.)
FIG. 19 Effect of electric double layer on SEC of colloidal particles. SEC of a CdS sol(average size 5.7 nm) on Nucleosil 500C4 Nucleosil 1000C4 with the standard eluent(1 mM Cd(ClO4)2/6 mM sodium polyphosphate) containing various salt concentrations.(top) Chromatograms obtained with standard eluent containing NaCl from 0 mM to 30mM. (center) Retention time as a function of salt concentration for CdS sols of variousparticle size. NaCl (open symbols), MgSO4 (full symbols). For comparison the retentiontimes of colloid 3 on Nucleosil 120C4 are given (small triangles). (bottom) Debye length1/κ as a function of ionic strength for an 1:1 electrolyte. (From Ref. 42.)

202 Fischer
FIG. 21 Effective particle diameter dp,eff for CdS sols of different particle size, chromato-graphically determined in the standard eluent (1 mM Cd(ClO4)2/6 mM sodium polyphos-phate) with and without NaCl or MgSO4 addition as a function of the reciprocal squareroot of ionic strength J according to Eq. (14). For the ionic strength J0 of the standardeluent a value of 8 mM was taken. Details in the text. (From Ref. 42.)
the plot dp,eff versus J0.5 was good proof that the retention time shift was due tothe changing electric double layer. Only the values at highest ionic strengthsseemed to be influenced by adsorption (Fig. 21). Potschka described similar be-havior of polystyrene latex beads [36]. In Fig. 22 experimental values for ddl atvarious particle core diameters were compared with the Debye length for selectedionic strengths. The agreement over a wide range revealed that at least in thiscase 1/κ can be used in the estimation of the effective particle size dp,eff in SEC.
F. Kinetics
1. Particle GrowthAs already mentioned, small nm particles are thermodynamically unstable andhave the tendency to grow. There are two mechanisms. In the case of Ostwaldripening [Eqs. (15) and (16)] smaller particles dissolve preferentially and the ionsprecipitate on larger particles, leading to gradual growth. Particle combination[Eq. (17)] results in a very sudden increase in diameter.
Ostwald ripening
(CdS)m → (CdS)m1 Cd2 S2 (15)

Chromatography of Colloidal Inorganic Nanoparticles 203
FIG. 22 Experimentally determined double-layer thickness ddl of CdS particles as afunction of the particle size dp for various ionic strengths. (From Ref. 42.)
(CdS)n Cd2 S2 → (CdS)n1 (16)
typically n m
Particle combination
(CdS)m (CdS)n → (CdS)mn (17)
The short analysis times of HPLC-SEC meant that the rapid growth of 2-nm CdSparticles could be investigated [27]. The chromatograms of a colloid just afterpreparation and at various stages of aging are shown in Fig. 23, top. From thediameters corresponding to the peaks, from peak heights and growth time a three-dimensional diagram was constructed (Fig. 23, bottom). One recognizes the de-crease of the initial population without pronounced change in size. The new popu-lation, significantly larger, initially exhibited a sudden increase in size indicatingparticle combination. Since the final growth was more gradual, it was concludedthat Ostwald ripening was then the predominant mechanism.
2. PhotocorrosionSize exclusion chromatography is very useful for photolysis studies of colloidalsemiconductor particles under different conditions, e.g., under oxygen or inertgas [19] or on exposure to light of different wavelengths [27]. For example, CdSparticles partially dissolve when they are illuminated under air due to oxidationto CdSO4. In an irradiation experiment using light with wavelengths 390 nm,the chromatograms of Fig. 24 were obtained. The original CdS sample had two

204 Fischer
FIG. 23 Thermal aging of small CdS particles. (top) Chromatograms after differentaging times. Conditions: column, Nucleosil 500C4 Nucleosil 1000C4 (7 µm), eluent:water with 6 mmol/L sodium polyphosphate and 1 mmol/L Cd(ClO4)2. Dashed line: zeroline of chromatogram. (bottom) Three-dimensional diagram showing the height of thepeaks in the chromatograms and the corresponding diameters as a function of time. (FromRef. 27.)

Chromatography of Colloidal Inorganic Nanoparticles 205
FIG. 24 Chromatograms of a CdS sample at various times of illumination with λ 390 nm. Conditions: column, Nucleosil 500C4 Nucleosil 1000C4 (7 µm), eluent: waterwith 6 mmol/L sodium polyphosphate and 1 mmol/L Cd(ClO4)2. Detection, absorbanceat 250 nm. Dashed line: zero line of chromatogram. (From Ref. 27.)
size populations, but only the larger particles were dissolved. The small particlesof the second peak were not affected because they do not absorb light of suchlong wavelengths (see Sec. II.G.1).
G. On-Line Optical Spectroscopy
1. Q EffectParticles of semiconductors in the low-nm size regime change their optical ab-sorption spectra with diameter. This behavior, known as quantum size effect orQ effect [43], is explained in terms of the band gap between valence band andconductivity band. The bandwidth depends on the number of molecules the crys-tal is formed of, since it determines the number of electronic states overlappingto a band (Fig. 25). As a consequence, smaller crystallites have a larger bandgap and therefore start absorbing light at shorter wavelengths than larger crystalli-tes or macrocrystals. It should be stressed that these nanoparticles really changecolor with size, e.g., 2-nm CdS particles are almost colorless! This is no effectof scattering; species of that size practically do not scatter light anymore. Chro-matographic separation according to size is extremely useful for basic researchin the field of these new materials especially when coupled with optical spectros-copy.
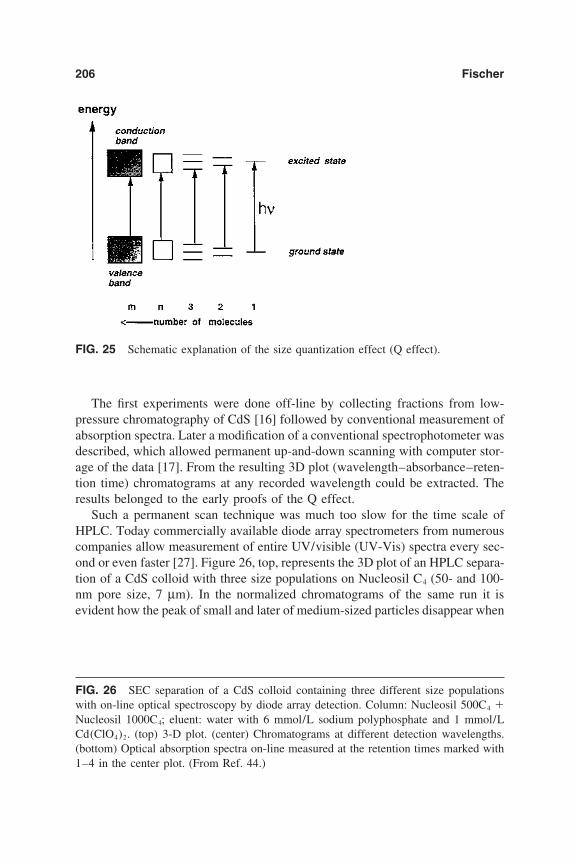
206 Fischer
FIG. 25 Schematic explanation of the size quantization effect (Q effect).
The first experiments were done off-line by collecting fractions from low-pressure chromatography of CdS [16] followed by conventional measurement ofabsorption spectra. Later a modification of a conventional spectrophotometer wasdescribed, which allowed permanent up-and-down scanning with computer stor-age of the data [17]. From the resulting 3D plot (wavelength–absorbance–reten-tion time) chromatograms at any recorded wavelength could be extracted. Theresults belonged to the early proofs of the Q effect.
Such a permanent scan technique was much too slow for the time scale ofHPLC. Today commercially available diode array spectrometers from numerouscompanies allow measurement of entire UV/visible (UV-Vis) spectra every sec-ond or even faster [27]. Figure 26, top, represents the 3D plot of an HPLC separa-tion of a CdS colloid with three size populations on Nucleosil C4 (50- and 100-nm pore size, 7 µm). In the normalized chromatograms of the same run it isevident how the peak of small and later of medium-sized particles disappear when
FIG. 26 SEC separation of a CdS colloid containing three different size populationswith on-line optical spectroscopy by diode array detection. Column: Nucleosil 500C4 Nucleosil 1000C4; eluent: water with 6 mmol/L sodium polyphosphate and 1 mmol/LCd(ClO4)2. (top) 3-D plot. (center) Chromatograms at different detection wavelengths.(bottom) Optical absorption spectra on-line measured at the retention times marked with1–4 in the center plot. (From Ref. 44.)
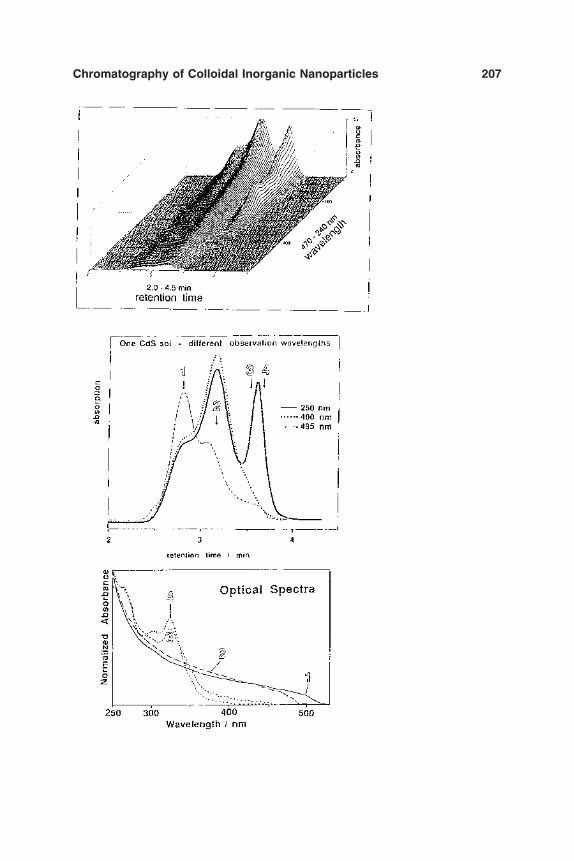
Chromatography of Colloidal Inorganic Nanoparticles 207

208 Fischer
the detection wavelength is increased (Fig. 26, center). The lower part of Fig.26 shows the optical spectra at the three chromatographic peaks. With decreasingparticle diameter (increasing retention time) the onset of adsorption shifts toshorter wavelengths due to the Q effect. It is interesting that spectra 3 and 4taken in the third peak are still significantly different, indicating separation withinthe peak, i.e., the peak width still reflects size distribution [44].
2. ‘‘Magic’’ Agglomeration NumbersFrequently, excitonic peaks are observed in the UV absorption spectra of verysmall semiconductor particles. They could be considered as electronic transitionsto various excited states because these smallest species have a term scheme simi-lar to that of a molecule rather than a conduction band with a high density ofstates [2,45,46]; or, on the other hand, such spectral maxima could occur whensize distributions are structured, i.e., certain agglomeration numbers are morecommon than others in the neighborhood due to lower energy. These ‘‘magic’’agglomeration numbers are explained by the shell model of Lippens and Lannoo[47]. This question could be answered by SEC with diode array detection [27].A closer inspection of numerous CdS colloids revealed that typically two spectralmaxima appeared and disappeared simultaneously during the SEC runs. Figure27 gives two examples showing the spectra of CdS at two retention times markedin the insert chromatogram. It was concluded that a pair of spectral peaks belongsto the same magic agglomeration number because of the same retention time inSEC. The peak at longer wavelength is attributed to the transition to the firstexcited state, that at shorter wavelength to the transition to the second. The nextblue-shifted pair of peaks originates from the next smaller magic number.
3. Plasmon Band in Gold SpectraThe optical absorption spectra of gold colloids also depend on particle size. How-ever, in this case absorption of light generates oscillation of electrons in the con-ductivity band, called plasmons. These oscillations are damped by impacts of theelectrons with the particle surface, which are more frequent in smaller particles.Therefore the intensity of the resulting plasmon band in the spectrum of goldcolloids, situated at about 520 nm, decreases with the particle diameter (Fig. 28,top) [48,49].
By means of SEC with on-line spectroscopy the plasmon band and its sizedependence can be investigated very conveniently [50]. Moreover, the plasmonband enables a quick test for monodispersity of particles within one SEC peak.As the extinction at 440 nm is independent of particle size, it is practical tonormalize the extinction at 520 nm. The extinction ratio R1 E520nm/E440nm is anintensity value for the plasmon band independent of concentration. The centralpart of Fig. 28 shows the chromatograms of two gold colloids (average diameters14.3 nm and 4.2 nm). The ratio chromatograms R1 calculated by the diode array

Chromatography of Colloidal Inorganic Nanoparticles 209
FIG. 27 Optical absorption spectra of two fractions of CdS samples measured with adiode array detector during SEC separation. The insets show the chromatograms of thesamples. The times at which the spectra were recorded are marked with A, B and A′, B′,respectively. Details in the text. (From Ref. 27.)
system gave values of 1.7 and 1.2, respectively. A constant R1 value indicates amonodisperse colloid. Constant values R2 E440nm/E400nm 0.95 were found forall Au samples in accordance with previous findings that interband transitions inthat area are independent of particle diameter [51]. In the final part of the secondpeak not only R1 but also R2 decreased, which could not be due to polydispersityof the Au sample. It is explained by beginning elution of tannin, a stabilizer ofsome gold colloids. Figure 28, bottom, comprises the results of seven samples.
4. Fluorescence DetectionMany cadmium sulfide colloids show intense fluorescence. The wavelength ofthe emitted light depends on the particle size in the same way as for absorption.

210 Fischer

Chromatography of Colloidal Inorganic Nanoparticles 211
FIG. 29 Coupled diode array detection (top) and fluorescence detection (bottom) withemission wavelength 650 nm (solid line) and 570 nm (dashed line). SEC of two CdScolloids of different particle size. (left) Single samples. (right) 1:1 mixture of both samples.Conditions: columns, Nucleosil 500 and Nucleosil 1000, 5 µm; eluents: THF containingcadmium perchlorate (2 104 mol/L) and dodecanethiol (2 104 mol/L); fluorescenceexcitation, 325 nm. (From Ref. 50.)
Fluorescence of every color has been found. When a fluorescence detector isplaced behind the diode array detector, not only can the Q effect of the fluores-cence emission be demonstrated, but the selectivity of the detection is also en-hanced [23]. In the experiment of Fig. 29 two CdS colloids of different particlesize were injected in the SEC column separately (left side) and as a 1:1 mixture(right side). In the upper part the absorbance at 250 nm is given and in the lower
FIG. 28 Size dependence of the plasmon band (520 nm) in the UV-Vis spectra of goldnm particles. (top) Spectra of two gold sols with average particle sizes of 14.3 and 4.2nm, respectively. (center) Normalized chromatograms of the two samples. Conditions:column, Nucleosil 500 and Nucleosil 1000 (15–25 µm, 120 4 mm each); eluent: 1mmol/L sodium citrate in water). Ratiochromatogram R1 E520/E440. Ratio chromatogramR2 E440/E400. (bottom) Extinction ratios R1 E520/E440 and R2 E440/E400 as a functionof retention time and particle diameter respectively. (From Refs. 25 and 50.)

212 Fischer
part the emissions at 650 and 570 nm, respectively. The two peaks in the mixturechromatogram overlapped considerably. However, by setting the emission wave-length of the detector on the maximum of each sample the original chromato-grams were obtained.
H. Preparative Size Exclusion Chromatography forMonodisperse nm Particles
Since the properties of nm particles depend strongly on their size, it is very impor-tant to possess colloids that are as monodisperse as possible. Preparative SEC isa way to narrow size distributions. However, one should keep in mind that SECrepresents a very special situation, when fractions are cut out of one broad peak.In all other preparative chromatographic methods, where two or more peaks areto be fractionated, the column can be overloaded resulting in peak broadening.As long as the interesting peak is separated from its neighbors at the baseline,there is no loss of product purity. In SEC an entire broad peak has to be consideredas a superposition of elemental chromatograms, each corresponding to speciesof a certain size. Any overloading leads automatically to broader elemental chro-matograms with more overlap and consequently to a higher polydispersity ofcollected fractions. Thus a compromise between yield and quality of the productmust be found unless the system is scaled up further. Fischer [28] investigatedthe influence of sample amount (concentration and volume), flow rate, and frac-tion volume on separation of aqueous CdS colloids on two preparative columnsin series, each 125 mm long and 32 mm in diameter, filled with 7-µm NucleosilC4, pore size 50 nm and 100 nm. The fractions were characterized by diameterpolydispersity Dd [Eq. (9)] obtained by injection in analytical SEC or by standarddeviation of diameter from TEM.
1. Effect of Flow RateSince preparative SEC is typically carried out through many cycles in order toavoid larger (too expensive) columns, flow rate has a great influence on the yieldper time. But when the flow rate is too high, particles can miss the entrance tothe pores, which leads to poor efficiency. For the columns described above, aflow rate of 4.5 mL/min was found to be best. When central fractions of the peakwere considered, efficiency of separation was not improved by further decreaseof flow rate.
2. Effect of Sample Concentration and VolumeLoading can be increased either by concentration or by volume. With increasingconcentration the quality of separation deteriorates much faster than with increas-ing volume. When a 10 mM CdS colloid was injected three times—500 µL non-diluted, 1000 µL diluted 1:1 with water, and 2000 µL diluted 1:3—the samplemass was the same in all three runs and the same CdS peak area would be ex-

Chromatography of Colloidal Inorganic Nanoparticles 213
pected. But the recovery dropped dramatically with increasing sample concentra-tion (Fig. 30). Due to the higher electrolyte concentration (from colloid prepara-tion) the protective electrical double layer shrank and the CdS particles wereirreversibly adsorbed at the stationary phase. Such behavior has already beendiscussed in sections II.C and II.D. Interestingly, the diameter polydispersity Dd
was the same in all three cases. The strong material loss in the concentratedsamples took place at the beginning of the column and this improved the separa-tion for the remaining particles so much that it equaled the dilute sample, wherethe situation was worsened by the larger sample volume. For preparative separa-tions of organic polymers larger sample volumes with lower concentrations havebeen recommended, but the reason is better separation efficiency and not a recov-ery problem [52].
FIG. 30 Preparative separation of nanoparticles. Comparison of the combined effectsof sample concentration and sample volume on the separation of colloidal cadmium sul-fide. The sample volumes were 500, 1000, and 2000 µL, but the latter two were diluted1:1 and 1:3, respectively, with water. Column: Nucleosil 500C4 Nucleosil 1000C4
(7 µm, 125 32 mm each); eluent: water with 6 mmol/L sodium polyphosphate and 1mmol/L Cd(ClO4)2 (4.5 mL/min). (left) Chromatograms of the three concentration/vol-ume combinations. (right) Relative peak area (nondiluted 1), fraction of adsorbed CdS(calculated from relative peak areas under the assumption that the most dilute sample hasno loss by adsorption) and diameter polydispersity of the main fraction as a function ofsample volume and concentration. (From Ref. 28.)

214 Fischer
3. Effect of Fraction VolumeFor studying the influence of fraction volume, 200 µL of a CdS colloid wasseparated. Original fractions of 0.9 mL were collected. Afterward in the peakmaximum the fraction volume was expanded stepwise from 0.9 mL to 8.1 mLby alternate addition of the next four and previous four fractions. The diameterpolydispersity Dd determined by analytical SEC is plotted as a function of fractionsize in Fig. 31. It turned out that serious loss of product quality occurred onlywhen the fraction volume exceeded the 15-fold sample volume.
4. Check of Fractionated Colloids by TEMTwo CdS colloids of different particle size were fractionated by preparative SEC.One main fraction of each run was reinjected in analytical SEC and measuredby TEM. Diameter polydispersity Dd was reduced from 1.69 to 1.13/1.10 (SEC/TEM) and from 1.50 to 1.18/1.04 (SEC/TEM), respectively. Standard deviationof diameter σd could be improved down to 11%, a very good value for semicon-ductor colloids. Table 4 summarizes the results and shows again the good agree-ment between the two methods.
5. Preparation of Colloidal nm Particles in aChromatographic Column
It should be mentioned that nm particles can also be generated in a chromato-graphic column (e.g., Lichrospher Alox T) by pumping the educt solutions sepa-rately and mixing the streams in a ‘‘zero volume’’ T piece or X piece immediately
FIG. 31 Effect of fraction volume on the separation of 200 µL of a CdS sol. Diameterpolydispersity of the main fraction as a function of fraction size. The inset shows thepreparative chromatogram and the size of the fractions. (From Ref. 28.)

Chromatography of Colloidal Inorganic Nanoparticles 215
TABLE 4 Preparative Separation of Two CdS Colloids:Product Analysis by SEC and TEM
dn[nm] dw[nm] Dd dw/dn
Sample HPLC ELMI HPLC ELMI HPLC ELMI
Original 2.32 3.91 1.691fraction 2.49 2.56 2.82 2.81 1.13 1.10
σ 0.46 (18%)Original 6.05 9.09 1.502fraction 5.66 5.77 6.73 5.97 1.18 1.04
σ 0.65 (11%)
Source: Ref. 28.
before the column [53]. The advantages are ease of control of educt ratios, imme-diate product check in the diode array spectrometer, and—the most importantfeature—products of higher stability. The latter was obvious when the opticalspectra of the particles after different aging times were compared with those ofcolloids obtained in the same way but without use of the column. The effect wasexplained by elimination of very small particles with high surface activity thatbehave as a glue for particle combination. The smallest crystalline CdS particlesto date with a diameter of only 1.3 nm were prepared by this technique. Theycontain only 23 unit cells yet still show lattice planes in high-resolution TEM.
I. General Considerations for Establishing SizeExclusion Chromatography Conditions forColloidal Inorganic nm Particles
When colloidal particles of a new inorganic material are to be separated by SEC,nonpolar stationary phases such as C4 or C18 silica for HPLC or Sephacryl forlow-pressure chromatography should be tried first, unless the colloid is stabilizedby organic groups. In cases where alkanethiols or detergents are used, bare silicais a good packing material. Addition of stabilizers or detergents to the mobilephase is usually necessary to avoid adsorption. Those used for the preparationof the colloid should be tried first. In the case of colloidal sulfides it is best toadd the particular cation in the form of a soluble salt in a modest concentration(about 1 mmol/L) to improve resolution, but high ionic strengths should beavoided for recovery reasons.
Whenever a method is elaborated, two checks are obligatory: (1) Compare
216 Fischer
injected and eluted sample amount. For comparison use Es ,λVs (Es ,λ, optical ab-sorption of the sample solution at wavelength λ; Vs, sample volume) and Ep,λVp
AλF (Ep,λ, integral optical absorption of all collected particles at the samewavelength λ and Vp, their volume; Aλ, total area of all colloid peaks at wave-length λ; F, flow rate). If both values are of comparable size, recovery is satisfac-tory. (2) Collect and reinject all eluted colloidal material. Compare the normal-ized chromatograms as a test for preferential loss of particles of a certain size.If the first check is negative but the second positive, i.e., a certain percentage ofthe whole distribution is lost without any preference, the method fails for quanti-tative analysis but could still be used for size determination under the conditionthat further careful tests by TEM give comparable results.
Since there is a lack of stable standards of inorganic colloids, calibration sam-ples have to be measured once by TEM. Later, e.g., for calibration of a newcolumn of the same type, another standard can be used. This can be an organicpolymer that elutes under the same condition as the nm particles or even a sub-stance with low molar weight as internal standard. This is also very helpful incompensating for retention variations due to changes in flow rate, temperature,etc. A specific calibration for each type of colloid seems to be the safer way,though a universal calibration for particles at low ionic strengths is reported[10,54]; the hydrodynamic volume of an organic polymer could also be usedunder the same conditions. When Q particles are to be separated, a diode arraydetector should be used, if available, as it provides useful additional information,e.g., about particle size, monodispersity of a peak, distinction between colloidand stabilizer peaks. For quantitative evaluation a detection wavelength must bechosen, where particles of all interesting sizes absorb light (i.e., this should bequite short) and, if possible, where the extinction coefficient is the same for allparticle sizes. Otherwise a density detector is recommended that gives a signalproportional to the mass; however, this has the disadvantage of low sensitivityand large cell volume.
III. HYDRODYNAMIC CHROMATOGRAPHY
A. Classical Hydrodynamic Chromatography
Hydrodynamic chromatography (HDC) is mentioned but not in great detail be-cause the method is rarely applied to inorganic colloids. However, HDC has agreat general potential in particle separation that does not seem to be exhaustedfor inorganic nm particles. The method was first published by Small [55] andworks with column packings of nonporous, spherical particles. Colloidal particlesor dissolved macromolecules are separated according to size just by passing thevoid volume through the packing. In the capillary model of HDC the liquid flowin the interstitial void volume is considered as a Poiseuille flow in a capillary

Chromatography of Colloidal Inorganic Nanoparticles 217
FIG. 32 The capillary model of HDC. Colloidal particles are sterically prevented fromenjoying the slowest velocities near the fluid wall interface. Larger particles are moreexcluded from this region (b) than are the smaller particles (a) and consequently movethrough the capillary with a higher mean velocity. (From Ref. 56.)
(Fig. 32) [56]. There are regions of slower flow velocities (close to the wall) andfaster ones (in the center) across which a selective distribution of solutes ac-cording to their size is found. Brownian motion lets colloidal particles moveradially through zones of different velocities, but only the smallest particles canreach the slowest regions. The larger the particles the more they are excludedfrom the ‘‘wall’’ zone and the earlier they elute. Here the ionic strength playsan important role, too, because of its influence on the electrical double layers oncolloidal particles and ‘‘walls,’’ causing repulsion due to similar charge. Thiseffect is stronger at lower ionic strengths, resulting in a faster elution. Studiesof experimental parameters, e.g., size of packing material and theoretical treat-ment of HDC in packed columns, can be found, e.g., in the paper of Stegemannet al. from the Amsterdam group [57].
In practice samples should contain small solutes, e.g., potassium dichromate,as a marker substance for compensation of flow rate changes, etc. Typically,surfactants are added to the eluent to diminish adsorption effects. Nevertheless,recovery can be a problem. That might be one reason why examples of HDCseparation of inorganic colloids are rare, a second being that chromatographersmight be less familiar with HDC. Kirkland separated silica particles in a rangeof 6–600 nm on 20-µm glass beads using the Rf method with a marker. Figure33 shows the calibration [12].
HDC can also be carried out in microcapillaries a few µm in diameter [58–62]. The theoretical background of this special technique is discussed, e.g., inthe papers of Tijssen et al. [63] and Silebi et al. [64]. An example with inorganicparticles, namely silica, was given by Noel et al. [58]. However, the size was 10µm. The calibration revealed that silica fits well with the values for latex, Cereus
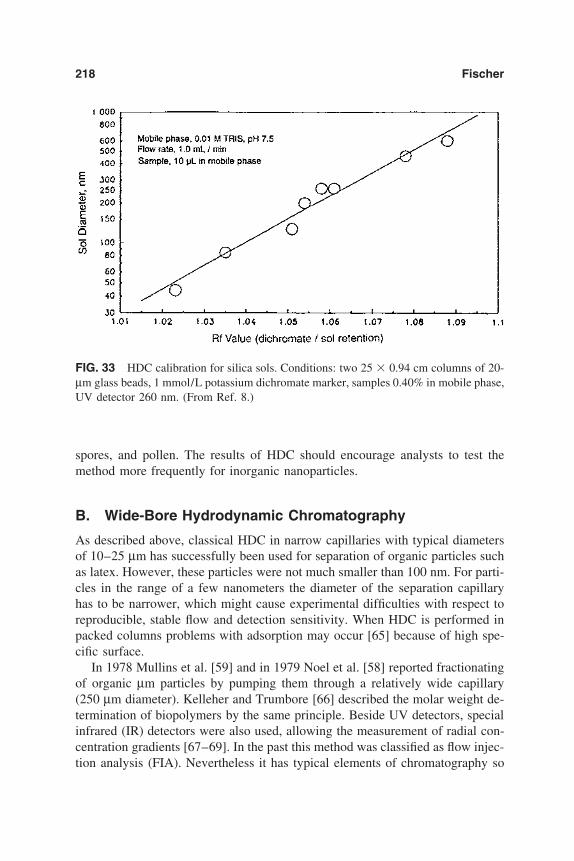
218 Fischer
FIG. 33 HDC calibration for silica sols. Conditions: two 25 0.94 cm columns of 20-µm glass beads, 1 mmol/L potassium dichromate marker, samples 0.40% in mobile phase,UV detector 260 nm. (From Ref. 8.)
spores, and pollen. The results of HDC should encourage analysts to test themethod more frequently for inorganic nanoparticles.
B. Wide-Bore Hydrodynamic Chromatography
As described above, classical HDC in narrow capillaries with typical diametersof 10–25 µm has successfully been used for separation of organic particles suchas latex. However, these particles were not much smaller than 100 nm. For parti-cles in the range of a few nanometers the diameter of the separation capillaryhas to be narrower, which might cause experimental difficulties with respect toreproducible, stable flow and detection sensitivity. When HDC is performed inpacked columns problems with adsorption may occur [65] because of high spe-cific surface.
In 1978 Mullins et al. [59] and in 1979 Noel et al. [58] reported fractionatingof organic µm particles by pumping them through a relatively wide capillary(250 µm diameter). Kelleher and Trumbore [66] described the molar weight de-termination of biopolymers by the same principle. Beside UV detectors, specialinfrared (IR) detectors were also used, allowing the measurement of radial con-centration gradients [67–69]. In the past this method was classified as flow injec-tion analysis (FIA). Nevertheless it has typical elements of chromatography so

Chromatography of Colloidal Inorganic Nanoparticles 219
that the name wide-bore hydrodynamic chromatography (wbHDC) was suggested[71].
1. MechanismTo some extent the method of wbHDC resembles the classical HDC. A plug ofsample solution is injected in a laminar flow through a capillary. Dissolved ordispersed species are transported forward by convection, but they can also movein other directions by diffusion. This diffusion depends on the size of the soluteand can be neglected in comparison with the forward transport in the case oflarge colloidal particles that just follow the laminar flow. In contrast, small parti-cles with a high diffusion coefficient undergo a rapid and effective exchangebetween fast-and slowly flowing regions of the laminar flow profile. Therefore theconcentration over the cross-section is more uniform and the average migrationvelocity is slower than in the first case. Vanderslice et al. [70] calculated radialand axial concentration distributions in such capillaries as shown in Fig. 34, top.With the simple setup shown in Fig. 34, bottom, consisting of a pump, injectionvalve with sample loop, capillary (20 m long, 0.7 mm I D) and optical detectorthe flow profiles resulting from the inhomogeneous distributions are obtained(Fig. 34, center). Large species with low diffusion coefficient give an early, asym-metrical convection peak; small analytes with high diffusion coefficient have alate, rather symmetrical diffusion peak, and analytes in between show elementsof both extremes.
2. Applications of wbHDC to Colloidal SystemsFischer [71] applied wbHDC to CdS and gold colloids. SEC chromatograms andcorrespoonding wbHDC elution profiles are presented in Fig. 35, top, for CdSparticles of different size. The samples are ordered according to increasing size.One can see the transition from diffusion peak to convection peak. For the evalua-tion of weight average diameter dw the method of height ratios R h1/h2 sug-gested by Trumbore et al. for molar weight determination of organic polymerswas applied [72]. h1 and h2 are the heights at the position of convection peakand diffusion peak, respectively. A calibration plot R f(dw) was constructed(Fig. 36, bottom), from which the diameters of unknown samples could be ob-tained. Based on studies of concentration dependence a 1 mmol/L colloidal solu-tion is recommended for all wbHDC analyses. However, a 5-fold higher or a 10-fold lower concentration would cause only an error of 7% or 8%, respectively.
IV. OPTICAL CHROMATOGRAPHY
Recently, a new method of size separation of particles based on optical trapping[73] was published by Imasaka et al. [74]. A laser beam is focused in a capillaryand the colloidal solution is pumped from the opposite end. The behavior of the

220 Fischer
FIG. 34 Wide-bore HDC. Behavior of material with small, medium, and high diffusioncoefficient during laminar flow through a ‘‘wide-bore’’ capillary. (a) Axial and radialconcentration distribution expressed in equiconcentration lines, based on the theoreticalcalculations of Vanderslice et al. [70]. (b) Corresponding elution profiles. (c) Scheme ofexperimental setup in wide-bore HDC. (From Ref. 71.)
particles is recorded by a video camera. Figure 36 describes schematically themotion of colloidal particles in the capillary in several steps. After introductionof a particle (A) it is focused into the center line of the laser beam by the gradientforce (B), turned around and accelerated by the scattering force (C) [75], andretarded with increasing distance from the beam waist (D). When the radiationpressure becomes identical with the force of the liquid flow, the particle drifts(D). The effect increases with increasing refractive index of the particle. There-fore larger particles are pushed further backward than smaller ones. The theoreti-cal background is discussed in [76]. The advantages are easy control of separationby changing the beam focusing, collecting of particles in order of size by interrup-
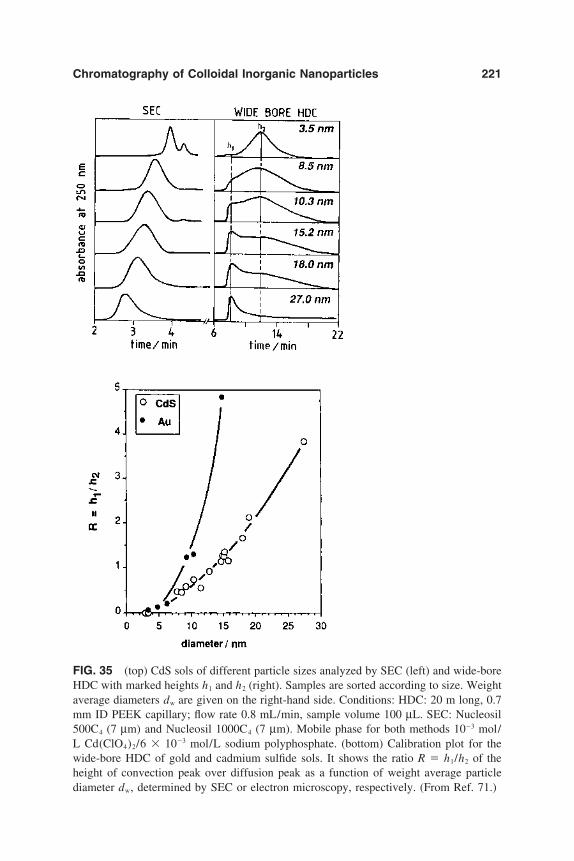
Chromatography of Colloidal Inorganic Nanoparticles 221
FIG. 35 (top) CdS sols of different particle sizes analyzed by SEC (left) and wide-boreHDC with marked heights h1 and h2 (right). Samples are sorted according to size. Weightaverage diameters dw are given on the right-hand side. Conditions: HDC: 20 m long, 0.7mm ID PEEK capillary; flow rate 0.8 mL/min, sample volume 100 µL. SEC: Nucleosil500C4 (7 µm) and Nucleosil 1000C4 (7 µm). Mobile phase for both methods 103 mol/L Cd(ClO4)2/6 103 mol/L sodium polyphosphate. (bottom) Calibration plot for thewide-bore HDC of gold and cadmium sulfide sols. It shows the ratio R h1/h2 of theheight of convection peak over diffusion peak as a function of weight average particlediameter dw, determined by SEC or electron microscopy, respectively. (From Ref. 71.)

222 Fischer
FIG. 36 Schematic motion of a particle in optical chromatography. The laser beam isintroduced from the right-hand side and the liquid from the left-hand side. (A) Particleintroduction. (B) Focus of particle into beam center by gradient force. (C) Accelerationof particle. (D) Deceleration of particle. (E) Particles drifting at equilibrium position.(From Ref. 74.)
tion of the laser pulse, observation of the whole system all of the time, and perfectrecovery. In the publication, separation of 1-µm, 3-µm, and 6-µm particles wasshown (material not defined), but it could be extended down to molecular dimen-sions by adapting laser power and wavelength. Though this method is limited tophotochemically stable material, it seems potentially useful.
V. COMPARISON OF DIFFERENT METHODS FORSIZE ANALYSIS OF nm PARTICLES
A good overview of the literature concerning all kinds of particle analysis canbe found in the reviews of Barth et al. [77–82]. Provder considers the assessmentof particle size distribution by various methods [89]. Kirkland compares SEC,sedimentation field flow fractionation (SdFFF), HDC, and capillary zone electro-phoresis (CZE) of silica particles [12].
TEM provides images of particles that can be directly measured using a scale.This classic method is the basis for calibration of other methods. It can be coupledwith x-ray spectroscopy for elemental analysis. However, typically not more thana few hundred particles or even much less can be counted for establishing a sizedistribution, resulting sometimes in rather bad statistics. Radiation damage has

Chromatography of Colloidal Inorganic Nanoparticles 223
been observed during the analysis [2]. The drying process during sample prepara-tion might be accompanied by aggregation or inhomogenization. Evaluation istime consuming unless an image processor is available.
SEC uses commonly available HPLC equipment (an isocratic pump is suffi-cient). Even with cheap peristaltic pumps low-pressure chromatography is possi-ble. The method is fast enough (3–5 min for HPLC) for kinetic studies of unstablecolloids. It gives a size distribution based on perfect statistics (if complete elutionis proven). On-line coupling with UV-Vis absorption or fluorescence spectroscopyis possible, providing useful information in the case of Q particles. Standards arerequired for calibration, preferably of the same material as the analyte. Selectionof stationary and mobile phase (pH, stabilizer, ionic strength) can be difficult.There is still a need for special software for colloids allowing corrections for axialdispersion. Easy scaling up or cyclical operation allows preparative separations.
HDC with packed columns requires normal HPLC pumps, etc. Due to smallelution volumes, dead volumes have to be minimized carefully. The quite poorresolution can be improved by special software with band deconvolution andcorrections for band broadening [83]. Standards and thorough optimization ofeluent composition are required. Special equipment for HDC in narrow-bore cap-illaries is available.
The advantages of wbHDC are the almost complete absence of disturbingsurfaces as compared to classic HDC and SEC and the simplicity of the experi-mental setup, where even peristaltic pumps can be used. The result is limited tothe average size of the colloidal particles unless in the case of Q particles addi-tional information is obtained via elution profiles at different wavelengths froma diode array detector.
Field flow fractionation (FFF) introduced by Giddings [84] comprises severalflow techniques. Particles in the µm and nm range can be separated. The resultingfractograms reflect the size distribution. Sedimentation FFF (SdFFF), especiallywith force-field programming, enables characterization of particles in a wide-diameter range with excellent resolution. However, it seems that no separationshave yet been carried out in the very low nm range. SdFFF does not requirestandards, if the density of the particles is known. The method is quite fast (about30 min), but unfortunately rather expensive.
With ultracentrifugation the size of colloidal particles, e.g., gold [85], can bedetermined without standards, but the density of the analyte must be known.Modern apparatus even allows coupling with UV-Vis spectroscopy. Such equip-ment is quite rare.
Capillary zone electrophoresis (CZE) has successfully been applied to silica[86] and to gold particles [87]. Resolution is higher than in SdFFF, SEC, or HDC[12] and the size range for silica lies at least between 6 and 600 nm. Standardsare necessary. At the moment, it seems that CZE is not the appropriate methodfor routine analyses.

224 Fischer
The well-established method of light scattering allows determination of aver-age particle size and particle shape. Numerous articles, reviews, and books arecited in Refs. 77–82. For proper operation and correct results the sample has tobe free of any dust. In some instances problems might occur during purificationby filtration, where colloidal particles could be retained by adsorption. Further-more, the exact particle concentration is necessary, the determination of whichis not always easy. Under certain conditions information about particle size ofnm particles can be gained from UV-Vis spectroscopy. In the case of very smallsemiconductor nm particles the onset of absorption is a function of diameter [88]or for gold colloids the relative intensity of the plasmon band depends in a certainrange on particle size [48–50]. Measurement of optical spectra is fast and simple.However, no exact values are obtained, especially about the size distribution.
REFERENCES
1. (a) A. Henglein, in Modern Trends of Colloid Science in Chemistry and Biology(H.-F. Eicke, ed.), Birkhauser, Basel, 1985, p. 126. (b) A. Henglein, Ber. Bunsenges.Phys. Chem. 99:903 (1995). (c) L. E. Brus, J. Chem. Phys. 79:5566 (1983). (d) H.Weller, Adv. Mat. 5:88 (1993).
2. E. Zeitler (ed.), Cryoscopy and Radiation Damage, North-Holland, Amsterdam,1982.
3. J. Porath and P. Flodin, Nature 183:1657 (1959).4. J. C. Moore, J. Polym. Sci. A2835 (1964).5. P. L. Dubin (ed.), Aqueous Size Exclusion Chromatography, J. Chromatography Li-
brary, Vol. 40, Elsevier, Amsterdam, 1988.6. T. G. Spiro, S. E. Allerton, J. Renner, A. Terzis, R. Bils, and P. Saltman, J. Am.
Chem. Soc. 88:2721 (1966).7. M. Shibukawa and N. Ohia, in Ref. 5, pp. 77–115.8. R. Tijssen, J. Bos, in Theoretical Advancement in Chromatography and Related
Separation Techniques (F. Dondi and G. Guiochon, eds.), NATO ADI Series C,Kluwer, Dordrecht, 1992, p. 397.
9. T. Tarutani, J. Chromatogr. 50:523 (1970).10. A. E. Hamielec and S. Singh, J. Liq. Chromatography 1:187 (1978).11. J. J. Kirkland, J. Chromatography 185:273 (1979).12. J. J. Kirkland, in Colloid Chemistry of Silica, Adv. Chem. Ser. 234:287, (1994).13. H. Burgy and G. Calzaferri, J. Chromatography 507:481 (1990).14. W. W. Yau, J. J. Kirkland, and D. D. Bly, Modern Size Exclusion Chromatography,
John Wiley and Sons, New York, 1979, pp. 31–36.15. J. Retuert, Bol. Soc. Chil. Quim. 40:415 (1995).16. Ch.-H. Fischer, H. Weller, A. Fojtik, C. Lume-Pereira, E. Janata, and A. Henglein,
Ber. Bunsenges. Phys. Chem. 90:46 (1986).17. Ch.-H. Fischer, J. Lilie, H. Weller, L. Katsikas, and A. Henglein, Ber. Bunsenges.
Phys. Chem. 93:61 (1989).18. Ch.-H. Fischer, M. Giersig and T. Siebrands, J. Chromatography A, 670:89 (1994).

Chromatography of Colloidal Inorganic Nanoparticles 225
19. Ch.-H. Fischer and A. Henglein, J. Phys. Chem. 93:5578 (1989).20. A. C. Nunes and Z.-C. Yu, J. Magnetism Magnetic Mat. 65:265 (1987).21. A. C. Nunes and Z.-C. Yu, J. Magnetism Magnetic Mat. 78:241 (1989).22. S. S. Kher and R. L. Wells, Chem. Mat. 6:2056 (1994).23. Ch.-H. Fischer, unpublished results.24. M. Holtzhauer and M. Rudolph, J. Chromatography 605:193 (1992).25. T. Siebrands, M. Giersig, P. Mulvaney, and Ch.-H. Fischer, Langmuir 9:2297
(1993).26. K. A. Littau, P. J. Szajowski, A. J. Muller, A. R. Kortan, and L. E. Brus, J. Phys.
Chem. 97:1224 (1993).27. Ch.-H. Fischer, H. Weller, L. Katsikas, and A. Henglein, Langmuir 5:429 (1989).28. Ch.-H. Fischer, J. Liq. Chromatography 17:3593 (1994).29. Ch.-H. Fischer and T. Siebrands, J. Chromatography A 707:189 (1995).30. H. Freundlich and A. Poser, Kolloid-Beihefte 6:297 (1934).31. A. v. Buzagh and E. Kneppo, Kolloid-Zeitschrift 82:150 (1938).32. P. L. Dubin and M. M. Tecklenburg, Anal. Chem. 57:275 (1985).33. C.-H. Cai, V. A. Romano, and P. L. Dubin, J. Chromatography A 693:251 (1995).34. P. L. Dubin, S. L. Edwards, and M. S. Mehta, J. Chromatography A 635:51 (1993).35. M. G. Styring, C. J. Davison, C. Price, and C. Booth, J. Chem. Soc. Faraday Trans.
80:3051 (1984).36. M. Potschka, J. Chromatography 587:276 (1991).37. M. G. Styring, H. H. Teo, C. Price, and C. Booth. Eur. Polym. J. 24:333 (1988).38. M. Potschka, J. Chromatography 441:239 (1988).39. F. G. Smith and W. M. Deen, J. Colloid Interface Sci. 78:444 (1980).40. F. G. Smith and W. M. Deen, J. Colloid Interface Sci. 91:571 (1983).41. E. J. W. Verwey and J. Th. G. Overbeek, Theory of the Stability of Lyophobic Col-
loids, Elsevier, New York, 1948.42. Ch.-H. Fischer and E. Kenndler, J. Chromatography, 773:179 (1997).43. R. Rosetti, J. L. Ellison, J. M. Gibson, and L. E. Brus, J. Chem. Phys. 80:4464
(1984).44. Ch.-H. Fischer, thesis.45. A. Fojtik, H. Weller, U. Koch, and A. Henglein, Ber. Bunsen Ges. Phys. Chem. 88:
969 (1984).46. L. Brus, J. Phys. Chem. 90:2555 (1986).47. P. E. Lippens and M. Lannoo, Phys. Rev. B 39:10935 (1989).48. U. Kreibig, J. Phys. (Paris) 38:C2-97 (1977).49. U. Kreibig and L. Genzel, Surf. Sci. 156:678 (1985).50. T. Siebrands, master’s thesis, Berlin, 1993.51. R. H. Doremus, J. Chem. Phys. 40:2389 (1964).52. L. E. Ekmanis, in Detection and Data Analysis in Size Exclusion Chromatography
(T. Provder, ed.), Am. Chem. Soc., Washington, DC, 1987, p.47.53. Ch.-H. Fischer and M. Giersig, Langmuir 8:1475 (1992).54. M. G. Styring, J. A. J. Honig, and A. E. Hamielec. J. Liq. Chromatography 9:3505
(1986).55. H. J. Small, J. Colloid Interface Sci. 48:147 (1974).56. H. Small, Acc. Chem. Res. 25:241 (1992).
226 Fischer
57. G. Stegemann, R. Oostervink, J. C. Kraak, and H. Poppe, J. Chromatography 506:547 (1990).
58. R. J. Noel, K. M. Gooding, F. E. Regnier, D. M. Ball, C. Orr, and M. E. Mullins,J. Chromatography 166:373 (1978).
59. M. E. Mullins and C. Orr, Int. J. Multiphase Flow 5:79 (1979).60. A. W. J. Brough, D. E. Hillman, and R. W. Perry, J. Chromatography 208:175
(1981).61. R. Tijssen, J. P. A. Bleumer, and M. E. van Krefeld, J. Chromatography 260: 297
(1983).62. J. G. DosRamos and C. A. Silebi, J. Colloid Interface Sci. 133:302 (1989).63. R. Tijssen, J. Bos, and M. E. van Krefeld, Anal. Chem. 58:3036 (1986).64. C. A. Silebi and J. G. DosRamos, AlChE J. 35:1351 (1989).65. A. W. Thornton, J. P. Olivier, C. G. Smart, and L. B. Gilman, in Particle Size Distri-
bution: Assessment and Characterization (T. Provder, ed.), ACS Symp. Ser. No.332, Am. Chem. Soc., Washington, DC, 1987, p. 256.
66. F. M. Kelleher and C. N. Trumbore, Anal. Biochem. 137:20 (1984).67. J. Pawliszyn, Anal. Chem. 58:3207 (1986).68. D. O. Hancock and R. E. Synovec, Anal. Chem. 60:2812 (1988).69. D. O. Hancock, C. N. Renn, and R. E. Synovec, Anal. Chem. 62:2441 (1990).70. J. T. Vanderslice, A. G. Rosenfeld, and G. R. Beecher, Anal. Chim. Acta 179:119
(1986).71. Ch.-H. Fischer and M. Giersig, J. Chromatography A, 688:97 (1994).72. C. N. Trumbore, M. Grehlinger, M. Stowe, and F. M. Kelleher, J. Chromatography
322:443 (1985).73. A. Ashkin, Phys. Rev. Lett. 24:156 (1970).74. T. Imasaka, Y. Kawabata, T. Kaneta, and Y. Ishidzu, Anal. Chem. 67:1763 (1995).75. A. Ashkin, Biophys. J. 61:569 (1992).76. T. Kaneta, Y. Ishidzu, N. Mishima, and T. Imasaka, Anal. Chem. 69:2701 (1997).77. H. G. Barth and S. T. Sun, Anal. Chem. 57:151 (1985).78. H. G. Barth, S. T. Sun, and R. M. Nikol, Anal. Chem. 59:142 (1987).79. H. G. Barth and S. T. Sun, Anal. Chem. 61:143 (1989).80. H. G. Barth and S. T. Sun, Anal. Chem. 53:1 (1991).81. H. G. Barth and S. T. Sun, Anal. Chem. 65:55 (1993).82. H. G. Barth and R. B. Flippen, Anal. Chem. 67:257 (1995).83. G. R. McGowan and M. A. Langhorst, J. Colloid Interface Sci. 89:94 (1982).84. J. C. Giddings, Science 260:1456 (1993).85. D. G. Duff, A. Bailker, I. Gameson, and P. P. Edwards, Langmuir 9:3210 (1993).86. R. M. McCormick, J. Liq. Chromatography 14:939 (1991).87. U. Schnabel, Ch.-H. Fischer, and E. Kenndler, J. Microsep., in press.88. L. Spanhel, M. Haase, H. Weller, and A. Henglein, J. Am. Soc. 109:5649 (1987).89. (a) T. Provder (ed.), Particle Size Distribution Assessment and Characterization,
ACS Symp. Ser. No. 332, Am. Chem. Soc., Washington, DC, 1987, p.256. (b) T.Provder (ed.), Particle Size Distribution, vol. 2, ACS Symposium Series No. 472,Am. Chem. Soc., Washington, DC, 1991.

6Chromatographic Behavior andRetention Models of PolyaromaticHydrocarbons in HPLCYU. S. NIKITIN and S. N. LANIN Department of Chemistry, M. V.Lomonosov State University of Moscow, Moscow, Russia
I. Introduction 228
II. General Approach to Description of PAH Retention in HPLC 230
III. General Model of PAH Retention in HPLC 231
IV. Reversed Phase HPLC of Polycyclic Aromatic Hydrocarbons onNonpolar Stationary Phase MCH-10 233
V. Reversed Phase HPLC of PAHs on ODS and Phenyl ReversedPhases. Influence of the Nature and Composition of theMobile Phase 237
VI. Influence of Various Parameters of a Chromatographic Systemon the Retention of Unsubstituted PAHs in HPLC 240
VII. Influence of the Molecular Parameters of PAHs on Their Reten-tion by Bonded Cyanoalkyl Phases of Different Types 246
VIII. Retention of Polyphenyls and Substituted Polycyclic AromaticHydrocarbons in the System Hydroxylated Silica-n-Hexane 251
IX. Optimization of a Mobile Phase Composition and Identificationof Components of PAH Mixes 258
References 260
227
228 Nikitin and Lanin
I. INTRODUCTION
The study of chromatographic behavior of polycyclic aromatic hydrocarbons(PAHs) in high-performance liquid chromatography (HPLC) has the interest bothfor the chemist-analysts in the analysis of objects of an environment and fordevelopment of retention theory and separation selectivity in liquid chromatogra-phy. PAHs are some of the most widespread and toxic pollutants of the environ-ment. Many are cancer producing. PAHs have been established as priority pollut-ants by the U.S. Environmental Protection Agency. All of this causes increasedattention to the investigations of chromatographic behavior of this class of sub-stances and to development of methods of its determination.
PAH determination in industrial sewage and natural waters is an importantand complex analytical problem. No less important are the study of a retentionmechanism of PAHs and selectivity of their separation in different variants ofliquid chromatography, that of establishment of correlation dependence betweenchromatographic parameters and structure of PAH molecules, and that of proper-ties of a chromatographic system.
In connection with the wide application of computers in chromatography,mathematical modeling of the chromatographic process for determining the corre-lation dependence between molecular parameters and physical properties of sor-bents and their retention with the subsequent computerized experiment holdspromise. It enables one to predict the properties of a chromatographic systemand to optimize its composition and the conditions for the separation (the directtask), as well as to study the molecular interactions, molecular structure of thesorbates, their retention mechanisms and physicochemical properties, in order toidentify the chromatographic zones corresponding to the components of complexmixtures of unknown composition (the reverse task) [1–20].
Numerous attempts were made to find the correlation dependencies betweenthe structure of PAHs and their retention in liquid chromatography. Some physi-cochemical parameters of the PAH molecules used to determine the retention arequite varied, namely, the number of aromatic cycles in a PAH molecule [21],number of the carbon atoms (nc) [22–24], van der Waals volumes (Vw) [25–27],length-to-breadth ratio of the molecule (L/B) [28–31], hydrophobic factor (lgP)[32–36], the molecular connectivity index (χ) [37–39], π-electron energies[40,41], combination of several parameters and an additive scheme [11,12,42–44].
The main defect of the similar approach is that the received correlation de-pendencies are empirical in nature and the area of their application is frequentlylimited by the conditions of the chromatographic experiment (type of chromato-graphic system, normal phase (NP) or reversed phase (RP) HPLC, type of adsor-bent, class of aromatic substance).
It is difficult to imagine that only one parameter describing the PAH molecule
Retention Models of PAHs in HPLC 229
could describe its retention in various conditions of chromatographic experiment.The retention mechanism in HPLC of such complex molecules as PAH moleculesapparently is reasonably complicated and is determined by various molecularinteractions in the chromatographic system.
By consideration of PAH retention in NP HPLC it is possible to show thecomplex character of retention dependence on a structure of PAH molecules evenwhen the properties of sorbent and mobile phase during chromatographic separa-tion remain practically constant (isocratic-isothermic variant of HPLC).
Based on the availability of delocalizated π electrons, molecules of aromatichydrocarbons (AHs) are able to undergo specific interactions with polar groups onthe surface of silica [45–48], aluminum oxide [49–51], or silica with chemicallybonded functional groups capable of forming charge-transfer complexes with AHmolecules [21,52–57].
In all cases the retention of AH molecules increases with increasing numberof aromatic cycles in a molecule. However, in some cases this dependence is notobserved. It has been shown [58] that on some polar adsorbents (e.g., with sur-face-bonded ester groups) the PAH molecules containing six aromatic cycles butbelonging to a number of pericondensed PAHs are retained more weakly thancata-condensed PAH molecules containing five aromatic cycles.
The retention regularities of various PAHs on silica gel at elution with n-pentane have been investigated [48]. It has been shown that some AHs are elutedfrom chromatographic column before partially hydrogenated derivatives. So, forexample, 9,10-dihydrophenanthrene is retained more strongly than phenanthreneand 4,5-dihydropyrene is retained more strongly than pyrene. The authors con-sider that the hydrogenated cycle in partially hydrogenated PAH molecules in-creases the electronic density in remaining nonhydrogenated aromatic cycles ofa PAH molecule. This increases specific interactions with a silica gel surface.However, there are data [48] that show that on polar adsorbents, such as silica gelwith surface-bonded alkylamine groups [59], or on polymer adsorbent PorapakT (sorbent on the basis of copolymer of divinylbenzene and ethylvinylbenzenemodified by ethylene glycol metacrylate [60]), and by n-hexane elution, AH re-tention is increased with reduction of hydrogenization degree of AH molecules,i.e., with an increase of the number of aromatic cycles in an AH molecule.
Thus PAH retention on polar adsorbents is determined not only by the numberbut by the arrangement of aromatic cycles in a molecule.
Data have confirmed the elution order of the isomeric PAHs from a chromato-graphic column. It is seen [48] that in NP HPLC on polar adsorbents, which arenot capable of forming the charge-transfer complexes with PAH molecules, thelinearly annellated cata-condensed PAHs are retained more weakly than iso-meric angular annellated compounds. Similarly to cata-condensed PAHs the dis-tinction in retention of isomeric pericondensed PAHs are also observed. So, forexample, benz[a]pyrene is more weakly retained than the isomeric compounds
230 Nikitin and Lanin
benz[e]pyrene and perylene. Some authors believe that such retention dependen-cies are stipulated by steric effects [48].
II. GENERAL APPROACH TO DESCRIPTION OF PAHRETENTION IN HPLC
In our opinion, the most general and theoretically justified approach to the de-scription of the retention dependence of PAH molecules on their structure is thatbased on additivity of the contribution of various groups or atoms of moleculesin retention. This approach is analogous to the approach widely used in organicchemistry for calculation of some physicochemical parameters of organic sub-stances.
Almost simultaneously with creation of the bases of classical theory of a chem-ical structure, attempts were made to present the molecule’s properties as a sumon its structural elements or group of structural elements (i.e., on atoms, pair ofconnected atoms, chemical bonds, etc.). Furthermore, methods of calculation ofmany properties of molecules and substances were developed that correlated wellwith experimental data and have received wide application for practical calcula-tion of physicochemical characteristics of molecules and substances [61]. How-ever, these methods were considered as purely empirical, without a commontheoretical foundation. Tatevskij [62–64] proposed some extensive property (L)of any system that can be determined by integration on system volume, as thesum of individual parts, pairs, triplets, etc., of a system:
L V
dτ1 ⋅ ⋅ ⋅ V
dτNF(X1, Y1, Z1, . . . , XN, YN, ZN) (1)
The results have been discussed [62–64] and generalized relating to energy offormation and other physicochemical characteristics of molecules and substances.
However, the application of this approach has difficulties because function Fin Eq. (1) depends not only on space coordinates but also on physical conditionsunder which the substance exists, e.g., pressure, temperature.
Equation (1) can be expressed as
L α
Lα ∑Lα ,β ⋅ ⋅ ⋅ (2)
where Lα is partial value of property L, attributed to volume V, Lα ,β is partialvalue of property L, attributed to pair of volumes Vα and Vβ, etc. Representationof any extensive property of a system in a form of a sum by separate parts, pairs,triplets, etc., of any system (from space object and up to nucleuses of atoms andelementary particles) is a direct consequence of the definition of extensive prop-erty [61].
In chromatography the study of dependence between a structure of a molecule

Retention Models of PAHs in HPLC 231
and its chromatographic retention began about 50 years ago. In his fundamentalwork, Martin [65] stated that substituted groups change the partial values of fac-tors that depend on the nature of substituted groups and on the nature of bothphases used (mobile and stationary), but not on remaining (‘‘constant’’) part ofa molecule. This phenomenon has generally been acknowledged in particularcase of a linear free energy relationship (LFER) [66].
In his outstanding and pioneering work, Snyder [67] considered in detail theprinciple of additivity of the contribution of separate groups of molecules in reten-tion and proved the applicability of this principle in liquid–solid chromatography.
III. GENERAL MODEL OF PAH RETENTION IN HPLC
Since the unsubstituted PAHs represent a limited set of solutes (sorbates) withsimilar molecular structure it is quite possible for the analysis of their chromato-graphic behavior to apply the retention structure model. In other words, in orderto study the dependence of chromatographic retention on molecular structure itis expedient to use the additivity principle according to which the sorption freeenergy of a molecule ∆G (or proportional to it value lg k, where k is the constantof adsorption equilibrium), can be expressed in a form of a linear combinationof free energies (∆Gi), relating to various fragments, or parameters of molecules,or to various physicochemical properties of substances.
∆G ∑∆Gi (3)
However, for construction of an adequate and universal (for both NP and RPHPLC) mathematical model of PAH retention one should include in a correlationequation a number of members such that mathematical model would be trans-formed in physically (physicochemically) model.
In our opinion the physicochemical model of retention and separation of poly-cyclic aromatic hydrocarbons should be based, on the one hand, on the principleof additivity of the contributions of the various groups or atoms of PAH mole-cules to retention; on the other hand, it should take into account all kinds ofmolecular interactions in a chromatographic system. Such a model would allowa better understanding of the retention mechanism of PAHs of different structure(including the isomeric PAHs) and to describe from the uniform point of viewtheir retention for different chromatographic systems in HPLC.
In considering a PAH retention mechanism in HPLC one should note the dom-ination of different types of molecular interactions (Table 1) in NP and RP HPLC,i.e., on a different retention mechanism of PAHs in NP and RP HPLC. In normalphase HPLC the PAH retention from nonpolar mobile phase is defined in thefirst approximation by specific adsorbate–adsorbent interaction (Table 1). Theintroduction in a mobile phase of a polar modifier, which is sorbed specificallyon active groups of a polar adsorbent surface, results in reduction of PAH reten-
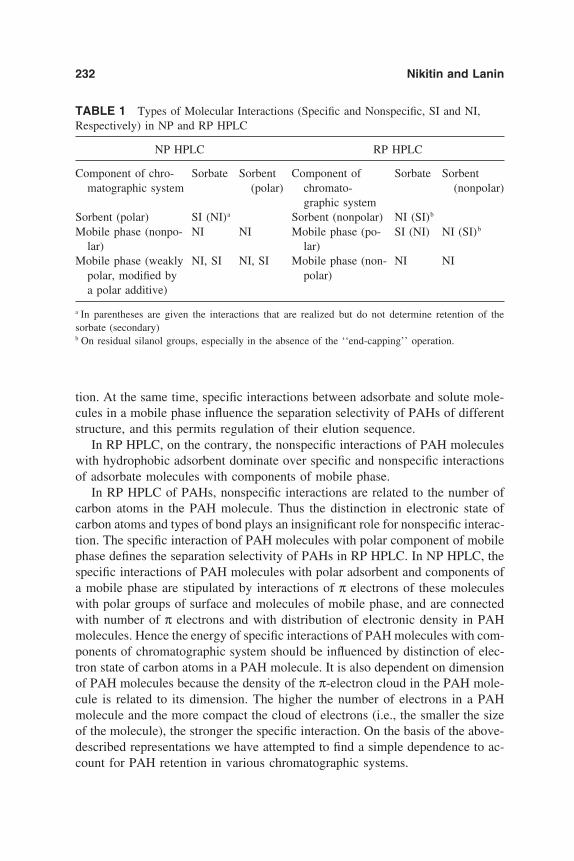
232 Nikitin and Lanin
TABLE 1 Types of Molecular Interactions (Specific and Nonspecific, SI and NI,Respectively) in NP and RP HPLC
NP HPLC RP HPLC
Component of chro- Sorbate Sorbent Component of Sorbate Sorbentmatographic system (polar) chromato- (nonpolar)
graphic systemSorbent (polar) SI (NI)a Sorbent (nonpolar) NI (SI)b
Mobile phase (nonpo- NI NI Mobile phase (po- SI (NI) NI (SI)b
lar) lar)Mobile phase (weakly NI, SI NI, SI Mobile phase (non- NI NI
polar, modified by polar)a polar additive)
a In parentheses are given the interactions that are realized but do not determine retention of thesorbate (secondary)b On residual silanol groups, especially in the absence of the ‘‘end-capping’’ operation.
tion. At the same time, specific interactions between adsorbate and solute mole-cules in a mobile phase influence the separation selectivity of PAHs of differentstructure, and this permits regulation of their elution sequence.
In RP HPLC, on the contrary, the nonspecific interactions of PAH moleculeswith hydrophobic adsorbent dominate over specific and nonspecific interactionsof adsorbate molecules with components of mobile phase.
In RP HPLC of PAHs, nonspecific interactions are related to the number ofcarbon atoms in the PAH molecule. Thus the distinction in electronic state ofcarbon atoms and types of bond plays an insignificant role for nonspecific interac-tion. The specific interaction of PAH molecules with polar component of mobilephase defines the separation selectivity of PAHs in RP HPLC. In NP HPLC, thespecific interactions of PAH molecules with polar adsorbent and components ofa mobile phase are stipulated by interactions of π electrons of these moleculeswith polar groups of surface and molecules of mobile phase, and are connectedwith number of π electrons and with distribution of electronic density in PAHmolecules. Hence the energy of specific interactions of PAH molecules with com-ponents of chromatographic system should be influenced by distinction of elec-tron state of carbon atoms in a PAH molecule. It is also dependent on dimensionof PAH molecules because the density of the π-electron cloud in the PAH mole-cule is related to its dimension. The higher the number of electrons in a PAHmolecule and the more compact the cloud of electrons (i.e., the smaller the sizeof the molecule), the stronger the specific interaction. On the basis of the above-described representations we have attempted to find a simple dependence to ac-count for PAH retention in various chromatographic systems.

Retention Models of PAHs in HPLC 233
We shall take a look at this dependence by an example of PAH retention inRP HPLC.
IV. REVERSED PHASE HPLC OF POLYCYCLICAROMATIC HYDROCARBONS ON NONPOLARSTATIONARY PHASE MCH-10
A simple linear correlation equation that accounts for the carbon atom environ-ment in the molecule was proposed to describe unsubstituted PAH retention inreversed phase liquid chromatography (RP-LC):
lg k′ B1nI B2nII B3nIII B4(nπ/L) B0 (4)
where k′ is capacity factor; nI, nII, nIII are the number of carbon atoms, whichare distinguished in their environment that is included in one, two, or three aro-matic cycles of a PAH molecule accordingly (see Fig. 1, atoms of types I, II,and III); nπ is the number of π electrons in the molecule; L is the PAH moleculelength along a main axis [68], B1, B2, B3, B4, and B0 are the equation coefficients.The types of the carbon atoms different in their environment in molecules ofunsubstituted PAHs, e.g., in a pyrene molecule, are indicated below (Fig. 1).
According to our model, the first three members of Eq. (4) should reflect thedifferences, if any, in the specific interaction of the carbon atoms (types I, II,and III of the PAH molecules, which are characterized by different distributionof electron density [11,12,69]) with the polar mobile phase in the chosen RPchromatographic system. The fourth member (nπ/L) takes into account the meandensity of the π-electron cloud in the PAH molecule and enables the identification
FIG. 1 Types of carbon atoms differing by the environment in the molecules of unsubsti-tuted polyaromatic hydrocarbons.

234 Nikitin and Lanin
of the differences in specific interactions of isomeric molecules with the polarmobile phases.
The significance of structural parameters and the number of π electrons ofPAH molecules are given in Table 2. Table 3 gives the values of the coefficientsin Eq. (4), the correlation coefficients and Fisher criteria for the calculation ofthe capacity factor logarithms. It follows from Table 3 that the proposed modeldescribes the retention of the PAH molecule quite well (the coefficients of multi-ple correlation for all mobile phases exceed 0.999 and Fisher criteria have evengreater values) in the chromatographic system (nonpolar sorbent–polar mobilephase). In all mobile phase compositions studied, the B2 and B3 coefficients haveclose values, which indicates a slight difference in the contribution of the carbonatoms of types II and III to the PAH retention and enables them to be combinedinto one member to simplify the model equation:
lg k′ D1nI D2(nII nIII) D3(nπ/L) D0 (5)
Table 4 presents the calculation results of capacity factor logarithms accordingto Eq. (5). As is seen in Table 4, the calculated values of the logarithms are
TABLE 2 Structural Parameters and Number of π Electrons of UnsubstitutedPolycyclic Aromatic Hydrocarbons
Number ofcarbon atoms
typesChemical
Substance formula n∑ nII n III nπ L, A
1 Benzene C6H6 6 0 0 6 5,52 Naphthalene C10H8 10 2 0 10 8,03 Anthracene C14H10 14 4 0 14 10,54 Phenanthrene C14H10 14 4 0 14 9,55 Pyrene C16H10 16 4 2 16 9,56 Tetracene C18H12 18 6 0 18 13,07 Tetraphene C18H12 18 6 0 18 11,88 Chrysene C18H12 18 6 0 18 11,89 Triphenylene C18H12 18 6 0 18 9,5
10 Benz[a]pyrene C20H12 20 6 2 20 11,511 Perylene C20H12 20 4 2 20 10,512 1,12-Benzperylene C22H12 18 6 4 22 10,513 Coronene C24H12 24 6 6 24 10,514 1,2,7,8,-Dibenzanthracene C22H14 22 8 0 22 13,515 1,2,5,6,-Dibenzanthracene C22H14 22 8 0 22 13,6

Retention Models of PAHs in HPLC 235
TABLE 3 Values of Coefficients B1, B2, B3, B4, B0, Correlation Coefficients (r)a,and Fisher Coefficients (F) for the Dependency Eq. (4) at Various Mobile PhaseCompositions (the Ethanol–Water Mixture); Column: MCH-10 ‘‘MicroPak,’’Temperature 39°C
Water content in ethanol, vol%
Parameter 0 10 20 30 40b
B1 0.0219 0.0334 0.0392 0.0518 0.0664r 0.8578 0.8845 0.8959 0.9099 0.9565B2 0.0890 0.0972 0.1057 0.1150 0.1243r 0.9702 0.9686 0.9664 0.9600 0.9592B3 0.0925 0.0926 0.0956 0.1046 0.1134r 0.0888 0.0657 0.0537 0.0506 0.1498B4 0.0177 0.0939 0.1571 0.2140 0.2496
r 0.8920 0.8675 0.8521 0.8348 0.8250B0 1.1028 0.8265 0.5565 0.3545 0.1672Multiple 0.9995 0.9996 0.9996 0.9995 0.9994
correlationF 2244.6 2845.6 2383.0 2085.5 1443.7
a Coefficients of correlation of Bi with lg k′b For 40 vol% the calculation was made with respect to 12 substances, in all other cases to 14 sub-stances (see Ref. 11).
close to the experimental values. For the capacity factors themselves, the meandeviations of the calculated k′ values from the experimental ones are 2–4%.
The values of the coefficients D1, D2, D3, and D0 of Eq. (5) are given in Table5. The values of the coefficients D1, D2, D3, and D0 linearly depend on the waterconcentration in the mobile phase (Fig. 2). Coefficients D1, D2, and D0 are di-rectly proportional and D3 is inversely proportional to the water concentration.This is in agreement with the increasing contribution of nonspecific interactionsof carbon atoms of the PAH molecules with the nonpolar adsorbent surface(members n1 and (nII nIII), and with specific (donor–acceptor) interaction ofthe PAH molecules (member nπ/L) with the polar mobile phase, upon increasingpolarity of the latter. As shown in Fig. 2 and Table 5, the contribution to theretention of the carbon atoms of types II and III, characterized by less electrondensity as compared with the carbon atoms of type I, is greater (D2 D1) thanthat of the carbon atoms of type I. The negative value of the coefficient D3 isindicative of the predominant specific interaction of the π electrons of the PAHmolecule with the mobile phase, which reduces the retention of PAHs.

236 Nikitin and Lanin
TABLE 4 Logarithm Values of the PAH Capacity Factors FoundExperimentally [11] and Calculated According to the Dependency Eq. (5) forVarious Mobile Phase Compositions (the Ethanol–Water Mixture); Column:MCH-10 ‘‘MicroPak,’’ Temperature 39°C
Water content in ethanol, vol%
0 30
Substance Exp. Calc. Exp. Calc.
Benzene 1.000 0.990 0.260 0.284Naphthalene 0.770 0.771 0.017 0.015Phenanthrene 0.553 0.552 0.297 0.316Anthracene 0.538 0.551 0.338 0.326Pyrene 0.387 0.377 0.459 0.500Triphenylene 0.337 0.340 0.570 0.565Chrysene 0.319 0.332 0.618 0.630Tetraphene 0.337 0.332 0.627 0.630Perylene 0.155 0.161 0.760 0.778Benz[a]pyrene 0.137 0.156 0.818 0.8201,2,7,8-Dibenzanthracene 0.125 0.114 0.950 0.9251,2,5,6-Dibenzanthracene 0.125 0.111 0.950 0.9451,12-Benzperylene 0.009 0.014 0.958 0.963Coronene 0.187 0.189 1.173 1.149
TABLE 5 Coefficients D1, D2, D3, D0, Correlation Coefficients (r),a
and Fisher Coefficients (F) for the Dependency Eq. (5) at VariousMobile Phase Compositions (the Ethanol–Water Mixture); Column:MCH-10 ‘‘MicroPak,’’ Temperature 39°C
Water content in ethanol, vol%
Parameter 0 10 20 30
D1 0.0213 0.0347 0.0419 0.0546r 0.8578 0.8845 0.8959 0.9100D2 0.0894 0.0936 0.0988 0.1072r 0.9952 0.9883 0.9832 0.9760D3 0.0187 0.0647 0.1037 0.1504r 0.8638 0.8384 0.8229 0.8042D0 1.0973 0.8695 0.6372 0.4477Multiple 0.9995 0.9994 0.9990 0.9989
correlationF 3124.6 2959.1 1677.0 1478.5
a Coefficients of correlation of Di with lg k′.

Retention Models of PAHs in HPLC 237
FIG. 2 Dependence of coefficients D1, D2, D3, and D0 of Eq. (5) on the water contentin the mobile phase (ethanol–water system). Column: MCH-10 ‘‘MicroPak,’’ temperature39°C.
V. REVERSED PHASE HPLC OF PAHs ON ODS ANDPHENYL REVERSED PHASES. INFLUENCE OFTHE NATURE AND COMPOSITION OF THEMOBILE PHASE
In order to verify the applicability of Eq. (5) to other RP systems, we calculatedthe data (by computer) obtained by Hanai and Hubert [41]. Tables 6 and 7 containthe values of D1, D2, D3, and D0; and they show that the experimental data onPAH retention on the octadecyl (YMC ODS) and phenyl (YMC phenyl) reversedphases, with the use of acetonitrile or tetrahydrofuran-water solutions as eluents[41], are also well described by Eq. (5). Figure 3 shows that, in this particularcase, a good linear dependence between coefficients D1, D2, D3, and D0 and watercontent in the eluent is observed. In this case the dependence is similar to thatdescribed for the ethanol–water mobile phase, i.e., D2 D1, and D3 0.
As shown in Refs. 41 and 70, a very low selectivity toward PAHs in RP HPLCis observed upon their elution with the tetrahydrofuran (THF)–water mixture.The variations in k′ of PAHs upon transition from benzene to tetracene are verysmall, changing from 0.09% for 70% THF to 0.15% for 60% THF upon adsorp-tion on the YMC ODS phase. This demonstrates the poor applicability of Eq.(5) to a system such as this. Nevertheless, also in this case the multiple correlationcoefficient exceeded 0.99, and only for the 30% H2O–70% THF system on theODS phase did r 0.9344.
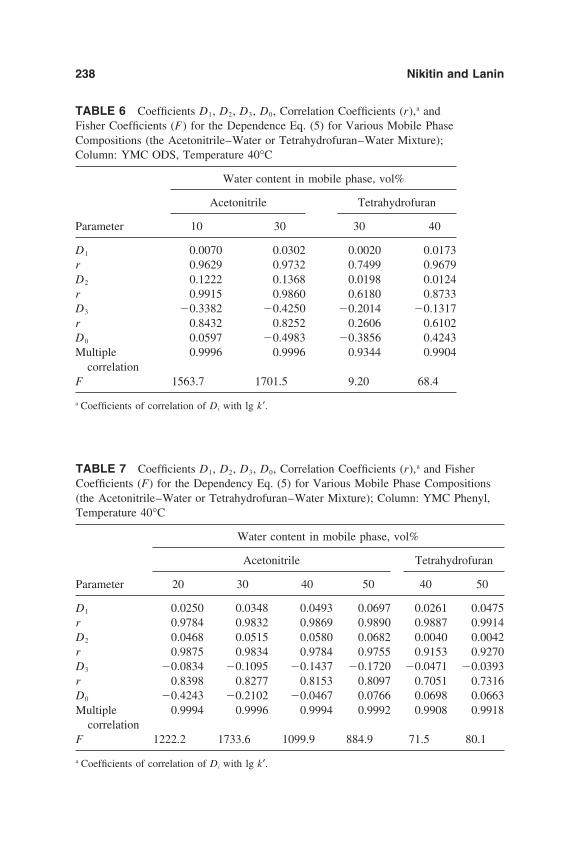
238 Nikitin and Lanin
TABLE 6 Coefficients D1, D2, D3, D0, Correlation Coefficients (r),a andFisher Coefficients (F) for the Dependence Eq. (5) for Various Mobile PhaseCompositions (the Acetonitrile–Water or Tetrahydrofuran–Water Mixture);Column: YMC ODS, Temperature 40°C
Water content in mobile phase, vol%
Acetonitrile Tetrahydrofuran
Parameter 10 30 30 40
D1 0.0070 0.0302 0.0020 0.0173r 0.9629 0.9732 0.7499 0.9679D2 0.1222 0.1368 0.0198 0.0124r 0.9915 0.9860 0.6180 0.8733D3 0.3382 0.4250 0.2014 0.1317r 0.8432 0.8252 0.2606 0.6102D0 0.0597 0.4983 0.3856 0.4243Multiple 0.9996 0.9996 0.9344 0.9904
correlationF 1563.7 1701.5 9.20 68.4
a Coefficients of correlation of Di with lg k′.
TABLE 7 Coefficients D1, D2, D3, D0, Correlation Coefficients (r),a and FisherCoefficients (F) for the Dependency Eq. (5) for Various Mobile Phase Compositions(the Acetonitrile–Water or Tetrahydrofuran–Water Mixture); Column: YMC Phenyl,Temperature 40°C
Water content in mobile phase, vol%
Acetonitrile Tetrahydrofuran
Parameter 20 30 40 50 40 50
D1 0.0250 0.0348 0.0493 0.0697 0.0261 0.0475r 0.9784 0.9832 0.9869 0.9890 0.9887 0.9914D2 0.0468 0.0515 0.0580 0.0682 0.0040 0.0042r 0.9875 0.9834 0.9784 0.9755 0.9153 0.9270D3 0.0834 0.1095 0.1437 0.1720 0.0471 0.0393r 0.8398 0.8277 0.8153 0.8097 0.7051 0.7316D0 0.4243 0.2102 0.0467 0.0766 0.0698 0.0663Multiple 0.9994 0.9996 0.9994 0.9992 0.9908 0.9918
correlationF 1222.2 1733.6 1099.9 884.9 71.5 80.1
a Coefficients of correlation of Di with lg k′.

Retention Models of PAHs in HPLC 239
FIG. 3 Dependence of coefficients D1, D2, D3, and D0 of Eq. (5) on the water contentin the mobile phase (acetonitrile–water) upon polyaromatic hydrocarbon adsorption onphenyl (unbroken line) and octadecyl (broken line) phase according to the data in Ref. 41.
It should be noted that, in comparison to correlation equations (using the con-nectiveness index), mostly distributed in RP-LC [38]:
lg k′ H1χ H0 (6)
equation (5) better describes the experimental data on the PAH retention [11];the values of the correlation coefficient and Fisher criteria (cf. Tables 5 and 8)are higher. This seems to be due to the fact that the topological index of connec-tiveness slightly reflects the molecule geometry, which is most drastically seenin the case of isomers. For example, in the case of anthracene and phenanthrene,χa 4.80940 and χph 4.81538 and differ by
∆χ 2(χph χa)(χph χa)
100% 0.124%
for chrysene and triphenylene (χchr 6.22607, χ thp 6.23205; ∆χ 0.096%),whereas in the case of the same PAH pairs, the differences in the molecule lengthare equal to: Lph 9.95000 A, La 10.36801 A, ∆L 4.115%; Lchr 12.18336A, L tph 9.95000 A, ∆L 20.181%).
We introduced one more parameter (L) into Eq. (6) to account for the lineardimensions of the PAH molecules.
lg k′ H1χ H2(nπ/L) H0 (7)
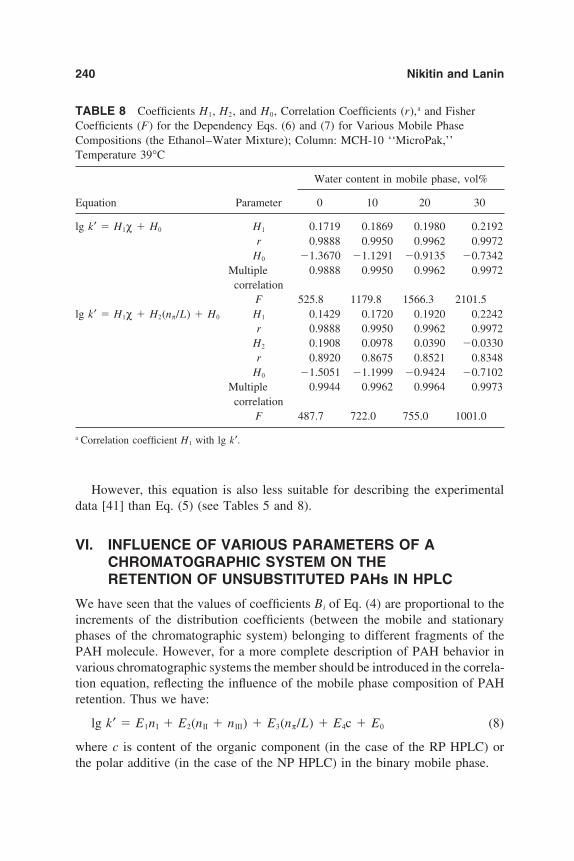
240 Nikitin and Lanin
TABLE 8 Coefficients H1, H2, and H0, Correlation Coefficients (r),a and FisherCoefficients (F) for the Dependency Eqs. (6) and (7) for Various Mobile PhaseCompositions (the Ethanol–Water Mixture); Column: MCH-10 ‘‘MicroPak,’’Temperature 39°C
Water content in mobile phase, vol%
Equation Parameter 0 10 20 30
lg k′ H1χ H0 H1 0.1719 0.1869 0.1980 0.2192r 0.9888 0.9950 0.9962 0.9972
H0 1.3670 1.1291 0.9135 0.7342Multiple 0.9888 0.9950 0.9962 0.9972correlation
F 525.8 1179.8 1566.3 2101.5lg k′ H1χ H2(nπ/L) H0 H1 0.1429 0.1720 0.1920 0.2242
r 0.9888 0.9950 0.9962 0.9972H2 0.1908 0.0978 0.0390 0.0330r 0.8920 0.8675 0.8521 0.8348
H0 1.5051 1.1999 0.9424 0.7102Multiple 0.9944 0.9962 0.9964 0.9973correlation
F 487.7 722.0 755.0 1001.0
a Correlation coefficient H1 with lg k′.
However, this equation is also less suitable for describing the experimentaldata [41] than Eq. (5) (see Tables 5 and 8).
VI. INFLUENCE OF VARIOUS PARAMETERS OF ACHROMATOGRAPHIC SYSTEM ON THERETENTION OF UNSUBSTITUTED PAHs IN HPLC
We have seen that the values of coefficients Bi of Eq. (4) are proportional to theincrements of the distribution coefficients (between the mobile and stationaryphases of the chromatographic system) belonging to different fragments of thePAH molecule. However, for a more complete description of PAH behavior invarious chromatographic systems the member should be introduced in the correla-tion equation, reflecting the influence of the mobile phase composition of PAHretention. Thus we have:
lg k′ E1nI E2(nII nIII) E3(nπ/L) E4c E0 (8)
where c is content of the organic component (in the case of the RP HPLC) orthe polar additive (in the case of the NP HPLC) in the binary mobile phase.

Retention Models of PAHs in HPLC 241
Previously, we have shown (see Fig. 2) that in the case of RP HPLC the Eq.(5) coefficients Di are the linear functions of the content (vol%) of water or anorganic component in the mobile phase:
D1 G1c G0,1 (9)
D2 G2c G0,2 (10)
D3 G3c G0,3 (11)
D0 G0c G0,0 (12)
where c is the content of the organic component in the polar mobile phase (RPHPLC), Gi and G0, i are the equation coefficients.
Introducing Eqs. (9)–(12) in Eq. (5), we get
lg k′ c[G1n1 G2(nII nIII) G3(nπ/L) G0] (13)
[G0,1nI G0,2(n II nIII) G0,3(nπ/L) G0 ,0]
Comparing Eqs. (8) and (13), we get:
E0 G0,0 (14)
E1 G0,1 (15)
E2 G0,2 (16)
E3 G0,3 (17)
E4 [G1nI G2(n II nIII) G3(nπ/L) G0] (18)
It is of interest to compare Eqs. (5) and (8) with the equation in Ref. 71:
lg k′ lg kw SΦ (19)
where Φ is the volume fraction of organic component in the mobile phase, S isthe coefficient, kw is the value of k′ (found by extrapolation) for the water mobilephase (when Φ 0). The values of S are approximately constant, as Φ is varied,though each substance will have a characteristic value S; the values of S can alsodiffer when the organic component of the mobile phase or chromatographic col-umn is changed.
Having Eqs. (8) and (19), we see that
Φ c/100 (20)
if c is presented in vol% and Φ c if c is presented in volume fraction
S E4 (21)
lg kw E1nI E2(nII nIII) E3(nπ/L) E0 (22)
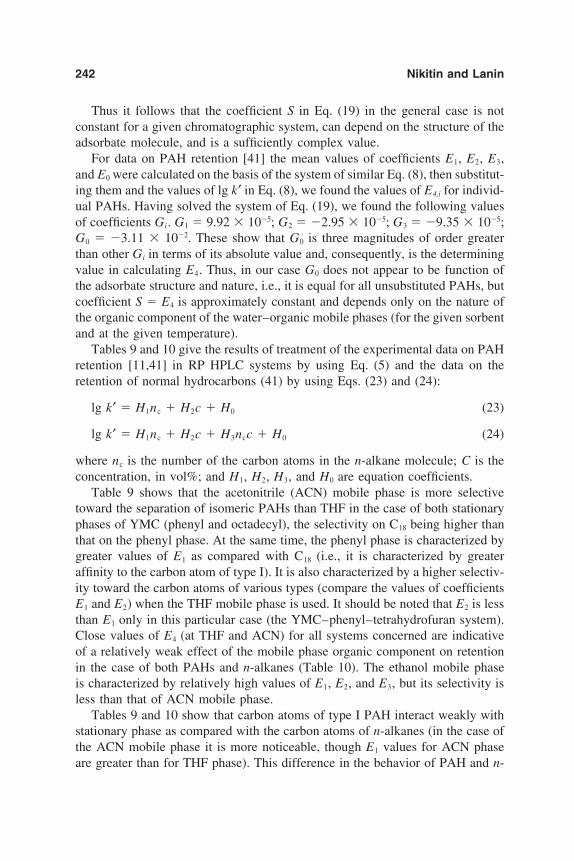
242 Nikitin and Lanin
Thus it follows that the coefficient S in Eq. (19) in the general case is notconstant for a given chromatographic system, can depend on the structure of theadsorbate molecule, and is a sufficiently complex value.
For data on PAH retention [41] the mean values of coefficients E1, E2, E3,and E0 were calculated on the basis of the system of similar Eq. (8), then substitut-ing them and the values of lg k′ in Eq. (8), we found the values of E4,i for individ-ual PAHs. Having solved the system of Eq. (19), we found the following valuesof coefficients Gi. G1 9.92 105; G2 2.95 105; G3 9.35 105;G0 3.11 102. These show that G0 is three magnitudes of order greaterthan other Gi in terms of its absolute value and, consequently, is the determiningvalue in calculating E4. Thus, in our case G0 does not appear to be function ofthe adsorbate structure and nature, i.e., it is equal for all unsubstituted PAHs, butcoefficient S E4 is approximately constant and depends only on the nature ofthe organic component of the water–organic mobile phases (for the given sorbentand at the given temperature).
Tables 9 and 10 give the results of treatment of the experimental data on PAHretention [11,41] in RP HPLC systems by using Eq. (5) and the data on theretention of normal hydrocarbons (41) by using Eqs. (23) and (24):
lg k′ H1nc H2c H0 (23)
lg k′ H1nc H2c H3ncc H0 (24)
where nc is the number of the carbon atoms in the n-alkane molecule; C is theconcentration, in vol%; and H1, H2, H3, and H0 are equation coefficients.
Table 9 shows that the acetonitrile (ACN) mobile phase is more selectivetoward the separation of isomeric PAHs than THF in the case of both stationaryphases of YMC (phenyl and octadecyl), the selectivity on C18 being higher thanthat on the phenyl phase. At the same time, the phenyl phase is characterized bygreater values of E1 as compared with C18 (i.e., it is characterized by greateraffinity to the carbon atom of type I). It is also characterized by a higher selectiv-ity toward the carbon atoms of various types (compare the values of coefficientsE1 and E2) when the THF mobile phase is used. It should be noted that E2 is lessthan E1 only in this particular case (the YMC–phenyl–tetrahydrofuran system).Close values of E4 (at THF and ACN) for all systems concerned are indicativeof a relatively weak effect of the mobile phase organic component on retentionin the case of both PAHs and n-alkanes (Table 10). The ethanol mobile phaseis characterized by relatively high values of E1, E2, and E3, but its selectivity isless than that of ACN mobile phase.
Tables 9 and 10 show that carbon atoms of type I PAH interact weakly withstationary phase as compared with the carbon atoms of n-alkanes (in the case ofthe ACN mobile phase it is more noticeable, though E1 values for ACN phaseare greater than for THF phase). This difference in the behavior of PAH and n-

Retention Models of PAHs in HPLC 243
TA
BL
E9
Ret
entio
nof
PAH
sin
RP
HPL
C.
Coe
ffici
ents
E1,
E2,
E3,
E4,
E0,
Cor
rela
tion
Coe
ffici
ents
,aM
ultip
leC
orre
latio
nC
oeffi
cien
t(R
),an
dFi
sher
Coe
ffici
ents
(F)
for
the
Dep
ende
ncy
Eq.
(8)
Org
anic
com
p.So
rben
tof
mob
ileph
ase
E1
E2
E3
E4
E0
RF
MC
H-1
0bE
than
ol0.
0442
0.10
16—
0.
0309
1.83
920.
9959
1918
Mic
roPa
k(0
.552
)(0
.590
)0.
1221
(0.
761)
(0.5
14)
Ace
toni
trile
0.04
470.
0561
01
272
0.
0304
1.82
420.
9924
441
YM
Cb
(0.4
96)
(0.4
94)
(0.4
13)
(0.
856)
phen
ylT
etra
hydr
ofur
an0.
0368
0.00
41—
0.
0223
1.29
300.
9839
83(0
.557
)(0
.519
)0.
0432
(0.
811)
(0.4
06)
Ace
toni
trile
0.01
860.
1295
—
0.03
062.
7299
0.99
6640
3Y
MC
c(0
.653
)(0
.667
)0.
3816
(0.
734)
OD
ST
etra
hydr
ofur
an0.
0096
0.01
61(0
.562
)
0.02
592.
0860
0.99
4120
3(0
.232
)(0
.203
)
0166
5(
0.96
3)(0
.126
)
aC
orre
latio
nco
effic
ient
sE
iw
ithlg
k′ar
egi
ven
inpa
rent
hese
s.b
For
calc
ulat
ions
,the
rete
ntio
nva
lues
for
benz
ene,
naph
thal
ene,
phen
anth
rene
,ant
hrac
ene,
pyre
ne,t
riph
enyl
ene,
chry
sene
,tet
raph
ene,
pery
lene
,ben
z[a]
pyr-
ene,
1,2,
7,8-
dibe
nzan
thra
cene
,1,
2,5,
6-di
benz
anth
race
ne,
1,2,
-ben
zper
ylen
e,an
dco
rone
new
ere
used
,th
eet
hano
lco
nten
tin
wat
erfr
om60
to10
0vo
l%,
colu
mn
tem
pera
ture
39°C
cFo
rca
lcul
atio
ns,
the
rete
ntio
nva
lues
for
benz
ene,
naph
thal
ene,
phen
anth
rene
,an
thra
cene
,py
rene
,ch
ryse
ne,
tetr
aphe
ne,
and
benz
[a]p
yren
eon
the
YM
Cph
enyl
with
the
cont
ent
ofac
eton
itrile
and
tetr
ahyd
rofu
ran
inw
ater
from
50to
80an
d50
to60
vol%
,an
don
the
YM
CO
DS
from
70to
90an
d60
to70
vol%
,re
spec
tivel
y,w
ere
used
.

244 Nikitin and Lanin
TABLE 10 Retention of n-Alkanes in RP HPLC. Coefficients H1, H2, H0,Correlation Coefficients,a Multiple Correlation Coefficient (R), and Fisher Coefficients(F) for the Dependency Eq. (23)
Organic comp.Sorbent of mobile phase H1 H2 H3 H0 R F
Acetonitrile 0.0854 0.0336 1.9682 0.9912 564YMCb (0.3843) (0.8664)phenyl Tetrahydrofuran 0.0540 0.0288 1.7596 0.9863 161
(0.6562) (0.7664)Acetonitrile 0.2344 0.0168 0.0022 0.8393 0.9994 5567
YMC (0.3842) (0.8664) (0.0888)ODS Tetrahydrofuran 0.2008 0.0161 0.0027 0.5845 0.9996 3258
(0.6562) (0.7364) (0.3968)
a Correlation coefficients Hi with lg k′ are given in parenthesesb For calculations, the retention values for pentane, hexane, heptane, octane, decane, dodecane onthe YMC phenyl stationary phase were used (the content of acetonitrile and tetrahydrofuran in waterfrom 50 to 80 and from 50 to 60 vol%, respectively).
alkanes can be due to the fact that the distribution constant of saturated hydrocar-bons between the hydrophobic sorbent and the polar mobile phase (as well asthe relative increments accounted for one carbon atom) is greater than that ofPAHs whose electrons are able to specifically interact with the mobile phase.
The results given in Table 11 show that the proposed model also can be usedin NP HPLC. As would be expected, inversion (in comparison with RP HPLC)the phase polarity of the chromatographic system resulted in a change of thesign of the coefficients E3 and E0. It accounts for the fact that the coefficient E3
characterizing SI of π electrons with the polar groups of the components of themobile phases and sorbents will reflect an increase in PAH retention (in the caseof NP HPLC) and a decrease in their retention (in the case of RP HPLC). Achange in the sign of E0 reflecting the contribution of NI to the PAH retentioncorresponds to the character of the n-alkane distribution between the polar andnonpolar (weakly polar) components of the chromatographic system.
The sign of the coefficients E1 and E2 does not depend on the type of thechromatographic system (RP or NP). However, in NP HPLC E1 E 2, whereasin the case of RP HPLC E1 E2 since the atoms of type I having greater electrondensity as compared with the atoms of type II and III interact more strongly witha more polar mobile phase. An increased concentration [c1 Eq. (8)] due to themodifying additive to the mobile phase results in less retention of PAHs in allcases (E4 0). It follows from Table 11 that the character of PAH retention atsmall concentrations of the additive, which is indicated by smaller values of the

Retention Models of PAHs in HPLC 245T
AB
LE
11R
eten
tion
ofPA
Hs
inN
PH
PLC
.C
oeffi
cien
tsE
1,
E2,
E3,
E4,
E0,
Cor
rela
tion
Coe
ffici
ents
,aM
ultip
leC
orre
latio
nC
oeffi
cien
t(R
),an
dFi
sher
Coe
ffici
ents
(F)
for
the
Dep
ende
ncy
Eq.
(8)
Pola
rco
mp.
ofSo
rben
tth
em
obile
phas
eE
1E
2E
3E
4E
0R
F
Chl
orof
orm
0.07
020.
0109
0.13
60
0.06
20—
0.93
30Si
O2b
(0–5
vol%
)(0
.362
)(0
.347
)(0
.293
)(
0.84
8)1.
0737
Mic
roPa
kC
hlor
ofor
m0.
0620
0.01
060.
1418
0.
408
0.98
7345
4(3
–15
vol%
)(0
.548
)(0
.540
)(0
.463
)(
0.78
7)—
1.21
81C
hlor
ofor
m0.
0706
0.04
5602
051
0.
0360
—0.
9705
295
NH
2-10
b(0
–25
vol%
)(0
.516
)(0
.588
)(0
.518
)(
0.75
5)1.
1886
Mic
roPa
kC
hlor
ofor
m0.
0625
0.04
200.
2125
0.
0282
0.98
7357
9(5
–25
vol%
)(0
.625
)(0
.724
)(0
.645
)(
0.64
4)—
Isop
ropa
nol
0.07
210.
0406
0.22
50
0.03
601.
2287
0.80
1533
(0–2
0vo
l%)
(0.4
74)
(0.5
36)
(0.4
75)
(0.
576)
Isop
ropa
nol
0.06
430.
0359
0.23
63
0.01
08—
0.98
8564
3(3
–20
vol%
)(0
.793
)(0
.912
)(0
.817
)(
0.28
5)1.
5443
—1.
8056
Chl
orof
orm
0.07
300.
0113
—
0.03
31—
0.98
3061
5C
N-1
0b(0
–20
vol%
)(0
.505
)(0
.476
)0.
3816
(0.
823)
1.16
18M
icro
Pak
Chl
orof
orm
0.06
990.
0106
(0.5
62)
0.
0314
0.98
4155
8(1
–20
vol%
)(0
.522
)(0
.493
)
0166
5(
0.81
1)—
(0.1
26)
1.14
50
aC
orre
latio
nco
effic
ient
sE
iw
ithlg
k’ar
egi
ven
inpa
rent
hese
s.b
For
calc
ulat
ions
,th
ere
tent
ion
valu
esfo
rna
phth
alen
e,an
thra
cene
,ph
enan
thre
ne,
pyre
ne,
tetr
acen
e,te
trap
hene
,ch
ryse
ne,
trip
heny
lene
,be
nz[a
]pyr
ene,
pery
lene
,1,
2,-b
enzp
eryl
ene,
and
1,2,
7,8-
dibe
nzan
thra
cene
wer
eus
edat
the
colu
mn
tem
pera
ture
29°C
.

246 Nikitin and Lanin
multiple correlation coefficients and Fisher criteria when the chromatographicsystems containing the modified and nonmodified mobile phases, are simulta-neously described by Eq. (8). That may be due to the property of the surface,i.e., its energetic and geometric heterogeneity, which is practically imperceptiblewhen 3–5 vol% of the modifying component is introduced. Nevertheless, theproposed model operates satisfactorily within a wide range of mobile phase com-positions.
VII. INFLUENCE OF THE MOLECULARPARAMETERS OF PAHs ON THEIR RETENTIONBY BONDED CYANOALKYL PHASES OFDIFFERENT TYPES
It was shown earlier that using the lg k′ versus carbon number relationship it ispossible to identify the qualitative difference in the chromatographic propertiesof PAHs on cyanodecyl and commercial phases. In order to analyze the behaviorof these phases, it is necessary to use a dependence that better reflects the effectof PAH structure on retention.
PAH retention on the studied polar stationary phases may be described asfollows:
lg k′ B1nI B2nII B3nIII B4(nπ/L) B0 (4)
Table 12 gives the values of the coefficients of Eq. (4) for the studied cyanoal-kyl stationary phases (cyanopropyl C3CN, cyanodecyl C10CN, and cyanoisodecyli-C10CN). As can be seen, Eq. (4) describes the retention of PAHs on the analyzedstationary phases. This is confirmed by the high values of the multiple correlationcoefficient R 0.9981 and Fisher criteria F 578. The values of coefficient B1
are quite close for all stationary phases considered, whereas the value of coeffi-cients B2, B3, and B4 for silica gel and the C3CN phase are quite different fromthose obtained for the C10CN and i-C10CN phases. This indicates a similarity inthe adsorption properties of silica gel and silica gel modified by cyanopropylgroups, on the one hand, and the sorbents containing cyanodecyl groups on theother. The smaller (5–8 times less) values of the B2 and B3 coefficients for silicagel, as compared with the cyanodecyl phases, are indicative of considerably lessspecific interaction of the silanol groups with the ‘‘inner’’ carbon atoms of thePAH molecule (type II and III carbon atoms), as compared with the interactionof the nitrile groups in the cyanodecyl phases with these carbon atoms. The C3CNphase represents an intermediate position. The B2 and B3 values of the cyanopro-pyl phase are approximately twice those for silica gel but are still much smallerthan the corresponding values for the long-chain C10CN and i-C10CN phases.

Retention Models of PAHs in HPLC 247
TABLE 12 Coefficients B1, B2, B3, B4, B0, the CorrelationCoefficients (r),a and Fisher Coefficients (F) for Eq. (4). StationaryPhase: Silica Gel or Various Cyanoalkyl Phases. Mobile Phase: n-Hexane, Temperature 29°C
Parameter SiO2 C3CN C10CN i-C10CN
B1 0.1022 0.1118 0.1040 0.0894r 0.9646 0.9557 0.8564 0.8705B2 0.0116 0.0182 0.1014 0.0818r 0.8436 0.8523 0.9437 0.9360B3 0.0145 0.0289 0.0996 0.0831r 0.0969 0.0670 0.0315 0.0308B4 0.1208 0.1265 0.1011 0.0455r 0.6279 0.6462 0.7839 0.7648B0 1.2154 1.3846 1.6040 1.7125Multiple 0.9983 0.9981 0.9994 0.9993
correlationF 672.39 577.97 1796.64 1607.58
This can be attributed either to poor modification of the C3CN phase surface orto a high degree of interaction between the nitrile groups of the bonded layerand the surface silanol groups, which are weakly screened by the short hydrocar-bon chains (propyl). In the case of cyanodecyl phases, the surface silanol groupsare less available and thus the main adsorption centers appear to be the ‘‘free’’nitrile groups in the normal phase chromatography of PAHs.
Analysis of the values of coefficients B1, B2, and B3 has shown that in thecase of adsorption on the cyanodecyl phases the electrostatic interaction of freenitrile groups and PAH molecules is weakly influenced by the difference in thedistribution of the electron density of the peripheral (type I) and inner (type IIand III) carbon atoms in the PAH molecules. In the case of the cyanopropyl phaseand silica gel, the deficiency of the electron density of the inner carbon atomsin the PAH molecule results in less contribution to the retention of peri-condensedPAHs as compared to cata-condensed PAHs and in the corresponding changesof the elution sequence as compared with the cyanodecyl phases (see Table 13).
The difference in the retention of isomeric PAH molecules is determined toa great extent by the difference in their sizes (nπ/L). It is clear that the effect ofthis difference on retention will be more pronounced when the PAH moleculecan simultaneously interact with several adsorption centers, i.e., at least two. Thiseffect is more readily attained on silica gel and silica gel modified with cyanopro-pyl groups, as indicated by the maximal value of coefficient B4 (0.1208 and
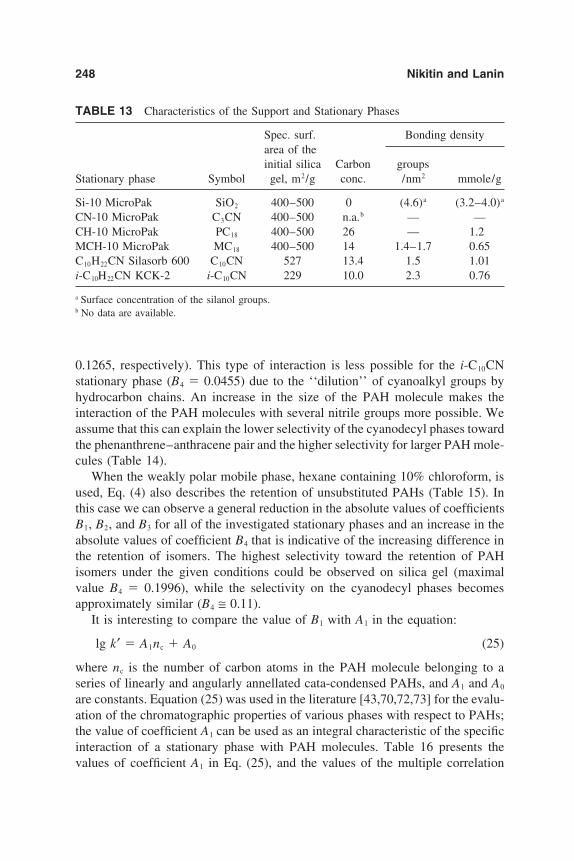
248 Nikitin and Lanin
TABLE 13 Characteristics of the Support and Stationary Phases
Spec. surf. Bonding densityarea of theinitial silica Carbon groups
Stationary phase Symbol gel, m2/g conc. /nm2 mmole/g
Si-10 MicroPak SiO2 400–500 0 (4.6)a (3.2–4.0)a
CN-10 MicroPak C3CN 400–500 n.a.b — —CH-10 MicroPak PC18 400–500 26 — 1.2MCH-10 MicroPak MC18 400–500 14 1.4–1.7 0.65C10H22CN Silasorb 600 C10CN 527 13.4 1.5 1.01i-C10H22CN KCK-2 i-C10CN 229 10.0 2.3 0.76
a Surface concentration of the silanol groups.b No data are available.
0.1265, respectively). This type of interaction is less possible for the i-C10CNstationary phase (B4 0.0455) due to the ‘‘dilution’’ of cyanoalkyl groups byhydrocarbon chains. An increase in the size of the PAH molecule makes theinteraction of the PAH molecules with several nitrile groups more possible. Weassume that this can explain the lower selectivity of the cyanodecyl phases towardthe phenanthrene–anthracene pair and the higher selectivity for larger PAH mole-cules (Table 14).
When the weakly polar mobile phase, hexane containing 10% chloroform, isused, Eq. (4) also describes the retention of unsubstituted PAHs (Table 15). Inthis case we can observe a general reduction in the absolute values of coefficientsB1, B2, and B3 for all of the investigated stationary phases and an increase in theabsolute values of coefficient B4 that is indicative of the increasing difference inthe retention of isomers. The highest selectivity toward the retention of PAHisomers under the given conditions could be observed on silica gel (maximalvalue B4 0.1996), while the selectivity on the cyanodecyl phases becomesapproximately similar (B4 ≅ 0.11).
It is interesting to compare the value of B1 with A1 in the equation:
lg k′ A1nc A0 (25)
where nc is the number of carbon atoms in the PAH molecule belonging to aseries of linearly and angularly annellated cata-condensed PAHs, and A1 and A0
are constants. Equation (25) was used in the literature [43,70,72,73] for the evalu-ation of the chromatographic properties of various phases with respect to PAHs;the value of coefficient A1 can be used as an integral characteristic of the specificinteraction of a stationary phase with PAH molecules. Table 16 presents thevalues of coefficient A1 in Eq. (25), and the values of the multiple correlation

Retention Models of PAHs in HPLC 249
TABLE 14 Selectivity (α) of the Stationary Phases Toward PAHs Differing in theNumber of Carbon Atoms in their Molecule (Nos. 1–3) and to Isomeric PAHs (Nos.4–6). Mobile Phase; Hexane (Upper Numbers) and Hexane Containing 10%Chloroform (Lower Numbers)
α k′2/k ′1
No. PAH SiO2 C3CN C10CN i-C10CN
1 Triphenylene/Phenanthrene 1.80 1.84 2.74 2.151.44 1.56 2.26 2.08
2 1,2,7,8-Dibenzanthracene/ 1.71 1.83 2.68 2.22Tetraphene 1.33 1.49 2.15 1.96
3 Benz[a]pyrene/Triphenylene 1.04 1.11 1.62 1.491.04 1.10 1.50 1.45
4 Phenanthrene/Anthracene 1.08 1.11 1.04 1.031.12 1.07 1.04 1.04
5 Triphenylene/Tetracene/ 1.11 1.13 1.12 1.021.18 1.16 1.12 1.11
6 Perylene/Benz[a]pyrene 1.10 1.11 1.09 1.081.11 1.13 1.11 1.08
TABLE 15 Coefficients B1, B2, B3, B4, B0, the Correlation Coefficients (r),a andFisher Coefficients (F) for Eq. (4). Stationary Phase: Silica Gel or Various CyanoalkylPhases. Mobile Phase: n-Hexane Containing 10 vol% Chloroform, Temperature 29°C
Parameter SiO2 C3CN C10CN i-C10CN
B1 0.0672 0.0714 0.0757 0.0757r 0.8888 0.9211 0.8330 0.8492B2 0.0047 0.0126 0.0864 0.0713r 0.8632 0.8796 0.9510 0.9431B3 0.0201 0.0226 0.0856 0.0746r 0.1600 0.0423 0.0212 0.0203B4 0.1996 0.1454 0.1139 0.1067r 0.7310 0.7131 0.8078 0.7937B0 1.7742 1.4852 1.5516 1.8271Multiple correlation 0.9783 0.9946 0.9991 0.9989F 50.19 208.04 1230.25 1039.48
a r is the correlation coefficient for Bi versus lg k ′.

250 Nikitin and Lanin
TABLE 16 Coefficients A1, A0, the Multiple Correlation Coefficient (R), and FisherCoefficient (F) for Eq. (24). Stationary Phase: Silica Gel or Various CyanoalkylPhases, Temperature 29°C
Parameter SiO2 C3CN C10CN i-C10CN
Mobile phase; hexane
A1 0.0601 0.0685 0.1047 0.0867A0 0.8253 0.9824 1.4866 1.6439R 0.9989 0.9996 0.9998 0.9995F 2202.1 6717.3 13189.0 4721.8
Mobile phase; hexane 10 vol% chloroform
A1 0.0417 0.0460 0.0836 0.0759A0 1.3976 1.1772 1.4643 1.7033R 0.9739 0.9963 0.9997 0.9994F 92.0 679.2 7465.1 4080.4
coefficients and Fisher criteria (F) calculated with respect to the retention ofnaphthalene, anthracene, phenanthrene, tetracene, tetraphene, and 1,2,5,6-dibenzanthracene on the analyzed stationary phases upon elution by nondriedhexane or hexane with 10% chloroform.
Table 16 shows that the interaction of the cata-condensed PAHs and the nitrilegroups of cyanodecyl phases is stronger (A1 0.1047 and 0.0867) than the inter-action with the silanol groups on the silica gel surface (A1 0.0601). The valuesof coefficient A1 for the cyanopropyl phase (A1 0.0685) are greater than thosefor silica gel but noticeably less than those for the cyanodecyl phases. It is ofinterest to note the values for the silica gel µ-Porasil and the cyanolkyl phaseµBondapak CN (A1 0.063 and 0.057, respectively) presented by Ref. 73, whichare close to the values obtained by us. A comparison of coefficients B1 in Eq.(4) and A1 in Eq. (25) shows that they practically coincide for the cyanodecylphases. In the case of silica gel and the cyanopropyl phase, the values of A1 areless than the values of B1, whereas they are greater than those for B2, due to asignificant difference in the interaction between these phases and the peripheral(type I) and inner (type II) carbon atoms of the PAH molecules.
Thus it follows that the application of Eq. (25) for series of cata-condensedPAHs also enables us to define the difference in the properties of the studiedstationary phases toward PAHs. However, Eq. (25) is less informative than Eq.(4) and does not describe the behavior of pericondensed PAHs as well as theretention sequence of isometric PAHs.

Retention Models of PAHs in HPLC 251
VIII. RETENTION OF POLYPHENYLS ANDSUBSTITUTED POLYCYCLIC AROMATICHYDROCARBONS IN THE SYSTEMHYDROXYLATED SILICA-n-HEXANE
The study of the regularity of chromatographic retention of polyphenyls (PPH)and substituted (PPHs) and substituted PAHs is very important because thisknowledge makes possible the use of NP HPLC for determination of individualPAHs (many of them carcinogenic) in different samples. In exhaust gases frominternal combustion engines PAHs exist presumably as unsubstituted aromatichydrocarbons or they can contain one or two methyl groups. The structure ofPAH molecules in coal tar is also simple.
In this connection was studied the retention regularity of PPHs and unsubsti-tuted and methyl-substituted PAHs on hydroxylated silica Silasorb 600 with n-hexane used as mobile phase.
Table 17 presents the structural parameters of the molecules and the valuesof the retention parameters (the capacity factor k′) for the aromatic hydrocarbons(AHs) investigated.
Figure 4 shows the chromatogram obtained from a model mixture (CCl4 andthe AHs benzene, naphthalene, biphenyl, phenanthrene, chrysene, and para-ter-phenyl). All components of the mixture were completely separated (resolutionRs 1 for all pairs of consecutive peaks) and peaks were reasonably symmetricaland narrow, indicating the high efficiency of the chromatographic system used.
It is apparent that to a first approximation the chromatographic retention ofPAH is proportional to the number of aromatic cycles:
Z f (n e) (26)
where Z is the chromatographic retention parameter (e.g., lg t′R, lg V′ or lg k′)and n e is the number of aromatic cycles in a PAH molecule. This can also beexpressed by a linear equation:
Z A1n e A0 (27)
where A1 and A0 are constants.Equation (27), however, obviously only describes satisfactory the retention
of substances belonging to one class of compound, e.g., unsubstituted linearlyannellated polycyclic aromatic hydrocarbons, or to a series of polyphenyls (Fig.5, Table 17).
As can be concluded from Fig. 5, the retention of PAH isomers (anthracene-phenanthrene, tetraphene-tetracene) mainly depends on the number of aromaticcycles, but the corresponding k′ values for isomers are remarkably different. Thepresence of methyl groups in molecules of PAHs increases their retention incomparison with unsubstituted molecules. The retention of PAH molecules is
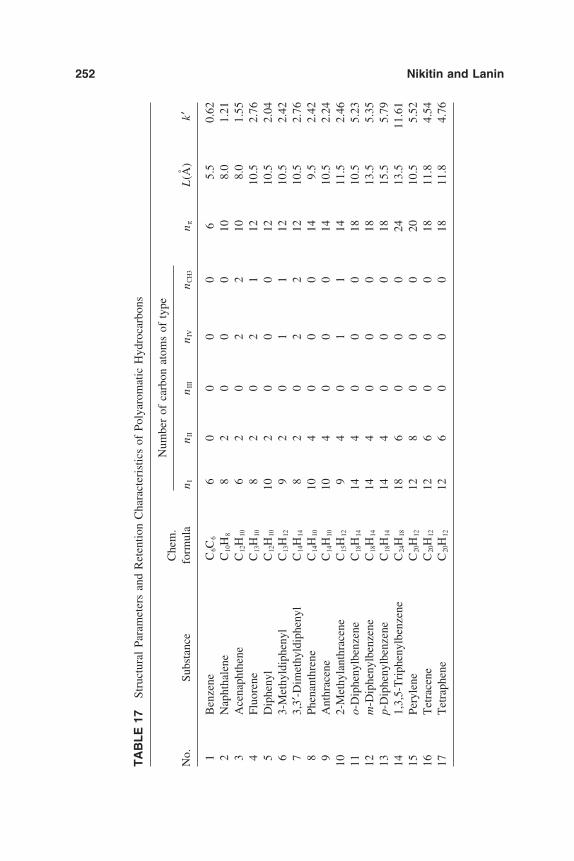
252 Nikitin and Lanin
TA
BL
E17
Stru
ctur
alPa
ram
eter
san
dR
eten
tion
Cha
ract
eris
tics
ofPo
lyar
omat
icH
ydro
carb
ons
Num
ber
ofca
rbon
atom
sof
type
Che
m.
No.
Subs
tanc
efo
rmul
an
In
IIn
III
nIV
nC
H3
nπ
L(A
)k′
1B
enze
neC
6C6
60
00
06
5.5
0.62
2N
apht
hale
neC
10H
88
20
00
108.
01.
213
Ace
naph
then
eC
12H
106
20
22
108.
01.
554
Fluo
rene
C13
H10
82
02
112
10.5
2.76
5D
iphe
nyl
C12
H10
102
00
012
10.5
2.04
63-
Met
hyld
iphe
nyl
C13
H12
92
01
112
10.5
2.42
73,
3′-D
imet
hyld
iphe
nyl
C14
H14
82
02
212
10.5
2.76
8Ph
enan
thre
neC
14H
1010
40
00
149.
52.
429
Ant
hrac
ene
C14
H10
104
00
014
10.5
2.24
102-
Met
hyla
nthr
acen
eC
15H
129
40
11
1411
.52.
4611
o-D
iphe
nylb
enze
neC
18H
1414
40
00
1810
.55.
2312
m-D
iphe
nylb
enze
neC
18H
1414
40
00
1813
.55.
3513
p-D
iphe
nylb
enze
neC
18H
1414
40
00
1815
.55.
7914
1,3,
5-T
riph
enyl
benz
ene
C24
H18
186
00
024
13.5
11.6
115
Pery
lene
C20
H12
128
00
020
10.5
5.52
16T
etra
cene
C20
H12
126
00
018
11.8
4.54
17T
etra
phen
eC
20H
1212
60
00
1811
.84.
76
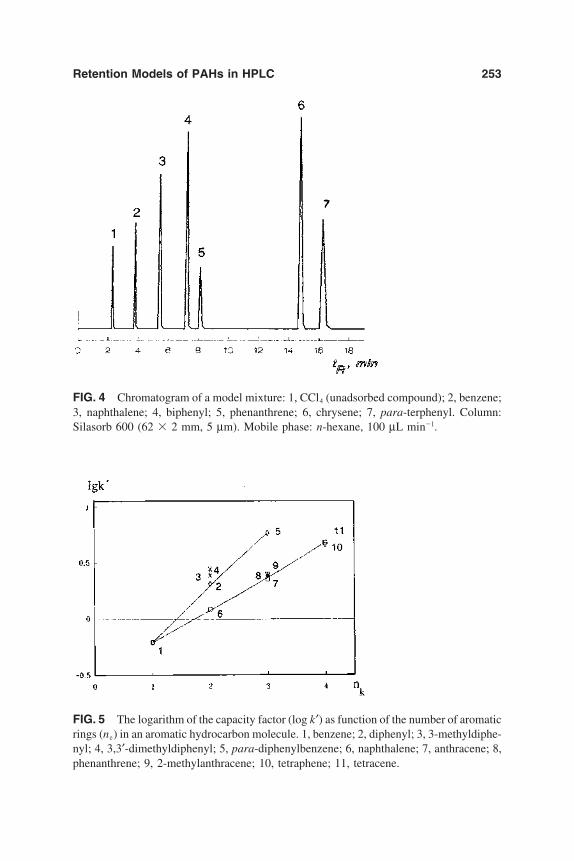
Retention Models of PAHs in HPLC 253
FIG. 4 Chromatogram of a model mixture: 1, CCl4 (unadsorbed compound); 2, benzene;3, naphthalene; 4, biphenyl; 5, phenanthrene; 6, chrysene; 7, para-terphenyl. Column:Silasorb 600 (62 2 mm, 5 µm). Mobile phase: n-hexane, 100 µL min1.
FIG. 5 The logarithm of the capacity factor (log k′) as function of the number of aromaticrings (ne) in an aromatic hydrocarbon molecule. 1, benzene; 2, diphenyl; 3, 3-methyldiphe-nyl; 4, 3,3′-dimethyldiphenyl; 5, para-diphenylbenzene; 6, naphthalene; 7, anthracene; 8,phenanthrene; 9, 2-methylanthracene; 10, tetraphene; 11, tetracene.

254 Nikitin and Lanin
strongly dependent on the type of bond between aromatic rings in these mole-cules. So the biphenyl and para-terphenyl molecules are retained considerablymore strongly than corresponding PAHs with two and three condensed rings(Fig. 5).
Obviously, the dependence of HPLC retention on PAH structure is multipa-rametric; consideration of one parameter only in a correlation equation does notprovide adequate description of chromatographic performance unless the correctparameter is chosen.
It is possible to use Eq. (25) to correlate the retention of PAHs with the numberof carbon atoms in the PAH molecule:
lg k′ A1nc A0 (25)
where nc is number of carbon atoms in a series of linearly or angularly annellatedcata-condensed PAHs and A1 and A0 are constants. Equation (25) has been usedto evaluate chromatographic properties of various stationary phases used for chro-matography of PAH [45,70,72,73]. The value of A1 can be used as an integratedcharacteristic of specific interactions between the stationary phase and a PAHmolecule. The correlation Eq. (25) provides better results (Fig. 6) than Eq. (27)(see Fig. 5).
Figure 6 demonstrates that the slope of the linear dependencies lg k′ on nc isdifferent for polyphenyls and polycyclic aromatic hydrocarbons; the para-terphe-
FIG. 6 The logarithm of the capacity factor (log k′) as function of the number of carbonatoms (nc) in an aromatic hydrocarbon molecule. Substance identification as for Fig. 5.

Retention Models of PAHs in HPLC 255
nyl molecule is retained more strongly than tetracene or tetraphene moleculeswith the same number of carbon atoms.
Assuming an identical NP retention mechanism for aromatic hydrocarbons inthe polyphenyl series and for PAH, it is possible to describe their retention bya single or by a set of closely related correlation equations. In this case it isexpedient to start to describe the additive retention of the aromatic hydrocarbonof each series AH (PAH or PHH) by the simplest equations. If necessary, it ispossible to use more complex equations using more detailed description of molec-ular structure until an adequate model of chromatographic retention is obtained(an adequate retention model being characterized by small differences betweencalculated and experimental data and by high values of the correlation coeffi-cient). For this purpose comparison of increments related to atoms of the sametype in molecules of different aromatic hydrocarbons (PAH and PPH) should beperformed as the equation becomes increasingly complex. The final aim is toachieve a good proximity of values of increments.
It is clear that from the perspective of construction of retention modes forindividual PAHs in NP HPLC the use of the number of aromatic rings n or thenumber of carbon atoms nc in an AH molecule as a simple parameter does notmake possible an adequate description of retention.
It was shown that the retention of unsubstituted PAHs in NP HPLC (on hy-droxylated silica gel and various cyanoalkyl stationary phases eluted with n-hexane) is described by the equation:
lg k′ B1nI B2nII B3nIII B4(nπ/L) B0 (4)
The values of Bi of Eq. (4) are given in Table 12.With methyl-substituted PAH and PPH it is necessary to allocate four types
of carbon atoms (Fig. 7). Similarly in terms of Eq. (4) it is also possible to de-scribe the retention of methyl-substituted PAHs and PPHs by means of
lg k′ A1nI A2nII A3nIII A4nIV A5(nπ/L) A0 (28)
where A1–A4 are the equation coefficients reflecting the contribution to retentionof different types of carbon atom (see Fig. 7).
Values of the coefficients Ai for PAH and PPH, calculated from the data inTable 17, are presented in Tables 18 and 19. It is apparent (see Tables 12 and18), that the values of the coefficients Ai and Bi for different types of carbonatom from PAH molecules have the same sign and close values. The differencesfor the B4 and A5 values can be explained by the use of retention values of differ-ent PAH molecules when calculating the coefficients for Tables 12 or 18, andthe introduction in Eq. (28) of an additional type (IV) of carbon atom, becauseof the presence of methyl substitution in PAH molecules. Thus, Eq. (28), similarto Eq. (4) offered earlier, describes the chromatographic behavior of PAHs of

256 Nikitin and Lanin
FIG. 7 Types of carbon atoms in molecules of methyl-substituted polycyclic aromatichydrocarbons (a) and polyphenyls (b).
TABLE 18 Coefficients A1, A2, A3, A4, A5, A0 for Eq. (28) and Multiple Correlation(R) for Condensed Polyaromatic Hydrocarbons. Stationary Phase: Hydroxylated SilicaGel. Mobile Phase; n-Hexane. Temperature 22°C
Equation coefficients
Equation Ai Significance
lg k′ A1n I A2n II A3nIII A4n IV A5(nπ/L) A0 (28) A1 0.122 0.0036A2 0.0211 0.000A3 0.021 0.0043A4 0.160 0.0079A5 0.05 0.029A0 0.8850 0.0000R 0.9993

Retention Models of PAHs in HPLC 257
TABLE 19 Coefficients Ai, Ci, Di, Fi, and Multiple Correlation (R) for PolyphenylHydrocarbons. Stationary Phase: Hydroxylated Silica Gel. Mobile Phase; n-Hexane.Temperature 22°C
Equation coefficients
Equation Xi Significance
lg k′ A1ne A0 (27) A1 0.40 0.033A0 0.05 0.088R 0.9806
lg k′ C1n I C2n II C3nIV C0 (30) C1 0.0189 0.0000C2 0.1500 0.0000C3 0.0349 0.0009C0 0.1500 0.0000R 0.9953
lg k′ D1n I D2n II D4(nπ/L) D0 (31) D1 0.06 0.02D2 0.32 0.053D4 0.09 0.073D0 0.4 0.14R 0.9968
lg k′ F1nI F2nII F3nIV F4(nπ/L) F0 (32) F1 0.0184 0.0036F2 1.16 0.0000F3 0.0398 0.0009F4 8.96 0.09F0 0.0809 0.0000R 0.99685
different classes (cata-condensed and peri-condensed) in NP HPLC and correctlypredicts a retention order for isomeric PAH.
Comparison of coefficient values of Eq. (28) for PAH and Eqs. (30)–(32) forPPH (Tables 18 and 19) shows that they often have different values for nominallyidentical types of carbon atoms (Fig. 7). This confirms the difficulty of mathemat-ical description of PAH and PPH retention by use of a single equation, althoughin the description of retention for each of these classes (PAH and PPH) the highvalues of multiple correlation coefficients are obtained for AH as a separate class.The noted discrepancy in coefficient values from equations, describing the chro-matographic behavior of PAHs and PPHs, indicates the different mechanisms ofadsorption of PAH and PPH molecules. This is a result of the different orientationof the molecules when adsorbed on a silica surfaces because flat orientation ishindered or impossible for polyphenyls (e.g., ortho-terphenyl) because of highpotential energy barriers to internal rotation [74]. Although this difference com-plicates the optimization of chromatographic separation of PAH and PPH, it in-

258 Nikitin and Lanin
creases the possibility of identifying individual AHs belonging to these classesof organic molecule.
IX. OPTIMIZATION OF A MOBILE PHASECOMPOSITION AND IDENTIFICATION OFCOMPONENTS OF PAH MIXES
The following two problems are most frequently found in liquid chromatographyof PAHs: (1) optimization (choice) of separation conditions and (2) identificationof the components of the analyzed complex mixture. Thus, in order to predictthe PAH retention times and choose the analysis conditions (in our case, themobile phase composition) for separating the mixture within a certain (given)period of time, we can apply Eq. (5) (see Table 4). The precision of predictionwould meet the practical requirements. Equation (5) is found to be feasible forthe purpose of substance identification.
Besides the properties of the PAH molecules the concentration of more polaraddition to the mobile phase should be considered in order to optimize the mobilephase composition. Therefore, in this case Eq. (8) appears to be more useful thanEq. (5).
lg k′ E1nI E2(nII nIII) E3(nπ/L) E4C E0 (8)
where Ei denotes the coefficients, C is the content of ethanol in the mobile phase,vol% (in this case, for more convenient treatment of the experimental data, weapplied the concentration of ethanol in water, but not otherwise), as it enablesthe prediction of the properties of the mobile phase of any (quantitative) composi-
TABLE 20 Values of Coefficients E1, E2, E3, E4, E0, Correlation Coefficients,a andFisher Coefficients (F) for the Dependence Eq. (18) (the Retention Values ofAnthracene, Pyrene, Triphenylene, Tetraphene, Benz[a]pyrene, 1,2,7,8-Dibenzanthracene Were Used for the Calculation); Column; MCH-10 ‘‘MicroPak,’’Water Content in Ethanol from 0 to 40 vol%, Temperature 39°C
Dependence coefficientsMultiple
E1 E2 E3 E4 E0 correlation F
0.05254 0.09754 0.13558 0.03195 1.87454 0.99649 884.66(0.34055)a (0.36186) (0.14352) (0.92228)
a Parentheses are used to give correlation coefficients Ei with lg k′.

Retention Models of PAHs in HPLC 259
TABLE 21 Results of the Structural-Chromatographic Analysis of PolyaromaticHydrocarbons [Calculations According to Eq. (5)]
L (nI nII nIII)/Substance n I nI nII nπ/L (nπ/L)
1. Phenanthrene 8.97 3.93 1.169 11.03(10) (4) (9.5)
2. Anthracene 9.89 3.79 1.289 10.56(10) (4) (10.5)
3. Pyrene 9.48 5.99 1.479 10.46(10) (6) (9.5)
4. Triphenylene 12.13 5.96 1.946 13.44(12) (6) (9.5)
5. Chrysene 10.51 6.44 1.260 13.48(12) (6) (11.8)
6. Tetraphene 12.72 6.48 1.806 10.63(12) (6) (11.8)
7. Perylene 12.86 8.02 2.250 9.28(12) (8) (10.5)
8. Benz[a]pyrene 12.58 8.02 1.919 10.73(12) (8) (11.8)
9. 1,2,7,8,-Dibenzanthracene 13.35 7.79 1.376 15.36(14) (8) (13.5)
a The actual values of the molecule’s parameter are given in parentheses.
tion, even in the absence of relative experimental data in the composition. Thisequation is a specific case of the well-known dependency [41,75]:
lg k′ A BC (29)
where A and B are the coefficients, and C is the concentration of one of thesubstances in the two-component mobile phase. The values of these coefficientsare given in Table 20. The calculations have shown that Eq. (8) describes theretention on the six reference substances and other PAHs.
Three types of problems occur in analytical chemistry [76]: (1) when the quali-tative composition of the test mixture is completely known and the referencesamples are available, i.e., individual substances or the data on their retention;(2) when the object of the test is of known origin and when the reference samplesof the supposed components or the data on their retention are available; (3) wheninformation concerning the object composition is not available. When analyzingPAHs for solving the problems of the first and particularly of the second type,Eq. (5) is the most feasible. The proposed approach to the identification of the

260 Nikitin and Lanin
components (chromatographic zone) consists of the following: the analyzed mix-ture is separated on one and the same sorbent (column) with the mobile phasesof various composition for which the coefficients of Eq. (5) were calculated.Then, using the experimental data, the logarithms of the capacity factors are cal-culated, and the system of linear equations of type (5) is constructed and solvedwith respect to nI, nII nIII, and L (Table 21) with the use of a computer. Thuswe obtain the point in three-dimensional space and can correctly identify thesubstance using the values of the point coordinates (comparing the values withthe data bank for the given class of substances). Certainly another advantage ofEq. (5) is the discreteness and evenness of two (nI and nII nIII) of three character-istic parameters, which simplifies rounding off to the nearest integer and increasesthe probability of correct identification.
REFERENCES
1. S. N. Lanin and Yu. S. Nikitin, Zh. Analit. Khimii (Rus). 42:1661 (1987).2. S. N. Lanin and Yu. S. Nikitin, Abstr. IV All Union Symp. on Molecular Liquid
Chromatography, Riga, 1987, p.11.3. S. N. Lanin and Yu. S. Nikitin, Chromatographia. 25:272 (1988).4. S. N. Lanin and Yu. S. Nikitin, Pure Appl. Chem. 61:2027 (1989).5. S. N. Lanin, Yu. S. Nikitin. A. A. Pyatygin, and S. M. Staroverov, Chromatographia.
25:147 (1989).6. S. N. Lanin and Yu. S. Nikitin, Zh. Analit. Khimii (Rus). 45:1939 (1990).7. A. V. Kiselev, in Phizicheskaja Khimiya, Sovremennye problemy (Ya. M. Kolotyr-
kin, ed.), Khimija, Moscow, 1982, p. 180.8. A. V. Kiselev, Chromatographia. 11:691 (1978).9. A. V. Kiselev, Mezhmolekulyarnye vzaimodeistviia v adsorbtsii i khromatographii,
Vysshaja Shkola, Moscow, 1986, p. 360.10. A. V. Kiselev, D. P. Poshkus, and Ya. I. Yashin, Molekulyarnye osnovy adsorbtsion-
noi khromatographii, Khimija, Moscow, 1986, p. 270.11. A. Ya. Gorbachevskii, A. V. Kiselev, Yu. S. Nikitin, and A. A. Pyatygin, Vestnik
Mosk. Univ. Ser. 2. Khimija. 26:364 (1985).12. A. Ya. Gorbachevskii A. V. Kiselev, Yu. S. Nikitin, and A. A. Pyatygin, Chromato-
graphia. 20:533 (1985).13. B. A. Rudenko, Z. Yu. Bulycheva, and L. V. Dylevskaya, Zh. Analit. Khimii (Rus).
39:344 1984.14. Z. Yu. Bulycheva, B. A. Rudenko, L. V. Dylevskaya, and V. F. Kutenev, Zh. Analit.
Khimii (Rus). 40:330 (1985).15. D. N. Grigorieva and R. V. Golovnya, Zh. Analit. Khimii (Rus). 40:1733 (1985).16. R. Kaliszan, CRC Crit. Anal. Chem. 16:323 (1986).17. R. Kaliszan Quantitative Structure–Chromatographic Retention Relationships, John
Wiley and Sons, New York, 1987.18. Ho Chu-Noi, D. L. Karlesky, J. R. Kennedy, and I. M. Warner, J. Liq. Chromatogra-
phy 9:1 (1986).

Retention Models of PAHs in HPLC 261
19. K. Jinno, Eighth International Symposium on Capillary Chromatography. Riva delGarda, Italy, 1987, Pt.2, Pp. 1143–1152.
20. V. D. Shatz and O. V. Sachartova, Vysokoeffektivnaya gidkostnaya chromatogra-phya, Zinante, Riga, 1988, p. 390.
21. P. L. Grizzle and J. S. Thomson, Anal. Chem. 54:1071 (1982).22. R. B. Sleight, J. Chromatography 83:31 (1973).23. A. Bylina, L. Gluzinski, K. Lesniak, and B. Radwanski, Chromatographia 17:132
(1983).24. R. E. Koopmans and R. Rekker, J. Chromatography 285:267 (1984).25. R. B. Hermann, J. Phys. Chem. 76:2754 (1972).26. F. S. Calixto and A. G. Raso, Chromatographia. 14:596 (1981).27. K. Jinno and A. Ishigaki, J. High Resolut. Chromatogr. Commun. 5:668 (1982).28. M. Randic, J. Chromatography 161:1 (1978).29. A. Radecki, H. Lamparczyk, and R. Kaliszan, Chromatographia 12:595 (1979).30. M. J. M. Wells, C. R. Clark, and R. Patterson, J. Chromatogr. Sci. 19:573 (1981).31. S. A. Wise, W. J. Bennett, F. R. Guenther, and W. E. May, J. Chromatogr. Sci. 19:
457 (1981).32. H. Hanai, Chromatographia 12:77 (1979).33. J. Sliwiok, A. Macioszczyk, and T. Kowalska, Chromatographia 14:138 (1981).34. J. Sliwiok, T. Kowalska, B. Kocjan, and B. Korczak, Chromatographia 14:363
(1981).35. K. Jinno, Anal. Lett. 15:1533 (1982).36. R. Kaliszan, J. Chromatogr. 220:71 (1981).37. W. Markowski, T. Dzido, and T. Wawrszynowicz, Pol. J. Chem. 52:2063 (1978).38. R. Kaliszan and H. Lamparczyk, J. Chromatogr. Sci. 16:246 (1978).39. R. J. Hurtubise, T. W. Allen, and H. F. Silver, J. Chromatography 235:517 (1982).40. N. Tanaka, Y. Tokuda, K. Iwaguchi, and M. Araki, J. Chromatography 239:761
(1982).41. T. Hanai and J. Hubert, J. Chromatography 291:81 (1984).42. J. F. Schabron, R. J. Hurtubise, and H. F. Silver, Anal. Chem. 49:2253 (1977).43. K. Jinno and K. Kawasaki, Chromatographia 17:445 (1983).44. K. Jinno and M. Okamoto, Chromatographia 18:495 (1984).45. A. N. Ageev, A. V. Kiselev, and Ya. I. Yashin, Chromatographia 13:669 (1980).46. J. E. Wilkinson, E. Struppe, and P. W. A. Jones, Third International Symposium on
Chemistry and Biology: Carcinogenesis and Mutagenesis, Ann. Arbor Science,1979, p. 217.
47. A. Matsunaga, Anal. Chem. 55:1375 (1983).48. M. Popl, V. Dolansky, and J. Mostecky, J. Chromatography 117:117 (1976).49. M. Popl, V. Dolansky, and J. Mostecky, J. Chromatography 59:329 (1971).50. O. A. Beiko, M. Yu. Isakov, V. Yu. Telly, and V. F. Novikova, Neftechimija, 22:
702 (1982).51. M. Popl, V. Dolansky, and J. Mostecky, J. Chromatography 91:649 (1974).52. H. Hemetsberger, A. Haac, and J. Kohler, Chromatographia 14:341 (1981).53. H. Hemetsberger, H. Klar, and H. Ricken, Chromatographia 13:277 (1980).54. W. Holstein, Chromatographia. 14:468 (1981).55. C. H. Lochmuller and C. W. Amoss, J. Chromatography 108:85 (1975).
262 Nikitin and Lanin
56. W. Holstein and D. Severin, Chromatographia 15:231 (1982).57. E. P. Lankmayer and K. Muller, J. Chromatography 170:139 (1979).58. J. Chmielowiec and A. E. George, Anal. Chem. 52:1154 (1980).59. K. G. Liphard, Chromatographia 13:603 (1980).60. V. Martiniand and J. Janak, J. Chromatography 65:477 (1972).61. V. M. Tatevskii, Zh. Fiz. Khimii. 68:1157 (1994).62. V. M. Tatevskii, Vestnik Mosk. Univ. Ser. 2. Khimija. 19:635 (1978).63. V. M. Tatevskii, Teorija fiziko-khimicheskich svoistv molekul i veschestv, MGU,
Moscow, 1987, p. 238.64. V. M. Tatevskii, Vestnik Mosk. Univ. Ser. 2. Khimija. 23:315 (1982).65. A. J. P. Martin, Biochem. Soc. Symp. 3:4 (1949).66. V. A. Palm, Osnovy kolichestvennoi teorii organicheskikh reaktsii, Khimija, Len-
ingrad, 1977, p. 359.67. L. R. Snyder, Principles of Adsorption Chromatography, Marcel Dekker, New York,
1968, p. 413.68. H. B. Klevens, J. Phys. Chem. 54:283 (1950).69. O. W. Adams and R. L. Miller, J. Am. Chem. Soc. 88:404 (1966).70. M. C. Hennion, C. Picard, C. Combellas, M. Cande, and R. Rosset, J. Chromatogra-
phy 210:211 (1981).71. L. R. Snyder, M. A. Quarry and J. L. Glaich Chromatograpia 24:33 (1987).72. W. R. Melander and Horvath, Chromatograpia 15:86 (1982).73. C. E. Ostman A. L. Colmsjo, Chromatograpia 25:25 (1988).74. W. J. Orville-Thomas (ed.), Internal Rotation of Molecules, Mir Press, Moscow,
1977, p. 510.75. L. R. Snyder, J. W. Dolan and J. R. Gant, J. Chromatogr. 165:3 (1979).76. M. S. Vigdergauz, Zh. Analit. Khimii (Rus). 39:151 (1984).

7Polymer-Modified Silica Resins forAqueous Size ExclusionChromatographyYORAM COHEN, RON S. FAIBISH, and MONTSERRATROVIRA-BRU Department of Chemical Engineering, University ofCalifornia, Los Angeles, Los Angeles, California
I. Introduction 263
II. Overview of Silica Resins Modification Techniques 267A. Coating of silica resins 267B. Silylation of silica resins 274C. Polymer-grafted silica resins 286
III. Graft Polymerization 292A. Process overview 292B. Graft polymerization and size exclusion chromatography 300
IV. Summary 308
References 308
I. INTRODUCTION
Size exclusion chromatography (SEC) is an analytical method in which polymers,proteins, and polypeptides, dissolved in an appropriate solvent, are separated bytheir molecular size as they are eluted through a column packed with a poroussupport. The choice of the optimal mobile and stationary phases is essential fora successful separation process [1]. Common packing materials that are used fororganic mobile phases are crosslinked polystyrene resins or silane-derivatized
263

264 Cohen et al.
silica (e.g., with a variety of organosilanes), whereas for aqueous mobile phasesthe most common stationary phases are crosslinked hydroxylated polymethacry-late, polypropylene oxide gels, or glyceryl-derived silica [2]. Packing materialsthat are based on crosslinked polysaccharides (e.g., dextrans) have also been usedextensively in aqueous SEC [3]. However, these soft resins exhibit poor mechani-cal stability when exposed to the high pressures in high performance SEC [3–5]. On the other hand, rigid SEC packings such as silica-based resins presentseveral advantages such as mechanical, chemical, and thermal stability, all ofwhich are very important in high-performance SEC [3,5,6]. Unfortunately, themost serious drawback of native silica packings is the presence of reactive silanolgroups on the silica surface [5,7,8].
Various solute–silica surface nonsterical interactions, which are facilitated bythe negatively charged silanol groups on the silica surface, lead to poor SECperformance of native silica packings. In essence, the silanol groups may be con-sidered as weak ion exchangers that can interact with charged solute molecules(e.g., charged proteins and polymers) causing delayed retention (of anionic spe-cies) or early elution (of cationic species) [9–11]. Indeed, when native silicaresins are used in SEC analyses, it is not uncommon to observe band shifts andbroadening of elution chromatograms due to secondary retention phenomena.This secondary retention is especially noticeable with aqueous SEC, where mo-bile phase pH can dramatically affect the nature of the silica surface. Dependingon the pH and ionic strength of the aqueous mobile phase, phenomena such asion exclusion and ion exchange can be the leading causes of secondary retentionwith silica packings. Ion exclusion can occur when the pH of the mobile phaseis greater than approximately 2, in which case the silica surface will be negativelycharged (isoelectric point, pI, of silica is about 2). Thus, negatively charged solutemolecules will have a shorter-than-expected retention time due to solute–silicarepulsive forces. Aqueous SEC of anionic solutes, for example, will result in ahigher apparent molecular weight (MW) than the true MW. On the other hand,if the solutes are positively charged, under the same pH conditions as above (pH 2), ion exchange will take place when solute molecules are attracted to thesilica surface. As a consequence, solute retention times will be longer than ex-pected and a lower apparent MW than the true one will be obtained.
In addition to the above two phenomena, significant nonspecific surface ad-sorption of solutes to the silica surface may occur due to binding of solute mole-cules (in particular, biopolymers such as proteins) to surface silanol groups[3,8,12]. The effect of the above nonspecific adsorption can be illustrated bysize exclusion chromatograms for the adsorption of Ficoll (a densely branchedpolysaccharide of a spherical shape) onto a silica gel packing (Fig. 1) [13]. Thenet difference between the areas of chromatogram A (Ficoll solution only) andchromatogram B (Ficoll silica) is a clear indication that some of the elutingFicoll adsorbed onto the silica. Variations in the elution volume, Ve, due to the

Polymer-Modified Resins for Aqueous SEC 265
FIG. 1 Adsorption of Ficoll on silica. (A) Ficoll without silica. (B) Ficoll with silica.(A-B) The difference between A and B (indicative of Ficoll adsorption onto silica). (FromRef. 13.)
above secondary retention phenomena can be quantified by considering the rela-tionship between the elution volume and changes in K, the equilibrium partitioncoefficient:
Ve V0 KVi (1)
where V0 is the void volume of the SEC column (i.e., volume of the macropores)and Vi is the pore volume of the column packing material. Total exclusion ofsolute molecules from the resin’s internal pores will occur when K 0, whereasK 1 is the condition of total permeation of solute molecules through the resin’spores. A value of K greater than 1 results when the silica support acts as a weakcationic exchanger, while a value of K less than 1 indicates ion exclusion phenom-ena [14].
Ion exchange, ion exclusion, and nonspecific solute–silica interactions, dis-cussed above, represent the most common nonsterical interactions that lead topoor SEC column performance. Typical SEC calibration curves that illustrategood and poor performance of a stationary phase are shown in Fig. 2. Improvedresolution of solutes of various molecular weights is better when most of thesilica silanol groups are unavailable for interactions with the solutes.
In order to minimize solute–silanol interactions in aqueous SEC with silica-based resins, researchers have explored several techniques to ‘‘deactivate’’ thereactive silanol groups on the native silica surface. The ‘‘deactivation’’ tech-niques rely on masking of the silanol groups with species that will not adsorbthe solutes to be separated. As summarized in Table 1, the presently availablesurface modification methods include coating or adsorbing of polymers onto thesilica resins with or without polymer crosslinking, covalent bonding of organosi-lanes to the silanol groups, and covalent bonding of polymer chains to the silanolgroups via polymer grafting and graft polymerization. Schematic representation

266 Cohen et al.
FIG. 2 SEC calibration curves for poor (A) and good (B) column performance.
of the three main methods of silica modification is given in Fig. 3. In the caseof surface modification with polymers, the degree of crosslinking of the coatingpolymer layer or the density of the grafted polymer layer allows for control ofthe silica resin pore size (see Secs. II and III). An overview of the various surfacemodification techniques is given in the subsequent sections followed by a detailed
TABLE 1 Various Modification Techniques for SEC Packings
Type of surface Typical size ofMethod modifier bonding polymeric modifier
Silylation Covalent bond Short chainsPolymer coating/adsorp- Physisorption and/or Low to high MW (105)
tion with or without chemisorption chainscrosslinking
Polymer grafting Covalent bond High MW chainsGraft polymerization Covalent bond Monomer to high MW
chains

Polymer-Modified Resins for Aqueous SEC 267
FIG. 3 Different silica surface modification methods. (a) Polymer coating w/o crosslink-ing. (b) Polymer coating with crosslinking. (c) Polymer grafting or graft polymerization.
description and analysis of the graft polymerization techniques, which is the focusof this chapter.
II. OVERVIEW OF SILICA RESINS MODIFICATIONTECHNIQUES
A. Coating of Silica Resins
1. General AspectsCoating of the native silica is usually carried out by deposition of a polymer froma solution that contains a crosslinking agent onto the silica surface. The solventis then evaporated and polymer crosslinking, if desired, is often thermally induced[8]. Polymers that have been commonly used in this technique include polyethyl-ene oxide, PEO (also known as polyethylene glycol, or PEG), dextran, and poly-styrene. The degree of polymer coating (i.e., mg polymer/m 2) and the extentof crosslinking have been shown to be of paramount importance in controllingundesired silica–solute interactions [3,4,8,12]. One method to quantify the num-ber of exposed silanol groups on different coated silica resins is to titrate thecharged silanol groups on the surface of the resins with an appropriate reagent(e.g., tetramethylammonium hydroxide) [8]. This method allows for the selectionof optimal coating conditions to be used in order to completely mask the silicasurface silanol groups by the polymer coating layer. The study of Frere andGramain [8], for example, utilized the above titration method to determine thatthe number of silanol groups on the surface of bare silica resins can be dramati-cally reduced by coating the resins with methacrylates of PEO. The study demon-strated that complete masking of the silanol groups was achieved with the coatingpolymer when the titrated solution pH was between 5 and 8. At a higher titratedsolution pH [9–10], silanol group masking was incomplete and a maximum ofabout 86% reduction in the number of exposed silanol groups was obtained. Vari-ations in the masking efficiency of the silanol groups were determined by coatingbare silica resins with different amounts of polymer containing different amountsof a crosslinker agent. The study showed that there was an optimum crosslinkercontent of 8–10%, which yielded the best coated resins for aqueous SEC applica-

268 Cohen et al.
FIG. 4 Calibration curves for proteins with the poor resin A (a) and the good resin B(b) methacrylate PEO-coated silica resins. (From Ref. 8.)
tions. To illustrate the effective masking of surface silanol groups, the perfor-mance of the PEO-coated silica resins in SEC of proteins, displayed in terms ofstandard SEC calibration plot, is given in Fig. 4. Resin A (Fig. 4a) exhibited amuch better SEC performance than resin B (Fig. 4b), which possessed the highestnumber of exposed silanols than any of the tested resins.
In a more recent study, Matthijs and Schacht [3] reported that high molecularweight dextran coatings (MW 7 104) led to improved masking of the silanolgroups and thus reduction in silica–solute interactions. These investigators useddiethylaminoethyl (DEAE) in order to introduce a positive charge on the silicasurface for better masking of the negatively charged silanol groups. However,careful choice of the amount of DEAE used has to be exercised, as was demon-strated in another study by Santarelli et al. [12]. They showed that if the percent-

Polymer-Modified Resins for Aqueous SEC 269
age of dextran units bearing DEAE groups is below a certain value (4% in theirstudy), the neutralization of the negatively charged silanol groups is incomplete.On the other hand, above a certain percentage of the DEAE-bearing dextran units(10% in this case) excess positive charge on the resin’s surface can lead to unde-sired cationic exchange as observed with various proteins such as thyroglobulin,β-amylase, pepsin, trypsin, and cytochrome c.
Smaller pore size polymer-coated supports can result in a drastic loss of porevolume and, consequently, a decrease in column resolution [3]. Indeed, the choiceof pore size of the native, unmodified, porous silica to be coated is a very impor-tant consideration. Zhou et al. [4], for instance, showed that an agarose-coatedsilica resin of a larger pore size exhibits better protein SEC performance than asmaller pore size coated resin, as illustrated in Fig. 5. On the other hand, Letotet al. [15] compared SEC performance of dextran- and PEO-coated silica resinsranging in pore size from 500 to 4000 A. They have showed that the smaller
FIG. 5 Molecular weight calibration curves for standard proteins on agarose-coated sil-ica columns of two different pore sizes (mobile phase: aqueous solution containing0.02 M Tris-HCl and 0.15 M NaCl; pH 7.4). () 300 A and () 1250 A. (From Ref. 4.)

270 Cohen et al.
pore size resins (500–1000 A) produced SEC calibration curves with a higherresolution than the modified resins with larger pore size with PEO and dextranstandards (Fig. 6). It should also be noted that nonsterical interactions betweendextran and the coated silica resin were reduced as the resin pore size decreased,as illustrated in Fig. 6. It can be concluded, therefore, that the choice of a suitableresin pore size cannot be decoupled from the effects of the resin coating materialand the solute to be separated on the SEC performance of the modified resin.
In order to overcome insufficient masking of the silica’s silanol groups, somestudies have suggested aqueous SEC operations under high ionic strength condi-tions (high salt concentrations) [3,8,11,13,16]. This approach is illustrated in Fig.7 for the elution of the protein α-chymotrypsin using a Tris buffer solution withsodium chloride, which was used to vary solution ionic strength, with PEO-coatedsilica as the SEC packing material [8]. The elution chromatograms, with the vari-ous coated silica resins, are observed to be narrower when the ionic strength ofthe eluent is higher. The narrower chromatograms at higher ionic strengths can
FIG. 6 Molecular weight versus the equilibrium partition coefficient calibration curvesfor PEO and dextran standards using 500-, 1000-, and 4000-A PVP-coated silica resins.(From Ref. 15.)
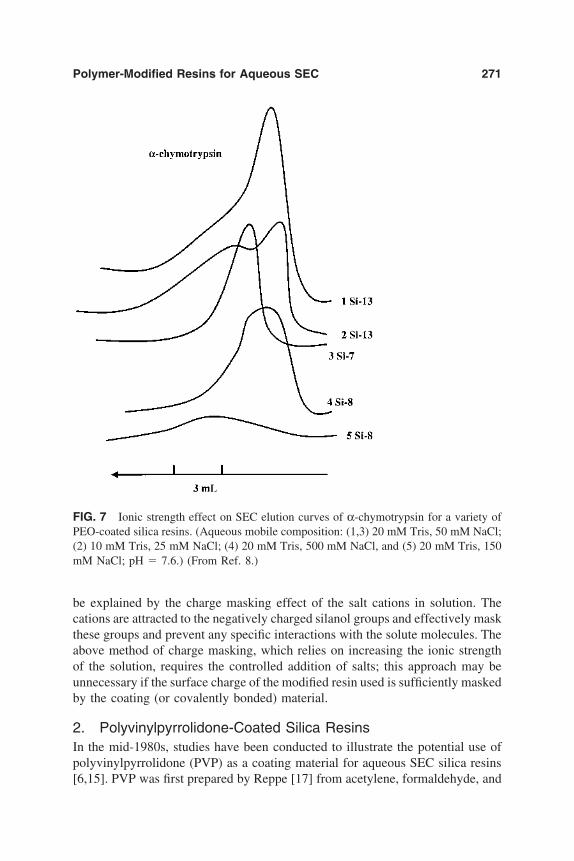
Polymer-Modified Resins for Aqueous SEC 271
FIG. 7 Ionic strength effect on SEC elution curves of α-chymotrypsin for a variety ofPEO-coated silica resins. (Aqueous mobile composition: (1,3) 20 mM Tris, 50 mM NaCl;(2) 10 mM Tris, 25 mM NaCl; (4) 20 mM Tris, 500 mM NaCl, and (5) 20 mM Tris, 150mM NaCl; pH 7.6.) (From Ref. 8.)
be explained by the charge masking effect of the salt cations in solution. Thecations are attracted to the negatively charged silanol groups and effectively maskthese groups and prevent any specific interactions with the solute molecules. Theabove method of charge masking, which relies on increasing the ionic strengthof the solution, requires the controlled addition of salts; this approach may beunnecessary if the surface charge of the modified resin used is sufficiently maskedby the coating (or covalently bonded) material.
2. Polyvinylpyrrolidone-Coated Silica ResinsIn the mid-1980s, studies have been conducted to illustrate the potential use ofpolyvinylpyrrolidone (PVP) as a coating material for aqueous SEC silica resins[6,15]. PVP was first prepared by Reppe [17] from acetylene, formaldehyde, and
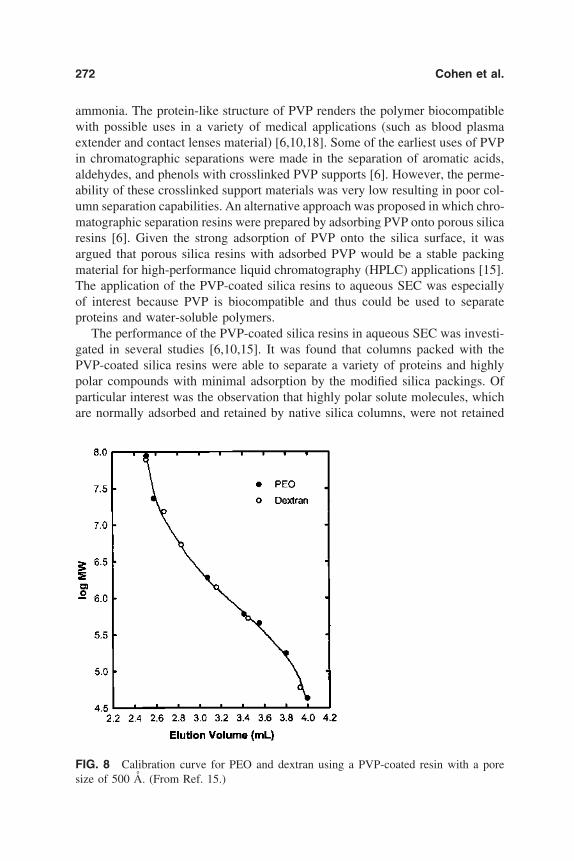
272 Cohen et al.
ammonia. The protein-like structure of PVP renders the polymer biocompatiblewith possible uses in a variety of medical applications (such as blood plasmaextender and contact lenses material) [6,10,18]. Some of the earliest uses of PVPin chromatographic separations were made in the separation of aromatic acids,aldehydes, and phenols with crosslinked PVP supports [6]. However, the perme-ability of these crosslinked support materials was very low resulting in poor col-umn separation capabilities. An alternative approach was proposed in which chro-matographic separation resins were prepared by adsorbing PVP onto porous silicaresins [6]. Given the strong adsorption of PVP onto the silica surface, it wasargued that porous silica resins with adsorbed PVP would be a stable packingmaterial for high-performance liquid chromatography (HPLC) applications [15].The application of the PVP-coated silica resins to aqueous SEC was especiallyof interest because PVP is biocompatible and thus could be used to separateproteins and water-soluble polymers.
The performance of the PVP-coated silica resins in aqueous SEC was investi-gated in several studies [6,10,15]. It was found that columns packed with thePVP-coated silica resins were able to separate a variety of proteins and highlypolar compounds with minimal adsorption by the modified silica packings. Ofparticular interest was the observation that highly polar solute molecules, whichare normally adsorbed and retained by native silica columns, were not retained
FIG. 8 Calibration curve for PEO and dextran using a PVP-coated resin with a poresize of 500 A. (From Ref. 15.)

Polymer-Modified Resins for Aqueous SEC 273
by the PVP-coated resins. In fact, it was found that as the polarity of the solutemolecules increased, their adsorption onto the native silica resin was greater thanonto the PVP-coated resin. As shown in the illustration of Fig. 8, the overlap ofthe universal calibration curves for the PEO and the dextran samples, with theadsorbed PVP-silica resins, demonstrates the absence of nonsteric effects in theelution of these solutes, which are present with native silica resins.
In summary, it is also important to note that an optimal coated silica resinmust not only perform the desired separation but should also exhibit satisfactorylong-term chemical stability. Polymer coating of silica has been shown effectivein reducing solute adsorption onto the silica; however, most of the coated resinsexhibited short-term stability of the coating polymer layer [5,11]. It has beendemonstrated, for example, that some coated resins lose a portion of the coatinglayer in the initial elution stages of SEC [15]. In addition, the incomplete coatingof the native silica resins can lead to serious nonsteric effects such as soluteretention or repulsion due to solute-exposed silanol group interactions, as wasdiscussed above. Indeed, the instability of PVP-coated silica resins was evaluatedby Cohen and Eisenberg [10] over many elution cycles, as illustrated in Fig. 9.
FIG. 9 Column instability for adsorbed PVP-silica resin for different injected molecularweight samples of PEO using pure water as the mobile phase. (Peak height is normalizedwith respect to the initial peak height.) (From Ref. 10.)

274 Cohen et al.
The chromatograms resulting from successive injections of three polymer sam-ples over a period of 4 days demonstrated significant variability in peak height.Such behavior suggests simultaneous adsorption/desorption of the PVP layer and,thus, the instability of the coating layer with time.
B. Silylation of Silica Resins
1. The Silylation ProcedureDespite the intensive effort to develop modified silica resins by adsorbing poly-mer onto the silica surface, the instability of the coating layer at different tempera-tures, flow rates, and compositions of the mobile phase has hindered the commer-cial acceptance of such resins. In aqueous SEC, silanol groups on the silicasurface contribute to the adsorption of hydrophilic polymers. Also, surface sila-nols can contribute in part to the adsorption and denaturalization of proteins andenzymes, a behavior that makes the presence of silanol groups undesirable inaqueous SEC with silica resins.
An alternative and popular way to reduce solute–silica surface interactions isby chemically reacting the surface silanol groups with organosilanes. The silyla-tion method results in an organosilane that is covalently bonded to the silicasurface, resulting in stable and robust SEC silica resins. A particularly effectiveclass of organosilanes is of the type R nSiX4n, where R is a nonhydrolyzableorganic group and X is a hydrolyzable functional group (e.g., halogen, amine,alkoxy, or akyloxy). The chemistry of the nonhydrolyzable organic group pro-vides the desired surface chemical functionality, whereas the hydrolyzable groupsreact with the surface silanol groups. Thus, silylation reactions allow the introduc-tion of a variety of functional groups and hence offer a range of possibilitiesfor tailoring chromatographic supports with the desired chemical characteristics.Although a wide range of commercial silylated silica SEC resins are available,the actual surface chemistry (and thus specific silanes used) of these resins isoften proprietary. However, the most common silanes employed in the synthesisof hydrophilic bonded silica are listed in Table 2 and a list of selected commercialhydrophilic silica columns is presented in Table 3.
There are a number of basic approaches of chemically bonding organosilanegroups onto the active surface of silica via organosilane reactions (Figs. 10 and11). In general, there are two distinct classes of silylation reactions: aqueousphase silylation and anhydrous silylation. The aqueous phase silylation reactionmay be divided into three main separate steps as illustrated in Fig. 10i–iii for analkoxysilane: hydrolysis, silane–silane condensation, and silane–substrate con-densation. In the presence of water, alkoxysilane molecules hydrolyze to formhydroxysilanes [19,20]. Furthermore, hydroxysilanes with two or three hydroxylgroups can undergo a condensation-polymerization reaction that can lead to theformation of polysiloxanes (Fig. 10ii), which then compete with the monosilanes
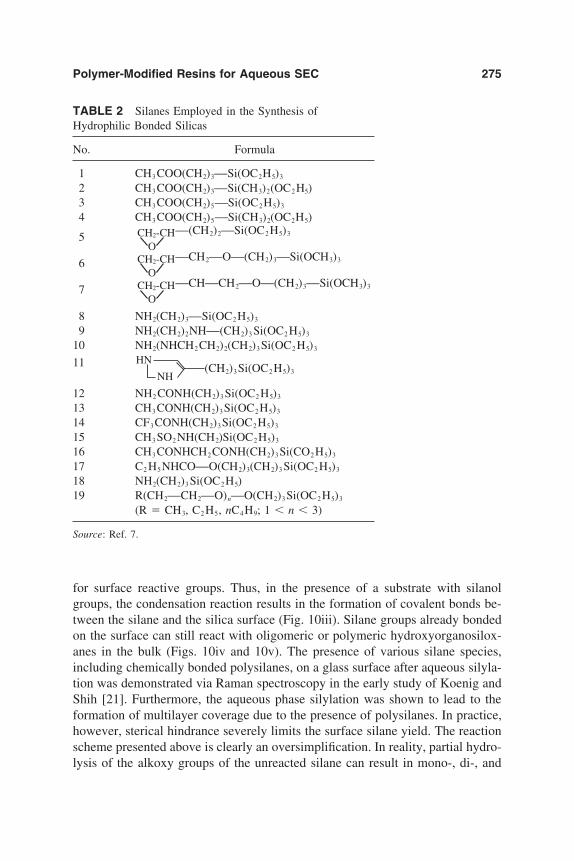
Polymer-Modified Resins for Aqueous SEC 275
TABLE 2 Silanes Employed in the Synthesis ofHydrophilic Bonded Silicas
No. Formula
1 CH3 COO(CH2)3Si(OC2H5)3
2 CH3 COO(CH2)3Si(CH3)2(OC2 H5)3 CH3 COO(CH2)5Si(OC2 H5)3
4 CH3 COO(CH2)5Si(CH3)2(OC2H5)
5 CH2-CHO
(CH2)2Si(OC2 H5)3
6 CH2-CHO
CH2O(CH2)3Si(OCH3)3
7 CH2-CHO
CHCH2O(CH2)3Si(OCH3)3
8 NH2(CH2)3Si(OC2 H5)3
9 NH2(CH2)2NH(CH2)3 Si(OC2 H5)3
10 NH2(NHCH2 CH2)2(CH2)3 Si(OC2 H5)3
11 HN
NH(CH2)3 Si(OC2 H5)3
12 NH2 CONH(CH2)3 Si(OC2 H5)3
13 CH3 CONH(CH2)3 Si(OC2 H5)3
14 CF3 CONH(CH2)3 Si(OC2 H5)3
15 CH3 SO2 NH(CH2)Si(OC2 H5)3
16 CH3 CONHCH2 CONH(CH2)3 Si(CO2 H5)3
17 C2 H5 NHCOO(CH2)3(CH2)3 Si(OC2 H5)3
18 NH2(CH2)3 Si(OC2 H5)19 R(CH2CH2O)nO(CH2)3 Si(OC2 H5)3
(R CH3, C2 H5, nC4 H9; 1 n 3)
Source: Ref. 7.
for surface reactive groups. Thus, in the presence of a substrate with silanolgroups, the condensation reaction results in the formation of covalent bonds be-tween the silane and the silica surface (Fig. 10iii). Silane groups already bondedon the surface can still react with oligomeric or polymeric hydroxyorganosilox-anes in the bulk (Figs. 10iv and 10v). The presence of various silane species,including chemically bonded polysilanes, on a glass surface after aqueous silyla-tion was demonstrated via Raman spectroscopy in the early study of Koenig andShih [21]. Furthermore, the aqueous phase silylation was shown to lead to theformation of multilayer coverage due to the presence of polysilanes. In practice,however, sterical hindrance severely limits the surface silane yield. The reactionscheme presented above is clearly an oversimplification. In reality, partial hydro-lysis of the alkoxy groups of the unreacted silane can result in mono-, di-, and

276 Cohen et al.
TA
BL
E3
Exa
mpl
esof
Com
mer
cial
Hyd
roph
ilic
Bon
ded
Silic
as
Frac
tiona
tion
rang
efo
rM
ean
nativ
egl
obul
arpa
rtic
leT
rade
nam
eC
ompo
sitio
npr
otei
nsa
(kD
a)si
ze(µ
m)
Supp
liers
TSK
-gel
SWty
peSi
lica
with
bond
edhy
drop
hilic
pola
r1–
1000
10,1
3
2T
oyo
Soda
Man
ufac
turi
ng(T
okyo
)(a
naly
tical
)gr
oups
(exa
ctco
mpo
sitio
nno
tkn
own)
TSK
-gel
SWty
peSi
lica
with
bond
edhy
drop
hilic
pola
r1–
1000
13,1
7
2T
oyo
Soda
Man
ufac
ture
ing
(Tok
yo)
(pre
para
tive)
grou
psL
iChr
osor
bD
iol
Silic
aw
ithbo
nded
glyc
erol
prop
yl10
–100
5,7,
10E
.M
erck
(Dar
mst
adt)
grou
psPr
otei
n-Pa
kPo
lym
eriz
edgl
ycer
olpr
opyl
–bon
ded
1–50
010
Wat
ers
Ass
ocia
tes
(Milf
ord,
MA
)si
lica
µBon
dage
lE
ther
-bon
ded
silic
a2–
2000
10,2
0W
ater
sA
ssoc
iate
s(M
ilfor
d,M
A)
SynC
hrop
akG
PCSi
lica
with
bond
edgl
ycer
olpr
opyl
NG
10Sy
nchr
omIn
c.(L
inde
n,IN
)gr
oups
Sync
hrop
akSi
lica
with
poly
mer
ized
poly
amin
eSE
Cfo
rca
tioni
c10
Sync
hrom
Inc.
(Lin
den,
IN)
CA
TSE
Cco
atin
gpo
lym
ers
Si-P
olyo
lSi
lica
with
hydo
phili
cbo
nded
grou
psN
G3,
5,10
,30
Serv
aFe
inbi
oche
mic
aG
mbH
&C
o.(H
eide
lber
g)SP
(Dal
tosi
lPo
lyol
)Si
lica
with
hydr
ophi
licbo
nded
NG
40–2
00Se
rva
Fein
bioc
hem
ica
Gm
bH&
Co.
grou
ps(H
eide
lber
g)
aFr
actio
natio
nov
erth
ein
dica
ted
rang
eis
poss
ible
with
one
orco
mbi
natio
nof
diff
eren
tco
lum
nsav
aila
ble
from
the
man
ufac
ture
r.So
urce
:R
ef.
7.

Polymer-Modified Resins for Aqueous SEC 277
FIG. 10 Silylation reaction in aqueous media. R is an organic residual group, that con-tains the desired functionality to be introduced on the silica surface (e.g.,(CH2)3OCH2CH-CH2
O). OR′ can be any hydrolyzable group (e.g., OCH3).
(From Ref. 7.)
trihydroxy derivatives; di- and trihydroxy derivatives can then lead not only tolinear condensation but to formation of branched and cyclic siloxanes. Crosslink-ing can also occur between adjacent surface-bonded groups. Therefore, silylationcan be considered to be a complex reaction, which in general is difficult to control.
Surface silylation and thus the resulting surface properties are highly depen-dent on the silane bulk concentration, pH, and the isoelectric point of the sub-

278 Cohen et al.
FIG. 11 Anhydrous silylation reactions. R is an organic residual group that contains thedesired functionality to be introduced on the silica surface (e.g., CH CH2). OR′ canbe any hydrolyzable group (e.g., OCH3).
strate. Studies have shown, for example, that in polymer-silylated glass fillercomposites the adhesive forces between silica/glass filler and the polymer matrixvaried markedly with the pH of the reaction medium [22,23]. It is important tonote that higher sensitivity to the pH of the reaction medium was found for ionicfunctional silanes relative to nonionic functional silanes.
The surface concentration of hydroxyl groups on a fully hydroxylated silicais about 4.6 OH groups/nm2 [24]. Thus, the monolayer surface concentration ofbonded silanes is about 7.5 µmol/m2. In practice, however, steric hindrance se-verely limits the surface silane yield. The effect of the size of the specie ap-proaching the surface can be studied by changing the silane hydrolyzable func-tional group. In the study of Unger et al. [25], silane surface coverage was shownto decrease by approximately 20% when one of the methyl groups of trimeth-ylchlorosilane was replaced by an n-butyl or n-octyl group. Furthermore, replac-ing the methyl groups by bulky phenyl groups resulted in a decrease in the silanesurface coverage by approximately 50–70%, depending on the number of methyl

Polymer-Modified Resins for Aqueous SEC 279
groups replaced by the phenyl groups. In a later study, Schomburg et al. [26]showed that the resulting surface silane concentration is affected by the presenceof bulky side groups of the organosilanes due to sterical hindrance effects. Theabove study showed, for example, that the silane surface coverage for bulky octa-decyldimethylsilylenolate was approximately 40% that of trimethylsilylenolate.
The formation of polysilanes in aqueous phase silylation reactions leads tosterical effects that can reduce the uniformity of the silylated layer and the surfacecoverage. As a result, anhydrous silylation reactions, in which the formation ofpolysilanes is eliminated, are often employed. Anhydrous silylation reactionsmay be carried out with pure silane or in an anhydrous organic solvent. In thismethod the silica surface must be dried before the reaction. However, since sur-face silanol groups are essential for silylation, extreme caution must be taken toensure that the drying step does not lead to condensation of the silanol groupsto form siloxane bonds, which occurs at temperatures above approximately 190 10°C [27].
In the absence of water, polysilanes are not formed, and the reaction schemeis simplified resulting in the attachment of monosilanes onto the surface (Fig. 11).As a consequence, silylation yields (e.g., µmol silane/m2) reached with anhydrousreactions are lower than with hydrosilylation; however, the fraction of reactedsurface hydroxyls is expected to be higher than in aqueous silylation. Bulk poly-condensations during aqueous reactions can lead to low silane yield due to sterichindrance effects associated with the polysilanes that diffuse to the surface toreact with surface silanols. It is noted, however, that it is possible with the pres-ence of a small and controlled quantity of water on the silica surface to enablecondensation reactions between already bonded silanes and bulk siloxanes,thereby increasing the silane surface coverage obtained with anhydrous reactions(Table 4). The role of water is nicely illustrated in the early study of Majors andHopper [29] who conducted a silylation reaction by introducing a predeterminedamount of water vapor into the reaction vessel. Their results revealed that thesurface concentration of octadecyltrichlorosilane was about 2 µmol/m2 in thepresence of water relative to about 0.5 µmol/m2 without the use of water. Simi-larly, the silane yield of 2-cyanoethyltriethoxysilane increased from approxi-mately 1.8 without water to 11 µmol/m2 in the presence of water vapor. Majorsand Hopper [29] proposed that silylation coverage can be increased by using atwo-step reaction. In the first step, the primary silane (e.g., dimethyldichlorosi-lane) is bonded to the silica surface using the anhydrous silylation technique.Subsequently, the substrate is exposed to water vapor, resulting in replace-ment of the unreacted chlorines by hydroxyl groups. In the next step, a largeexcess of the desired secondary silane is reacted with the primary silane-bondedsilica in the presence of water vapor. In the above approach, the primary silaneserves to extend the silanol groups away from the silica surface and therebydecrease sterical hindrance effects, which may occur if the secondary silane

280 Cohen et al.
TA
BL
E4
Perf
orm
ance
ofSi
lyla
tion
onSi
lica
Surf
aces
Surf
ace
cove
rage
Sila
neSi
lica
Sily
latio
nm
etho
d(µ
mol
/m2 )
Ref
.
Oct
adec
yltr
ichl
oros
ilane
LiC
hros
orb
(Si-
100-
5)B
ulk
3.7
Scho
mbu
rget
al.,
1983
Oct
adec
yltr
ieth
oxys
ilane
Vap
or3.
0O
ctad
ecyl
tric
hlor
osila
nePh
ase
4.4
Oct
adec
yldi
met
hyls
ilyle
nola
teN
ucle
osil
(100
-5)
Sily
latio
n3.
9A
llyld
imet
hyld
ilyle
nola
te5.
66.
6T
rim
ethy
lchl
oros
ilane
Poro
usB
ulk
4.5
Ung
eret
al.,
1976
But
yldi
met
hylc
hlor
osila
neV
apor
3.6
Oct
yldi
met
hylc
hlor
osila
nePh
ase
3.8
Hex
adec
yldi
met
hylc
hlor
osila
neSi
lyla
tion
3.4
Phen
yldi
met
hylc
hlor
osila
ne2.
6B
utyl
diph
enyl
chlo
rosi
lane
1.8
Tri
phen
ylch
loro
sila
ne1.
5Su
lfon
amid
etri
etho
xysi
lane
Mer
ck(S
i-10
0)A
nhyd
rous
sily
latio
n5.
25E
ngel
hard
tan
dM
athe
s,19
77A
min
etri
etho
xysi
lane
4.97
Am
idet
riet
hoxy
sila
ne4.
02T
riflu
oroa
mid
etri
etho
xysi
lane
3.86
Gly
cina
mid
etri
etho
xysi
lane
3.01
Oct
adec
yltr
ieth
oxys
ilane
2.78
Gly
coltr
ieth
oxys
ilane
2.17
Oct
adec
yldi
met
hyltr
ifluo
roac
etox
ysila
nePo
rous
Anh
ydro
ussi
lyla
tion
3.32
Kin
kel
and
Ung
er,
1984
Oct
adec
yldi
met
hylc
hlor
osila
ne3.
34O
ctyl
dim
ethy
ltrifl
uoro
acet
oxys
ilane
3.45
Oct
yldi
met
hylc
hlor
osila
ne3.
48E
thyl
dim
ethy
ltrifl
uoro
acet
oxys
ilane
3.93
Eth
yldi
met
hylc
hlor
osila
ne4.
01T
rim
ethy
ltrifl
uoro
acet
oxys
ilane
4.48
Tri
met
hlyc
hlor
osila
ne4.
40
Sour
ce:
Ref
.28
.
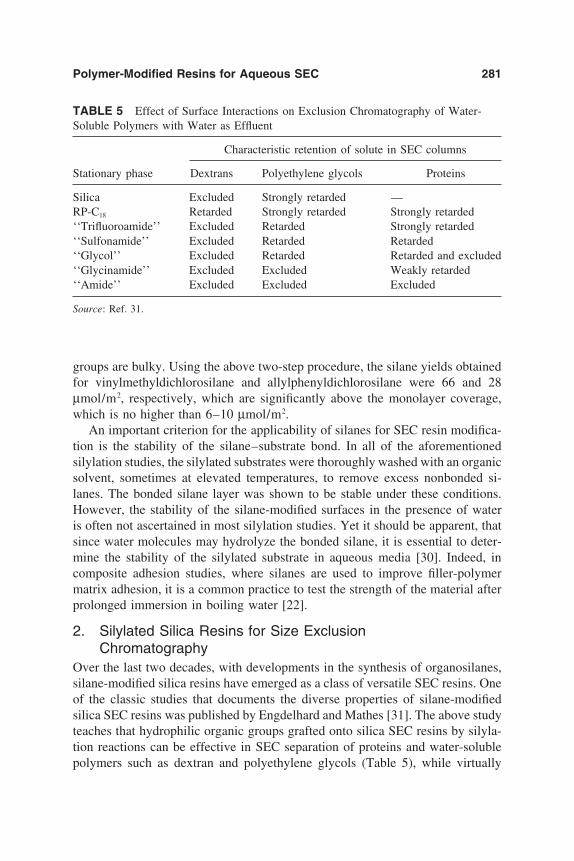
Polymer-Modified Resins for Aqueous SEC 281
TABLE 5 Effect of Surface Interactions on Exclusion Chromatography of Water-Soluble Polymers with Water as Effluent
Characteristic retention of solute in SEC columns
Stationary phase Dextrans Polyethylene glycols Proteins
Silica Excluded Strongly retarded —RP-C18 Retarded Strongly retarded Strongly retarded‘‘Trifluoroamide’’ Excluded Retarded Strongly retarded‘‘Sulfonamide’’ Excluded Retarded Retarded‘‘Glycol’’ Excluded Retarded Retarded and excluded‘‘Glycinamide’’ Excluded Excluded Weakly retarded‘‘Amide’’ Excluded Excluded Excluded
Source: Ref. 31.
groups are bulky. Using the above two-step procedure, the silane yields obtainedfor vinylmethyldichlorosilane and allylphenyldichlorosilane were 66 and 28µmol/m2, respectively, which are significantly above the monolayer coverage,which is no higher than 6–10 µmol/m2.
An important criterion for the applicability of silanes for SEC resin modifica-tion is the stability of the silane–substrate bond. In all of the aforementionedsilylation studies, the silylated substrates were thoroughly washed with an organicsolvent, sometimes at elevated temperatures, to remove excess nonbonded si-lanes. The bonded silane layer was shown to be stable under these conditions.However, the stability of the silane-modified surfaces in the presence of wateris often not ascertained in most silylation studies. Yet it should be apparent, thatsince water molecules may hydrolyze the bonded silane, it is essential to deter-mine the stability of the silylated substrate in aqueous media [30]. Indeed, incomposite adhesion studies, where silanes are used to improve filler-polymermatrix adhesion, it is a common practice to test the strength of the material afterprolonged immersion in boiling water [22].
2. Silylated Silica Resins for Size ExclusionChromatography
Over the last two decades, with developments in the synthesis of organosilanes,silane-modified silica resins have emerged as a class of versatile SEC resins. Oneof the classic studies that documents the diverse properties of silane-modifiedsilica SEC resins was published by Engdelhard and Mathes [31]. The above studyteaches that hydrophilic organic groups grafted onto silica SEC resins by silyla-tion reactions can be effective in SEC separation of proteins and water-solublepolymers such as dextran and polyethylene glycols (Table 5), while virtually

282 Cohen et al.
FIG. 12 Effect of pore size on calibration curves for dextrans on amide-bonded silicas.Pore size: 60 A (Si-60), 100 A (Si-100), 200 A (Si-200), and 500 A (Si-500). Samples:dextran standards MW 500,000 to 10,000 and raffinose (MW 595). (From Ref. 36.)
eliminating surface adsorption in some cases. For example, SEC silica resins withsurface-bonded amide groups enable the elution of protein standards and poly-mers such as PEO without solute adsorption. The amide group is not neutrallycharged, hence it is unclear as to whether electrostatic interactions affect theseparation. However, given that polyacrylamide gels were shown to be successfulfor protein separations [32–35], it should not be surprising that the amide-bondedsilica SEC resin is similarly a good resin for protein SEC analysis.
Interactions of solutes with silylated surfaces are expected to vary with thesilylation surface coverage. This effect was noted by Engelhardt and Mathes [36],who argued that significant differences in the interaction of PEG with similarfunctional end-groups attached to the surface silane (amine, diamine, and tria-mine) are attributable to differences in surface coverage of the specific functionalgroups. In the same study, dextran SEC using an amide-bonded silica resin dem-onstrated the importance of pore size on MW resolution. As Fig. 12 shows, silica
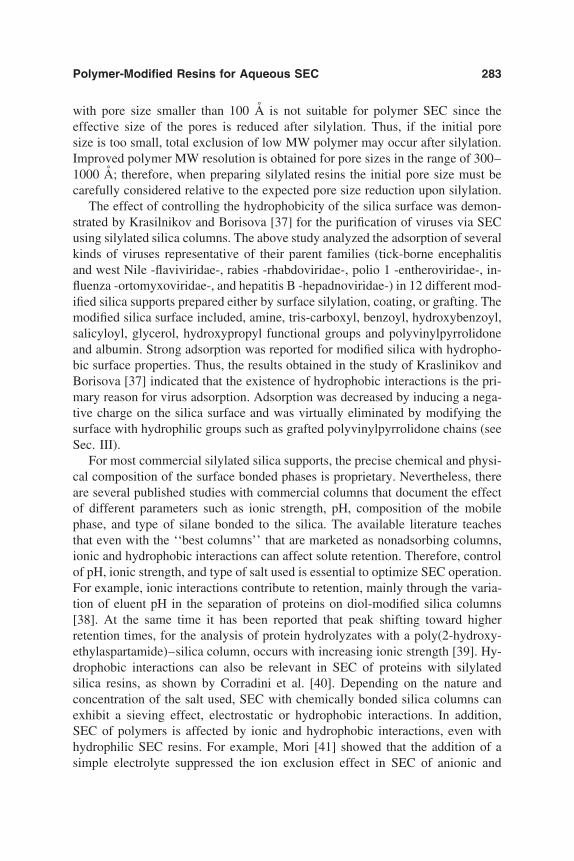
Polymer-Modified Resins for Aqueous SEC 283
with pore size smaller than 100 A is not suitable for polymer SEC since theeffective size of the pores is reduced after silylation. Thus, if the initial poresize is too small, total exclusion of low MW polymer may occur after silylation.Improved polymer MW resolution is obtained for pore sizes in the range of 300–1000 A; therefore, when preparing silylated resins the initial pore size must becarefully considered relative to the expected pore size reduction upon silylation.
The effect of controlling the hydrophobicity of the silica surface was demon-strated by Krasilnikov and Borisova [37] for the purification of viruses via SECusing silylated silica columns. The above study analyzed the adsorption of severalkinds of viruses representative of their parent families (tick-borne encephalitisand west Nile -flaviviridae-, rabies -rhabdoviridae-, polio 1 -entheroviridae-, in-fluenza -ortomyxoviridae-, and hepatitis B -hepadnoviridae-) in 12 different mod-ified silica supports prepared either by surface silylation, coating, or grafting. Themodified silica surface included, amine, tris-carboxyl, benzoyl, hydroxybenzoyl,salicyloyl, glycerol, hydroxypropyl functional groups and polyvinylpyrrolidoneand albumin. Strong adsorption was reported for modified silica with hydropho-bic surface properties. Thus, the results obtained in the study of Kraslinikov andBorisova [37] indicated that the existence of hydrophobic interactions is the pri-mary reason for virus adsorption. Adsorption was decreased by inducing a nega-tive charge on the silica surface and was virtually eliminated by modifying thesurface with hydrophilic groups such as grafted polyvinylpyrrolidone chains (seeSec. III).
For most commercial silylated silica supports, the precise chemical and physi-cal composition of the surface bonded phases is proprietary. Nevertheless, thereare several published studies with commercial columns that document the effectof different parameters such as ionic strength, pH, composition of the mobilephase, and type of silane bonded to the silica. The available literature teachesthat even with the ‘‘best columns’’ that are marketed as nonadsorbing columns,ionic and hydrophobic interactions can affect solute retention. Therefore, controlof pH, ionic strength, and type of salt used is essential to optimize SEC operation.For example, ionic interactions contribute to retention, mainly through the varia-tion of eluent pH in the separation of proteins on diol-modified silica columns[38]. At the same time it has been reported that peak shifting toward higherretention times, for the analysis of protein hydrolyzates with a poly(2-hydroxy-ethylaspartamide)–silica column, occurs with increasing ionic strength [39]. Hy-drophobic interactions can also be relevant in SEC of proteins with silylatedsilica resins, as shown by Corradini et al. [40]. Depending on the nature andconcentration of the salt used, SEC with chemically bonded silica columns canexhibit a sieving effect, electrostatic or hydrophobic interactions. In addition,SEC of polymers is affected by ionic and hydrophobic interactions, even withhydrophilic SEC resins. For example, Mori [41] showed that the addition of asimple electrolyte suppressed the ion exclusion effect in SEC of anionic and

284 Cohen et al.
nonionic water-soluble polymers on silica gel with bonded hydrophilic groups,but the addition of an excess electrolyte promoted hydrophobic interactions.
Changes in solvent conditions often lead to changes of the predominant sol-ute–surface interactions. This can be used not only to improve difficult separa-tions but to enable the use of a given column for different types of chromato-graphic separations. For example, silylation in an aqueous medium was used byMiller et al. [42] to modify silica resins for applications in SEC and hydrophobicinteraction chromatography (HIC). In the above study, five different ether-bondedphases of the structure Si (CH2)3O(CH2CH2O)nR, where n 1, 2 or 3 and R methyl, ethyl or n-butyl, were evaluated for protein analysis.Under high ionic strength conditions (3 M ammonium sulfate), hydrophobic in-teractions with the protein were observed with the polyether-bonded phases, andthe observed behavior was characteristic of HIC. It is worth noting that the useof weakly hydrophobic phases in HIC provides a milder adsorptive surface, lead-ing to elution of proteins in their active state. At moderate (0.5 M ammoniumacetate) to low (0.05 M ammonium acetate) ionic strength, the bonded ether link-ages were found to be noninteracting and thus usable for SEC. In the study ofMiller et al. [42], it was found that as the length of the alkyl group at the endof the bonded ether chains increased, the degree of hydrophobic interactions alsoincreased. Calibration curves for both protein and polystyrene were in close corre-spondence (Fig. 13), which indicates that ether-bonded phases with nonionicweakly hydrophobic properties have the desired properties for SEC where separa-tion is due to molecular size. Therefore, the elution behavior was shown to dependonly on the size of the solute and not on solute–support interactions. SEC behav-ior for those phases was not affected by the ionic strength of the mobile phasein a range between 0.05 and 0.5M ammonium acetate, which was interpreted asproof of the minimization of silanol accessibility on the ether phase.
In practice, even with the most efficient silylation procedure, residual hydroxylgroups will remain on the silica surface. This may be due to the use of silaneswith bulky organic groups that limit the ability of the silane to react with theless accessible hydroxyl groups on the surface. Residual hydroxyls also resultfrom the hydrolysis of a chloro- or alkoxysilane (e.g., RSiCl3 or RSiOR′3). Asdiscussed previously, interactions between the solute and OH groups on eitherthe native silica or the hydrolyzable silane organic group should be avoided inSEC. One can, however, take advantage of such interactions in nonideal SEC.For example, several authors have noted that, under certain conditions, glycerolpropylsilane–modified silica resins exhibit latent hydrophobic [43,44] and an-ionic [38,45–47] properties that can be manipulated to increase the resolvingpower of the column. The anionic charge of a resin can be suppressed with 0.1M or higher ionic solutions of a nonbuffering salt [48]. In contrast, Ovalle [49]demonstrated that zwitterion buffer can be used to amplify electrostatic interac-

Polymer-Modified Resins for Aqueous SEC 285
FIG. 13 Universal calibration curve for SEC of proteins and polystyrene standards usingan ether-bonded resin [ Si(CH2)3O(CH2CH2O)3CH3]. (From Ref. 42.)
tions between proteins and glycerol propylsilane–modified silica support. Thislatter approach was shown to be effective in separating potato homogenate–con-taining proteins of similar molecular weights but varying pI values. It is notedthat these proteins were not resolved by SEC methods or by standard anion orcation exchange chromatography. Between proteins of different sizes, pI was thedominant factor in determining the elution order of the proteins tested. WhenpI values were similar, the larger protein eluted first. The degree of protein ad-sorption in the study of Ovalle [49] was high (60% of the injected sample) andthe level of recovery was found to vary depending on the protein. Despite thehigh degree of protein retention, the column did not appear to leach adsorbedproteins, and peak shapes remained constant over a 4-year period.
Clearly, silane-modified silica resins have shown a wide range of applicabilityin SEC. However, as with polymer-coated resins, the residual silanol groups onthe silica surface can lead to deterioration of SEC performance. Therefore, otheralternatives, which include polymer grafting and graft polymerization, have beenproposed as described in the following sections.
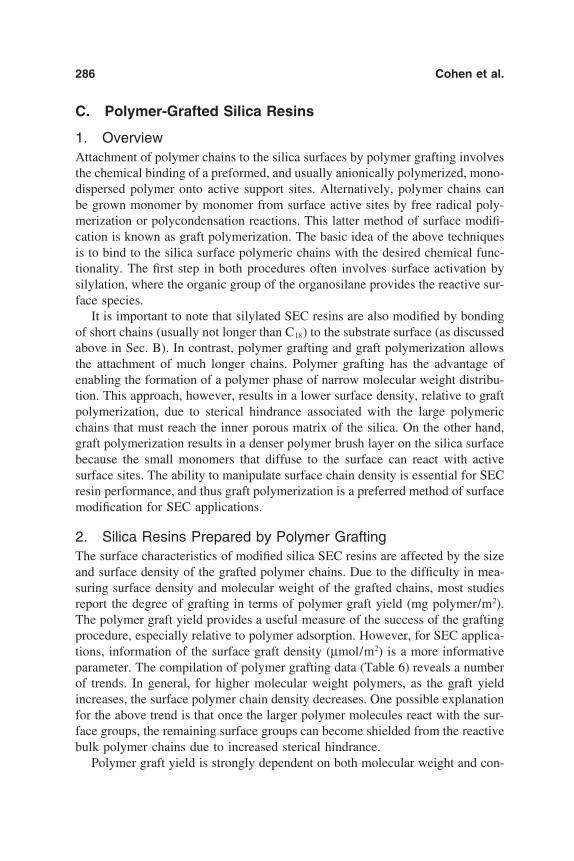
286 Cohen et al.
C. Polymer-Grafted Silica Resins
1. OverviewAttachment of polymer chains to the silica surfaces by polymer grafting involvesthe chemical binding of a preformed, and usually anionically polymerized, mono-dispersed polymer onto active support sites. Alternatively, polymer chains canbe grown monomer by monomer from surface active sites by free radical poly-merization or polycondensation reactions. This latter method of surface modifi-cation is known as graft polymerization. The basic idea of the above techniquesis to bind to the silica surface polymeric chains with the desired chemical func-tionality. The first step in both procedures often involves surface activation bysilylation, where the organic group of the organosilane provides the reactive sur-face species.
It is important to note that silylated SEC resins are also modified by bondingof short chains (usually not longer than C18) to the substrate surface (as discussedabove in Sec. B). In contrast, polymer grafting and graft polymerization allowsthe attachment of much longer chains. Polymer grafting has the advantage ofenabling the formation of a polymer phase of narrow molecular weight distribu-tion. This approach, however, results in a lower surface density, relative to graftpolymerization, due to sterical hindrance associated with the large polymericchains that must reach the inner porous matrix of the silica. On the other hand,graft polymerization results in a denser polymer brush layer on the silica surfacebecause the small monomers that diffuse to the surface can react with activesurface sites. The ability to manipulate surface chain density is essential for SECresin performance, and thus graft polymerization is a preferred method of surfacemodification for SEC applications.
2. Silica Resins Prepared by Polymer GraftingThe surface characteristics of modified silica SEC resins are affected by the sizeand surface density of the grafted polymer chains. Due to the difficulty in mea-suring surface density and molecular weight of the grafted chains, most studiesreport the degree of grafting in terms of polymer graft yield (mg polymer/m2).The polymer graft yield provides a useful measure of the success of the graftingprocedure, especially relative to polymer adsorption. However, for SEC applica-tions, information of the surface graft density (µmol/m2) is a more informativeparameter. The compilation of polymer grafting data (Table 6) reveals a numberof trends. In general, for higher molecular weight polymers, as the graft yieldincreases, the surface polymer chain density decreases. One possible explanationfor the above trend is that once the larger polymer molecules react with the sur-face groups, the remaining surface groups can become shielded from the reactivebulk polymer chains due to increased sterical hindrance.
Polymer graft yield is strongly dependent on both molecular weight and con-
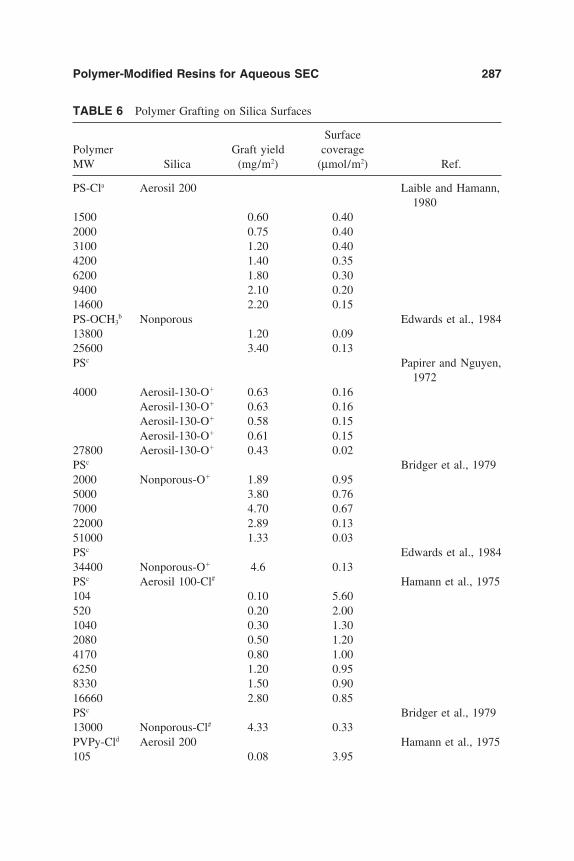
Polymer-Modified Resins for Aqueous SEC 287
TABLE 6 Polymer Grafting on Silica Surfaces
SurfacePolymer Graft yield coverageMW Silica (mg/m2) (µmol/m2) Ref.
PS-Cla Aerosil 200 Laible and Hamann,1980
1500 0.60 0.402000 0.75 0.403100 1.20 0.404200 1.40 0.356200 1.80 0.309400 2.10 0.2014600 2.20 0.15PS-OCH3
b Nonporous Edwards et al., 198413800 1.20 0.0925600 3.40 0.13PSc Papirer and Nguyen,
19724000 Aerosil-130-O 0.63 0.16
Aerosil-130-O 0.63 0.16Aerosil-130-O 0.58 0.15Aerosil-130-O 0.61 0.15
27800 Aerosil-130-O 0.43 0.02PSc Bridger et al., 19792000 Nonporous-O 1.89 0.955000 3.80 0.767000 4.70 0.6722000 2.89 0.1351000 1.33 0.03PSc Edwards et al., 198434400 Nonporous-O 4.6 0.13PSc Aerosil 100-Cl# Hamann et al., 1975104 0.10 5.60520 0.20 2.001040 0.30 1.302080 0.50 1.204170 0.80 1.006250 1.20 0.958330 1.50 0.9016660 2.80 0.85PSc Bridger et al., 197913000 Nonporous-Cl# 4.33 0.33PVPy-Cld Aerosil 200 Hamann et al., 1975105 0.08 3.95
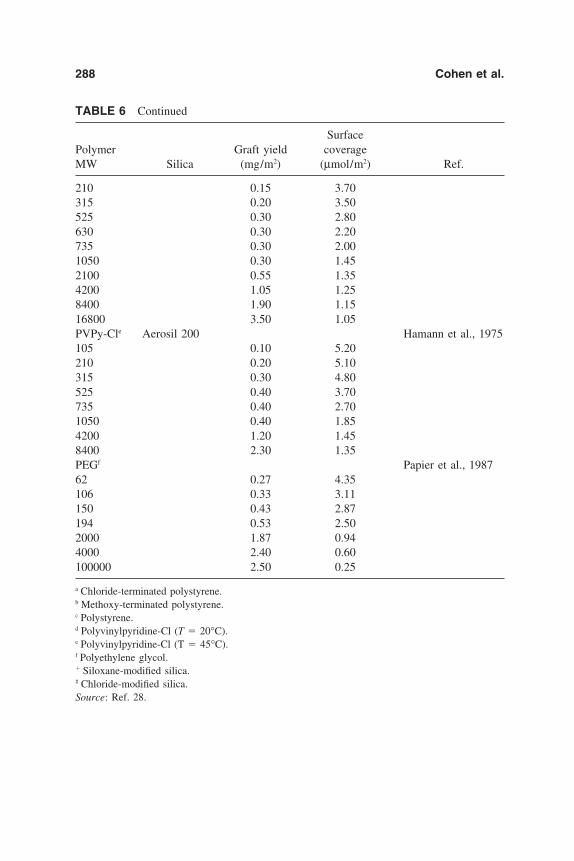
288 Cohen et al.
TABLE 6 Continued
SurfacePolymer Graft yield coverageMW Silica (mg/m2) (µmol/m2) Ref.
210 0.15 3.70315 0.20 3.50525 0.30 2.80630 0.30 2.20735 0.30 2.001050 0.30 1.452100 0.55 1.354200 1.05 1.258400 1.90 1.1516800 3.50 1.05PVPy-Cle Aerosil 200 Hamann et al., 1975105 0.10 5.20210 0.20 5.10315 0.30 4.80525 0.40 3.70735 0.40 2.701050 0.40 1.854200 1.20 1.458400 2.30 1.35PEGf Papier et al., 198762 0.27 4.35106 0.33 3.11150 0.43 2.87194 0.53 2.502000 1.87 0.944000 2.40 0.60100000 2.50 0.25
a Chloride-terminated polystyrene.b Methoxy-terminated polystyrene.c Polystyrene.d Polyvinylpyridine-Cl (T 20°C).e Polyvinylpyridine-Cl (T 45°C).f Polyethylene glycol. Siloxane-modified silica.# Chloride-modified silica.Source: Ref. 28.

Polymer-Modified Resins for Aqueous SEC 289
centration of the polymer chains in the treatment solution. Early studies haveshown that for dilute polymer solutions at identical polymer mass concentrationsthe graft yield is independent of molecular weight [50]. For high initial massconcentrations, however, the graft yield is inversely proportional to the polymermolecular weight. In contrast, at low polymer concentration but for equal initialmolar concentrations, the graft yield increases with molecular weight. At highpolymer molar concentrations, for high molecular weight polymers, the polymergraft yield reaches a plateau faster than in dilute solutions. Therefore, at highinitial polymer concentrations, higher polymer graft yield is achieved with lowermolecular weight polymer.
The study of Lecourtier et al. [51] reported on the performance of SEC resinswith low (MW 1000 and 8000) and high (MW 50,000) molecular weightpolystyrene grafted on porous chlorinated silica (Table 7). The above study illus-trated that when separating nonadsorbing solutes, the upper and lower exclusionlimit increased with the molecular weight of the grafted polymer. At the sametime, a significant decrease in the pore volume and the specific surface area ofthe resin was reported for the grafted polystyrene SEC resins. Based on a seriesof SEC studies with polystyrene and alkanes it was concluded that the graftingprocedure resulted in a polystyrene phase bonded to the exterior of the silica SECresins. The study of Lecourtier et al. [51] teaches that SEC of large molecules isbest achieved when grafting occurs outside the silica pores. Clearly, there is aninterplay between the molecular weight of the polymer approaching the surfaceand the space that the grafted chain occupies. The use of long chains results ina higher surface mass density of grafted polymer while increasing the fractionof inaccessible surface area (or micropore volume). The above two effects suggestthe existence of an optimum polymer molecular weight for a maximum columnSEC performance.
The observed dependence of polymer graft yield on molecular weight mustbe interpreted with consideration of the internal pore size of the silica supportrelative to the chain size. For example, polymer grafting onto silica with large
TABLE 7 Effect of the Molecular Weight on the Graft Yield
Specific surface Porous volume Graft yieldSupport (m2/g) (cm3/g) (mg/m2)
Silica 345 0.58 —Silica-PS 1000 60 0.15 3.40Silica-PS 8000 50 0.09 3.54Silica-PS 50,000 145 0.37 3.20
Source: Ref. 56.

290 Cohen et al.
pores (i.e., L Dp, where L is the chain size and Dp is the pore diameter) andwhere the chains are in the dilute regime (i.e., negligible interactions amonggrafted chains) will result in graft yield that increases with polymer molecularweight. On the other hand, when the molecular size of the polymer chain is largerelative to the pore size, pore diffusion limitations will reduce the graft yield asthe molecular weight increases. Similarly, for large chains sterical hindrance ef-fects will also lead to decreasing polymer graft yield with increasing polymermolecular weight. Clearly, as the chain size approaches the distance betweensurface anchoring sites, an already grafted polymer chain can shield adjacentreactive sites from the reactive polymer species in solution. The larger graftedpolymer chains, with larger radii of gyration, tend to shield reactive sites over agreater area than smaller grafted chains. In addition, large polymer chains insolution require a larger unhindered area for grafting to occur. Clearly, for porousSEC silica-based resins, the effects of sterical hindrance should be more pro-nounced, where the size of the polymer modifier limits its diffusion into theporous resin’s matrix. For example, when the mean pore diameter (Dp) of thestarting silica resin falls in the mesopore range and below (Dp 50 nm), polymerchains with a radius of 1.4 nm (e.g., polystyrene-vinylmethyldiethoxysilane co-polymer of MW 10,000 [52]) will have limited access to the pores. Therefore,the obtained polymer graft yield will be lower than calculated based on a freelyaccessible surface. In order to reduce the effects of sterical hindrance and obtaina higher and more uniform polymer surface density, it is more appropriate to usethe method of graft polymerization for SEC resin preparation, which has distinctadvantages, as discussed in Sec. III.
3. Polymer Grafting and Size Exclusion ChromatographyThe synthesis of SEC resins by polymer grafting was reported in the literaturefor protein [53] and polymer [51–54] separations. These studies have shown thatthe performance of polymer-grafted resins, as a function of the molecular weightof the polymer chains, depends on the quality of the solvent. For example, Le-courtier et al. [51] evaluated silica-polystyrene-grafted resins and found that, un-der good solvent conditions, the exclusion limit and solute retention increasedas the molecular weights of the grafted molecules increased (Fig. 14a). Con-versely, for solvents having low affinity for both solute and grafted polymer, theinfluence of the bonded molecule size was reversed, namely, the exclusion limitand solute retention decreased as the molecular weights of grafted moleculesincreased (Fig. 14b). The size, degree of swelling, and grafting location of thegrafted polymer on the silica resin are responsible for the above observations.Studies of swelling of the polymer layer under good solvent conditions and mea-surements of the apparent pore volume by liquid nitrogen adsorption showed thatpolystyrene was mainly grafted outside the pores, preventing direct access of thesolute into the pores. Thus, under good solvent conditions, there are two processes

Polymer-Modified Resins for Aqueous SEC 291
FIG. 14 Effect of the polymer molecular weight and solvent quality on SEC calibrationcurves. (a) Elution volume (Ve) of polystyrenes (molecular weight M ) by chloroform onpure silica Si-60 () and silicas bonded with polystyrene MW 1000 (), MW 8000(), and MW 50,000 (). (b) Elution of polystyrenes (PS) and alkanes (Alk) by dimeth-ylformamide on silica bonded with polystyrene MW 1000 [PS (), Alk ()], MW 8000 [PS (), Alk ()], and MW 50,000 [PS (), Alk ( )]. (From Ref. 51.)
controlling the chromatographic separation: steric exclusion effect in the silicapores and partition of the solute between the grafted phase and the bulk phase.At sufficiently high molecular weight of the grafted polymer chains, pore en-trances may be blocked by the polymer, thus preventing the penetration of largersolutes into the interior of the SEC resin (Fig. 14a). Small solutes, however, canpartition into the grafted layer and this process largely depends on the differencebetween solute affinity toward the grafted molecules and the solvent. It is worthnoting that reverse chromatography occurs when solutes exhibit high affinity to-ward the stationary phase. Under these latter conditions, the retention time isaffected by the interaction parameters between the solute and the grafted layer,

292 Cohen et al.
which in turn also depend on polymer size. For example, dimethylformamide isa better solvent for polystyrene MW 1000 than for polystyrene of MW 50,000. Thus, elution volume for a grafted polystyrene of MW 50,000 shouldbe lower than for a grafted polystyrene of MW 1000 reverse phase (Fig. 14b).
Polymer chains grafted onto silica can be used to screen specific solute–silicainteractions. However, solvent parameters such as hydrophobicity or ionicstrength must be optimized to minimize solute–SEC resin interactions. The effectof solvent quality on electrostatic and hydrophobic solute–surface interactionsis illustrated in the study of Petro et al. [53]. These authors demonstrated theeffect of solvent power on electrostatic and hydrophobic interactions betweenproteins and both diol-grafted and dextran-grafted silica resins. Protein retentionwas found to be higher on the diol-silica resins than on the dextran-silica resins,which indicated that protein–surface silanol interactions were significantly sup-pressed by the dextran surface phase (MW 40,000). As expected, an optimalsalt concentration was found at which protein–surface interactions were at mini-mum. An even more effective shielding of residual silanols was achieved bygrafting aminoethyl-derivatized dextran (AE-dextran) onto the silica SEC resin.However, the performance of the latter modified resin was affected by the contentof the aminoethyl groups, which essentially reduced the cation exchange effectof silanols in the presence of positively charged amino groups. Nevertheless, withincreasing content of amino groups on the dextran graft, anion exchange behaviorof the resin emerges, resulting in increased retention of acidic proteins at lowsalt concentration. Although residual electrostatic interactions can be minimized,by increasing the ionic strength of the solvent, hydrophobic resin–protein interac-tions also increase with increasing salt concentration. Thus, despite the improve-ment of modified SEC resins, ionic strength is also a parameter that needs to beoptimized for aqueous SEC applications.
In closure, grafted polymers can be effective in controlling specific surface–solute interactions (e.g., minimizing surface adsorption of proteins). However,it is necessary to optimize solvent conditions under which SEC is performed.Additionally, the resin’s pore structure can be significantly altered by the graftingprocess [54]. Thus, the initial pore size distribution of the SEC resin must becarefully selected, in relation to the size of the grafted chains, in order to producea SEC resin of the desired molecular weight resolution.
III. GRAFT POLYMERIZATION
A. Process Overview
Free radical graft polymerization procedure typically consists of two separatesteps: a silylation reaction producing a vinylsilane-modified surface, and a subse-quent surface polymerization of a vinyl monomer that results in a chemically

Polymer-Modified Resins for Aqueous SEC 293
bonded polymer phase (see Fig. 15). In order to achieve the desired characteristicsfor the grafted polymer phase it is necessary to understand the various controllingreaction steps involved in the production of that material. An overview of thetypical experimental procedure is presented focusing on the techniques of pre-treatment, silylation, hydrolysis, and graft polymerization.
1. Surface PretreatmentSurface activation is a crucial step for subsequent graft polymerization. Mostsurface activation procedures rely on surface silylation. However, prior to silyla-tion, the silica resin must be cleaned with a dilute acid to remove metal ions(e.g., iron) and any traces of organic solvents from the surface. The resin is thenwashed in deionized water for a prescribed period of time in order to hydrolyzesurface siloxane groups into silanol groups. A final surface preparation step con-sists of drying the resin in order to remove excess surface water.
In the silylation step silane compounds with the desired functionality are re-acted with surface hydroxyls. For example, amorphous silicas possess, dependingon the temperature history of silica, surface silanol ( SiOH) and/or silox-ane SiOSi ) groups. Hydroxyl concentration for native hydroxylatedsilica is reported to be 4.6 hydroxyls per nm2 [24]. Since the silanes react onlywith the surface hydroxyl groups, the maximum possible surface coverage withsurface silanes is therefore 4.6 molecules/nm2.
FIG. 15 Steps in vinylpyrrolidone (VP) grafting onto silica: (a) surface silylation; (b)VP surface grafting; (c) resultant attached PVP surface chains.

294 Cohen et al.
2. Surface SilylationPrior to graft polymerization, the silica surface is activated as illustrated in Fig.11 for the attachment of a vinyltrialkoxysilane onto a hydroxylated surface. Sincethe vinyl groups of these attached silane molecules provide the surface anchoringsites for the grafted polymeric chains, the ability to regulate the silylation cover-age provides a method for controlling the surface density (chains/area) of theresulting polymer chains. It is noted that, in the above example, the use of trial-koxysilane allows for multiple surface attachments and/or silane crosslinking,which produces multilayer coverage [55] as shown schematically in Fig. 16. Ad-ditional details regarding silylation of the silica resins are provided in Sec II.B.In the sections that follow the discussion is restricted to alkoxyvinylsilane, whichcan be bonded to silica in a controlled manner and under extremely mild reactionconditions.
Chemical bonding of alkoxysilanes onto the hydroxylated silica surface maybe accomplished by either aqueous phase or anhydrous silylation methods asdescribed in Sec. II.B. Briefly, aqueous phase silylation in the presence of watermolecules leads to the formation of polysilanes, which may limit the developmentof a uniform surface coverage because of sterical effects. In addition, the silaneyield is strongly affected by the pH of the reaction medium. Anhydrous silylationreactions may be performed using pure silane or in anhydrous organic solventswith properly dried substrates. The selection of the appropriate organic solventis essential for the formation of a uniform brush-like surface coverage. On theother hand, high-yield multilayer coverage may be achieved with the addition ofa small amount of surface water to the dried substrates [29,56].
Subsequent hydrolysis of the alkoxysilane-modified silica surface is necessarywhen the graft polymerization process is conducted in an aqueous solution dueto the hydrophobic nature of the remaining alkoxy groups. Hydrolysis of theunreacted alkoxy groups increases the hydrophilicity of the silylated surface, thusfacilitating a more efficient wetting of the support by the aqueous monomer solu-
FIG. 16 Multilayer silane coverage of the silica surface.

Polymer-Modified Resins for Aqueous SEC 295
tion. Hydrolysis can be carried out using a basic solution (typically at pH 9.5)as illustrated in Fig. 17.
3. Graft Polymerization Process
(a) General Aspects. The final part of the surface modification procedure isthe graft polymerization reaction itself, as illustrated in the example of Fig. 15,in which an initiator is used to initialize the polymerization by attacking theC C bond of both the monomer and the surface silane groups formingfree radicals. During graft polymerization, the attachment of polymer to the sur-face results from one of three possible processes: polymer grafting, graft polymer-ization, and termination (Fig. 18). Polymer grafting refers to chemical bondingbetween living polymer and the silica surface sites. Graft polymerization is theprocess of attaching monomeric units, one by one, to active groups on a chaingrowing from the substrate surface. Termination results from the reaction of alive homopolymer chain and a growing surface chain, and is often grouped withpolymer grafting defined previously. Due to sterical hindrance and diffusion limi-tations of the large polymer chains near the surface and in the pores of the resins,polymer grafting typically results in low graft density. On the other hand, as wasmentioned in Sec. II.C, since graft polymerization involves the diffusion of small
FIG. 17 Hydrolysis of the alkoxysilanes-modified silica surface with potassium hy-droxide.

296 Cohen et al.
FIG. 18 Comparison between graft polymerization and polymer grafting. M: Monomer;M*n : active polymer chain of size n; S: surface site; S*n : active surface chain of size n.
monomer molecules to the silica surface, graft polymerization results in relativelyhigh polymer yield and more uniform surface coverage than that obtained viapolymer grafting. In order to ensure that graft polymerization is the primary pro-cess by which polymeric chains are grown on the silica surface, it is necessaryto understand the kinetic mechanism of the graft polymerization process.
(b) The Kinetics of Graft Polymerization. The kinetics of free radical graftpolymerization involves the following species: solvent, reaction initiator, freeradicals, monomers in solution, surface-bound monomers, live growing homo-polymer chains (i.e., chains in solution), live surface chains, terminated homo-polymer, and terminally anchored surface chains. Consumption of monomer oc-curs by two processes, homopolymerization in solution and graft polymerization(which includes polymer grafting) on the silica surface, with the sum of thesetwo consumption rates representing the overall rate of monomer consumption.The reaction sequence for free radical graft polymerization, as in traditional freeradical polymerization mechanisms, can be divided into four different categories:initiation, propagation, transfer, and termination. A summary of the various reac-tion steps is given in Fig. 19. The various species that appear in the reaction
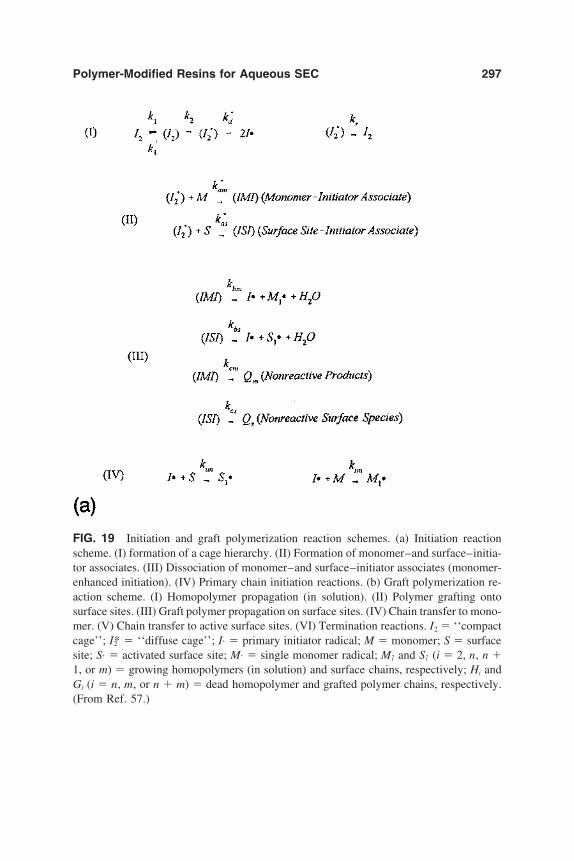
Polymer-Modified Resins for Aqueous SEC 297
FIG. 19 Initiation and graft polymerization reaction schemes. (a) Initiation reactionscheme. (I) formation of a cage hierarchy. (II) Formation of monomer–and surface–initia-tor associates. (III) Dissociation of monomer–and surface–initiator associates (monomer-enhanced initiation). (IV) Primary chain initiation reactions. (b) Graft polymerization re-action scheme. (I) Homopolymer propagation (in solution). (II) Polymer grafting ontosurface sites. (III) Graft polymer propagation on surface sites. (IV) Chain transfer to mono-mer. (V) Chain transfer to active surface sites. (VI) Termination reactions. I2 ‘‘compactcage’’; I*2 ‘‘diffuse cage’’; I⋅ primary initiator radical; M monomer; S surfacesite; S⋅ activated surface site; M⋅ single monomer radical; M⋅i and S⋅i (i 2, n, n 1, or m) growing homopolymers (in solution) and surface chains, respectively; Hi andGi (i n, m, or n m) dead homopolymer and grafted polymer chains, respectively.(From Ref. 57.)

298 Cohen et al.
FIG. 19 Continued
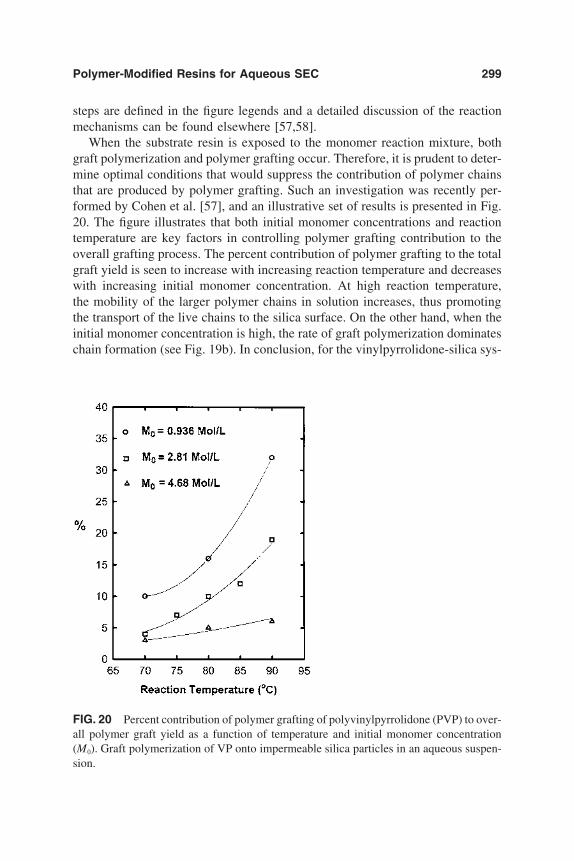
Polymer-Modified Resins for Aqueous SEC 299
steps are defined in the figure legends and a detailed discussion of the reactionmechanisms can be found elsewhere [57,58].
When the substrate resin is exposed to the monomer reaction mixture, bothgraft polymerization and polymer grafting occur. Therefore, it is prudent to deter-mine optimal conditions that would suppress the contribution of polymer chainsthat are produced by polymer grafting. Such an investigation was recently per-formed by Cohen et al. [57], and an illustrative set of results is presented in Fig.20. The figure illustrates that both initial monomer concentrations and reactiontemperature are key factors in controlling polymer grafting contribution to theoverall grafting process. The percent contribution of polymer grafting to the totalgraft yield is seen to increase with increasing reaction temperature and decreaseswith increasing initial monomer concentration. At high reaction temperature,the mobility of the larger polymer chains in solution increases, thus promotingthe transport of the live chains to the silica surface. On the other hand, when theinitial monomer concentration is high, the rate of graft polymerization dominateschain formation (see Fig. 19b). In conclusion, for the vinylpyrrolidone-silica sys-
FIG. 20 Percent contribution of polymer grafting of polyvinylpyrrolidone (PVP) to over-all polymer graft yield as a function of temperature and initial monomer concentration(M0). Graft polymerization of VP onto impermeable silica particles in an aqueous suspen-sion.

300 Cohen et al.
tem, the grafting of PVP is best carried out at low temperature and high monomerconcentration in order to minimize the contribution of polymer grafting. It isworth noting that in the example of Fig. 20 the practical initial monomer concen-tration is 2.81 mol/L because at the higher concentration of 4.68 mol/L the vis-cosity of the reaction mixture increases rapidly, making it difficult to maintaina well-mixed suspension.
B. Graft Polymerization and Size ExclusionChromatography
Modification of SEC silica resins via graft polymerization is an efficient methodof masking surface silanol groups on silica surfaces. This approach, as mentionedpreviously, results in covalently bonded polymeric chains that are grown mono-mer by monomer on the silica surface, thus yielding modified resins with potentialfor long-term chemical and mechanical stability. The first reported modificationof a silica resin with a grafted pyrrolidone-type surface group (i.e., 1-N-pyrroli-dyl-2-dimethylchlorosilylethane) for aqueous SEC of various polymeric chainswas reported in the mid 1980s [6]. However, these resins demonstrated marginalchemical stability relative to PVP-coated resins [6].
In order to improve the stability of PVP-modified silica resins, direct graftingmethods of PVP onto silica resins via graft polymerization or polymer graftinghave been proposed as alternatives to coated silica resins to yield stable silica-supported polymer (SSP) resins for SEC [6,10,37,59–61]. Polymer grafting,which involves the covalent bonding of live polymer chains to the silica surface,can be used to produce chemically stable resin with monodispersed polymericsurface chains [10]. However, grafting of large polymeric chains onto the silicasurface and inside the pores is problematic due to diffusional limitations andsteric hindrance effects (see Sec. II.C.2 and II.C.3 and [10]). In contrast, thefree radical graft polymerization method (described previously in Sec. III.A.3)promotes a more uniform surface coverage with a higher surface chain density,albeit with a wide molecular weight distribution that is typical for free radicalhomopolymerization.
There are several major operating conditions that affect the performance ofSSP/SEC columns. These include grafted polymer surface density, chain length,solvent power of the eluent, shear stress (or shear rate) at the interstitial porewalls, and column temperature. When the length of the anchored chains is long,relative to the distance between the anchoring points on the surface, the chainsextend away from the surface forming a so-called brush layer (Fig. 21). A simplecriterion for the formation of a brush layer was proposed by de Gennes [62]:
αD2
N6/5 (2)

Polymer-Modified Resins for Aqueous SEC 301
FIG. 21 Polymer chain conformation in a good solvent at (a) high and (b) low surfacechain density. High surface chain density corresponds to the so-called polymer brush layer.
where α is the monomer size, D is the average distance between grafted sites,and N is the number of monomers per grafted chain. If the inequality in Eq. (2)is satisfied, the grafted polymer layer is in the dense brush regime. In this typeof grafted layer conformation, the chains extend away from the surface withpartial overlap between neighboring chains. When the inequality of Eq. (2) isreversed, the grafted chains collapse against the surface in a coiled mushroom-type conformation. The surface density of the grafted polymer phase, and in turnthe conformation of the polymer chains, affects the permeability of the packedSEC column. A dense polymer surface layer, consisting of high molecular weightpolymer chains, will reduce the permeability of the column, resulting in increasedoperational pressure. At the same time, it is expected that reduction in resin sizeand column porosity will reduce the lower MW exclusion limit. It is importantto note that as the quality of the solvent increases, the polymer surface phaseswells to a greater degree, lowering the column permeability [59,63]. On theother hand, as the solvent quality (for the surface polymer) decreases, the chainsretract to the surface resulting in higher column permeability [59].
The variation of permeability of SEC columns packed with SSP resins canbe utilized as a measure of the effective length of the chains. Hydrodynamicpermeability measurements are expected to be sensitive to long chains, a fact thatis well known from measurements of the hydrodynamic thickness of adsorbedpolymers [64,65]. The permeability, which is obtained from simple flow rate–pressure drop measurements, can be related to the effective hydrodynamic thick-ness of the polymer surface layer via the following equation [64,65]:
LH
RE
1 kG
k 1/4
(3)
where LH is the effective hydrodynamic thickness of the grafted polymer chains,k and kG are the permeabilities of the packed column packed with the native silicaresin and the silica-grafted polymer resin, respectively, and RE is the effectivepore radius given by [66]:
RE dp
12(1 )(4)

302 Cohen et al.
where dp is the particle diameter and is the porosity of the packed column.Equation (3) assumes that the pores in the column are represented by equivalentcylindrical pores. Thus, a decrease in column permeability due to a grafted poly-mer phase (relative to the native silica resin) is equivalent to a decrease in thepore diameter or, equivalently, to an increase in the effective hydrodynamic thick-ness of the polymer surface layer. As an illustration, the flow rate–pressure dropbehavior for a PVP-grafted silica resin is shown in Fig. 22 for the flow of differentsolvents. The native silica was Nucleosil 1000-10 (N1000-10) with an averageparticle diameter of 10 mm, an average pore diameter of 1000 A, and a surfacearea of 50 m2/g. It is evident that there are significant differences in the permeabil-ities (observed from the slopes of the flow curves) between the two solvents
FIG. 22 (a) Flow rate versus pressure drop for column packed with PVP-grafted silicaresin G1 (with 121 monomers per grafted chain). (b) Flow rate versus pressure drop forcolumn packed with PVP-grafted silica resin G2 (with 63 monomers per grafted chain).Same elution conditions are used for both columns as indicated in a and b. (From Ref.59.)

Polymer-Modified Resins for Aqueous SEC 303
(water and water-acetone) for the resin with the longer grafted chains containing121 monomers per chain (Fig. 22a). This behavior is indicative of the swellingof the chains as the solvent power increases from a theta solvent (water-acetone(33:67 v/v) to a good solvent (pure water). On the other hand, the column packedwith the resin of shorter chains (containing 63 monomer units per chain; Fig.22b) exhibits a much smaller variation in column permeability with solventpower. This behavior is consistent with the discussion above and suggests thatfor the silica-grafted PVP resin there is an additional operational consideration,namely, the variation in pore size with solvent power. Additional flow rate–pres-sure drop curves for the N1000-10 resin with grafted PVP chains of about 130monomers/chain are given in Fig. 23. The curves illustrate nicely the increasing
FIG. 23 Flow curves for a PVP-grafted N1000-10 column for different solvents. Theslope of the curves is the column permeability k Q/[∆PA/(µL)], where Q flow rate,∆P pressure drop across the packed column, A column cross-sectional area, µ viscosity of mobile phase, and L column length. Swelling of the grafted PVP phaseis evident by the decrease in the slope of the flow curves with increasing solvent power.The resin was prepared by graft polymerization with initial VP concentration of 5% byvolume. (From Ref. 63.)

304 Cohen et al.
column permeability with decreasing solvent power. When a very hydrophiliceluent such as ethanol is used, significant polymer swelling decreases the columnpermeability below that obtained with pure water. On the other hand, when a veryhydrophobic eluent such as cyclohexane is used, polymer swelling is minimal andcolumn permeability is observed to be highest (Fig. 23). The curve for the thetasolvent water-acetone (33:67 v/v) gives intermediate column permeability.
As noted earlier, if the surface density of the grafted chains is sufficientlyhigh, one should expect the permeability of the column to be invariant with theshear stress in the interstitial pores of the column. Indeed, as illustrated in Fig.24 for a silica resin with grafted PVP polymer chains in the brush regime and withchain length/resin diameter ratio of about 9.3 104, the column permeability forwater is independent of the column shear stress (or shear rate). In addition, thecolumn packed with silica resins grafted with longer chains (121 monomers per
FIG. 24 Permeability of PVP grafted-silica column G1 (with 121 monomers per graftedchain). Effect of solvent power on pore–wall shear stress, τ [∆P/(Le/L)(L/RE)], where∆P pressure drop across column, Le /L the ratio of the effective fluid path length tocolumn length (1.57 for spherical packings), and RE effective pore radius of poresin the packed column, which is given by Eq. (4). (From Ref. 59.)

Polymer-Modified Resins for Aqueous SEC 305
chain; curves in Fig. 22a) exhibits a lower permeability (compare Fig. 22a andb). Clearly, the length of the polymer chains and solvent power affect the resin’spore size; therefore, these variables are important to consider when designingSEC applications with silica-grafted polymer resins.
The effect of grafted surface chains on SEC separation of polyvinylpyrroli-done and polyethylene oxide standards is shown in Fig. 25. The grafted resinsyield a linear calibration of log(MW) versus elution volume over a considerablemolecular weight range. Moreover, it is apparent that the PVP-30, which haslonger chains than the PVP-10 resins, has a lower resolution at the lower MWregion (i.e., near the lower MW exclusion limit) and also a lower upper MWexclusion limit. Although the above two resins have not been optimized for aque-ous SEC, the results do suggest that the length of the surface chains (in the brushregime) can be manipulated to synthesize resins for SEC analysis of differentMW ranges. It is also worth noting that the calibration curve for an adsorbedPVP-10K resin (prepared by adsorbing a 10K MW PVP onto the surface of thesilica resin) has a much narrower range of MW applicability with the addeddisadvantage of poor resin stability (see Fig. 25).
FIG. 25 Molecular weight versus elution volume calibration curves of PEO and PVPstandards for adsorbed PVP-silica (PVP-10K) and PVP grafted-silica (PVP-10 and PVP-30). (From Ref. 10.)

306 Cohen et al.
As implied by the above discussion, the resulting performance of silica-graftedpolymer resins can be tailored by adjusting the length of the polymer chainsrelative to the initial silica resin pore size. An illustration of this type of controlis provided in Fig. 26, where resins with initial pore size of 4000 and 1000 Awere used in SEC of PEO standards. For this type of silica resin an upper MWexclusion limit of 7 105 was obtained with a lower MW exclusion limit ofabout 1000. Of the three resins shown in Fig. 26, the N4000-grafted resin, whichwas prepared by graft polymerization at an initial monomer concentration of 30%(VP 30%) (by volume), had the lowest upper exclusion limit. This is consistentwith the fact that the contribution of graft polymerization (i.e., sequential additionof monomer to growing surface chains) to the formed grafted polymer phase ishigher at the higher initial monomer concentration, resulting in longer graftedchains with measurable reduction in pore size for the N4000-10 (VP 30%) resin.A native silica resin with smaller initial diameter can also be used to achieve aseparation capability in the range displayed for the N4000 resins. Such a case isillustrated in Fig. 26 for the 1000-A pore silica resin (N1000-10) onto whichvinylpyrrolidone was polymerized with initial monomer concentration of 5%. At
FIG. 26 Molecular weight versus elution volume calibration curves of PEO standardsfor the larger pore size (4000 A) PVP-grafted silica resins N4000-10 (VP 10% and VP30%), and the smaller pore size PVP-grafted silica resin (1000 A) N1000-10 (VP 5%).(From Ref. 63.)

Polymer-Modified Resins for Aqueous SEC 307
the lower initial monomer concentration the contribution of polymer grafting (i.e.,attachment of living polymer chains to the surface) to the grafted polymer phaseincreases and thus a layer of shorter chains results. The grafting of the shorterPVP chains on the smaller pore size resin (N1000-10) produced a modified resinwith similar SEC performance as the larger pore size resin (N4000-10). The abil-ity to control the size of the chains is crucial to designing effective grafted poly-mer resins. Clearly, this can only be accomplished with a detailed understandingof the graft polymerization kinetics as discussed in Sec. III.A.
Changes in SEC column operating temperature can also significantly affectthe permeability of the PVP-grafted resin. For example, the permeability of PVP-grafted resin-packed columns increases with eluent temperature, as illustrated forthe water-PVP systems in Fig. 27. This result is consistent with the typical trendthat the solvent power of a good solvent is expected to decrease with increasingtemperature because the swelling of PVP in a good solvent is an exothermic
FIG. 27 Temperature effect on flow curves in columns packed with PVP grafted-silicaresin G1: (a) at 25°C and (b) at 28°C. (Note: column permeability is given by k [Q/∆PA/(µL)], as defined in Fig. 23.) (From Ref. 59.)

308 Cohen et al.
process [67]. The decrease in solvent power results in lower swelling of the poly-mer chains and, as a consequence, higher column permeability [59]. It is alsointeresting to note that the permeability of the PVP-grafted silica resin for water-acetone (33:67 v/v) at 25°C was lower than that for the 0.55 M aqueous sodiumsulfate solution at 28°C (Fig. 27), even though both eluents are theta solvents.This interesting difference between the two solvents is consistent with estimatesof the end-to-end distance of the PVP chains in these solvents as described in[67]. Similar trends in column permeability with changes in column temperaturecan also be seen in Fig. 24.
IV. SUMMARY
The grafting of polymers onto silica resins using free radical graft polymerizationfor aqueous SEC applications is a relatively recent development. The motivationbehind the development of this technique was to produce modified SEC-silicaresins that would not interact with the solutes to be separated. Thus, the degreeof masking of the silica surface silanol groups is by far the most important prop-erty that modified silica resins for SEC must possess. In addition, the modifiedsilica resins should exhibit long-term chemical stability. Clearly, the graft poly-merization approach presented in this chapter for PVP-grafted silica resins resultsin resins with the above desired properties. Moreover, graft polymerized silicaSEC resins have been shown to present better long-term chemical stability thanpolymer-coated resins.
Grafted polymers can also be used to alter the porosity of native silica withlarge pores and thus change the exclusion limit of the resins. This can be achievedby controlling the density and length of the polymer chains. Additionally, solventpower and column temperature were shown to markedly affect the conformationof the grafted polymer chains and thus alter column permeability. This may alsobe used to obtain desired column permeabilities and better SEC performance foraqueous as well as nonaqueous SEC systems.
Although the focus of this chapter was on the graft polymerization of PVPonto silica resins for aqueous SEC, there may be many other polymers suitablefor this particular resin modification technique. Indeed, the very promising resultswith the PVP-grafted silica resins should encourage future studies of other poly-meric materials that may be suitable for grafting onto silica resins for use in avariety of SEC systems.
REFERENCES
1. R. Eksteen, and K. J. Pardue, in Handbook of Size Exclusion Chromatography (WuChi-san, ed.), Marcel Dekker, New York, 1995, pp. 47–101.

Polymer-Modified Resins for Aqueous SEC 309
2. E. G. Malawer, in Handbook of Size Exclusion Chromatography (Wu Chi-san, ed.),Marcel Dekker, New York, 1995, pp. 1–24.
3. G. Matthijs, and E. Schacht, J. Chromatography A 755:1 (1996).4. F. L., Zhou, D. Muller, X. Santarelli, J. Jozefonvicz, J. Chromatogr. 476:195 (1989).5. D. Horak, J. Hardil, and M. J. Benes, in Strategies in Size Exclusion Chromatogra-
phy, (M. Potschka, and P. L. Dubin, eds.), American Chemical Society, Washington,D. C., 1996, pp. 190–210.
6. J. Kohler, Chromatographia 21:573 (1986).7. K. K. Unger, and J. N. Kinkel, in Aqueous Size-Exclusion Chromatography, (P. L.
Dubin, ed.), Elsevier, Amsterdam, 1988, pp. 193–234.8. Y. Frere and Ph. Gramain, J. Reactive Polym. 16:137 (1992).9. V. A. Romano, T. Ebeyer, and P. L. Dubin, in Strategies in Size Exclusion Chroma-
tography (M. Potschka, and P. L. Dubin, eds.), American Chemical Society, Wash-ington, D. C., 1996, pp. 88–102.
10. Y. Cohen and P. Eisenberg, in Polyelectrolyte Gels: Properties, Preparation, andApplications (R. S. Harland, and R. K. Prud’homme, eds.), American Chemical Soci-ety, Washington, D.C., 1992, pp. 254–268.
11. P. L. Dubin, in Aqueous Size-Exclusion Chromatography (P. L. Dubin, ed.), Elsevier,Amsterdam, 1988, pp. 55–75.
12. X. Santarelli, D. Muller, and J. J. Jozefonvicz, J. Chromatography 443:55 (1988).13. G. Shah and P. L. Dubin, J. Chromatography 693:197 (1995).14. P. Pfannkoch, K. C. Lu, and F. E. Regnier, J. Chromatogr. Sci. 18:430 (1980).15. L. Letot, J. Lesec, and C. Quivoron, J. Liq. Chromatogr. 4:1311 (1981).16. H. D. Crone, R. M. Dawson, and E. M. Smith, J. Chromatography 103:71
(1975).17. W. Reppe, Poly(vinylpyrrolidone) Verlag Chemie: Weinheim, FRG, 1954.18. L. Blecher, D. H. Lorenz, H. L. Lowd, A. S. Wood, and D. P. Wyman, in The
Handbook of Water-Soluble Gums and Resins (R. L. Davidson, ed.), McGraw-Hill,New York, 1980, pp. 21.1–21.21.
19. B. Arkles, Chemtech 7:766 (1977).20. Petrarch Systems, Inc. Silicon Compounds Register and Review, Bristol, Pennsylva-
nia 1987.21. J. L. Koenig and P. T. K. Shih, J. Colloid Interface Sci. 36:247 (1971).22. E. P. Plueddemann, in Interfaces in Polymer Matrix Composites, Composite Materi-
als (E. P. Plueddemann, ed.), Academic Press, New York, p. 6, 1974.23. E. P. Pluedemann and G. L. Stark, Modern Plastics 55:74 (1974).24. R. K. Iler, The Chemistry of the Silica, John Wiley and Sons, New York, 1979.25. K. K. Unger, N. Becker, P. Roumeliotis, J. Chromatography 125:115 (1976).26. G. Schomburg, A. Deege, J. Kohler, and U. Bien-Vogelsang, J. Chromatography
282:27 (1983).27. L. T. Zhuravlev, Reac. Kinet. Catal. Letters 50:15 (1993).28. M. Chaimberg, Free Radical Graft Polymerization of Vinyl Pyrrolidone, Ph.D. dis-
sertation, University of California, Los Angeles, 1989.29. R. E. Majors, and J. M. Hopper, J. of Chromatogr. Sci. 12:767 (1974).30. M. Chaimberg and Y. Cohen, J. Colloid Interface Sci. 134:576 (1990).31. H. Engelhard and D. Mathes, J. Chromatography 142:311 (1977).

310 Cohen et al.
32. L. R. Snyder and J. J. Kirkland, Introduction to Modern Liquid Chromatography,John Wiley and Sons, New York, 1979.
33. T. Kremer and L. J. Boros, Wiley and Sons 1979.34. C. J. Van Oss, Sep. Puri. Meth. 11:131 (1982/83).35. D. R. Absolom, Sep. and Purif. Meth. 10:239 (1981).36. H. Engelhard and D. Mathes, J. Chromatography 185:305 (1979).37. I. Krasilnikov and V. Borisova, J. Chromatography 446:211 (1988).38. P. Roumeliotis, and K. K. Unger, J. Chromatography 218:535 (1981).39. M. P. C. Silvestre, M. Hamon, and M. Yvon, J. Agric. Food Chem. 42:2778 (1994).40. D. Corradini, R. Filippetti, and C. Corradini, J. Liq. Chromatography 16:3393
(1993).41. S. Mori, J. Chromatography 471:367 (1989).42. N. T. Miller, B. Feibush, and B. L. Karger, J. Chromatography 316:519 (1985).43. D. E. Schmidt, R. W. Glese, D. Conron, and B. L. Karger, Anal. Chem. 52:177
(1980).44. L. R. Meyerson, and K. I. Abraham, Peptides 7:481 (1986).45. F. E. Regnier and K. M. Gooding, Anal. Biochem. 103:1 (1980).46. H. D. Crone, and R. M. Dawson, J. Chromatography 129:91 (1976).47. P. Roumenliotis, and K. K. Unger, J. Chromatography 185:445 (1979).48. F. E. Regnier, Meth. Enzymol. 91:137 (1983).49. R. Ovalle, Anal. Biochem. 229:1 (1995).50. E. Papirer, and V. T. Nguyen, Angew. Makromol. Chem. 28:31 (1973).51. J. Lecourtier, R. Audebert, and C. Quivoron, J. Liq. Chromatography 1:479 (1978).52. A. Kurganov, O. Kuzmenko, V. A., Davankov, B. Eray, K. K. Unger, and U. Trud-
inger, J. Chromatography 506:391 (1990).53. A. Kurganov, V. Davankov, T. Isajeva, K. Unger, and F. Eisenbeiss, J. Chromatogra-
phy A 660:97 (1994).54. M. Petro, P. Gemeiner, and D. Berek, J. Chromatography A 665:37 (1994).55. K. M. R. Kallury, P. M. Macdonald, and M. Thompson, Langmuir 10:492 (1994).56. R. P. Castro, Development of ceramic-supported polymeric membrane for filtration
of oil emulsions, Ph.D. dissertation, University of California, Los Angeles, 1997.57. Y. Cohen, J. D. Jou, W. Yoshida, and L. J. Bei, in Oxides Surfaces (J. A. Wingrave,
ed.), Marcel Dekker, New York, 1997.58. M. Chaimberg and Y. Cohen, AIChE J. 40:294 (1994).59. Y. Cohen, P. Eisenberg, and M. Chaimberg, J. Colloid Interface Sci. 148:579 (1992).60. A. E. Ivanov, L. Zigis, M. F. Turchinskii, V. P. Kopev, P. D. Reshetov, V. P. Zubov,
L. N. Kastrikina, and N. I. Lonskaya, Mol. Genet., Mikrobiol. Virusol. 11:39 (1987).61. K. Komiya, Y. Kato, Can. Pat. 1987, 1,293,083; Chem. Abstr. 117:163,125 (1991).62. P. G. de Gennes, Macromolecules 13:1069 (1980).63. C. Chen, Behavior of polyvinylpyrrolidone-grafted silica resin in size exclusion
chromatography, M.S. thesis, University of California, Los Angeles, 1992.64. R. Varoqui, and P. Dejardin, J. Chem. Phys. 66:4395 (1977).65. P. Gramain, and P. Myard, Macromolecules 14:180 (1981).66. Y. Cohen, and A. B. Metzner, AIChE J. 27:705 (1981).67. P. J. Flory, Principles of Polymer Chemistry, Cornell University Press, Ithaca, NY,
1953.

8Polycation-Modified Siliceous Surfacesfor Protein SeparationsYINGFAN WANG and PAUL L. DUBIN Department of Chemistry,Indiana University—Purdue University, Indianapolis, Indiana
I. Introduction 311
II. Experimental 314A. Materials 314B. Methods 315
III. Results and Discussion 317A. Selectivity 317B. Protein binding 317C. Polyelectrolyte adsorption layer 318D. Chromatography 319E. Quasi-elastic light scattering 320F. Capillary electrophoresis 322
IV. Conclusions 326
References 326
I. INTRODUCTION
Chromatographic separation of proteins is based on their specific or nonspecificinteractions with the stationary phase of chromatographic columns. Specific inter-actions have been utilized in affinity chromatography, in which protein separationresults from the interaction of protein binding sites with immobilized ligands [1].Various ligands including protein G, biotin, and glucose have thus been immobi-
311

312 Wang and Dubin
lized to provide highly selective separation of their complementary proteins [1].Nonspecific interactions based on electrostatic, hydrophobic, and dipole–dipoleeffects also provide the basis for several types of protein chromatography. Forexample, ion exchange chromatography depends on the competitive interactionof proteins and simple ions with the packing material, and proteins are separatedprimarily according to their net charge. In reverse phase liquid chromatography(RPLC) [2], the elution sequence of proteins depends on the overall hydropho-bicity. Lastly, elution in size exclusion chromatography (SEC) [3] depends onprotein molecular dimensions. These examples indicate the diversity of proteinchromatography.
The stationary phases of chromatography columns are normally supported bya core of inorganic or polymeric material [2]. Generally, chromatographic sup-ports must be mechanically stable, uniform with respect to size and pore distribu-tion, and chemically inert to both solvent and solute molecules [2]. Althoughcrosslinked polysaccharides, polyacrylamide, and other polymeric materials arestill widely used for protein separations, the chromatographic applications ofthese materials tend to be constrained by their limited mechanical strength, lowcolumn efficiency, and swelling [4]. On the other hand, inorganic materials suchas silica, alumina, and glass beads exhibit good mechanical stability. Silica andglass beads are particularly useful in chromatographic applications due to theease of surface modification and commercial availability [2,4].
Silica and glass beads typically require surface modification for protein separa-tion. This modification may involve a chemically stable bonded stationary phasethat prevents undesired interactions between proteins and active silanol groups, orit may involve introduction of desired active sites that can interact with proteins.Siliceous surfaces have been modified with both small molecules and macromole-cules. Petro and Berek [4], who summarized recent developments in polymer-modified silica gels, pointed out that polymer-modified silica stationary phasesare more chemically stable than monomer-modified stationary phases. It can alsobe noted that a substantial proportion of silanol groups remain unaltered aftersurface modification with low molecular weight ligands. These uncovered silanolgroups often show undesirable interaction with solutes. This problem can be re-duced by macromolecule modification, which provides more complete surfacecoverage.
Macromolecular modification of the silica surface has also been proven to bean effective method to prevent protein adsorption in capillary electrophoresis,and many polymers have been employed for this purpose. Regnier et al. [5] modi-fied fused silica capillaries with polyethyleneimine (PEI). The subsequent cross-linking of adsorbed PEI provided a stable polymer layer on silica surface. Theirresults show that PEI-modified capillary minimized adsorption of positivelycharged proteins onto the capillary surface. Neutral polymers have also beenused in capillary electrophoresis to prevent protein adsorption. Kubo [6] used a

Polycation-Modified Siliceous Surfaces 313
polyacrylamide-coated capillary to reduce the adsorption of bovine serum albu-min (BSA). Generally, the techniques used to modify silica surfaces with poly-meric materials are the same.
Interest in polymer modification of silica surface has recently been stimulatedby potential applications to capillary electrophoresis (CE) [5,7–9]. Previous studydemonstrated that polymers can be immobilized either through chemical modifi-cation or through physisorption [4,10]. In the first class of immobilization, poly-mers are covalently bound to the silica surface by reaction with silanol groups orwith other functional groups introduced onto the silica surface [4,7,8]. Althoughchemical modification appears to yield a relatively stable polymer stationaryphase, the cost and inflexibility of this method impede further application, andrecent attention has been focused on physisorption [8,9]. The second of thesemethods involves the adsorption of polymer onto a silica surface without chemi-cal reaction [4,9]. In this method, both ionic and nonionic polymers can be di-rectly deposited onto silica and may remain on the silica surface permanently.Physisorption may also be used to bind monomers or oligomers, followed bypolymerization, with or without crosslinking, on the silica surface [5]. Since poly-electrolytes are readily physisorbed onto oppositely charged surfaces throughelectrostatic interactions, they have been used to modify the chromatographicproperties of silica materials [9].
Two approaches toward the examination of polymer-modified silica can bevisualized, either by examination of chromatographic properties or by elucidationof the structure of the adsorbed polymers. Chromatographic properties includecolumn efficiency, resolution, and relative retention; by ‘‘structure of adsorbedpolymers’’ we refer to phenomena at the molecular level, such as dimensions,configuration, and local environment of the immobilized molecules. These twoapproaches should complement each other in the interpretation of chromato-graphic results.
While extensive chromatography studies have been carried out on polymer-modified HPLC columns, few have focused on the effect of the structure of ad-sorbed polymers on chromatographic separations. A similar problem is evidentin the field of CE. The absence of such studies may point to a need for a morecomplete understanding of how polymers, especially polyelectrolytes, adsorb onHPLC substrates and the concomitant relationship between the configuration ofthe adsorbed polymers and resultant chromatographic properties.
The configuration of adsorbed polyelectrolyes has been described in terms oftrains, loops, and tails. Fleer et al. [11] provide a detailed review on polymeradsorption at interfaces. They pointed out that the configurations of adsorbedpolymers are determined by polymer adsorption conditions, such as solvent prop-erties, polymer molecular weight, polymer concentration, polydispersity, adsorp-tion time, surface geometry, surface chemical properties, and substrate chemicalheterogeneity. Because chromatographic properties of proteins are determined
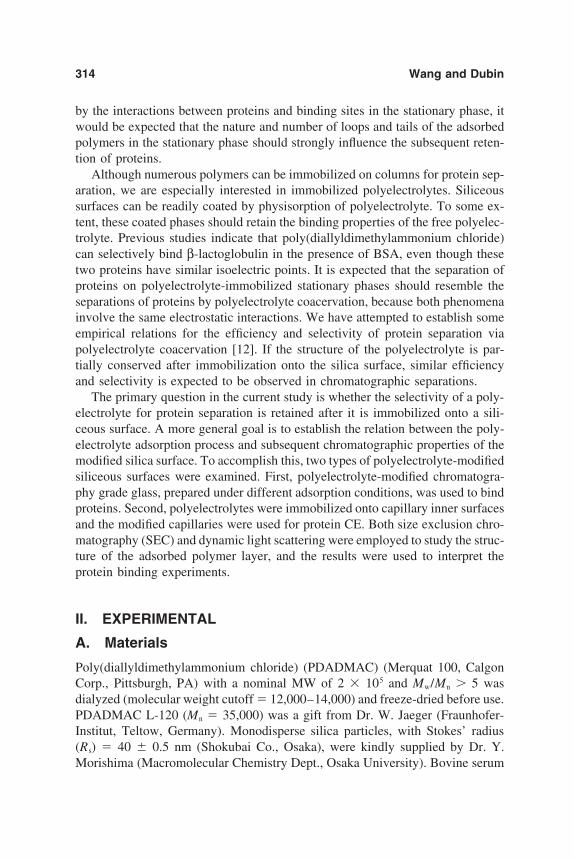
314 Wang and Dubin
by the interactions between proteins and binding sites in the stationary phase, itwould be expected that the nature and number of loops and tails of the adsorbedpolymers in the stationary phase should strongly influence the subsequent reten-tion of proteins.
Although numerous polymers can be immobilized on columns for protein sep-aration, we are especially interested in immobilized polyelectrolytes. Siliceoussurfaces can be readily coated by physisorption of polyelectrolyte. To some ex-tent, these coated phases should retain the binding properties of the free polyelec-trolyte. Previous studies indicate that poly(diallyldimethylammonium chloride)can selectively bind β-lactoglobulin in the presence of BSA, even though thesetwo proteins have similar isoelectric points. It is expected that the separation ofproteins on polyelectrolyte-immobilized stationary phases should resemble theseparations of proteins by polyelectrolyte coacervation, because both phenomenainvolve the same electrostatic interactions. We have attempted to establish someempirical relations for the efficiency and selectivity of protein separation viapolyelectrolyte coacervation [12]. If the structure of the polyelectrolyte is par-tially conserved after immobilization onto the silica surface, similar efficiencyand selectivity is expected to be observed in chromatographic separations.
The primary question in the current study is whether the selectivity of a poly-electrolyte for protein separation is retained after it is immobilized onto a sili-ceous surface. A more general goal is to establish the relation between the poly-electrolyte adsorption process and subsequent chromatographic properties of themodified silica surface. To accomplish this, two types of polyelectrolyte-modifiedsiliceous surfaces were examined. First, polyelectrolyte-modified chromatogra-phy grade glass, prepared under different adsorption conditions, was used to bindproteins. Second, polyelectrolytes were immobilized onto capillary inner surfacesand the modified capillaries were used for protein CE. Both size exclusion chro-matography (SEC) and dynamic light scattering were employed to study the struc-ture of the adsorbed polymer layer, and the results were used to interpret theprotein binding experiments.
II. EXPERIMENTAL
A. Materials
Poly(diallyldimethylammonium chloride) (PDADMAC) (Merquat 100, CalgonCorp., Pittsburgh, PA) with a nominal MW of 2 105 and Mw/Mn 5 wasdialyzed (molecular weight cutoff 12,000–14,000) and freeze-dried before use.PDADMAC L-120 (Mn 35,000) was a gift from Dr. W. Jaeger (Fraunhofer-Institut, Teltow, Germany). Monodisperse silica particles, with Stokes’ radius(Rs) 40 0.5 nm (Shokubai Co., Osaka), were kindly supplied by Dr. Y.Morishima (Macromolecular Chemistry Dept., Osaka University). Bovine serum

Polycation-Modified Siliceous Surfaces 315
albumin was purchased from Boehringer Mannheim (Indianapolis, IN) (Lot100062), and β-lactoglobulin was obtained from Sigma (Lot L2506). Proteins wereused without further purification. Controlled pore glass (BioRan-CPG) (30–60 µmgrain size, pore diameter 29.4 nm, and 136 m2/g specific surface area) was obtainedfrom Schott Gerate (Mainz, Germany). Pullulan standards (Shodex standard, P-82,Lot 50501) were obtained from Showa Denko K.K. (Tokyo, Japan).
B. Methods
1. Preparation of PDADMAC-CPGPrior to polyelectrolyte adsorption, CPG was first cleaned using the procedurerecommended by the manufacturer, namely, washing with pH 9.0, 1% sodiumdodecyl sulfate (SDS) at room temperature for 2 h, then with deionized (DI)water until no foaming was observed, and drying at 89°C for more than 12 h.
PDADMAC was adsorbed onto cleaned CPG at different pH, ionic strength,and adsorption times. CPG was added slowly into the PDADMAC solution withstirring for 24 h to reach equilibrium. The solution was centrifuged and the solidwas washed 5 times with DI water before drying at 89°C for more than 24 h.The pH, ionic strength, and adsorption time for polyelectrolyte adsorption aredesignated as pH0, I0, and t0.
2. Protein BindingAll protein binding experiments were performed at pH1 9 and I1 0.1. About100 mg of PDADMAC-CPG was added into 0.1 g/L protein solution with stirringfor 1 h. The solution was centrifuged and the protein concentration in the superna-tant was measured by UV at 278 nm. Figure 1 schematically illustrates the proce-dure for polyelectrolyte adsorption and subsequent protein binding.
Polyelectrolyte desorption was not monitored during protein binding experi-ments due to lack of applicable detection methods. However, we found that pullu-lan elution volumes from PDADMAC-CPG packed columns, measured with thechromatographic procedures described in the next section, did not change during48 h of chromatographic elution. Since pullulan elution volumes were signifi-cantly different for PDADMAC-treated versus nontreated columns, this resultstrongly suggests the absence of polyelectrolyte leaching for PDADMAC-CPG.Similar results were also found in capillary electrophoresis experiments wherethe electrophoretic mobility of protein on a polyelectrolyte-coated capillary wasstable during multiple runs [8,9].
3. ChromatographyThe chromatographic system included a Minipump (Milton Roy, St. Petersburg,FL), a 100 µL sample loop, an R401 differential refractometer (Waters, Milford,MA), and a Kipp and Zonen recorder (Model BD 112, Delft, Holland). A stainlesssteel column (25 cm 0.5 cm ID) was dry-packed with PDADMAC-CPG (pH0

316 Wang and Dubin
FIG. 1 Schematic process of batch adsorption experiment.
9, t0 12 h, Cp 20 g/L, and I0 0, 0.10, 0.50, and 1.00, respectively).The column efficiency measured with D2O was 2.4 103 plates/m. Boric acid–NaOH buffer at selected pH and ionic strength was used as the mobile phase.The flow rate was maintained between 0.5 and 0.6 mL/min.
4. Quasi-Elastic Light ScatteringPDADMAC was adsorbed on silica particles by slowly adding 0.002 wt% silicainto a solution of 0.2 wt% PDADMAC at preadjusted pH and ionic strength. Thesolution was filtered through 0.45-µm Whatman filters before light scatteringmeasurement. The apparent stokes radius Rapp
s of PDADMAC-silica was deter-mined by quasi-elastic light scattering with a Brookhaven (Holtsville, NY) 72-channel BI-2030 AT digital correlator, using a 100-mW argon ion laser.
5. Capillary ElectrophoresisPDADMAC adsorption was conducted at pH 8, ionic strength 0.5 by washingpolymer solution through preconditioned fused silica capillary (Restek,Bellefonte, PA) under alternating high (5–10 min) and low (200–540 min) pres-sure for 16 h. After adsorption, the column was washed with pH 8, I 0.05 Trisbuffer for 30 min before mobility measurement. The electroosmotic flow (EOF)was measured with mesityl oxide (Aldrich Chemical Company, Inc.). The valueof electroosmotic mobility (µEOF) was determined experimentally using Eq. (1):

Polycation-Modified Siliceous Surfaces 317
µ Ld L t
VtMO
(1)
where Ld (cm) is the length of the capillary length from the inlet to the detector,tMO (s) is the migration time of electrically neutral marker (mesityl oxide), V isthe voltage applied across the capillary, and L t is the total capillary length. AfterPDADMAC coating, EOF was reversed (in the opposite direction of uncoatedcapillary) and the polarity of electrodes was switched for detection.
III. RESULTS AND DISCUSSION
A. Selectivity
Figure 2 shows selective protein binding by PDADMAC-CPG. β-lactoglobulinis more favorably bound to PDADMAC-CPG than BSA, which is consistentwith the coacervation selectivity of PDADMAC for these proteins [12]. Thus,the selective protein binding properties of PDADMAC in solution are retainedafter it is immobilized on the CPG surface.
B. Protein Binding
The degree of protein binding (yield) on polyelectrolyte-treated glass was studiedas a function of pH0. Figure 3 shows the yield upon batch mixing of BSA withpolyelectrolyte-treated glass at pH1 9.0 (pH0 0.9 and 10.0) and I 0.1. Itis clear that protein binding on polyelectrolyte-treated glass is affected by the
FIG. 2 % BSA and β-lactoglobulin bound on PDADMAC-CPG. PDADMAC adsorptionconditions: pH0 9.0, no added salt; Cp 1.0 g/L. Protein binding conditions: pH1 9.0, I1 0.10, Cpr 0.10 g/L.

318 Wang and Dubin
FIG. 3 Effect of preparation pH (pH0) and ionic strength (I0) on subsequent BSA bind-ing. PDADMAC adsorption conditions: pH0 9.0; Cp 0.10 g/L. BSA binding condi-tions: pH1 9.0, I1 0.10, Cpr 0.10 g/L, 10 g/L PDADMAC-CPG.
initial conditions of polyelectrolyte adsorption. According to Fleer [13], theamount of adsorbed polyelectrolyte increases with the substrate surface chargedensity. The pH titration of CPG [14], shows that its charge density is doubledfrom pH 9.0 to pH 10.0. Consequently, more polyelectrolyte is adsorbed at pH10, and the resultant PDADMAC-CPG binds more protein.
Our preliminary results also show that polyelectrolyte adsorption conditions(I0, t0) also affected subsequent protein binding. The effect of I0 and t0 on proteinbinding has been explained by Wang and Dubin [15].
C. Polyelectrolyte Adsorption Layer
The amount of adsorbed polyelectrolyte is a key parameter in the interpretationof protein binding results. Commonly used techniques for the quantitation ofadsorbed polymer include adsorption isotherms, ellipsometry, and reflectometry[16]. However, these techniques are not applicable to the PDADMAC-CPG sys-tem for several reasons. First, a relatively concentrated polymer solution wasused in the current experiments to ensure adsorption leading to a loop-and-tailtype of configuration. The amount of polymer adsorbed was therefore insignifi-cant compared to the bulk polymer concentration. Attempts to generate adsorp-tion isotherms through elemental analysis failed. Other techniques, such as ellip-sometry and reflectometry, are normally applied only to planar surfaces.Recently, the absorption of polymers tagged via fluorescence [17] or radio activelabels [18] has been effectively used to monitor polymer adsorption. However,

Polycation-Modified Siliceous Surfaces 319
the lack of such labeled polymers impeded the use of these two powerful tech-niques. Therefore, we employed two semiquantitative methods to determine poly-mer adsorption layer thickness on PDADMAC-CPG and the results were usedto interpret protein binding experiments.
D. Chromatography
SEC was employed to measure the pore radius of polyelectrolyte-treated andnative CPG using the cylindrical pore model [19]. According to this model,
KSEC 1 Rrp
2
(2)
where KSEC is the measured partition coefficient, R is the solute radius, and rp isthe pore radius. Although Eq. (2) rests on an unrealistically well-defined poregeometry, it has been empirically verified by several groups [20,21], who haveobserved that plots of K1/2
SEC versus R yield straight lines with slopes of 1/rp. Withthis method, the pore radius of CPG was obtained both before and after polyelec-trolyte adsorption, and the difference between these two values (∆rp) was usedto estimate polyelectrolyte adsorption layer thickness (δH).
Figure 4 shows a plot of K1/2SEC versus R for pullulan standards eluted at I1
0.001 on both native and polyelectrolyte-treated CPG (pH0 9.0, Cp 20 g/L,no salt added), giving rp 11.4 0.4 and 8.9 0.3 nm, for native and
FIG. 4 Dependence of SEC chromatographic partition coefficient on pullulan Stokesradius, used to determine CPG effective pore size. SEC mobile phase: pH 9.0, 0.001 MTris buffer. PDADMAC-CPG prepared at pH 9.0, I 0, Cp 20 g/L.

320 Wang and Dubin
polyelectrolyte-treated CPG, respectively. Therefore, δH ∆rp (11.4 0.4) (8.9 0.3) 2.5 0.5 nm. The error limits shown here are obtained fromthe standard deviation of the slope. Additional measurements at I1 0.01 and0.10 both gave δH 1.7 1.5 nm. The relatively large error in δH led us toseek other methods to quantitate δH.
E. Quasi-Elastic Light Scattering
Quasi-elastic light scattering (QELS) was chosen as an alternative method toexamine the structure of the adsorbed polyelectrolyte. Since CPG particles weretoo large to be characterized by QELS, we used small silica particles (KE-E10)and low molecular weight polyelectrolyte (L-120) to model PDADMAC adsorp-tion on CPG. The system was chosen to minimize sedimentation and bridgingflocculation. It is expected that the influence of pH0, I0, and t0 on polyelectrolyteadsorption thickness should be similar to that of CPG/PDADMAC.
The hydrodynamic radius of silica was measured both before and after poly-electrolyte adsorption, and the difference between the two ∆Rapp
s was taken as thehydrodynamic polyelectrolyte adsorption layer thickness (HLT), with the resultsshown in Fig. 5. Numbers in parentheses are the conditions used for the QELSmeasurement, and the filled circles represent results obtained at pH values otherthan adsorption conditions (pH ≠ pH0). HLT is seen to increase with pH0 and tobe virtually independent of the measurement pH. HLT for weakly adsorbedchains would be expected to change with measurement pH. Therefore, this initial
FIG. 5 Effect of adsorption pH on hydrodynamic layer thickness (HLT) on silica (byQELS). Silica concentration 0.02 g/L, Cp 2 g/L, I 0.01 Numbers in parenthesesindicate the measurement pH.

Polycation-Modified Siliceous Surfaces 321
pH dependence suggests a relatively strong adsorption of PDADMAC on thesilica surface.
The dependence of protein binding to polyelectrolyte-treated CPG on pH0, I0
and t0 suggests that the structure of the adsorbed polyelectrolyte, namely, thearrangement of loops and tails, affects subsequent protein binding. Therefore, itshould be possible to relate protein binding to PDADMAC-CPG to δH and HLTobtained from SEC and QELS, respectively.
An explanation for the effect of pH on polyelectrolyte adsorption layer thick-ness and subsequent protein binding is illustrated schematically in Fig. 6. Let usassume that n binding sites per polymer chain are required for polyelectrolyteretention on the CPG surface. At low pH, where the surface charge density of
FIG. 6 Schematic depiction of effect of polyelectrolyte adsorption pH on subsequentBSA binding.

322 Wang and Dubin
CPG is low, a relatively flat configuration is needed to produce the requisitenumber of ionic contacts, and fewer polyelectrolyte molecules are adsorbed. Onthe other hand, an increase in surface charge density at high pH means that ashorter length of adsorbed chain can provide energetic stabilization of the boundstate, resulting in a subsequent increase in the adsorption amount. Furthermore,repulsion between adsorbed chains yields a thicker δH. QELS results show thatHLT increases with pH0 (Fig. 5); therefore, more sites are available for subse-quent protein binding, as verified by the protein binding results in Fig. 3.
Although Fig. 6 rationalizes the effect of pH0 on protein binding with QELSresults, it should be noted that a significant discrepancy exists between the silicamodel system and polyelectrolyte-treated CPG. First, the discrepancy betweenδH (2.5 nm) and HLT (12 nm) suggests that the model system does not representthe true polyelectrolyte adsorption process on CPG. Silica is more highly curvedthan CPG, so that the configurational entropy of train-adsorbed polyelectrolyteon silica is more unfavorable than on CPG. If loops and especially tails are morepredominant for PDADMAC on silica, HLT could be much higher than δH. Sec-ond, the surface charge density of silica is expected to be higher than that ofCPG, which is likely to affect the polyelectrolyte adsorption layer thickness.Third, CPG has a porous surface whereas silica is relatively smooth. An oversim-plified picture of polyelectrolyte adsorption within the pore used to obtain δH
from SEC might contribute to the discrepancy as well. Finally, QELS is primarilysensitive to the tails of adsorbed polyelectrolytes, whereas both loops and tailscontribute to the protein binding. All of these problems remain as challenges forfuture research.
F. Capillary Electrophoresis
Mixtures of BSA and β-lactoglobulin were separated on both coated and uncoatedcapillaries. As shown in Fig. 7, the PDADMAC-coated capillary better resolvesthe two proteins. Table 1 summarizes the data of protein titration charge (Z ) andapparent protein mobility (µ). The calculated |µ|/|Z| are all close to 0.06 exceptthe one for BSA on coated capillary (0.024). The comparable µEOF at two pHssuggests a similar surface charge density for both coated and uncoated capillaries.Therefore, the relatively low |µ|/|Z| for BSA on a coated capillary is more likelydue to the interactions between BSA and the loops and tails of adsorbed polyelec-trolytes, as suggested in the protein binding experiment with PDADMAC-coatedCPG.
The interactions between proteins and polyelectrolyte-coated capillaries werestudied by comparing apparent protein mobility (µapp) with true mobility (µ). Ifµapp/µ 1, there is no protein–polyelectrolyte interaction. The smaller the mobil-ity ratio µapp/µ, the more strongly the proteins interact with the polyelectrolyte-modified surface. Electrophoretic mobility values for BSA are available in the
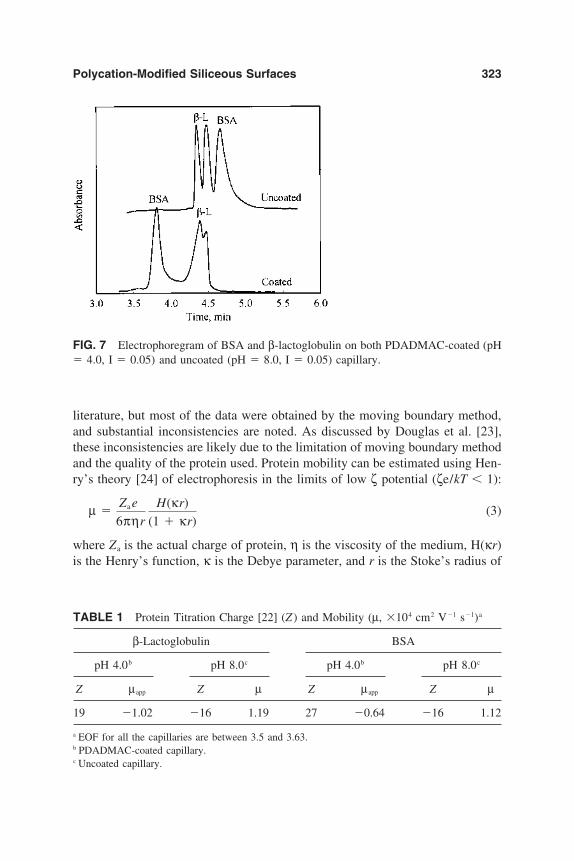
Polycation-Modified Siliceous Surfaces 323
FIG. 7 Electrophoregram of BSA and β-lactoglobulin on both PDADMAC-coated (pH 4.0, I 0.05) and uncoated (pH 8.0, I 0.05) capillary.
literature, but most of the data were obtained by the moving boundary method,and substantial inconsistencies are noted. As discussed by Douglas et al. [23],these inconsistencies are likely due to the limitation of moving boundary methodand the quality of the protein used. Protein mobility can be estimated using Hen-ry’s theory [24] of electrophoresis in the limits of low ζ potential (ζe/kT 1):
µ Za e
6πηr
H(κr)(1 κr)
(3)
where Za is the actual charge of protein, η is the viscosity of the medium, H(κr)is the Henry’s function, κ is the Debye parameter, and r is the Stoke’s radius of
TABLE 1 Protein Titration Charge [22] (Z ) and Mobility (µ, 104 cm2 V1 s1)a
β-Lactoglobulin BSA
pH 4.0b pH 8.0c pH 4.0b pH 8.0c
Z µapp Z µ Z µapp Z µ
19 1.02 16 1.19 27 0.64 16 1.12
a EOF for all the capillaries are between 3.5 and 3.63.b PDADMAC-coated capillary.c Uncoated capillary.

324 Wang and Dubin
the protein. Xia et al. [25] demonstrated as expected a low ζ of BSA at pH nearPI. Therefore, we attempted to calculate the true mobility of BSA from reportedliterature values, with the ionic strength effect corrected using Eq. (3). Douglasand others [23] measured the electrophoretic mobility of BSA as a function ofpH. Using their data and Eq. (3), the electrophoretic mobility of BSA at pH 4and ionic strength 0.05 was calculated as 1.3 104 cm2 V1 s1. Hence, µapp/µ of BSA was estimated as 0.49, which indicates an interaction between BSAand coated PDADMAC. However, we were unable to evaluate µapp/µ for β-lacto-globulin due to insufficient literature data at pH 4.
An alternate method to estimate the electrophoretic mobility of protein fromEq. (3) has been proposed by Compton et al. and others [26,27]. First, they calcu-lated the structural net protein charge, Zc, via the Henderson-Hasselbalch equa-tion:
Zc n 1,4
Pn
1 10pHpK(Pn)
n 1,5
Nn
1 10pK(Nn)pH(4)
where Pn and Nn refer to the respective positively and negatively charged aminoacids. Then, they used a semiempirical expression for protein mobility:
µ C1Za
C2M1/3 C3M2/3I1/2(5)
where C1, C2, C3 are constants, Za is the electrophoretic protein charge, and Mis the protein molecular weight. Compton et al. assumed that Za/Zc is independentof pH at any given ionic strength. Therefore, Eq. (5) suggests that
µ1
µ2
ZC1
ZC2
(6)
Consequently, the electrophoretic mobility at one pH can be calculated from themobility measured at another pH. As Compton et al. pointed out, there are manyfactors influencing the theoretical charge of proteins, such as specific ion adsorp-tion, as well as structural and environmental influences on the pKa of individualamino acids. Therefore, the above equations can only be used for a first approxi-mation of protein mobility. Douglas et al. [23] suggested that protein chargetitration data, if available, should be used in Eq. 6 to calculate protein mobilities.In this study, electrophoretic mobilities of protein were measured on a coatedcolumn at low pH where no protein–polyelectrolyte interaction existed. The ex-trapolation of these measured mobilities as a function of protein titration chargegave µ at the desired conditions.
Electrophoretic mobilities of BSA at pH 3.2, 3.4, 3.6, 3.8, 4.0, and 4.2 areshown in Fig. 8 as a function of protein charge [22]. The extrapolated µBSA atpH 4 (Z 27) is 1.35 104 cm2 V1 s1. Therefore, µapp/µBSA at this pH andionic strength is estimated as 0.47, which is consistent with the value of 0.49

Polycation-Modified Siliceous Surfaces 325
FIG. 8 Electrophoretic mobility of BSA () as a function of protein charge onPDADMAC-coated capillary. Line shows extrapolation from low pH to pH 4.0 ().
calculated from Eq. (3). Similar experiments were also carried out to obtain µβ
as 1.20 104 cm2 V1 s1 at pH 4.0, as shown in Fig. 9, leading to an estimatefor µapp/µβ as 0.85. The smaller value µapp/µ for BSA suggests a stronger interac-tion between BSA and the PDADMAC surface, accounting for the better separa-tion achieved using coated capillaries.
FIG. 9 Electrophoretic mobility of β-lactoglobulin () as a function of protein chargeon PDADMAC-coated capillary. Line shows extrapolation from low pH to pH 4.0 ().
326 Wang and Dubin
Li et al. [28] measured the electrophoretic mobility of β-lactoglobulin as afunction of pH on a Polybrene-coated capillary. They found that µβ was a linearfunction of pH between pH 3.3 and 4.3 (note that the protein titration charge isa linear function of pH in this pH range [29], and the extrapolation of µβ againstpH yielded a correct isoelectric point. Contrary to our results, Li’s data suggestthat no protein–polyelectrolyte interactions exist on a Polybrene-coated capillary.This discrepancy may be attributed to the different polyelectrolyte adsorptionconditions. In Li’s method, the low polyelectrolyte concentration and low ionicstrength of coating solution, approximately Cp 0.05% and I 0.02, wouldresult in relatively flat polyelectrolyte adsorption. On the other hand, our highCp and high ionic strength coating solution resulted in more loops and tails ofpolyelectrolyte in the adsorption layer, leading to better resolution in the coatedcapillary.
IV. CONCLUSIONS
We have demonstrated that PDADMAC can be immobilized on silica surfacesthrough physisorption. By properly controlling polyelectrolyte adsorption condi-tions it is possible to change the structure of immobilized polyelectrolyte andthus change the subsequent amount of protein binding. Most notably, the proteinbinding selectivity of PDADMAC is maintained after immobilization. This canbe attributed to the interaction between proteins and the loops and tails of theimmobilized polyelectrolytes. We have used modified silica surfaces to enhanceprotein separation in both chromatography and capillary electrophoresis. Thisstudy opens up the possibility for the design of novel stationary phases in bothchromatography and capillary electrophoresis.
ACKNOWLEDGMENTS
The authors thank Dr. Y. Morishima for the silica samples, Dr. W. Jaeger forthe PDADMAC samples, and the National Science Foundation for support viaCHE 9505953.
REFERENCES
1. P. D. G. Dean, W. S. Johnson, and F. A. Middle, Affinity Chromatography: A practi-cal Approach, IRL Press, Washington, D.C., 1985.
2. C. F. Poole, and S. K. Poole, Chromatography Today, Elsevier, New York, 1991.3. P. L. Dubin, (ed.), Aqueous Size-Exclusion Chromatography, Elsevier, Amsterdam,
1988.4. M. Petro, and D. Berek, Chromatographia 37(9/10):549 (1993).5. J. K. Towns, and F. E. Regnier, J. Chromatography 516:69 (1990).

Polycation-Modified Siliceous Surfaces 327
6. K. Kubo, Anal. Biochem. 241:42 (1996).7. A. M. Dougherty, N. Cooke, and P. Shieh, Handbook of Capillary Electrophoresis
(J. P. Landers ed.), CRC Press Boca Raton, 1997, Chap. 24.8. Q. Liu, F. Lin, and R. A. Hartwick, J. Chromatogr. Sci. 36:126 (1997).9. E. Cordova, J. Gao, and G. M. Whitesides, Anal. Chem. 69:1370 (1997).
10. R. K. Iller, The Chemistry of Silica, John Wiley and Sons, New York, 1979, Chap. 5.11. G. J. Fleer, M. A. Cohen Stuart, J. M. H. M. Scheutjens, T. Cosgrove, and B. Vincent,
Polymers at Interfaces, Chapman and Hall, London, 1993, Chap. 7.12. Y. Wang, J. Y. Gao, and P. L. Dubin, Biotechnol. Prog., 12:356 (1996).13. G. J. Fleer, Spec. Publ. Roy. Soc. Chem. 82:34 (1991).14. G. Shah, P. L. Dubin, J. I. Kaplan, G. R. Newkome, C. N. Moorefield, and G. R.
Baker, J. Colloid Interface Sci. 183:397 (1996).15. Y. Wang and P. L. Dubin, J. Chromatogr. A, in press.16. M. A. Cohen Stuart and G. J. Fleer, Annu. Rev. Mat. Sci. 26:463 (1996).17. M. A. Bos, and J. M. Kleijn, Biophys J. 68:2566 (1995).18. C. Huguenard, J. Widmaier, A. Elaissari, and E. Pefferkorn, Macromolecules 30:
1434 (1997).19. E. F. Casassa, and Y. Tagami, Macromolecule, 2:14 (1969).20. H. Waldmann-Meyer, J. Chromatography. 350:1 (1985).21. S. L. Edwards, and P. L. Dubin, J. Chromatography, 648:3 (1993).22. C. Tanford, S. A. Swanson, and W. S. Shore, J. Am. Chem. Soc. 77:6414 (1955).23. N. G. Douglas, A. A. Humffray, H. R. C. Pratt, and G. W. Stevens, Chem. Eng.
Sci. 50:743 (1995).24. D. C. Henry, Proc. Roy. Soc. London A, 133:106 (1931).25. J. Xia, P. L. Dubin, Y. Kim, B. B. Muhoberac, and V. J. Klimkowski, J. Phys.
Chem., 97:4528 (1993).26. S. Micinski, M. Gronvald, and B. J. Compton, Meth. Enzymol. 270:342 (1996).27. R. A. Mosher, P. Gebauer, and W. Thormann, J. Chromatography. A, 638:155
(1993).28. Y. J. Yao, K. S. Khoo, M. C. M. Chung, and S. F. Y. Li, J. Chromatography. A,
680:431 (1994).29. Y. Nozaki, L. G. Bunville, and C. Tanford, J. Am. Chem. Soc. 81:5523 (1959).

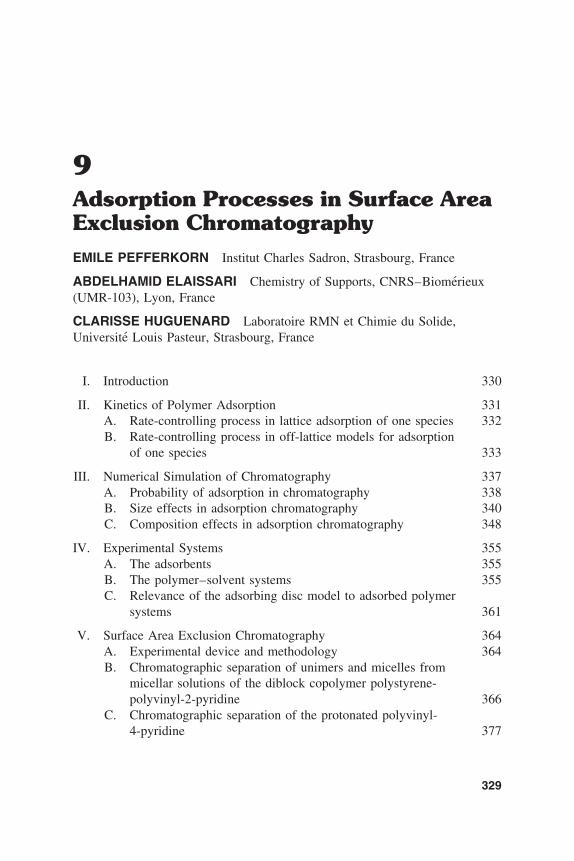
9Adsorption Processes in Surface AreaExclusion ChromatographyEMILE PEFFERKORN Institut Charles Sadron, Strasbourg, France
ABDELHAMID ELAISSARI Chemistry of Supports, CNRS–Biomerieux(UMR-103), Lyon, France
CLARISSE HUGUENARD Laboratoire RMN et Chimie du Solide,Universite Louis Pasteur, Strasbourg, France
I. Introduction 330
II. Kinetics of Polymer Adsorption 331A. Rate-controlling process in lattice adsorption of one species 332B. Rate-controlling process in off-lattice models for adsorption
of one species 333
III. Numerical Simulation of Chromatography 337A. Probability of adsorption in chromatography 338B. Size effects in adsorption chromatography 340C. Composition effects in adsorption chromatography 348
IV. Experimental Systems 355A. The adsorbents 355B. The polymer–solvent systems 355C. Relevance of the adsorbing disc model to adsorbed polymer
systems 361
V. Surface Area Exclusion Chromatography 364A. Experimental device and methodology 364B. Chromatographic separation of unimers and micelles from
micellar solutions of the diblock copolymer polystyrene-polyvinyl-2-pyridine 366
C. Chromatographic separation of the protonated polyvinyl-4-pyridine 377
329

330 Pefferkorn et al.
VI. Conclusion 384
References 385
I. INTRODUCTION
Diffusion of polymer chains in random media controls a great number of phenom-ena such as exclusion chromatography, membrane separations, and ultrafiltration.The fundamental issue in these separation processes is the transport of a polymerchain from a region of larger volume to another region of smaller volume wherethe chain entropy is lower. The separation is thus induced by effects of entropicbarriers on chain dynamics [1]. Adsorption phenomena of polymer chains atsolid–liquid interfaces control the interfacial phenomena in this new approachof chromatographic separation mainly based on surface area availability effects.For one-component systems, different models have been developed to determinethe relationships between the rate of surface coverage and the decrease in surfacearea availability [2]. When the size of the adsorbent becomes comparable withthe remaining available surface areas, the effect of the excluded surface areashould be taken into account [3,4]. This first quasi-ballistic model has been modi-fied to take into account the random walk of the particle near the surface prioradsorption [5]. More recently, the initial random sequential adsorption (RSA)model has been modified to take into account the mobility of the adsorbent in theadsorbed state (in-plane mobility) [6]. Actually, this last feature has contributed inthe past to determine two main systems. Statistical thermodynamic treatments ofadsorption allow an exact calculation of the entropy of the sorbed phase to bemade, provided that the model (equation of state, adsorption isotherm) is defined.The localized model (lattice theory, no nearest neighbors) considers that thesorbed molecule encounters potential wells deeper than kT and so becomes caged[7]. The mobile model considers the two-dimensional mobility in the adsorptionplane to be governed by the mutual interactions existing between the adsorbentand the sorbed species. Obviously, the actual behavior of the adsorbent withregard to localized or mobile adsorption may depend on the correlation betweenadsorption energy and degree of surface coverage because in mobile systems alimited in-plane mobility may set in at high coverage. These different situationsof chain adsorption are first presented from the theoretical and numerical pointsof view.
The adsorption models should be combined with chromatographic separationmodels. The plate model used to describe the solute partition between solid andliquid phases during flow of the suspension or solution through the permeable

Adsorption Processes in Chromatography 331
medium was introduced by Mayer and Tompkins [8] and later modified byGlueckauf [9,10]. Since in chromatographic columns of stacked beads the adsor-bent is discontinuous whereas the solution flow is continuous, in the initial modelof Mayer and Tompkins thermodynamic equilibrium was assumed to be attainedat each plate between the solute and the sorbent phases. Glueckauf consideredthe lack of equilibrium arising from fast rates of mass transfer through the col-umn. On the basis of a Langmuir-type process in which both adsorption anddesorption contribute to establish thermodynamic equilibrium, the concentrationratio of the adsorbed Ns ,i, and solute species Ni is found to be related to theadsorption energy. In irreversible adsorption and in many reversible adsorptionprocesses, as the solute remains a long time in the adsorbed state, the progressof surface filling further modifies the thermodynamic partition. Numerical studiesrelative to these aspects are presented as a second part.
The results of numerical studies of polymer separation resulting from interfa-cial phenomena are confronted with experiments of polymer adsorption and chro-matographic separation of polymers. The aim of the work was to clearly establishthe correlation between some interfacial phenomena related to adsorption andthe quality of the resulting separation.
II. KINETICS OF POLYMER ADSORPTION
The rate of polymer adsorption has to be investigated under conditions wherethe solution to surface transport does not constitute the limiting factor. Actually,when the polymer is injected into the chromatographic column, it is expectedthat the molecule will immediately interact with the surface (the stationary phase)due to the very small average thickness of the elutant (the mobile phase). There-fore, the diffusional higher mobility of polymers of small molecular weight isnot expected to favor the faster adsorption of this class of polymer with respect tothat of polymer of higher molecular weight. Moreover, since the chromatographicseparation usually constitutes a fast process, it is important to only consider theinitial step of fast surface filling and not the supplementary period of establish-ment of the adsorption equilibrium. With these assumptions, the elementary equa-tion of the adsorption kinetics is expressed as follows:
dNs
dt N(t)K(Ns) (1)
where N(t) represents the average polymer concentration during the period dt, dNs
is the increase in surface coverage during dt, and K(Ns) is the kinetic coefficientof the adsorption. The validity of the kinetic model applied to chromatographicconditions requires K(Ns) to be a function of Ns and independent of N(t).

332 Pefferkorn et al.
A. Rate-Controlling Process in Lattice Adsorption ofOne Species
The expected decay of K(Ns) as a function of Ns results from the difficulty en-countered by the polymer (1) to systematically seek an unoccupied surface areaand (2) from the necessity to dispose of the expected number of sets of contiguoussites to bind the macromolecule to the surface.
Using the relation of Arrhenius to express the kinetic coefficient K(Ns) as afunction of the adsorption energy ∆µ(ads), one obtains the following equation:
K(Ns) K0 exp(∆µ(ads)/kT) (2)
with
∆µ(ads) µ(surf ) µ(sol) (3)
The adsorption enthalpy h(surf) h(sol) results from the exchange in theinterface of adsorbed molecules of solvent with polymer segments and from theexchange in the solution of polymer–solvent interactions for solvent–solvent in-teractions. Since the same scheme is encountered throughout the surface cov-ering, the enthalpic balance is assumed to be constant,
The entropy of the polymer in the solution s(sol) does not vary greatly in verydilute solution and may also be taken as being constant.
To a first approximation, the term ∆µ(ads) in Eq. (3) is determined by thevariation of Ts(surf), which is evaluated as follows. The entropy S of the poly-meric interface can be estimated from the usual law S k ln W, where W repre-sents the number of ways of putting the Ns polymer molecules at the N0 sites ofthe plane lattice [11,12]:
W N0!
(N0 xNs)!(Ns)! z 1N0
Ns(x 1)
(4)
where z is the lattice coordination number and x the mean degree of polymeriza-tion. The entropy s(surf) of the isolated macromolecule in the situation [N0, Ns]is given by Eq. (5):
s dS/dNs (5)
With the usual assumption of Flory, Eq. (5) is expressed as follows:
K(Ns) K0 z 1z 1
Ns
νNS1 (6)

Adsorption Processes in Chromatography 333
where νNS1 represents the expected number of sets of x contiguous sites avail-able to the (Ns 1)th molecule, if Ns molecules are previously adsorbed at ran-dom. Equation (6) can be developed into:
K(Ns) K0x(N0/x) Ns
Ns
(7)
In this situation, the adsorption mechanism can be easily described if the adsor-bent surface is assumed to contain N0/x fictive adsorption sites and if there is nosupplementary constraint to the planar distribution of the adsorbed segments. Toapproximate more exactly the term νNs1 in Eq. (6), Flory proposed a betterevaluation of the function determining the expectancy that a given cell adjacentto a previously vacant one is occupied:
νNs1 (N0 xNs)z(z 1)x2 (1 fi)x1 (8)
where
1 fi N0 xNs
N0 2(x 1)Ns/z)(9)
Thus, Eq. (7) is modified into:
K(Ns) K0 x(N0/x) Ns
Ns
N0 xNs
N0 2(x 1)Ns/zx1
(10)
Equation (10) indicates that K(Ns) strongly decreases with surface coverage whenall of the x contiguous sites should be available for adsorption [13]. This situationhas been revisited by Poland who takes into account the variety of polymer in-terfacial conformation [14]. Figure 1 shows the values of K(Ns) as a function of(xNs/N0) derived from Eqs. (7) and (10) for adsorption of 1175 chains of 10segments adsorbing on a square lattice of side equal to 114. Figure 2 shows thesituation for adsorption of 588 chains of 20 segments. It is shown that the kineticcoefficient K(Ns) strongly decreases with the lattice coordination number z andthe polymerization index x for a given surface coverage.
B. Rate-Controlling Process in Off-Lattice Models forAdsorption of One Species
1. Random Sequential Adsorption Model (LocalizedAdsorption)
The random sequential adsorption (RSA) model without interaction is expectedto generate a kinetic behavior for adsorption that is similar to that resulting fromthe lattice model. Actually, Eq. (4) assumes random distribution of the adsorbedspecies on targets, whereas in RSA the adsorption sites are not determined. The

334 Pefferkorn et al.
FIG. 1 Representation of the kinetic coefficient K(Ns) as a function of the relative cover-age xNs/N0 calculated using the model of Flory for 1176 (Ns) polymer chains of polymer-ization index x equal to 10, adsorbing onto a lattice of 13,100 adsorbing sites (N0). (a) isobtained using Eq. (7); (b), (c), and (d) are obtained using Eq. (10) and the followingvalues of the lattice coordination number 2, 3, and 4, respectively.
RSA model is usually employed to determine the deposition rate and positioncorrelation of spheres or discs onto a plane surface and the main information isrelative to the surface blocking effects of previously adsorbed species [15]. Themodel has been applied to colloidal particles [16] and was found to be valid forproteins [17]. This simple model may be applied to diluted systems of macromol-ecules strongly interacting with the adsorbent, so that irreversible localized ad-sorption is established after deposition. In the present RSA process, hard discsare placed randomly and sequentially on a surface without overlap. When therandomly selected position is free the disc is deposited on that position and whenthe selected position is already occupied the attempt is abandoned.
2. Random Sequential Adsorption Plus Surface DiffusionModel (Mobile Adsorption)
The RSA algorithm is modified to take into account that the adsorbed disc iscontinuously moving in the adsorption plane. For adsorption of one species, the

Adsorption Processes in Chromatography 335
FIG. 2 Representation of the kinetic coefficient K(Ns) as a function of the relative cover-age xNs/N0 calculated using the model of Flory for 588 (Ns) polymer chains of polymeriza-tion index x equal to 20, adsorbing onto a lattice of 13,100 adsorbing sites (N0). (a) isobtained using Eq. (7); (b), (c), and (d) are obtained using Eq. (10) and the followingvalues of the lattice coordination number 2, 3, and 4, respectively.
model is similar to the model of random walk near the surface, for which interac-tions at large distances between a disc and the plane may modify the trajectoryof the adsorbing disc [5]. In this situation, when the position corresponding tothe randomly selected coordinates is already occupied, the adsorbing disc is ableto move near the interface to search for a free area in the immediate vicinity ofthe first selected position. It is further assumed that a disc wandering around aselected position operates over the time required in the pure RSA process inagreement with the fact that attractive or repulsive forces modify the trajectoryin the second situation. Obviously, this is equivalent to our major assumption thatan adsorbed disc continuously moves in the adsorption plane while the solution tosurface transfer is instantaneous.
The unidirectional diffusion path that allows a disc to escape from an alreadyoccupied area is given by:
(2r)2 2Dt 2(ν/6)L2 (11)

336 Pefferkorn et al.
where L expressed by r/λ is the length of the elementary jump. The probabilityfor a random walker in the plane, which encounters an occupied area to reach aclosely located and nonoccupied area, is expressed by Eq. (12) between the fre-quency and the length of the jumps:
96λ2 ν 24λ2 (12)
Clearly, the disc does not systematically explore the total allowed diffusion path,but the first free area will be occupied. Equation (12) implies that there is nopossibility for the disc to investigate at large distances from the first impact point,in order to preserve a total diffusion path of similar length. If no free area isavailable for adsorption at the end of the random walk, the adsorption attemptdoes not succeed definitely.
The influence of the jump length on the fate of the adsorbing disc during thiswalk around the coordinates of an already adsorbed disc has been investigatedby visual observation that indicated that the probability of finding a closely lo-cated free area increases when the jump length L decreases. This leads to thebest positioning when the still-free area located between a set of adsorbed discsis close or equal to the disc area. Nevertheless, the running of this subroutine israpidly time consuming, so that a value of λ equal to 10 was found to be a goodcompromise.
3. Kinetics of the Adsorption ProcessThe numerical simulation is employed to determine the validity of Eq. (1), whichimplies that K(Ns) is independent of N(t). Equation (1) may be modified in Eq.(13) to hold for simulation:
∆Ncs
∆tc
K(Ncs) Nc (13)
where ∆Ncs represents the number of discs adsorbed during the time ∆tc, whenNc discs are in front of the adsorbing plane.
The number of discs that are transferred from the solution to the adsorbent,that of discs that are in front of the plane and that being adsorbed per time unit,permit determination of the computer time and adsorption rate, both being scalingparameters. The simulation is carried out as follows.
At time t 0, ∆Nc discs are placed in front of the plane. Each disc carriedout one attempt to adsorb before the time is incremented by ∆tc. Simulationindicates that after the first period ∆tc, ∆Ncs discs succeed in adsorption whereasNc discs fail. During a second period ∆tc, the constant number of attempts ∆Nc
is increased by the number Nc, which failed in the first period. Successively, thenonadsorbed discs and the discs that are regularly supplied again attempt to ad-sorb during each period ∆tc. The resulting adsorption is calculated by summing

Adsorption Processes in Chromatography 337
the successive values of ∆Ncs. This procedure is implemented up to full-surfacecoverage of the plane with discs.
Three situations are considered:
1. ∆Nc Nc. During each period ∆tc, ∆Nc tentatives are made to place a discand generally succeed. This corresponds to the early stage of the adsorption.Taking ∆tc 1 implies that the time is increased by one unit when all ofthe discs tried to adsorb on the plane once every period.
2. ∆Nc Nc. Each period ∆tc allows Nc tentatives and adsorption almost neverhappens. This corresponds to the final stage of adsorption, where the rate ofsupplying the discs does not play a role. The time is increased by one unitwhen, as previously, all the discs have tried once to adsorb.
3. ∆Nc ≅ Nc. The same definition is adopted.
As one may expect, different values of ∆Nc lead to different patterns whenthe surface coverage is represented as a function of time. The variation with thesurface coverage is detailed below for the following simulation. A very largenumber of discs of radius 1 are sequentially supplied to a plane of surface 60 120 until 1230 discs are deposited using the localized and mobile adsorptionalgorithm. This number corresponds to the maximal coverage of 0.537, close tothe jamming limit of 0.547 [4]. Different rates of disc supplies were implemented.It is important to note that the kinetic coefficient could only be determined forcoverage of about 800–900 discs. This upper limit resulted from the fact that aone-unit time increment corresponds to 100,000 attempts at the end of the simula-tion.
Figures 3 and 4 portray the kinetic coefficient K(Ncs) of localized and mobileadsorption processes, respectively, as a function of the fractional surface coverageθcs for values of ∆Ncs equal to 5, 20, 50, and 100. The unique curve obtainedover a large range of surface coverage displays the characteristic variation of thekinetic coefficient in the two processes. In the mobile adsorption simulation, thefirst 500 discs are immediately adsorbed. Therefore, infinite values of the kineticcoefficient are calculated using Eq. (13) [18].
III. NUMERICAL SIMULATION OFCHROMATOGRAPHY
A simple model is used to derive the solute partition between solid and liquidphases during flow of the polymer solution through the permeable medium. Con-trarily to the assumption of the Langmuir-type process, the polymer partition isassumed to be only determined by the success or failure of adsorption attempts,taking into account that the interfacial adsorption energy is usually sufficientlyhigh to allow the solute macromolecules to be extracted from the bulk. Polymer

338 Pefferkorn et al.
FIG. 3 Representation of the kinetic coefficient K(Ncs) as a function of the fractionalsurface coverage θcs in adsorption processes developing with features of the localizedadsorption model for different rates of disc supply: () 5; () 20; () 50; and () 100.
adsorption may develop quite irreversibly so that desorption of adsorbed neutralmacromolecules is not expected to be rapidly induced even by dilution of thesystem [19]. Adsorbed macromolecules may slowly exchange with solute mole-cules of similar molecular weight (without changing the total amount of adsorp-tion), this interfacial exchange being however blocked when the pure solventfaces the adsorbed polymer layer [20,21]. As far as very dilute polymer solutionsare usually eluted in chromatography, interfacial exchange between adsorbed andsolute discs is not taken into account in this numerical solution. Thus, deviationfrom the theoretical chromatograms is attributed to rapid interfacial exchangeprocesses.
A. Probability of Adsorption in Chromatography
The following simulation is designed to determine the probability of adsorptionof discs on a unique plane. Contrary to the situation described in Sec. II.3, discsdo not attempt to adsorb twice on the same plane and discs failing to adsorbtherefore disappear from the system. Our model considers the iterative adsorption

Adsorption Processes in Chromatography 339
FIG. 4 Representation of the kinetic coefficient K(Ncs) as a function of the fractionalsurface coverage θcs in adsorption processes developing with features of the mobile adsorp-tion model for different rates of disc supply: () 5; () 20; () 50; and () 100.
from a mixture of 250 discs of radii r1 and 250 of radius r2 on a unique plane.The time is incremented by one unit when these 500 randomly selected discshave tried to adsorb on a plane of area 250 250, the adsorption probabilityP(θcs) being defined by:
P(θcs) ∆Ncs
250(14)
where θcs represents the portion of the covered surface area and ∆Ncs the numberof discs of given radius adsorbed per unit time.
Results are given in Fig. 5 for the iterative adsorption from three mixtures ofdiscs of radii 1 and 2, 1 and 3, and 1 and 7, in all three cases randomly selectedfrom 500 discs. The three upper curves correspond to adsorption of discs of radius1 and the common lower curves to adsorption of the larger discs, with the totaldegree of surface coverage θcs being represented on the abscissa.
Figures 1 to 4 clearly show that the progress of the surface coverage leads toa strong retardation of the random deposition of chains and discs on an adsorbingsurface. Figure 5 shows that the retardation effect is very selective and, therefore,

340 Pefferkorn et al.
FIG. 5 Adsorption probability P(θcs) as a function of the fractional surface coverage θcs
for disc adsorption from mixtures of discs of radii 1 and 2 (), 1 and 3 (), 1 and 7 ().Open symbols correspond to the large discs and filled symbols to the small disc of radius 1.
adsorption chromatography is expected to induce a good separation of constit-uents of different sizes.
B. Size Effects in Adsorption Chromatography
In the numerical simulation study, the chromatographic column was schematizedby 100 successive adsorbing square planes of individual area 62,500. At eachrun, small and large discs are randomly selected from a total number of 500. Sincethe discs attempt to adsorb only once on the same plate, the elutant composition isfixed only for adsorption on the first plate and the composition at the secondplate results from failures in adsorption on the first. This situation is reproducedat all successive plates. At each run, following injection of 500 discs into thecolumn, the model enabled determination for each plate of the total number Ncs(r1
r2) of adsorbed discs, the number Ncs(r1) of adsorbed discs of radius r1, thenumber Ncs(r2) of adsorbed discs of radius r2 and the relative area θcs occupiedby the adsorbed discs. The number of runs was selected to obtain a constantsurface coverage independent of the composition of the mixture and the disc

Adsorption Processes in Chromatography 341
radii. In all situations the radius r1 of the small disc was chosen equal to 1. Theradius r2 of the large disc was chosen to be 2, 3, or 7 to investigate the influenceof this parameter on the disc packing profile [6].
1. Localized AdsorptionAs previously indicated, localized adsorption is simulated using the RSA algo-rithm. Discs of different radii are randomly chosen and deposited onto the planeat randomly selected coordinates. Adsorption occurs at this position if the areaenclosing the coordinates is free of discs and if the surrounding free area is largeenough to allow the new disc to be adsorbed; in contrast, adsorption does notoccur if the selected position is already occupied.
Mixtures of 250 discs of radius 1 and 250 discs of radius 2 (500 injections),3 (250 injections), or 7 (50 injections) were introduced into the column. Figure6 represents the relative coverage as a function of plate number i. Figures 7 and8 present the adsorption of discs of small r1 and large r2 radii, respectively. Aspreviously noted, the disc supply is stopped when the same total covered surfacearea inside the column is obtained.
FIG. 6 Localized adsorption process. Relative covered area as a function of plate numberi for different values of the radius of the large disc: () 2; () 3; and 7 (). The relativeconcentration of the two discs being supplied at plate 1 is 0.5.

342 Pefferkorn et al.
FIG. 7 Localized adsorption process. Number of discs of radius 1 adsorbed as a functionof the plate number i for different values of the radius of the large discs: () 2; () 3;and 7 (). The relative concentration of the discs of radius 1 and the large discs beingsupplied at plate 1 is 0.5.
FIG. 8 Localized adsorption process. Number of large discs adsorbed as a function ofthe plate number i for different values of their radius: () 2; () 3; and 7 (). The relativeconcentration of the large discs and discs of radius 1 being supplied at plate 1 is 0.5.

Adsorption Processes in Chromatography 343
For the mixture of discs of radii 1 and 7, the relative coverage (Fig. 6) is similarto the situation where only one species of disc is injected and the distributionof small discs through the column (Fig. 7) indicates that the area covered bythe excess of small discs exactly compensates the lack of large discs on the10 initial plates (Fig. 8). Dispersion of the points representing the adsorptionper plate results from the low number of injections (50 injections). However,extrapolation to maximum coverage gives a value close to 0.49, lower thanthe jamming limit (0.547), which indicates that the surface area is far frombeing completely covered when the number of runs is limited.
For the mixture of discs of radii 1 and 3 the chromatogram presents an initial peakaround i 10 where the maximum area covered is close to 57%. Inspection ofFig. 7 leads to the conclusion that the peak is due to overadsorption of smalldiscs while the pseudoplateau between plates 35 and 45 (Fig. 6) is only dueto adsorption of large discs.
For the mixture of discs of radii 1 and 2, the chromatogram does not show awell-defined peak and the separation is of poor quality as can be concludedfrom the distribution of small and large discs, as reported in Figs. 7 and 8.
2. Mobile Adsorption
(a) Parameters of the In-Plane Diffusion. In mobile adsorption (MA) an ad-sorbing disc may be attracted by free portions of the surface area or repelled byalready covered areas. The RSA algorithm was therefore adapted to take intoaccount these interactions between the disc and the plane, which may modifythe trajectory of the disc prior to adsorption and thus increase the adsorptionprobability. When a randomly selected position is already occupied, the disc willsearch for a free area in the close vicinity. However, as the close vicinity indicatesthat these interactions cannot greatly modify the position of adsorption relativeto the initial randomly fixed coordinates, the maximum length of the walk is animportant parameter. Adsorption occurs if the disc finds a free area, but if nofree area is encountered during the random walk the adsorption attempt fails.
In order to determine the characteristics of the random walk, we consider thetwo following situations: a disc r1 encounters an area occupied by a disc r2, ora disc r2 encounters an area occupied by a disc r1. The unidirectional diffusionpath allowing both discs to escape from the occupied position is given by:
(r1 r2)2 2(ν/6)L2 (15)
where L is the length of an elementary jump and ν the number of jumps. For agiven value of ν the term L, which is expressed in Eq. (16) as a function onlyof the disc radius, expresses the probability of finding an unoccupied area. Noallowance is made for the fact that discs of small radius may explore a greaterarea than those of large radius due to their higher relative Brownian mobility insolution. We point out that only interfacial characteristics are taken into account.

344 Pefferkorn et al.
Therefore, an adsorbed disc of large radius r2 is considered to more effectivelyscreen the attractive interaction between an adsorbing disc r1 and the plane thanan adsorbed disc r1 for an adsorbing disc r2. This manner of defining the size-dependent probability of adsorption is introduced by correlating the jump lengthL with the radius ra of the disc attempting to adsorb:
L ra f
λ(16)
The relative ‘‘mobility’’ L of the species attempting to adsorb, which is scaledby the exponent f in Eq. (16), controls the in-plane mobility of the disc beingadsorbed. Positive values of f are essential in this model of in-plane diffusion. Thecorresponding physically unrealistic assumption of an increase of the diffusivemobility of the disc with larger radius ra is equivalent to the more realistic as-sumption of a decrease in the in-plane mobility of an adsorbed disc of increasingradius. This implies that a large adsorbed disc moves too slowly in the adsorptionplane to facilitate by its own displacement the adsorption of small discs. Simi-larly, an increased mobility of the large discs in solution implies an increasedmobility of the small discs in the adsorbed state. A small adsorbed disc is ableto move rapidly in the plane and hence more readily allows successful adsorptionof large discs. The exponent f in Eq. (16) thus scales the energy of the solute–adsorbent interactions: f 1 corresponds to an in-plane mobility of the adsorbeddiscs inversely proportional to the square root of their area and f 2 indicatesthat this characteristic is proportional to the area. From a physical point of view,f 1 may describe the interactions of loose solutes like synthetic macromole-cules, whereas f 2 may be applicable to denser species like proteins.
The third parameter is the number of jumps, ν. In order to set ν, we nowconsider in two-dimensional space the random walk enabling an adsorbing discto find a free area when initially it meets an already adsorbed disc. Three situa-tions may be envisaged:
1. When a disc r1 attempts to adsorb in an area r2, Eqs. (15) and (16) give thefollowing Eq. (17):
ν1 6λ2r1 r2
r1 f 2
(17)
2. When a disc r2 attempts to adsorb in an area r1, one obtains:
ν2 6λ2r1 r2
r2 f 2
(18)

Adsorption Processes in Chromatography 345
3. When the radii ra of the adsorbing and adsorbed discs are equal, the relationis:
νa 24λ2 [r2(1f )a ] (19)
If we consider the adsorption of two types of disc, one of radius r1 1 anda second of radius r2 2, 3, or 7 respectively, the calculated values of ν2 andνa as a function f with λ 10 lead to the curves shown in Fig. 9. Maximumefficiency of the in-plane diffusion to facilitate adsorption implies use of thecorresponding values of ν1, ν2, and νa, whereas smaller values of the jump fre-quency may lead to unsuccessful in-plane random walks. The jump frequencythus determines the adsorption probability according to Eqs. (5)–(7). Moreover,as assumed in the model, ν also controls the mobility of the adsorbed species inthe mobile adsorption process. The physically interesting limits of variation ofν are given by Eq. (20):
FIG. 9 Variation of the number ν of jumps required for maximum efficiency of the in-plane diffusion as a function of the parameter f [Eq. (16)]. The solid and dashed linesrepresent νa [Eq. (19)] and ν2 [Eq. (18)], respectively, and in the two cases, the negativeslope of the variation increases with the size of the discs (r2 2, 3, or 7) attempting toadsorb on positions already occupied by discs of radius 1.

346 Pefferkorn et al.
0 ν
6λ2 (r1 r2)2 (20)
Whereas the upper limit allows all particles to escape from all occupied areas,the lower limit corresponds to the LA process. Figure 10 represents the differentdomains of variation of ν/6λ2 investigated in the present study, under conditionswhereby one disc of radius r1 is already adsorbed and d is the distance of theimpact point of the disc of radius r2 from the center of the adsorbed disc 1.
Considering for clarity the case f 1, adsorption statistically succeeds in thefollowing situations:
d r1 r2: even the LA process leads to adsorption (ν 0).r1 d r1 r2: owing to initial overlap of the discs 1 and 2, adsorption requires
the MA process and succeeds for values of ν between 0 and 6λ2.d r1: the impact point of the adsorbing disc 2 is located in the area of the
adsorbed disc 1 and adsorption occurs for values of ν/6λ2 between 1 and(r1 r2)2.
The set of parameters ra, f, ν, and λ entirely characterizes the mobile adsorp-tion process which is thus based on simple geometrical considerations. Therefore,it was interesting to determine the influence of the parameter ν/6λ2, which coun-terbalances the opposing effects of surface area exclusion and in-plane mobility,on the concentrations of the two types of disc 1 and 2 and their relative adsorptionon the successive plates of the chromatographic column.
(b) Influence of the Number of Jumps. A mixture of 250 discs of radius 1and 250 discs of radius 3 was injected 250 times into the column. A similarsimulation was done with the injection of 50 discs of radii 7. The parameter ofinterest was the number of jumps ν in relation to the distribution of small andlarge discs along the column and the corresponding covered areas on the initialplates. In Figs. 11 and 12 the number of small (top schema) and large discs(bottom schema) is reported as a function of plate number i for the successiveν values of 0 (LA process), 50, 500 (for Figs. 11 and 12), and 5000 (for Fig.
FIG. 10 Different domains of the efficient number of jumps according to the initialseparation between the coordinates of an adsorbed disc 1 and the randomly selected coordi-nates of a disc 2 at the first adsorption attempt.

Adsorption Processes in Chromatography 347
FIG. 11 Number of discs of radius 1 (top) and radius 3 (bottom) adsorbed as a functionof plate number i for different values of the number of jumps ν: (a) 0; (b) 50; and (c)500. The relative concentration of discs of radii 1 and 3 supplied at plate 1 is 0.5.
12), which correspond to an MA process characterized by in-plane diffusion pathsof increasing length. One observes that the increase in disc mobility in the MAmodel allows a larger number of small discs to be adsorbed on the initial plates,whereas in the LA process about 40 and 15 plates are required for adsorption ofthe 62,500 and 12,500 small discs, respectively. In all situations, a tendency toexclusion of large discs from the initial plates offers an increased possibility foradsorption of the small ones. MA is more efficient than LA with regard to thesurface area filling and the factor ν plays a major role in the disc compacting.Figures 13 and 14 show the relative area covered by adsorption when differentjump frequencies are implemented. The increase in the disc mobility in the MAmodel induces a marked overadsorption of small discs in the first plates (20 and5, respectively), whereas in the plateau, the coverage results only from the pres-ence of large discs. Hence MA systematically leads to a greater degree of surfacecoverage than LA. Therefore, chromatographic separation of mixtures of small

348 Pefferkorn et al.
FIG. 12 Number of discs of radius 1 (top) and radius 7 (bottom) adsorbed as a functionof plate number i for different values of the number of jumps ν: (a) 0; (b) 50; (c) 500;and (d) 5000. The relative concentration of discs of radii 1 and 7 supplied at plate 1 is 0.5.
and large discs is expected to be strongly enhanced when the adsorption kineticsare modeled by the MA process.
C. Composition Effects in AdsorptionChromatography
As far as the composition C rel of the mixture entering the column is fixed on thefirst plate throughout the experiment, this parameter strongly evolves with time,when the nonadsorbed discs become placed in front of the successive plates.Therefore, since the adsorption probability is modified from one plate to the fol-lowing, we first present these effects by showing the covered areas as a functionof the plate number i.
1. Localized AdsorptionFigures 15a–c and 16a and b show the covered area as a function of the platenumber i when different mixtures of discs of radii 1 and 2, 1 and 3, and 1 and
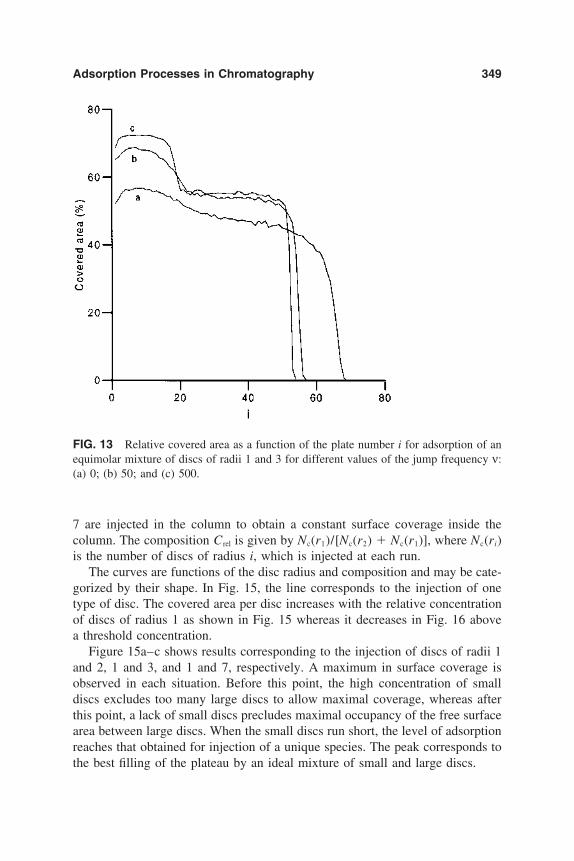
Adsorption Processes in Chromatography 349
FIG. 13 Relative covered area as a function of the plate number i for adsorption of anequimolar mixture of discs of radii 1 and 3 for different values of the jump frequency ν:(a) 0; (b) 50; and (c) 500.
7 are injected in the column to obtain a constant surface coverage inside thecolumn. The composition C rel is given by Nc(r1)/[Nc(r2) Nc(r1)], where Nc(ri)is the number of discs of radius i, which is injected at each run.
The curves are functions of the disc radius and composition and may be cate-gorized by their shape. In Fig. 15, the line corresponds to the injection of onetype of disc. The covered area per disc increases with the relative concentrationof discs of radius 1 as shown in Fig. 15 whereas it decreases in Fig. 16 abovea threshold concentration.
Figure 15a–c shows results corresponding to the injection of discs of radii 1and 2, 1 and 3, and 1 and 7, respectively. A maximum in surface coverage isobserved in each situation. Before this point, the high concentration of smalldiscs excludes too many large discs to allow maximal coverage, whereas afterthis point, a lack of small discs precludes maximal occupancy of the free surfacearea between large discs. When the small discs run short, the level of adsorptionreaches that obtained for injection of a unique species. The peak corresponds tothe best filling of the plateau by an ideal mixture of small and large discs.

350 Pefferkorn et al.
FIG. 14 Relative covered area as a function of the plate number i for adsorption of anequimolar mixture of discs of radii 1 and 7 for different values of the jump frequency ν:(a), 0; (b), 50; (c) 500; and (d) 5000.
Figure 16a and b shows results corresponding to the injection of discs of radii1 and 2 and 1 and 3. The different curves present a maximum. It is shown that thesituation of initial high concentration of small discs contributes to progressivelyexclude the large discs from the planes so that the previous maximal coverageper plane cannot be reached. The maximal degree of surface coverage within thecolumn depends on the composition C rel of the mixture being injected and on thesize of the larger disc. In a given system, the highest value is obtained for acharacteristic surface composition CS,rel : for plates bearing adsorbed discs of radii1 and 2, 1 and 3, or 1 and 7, the maximal surface coverage θcS,max is 0.565, 0.596,or 0.630. However, these degrees of surface coverage cannot be attained throughdirect injection at the given plate of a mixture of the required composition CS,rel.The final surface distribution results from successes and failures in adsorption onthe preceding plates, which progressively change the composition of the elutantencountering the plate of maximal coverage and thus modify the random accessto the surface initially imposed at plate 1 by the composition C rel.
Figure 17 shows the separation efficiency in the plates characterized by the

Adsorption Processes in Chromatography 351
FIG. 15 Localized adsorption process. Relative coverage by adsorbed discs of radii 1and 2 (a), 1 and 3 (b), 1 and 7 (c) as a function of the plate number i for different valuesof the relative concentration (%, as indicated on the curve) of the mixture supplied atplate 1.

352 Pefferkorn et al.
FIG. 16 Localized adsorption process. Relative coverage by adsorbed discs of radii 1and 2 (a), 1 and 3 (b) as a function of the plate number i for different values of the relativeconcentration (%, as indicated on the curve) of the mixture supplied at plate 1.
maximal coverage in terms of CS,rel as a function of Crel. Obviously, the separationefficiency is greater before since surface area exclusion of large discs is greaterand smaller after this point as a result of the decay of the concentration of smalldiscs. The selectivity of the chromatographic column, which can be defined bythe ratio CS, rel/C rel increases with the radius of the larger disc. Thus, for a symmet-rical system (Crel 0.5) containing discs of radii 1 and 2, 1 and 3, and 1 and 7,the selectivity is 1.13, 1.57, or 1.86, respectively, and the efficiency of separationincreases with the difference between the disc radii. The selectivity of the columnstrongly decreases with rising Crel. This may be explained by the fact that the

Adsorption Processes in Chromatography 353
FIG. 17 Relative concentration of adsorbed discs of radii 1 and 2 (), 1 and 3 (), 1and 7 () at the plate characterized by the maximal coverage as a function of the relativeconcentration of the discs being supplied at plate i 1. Open symbols refer to the localizedadsorption model and filled symbols refer to the mobile adsorption model. The dashedline indicates the absence of selectivity.
small discs are always able to invade the free areas existing between adsorbeddiscs, whereas the larger ones may be unable to adsorb on some free areas. Anearly symmetrical system may therefore be separated with greater efficiency.
These considerations lead to a result of particular interest for optimal separa-tion into the two fractions: the degree of surface coverage is lower before andafter the plate of maximal coverage due to departure from the ideal surface com-position. Hence, the best separate recovery of small and large discs is obtainedwhen the chromatographic column is split into three sections a, b, and c, as shownin Fig. 18, after injection of a mixture of discs of radii 1 and 3 at the sameconcentration:
The first section (a) going from plate 1 to the plate of maximal coverage. Itessentially contains the small discs,
The second section (b) going from the plate of maximal coverage to the platewhere the curve joins the curve of reference corresponding to the injection ofa unique species. It contains a mixture of small and large discs.
The last section (c), which only contains large discs.

354 Pefferkorn et al.
FIG. 18 Localized adsorption model. Relative concentration of discs of radii 1 and 3as a function of the plate number i obtained after supply of an equimolar mixture at plate1. (a) Corresponds to the region of overadsorption of discs of radius 1; (b) correspondsto a region of inefficient separation; and (c) corresponds to the region where only discsof radius 3 are recovered.
FIG. 19 Mobile adsorption process. Relative concentration of discs of radii 1 and 3 asa function of the plate number i obtained after supply of an equimolar mixture at plate1. (a) Corresponds to the region of overadsorption of discs of radius 1; (b) correspondsto a region of inefficient separation; and (c) corresponds to the region where only discsof radius 3 are recovered.
Adsorption Processes in Chromatography 355
2. Mobile AdsorptionNo systematic investigations have been done using the mobile adsorption model.For comparison with the localized adsorption model, Fig. 17 shows the value ofCS, rel for injection of the systems 1–3 and 1–7 at the initial concentration C rel
equal to 0.5 (black symbols). Figure 19 shows the variation of CS,rel with i forthe system 1–3. As previously, cutting of the column into three sections leadsto mainly obtain small discs in (a), a mixture of the two species in (b), and onlylarge discs in (c). The mobile adsorption process essentially limits the zone (b)of mixture of the two species to a very small number of plates.
IV. EXPERIMENTAL SYSTEMS
A. The Adsorbents
1. Adsorption ExperimentsNonporous glass beads of industrial origin (Verre et Industrie) of 34 µm averagediameter and 7.8 102 m2/g specific surface area were used as raw material.The beads were washed with hot hydrochloric acid to extract or exchange withhydrogen ions all surface complexing ionic species and thoroughly washed freeof acid with water to finally recover fully hydrated silica beads only bearingsurface silanol (-SiOH) groups. Excess water was evaporated under reduced pres-sure at 40°C to maintain the fully hydrated silica surface [22].
Latex of sperical shape and narrow size distribution was kindly provided bythe Laboratoire de Chimie et des Procedes de Polymerisation (Lyon, France).The latex particles were polymerized under emulsifier-free conditions using po-tassium persulfate as free radical initiator. The latex particles were hydrolyzedin the presence of Pyrex glass beads at 90°C during a week. This hydrolysisconverts all surface groups in carboxylic acid groups [23,24]. Average diameterswere the following: 840 nm from quasi-elastic light scattering and 860 nm fromelectronic microscopy determination.
2. ChromatographyChromatographic separation experiments were carried out using Whatman glassmicrofiber filters GF/B whose retention is limited to particles above 1 µm. Eachfilter had a diameter of 5 mm and a thickness of 1.4 mm, the calculated meandiameter of the glass microfiber being close to 6 µm. The material was thoroughlywashed with solvent before use.
B. The Polymer–Solvent Systems
Experiments have been carried out with polymers developing noncomplex poly-mer–adsorbent interactions. Adsorption isotherms and kinetics are given in thispart in order to characterize the different systems.

356 Pefferkorn et al.
To determine the amount of polymer adsorbed, the following procedure wasimplemented. The colloidal adsorbents were suspended in solvent and degassedunder reduced pressure in order to generate a solid–liquid interface. The requiredmass of polymer solution was then added to the suspension. Mild controlledagitation was employed to homogenize the suspension during adsorption. Theamount of adsorbed polymer was determined by comparing the initial specificradioactivity and that of the supernatant solution after adsorption. The isothermrepresents the surface coverage Ns (mol/cm2) as a function of the polymer con-centration N (mol/ml) in solution at adsorption equilibrium.
To determine the rate of adsorption the following cell reactor (Fig. 20) andmethodology were implemented in order to slow down the surface coverage dur-ing the initial step where the surface area coverage is small and to accelerate theprocess during the final step where the coverage tends to completion. The cellconsisted of a cylindrical chrome or glass reservoir of volume V equal to 50mL with a rotating magnetic bar D fixed on the bottom. The outlet aperture wasfitted with a nonadsorbing filter E to avoid loss of beads during injection of thesolution with an automatically driven syringe A. The adsorbent and a smallamount of solvent were introduced into the cell reactor and the suspension wasdegassed. The cell was then filled with solvent and the suspension was homoge-nized by stirring with a magnetic bar D. At time zero, the radiolabeled polymersolution at concentration C0 (cpm/mL) was injected at controlled rate Jv (mL/min) into the reactor. It was shown that the diffusion of macromolecules in thestagnant layer around the adsorbent can be neglected [25]. The chief advantageis the possibility of a quasi-continuous recording of the radioactivity of the efflu-
FIG. 20 Schematic representation of the experimental device employed for determina-tion of the adsorption kinetics. (A) Automatically driven syringe for controlled polymersupply. (B) Reactor containing the suspension. (C) Effluent collector. (D) Magnetic bar.(E) Filter.
Adsorption Processes in Chromatography 357
ent taken at C as a function of time, by which a high accuracy in the determinationof the adsorption amount can be reached. The effluent was collected for a time∆t (min), and the successive samples n were analyzed for radioactivity. The in-crease in adsorption ∆As for an increment of time ∆t was obtained using Eq. (21):
[∆As]n1 JvC0∆t An1 V
2Jv∆tAn2 An (21)
where An represents the total radioactivity of the nth sample. At time t 0, n 0.The increase ∆Ns (mol/cm2) is related to ∆As through Eq. (22):
∆NS ∆As
SRspecMw
(22)
where S, Rs, and Mw are the specific area of the adsorbent, the specific radioactiv-ity, and the average molecular weight of the polymer, respectively. The value ncorresponding to the end of the fast adsorption process was obtained by compar-ing the experimental variation of An as a function of n with the expected variationgiven by Eq. (23):
An C0Jv∆t1 expJv∆t
V(nf n) Af expJv∆t
V(nf n) (23)
where Af and nf are the sample radioactivity and the sample number correspond-ing to the end of adsorption. Equation (23) means that the exponential behaviorof An, which is determined in the absence of adsorption, is recovered when theadsorption has reached completion. The experimental kinetic coefficient is ex-pressed by Eq. (24), according to Eq. (13):
∆Ns
∆t K(Ns) N (24)
1. The Diblock Copolymer of Styrene andVinyl-2-pyridine
Copolymers were prepared by anionic polymerization of styrene with functionalend-groups in tetrahydrofuran, followed by in situ polymerization of the vinyl-2-pyridine component [26]. Average molecular weights of polystyrene and poly-vinyl-2-pyridine blocks were determined by light scattering in tetrahydrofuransolution. Radiolabeling was carried out by trace quaternization of the pyridinemoiety with 14CH3l in tetrahydrofuran leading to 0.1–0.3% pyridine iodidegroups. In the text, the copolymer is referenced by [ p-q] where p and q are thepolymerization index of the styrene and vinyl-2-pyridine blocks, respectively.
Toluene was purified by distillation over sodium wire and maintained overmolecular sieves to prevent the adsorption of moisture.

358 Pefferkorn et al.
Toluene constitutes a selective solvent for the copolymer because it is a goodsolvent for the styrene block and a nonsolvent for the pyridine block. The copoly-mer solubilized in toluene below the critical micelle concentration (cmc) mayhave a segregated structure where the polyvinyl block is protected from precipita-tion by the polystyrene chain. Adsorption kinetics were determined from solutionbelow and above the cmc, which was determined to be equal to 1010 mol/mL.
Results of static light scattering measurements carried out on aged solutionsindicated that the mean degree of micellization was of the order of 10 [27]. TheZimm plot is characteristic of a macromolecular system in poor solvent, as evi-denced by the negative value of the second virial coefficient (A2 2 1 104 g/mL) [28]. Moreover, the shape of the angular variation of the scatteredintensity is characteristic of interacting spheres.
Since high adsorption levels were determined on hydrated silica whereas verylow levels were determined on silanized silica, diblock copolymer adsorptionon silica from toluene solution was attributed to silanol–pyridine interaction innonpolar medium (Lewis acid–base interaction) [29]. Figures 21 and 22 showthe kinetic coefficient K(Ns) of adsorption on nonporous glass beads as a functionof θs according to Eq. (24) for the copolymer [314–771] below and above thecmc, respectively. The fractional surface coverage θs was calculated by takinginto account that the surface is fully covered with molecules when 2.7 1012
mol/cm2 are adsorbed (after 1 month) [30]. The fact that unique curves are ob-tained with changing the rate of supply of isolated and organized macromoleculesindicates that surface area exclusion constitutes the rate-limiting phenomenon.Moreover, the adsorption kinetics during the fast process appears to be the samefor isolated and organized macromolecules.
2. The Homopolymer Poly-4-vinylpyridinePolyvinyl-4-pyridine was synthesized in ethylene glycol using azodiisobutyroni-trile as initiator. After purification by successive precipitation in alkaline waterand dissolution runs in ethanol, the polymer was fractionated in methanol-toluenemixtures. The polymerization index x and the radius of gyration RG were deter-mined from static light scattering measurements performed in 0.01 NaCl etha-nolic solution and the following relation was obtained between x and RG :
RG(nm) 0.94x0.45 (25)
The polyvinyl-4-pyridine is soluble in water in acidic medium, and at pH 3.0the degree of protonation is equal to 0.475 [31].
In order to determine polymer concentrations in very dilute solutions witha high degree of precision, radiolabeled polyvinyl-4-pyridine was obtained byquaternization of a few pyridine groups. In its final form, the polymer was com-posed of 99.9% pyridine groups and 0.1% quaternized pyridinium groups.

Adsorption Processes in Chromatography 359
FIG. 21 Adsorption of block copolymer polystyrene-polyvinyl-2-pyridine [314-771] onsilica from a solution of concentration equal to 1010 mol/mL (cmc). Representation ofthe kinetic coefficient K(Ns) (s1) as a function of the relative coverage θs, for differentrates of polymer supply (mol/min cm2): () 2.8 1014; () 4.95 1014; () 12.9 1014.
Adsorption studies were carried out using polystyrene latex particles as adsor-bent. Only electrostatic interactions between the pyridinium groups and the sur-face carboxylic acid groups are expected to occur. Interfacial reconformationof adsorbed polymer was evidenced by changing the rate of polymer supply inadsorption experiments. At the moment of initial contact with the surface, thepolymer preserves its solution conformation. Under conditions of slow transferof polymer to the sorbent surface, a slow reconformation of adsorbed macromole-cules sets in, leading to a polymer flattening. This structure is unstable and over-adsorption proceeds slowly to establish a thermodynamic equilibrium. Underconditions of fast transfer of polymer to the surface, the adsorbent is quite instan-taneously covered with polymer characterized by their solution conformation.This interfacial structure was also unstable and thermodynamic equilibrium wasattained via a desorption process. Equations (26) and (27) were found to describe

360 Pefferkorn et al.
FIG. 22 Adsorption of block copolymer polystyrene-polyvinyl-2-pyridine [314-771] onsilica from a solution of concentration equal to 3.5 1010 mol/mL (3.5 cmc). Repre-sentation of the kinetic coefficient K(Ns) (s1) as a function of the relative coverage θs,for different rates of solution injection (mol/min): () 2 1011; (, ) 1010 (twoexperiments).
the slow relaxation process during delayed surface area coverage and the fastprocess during desorption of the exceeding macromolecules [31]:
σ σeq
σm σeq
expt
τads (26)
σ σads
σm σads
expt
τdes (27)
where σm is the area at the initial time of contact with the surface (equal to thecross-sectional area of the polymer coil), σ is the area at time t, σeq and σads arethe surface occupied at adsorption equilibrium by the isolated flat macromoleculeand by the macromolecule at completion of the surface coverage, respectively.τads and τdes were determined to be equal to 2200 and 11 min, respectively. Since
Adsorption Processes in Chromatography 361
a unique equilibrium interfacial structure is established under slow and fast ad-sorption conditions, the adsorption is expected to be reversible. This characteristicwas determined by determination of the electrophoretic mobility of the colloid–polymer complex. When the colloid suspension is washed out of nonadsorbedpolymer by replacement of the supernatant polymer solution with pure water, theelectrophoretic mobility of the bare colloid is recovered after a given time [32].
To represent the kinetic coefficient K(Ns) as a function of the relative surfacecoverage θs, it is assumed that the maximal coverage of 9 1014 mol/cm2
corresponding to the fast adsorption regime prior to desorption corresponds to arelative coverage of about 0.4 for which the kinetic factor can be experimentallydetermined. It is noteworthy that for the model used in numerical simulation the1231 discs that can adsorb on the plane strictly corresponds to the number ofmacromolecules able to adsorb on a unique latex particle and that the kineticsof the adsorption process is obtained for only 75% of the jamming limit. Thismeans that the range of fast surface filling constitutes the experimentally measur-able adsorption and that completion of coverage brings into play kinetic coeffi-cients much lower than 104 s1, which are not accessible to our technique. Onthe other hand, it is obvious that higher coverage cannot be obtained as a resultof the polymer interfacial reconformation. With this assumption, the experimentalvariation of K(Ns) with θs shown in Fig. 23 agrees with that determined by themobile adsorption model (see Fig. 4). Clearly, since no polymer is detected in theliquid phase for θs values below 0.2, adsorption of the injected macromolecules isinstantaneous. The existence of a unique variation of K(Ns) for different injectionrates of polymer indicates that surface area exclusion constitutes the unique lim-iting factor in this range of surface coverage.
Since interfacial reconformation tends to slowly flatten the adsorbed molecule,it is clear that during the time devoted to a typical chromatography experiment,adsorbed polyvinyl-4-pyridine may not be considered as retaining its solutionconformation. Nevertheless, the adsorbed polymer does not remain adsorbed ata given place but continuously moves on the surface.
C. Relevance of the Adsorbing Disc Model toAdsorbed Polymer Systems
1. The Diblock CopolymerPolystyrene-polyvinyl-2-pyridine
The diblock copolymer [p-q] is characterized by its solution β and surface βs
size asymmetry ratio defined as follows [33]:
β p0.60
q0.33; βs
p0.60
q0.5(28)

362 Pefferkorn et al.
FIG. 23 Adsorption of polyvinyl-4-pyridine on carboxylate polystyrene latex in waterat pH 3.0. Representation of the kinetic coefficient K(Ns) (s1) as a function of the relativesurface coverage θs for different rates of polymer supply (mol/min cm2): () 1.24 1015; () 2.45 1015; () 4.82 1015.
Table 1 provides molecular characteristics of the copolymers used in the chro-matography experiments. When βs is great, the large bulk of the soluble blockimpedes the formation of the continuous interfacial cake comprising the nonsolu-ble blocks and small islands were expected to appear on the surface even at fullsurface coverage. When βs is equal to 1 or less, isolated spherical cakes appear
TABLE 1 Molecular Characteristics of theCopolymer Polystyrene-polyvinyl-2-pyridine
[p-q] β βs
[211–57] 6.5 3.3[314–771] 3.4 1.1[179–412] 3.0 1.1[177–863] 2.3 0.7[177–1581] 1.9 0.5

Adsorption Processes in Chromatography 363
at small coverage, which give rise to a continuous film at full coverage. In thelast situation, since the cross-sectional area corresponding to the volume of thesoluble block is close to or smaller than the surface area of the nonsoluble block,no retardation effect is expected to result from the presence of the soluble block.The image of isolated adsorbed polymers characterized by βs 1 is given inFig. 24. The surface deposition of the cake may thus be modeled by the discadsorption scheme.
2. The Homopolymer Polyvinyl-4-pyridineThe number Ns of polymers giving rise to a monolayer was found to be close tothe number N*s derived from the critical concentration of nonoverlapping spheresin two dimensions when the intrinsic viscosity [η] and radius of gyration RG weredetermined in nonpolar medium [31]. This derivation was found to be valid inthe case of the random sequential adsorption model when [η] was determined in0.5 M NaCl solution, where long-range electrical forces are screened. It is wellknown that the reduced viscosity of polyelectrolyte strongly increases with dilu-tion as a result of the effect of increasing electrostatic repulsive forces. Whenpolymer characteristics determined in water or dilute electrolyte solution are em-ployed to derive the adsorption of polymer of different average molecular weight,nonrealistic values were obtained as a result of an overvalued surface area exclu-sion effect. Conversely, since the effect of long-range forces disappears in con-centrated electrolyte and polymer solution, we are brought to the conclusion thatthese forces may also be ignored at the interface. Our model of the adsorbedpolyelectrolyte shown in Fig. 25 assumed that the area occupied by the adsorbedmacromolecule is composed of (1) the central zone of high chain segment concen-tration, which constitutes the surface area being effectively excluded, and (2) theouter zone of smaller segment density, which does not exert such effects towardthe central zone of solution macromolecules. If one further assumes that the vol-ume of the central zone is close to that derived from the intrinsic viscosity deter-mined in nonpolar medium, this image supports the adsorption model of un-charged discs of radius equal to the radius of the central zone.
FIG. 24 Representation of the conformation of block copolymers adsorbed at the solid–liquid interface from a selective solvent.

364 Pefferkorn et al.
FIG. 25 Representation of the conformation of a polyelectrolyte adsorbed at the solid–liquid interface. The rectangle indicates the limit of the zone corresponding to the excludedsurface area.
V. SURFACE AREA EXCLUSIONCHROMATOGRAPHY
Obviously, the efficiency of the chromatographic separation based on surfacearea exclusion effects may be improved when the rate of polymer transfer fromthe flowing phase (elutant) to the adsorbent (the stationary phase) is fast and thusexperimental systems developing high surface to volume ratios may be advanta-geous. On the other hand, since high shear rates under fast injection may bedetrimental to an efficient fractionation based on the present localized and mobilemodels of disc adsorption, we devised a very elementary column to show thelimits and the possibilities of these idealized chromatographic separationmethods.
A. Experimental Device and Methodology
1. The Chromatographic ColumnThe chromatographic column that is schematically represented in Fig. 26 is com-posed of a calibrated glass syringe (Tacussel, Lyon) and the corresponding pis-tons (C), which were modified to be fitted with input and output apertures of 0.5mm, allowing the solvent or polymer solution to be injected at a controlled ratewith the aid of an automatically driven syringe at one point and recovered at theother one. Two 2-mm-thick ‘‘nonadsorbing’’ Teflon discs (E) of large porositywere clamped close to the input piston inside the column to immediately establisha homogeneous distribution of the injected solution through the first and succes-sive Whatman glass microfiber filters (C). The small amount of copolymer andpolyelectrolyte adsorbed on these two ‘‘nonadsorbing’’ Teflon discs is reportedin all chromatograms to show the absence of polymer retention and/or fraction-ation by adsorption. The column was filled with 56 filters and the height of theadsorbent in the column was reduced from 8 to 4.5 cm after stacking. The glassfiber volume thus represented 10% of the void volume of the column, which wasequal to 0.77 mL.

Adsorption Processes in Chromatography 365
FIG. 26 Schematic representation of the experimental device employed for determina-tion of the adsorption profiles in chromatography. (A) Automatically driven syringe forcontrolled polymer supply. (B) Automatic valve for swapping solution for solvent. (C)Stacked glass fiber filters (the stationary phase). (D) Automatically driven syringe forcontrolled solvent supply. (E) Nonadsorbing Teflon filters. (F) Elutant collector.
2. The Chromatographic SeparationTo establish reproducible adsorption characteristics on the solid–liquid interface,the column was carefully saturated with use of a syringe (D) and eluted withtoluene in the case of experiments performed with diblock copolymers and acidicwater at pH 3.0 in the case of experiments performed with polyvinyl-4-pyridine.The polymer solution was injected at a controlled rate employing the syringe (A)enabling the polymer to be adsorbed on the successive filters. When the fixedvolume of solution was injected, the injection was stopped and the elution wascontinued with solvent by running of the valve (B). In some instances, the solu-tion in the void volume was pushed out by injection of air. The effluent wascollected at the outlet with a sample collector (F).
At the end of the experiment, the filters were successively taken out of thecolumn with care, individually deposited into glass vials, and counted for radioac-tivity content using a Tricarb spectrometer (Packard). The surface area availableto polymer adsorption was estimated to be 1 dm2/filter taking into account adsorp-tion measurements of polyvinyl-4-pyridine of molecular weight 3.6 105 onpolystyrene latex particles. Actually, no major difference in the adsorption behav-ior was expected to occur on silica and latex particles because at the pH levelof the experiments silica and polystyrene latex particles are characterized by asurface charge density of the order of 2.8 µC/cm2. Quite similar interactions areexpected to be established between the pyridinium groups of the polymer andthe dissociated silanol or carboxylic acid groups [34]. Therefore, the radioactivity(cpm) of each filter was converted to the number of adsorbed polyelectrolyte
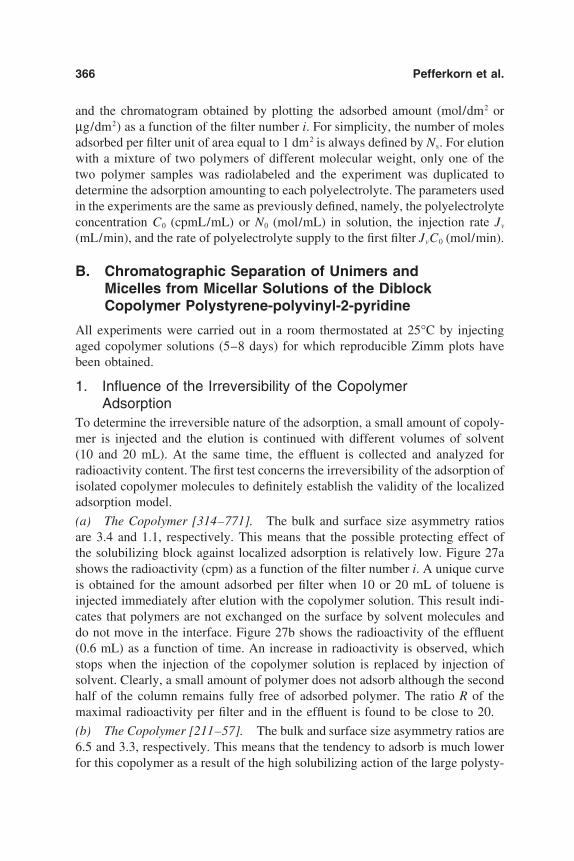
366 Pefferkorn et al.
and the chromatogram obtained by plotting the adsorbed amount (mol/dm2 orµg/dm2) as a function of the filter number i. For simplicity, the number of molesadsorbed per filter unit of area equal to 1 dm2 is always defined by Ns. For elutionwith a mixture of two polymers of different molecular weight, only one of thetwo polymer samples was radiolabeled and the experiment was duplicated todetermine the adsorption amounting to each polyelectrolyte. The parameters usedin the experiments are the same as previously defined, namely, the polyelectrolyteconcentration C0 (cpmL/mL) or N0 (mol/mL) in solution, the injection rate Jv
(mL/min), and the rate of polyelectrolyte supply to the first filter JvC0 (mol/min).
B. Chromatographic Separation of Unimers andMicelles from Micellar Solutions of the DiblockCopolymer Polystyrene-polyvinyl-2-pyridine
All experiments were carried out in a room thermostated at 25°C by injectingaged copolymer solutions (5–8 days) for which reproducible Zimm plots havebeen obtained.
1. Influence of the Irreversibility of the CopolymerAdsorption
To determine the irreversible nature of the adsorption, a small amount of copoly-mer is injected and the elution is continued with different volumes of solvent(10 and 20 mL). At the same time, the effluent is collected and analyzed forradioactivity content. The first test concerns the irreversibility of the adsorption ofisolated copolymer molecules to definitely establish the validity of the localizedadsorption model.
(a) The Copolymer [314–771]. The bulk and surface size asymmetry ratiosare 3.4 and 1.1, respectively. This means that the possible protecting effect ofthe solubilizing block against localized adsorption is relatively low. Figure 27ashows the radioactivity (cpm) as a function of the filter number i. A unique curveis obtained for the amount adsorbed per filter when 10 or 20 mL of toluene isinjected immediately after elution with the copolymer solution. This result indi-cates that polymers are not exchanged on the surface by solvent molecules anddo not move in the interface. Figure 27b shows the radioactivity of the effluent(0.6 mL) as a function of time. An increase in radioactivity is observed, whichstops when the injection of the copolymer solution is replaced by injection ofsolvent. Clearly, a small amount of polymer does not adsorb although the secondhalf of the column remains fully free of adsorbed polymer. The ratio R of themaximal radioactivity per filter and in the effluent is found to be close to 20.
(b) The Copolymer [211–57]. The bulk and surface size asymmetry ratios are6.5 and 3.3, respectively. This means that the tendency to adsorb is much lowerfor this copolymer as a result of the high solubilizing action of the large polysty-

Adsorption Processes in Chromatography 367
FIG. 27 (a) Radioactivity counted (cpm) per filter as a function of the filter number iafter injection of the copolymer [314–771] and elution with 10 () and 20 mL () oftoluene. (b) Radioactivity (cpm) counted per 0.6 mL of elutant as a function of time (min).
rene block. One may wonder if the injection of different volumes of solventfurther provides unique variations of the radioactivity as a function of the filternumber i and time. This information is given in Fig. 28a and b. Obviously, thepresence of a small adsorbing block ensures the conditions of a localized adsorp-tion. Nevertheless, R is found to be close to 6, indicating that relatively moremacromolecules flow through the column without interacting with the adsorbentthan was determined for the copolymer [314–771].

368 Pefferkorn et al.
FIG. 28 (a) Radioactivity counted (cpm) per filter as a function of the filter number iafter injection of the copolymer [211–57] and elution with 10 () and 20 mL () oftoluene. (b) Radioactivity (cpm) counted per mL of elutant as a function of time (min).
These combined results demonstrate that the copolymer molecules irreversiblyadsorb on the successive filters and that a very small number of macromoleculesadopted solution conformations that impede any adsorption. When the polysty-rene block prevents interaction between pyridine and silica, from this effectappears to be more marked with copolymers characterized by large β and βs
values [35].The amount of solvent used as elutant does not modify the copolymer distribu-
tion inside the column. Therefore, we estimate that injection of solutions of differ-
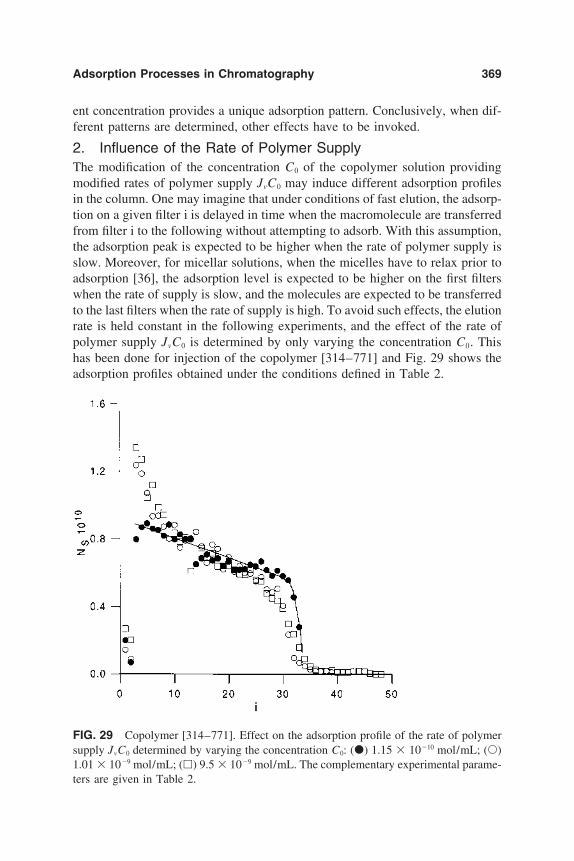
Adsorption Processes in Chromatography 369
ent concentration provides a unique adsorption pattern. Conclusively, when dif-ferent patterns are determined, other effects have to be invoked.
2. Influence of the Rate of Polymer SupplyThe modification of the concentration C0 of the copolymer solution providingmodified rates of polymer supply JvC0 may induce different adsorption profilesin the column. One may imagine that under conditions of fast elution, the adsorp-tion on a given filter i is delayed in time when the macromolecule are transferredfrom filter i to the following without attempting to adsorb. With this assumption,the adsorption peak is expected to be higher when the rate of polymer supply isslow. Moreover, for micellar solutions, when the micelles have to relax prior toadsorption [36], the adsorption level is expected to be higher on the first filterswhen the rate of supply is slow, and the molecules are expected to be transferredto the last filters when the rate of supply is high. To avoid such effects, the elutionrate is held constant in the following experiments, and the effect of the rate ofpolymer supply JvC0 is determined by only varying the concentration C0. Thishas been done for injection of the copolymer [314–771] and Fig. 29 shows theadsorption profiles obtained under the conditions defined in Table 2.
FIG. 29 Copolymer [314–771]. Effect on the adsorption profile of the rate of polymersupply JvC0 determined by varying the concentration C0: () 1.15 1010 mol/mL; ()1.01 109 mol/mL; () 9.5 109 mol/mL. The complementary experimental parame-ters are given in Table 2.

370 Pefferkorn et al.
TABLE 2 Parameters of Experiments Reported inFig. 29
109 C0 Jv 109 JvC0 109 Ns
(mol/mL) (mL/min) (mol/min) (mol)
0.115 1.5 0.17 2.161.01 1.5 1.52 2.159.5 1.5 14.2 2.06
Clearly, the major effect of varying the copolymer concentration from the cmcto 100 cmc is to modify the adsorption profile in the column because similarcurves are not obtained at low and high rates of polymer supply although similaradsorptions are obtained at the end of the experiment. The full line correspondsto the injection of isolated macromolecules. For injection of the micellar solution,an adsorption peak is determined at the column inlet and comparatively lowermolecules are adsorbed at the end of the adsorption zone. This clearly showsthat micellar solutions initially contain unimers (isolated molecules) and micelles(organized molecules) that behave differently on adsorption.
3. Influence of the Injection RateTo definitely eliminate relaxation effects and delay in adsorption resulting fromchanges in the elution rate, solutions of different copolymer [p-q] were eluted atthe same concentration but at different rates as indicated in Table 3. Obviously,different shapes were obtained for the different systems but no definite effect
TABLE 3 Parameters of Experiments Reported in Fig. 30
109 C0 Jv t(s) 109 JvC0 109 Ns FigureCode [p-q] (mol/mL) (mL/min) injection mol/min (mol) number
[314–771] 9.5 1.5 11 14.2 2.06 (a)[314–771] 9.5 0.15 105 1.42 2.08 (a)[179–412] 2.00 1.5 55 3.0 2.30 (b)[179–412] 1.95 0.15 495 0.29 2.12 (b)[177–863] 1.88 1.5 50 2.8 2.29 (c)[177–863] 1.88 0.15 470 0.28 2.18 (c)[177–1581] 1.14 1.5 88 1.71 1.98 (d)[177–1581] 1.18 0.15 813 0.177 2.05 (d)[211–57] 2.04 1.5 338 3.06 15.1 (e)[211–57] 2.04 0.3 1950 0.612 15.0 (e)

Adsorption Processes in Chromatography 371
would be attributed to a decrease (by a factor 10) of the injection rate. Therefore,when these experimental criteria are employed in chromatography, modificationsin the shape of the adsorption profile have to be attributed to changes in thestructure and/or composition of the copolymer solutions. The most simple situa-tion represented in Fig. 30e corresponds to the copolymer [211–57] for whichno micelles could be detected by light scattering in solution of concentrations
FIG. 30 Influence of the injection rate. Effect on the adsorption profile after injectionof the different copolymers: (a) [314–771]; (b) [179–412]; (c) [177–863]; (d) [177–1581];and (e) [211–57]. The complementary experimental parameters are given in Table 3.
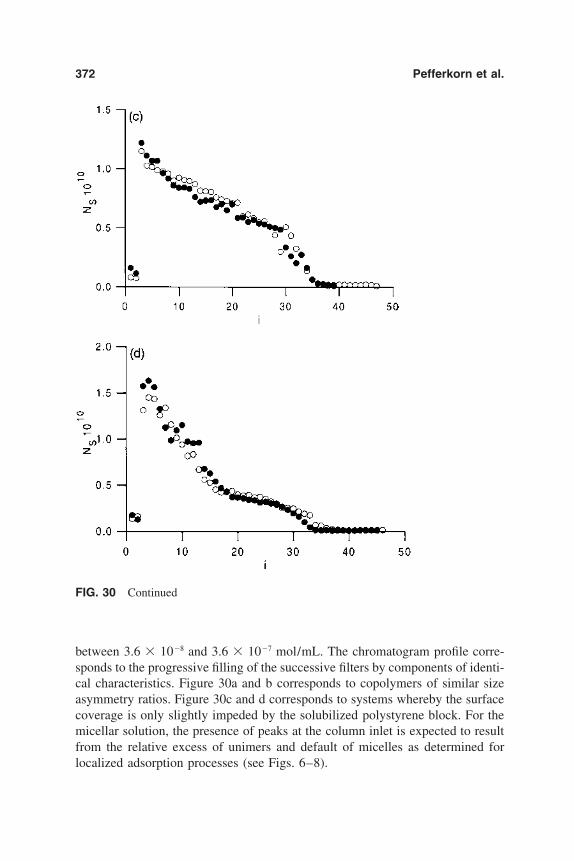
372 Pefferkorn et al.
FIG. 30 Continued
between 3.6 108 and 3.6 107 mol/mL. The chromatogram profile corre-sponds to the progressive filling of the successive filters by components of identi-cal characteristics. Figure 30a and b corresponds to copolymers of similar sizeasymmetry ratios. Figure 30c and d corresponds to systems whereby the surfacecoverage is only slightly impeded by the solubilized polystyrene block. For themicellar solution, the presence of peaks at the column inlet is expected to resultfrom the relative excess of unimers and default of micelles as determined forlocalized adsorption processes (see Figs. 6–8).

Adsorption Processes in Chromatography 373
FIG. 30 Continued
4. Influence of the Interfacial Reconformation of thePolyvinyl-2-pyridine Block
Reconformation of adsorbed homopolymers has been previously determined asa process that can strongly influence the surface coverage [37–40]. Similar in-terfacial phenomena were expected to address the adsorbed chain of blockcopolymers (belonging to isolated and organized molecules) and may modifythe separation efficiency. This should particularly apply to copolymers of sizeasymmetry ratios βs smaller than 1 such as the copolymer [117–1581] [33] (Fig.31). Experiments were carried out with the parameters reported in Table 4 includ-ing a very short injection time of 9 s.
A monotonous decay is determined at the cmc with a maximal coverage of 0.9 1010 mol on the first adsorbing filter. The decay appears to be more complex at10 and 100 cmc, where initial peak and plateau adsorptions were observed.Overadsorption at the inlet of the column should be attributed to preferentialadsorption of unimers, whereas values of the final plateau should be attributedonly to adsorption of micelles. Therefore, adsorbed unimers are expected to oc-cupy a smaller area than adsorbed micelles, since the number of molecules ad-sorbed in the plateau region is greater than the values that may be determinedfrom plateaus observed at 10 and 100 cmc. Moreover, in the experiment wherethe solution was injected during 88 s (and longer, as indicated in Fig. 30d), lowermicelles are adsorbed than in the experiment where the solution was injectedduring 9 s; fast aging seems to flatten the interfacial conformation of adsorbedmicelles. However, a more pertinent information of these results is not possiblebecause no correlation is established between the actual areas being occupied by
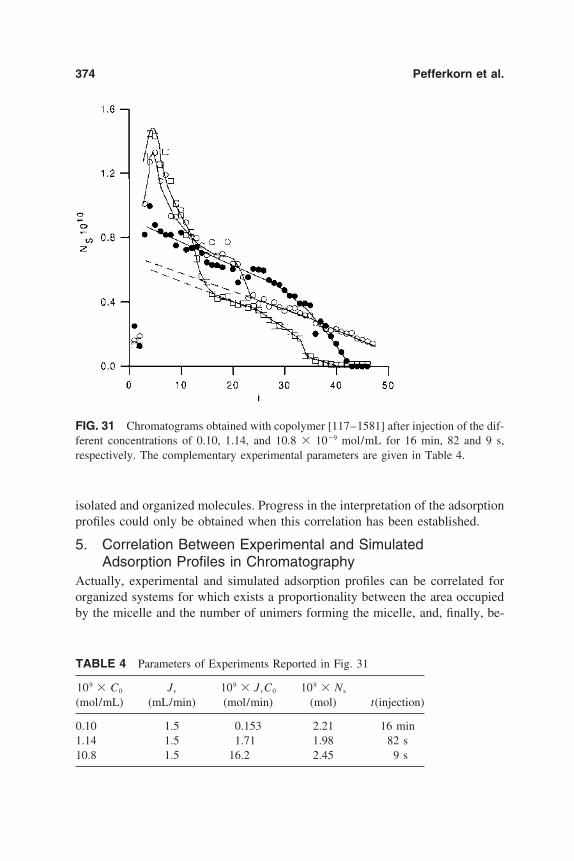
374 Pefferkorn et al.
FIG. 31 Chromatograms obtained with copolymer [117–1581] after injection of the dif-ferent concentrations of 0.10, 1.14, and 10.8 109 mol/mL for 16 min, 82 and 9 s,respectively. The complementary experimental parameters are given in Table 4.
isolated and organized molecules. Progress in the interpretation of the adsorptionprofiles could only be obtained when this correlation has been established.
5. Correlation Between Experimental and SimulatedAdsorption Profiles in Chromatography
Actually, experimental and simulated adsorption profiles can be correlated fororganized systems for which exists a proportionality between the area occupiedby the micelle and the number of unimers forming the micelle, and, finally, be-
TABLE 4 Parameters of Experiments Reported in Fig. 31
109 C0 Jv 109 JvC0 109 Ns
(mol/mL) (mL/min) (mol/min) (mol) t(injection)
0.10 1.5 0.153 2.21 16 min1.14 1.5 1.71 1.98 82 s10.8 1.5 16.2 2.45 9 s

Adsorption Processes in Chromatography 375
FIG. 32 Copolymer [314–771]. Chromatogram obtained for injection of solutions ofconcentration equal to the cmc. The complementary experimental parameters are givenin Table 5.
tween the area covered by the micelles and the radioactivity counted on the filter.This has been verified for the copolymer [314–771], which is characterized bya βs value of 1.1. Figure 32 shows the chromatograms for three experimentswhere a total amount of 2.11–2.17 109 mol was injected in the column. Thecorresponding parameters are given in Table 5. The three experiments indicatethat a maximal coverage of 0.9 1010 mol is obtained at the column inlet. Themonotonous decay of the coverage well characterizes the adsorption of a uniquespecies. Figure 32 should be compared to Fig. 33, which represents the chromato-gram corresponding to the same total coverage obtained after injection of a solu-tion at the concentration of 109 mol/mL (10 cmc). The parameters of theexperiments are given in Table 6. Taking into account the analogy existing be-tween the adsorption profiles of Figs. 6–8 obtained from simulation of the injec-
TABLE 5 Parameters of Experiments Reported in Fig. 32
1010 C0 Jv 1010 JvC0 109 Ns t(s)(mol/mL) (mL/min) (mol/min) (mol) (injection)
1.15 1.5 1.72 2.16 8501.15 1.5 1.72 2.11 8501.12 0.6 0.67 2.17 2220

376 Pefferkorn et al.
FIG. 33 Copolymer [314–771]. Chromatogram obtained for injection of solutions ofconcentration equal to 10 cmc. The complementary experimental parameters are givenin Table 6.
tion of a mixture of discs of radii 1 and 3, and that represented in Fig. 33, wemay conclude that the initial peak corresponds to the overadsorption of unimersand the plateau region, where the unimers are excluded, to micelles. In Fig. 33,extrapolation of the plateau to the inlet of the column sets a line that reproducesthe coverage determined in Fig. 32. This indicates that adsorption at a constantfull coverage by unimers or micelles corresponds to the interfacial deposition ofthe same number Ns of macromolecules. Taking into account that the determina-tion by light scattering provided an average degree of micellization equal to 10,it can be concluded that a micelle composed of 10 molecules occupies the areacorresponding to 10 molecules. This may be expressed differently by assumingthat the radii of the adsorbed unimer and micelle are equal to 1 and 3.16, respec-tively, so that the numerical simulation of the chromatography using discs of radii
TABLE 6 Parameters of Experiments Reported in Fig. 33
109 C0 Jv 109 JvC0 109 Ns t(s)(mol/mL) (mL/min) (mol/min) (mol) (injection)
1.01 1.5 1.52 2.15 861.01 0.15 0.152 2.3 9901.09 0.6 0.65 2.14 2371.09 0.6 0.65 2.28 240
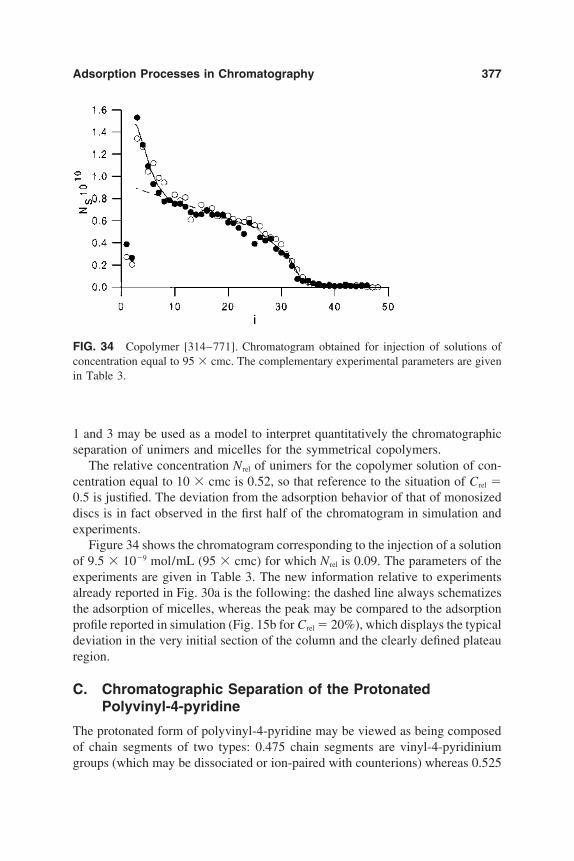
Adsorption Processes in Chromatography 377
FIG. 34 Copolymer [314–771]. Chromatogram obtained for injection of solutions ofconcentration equal to 95 cmc. The complementary experimental parameters are givenin Table 3.
1 and 3 may be used as a model to interpret quantitatively the chromatographicseparation of unimers and micelles for the symmetrical copolymers.
The relative concentration Nrel of unimers for the copolymer solution of con-centration equal to 10 cmc is 0.52, so that reference to the situation of Crel 0.5 is justified. The deviation from the adsorption behavior of that of monosizeddiscs is in fact observed in the first half of the chromatogram in simulation andexperiments.
Figure 34 shows the chromatogram corresponding to the injection of a solutionof 9.5 109 mol/mL (95 cmc) for which N rel is 0.09. The parameters of theexperiments are given in Table 3. The new information relative to experimentsalready reported in Fig. 30a is the following: the dashed line always schematizesthe adsorption of micelles, whereas the peak may be compared to the adsorptionprofile reported in simulation (Fig. 15b for Crel 20%), which displays the typicaldeviation in the very initial section of the column and the clearly defined plateauregion.
C. Chromatographic Separation of the ProtonatedPolyvinyl-4-pyridine
The protonated form of polyvinyl-4-pyridine may be viewed as being composedof chain segments of two types: 0.475 chain segments are vinyl-4-pyridiniumgroups (which may be dissociated or ion-paired with counterions) whereas 0.525
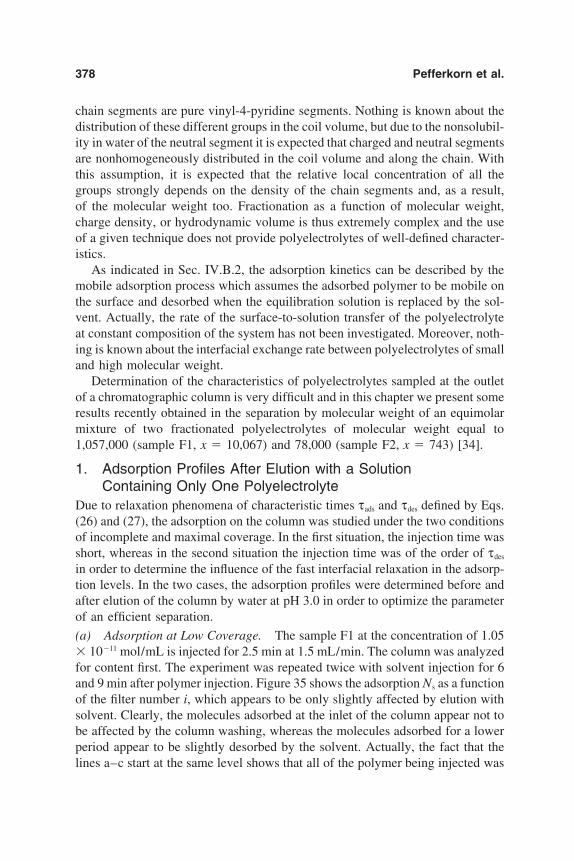
378 Pefferkorn et al.
chain segments are pure vinyl-4-pyridine segments. Nothing is known about thedistribution of these different groups in the coil volume, but due to the nonsolubil-ity in water of the neutral segment it is expected that charged and neutral segmentsare nonhomogeneously distributed in the coil volume and along the chain. Withthis assumption, it is expected that the relative local concentration of all thegroups strongly depends on the density of the chain segments and, as a result,of the molecular weight too. Fractionation as a function of molecular weight,charge density, or hydrodynamic volume is thus extremely complex and the useof a given technique does not provide polyelectrolytes of well-defined character-istics.
As indicated in Sec. IV.B.2, the adsorption kinetics can be described by themobile adsorption process which assumes the adsorbed polymer to be mobile onthe surface and desorbed when the equilibration solution is replaced by the sol-vent. Actually, the rate of the surface-to-solution transfer of the polyelectrolyteat constant composition of the system has not been investigated. Moreover, noth-ing is known about the interfacial exchange rate between polyelectrolytes of smalland high molecular weight.
Determination of the characteristics of polyelectrolytes sampled at the outletof a chromatographic column is very difficult and in this chapter we present someresults recently obtained in the separation by molecular weight of an equimolarmixture of two fractionated polyelectrolytes of molecular weight equal to1,057,000 (sample F1, x 10,067) and 78,000 (sample F2, x 743) [34].
1. Adsorption Profiles After Elution with a SolutionContaining Only One Polyelectrolyte
Due to relaxation phenomena of characteristic times τads and τdes defined by Eqs.(26) and (27), the adsorption on the column was studied under the two conditionsof incomplete and maximal coverage. In the first situation, the injection time wasshort, whereas in the second situation the injection time was of the order of τdes
in order to determine the influence of the fast interfacial relaxation in the adsorp-tion levels. In the two cases, the adsorption profiles were determined before andafter elution of the column by water at pH 3.0 in order to optimize the parameterof an efficient separation.
(a) Adsorption at Low Coverage. The sample F1 at the concentration of 1.05 1011 mol/mL is injected for 2.5 min at 1.5 mL/min. The column was analyzedfor content first. The experiment was repeated twice with solvent injection for 6and 9 min after polymer injection. Figure 35 shows the adsorption Ns as a functionof the filter number i, which appears to be only slightly affected by elution withsolvent. Clearly, the molecules adsorbed at the inlet of the column appear not tobe affected by the column washing, whereas the molecules adsorbed for a lowerperiod appear to be slightly desorbed by the solvent. Actually, the fact that thelines a–c start at the same level shows that all of the polymer being injected was
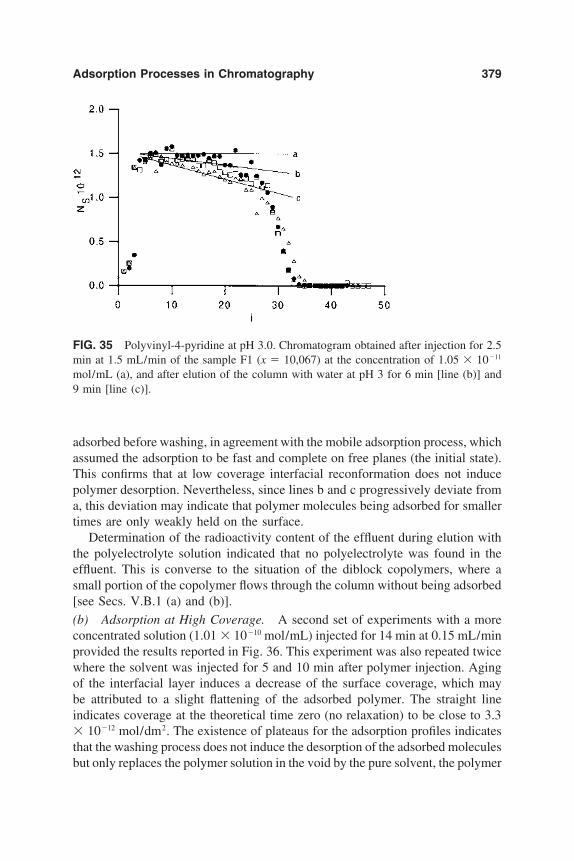
Adsorption Processes in Chromatography 379
FIG. 35 Polyvinyl-4-pyridine at pH 3.0. Chromatogram obtained after injection for 2.5min at 1.5 mL/min of the sample F1 (x 10,067) at the concentration of 1.05 1011
mol/mL (a), and after elution of the column with water at pH 3 for 6 min [line (b)] and9 min [line (c)].
adsorbed before washing, in agreement with the mobile adsorption process, whichassumed the adsorption to be fast and complete on free planes (the initial state).This confirms that at low coverage interfacial reconformation does not inducepolymer desorption. Nevertheless, since lines b and c progressively deviate froma, this deviation may indicate that polymer molecules being adsorbed for smallertimes are only weakly held on the surface.
Determination of the radioactivity content of the effluent during elution withthe polyelectrolyte solution indicated that no polyelectrolyte was found in theeffluent. This is converse to the situation of the diblock copolymers, where asmall portion of the copolymer flows through the column without being adsorbed[see Secs. V.B.1 (a) and (b)].
(b) Adsorption at High Coverage. A second set of experiments with a moreconcentrated solution (1.01 1010 mol/mL) injected for 14 min at 0.15 mL/minprovided the results reported in Fig. 36. This experiment was also repeated twicewhere the solvent was injected for 5 and 10 min after polymer injection. Agingof the interfacial layer induces a decrease of the surface coverage, which maybe attributed to a slight flattening of the adsorbed polymer. The straight lineindicates coverage at the theoretical time zero (no relaxation) to be close to 3.3 1012 mol/dm2. The existence of plateaus for the adsorption profiles indicatesthat the washing process does not induce the desorption of the adsorbed moleculesbut only replaces the polymer solution in the void by the pure solvent, the polymer

380 Pefferkorn et al.
FIG. 36 Polyvinyl-4-pyridine at pH 3.0. Chromatogram obtained after elution with sam-ple F1 (C0 1.01 1010 mol/mL; Jv 0.15 mL/min; t 13.5 min; JvC0 1.51 1011
mol/min): (), no solvent injection; after () 10 mL and () 15 mL solvent injection. Theline gives the surface coverage prior to polyelectrolyte reconformation.
desorption being only the result of the fast interfacial relaxation. Moreover, thepolyelectrolyte layer appears to be stabilized at the ‘‘end’’ of the relaxationprocess.
(c) Excluded Area for Samples F1 and F2. Figure 37a and b shows the adsorp-tion chromatograms obtained for experiments carried out using the parametersgiven in Table 7. After elution, the column is rapidly eluted with solvent to dis-place the excess polymer from the void. The amount of polymer adsorbed isexpressed in µg/dm2 in Fig. 37a and in mol/dm2 in Fig. 37b. Figure 38 showsthe chromatogram obtained after saturation of the column under conditions de-scribed in Table 8.
The difference in the adsorption amounts of 1 and 1.6 µg/dm2 observed inFig. 37a may result from the variation of the density of polymer chain segmentsalready existing in solution. This similar establishment of monolayers confirmsthat the full surface area of the glass fiber filter is available for adsorption ofboth samples. Actually, the experimental adsorption agrees with the value thatis calculated taking into account the molecular dimensions of the two polyelectro-lytes [31]. From Figs. 37 and 38 we conclude that polyelectrolyte F1 effectivelyoccupies an interfacial area nine-fold larger than sample F2. Therefore, to quanti-tatively interpret the chromatograms obtained for mixtures of F1 and F2, we referto results of numerical simulation of the mobile adsorption processes obtainedfor discs of radii 1 and 3.
Adsorption Processes in Chromatography 381
FIG. 37 Polyvinyl-4-pyridine at pH 3.0 Chromatograms obtained after elution with sam-ples F1 () and F2 () inducing a relatively low surface coverage. Representation of theadsorbed amount per filter (µg/dm2) (a) and (mol/dm2) (b) as a function of the filternumber i. The complementary experimental parameters are given in Table 7.
TABLE 7 Parameters of Experiments Reported in Fig. 37a and b
1011 C0 Jv 1011 JvC0 t (min)Sample (mol/mL) (mL/min) (mol/min) (injection)
F1 1.05 1.5 1.58 2.5F2 1.00 1.5 1.50 14

382 Pefferkorn et al.
FIG. 38 Polyvinyl-4-pyridine at pH 3.0. Chromatograms obtained after elution withsamples F1 () and F2 () inducing a relatively high surface coverage. Representationof the adsorbed amount per filter (mol/dm2) as a function of the filter number i. Thecomplementary experimental parameters are given in Table 8.
2. Adsorption Profiles After Elution with a SolutionContaining an Equimolar Mixture of Samples F1and F2
This experiment was duplicated and equimolar mixtures contained at once a ra-diolabeled sample of one polyelectrolyte and a nonlabeled sample of the other.Injection of mixtures at a total concentration of 2 1010 mol/mL at 0.15 mL/min for 15 min and rapid washing with solvent resulted in the histograms shownin Fig. 39. The solid line represents the previous situation of injection of F1. Theamount of polymer injected into the column corresponded to a full coverage ofabout 130 filters. This number should be compared to the 54 plates covered insimulation by small and large discs (Fig. 13). Since curve (c) in Fig. 13 revealscoadsorption of small and large discs on 17 plates, we investigated the typeof coverage on the equivalent 40 microfiber filters, where simulation predictedcoadsorption of fractions F1 and F2.
The results of Fig. 39 may be interpreted on the basis of the mobile adsorption
TABLE 8 Parameters of Experiments Reported in Fig. 38
1010 C0 Jv 1011 JvC0 t (min)Sample (mol/mL) (mL/min) (mol/min) (injection)
F1 1.01 0.15 1.51 14.5F2 1.48 1.5 2.22 5

Adsorption Processes in Chromatography 383
FIG. 39 Polyvinyl-4-pyridine at pH 3.0. Chromatograms after elution with an equimolarmixture of samples F1 () and F2 (). Representation of the number of moles adsorbedper filter (area 1 dm2) as a function of the filter number i. The parameter of the elutionfor each sample are as follows: C0 1.05 1010 mol/mL; Jv 0.15 mL/min; t 15min; JvC0 1.5 1011 mol/min. The line represents the situation of injection of F1 asgiven in Fig. 38.
model because adsorption of 0.17 1011 mol/dm2 effectively corresponds tothe maximum adsorption determined from experiments reported in Fig. 36. Onthe first filters, a slightly denser occupation by the polyelectrolyte F2 can benoted, as expected from Fig. 11 (top), curve (c). The plateaus indicate equaladsorption of polyelectrolytes F1 and F2 whereas, according to our simulation,the number of moles F2 was expected to be threefold greater than that of F1.This implied that the solution continuously flowing through the column is moreenriched in F2 than determined from simulation and, on the average, alwaysidentical to the mixture being injected into plate 1. Therefore, the surface cover-age and the number of large discs being adsorbed on plate 1 for injection of anequimolar mixture should be recovered on the successive plates because the in-jected mixture remained equimolar on the average. Figure 11 (bottom), curve (c)shows that the number of discs of radius 3 on plate 1 is only equal to 75% ofthe number corresponding to the plateau value, so that we expect that the maximalcoverage by polyelectrolyte F1 should not exceed 0.75 0.17 1011, i.e., 0.13 1011 mol/dm2.

384 Pefferkorn et al.
The unexpected adsorption of 0.17 1011 mol/dm2 experimentally deter-mined may be interpreted as follows: our schema reveals a situation of selectiveadsorption of large discs that only sets in when the total area allotted to a set ofadjoining small discs is large enough to allow adsorption of one large disc. There-fore, at any moment one large disc replaces the corresponding set of small discs,which again attempt to adsorb on the subsequent plates. Therefore, for selectivereversible adsorption, the situation will be similar on each plate and the histogramof the size exclusion chromatography will be flat. Similarly, one polyelectrolyteF1 may replace several adsorbed polyelectrolytes F2 when the positions of F2are distributed in such a way that the areas belonging to F2 and the interstitialareas are large enough. Conversely, when the area portions are too small to allowmobile adsorption of F1, the interfacial exchange is impeded. Maximal instanta-neous replacement of small polyelectrolytes by large ones should result from thein-plane mobility of the adsorbed polyelectrolytes.
This result lead us to propose an alternative interpretation for the desorptionobserved in Fig. 35, when solvent is used as elutant. If we assume that a fraction-ated sample may be characterized by a given mass polydispersity, when thissample is continuously supplied at the inlet of the column, adsorbed polyelectro-lytes of relatively lower molecular weight are progressively displaced toward thecolumn outlet to the benefit of polymers of larger molecular weight. Thus, wemay conclude that a continuous elution of the column by solvent progressivelydesorbs polyelectrolytes of lower molecular weight and that an efficient fraction-ation will result from the continuous elution with solvent.
VI. CONCLUSION
Concerning polymeric systems, the chromatographic technique most frequentlyused for fractionation by molecular weight is gel permeation chromatography.The fractionation is based on a sieve effect that excludes the large macromole-cules from the small pores, thus inducing an elution retardation proportional totheir hydrodynamic volume. In hydrodynamic chromatography, depletion at thewall of the largest macromolecules leads to retardation of small macromolecules.Field flow fractionation depends on the action of a field (centrifugal, electrical,thermal, or hydraulic) applied perpendicular to the channel flow, which givesrise to partitioning of the components into regions of different flow velocity. Inall of these techniques, the macromolecules are assumed not to interact with thesolid phase or the wall [41].
Usual two-dimensional gel chromatography or chromatographic fractionationmay serve to separate macromolecules having a low energy of interaction withthe gel phase or beads, such that macromolecules may be displaced by solventunder given conditions of temperature and solvent quality. Orthogonal chroma-tography combining two sizes of exclusion chromatography also relies on this

Adsorption Processes in Chromatography 385
principle. However, some limitation of the fractionation efficiency may resultfrom partial adsorption and partition effects [42].
Separation of macromolecules having a strong interaction with the solid phaseconstituted a very difficult challenge. This preliminary work aimed at determina-tion of the separation efficiency of surface area exclusion chromatography whensmall and large constituents compete in irreversible adsorption, assuming thatthe components reversibly or irreversibly adsorb on the stationary phase. Ourintention was to determine the conditions whereby random deposition of the dif-ferent species may induce a fractionation within the column. Different systemsmay benefit from such fractionation processes, essentially those combining hy-drophobic and electrical interactions with hydrogen bonding. Proteins may be-have in this manner, as may synthetic macromolecules which remain adsorbedeven when solvent is injected into the column [43].
Adsorption chromatography seems to be suited for analysis of such moleculesas surfactants and proteins, which may coexist in solution under different formsof molecular organization. Actually, since relaxation processes are able to affectthe structural composition of the flowing phase in the usual chromatographicmethods, such processes appear to not modify the solution composition and mo-lecular organization in adsorption chromatography.
REFERENCES
1. M. Muthukumar and A. Baumgartner, Macromolecules 22:1937 (1989).2. Y. Lipatov and L. M. Sergeeva, Adsorption of Polymers, (John Wiley and Sons,
New York, 1970.3. J. Feder, J. Theor. Biol. 87:237 (1980).4. E. L. Hinrichsen, J. Feder, and T. Jossang, J. Stat. Phys. 44:793 (1986).5. B. Senger, P. Schaaf, J. C. Voegel, A. Johner, A. Schmitt, and J. Talbot, J. Chem.
Phys. 97:3813 (1992).6. A. Elaissari, G. Chauveteau, C. Huguenard, and E. Pefferkorn, J. Colloid Interface
Sci. 173:221 (1995).7. R. H. Fowler and E. A. Guggenheim, Statistical Thermodynamics, Cambridge Uni-
versity Press, New York, 1939.8. W. Mayer and E. R. Tompkins. J. Am. Chem. Soc. 69:2866 (1947).9. E. Glueckauf, Trans. Faraday Soc. 51:34 (1955).
10. E. Glueckauf, Ion Exchange and Its Application, Society of Chemical Industry, Lon-don, 1955, p. 34.
11. P. J. Flory, Principles of Polymer Chemistry, Cornell University Press, Ithaca, NY,1953, Chapter 12.
12. A. Silberberg, J. Chem. Phys. 48:2835 (1968).13. E. Pefferkorn, A. Haouam, and R. Varoqui, Macromolecules 21:2111 (1988).14. D. Poland, Macromolecules 24:3361 (1991).15. Z. Adamczyk, B. Siwek, M. Zembala, and P. Belouschek, Adv. Colloid Interface
Sci. 48:151 (1994).

386 Pefferkorn et al.
16. G. Y. Onoda and E. G. Liniger, Phys. Rev. A 33:715 (1986).17. J. Feder, J. Theor. Biol. 87:237 (1980).18. A. Elaissari, A. Haouam, C. Huguenard, and E. Pefferkorn, J. Colloid Interface Sci.
149:68 (1992).19. W. H. Grant, L. E. Smith, and R. R. Stromberg, Faraday Discuss. Chem. 59:209
(1975).20. E. Pefferkorn, A. Haouam, and R. Varoqui, Macromolecules 222:2677 (1989).21. E. Pefferkorn, A. Carroy, and R. Varoqui, J. Polym. Sci.: Polym. Phys. Ed. 23:1997
(1985).22. R. K. Iler, The Chemistry of Silica, John Wiley and sons New York, 1979.23. A. A. Kamel, Ph.D. dissertation, Lehigh University, 1981, pp. 95–110.24. A. A. Kamel, M. S. El-Aasser, and J. W. Vanderhoff, J. Dispers. Sci. Technol. 2:
213 (1981).25. E. Pefferkorn, A. Carroy, and R. Varoqui, Macromolecules 18:2252 (1985).26. M. Fontanille and P. Sigwalt, C. Roy. Acad. Sci. 251:2947 (1960).27. C. Huguenard, A. Elaissari, and E. Pefferkorn, Macromolecules 27:5277 (1994).28. B. H. Zimm, J. Chem. Phys. 16:1093 (1948).29. E. Pefferkorn, Q. Tran, and R. Varoqui, J. Polym. Sci.: Polym. Chem. Ed. 19:27
(1981).30. C. Huguenard, R. Varoqui, and E. Pefferkorn, Macromolecules 24:2226 (1991).31. E. Pefferkorn and A. Elaissari, J. Colloid Interface Sci. 138:187 (1990).32. J. Widmaier, personal communication.33. C. M. Marques, J. F. Joanny, and L. Leibler, Macromolecules 21:1051 (1988).34. C. Huguenard, J. Widmaier, A. Elaissari, and E. Pefferkorn, Macromolecules 30:
1434 (1997).35. A. Johner and J. F. Joanny, Macromolecules 23:5299 (1990).36. A. Halperin and S. Alexander, Macromolecules 22:2403 (1989).37. E. Pefferkorn, A-C. Jean-Chronberg, and R. Varoqui, C. Roy. Acad. Sci. Paris, 308,
Serie II: 1203 (1989).38. E. Pefferkorn, A-C. Jean-Chronberg, and R. Varoqui, Macromolecules 23:1735
(1990).39. E. Pefferkorn and A. Elaissari, J. Colloid Interface Sci. 138:187 (1990).40. A. Elaissari and E. Pefferkorn, J. Colloid Interface Sci. 143:85 (1991).41. M. J. R. Cantow, Polymer Fractionation, Academic Press, New York, 1967.42. H. G. Barth and J. W. Mays, Modern Methods of Polymer Characterization, John
Wiley and Sons, New York, 1991.43. J. D. Andrade, Surface and Interfacial Aspects of Biomedical Polymers: Protein
Adsorption, Plenum Press, New York, 1985.

10Separation of Polymer Blends byInteraction ChromatographyHARALD PASCH Department of Polymer Analysis, German PlasticsInstitute, Darmstadt, Germany
I. Introduction 387
II. Liquid Chromatography of Polymer Blends 389A. Thermodynamic fundamentals 389B. Size exclusion chromatography 392C. Gradient HPLC 397D. Chromatography under limiting conditions of solubility 400
III. Separation of Polymer Blends by Liquid Chromatography at theCritical Point of Adsorption 403A. General relations 403B. Separation of binary blends of homopolymers 406C. Separation of blends of homo-and copolymers 415
IV. Analysis of Polymer Blends by Coupling Liquid Chromatographyand Selective Detectors 419A. Combination of LCCC and a viscometer detector 420B. Coupled liquid chromatography and FTIR spectroscopy 423
References 431
I. INTRODUCTION
Polymer blends are mixtures of two or more polymer components of differentchemical composition. They are of increasing commercial importance for a num-
387

388 Pasch
ber of applications, particularly in the construction and automotive industries.The advantage of polymer blends is the useful combination of the properties ofthe components without the creation of chemically new polymers. This approachin many cases is more feasible than developing new tailor-made polymer struc-tures. Two of many prominent blend systems are rubber-modified polystyrene,known as high-impact polystyrene, and mixtures of butyl rubber and styrene-butadiene copolymers for the production of car tires.
The chemical composition of polymer blends may be rather complex becauseas blend components homopolymers as well as copolymers may be used. Accord-ingly, binary polymer blends may be composed of two homopolymers, a homo-polymer and a copolymer, or two copolymers. In addition, very frequently com-patibilizers are used in technical blends due to the fact that most homopolymersare immiscible.
In view of the complexity of polymer blends, the following protocol can beformulated for polymer analysis:
Determination of the molar mass distribution (MMD) of the blendIdentification of the blend components and quantitative determination of the
blend compositionDetermination of the MMD of the blend componentsDetermination of the chemical composition of the blend components (in the case
of copolymers)
The identification and quantitative determination of blend components is compli-cated. Depending on the specific chemical structure a variety of different analyti-cal methods must be used. Spectroscopic methods such as Fourier transform in-frared spectroscopy (FTIR) and nuclear magnetic resonance (NMR) can help toidentify blend components. However, in many cases they are unable to answer thequestion of whether two chemical structures are combined to yield a copolymer ora blend or both. For example, in analyzing a rubber mixture one can identifystyrene and butadiene as the monomer units. However, using FTIR or NMRone is unable to say if the sample is a mixture of polystyrene (PS) and polybuta-diene (PB), or a copolymer of styrene and butadiene, or a blend of a styrene-butadiene copolymer and PB. For the last case, even the copolymer compositioncannot be determined just by running an FTIR or NMR spectrum.
In most cases, for the precise determination of the blend composition includingthe composition and MMD of the components a separation step is required. Onlyafter obtaining fractions comprising the different blend components can an analy-sis with regard to chemical composition and MMD be conducted. This chapterdiscusses different options to use liquid chromatography for the separation ofpolymer blends. It shows that optimum results can be obtained when selectiveseparation techniques are combined with selective detectors.

Separation of Polymer Blends by Chromatography 389
II. LIQUID CHROMATOGRAPHY OF POLYMERBLENDS
A. Thermodynamic Fundamentals
Chromatographic separation of macromolecules by size, chemical composition,or architecture relates to the selective distribution of the macromolecules betweenthe mobile and the stationary phase of a given chromatographic system. Thisdistribution process occurs multiple times within one chromatographic run, anddepending on the strength and type of the interactions, more or less resolvedcomponent peaks are obtained. The separation process is described by
VR V i VKd (1)
where VR is the retention volume of the solute, V i is the interstitial volume ofthe column, V is the volume of the packing, i.e., the ‘‘stationary’’ volume, andKd is the distribution coefficient, which is equal to the ratio of the analyte concen-tration in the stationary phase and in the mobile phase. Note that V can comprisethe pore volume Vp, surface area Va, or volume of chemically bonded ‘‘stationaryphase’’ on the packing Vstat, depending on the separation mode and type ofpacking.
Kd is a function of the change in Gibbs’ free energy ∆G related to the analytepartitioning between the mobile and the stationary phases [1].
∆G ∆H T∆S RT ln Kd (2)
Kd exp (∆S/R ∆H/RT) (3)
The change in Gibbs’ free energy may be due to different effects:
1. Inside the pore, which has limited dimensions, the macromolecule cannotoccupy all possible conformations and therefore the conformational entropy∆S decreases.
2. When penetrating the pores, the macromolecule may interact with the porewalls resulting in a change in enthalpy ∆H.
Depending on the chromatographic system and the chemical structure of the mac-romolecule, only entropic or enthalpic interactions, or both, may be operating.Therefore, in the general case the distribution coefficient may be expressed as:
Kd KSECKLAC (4)
where KSEC is based on entropic interactions, whereas KLAC characterizes the en-thalpic interactions. Depending on the magnitude of entropic and enthalpic ef-fects, the size exclusion mode (SEC, ∆S-driven) or the liquid adsorption mode(LAC, ∆H-driven) will be predominant.
In size exclusion chromatography, separation is accomplished with respect to

390 Pasch
the hydrodynamic volume of the macromolecules. The stationary phase is a swol-len gel with a characteristic pore size distribution, and depending on the size ofthe macromolecules a larger or lesser fraction of the pores is accessible to themacromolecules.
In ideal SEC, separation is exclusively directed by conformational changes ofthe macromolecules and ∆H by definition is zero. Thus:
Kd KSEC exp (∆S/R) (5)
Since the conformational entropy decreases (∆S 0), the distribution coefficientof ideal SEC is KSEC 1. The maximum value, KSEC 1, is related to zerochange in conformational entropy, i.e., to a situation where all of the pore volumeis accessible to the macromolecules (separation threshold). At KSEC 0, the ana-lyte molecules are too large to penetrate the pores (exclusion limit). Accordingly,the separation range is 0 KSEC 1.
The retention volume for ideal SEC is
VR V i VpKd V i VpKSEC (6)
If enthalpic effects, due to electrostatic interactions between macromolecules andthe pore walls, have to be taken into account, the distribution coefficient Kd ofreal SEC is as follows:
Kd exp(∆S/R ∆H/RT) exp(∆S/R) exp(∆H/RT) KSECKLAC (7)
In this case, the retention volume is a function of KSEC and KLAC. If electrostaticinteractions occur at the outer surface of the stationary phase as well, an additionalterm VstatKLAC has to be accounted for.
In adsorption chromatography (LAC), where separation is directed by adsorp-tive interactions between the macromolecules and the stationary phase, an idealand a real case may be defined as well. In ideal LAC conformational changesare assumed to be zero (∆S 0) and the distribution coefficient is exclusivelydetermined by enthalpic effects.
Kd KLAC exp(∆H/RT) (8)
Depending on the pore size of the stationary phase two possible cases have tobe discussed:
1. For narrow-pore stationary phases, separation occurs exclusively at the outersurface. The pores are not accessible to the macromolecules (KSEC 0).Accordingly, the retention volume is a function of the interstitial volume andthe volume of the stationary phase (Vstat):
VR Vi VstatKLAC (9)

Separation of Polymer Blends by Chromatography 391
2. If the solute can freely penetrate the pore volume of the stationary phase(KSEC 1), the pore volume adds to the interstitial volume.
VR V i Vp VstatKLAC (10)
In real LAC only a fraction of the pores of the packing is accessible and thereforeentropic interactions must be assumed. Accordingly, the distribution coefficientis a function of ∆H and ∆S (compare to real SEC). The retention volume nowis a function of enthalpic interactions at the surface of the packing, entropic ef-fects owing to the limited dimensions of the pores, and possible electrostaticinteractions inside the pores. Therefore, the expression for VR in real LAC isformally similar to that in real SEC:
VR V i Vp(KSECKLAC) VstatKLAC (11)
As the enthalpic interactions are based on a multiple attachment mechanism, itis clear that the retention volume increases with increasing molar mass [2].
Real SEC and real LAC are often mixed mode chromatographic methods withpredominance of entropic or enthalpic interactions. With chemically heteroge-neous polymers, effects are even more dramatic because exclusion and adsorptionact differently on molecules of different composition.
In a more general sense, the size exclusion mode of liquid chromatographyrelates to a separation regime whereby entropic interactions are predominant, i.e.,T ∆S ∆H. In the reverse case, ∆H T ∆S, separation is mainly directed byenthalpic interactions. As both separation modes in the general case are affectedby the macromolecule size and the pore size, a certain energy of interaction εmay be introduced, characterizing the specific interactions of the monomer unitof the macromolecule and the stationary phase. ε is a function of the chemicalcomposition of the monomer unit, the composition of the mobile phase of thechromatographic system, the characteristics of the stationary phase, and the tem-perature. The theory of adsorption at porous adsorbents predicts the existenceof a finite critical energy of adsorption εc, where the macromolecule starts toadsorb at the stationary phase. Thus, at ε εc the macromolecule is adsorbed,whereas at ε εc the macromolecule remains unabsorbed. At ε εc the transitionfrom the unabsorbed to the adsorbed state takes place, corresponding to a transi-tion from SEC to adsorption. This transition is termed ‘‘critical point of adsorp-tion’’ and relates to a situation where the adsorption forces are exactly compen-sated by entropy losses [3,4].
T ∆S ∆H (12)
∆G 0 (13)
Accordingly, at the critical point of adsorption the Gibbs free energy is constantand the distribution coefficient is Kd 1, irrespective of the molar mass of the

392 Pasch
FIG. 1 Chromatographic behavior molar mass versus retention volume in the threemodes of liquid chromatography: size exclusion (SEC), critical mode (CC), and liquidadsorption (LAC).
macromolecules and the pore size of the stationary phase. The molar mass versusretention volume behaviour in the critical mode of liquid chromatography is sche-matically represented in Fig. 1 in comparison to SEC and LAC. The criticalpoint of adsorption relates to a very narrow range between the size exclusionand adsorption modes of liquid chromatography, a region very sensitive to tem-perature and mobile phase composition.
The transition from one to another chromatographic separation mode bychanging the temperature or the composition of the mobile phase for the firsttime was reported by Tennikov et al. [5] and Belenkii et al. [6,7]. They showedthat a sudden change in elution behavior may occur by small variations in thesolvent strength. Thus, just by changing the eluent composition gradually, a tran-sition from the SEC to the LAC mode and vice versa may be achieved. The pointof transition from SEC to LAC is the critical point of adsorption and chromato-graphic separations at this point are termed liquid chromatography at the criticalpoint of adsorption (LCCC).
B. Size Exclusion Chromatography
SEC is the most commonly used method for the determination of MMD of poly-mers. It separates macromolecules with respect to their hydrodynamic volume,and, using an appropriate calibration, the hydrodynamic volume of homopolymermolecules can be directly correlated with chain length. However, when analyzing
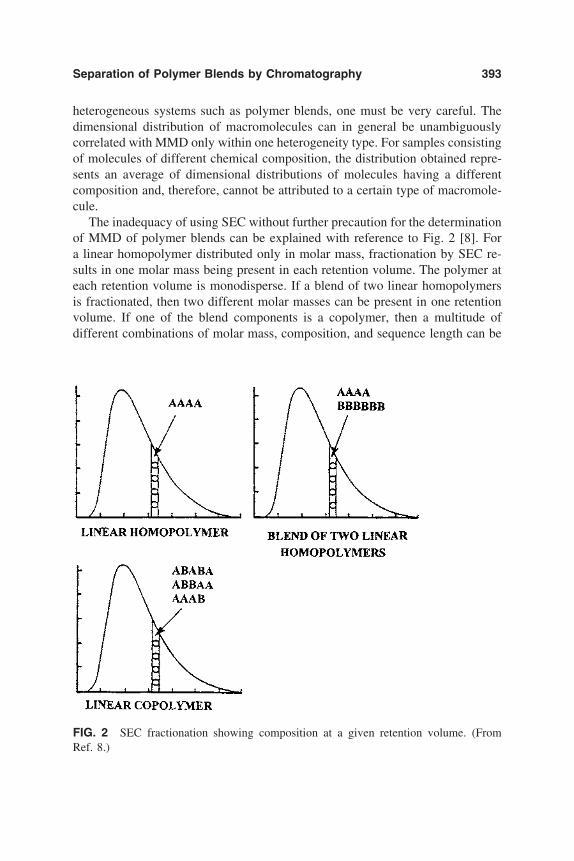
Separation of Polymer Blends by Chromatography 393
heterogeneous systems such as polymer blends, one must be very careful. Thedimensional distribution of macromolecules can in general be unambiguouslycorrelated with MMD only within one heterogeneity type. For samples consistingof molecules of different chemical composition, the distribution obtained repre-sents an average of dimensional distributions of molecules having a differentcomposition and, therefore, cannot be attributed to a certain type of macromole-cule.
The inadequacy of using SEC without further precaution for the determinationof MMD of polymer blends can be explained with reference to Fig. 2 [8]. Fora linear homopolymer distributed only in molar mass, fractionation by SEC re-sults in one molar mass being present in each retention volume. The polymer ateach retention volume is monodisperse. If a blend of two linear homopolymersis fractionated, then two different molar masses can be present in one retentionvolume. If one of the blend components is a copolymer, then a multitude ofdifferent combinations of molar mass, composition, and sequence length can be
FIG. 2 SEC fractionation showing composition at a given retention volume. (FromRef. 8.)

394 Pasch
combined to give the same hydrodynamic volume. In this case, fractionation withrespect to molecular size is completely ineffective in assisting the analysis ofcomposition or MMD.
For demonstration, the SEC behavior of different polymethacrylates is givenin Fig. 3. On silica gel as the stationary phase and methyl ethyl ketone as theeluent all polymethacrylates elute in the conventional SEC mode. The calibrationcurves of elution volume versus molar mass for polymethyl methacrylate(PMMA), poly-t-butyl methacrylate (PtBMA), poly-n-butyl methacrylate(PnBMA), and polydecyl methacrylate (PDMA) reflect the inability of the systemto separate different polymethacrylates of similar molar mass. Samples of molarmass of about 100,000 g/mol would elute at elution volumes of 3.08 mL(PnBMA), 3.21 mL (PtBMA), 3.32 mL (PDMA), and 3.43 mL (PMMA). Sincethe peak width of a narrow disperse sample is about 0.5 mL, even PnBMA and
FIG. 3 SEC calibration curves of molar mass versus elution volume for different poly-methacrylates. Stationary phase: LiChrospher 300 1000 A, eluent: methyl ethyl ketone.

Separation of Polymer Blends by Chromatography 395
PMMA could not be separated into two individual peaks. In terms of molar massdifferences the following situation is apparent for the separation of a mixture ofPMMA having a molar mass of 200,000 g/mol and other polymethacrylates intotwo elution peaks (distance of the elution peak maxima shall be an elution volumeof 0.5 mL), it is necessary that the molar mass of the second component be lessthan 32,000 g/mol and 65,000 g/mol for PnBMA and PDMA, respectively.
A more feasible approach to the analysis of polymer blends by SEC is thecombination of separation by size with multiple detection. SEC with dual detec-tion is known to provide information on the composition at any point of theelution curve [9–13]. This requires two detectors with sensitivities to the compo-nents that are sufficiently different, or a detector that can measure two variablessimultaneously, such as a diode array photometer or an infrared detector [14,15].For practical reasons, this technique has been applied mostly to UV-absorbingpolymers because the use of an IR flow-through detector cell is rather limiteddue to the absorption of the eluent [16].
The common combination of the refractive index (RI) with the UV detectorcan, however, only be applied if at least one of the monomers absorbs a suitablewavelength and if the UV spectra of both components are sufficiently different.Successful applications of this setup are the analysis of mixtures of PS withPMMA, PB, PVC, or PtBMA. The RI detector provides the total elution profile,whereas the UV detector yields the elution profile of PS. Substracting the latterfrom the former, the elution profile of the nonabsorbing component can be gener-ated.
For polymer systems without UV activity the combination of the RI detectorwith a density detector can be used. The working principle of the density detectoris based on the mechanical oscillator method. Since this detector yields a signalfor every polymer, provided that its density is different from the density of themobile phase, this detector can be regarded as universal [17–19]. The separationof mixtures of PS and PB by SEC with dual-density RI detection is presentedin Figs. 4 and 5. In a first set of experiments, the response factors of both polymersin the two detectors have to be determined. Then, from the intensity of each sliceof the elution curves in both detectors, the mass distribution of both polymersalong the elution volume axis can be calculated.
As can be seen in Fig. 4, a separation into the component peaks is obtaineddue to the fact that the molar masses of PS and PB are sufficiently different. Forboth components the individual elution profiles can be determined and usingcorresponding calibration curves for PS and PB the individual MMDs can becalculated. The same information can be extracted from an experiment, wherethe molar masses of the components are similar and SEC separation does notwork (see Fig. 5). Again the individual mass distributions are obtained and theMMDs for PS and PB can be determined.
The limitation of SEC with dual detection is that only binary blends of homo-
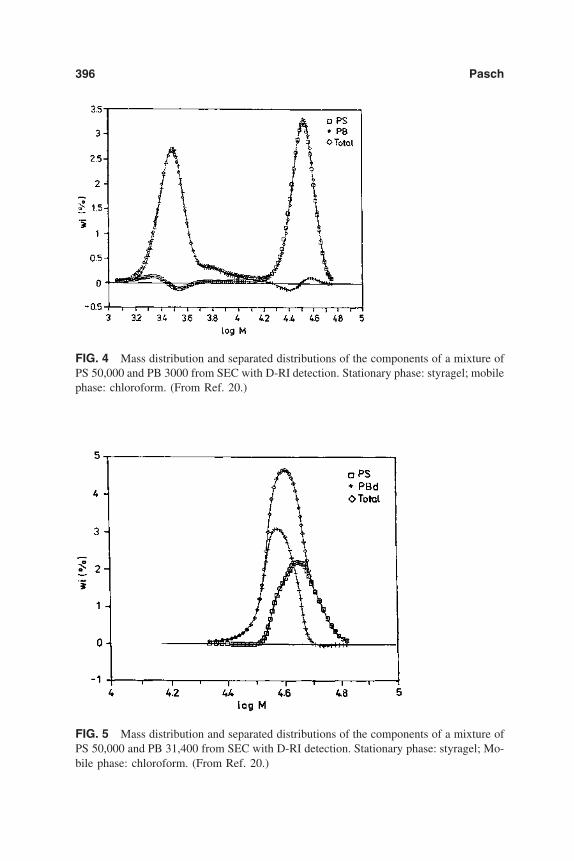
396 Pasch
FIG. 4 Mass distribution and separated distributions of the components of a mixture ofPS 50,000 and PB 3000 from SEC with D-RI detection. Stationary phase: styragel; mobilephase: chloroform. (From Ref. 20.)
FIG. 5 Mass distribution and separated distributions of the components of a mixture ofPS 50,000 and PB 31,400 from SEC with D-RI detection. Stationary phase: styragel; Mo-bile phase: chloroform. (From Ref. 20.)

Separation of Polymer Blends by Chromatography 397
polymers can be investigated successfully. In the case of ternary blends, morethan two detectors must be used or one of the detectors must be able to detecttwo components simultaneously. For blends of homopolymers and copolymersthis approach cannot be used because the copolymer itself is chemically heteroge-neous.
C. Gradient HPLC
Apart from using entropic interactions to promote separation as in SEC, enthalpicinteractions or a combination of entropic and enthalpic interactions can be usedfor separating polymer blends. In particular, enthalpic interactions of the solutemolecules and the stationary phase may be used for the separation of copolymersand polymer blends with respect to chemical composition. For stationary phasesof a certain polarity, very specific precipitation/redissolution processes are ableto promote such separations. Using solvent mixtures as the mobile phase, theprecipitation/redissolution equilibria may be adjusted to a specific retention be-havior.
Polymer samples that are rather homogeneous in chemical nature and chainlength can be eluted isocratically, meaning that the composition of the mobilephase is constant throughout the chromatographic run. If, however, the sampleconsists of species of different chemical composition, isocratic elution cannot beapplied because the different species exhibit retention properties that vary toomuch. For example, in a given chromatographic system one component could beirreversibly adsorbed due to very strong enthalpic interactions, whereas anothercomponent could elute without being retained. By changing the composition ofthe mobile phase during the chromatographic run, the solubility and the enthalpicinteractions of the sample components may be changed. Thus, using gradientelution techniques, the polymer sample may be fractionated with respect to com-position over a very broad range of different compositions. Gradient elution inthe normal phase mode requires the use of a polar stationary phase together witha gradient whose polarity increases in the course of the run. In the reversed phasemode of gradient elution a nonpolar stationary phase is combined with a gradientwhose polarity decreases in the course of the run.
Very frequently, precipitation processes are intentionally used for the separa-tion according to chemical composition. In this case the initial mobile phase isa nonsolvent for one component, which precipitates on the top of the column,while the other component is eluted. By increasing the solvent strength, the ini-tially precipitated component is also recovered. If the polarity of the stationaryphase has no effect on elution, adsorption of the redissolved macromolecules onthe stationary phase can be excluded, and separation is solely governed by solu-bility. An overview on different techniques is given in a number of reviews[1,21–23].

398 Pasch
Various modifications of gradient HPLC of polymers have been described inthe literature, which differ mainly in the nature of gradient employed. In manycases it is not possible to judge whether a certain separation occurs solely byadsorption or whether entropic interactions are involved. Also, the extent of pre-cipitation involved cannot be completely predicted. The composition of the mo-bile phase at which a given sample is dissolved can be determined by turbidimet-ric titration [1,24–26].
Most of the work in gradient HPLC of polymers was conducted with respectto chemical composition analysis of copolymers. One of the first separationsof random copolymers was carried out by Teramachi et al. [27]. Mixtures ofpoly(styrene-co-methyl acrylate)s were separated by composition on silica col-umns through a carbon tetrachloride/methyl acetate gradient. When increasingthe content of methyl acetate in the eluent, retention increased with increasingmethyl acrylate content in the copolymer. Similar separations could be achievedon other columns as well, including polar bonded-phase columns (diol, nitrile,amino columns) [1]. Other applications have been published by Glockner, Mori,Schunk, and others, showing the usefulness of gradient HPLC [28–43].
Compared to random copolymers, a rather limited amount of work has beendevoted to mixtures of homopolymers. The separation of mixtures of poly(meth)-acrylates by gradient HPLC has been successfully conducted by Mourey [44].The effect of the alkoxy group on the retention behavior of the poly(meth)acry-lates provided the chance of separating different (meth)acrylate homopolymersthrough normal phase gradient elution. Figure 6A shows the separation of poly-methacrylate esters on silica gel using a toluene–methyl ethyl ketone gradient.As was expected from the polarity of the alkoxy group, polybutyl methacrylatewas less retained than polymethyl methacrylate. The same sequence holds forpolyacrylates; see Fig. 6B. From the chromatograms the composition of the sam-ples may be quantitatively determined. As in this case separation is accomplishedwith respect to chemical composition and not molar mass, a second chromato-graphic method must be used for the determination of the MMD of the chromato-graphic fractions.
The fractionation of polymer blends by multiple solvent gradient elution wasdiscussed by Jansen et al. [45]. Following the precipitation of the blends ina nonsolvent, fractionation was achieved according to solubility by multiple sol-vent elution with increasing solvent power. Reproducible baseline resolvedfractionation of some commercial blends was obtained, including blends ofpolyphenylene oxide/polystyrene (PPO/PS) and ethylene-propylene-dienecopolymer/polystyrene (EPDM/PS) (see Fig. 7). In the first case a mobile phaseof isooctane-THF-chloroform was used, whereas in the second case methanol-toluene formed the mobile phase.
Precipitation chromatography was used by Mori for the identification of poly-mer components in mixtures [46]. He injected PS, PVC, polyvinyl acetate, and

Separation of Polymer Blends by Chromatography 399
FIG. 6 Separation of polymethacrylates (A) and polyacrylates (B) by gradient HPLC.Stationary phase: silica gel, mobile phase: toluene–methyl ethyl ketone. (From Ref. 44.)
various polymethacrylates onto a silica column and eluted with different solvents,including THF, chloroform, ethyl acetate, methanol, etc. Depending on the solu-bility of a specific component, this component was eluted or retained in the col-umn with a specific solvent. By testing different solvents, different polymer com-ponents were eluted and could be identified by their solubility. An extensivestudy on the correlation of retention times, cloud points, and solubility parametershas been published recently by Staal [47]. He investigated the chromatographicbehavior of PS, PMMA, and PB in different eluents and discussed the mechanismof separation and possibilities of predicting the elution behavior.
The characterization of polymer mixtures by temperature-rising gradientHPLC was published by Lee and Chang [48]. Using a C18 reversed phase and

400 Pasch
FIG. 7 Gradient HPLC separation of PPO/PS (A) and EPDM/PS blends (B). (FromRef. 45.)
an eluent of methylene chloride–acetonitrile 57:43% (v/v) the authors were ableto separate a mixture of 5 PMMA and 11 PS calibration standards, see Fig. 8(Table 1). Keeping the composition of the mobile phase constant, the temperaturewas increased from 5°C to 45 °C within the chromatographic run. The PMMAsamples eluted before the PS samples in the order of decreasing molar masses,whereas PS eluted in the order of increasing molar masses. Obviously, both sizeexclusion and adsorption mechanisms are responsible for this type of separation.
D. Chromatography Under Limiting Conditions ofSolubility
This type of liquid chromatography of polymers refers to a situation where themacromolecules move with the solvent zone and elute at the ‘‘limit’’ of their

Separation of Polymer Blends by Chromatography 401
FIG. 8 Temperature gradient HPLC analysis of a set of 11 PS and 5 PMMA standards.Stationary phase: Nucleosil-C18 100 500 1000 A; mobile phase: CH2Cl2-ACN 57:43% (v/v). Temperature program as indicated.
solubility. The limiting conditions of solubility are achieved when the polymersample is dissolved in a thermodynamically good solvent and injected in a mobilephase that is a weak nonsolvent for the polymer. In this case, homopolymerswith different molar masses elute from the chromatographic column at the sameretention volume, which is roughly equal to the volume of liquid in the column.Accordingly, under limiting conditions of solubility there is no separation ac-
TABLE 1 PMMA and PS Standards Separated by Temperature Gradient HPLC
Code Polymer Mw (g/mol) Code Polymer Mw (g/mol)
1 PMMA 1,500,000 d PS 22,0002 PMMA 501,000 e PS 37,3003 PMMA 77,500 f PS 68,0004 PMMA 8,500 g PS 114,0005 PMMA 2,000 h PS 208,000a PS 1,700 i PS 502,000b PS 5,100 j PS 1,090,000c PS 11,600 k PS 2,890,000

402 Pasch
cording to molar mass, and the method can be applied to separations based onother properties of the polymer sample [49–51].
The following mechanism is suggested by Berek et al. to cause the limitingcondition phenomena [52]: At low levels of nonsolvent, the calibration curvesshift slightly to lower retention volumes due to the suppression of adsorptionand a reduced effective pore size of the column packing. At higher quantities ofnonsolvent, in the vicinity of the θ-composition, the thermodynamic quality ofthe solvent is strongly reduced. If such a mixture is used as the eluent and theinjected polymer is dissolved in a good solvent, the macromolecules move to-gether with the zone of their initial solvent. If macromolecules move faster dueto exclusion processes, they encounter the nonsolvent and precipitate. As theinjection zone (good solvent) reaches the precipitated macromolecules, they re-dissolve and move with the injection zone. This ‘‘microgradient’’ process of
FIG. 9 Elution of polystyrene and solvent in a limiting condition experiment using RIand ELSD detection. (From Ref. 54.)

Separation of Polymer Blends by Chromatography 403
precipitation/redissolution occurs multiple times with the polymer eluting just inthe front part of the solvent zone (Fig. 9). As a consequence, the macromoleculesmove with a velocity similar to that of the solvent zone and elute at the limit oftheir solubility. Because the polymer elutes very close to the solvent peak, anevaporative light scattering detector (ELSD) must be used to ‘‘see’’ the polymerpeak.
So far, limiting conditions have been reported for PS, PMMA, and polyvinylacetate [53,54]. Using this technique, blends of PS and PMMA have been sepa-rated on silica gel as the stationary phase and THF-n-hexane 82:18% (v/v) asthe limiting condition eluent. In this case, PS elutes under SEC conditions withits MMD correctly estimated, whereas PMMA elutes at limiting conditions. Fur-ther, it has been shown that under limiting conditions of solubility the tacticityof macromolecules can be estimated [55].
III. SEPARATION OF POLYMER BLENDS BY LIQUIDCHROMATOGRAPHY AT THE CRITICAL POINTOF ADSORPTION
A. General Relations
As was already pointed out in Sec. II.A, LCCC refers to a situation wherethe entropy losses exactly compensate the adsorptive interactions in the chro-matographic system. At the critical point of adsorption, the Gibbs free energyis constant and the distribution coefficient Kd is 1, irrespective of the molarmass of the macromolecules. Under these conditions, all homopolymer mole-cules of the same chemical structure elute at the same retention volume andseparation is accomplished with respect to other types of molecular heteroge-neity, including chemical composition, functionality, and molecular architecture[56–58]. LCCC has been successfully used for the determination of the function-ality type distribution of telechelics and macromonomers [59–65], for the analy-sis of block copolymers [66–71], and for the separation of macrocyclic polymers[72].
The general behavior of a binary blend in different chromatographic modesis summarized in Fig. 10 [73]. When separating with respect to chain length, theretention behavior for both blend components is very similar in the size exclusionand the adsorption modes, and the calibration curves log molar mass versus reten-tion time suggest that in these cases normally one retention time corresponds totwo molar masses (one molar mass on each calibration curve). Thus, for compara-ble molar masses of the components an overlapping of the elution zones is ob-tained. Accordingly, a sufficient separation of the components using SEC or ad-sorption chromatography may be achieved only when their molar masses arequiet different.

404 Pasch
FIG. 10 Behavior of the calibration curves log molar mass versus retention time of abinary polymer blend in the three chromatographic modes. (From Ref. 73.)
A completely different behavior of the blend components is obtained whenchromatographic conditions are used, corresponding to the critical mode ofone of the components. In this case, the elution zones are separated from eachother over the entire molar mass range, and separation is achieved even for com-ponents of similar molar mass. This type of separation holds much promise forthe development of general separation schemes of polymer blends. With chro-matographic conditions corresponding to the critical point of component 2, sepa-ration should be possible in any case. In addition, since component 1 is elutedin the SEC mode, its molar mass distribution can be determined. Changing thechromatographic system to the critical point of component 1, one can analyzecomponent 2 with respect to its MMD.
From a thermodynamic point of view, the total change in the Gibbs free energyof a binary blend An Bm can be regarded as the sum of the contributions ofthe components An and Bm.
∆GAB (nA∆GA nB∆GB) (14)
As specific interactions between components A and B are usually negligible inthe chromatographic system, an interaction parameter χAB must not be introduced
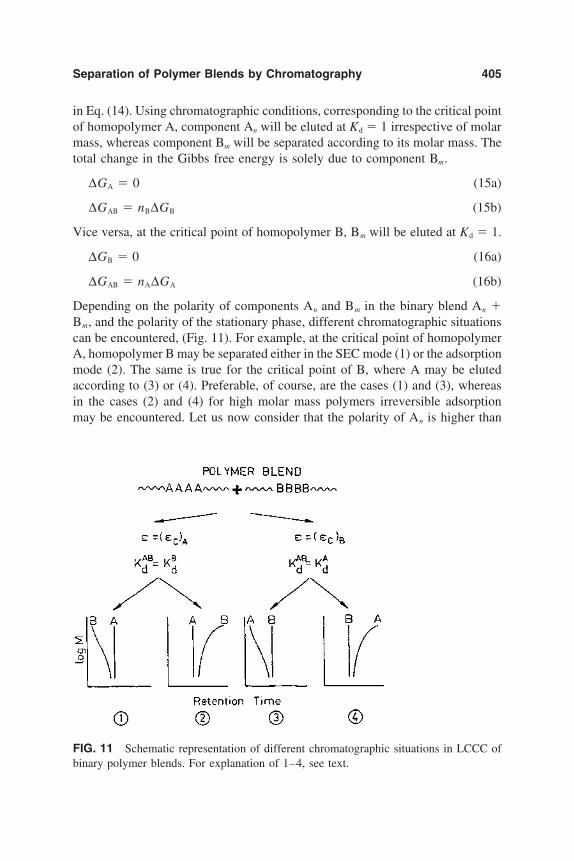
Separation of Polymer Blends by Chromatography 405
in Eq. (14). Using chromatographic conditions, corresponding to the critical pointof homopolymer A, component An will be eluted at Kd 1 irrespective of molarmass, whereas component Bm will be separated according to its molar mass. Thetotal change in the Gibbs free energy is solely due to component Bm.
∆GA 0 (15a)
∆GAB nB∆GB (15b)
Vice versa, at the critical point of homopolymer B, Bm will be eluted at Kd 1.
∆GB 0 (16a)
∆GAB nA∆GA (16b)
Depending on the polarity of components An and Bm in the binary blend An Bm, and the polarity of the stationary phase, different chromatographic situationscan be encountered, (Fig. 11). For example, at the critical point of homopolymerA, homopolymer B may be separated either in the SEC mode (1) or the adsorptionmode (2). The same is true for the critical point of B, where A may be elutedaccording to (3) or (4). Preferable, of course, are the cases (1) and (3), whereasin the cases (2) and (4) for high molar mass polymers irreversible adsorptionmay be encountered. Let us now consider that the polarity of An is higher than
FIG. 11 Schematic representation of different chromatographic situations in LCCC ofbinary polymer blends. For explanation of 1–4, see text.

406 Pasch
the polarity of Bm. In this case, chromatographic behavior according to (1) isachieved, when silica gel is used as the stationary phase (silica gel separates inthe order of increasing polarity). On the other hand, separation according to (3)is obtained on a reversed phase, such as RP-8 or RP-18 (separation in the orderof decreasing polarity).
B. Separation of Binary Blends of Homopolymers
Blends of PS and PMMA are very common model systems. Depending on thepreparation procedure they form immiscible blends of different morphology.Since the hydrodynamic volumes of PS and PMMA are rather similar, it is notpossible to separate blends of them by SEC when the molar masses of the compo-nents are close to each other. Therefore, critical chromatography shall be usedto separate PS-PMMA blends. Following the discussion on elution behavior asa function of column polarity (see Fig. 11), different stationary phases must beselected for establishing the critical points of PS and PMMA, respectively. SincePMMA is the more polar component, a polar (silica gel) column is chosen forestablishing its critical point. PS is then eluted in the SEC mode. For establishingthe critical point of PS, however, a reversed stationary phase must be used.PMMA is eluted in the SEC mode under these conditions.
The behavior of PMMA of different molar masses on silica gel in eluentscomprising methyl ethyl ketone (MEK) and cyclohexane is given in Fig. 12A.At concentrations of MEK 73% by volume the SEC mode is operating, whereasat concentrations 73% by volume of MEK, adsorption takes place. The criticalpoint of PMMA is obtained at an eluent composition of MEK-cyclohexane 73:27% (v/v). At this point, all PMMA samples are eluted at the same retentiontime irrespective of their molar mass. Depending on the size of the macromole-cules under investigation, similar to conventional SEC the pore size of the station-ary phase has to be adjusted to the desired molar mass range. Thus, for highermolar mass samples the investigations must be carried out on column sets withlarger pores (see Fig. 12B for a two-column set of silica gel with pores sizes of300 and 1000 A). For these columns the critical point of PMMA corresponds toa mobile phase composition of MEK-cyclohexane 70:30% (v/v).
For establishing the critical point of PS, a reversed phase Nucleosil RP-18 isused (Fig. 13). The figure indicates that at concentrations of (THF) 88% byvolume, separation is predominantly driven by entropic effects and the SEC modeis operating. In contrast, the LAC mode with predominantly enthalpic interactionsis operating at concentrations of THF 87% by volume in the eluent. The criticalpoint of adsorption of PS is obtained at an eluent composition of THF–water88.8 :11.2% (v/v). At this point, all PS samples regardless of their molar masselute at one retention time. This, by definition, indicates, that the PS polymer

Separation of Polymer Blends by Chromatography 407
FIG. 12 Critical diagrams molar mass versus retention time of PMMA. Stationary phase:Nucleosil Si-100 (A) or LiChrospher Si-300 Si 1000 (B). Mobile phase: MEK-cyclohexane. (From Ref. 67.)
chain is ‘‘chromatographically invisible,’’ i.e., does not contribute to retention.Accordingly, using these chromatographic conditions, blends of PMMA and PScan be analyzed with respect to the PMMA component.
For higher molar mass samples the investigations must be carried out on col-umn sets with larger pores; see Fig. 13B for a two-column set of RP-18 300 1000 A. For this column set, critical conditions were found to be operating atan eluent composition of THF–water 88.1:11.9% by volume.
In a first set of experiments, PS-PMMA blends are separated under chromato-graphic conditions, corresponding to the critical point of PS. By the use of
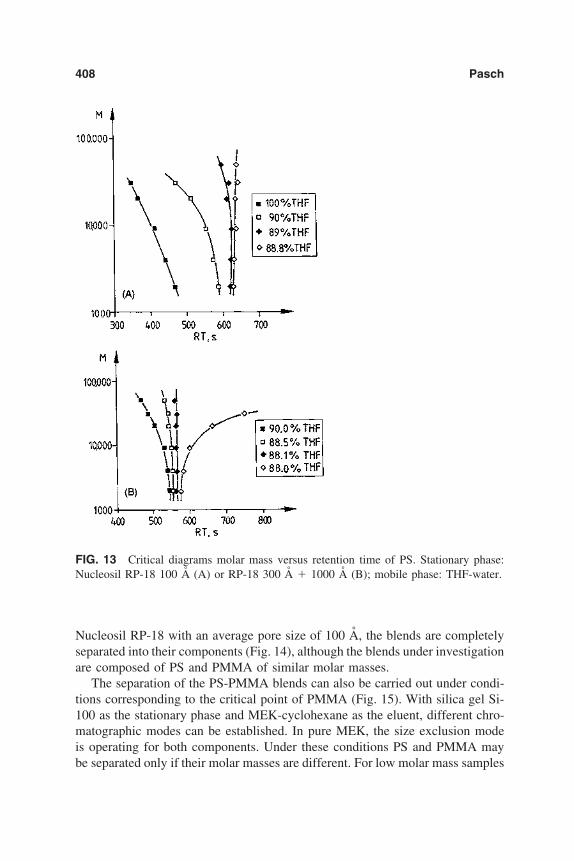
408 Pasch
FIG. 13 Critical diagrams molar mass versus retention time of PS. Stationary phase:Nucleosil RP-18 100 A (A) or RP-18 300 A 1000 A (B); mobile phase: THF-water.
Nucleosil RP-18 with an average pore size of 100 A, the blends are completelyseparated into their components (Fig. 14), although the blends under investigationare composed of PS and PMMA of similar molar masses.
The separation of the PS-PMMA blends can also be carried out under condi-tions corresponding to the critical point of PMMA (Fig. 15). With silica gel Si-100 as the stationary phase and MEK-cyclohexane as the eluent, different chro-matographic modes can be established. In pure MEK, the size exclusion modeis operating for both components. Under these conditions PS and PMMA maybe separated only if their molar masses are different. For low molar mass samples
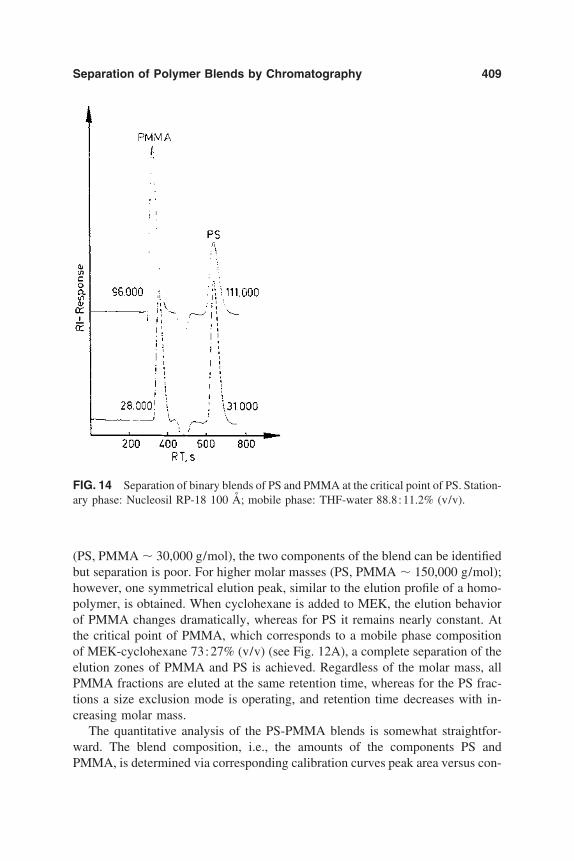
Separation of Polymer Blends by Chromatography 409
FIG. 14 Separation of binary blends of PS and PMMA at the critical point of PS. Station-ary phase: Nucleosil RP-18 100 A; mobile phase: THF-water 88.8:11.2% (v/v).
(PS, PMMA 30,000 g/mol), the two components of the blend can be identifiedbut separation is poor. For higher molar masses (PS, PMMA 150,000 g/mol);however, one symmetrical elution peak, similar to the elution profile of a homo-polymer, is obtained. When cyclohexane is added to MEK, the elution behaviorof PMMA changes dramatically, whereas for PS it remains nearly constant. Atthe critical point of PMMA, which corresponds to a mobile phase compositionof MEK-cyclohexane 73:27% (v/v) (see Fig. 12A), a complete separation of theelution zones of PMMA and PS is achieved. Regardless of the molar mass, allPMMA fractions are eluted at the same retention time, whereas for the PS frac-tions a size exclusion mode is operating, and retention time decreases with in-creasing molar mass.
The quantitative analysis of the PS-PMMA blends is somewhat straightfor-ward. The blend composition, i.e., the amounts of the components PS andPMMA, is determined via corresponding calibration curves peak area versus con-

410 Pasch
FIG. 15 Chromatograms of PS-PMMA blends in the SEC (A) and in the critical mode(B). Stationary phase: Nucleosil Si-100; mobile phase: MEK-cyclohexane 100:0 (A) or73:27% (v/v) (B).
centration. This determination can be conducted under critical conditions ofPMMA, as well as at critical conditions of PS. The determination of the MMDof the blend components is carried out using conventional SEC calibration proce-dures. Separating the blend under critical conditions of PS, one can elute andquantify the PMMA in the SEC mode. When the blend is separated under criticalconditions of PMMA, the PS is eluted in the SEC mode and its MMD is calcu-lated via a conventional PS calibration curve.
It is known that using a refractive index detector in SEC, very frequently anegative peak is observed at the end of the chromatogram. This ‘‘solvent peak’’or ‘‘system peak’’ is due to preferential adsorption, residual water, or impurities
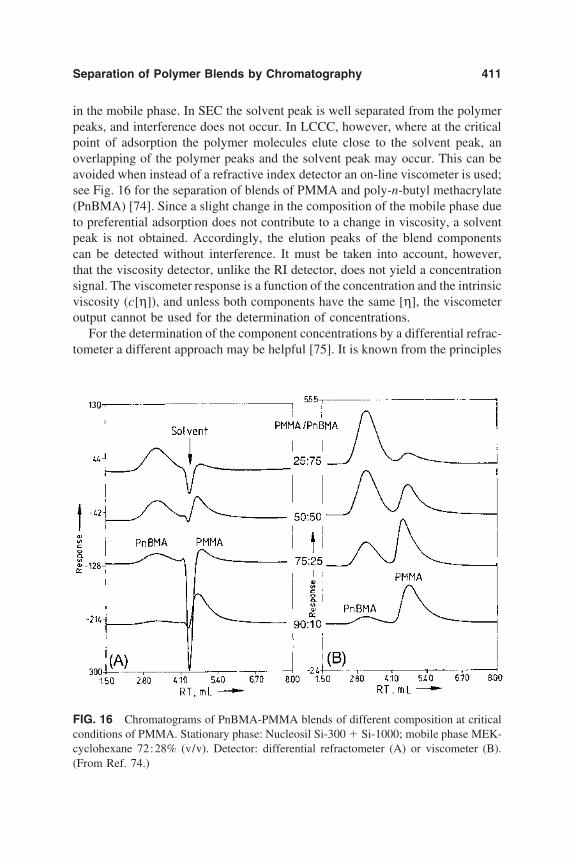
Separation of Polymer Blends by Chromatography 411
in the mobile phase. In SEC the solvent peak is well separated from the polymerpeaks, and interference does not occur. In LCCC, however, where at the criticalpoint of adsorption the polymer molecules elute close to the solvent peak, anoverlapping of the polymer peaks and the solvent peak may occur. This can beavoided when instead of a refractive index detector an on-line viscometer is used;see Fig. 16 for the separation of blends of PMMA and poly-n-butyl methacrylate(PnBMA) [74]. Since a slight change in the composition of the mobile phase dueto preferential adsorption does not contribute to a change in viscosity, a solventpeak is not obtained. Accordingly, the elution peaks of the blend componentscan be detected without interference. It must be taken into account, however,that the viscosity detector, unlike the RI detector, does not yield a concentrationsignal. The viscometer response is a function of the concentration and the intrinsicviscosity (c[η]), and unless both components have the same [η], the viscometeroutput cannot be used for the determination of concentrations.
For the determination of the component concentrations by a differential refrac-tometer a different approach may be helpful [75]. It is known from the principles
FIG. 16 Chromatograms of PnBMA-PMMA blends of different composition at criticalconditions of PMMA. Stationary phase: Nucleosil Si-300 Si-1000; mobile phase MEK-cyclohexane 72:28% (v/v). Detector: differential refractometer (A) or viscometer (B).(From Ref. 74.)

412 Pasch
of critical chromatography that the chromatographic behavior of a polymer inthe transition range from SEC to LAC is very sensitive to mobile phase composi-tion. A slight change in the eluent composition may cause a shift from criticalconditions to the adsorption mode. Since the position of the solvent peak is ratherinsensitive to eluent composition, this fact can be used to separate the PMMAelution peak from the solvent peak. Figure 17 demonstrates the changes in thechromatogram when changing the mobile phase composition from MEK-cyclo-hexane 72:28% to 68:32% (v/v), corresponding to a slight adsorption mode. Inthis case, the PMMA elution peak is well separated from the solvent peak andquantification can be carried out. The PnBMA elutes in the SEC mode and thesolvent peak appears between the elution peaks of the components. Another op-tion is to use an evaporative light scattering detector (ELSD) instead of a refrac-tometer. Since in the ELSD the solvent is evaporated prior to detection, a solventpeak cannot appear in the chromatogram [76–79].
The broad applicability of the LCCC approach to the separation of binaryblends is documented in Fig. 18. Operating at the critical point of adsorption ofPMMA, all polymethacrylates of lower polarity, including polyethyl methacry-late (PEMA), poly-n-butyl methacrylate (PnBMA), poly-t-butyl methacrylate(PtBMA), and polydecyl methacrylate (PDMA), elute in the ideal SEC mode.
FIG. 17 Chromatograms of a PnBMA-PMMA blend at different compositions of themobile phase. Stationary phase: LiChrospher Si-300 Si-1000; mobile phase: MEK-cyclohexane 72:28% (A) or 68:32% (B). (From Ref. 75.)

Separation of Polymer Blends by Chromatography 413
FIG. 18 Universal calibration curve for different polymethacrylates. For chromato-graphic conditions, see Fig. 16.
Accordingly, a common universal calibration curve is obtained for these poly-methacrylates that can be used for molar mass calculations. In any case, the elu-tion zone of PMMA is completely separated from the elution zones of the otherpolymethacrylates, providing for optimum separation of corresponding binaryblends. Partial overlapping of the elution peaks is then exclusively due to axialdispersion.
As has been shown, the key experiment for the successful separation of binaryblends is the determination of critical conditions for one of the blend components.Similar to the critical point of PMMA, the critical point of PtBMA can be estab-lished on silica gel LiChrospher Si-300 Si-1000. The critical point of PtBMAcorresponds to a mobile phase composition of MEK-cyclohexane 18.8 :81.2%(v/v).
The separation of blends of PS and PtBMA using chromatographic conditions,corresponding to the critical point of PtBMA, is shown in Fig. 19. As was ex-pected, in all cases, regardless of the molar masses of the components, a complete

414 Pasch
FIG. 19 Separation of blends of PS and PtBMA at the critical point of PtBMA. Station-ary phase: LiChrospher Si-300 Si-1000; mobile phase: MEK-cyclohexane 18.8:81.2%(v/v). Detector: viscometer.
separation is obtained. Since PS is the less polar component in the blend, it elutesfirst from the column in the SEC mode. For the low molar mass blend, comprisingPS 32,500 and PtBMA 34,000, the peaks are not baseline-separated. A betterresolution can be obtained by changing the separation range of the stationaryphase. A useful combination for this molar mass range would be Nucleosil Si-100 Si-300.
The ability of liquid chromatography at the critical point of adsorption to sepa-rate polymer blend components of minimum structural differences is demon-strated in Fig. 20. Even blends of such very similar polymers like PtBMA andPnBMA can be separated without problems.
With the same resolving power the separation of PtBMA-PnBMA blends canbe conducted on a reversed phase system operating at the critical point of PnBMA(Fig. 21). In this case, critical conditions correspond to a mobile phase of THF-acetonitrile 53.1:46.9% (v/v).

Separation of Polymer Blends by Chromatography 415
FIG. 20 Separation of blends of PnBMA and PtBMA at the critical point of PtBMA.For chromatographic conditions, see Fig. 19.
To summarize, the mobile phase compositions corresponding to the criticalpoints of PS and a number of polymethacrylates are given in Table 2. As can beexpected for a reversed phase system (RP-18), the amount of good solvent inthe mobile phase (THF) necessary to elute the polymer from the column increaseswith increasing hydrophobicity of the polymer. For the normal phase silica sys-tem, the amount of good solvent (MEK) increases with increasing polarity of thepolymer.
C. Separation of Blends of Homo- and Copolymers
Similar to the separation of blends of homopolymers, blends of homo- and copoly-mers can be separated by LCCC provided that the polarities of the blend compo-
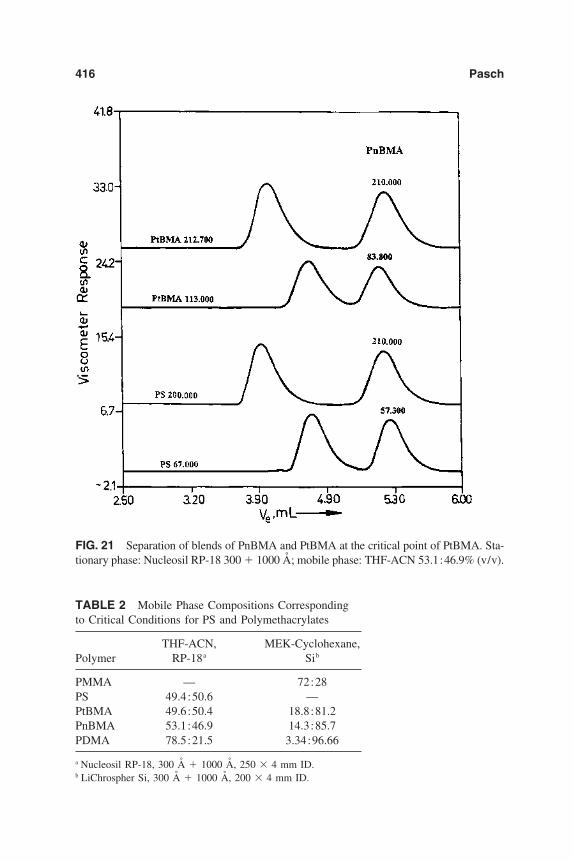
416 Pasch
FIG. 21 Separation of blends of PnBMA and PtBMA at the critical point of PtBMA. Sta-tionary phase: Nucleosil RP-18 300 1000 A; mobile phase: THF-ACN 53.1:46.9% (v/v).
TABLE 2 Mobile Phase Compositions Correspondingto Critical Conditions for PS and Polymethacrylates
THF-ACN, MEK-Cyclohexane,Polymer RP-18a Sib
PMMA — 72:28PS 49.4:50.6 —PtBMA 49.6:50.4 18.8:81.2PnBMA 53.1:46.9 14.3:85.7PDMA 78.5:21.5 3.34:96.66
a Nucleosil RP-18, 300 A 1000 A, 250 4 mm ID.b LiChrospher Si, 300 A 1000 A, 200 4 mm ID.
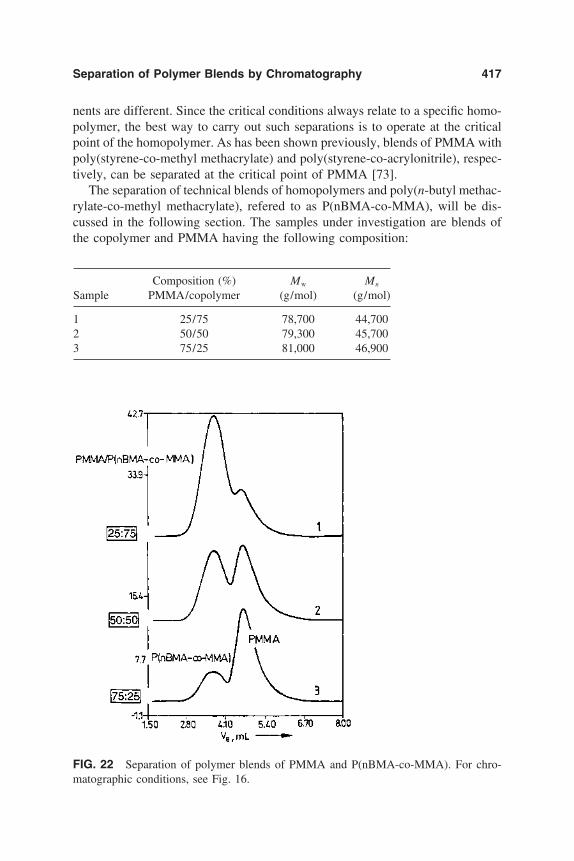
Separation of Polymer Blends by Chromatography 417
nents are different. Since the critical conditions always relate to a specific homo-polymer, the best way to carry out such separations is to operate at the criticalpoint of the homopolymer. As has been shown previously, blends of PMMA withpoly(styrene-co-methyl methacrylate) and poly(styrene-co-acrylonitrile), respec-tively, can be separated at the critical point of PMMA [73].
The separation of technical blends of homopolymers and poly(n-butyl methac-rylate-co-methyl methacrylate), refered to as P(nBMA-co-MMA), will be dis-cussed in the following section. The samples under investigation are blends ofthe copolymer and PMMA having the following composition:
Composition (%) Mw Mn
Sample PMMA/copolymer (g/mol) (g/mol)
1 25/75 78,700 44,7002 50/50 79,300 45,7003 75/25 81,000 46,900
FIG. 22 Separation of polymer blends of PMMA and P(nBMA-co-MMA). For chro-matographic conditions, see Fig. 16.

418 Pasch
In the previous section it has been demonstrated that due to their differentpolarity PMMA and PnBMA can be separated by LCCC. If now the polarity ofthe copolymer P(nBMA-co-MMA) is compared to the polarities of the homopoly-mers, then the copolymer can be assumed to be more polar than PnBMA butless polar than PMMA. Of course, the polarity of the copolymer depends on thecomposition; the more MMA is incorporated into the copolymer the higher isthe polarity.
If a polar stationary phase is selected for the separations, it can be assumedthat the PMMA homopolymer is more strongly retained than the P(nBMA-co-MMA). Optimum separation should occur when the mobile phase compositioncorresponds to the critical point of PMMA. Figure 22 shows the separation of
FIG. 23 Separation of PDMA blends with homo- and copolymers. Stationary phase:Nucleosil RP-18; mobile phase: THF-ACN 87.5:21.5% (v/v).
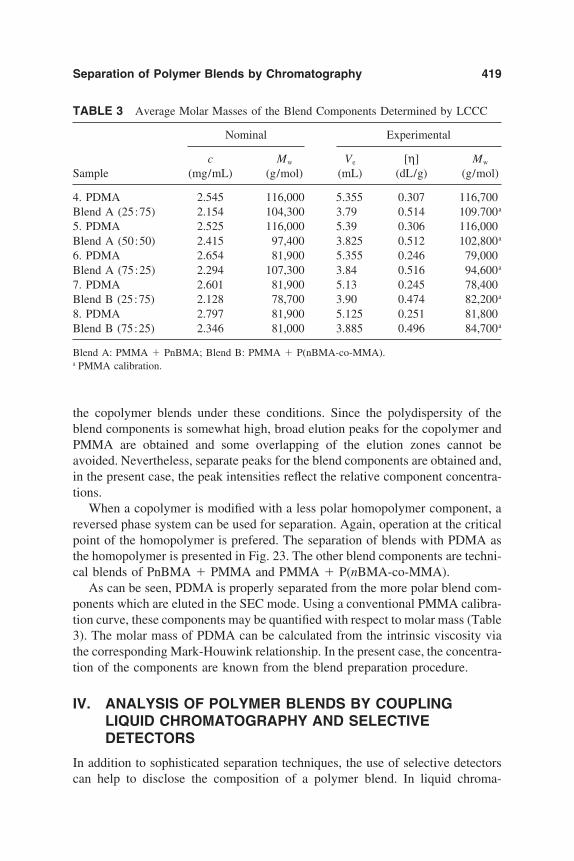
Separation of Polymer Blends by Chromatography 419
TABLE 3 Average Molar Masses of the Blend Components Determined by LCCC
Nominal Experimental
c Mw Ve [η] Mw
Sample (mg/mL) (g/mol) (mL) (dL/g) (g/mol)
4. PDMA 2.545 116,000 5.355 0.307 116,700Blend A (25:75) 2.154 104,300 3.79 0.514 109.700a
5. PDMA 2.525 116,000 5.39 0.306 116,000Blend A (50:50) 2.415 97,400 3.825 0.512 102,800a
6. PDMA 2.654 81,900 5.355 0.246 79,000Blend A (75:25) 2.294 107,300 3.84 0.516 94,600a
7. PDMA 2.601 81,900 5.13 0.245 78,400Blend B (25:75) 2.128 78,700 3.90 0.474 82,200a
8. PDMA 2.797 81,900 5.125 0.251 81,800Blend B (75:25) 2.346 81,000 3.885 0.496 84,700a
Blend A: PMMA PnBMA; Blend B: PMMA P(nBMA-co-MMA).a PMMA calibration.
the copolymer blends under these conditions. Since the polydispersity of theblend components is somewhat high, broad elution peaks for the copolymer andPMMA are obtained and some overlapping of the elution zones cannot beavoided. Nevertheless, separate peaks for the blend components are obtained and,in the present case, the peak intensities reflect the relative component concentra-tions.
When a copolymer is modified with a less polar homopolymer component, areversed phase system can be used for separation. Again, operation at the criticalpoint of the homopolymer is prefered. The separation of blends with PDMA asthe homopolymer is presented in Fig. 23. The other blend components are techni-cal blends of PnBMA PMMA and PMMA P(nBMA-co-MMA).
As can be seen, PDMA is properly separated from the more polar blend com-ponents which are eluted in the SEC mode. Using a conventional PMMA calibra-tion curve, these components may be quantified with respect to molar mass (Table3). The molar mass of PDMA can be calculated from the intrinsic viscosity viathe corresponding Mark-Houwink relationship. In the present case, the concentra-tion of the components are known from the blend preparation procedure.
IV. ANALYSIS OF POLYMER BLENDS BY COUPLINGLIQUID CHROMATOGRAPHY AND SELECTIVEDETECTORS
In addition to sophisticated separation techniques, the use of selective detectorscan help to disclose the composition of a polymer blend. In liquid chroma-

420 Pasch
tography of polymers different types of detectors are used, including concen-tration-sensitive and molar mass–sensitive detectors. These detectors can beuniversal, measuring a bulk property of the eluate, or selective, measuring aspecific property of the solute. Among the universal detectors the most fre-quently used are the differential refractometer and the evaporative light scatteringdetector. As for selective detectors, the UV and IR detectors are most common.In particular, FTIR can be of exorbitant value in terms of selective structuralinformation, as will be shown later. Molar mass–sensitive detectors, e.g., differ-ential viscometers and light scattering detectors, are frequently used in SEC be-cause they yield the molar mass of each fraction of a polymer peak. Since theresponse of such detectors depends on both concentration and molar mass, theyhave to be combined with a concentration-sensitive detector. An overview ofdifferent detection systems in liquid chromatography of polymers is given inRefs. [80–87].
A. Combination of LCCC and a Viscometer Detector
So far the differential viscometer has been treated as a means to avoid solventpeaks in the chromatogram (see Secs. III.B and III.C). However, since the detec-tor signal bears molar mass information, it can be used for obtaining selectiveinformation on the components of polymer blends.
The viscosity of a polymer solution is related to the molar mass M via theMark-Houwink-Sakurada equation:
[η] KM a (17)
where [η] is the intrinsic viscosity, and K and a are coefficients that are character-istic for a specific polymer, solvent, and temperature.
Viscosity measurement in SEC can be performed by measuring the pressuredrop P across a capillary, which is proportional to the viscosity η of the flowingliquid (the viscosity of the pure mobile phase is denoted as η0). The intrinsicviscosity is defined as the limiting value of the ratio of specific viscosity ηsp andconcentration c for c → 0:
[η] lim (η η0)/η0c lim ηsp/c (18)
When a polymer solution passes the capillary, the pressure drop is increased by∆P. In viscosity detection, one has to determine the viscosity η of the samplesolution and the viscosity η0 of the pure mobile phase. The specific viscosity ηsp
∆η/η is obtained from ∆P/P. As the concentrations in SEC are typically verylow, [η] can be approximated by ηsp/c.

Separation of Polymer Blends by Chromatography 421
FIG. 24 Schematic representation of differential viscometers.
A schematic representation of a differential viscometer is given in Fig. 24. Inthe two-capillary design the capillaries C1 and C2 are connected in series, andeach is connected to a differential pressure transducer (DP1 and DP2), with asufficiently large holdup reservoir (H) in between. With this design, one measuresthe sample viscosity η from the pressure drop across the first capillary, and thesolvent viscosity η0 from the pressure drop across the second capillary. Anotherdesign is a differential viscometer, in which four capillaries are arranged similarto a Wheatstone bridge. In the ‘‘bridge’’ design, a holdup reservoir in front ofthe reference capillary (C4) makes sure that only pure mobile phase flows throughthe reference capillary, when the peak passes the sample capillary (C3). Thisdesign offers considerable advantages: The detector measures actually the pres-sure difference ∆P at the differential pressure transducer (DP) between the inletsof the sample capillary and the reference capillary, which have a common outlet,and the overall pressure P at the inlet of the bridge. The specific viscosity ηsp isthus obtained from ∆P/P. In order to calculate [η] from ηsp, the concentrationat each point of the chromatogram must be determined. Therefore, the viscometermust be coupled to a concentration detector.
As was already discussed in sec. III, LCCC offers the opportunity to separatethe components of polymer blends. Chromatographic conditions in this case cor-respond to the critical point of component A, whereas component B is eluted inthe SEC mode. When using a concentration detector, component B can be ana-lyzed with respect to molar mass, whereas component A at the critical point ofadsorption does not provide separation according to molar mass.
The molar mass versus elution volume behavior of a typical binary blend isshown in Fig. 25A. PtBMA exhibits conventional SEC behavior, whereas forPMMA under critical conditions the elution volume is independent of molarmass.
On the other hand, both blend components exhibit normal Mark-Houwinkbehavior, i.e., regardless of their chromatographic behavior the typical [η]–Mrelationship is always operating (see Fig. 25B). Accordingly, from [η] the molar

422 Pasch
FIG. 25 Molar mass versus elution volume diagram (A) and Mark-Houwink diagram(B) for PMMA and PtBMA under critical conditions for PMMA. Stationary phase: LiChro-spher Si-300 Si-1000; mobile phase: MEK-cyclohexane 72:28% (v/v).
mass of both components can be calculated directly from the Mark-Houwinkplot.
The separation of binary blends of PMMA and PtBMA is presented in Fig.26. Operating at critical conditions for PMMA, PtBMA elutes in the SEC mode(cf. Fig. 25A). The peak areas of the viscometer traces for both componentscorrespond to [η]c. By determining c with an ELSD detector, the intrinsic viscosi-ties [η]PMMA and [η]PtBMA can be calculated from the ratio of the viscometer andthe ELSD signals. Using the corresponding Mark-Houwink functions (Fig. 25B),from the intrinsic viscosities the molar masses MPMMA and MPtBMA can be calcu-lated (Table 4).
Thus, by combining the selectivity of LCCC with a viscometer and a concen-

Separation of Polymer Blends by Chromatography 423
tration detector, the following information of a binary blend can be obtained inone experiment:
Concentration of component A in the blendConcentration of component B in the blendMolar mass of component A in the blendMolar mass of component B in the blend
B. Coupled Liquid Chromatography and FTIRSpectroscopy
When analyzing a commercial polymer blend, very frequently the first step mustbe the determination of the gross composition. Only when the chemical structuresof the blend components are known, sophisticated separation techniques such asLCCC can be adapted to a specific analysis.

424 Pasch
FIG. 26 Separation of binary blends of PMMA and PtBMA under critical conditionsfor PMMA. For chromatographic conditions, see Fig. 25.
The most frequently used techniques for a ‘‘flash’’ analysis are infrared spec-troscopy and SEC. Infrared spectroscopy provides information on the chemicalsubstructures present in the sample, whereas SEC gives a first indication of themolar mass range of the components. Information on both molar mass and com-position is obtained when SEC or a comparable chromatographic method is com-
TABLE 4 Average Molar Masses of the Components of PMMA-PtBMA Blends,Determined by LCCC and Viscometric Detection
Nominal Experimental
c Mp Ve [η] M PtBMA/PMMASample (mg/mL) (g/mol) (mL) (mL/g) (g/mol) (wt%)
9. PtBMA 1.946 34,000 4.05 11.3 33,700 45/55PMMA 2.233 30,500 4.81 14.8 31,10010. PtBMA 1.756 48,000 3.93 17.3 46,400 48/52PMMA 1.990 30,500 4.81 14.8 30,10011. PtBMA 1.498 113,000 3.49 37.8 114,600 50/50PMMA 1.548 85,100 4.83 28.5 85,00012. PtBMA 1.254 185,000 3.18 58.0 188,200 48/52PMMA 1.332 175,000 4.88 40.6 146,400

Separation of Polymer Blends by Chromatography 425
bined with an IR detector. In the past, numerous workers have tried to use IRdetection of the SEC column effluent in liquid flow cells. The problems encoun-tered relate to obtaining sufficient signal-to-noise (S/N) ratio even with FTIRinstruments, flow-through cells with minimum pathlengths, and mobile phaseswith sufficient spectral windows. Attempts to use FTIR detection with liquidflow-through cells and high-performance columns have not been very successfuldue to the requirement of considerably less sample concentration for efficientseparation.
A rather broad applicability of FTIR as a detector in liquid chromatographycan be achieved when the mobile phase is removed from the sample prior todetection. In this case, the sample fractions are measured in pure state withoutinterference from solvents. Experimental interfaces to eliminate volatile mobilephases from HPLC effluents have been tried with some success [88–90] but thebreakthrough toward a powerful FTIR detector was achieved only by Gagel andBiemann, who formed an aerosol from the effluent and sprayed it on a rotatingaluminum mirror. The mirror was then deposited in an FTIR spectrometer andspectra were recorded at each position in the reflection mode [91–93].
Recently, Lab Connections Inc. introduced the LC-Transform, a direct HPLC–FTIR interface based on the invention of Gagel and Biemann and discussed firstapplications in polymer analysis [94–96]. The design concept of the interface isshown in Fig. 27. The system is composed of two independent modules: thesample collection module and the optics module. The effluent of the liquid chro-matography column is split with a fraction (frequently 10% of the total effluent)going into the heated nebulizer nozzle located above a rotating sample collectiondisc. The nozzle rapidly evaporates the mobile phase while depositing a tightlyfocused track of the solute. When a chromatogram has been collected on thesample collector disc, the disc is transfered to the optics module in the FTIR
FIG. 27 Schematic representation of the principle of coupled liquid chromatographyand FTIR spectroscopy.

426 Pasch
for analysis of the deposited sample track. A control module defines the samplecollection disc position and rotation rate in order to be compatible with the runtime and peak resolution of the chromatographic separation. Data collection isreadily accomplished with software packages presently used for GC-FTIR. Thesample collection disc is made from germanium, which is optically transparentin the range 6000–450 cm1. The lower surface of the disc is covered with areflecting aluminum layer.
As a result of the investigation, a complete FTIR spectrum for each positionon the disc and, hence, for each sample fraction is obtained. This spectrum bearsinformation on the chemical composition of each sample fraction. The set of allspectra can be arranged along the elution time axis and yields a three-dimensionalplot in the coordinates elution time–FTIR frequency-absorbance.
One of the benefits of coupled SEC-FTIR is the ability to directly identify theindividual components separated by chromatography. A typical SEC separationof a polymer blend is shown in Fig. 28.
Two separate elution peaks 1 and 2 are obtained, indicating that the blendcontains at least two components of significantly different molar masses. How-ever, a quantification of the components with respect to concentration and molarmass cannot be carried out as long as the chemical structure of the componentsis unknown.
The analysis of the chemical composition of the sample is conducted by cou-pled SEC-FTIR using the LC transform. After separating the sample with respect
FIG. 28 SEC separation of a binary blend. Stationary phase: Ultrastyragel 2 linear 105 A; mobile phase: THF.
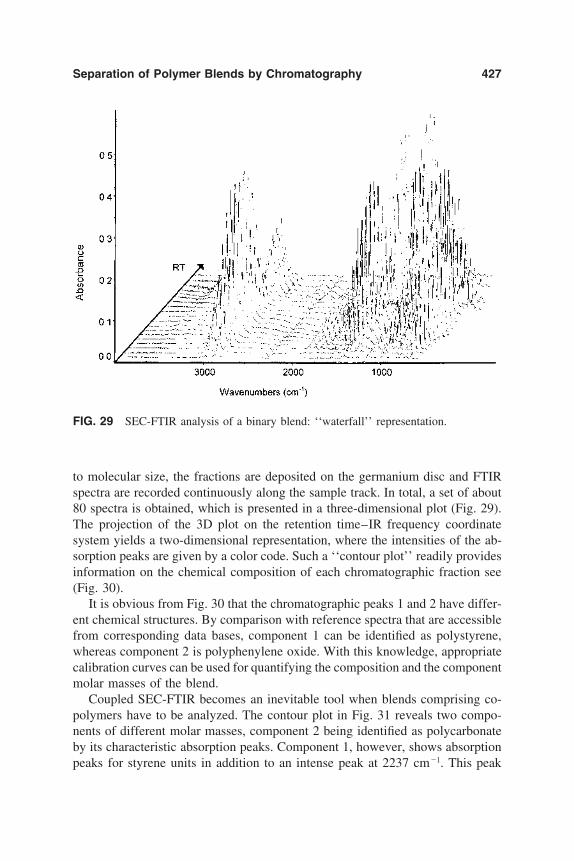
Separation of Polymer Blends by Chromatography 427
FIG. 29 SEC-FTIR analysis of a binary blend: ‘‘waterfall’’ representation.
to molecular size, the fractions are deposited on the germanium disc and FTIRspectra are recorded continuously along the sample track. In total, a set of about80 spectra is obtained, which is presented in a three-dimensional plot (Fig. 29).The projection of the 3D plot on the retention time–IR frequency coordinatesystem yields a two-dimensional representation, where the intensities of the ab-sorption peaks are given by a color code. Such a ‘‘contour plot’’ readily providesinformation on the chemical composition of each chromatographic fraction see(Fig. 30).
It is obvious from Fig. 30 that the chromatographic peaks 1 and 2 have differ-ent chemical structures. By comparison with reference spectra that are accessiblefrom corresponding data bases, component 1 can be identified as polystyrene,whereas component 2 is polyphenylene oxide. With this knowledge, appropriatecalibration curves can be used for quantifying the composition and the componentmolar masses of the blend.
Coupled SEC-FTIR becomes an inevitable tool when blends comprising co-polymers have to be analyzed. The contour plot in Fig. 31 reveals two compo-nents of different molar masses, component 2 being identified as polycarbonateby its characteristic absorption peaks. Component 1, however, shows absorptionpeaks for styrene units in addition to an intense peak at 2237 cm1. This peak

428 Pasch
FIG. 30 SEC-FTIR analysis of a binary blend: ‘‘contour plot’’ representation.
is due to nitrile groups and indicates that component 1 is composed of styreneand acrylonitrile units. Accordingly, component 1 can be identified as a styrene-acrylonitrile copolymer (SAN), which is frequently used as a modifier of polycar-bonate. The composition of the copolymer can easily be determined from itsFTIR spectrum, comparing the relative intensities of the nitrile and the styreneabsorption peaks.
Very frequently components of similar molar masses are used in polymerblends. In these cases resolution of SEC is not sufficient to resolve all componentpeaks (see Fig. 32 for a binary blend containing an additive). The elution peaksof the polymer components 1 and 2 overlap and, thus, the molar masses cannotbe determined directly. Only the additive peak 3 at the low molar mass end ofthe chromatogram is well separated and can be quantified.
A first indication of the composition of the present sample can be obtainedfrom the contour plot shown in Fig. 33. Component 3 shows typical absorptionpeaks of a phenyl benzotriazole and can be identified as a UV stabilizer of theTinuvin type. Component 2 exhibits absorption peaks that are characteristic fornitrile groups (2237 cm1) and styrene units (760, 699 cm1), whereas component1 shows a strong ester carbonyl peak around 1740 cm1 and peaks of styrene

Separation of Polymer Blends by Chromatography 429
FIG. 31 SEC-FTIR analysis of a blend of polycarbonate and SAN copolymer. For chro-matographic conditions, see Fig. 28.
units. In agreement with the peak pattern in Fig. 31, component 2 is identifiedas styrene-acrylonitrile copolymer.
Component 1 could be a mixture of polystyrene and PMMA or a styrene-methyl methacrylate copolymer. Since the FTIR spectra over the entire elutionpeak are uniform, it is more likely that component 1 is a copolymer.
One important feature of the SEC-FTIR software is that from the contour plotspecific elugrams at one absorption frequency can be obtained. Taking the elu-gram at 2230 cm1, which is specific for the nitrile group, the elution peak ofthe SAN copolymer can be presented individually. For the presentation of compo-nent 1 the elugram at the carbonyl absorption frequency is drawn. Thus, viathe ‘‘chemigram’’ presentation the elution peak of each component is obtained(Fig. 34).
The total concentration profile can be obtained from the chemigram at thefrequency of the C-H valence vibrations (2800–3100 cm1). The specific chemi-grams that are characteristic for one component each represent the elution profileof this component. Accordingly, the chemigrams can be used for the calculationof the molar masses of the components.

430 Pasch
FIG. 32 SEC separation of a blend of two copolymers and an additive. For chromato-graphic conditions, see Fig. 28.
FIG. 33 Contour plot of the SEC-FTIR analysis of a blend of two copolymers and anadditive.

Separation of Polymer Blends by Chromatography 431
FIG. 34 Chemigrams taken from the contour plot in Fig. 33.
ACKNOWLEDGMENT
Financial support of a part of this work from the Bundesminister fur Wirtschaftthrough the Arbeitsgemeinschaft industrieller Forschungsvereinigungen e.V.(AiF) (grant no. 10947) is gratefully acknowledged.
REFERENCES
1. G. Glockner, Gradient HPLC of Copolymers and Chromatographic Cross-Fraction-ation, Springer-Verlag, Berlin, 1991, Chapter 3.
2. G. Glockner, Polymer Characterization by Liquid Chromatography, Elsevier, Am-sterdam, 1987.
3. S. G. Entelis, V. V. Evreinov, and A. V. Gorshkov, Adv. Polym. Sci. 76:129 (1986).4. S. G. Entelis, V. V. Evreinov, and A. I. Kuzaev, Reactive Oligomers, Khimiya,
Moscow, 1985.5. M. B. Tennikov, P. P. Nefedov, M. A. Lazareva, and S. J. Frenkel, Vysokomol.
Soedin. A19:657 (1977).6. B. G. Belenkii, E. S. Gankina, M. B. Tennikov, and L. Z. Vilenchik, Dokl. Acad.
Nauk USSR 231:1147 (1976).7. A. M. Skvortsov, B. G. Belenkii, E. S. Gankina, and M. B. Tennikov, Vysokomol.
Soedin. A20:678 (1978).

432 Pasch
8. S. T. Balke, in Modern Methods of Polymer Characterization (H. G. Barth andJ. M. Mays, eds.), Wiley-Interscience, New York, 1991, Chapter 1.
9. W. W. Yau, J. J. Kirkland, and D. D. Bly, Modern Size Exclusion Liquid Chromatog-raphy, John Wiley and Sons, New York, 1979.
10. H. E. Adams, in Gel Permeation Chromatography (K. H. Altgelt and L. Segal, eds.),Marcel Dekker, New York, 1971.
11. A. Revillon, J. Liq. Chromatogr. 3:1137 (1980).12. S. Mori and T. Suzuki, J. Liq. Chromatogr. 4:1685 (1981).13. W. W. Yau, Chemtracts-Macromol. Chem. 1:1 (1990).14. E. Kohn and M. E. Chisum, in Detection and Data Analysis in Size Exclusion
Chromatography (Th. Provder, ed.), ACS Symp. Ser. 352, ACS, Washington, D.C.,1987.
15. F. M. Mirabella, E. M. Barrall, and J. F. Johnson, J. Appl. Polym. Sci. 20:959 (1976).16. R. Bruessau, GIT Fachz. Lab. 31:388 (1987).17. B. Trathnigg, J. Liq. Chromatogr. 13:1731 (1990).18. B. Trathnigg, J. Chromatogr. 552:505 (1991).19. B. Trathnigg and Ch. Jorde. J. Chromatogr. 385:17 (1987).20. B. Trathnigg and X. Yan, Chromatographia 33:467 (1992).21. B. G. Belenkii, and L. Z. Vilenchik, J. of Chromatogr. Library, Vol. 25, Elsevier,
Amsterdam, 1983.22. S. Mori, Trends Polym. Chem. R138 (1994).23. C. G. Smith, P. B. Smith, and A. J. Pasztor, Anal. Chem. 65:217R (1993).24. G. Glockner, Z. Phys. Chem. 229:98 (1965).25. G. Glockner, Chromatographia 25:854 (1988).26. G. Glockner, Chromatographia 23:517 (1987).27. S. Teramachi, A. Hasegawa, Y. Shima, M. Akatsuka, and M. Nakajima. Macromole-
cules 12:992 (1979).28. H. Sato, H. Takeuchi, and Y. Tanaka, Macromolecules 19:2613 (1986).29. R. W. Sparidans, H. A. Claessens, G. H. J. van Doremaele, and A. M. van Herk,
J. Chromatogr. 508:319 (1990).30. S. Mori, J. Appl. Polym. Sci. 38:95 (1989).31. G. Glockner and A. H. E. Muller, J. Appl. Polym. Sci. 38:1761 (1989).32. H. Sato, M. Sasaki, and K. Ogino. Polym. J. 21:965 (1989).33. G. Glockner and D. Wolf, Chromatographia 34:363 (1992).34. M. Augenstein and M. A. Muller, Makromol. Chem. 191:2151 (1990).35. G. Glockner, M. Stickler, and W. Wunderlich, J. Appl. Polym. Sci. 37:3147 (1989).36. S. Mori and M. Mouri, Anal. Chem. 61:2171 (1989).37. S. Mori, J. Chromatogr. 507:473 (1990).38. S. Mori, J. Chromatogr. 503:411 (1990).39. S. Mori, Anal. Chem. 62:1902 (1990).40. S. Mori, J. Chromatogr. 541:375 (1991).41. T. C. Schunk, J. Chromatogr. 661:215 (1994).42. T. C. Schunk and T. E. Long, Chromatogr. 692:221 (1995).43. T. C. Schunk, J. Chromatogr. A656: 591 (1993).44. T. H. Mourey, J. Chromatogr. 357:101 (1986).45. J. A. J. Jansen, in: Integr. Fundam. Polym. Sci. Technol. Proc. Int. Meet. Polym.

Separation of Polymer Blends by Chromatography 433
Sci. Technol., Vol. 5 (P. J. Lemstra and L. A. Kleintjens, eds.), Elsevier, Amsterdam,1991.
46. S. Mori, J. Liq. Chromatogr. 16:1 (1993).47. W. J. Staal, Ph.D. thesis, Technical University Eindhoven, The Netherlands, 1996.48. H. C. Lee and T. Chang, Macromolecules 29:7294 (1996).49. D. Hunkeler, D. Macko, and T. Berek, Polym. Mat. Sci. Eng. 65:101 (1991).50. D. Hunkeler, T. Macko, and D. Berek, in: Chromatography of Polymers: Charac-
terization by SEC and FFF (T. Provder, ed.), ACS Books, Washington, D.C.,1993.
51. M. Janco, T. Prudskova, and D. Berek. J. Appl. Polym. Sci. 55:393 (1995).52. D. Berek, Macromol. Symp. 110:33 (1996).53. D. Hunkeler, M. Janco, V. Guryakova, and D. Berek, ACS Adv. Chem. Ser. 247:
13 (1995).54. D. Hunkeler, M. Janco, and D. Berek, in: Strategies in Size Exclusion Chromatogra-
phy (M. Potschka and P. L. Dubin, eds.), ACS Symp. Ser. 635, ACS, Washington,D.C., 1996.
55. D. Berek, M. Janco, T. Kitayama, and K. Hatada. Polym. Bull. 32:629 (1994).56. H. Pasch, H. Much, and G. Schulz, in: Trends in Polymer Science, Vol. 3, Research
Trends, Trivandrum, India, 1993.57. H. Pasch, Adv. Polym. Sci. 128:1 (1997).58. H. Pasch, H. Much, G. Schulz, and A. V. Gorshkov, LC-GC Int. 5:38 (1992).59. N. N. Filatova, A. V. Gorshkov, V. V. Evreinov, and S. G. Entelis, Vysokomol.
Soedin. A30:953 (1988).60. A. V. Gorshkov, S. S. Verenich, V. V. Evreinov, and S. G. Entelis, Chromatographia
26:338 (1988).61. A. V. Gorshkov, T. N. Prudskova, V. V. Guryakova, and V. V. Evreinov, Polym.
Bull. 15:465 (1986).62. A. V. Gorshkov, H. Much, H. Becker, H. Pasch, V. V. Evreinov, and S. G. Entelis,
J. Chromatogr. 523:91 (1990).63. H. Kruger, H. Pasch, H. Much, V. Gancheva, and R. Velichkova, Makromol. Chem.
193:1975 (1992).64. R.-P. Kruger, H. Much, and G. Schulz, Macromol. Symp. 110:155 (1996).65. H. Pasch and I. Zammert, J. Liquid Chromatogr. 17:3091 (1994).66. H. Pasch, C. Brinkmann, H. Much, and U. Just. J. Chromatogr. 623:315 (1992).67. H. Pasch, C. Brinkmann, and Y. Gallot, Polymer 34:4099 (1993).68. H. Pasch and M. Augenstein, Makromol. Chem. 194:2533 (1993).69. H. Pasch, M. Augenstein, and B. Trathnigg, Makromol. Chem. 195:743 (1994).70. H. Pasch, Y. Gallot, and B. Trathnigg, Polymer 34:4986 (1993).71. H. Pasch, GIT Fachz Lab. 37:1068 (1993).72. H. Pasch, A. Deffieux, I. Henze, M. Schappacher, and L. Rique-Lurbet, Macromole-
cules 29:8776 (1996).73. H. Pasch, Polymer 34:4095 (1993).74. H. Pasch and K. Rode, Macromol. Chem. Phys. 197:2691 (1996).75. H. Pasch, K. Rode, and N. Chaumien, Polymer 37:4079 (1996).76. M. Lafosse, L. Elfakir, L. Morin-Allory, and M. Dreux, J. High Res. Chromatogr.
15:312 (1992).

434 Pasch
77. K. Rissler, U. Fuchslueger, and H. J. Grether, J. Liq. Chromatogr. 17:3109(1994).
78. S. Brossard, M. Lafosse, and M. Dreux, J. Chromatogr. 591:149 (1992).79. M. Dreux, M. Lafosse, and L. Morin-Allory, LC-GC Int. 9:148 (1996).80. S. R. Abbott and J. Tusa, J. Liq. Chromatogr. 6:77 (1983)81. R. P. W. Scott, Liquid Chromatography Detectors, Elsevier, Amsterdam (1986).82. E. S. Yeung, Detectors for Liquid Chromatography, John Wiley and Sons, New
York, 1986.83. K. H. Shafer, S. L. Pentoney, and P. R. Griffiths, J. High Res. Chromatogr., Chro-
matogr. Commun. 7:707 (1984)84. J. M. Willis, J. L. Dwyer, and L. Wheeler, Proceedings International Symposium
on Polymer Analysis and Characterizationn, Crete, Greece (1993).85. A. E. Hamielec, A. C. Ouano, and L. L. Nebenzahl, J. Liquid Chromatogr. 1:527
(1978).86. M. A. Haney, J. Appl. Polym. Sci. 30:3037 (1985).87. W. W. Yau, S. D. Abboutt, G. A. Smith, and M. Y. Keating, ACS Symp. Ser. 352:
80 (1987).88. R. M. Robertson, J. A. de Haseth, J. D. Kirk, and R. F. Browner, Appl. Spectrosc.
42:1365 (1988).89. P. R. Griffiths and C. M. Conroy, Adv. Chromatogr. 25:105 (1986)90. J. W. Hellgeth and L. T. Taylor, J. Chromatogr. Sci. 24:519 (1986).91. J. J. Gagel and K. Biemann, Anal. Chem. 58:2184 (1986).92. J. J. Gagel and K. Biemann, Anal. Chem. 59:1266 (1987).93. J. J. Gagel and K. Biemann, Microchim. Acta 11:185 (1988).94. L. M. Wheeler and J. N. Willis, Appl. Spectrosc. 47:1128 (1993).95. J. N. Willis, J. L. Dwyer, and L. M. Wheeler, Polym. Mat. Sci. 69:120 (1993).96. J. N. Willis, J. L. Dwyer, and M. X. Lui, Proceedings International GPC Symposium
1994, Lake Buena Vista, FL, USA (1995).

Acceptor characteristics, 127 -donor interactions, 61, 126, 127, 133,
136 number, 52, 54, 67, 11 1, 128, 130,
probe, 62 reference, 13 1 site, 54, 131, 139
154- 156
Acid-base character, 44, 62, 64, 111 concept, 54, 64, 108, 130 contribution to adhesion, 126 exchanges, 43 number, 108, probes, 108 properties, 48, 52, 61, 66, 76, 108,
113, 150 evaluation, 155
reaction enthalpy, 154 scale, 63, 153, 154 surface properties, 105, 110
boric, 316 Acid
dispersive effect, 53 number, 53, 68, 130 oxidation, 88
[Acid] perchloric, 195, 230 polysilicic, 175 styrene-methacrylic, 175 treatment, 293, 355
constant, 130 mobile phase, 178 probe, 47, 54, 64 protein retention, 292
of hydrogen bond, 155 of substances, 52, 110, 111
of group contribution, 230, 231 of radii, 23 of surface energies, 130
between fibers, 138, 140 between surfaces, 126 induced by grafting, 135 polymer-matrix, 28 1 strength, 95 work of, 42, 56, 138
-adsorbent area, 25
Acidic
Acidity
Additivity
Adhesion
Adsorbate
435

436 Index
[Adsorbate] [Adsorption] mobility, 330
boiling point, 17 cavity interaction, 30 cavity model, 9, 10 molecular structure, 35 nonspecific, 24 isotherm retention time definition, 5 size, 24 solid interaction, 35 zeolite interaction, 26 (probe), 51
film, speading pressure of, 57 molecule layer thickness, 3 19-322
free energy of, 56, 61, 130, 150, 332 in micropores, 2 in slit-like pores, 3 irreversible, 149, 366, 405 isosteric heats of, 26, 163
(BET), 44, 48, 290 (organic molecules), 48, 148, 161 (polyelectrolyte), 3 18
Adsorbed kinetic coefficient of, 331, 336, 358, 36 1
amount of, 163 interfacial orientation of, 257 surface area of, 51, 66, 76, 158
amount of, 318 in-plane mobility of, 384 repulsion between, 322 structure of, 320
hydrodynamic thickness of, 301 reconformation of, 359, 373, 379 structure, 3 13
species, surface blocking effect of, 334 water, role of, 153 378
retention on polar, 229 structural information, 2 surface model, 8
Adsorbing disc model, 361 Adsorption on a lattice, 332
localized, 330, 333, 341, 349 memory effect in, 195 mobile, 330, 334, 343, 355
nonspecific surface, 264 of chains, 330 of diblock copolymer, 358 of heterogeneous polymers, 391
of hydrophilic polymer, 274, 313 of linear hydrocarbons, 157 of micelles, 377 of polyelectrolyte, 314 -318, 322, 366,
polyelectrolytes model, 363
polymer of hydrocarbons, 58
Adsorbent of polymer, 331 of proteins, 285, 292, 312 of specific ions, 324 of two discs, 345 of viruses, 283
preferential, 373, 384, 410 prevention, 189, 282, 283 probability of, 338, 339, 343, 344, 345 profile in chromatography, 37 1, 374,
properties of carbon black, 85-88, random sequential model of, 330, rate of polymer, 331, 356,
reduction by coating, 276 separation efficiency in, 385 single surface approach, 18
at porous adsorbents, 391 at stationary phases, 174, 181, 195,
199, 215-218 capacity of resins, 113 centers, 247 378 composition effect in, 348 constant at equilibrium, 23 1 critical point of, 391, 403 -desorption free energy, 58 end of, 357 energy distribution, 162-169 enthalpy of, 66, 126, 130, 150, 332
supply in, 359

Index 437
[Adsorption] site accessibility, 157, 333 size effect in, 340 standard entropy of, 129 surface, 128, 282 thermodynamic treatment of, 330 virial coefficient treatment of, 3 virial equation of state for, 5
Aerosil, 158 Aggregation, 182 Alkanes, 33, 59, 233, 289, 313
as nonspecific adsorbates, 24, 48, 61,
branched, 158 flexible, 157 insertion of, 157 retention volume of, 149, 151, 242 surface area of, 51, 76 vapor pressure of, 155
127, 130, 136, 147
Alkanethiol, as stabilizer, 185 Aluminium oxide
surface energy of, 103 specific interaction with, 229
character, 87 probes, 48, 54, 136 properties, 154 surface, 63, 87, 151
Analytic solution Hansen’s, 34
Anhydrous silylation, 274, 279, 294 Aromatic cycle
Amphoteric
number of, 228 retention of, 251
Atomic van der Waals radii, 49 Average size of colloids, 179, 200
Band shift of elution chromatogram, 264 Bending energy
of molecules, 36 Bimodal distribution, 164, 166, 187 Biocompatible, 272 B iopolymers,
binding of, 264 molecular weight determination of,
182
Blends, 387 binary, 395 characterization of, 393, 419 elaboration of, 42, 79 fractionation of, 398 interaction parameters in, 88 polymer, 127 ternary, 397
Boiling point, 48, 128 correlation with
B2S data, 17 energy, 36 van der Waals attraction, 36
Brush layer, 300, 305 -type network, 69, 286, 294
Calcium carbonate, 48, 63
oxide, 48
Calibration
treatment of, 60
surface energy of, 63,
column, 14, 46, 181, 186, 189, 199, 216, 222, 265, 270, 305
curves for polymer, 175, 392, 394, 402
universal, 175, 228, 273, 413
bridge design, 421 column, 46, 209 electrophoresis, 3 12, 3 16 model, 194 rise, 138 viscosity detection in, 420 zone electrophoresis, 21 8
atom, number of, 17, 35, 130, 151,
black, 19, 152, 157
fiber, 66, 75, 78, 82, 110, 111, 113,
microporous, 23 type of atom, 242, 246, 250, 255 with flat surfaces, 30
Capillary
Carbon
228, 230, 233, 242, 246, 254
surface energy of, 88
139
438 Index
Carrier gas, 2, 42, 127, 153, 168 flow rate of, 47, 54, 148 pressure o f , 13
dispersive energy of, 69 film, 46, 51
acetate fibers, 85 as stationary phase, 179 fibers, 68, 108, 128, 133
structure of, 92 surface
Cellophane
Cellulose
chemically modified, 133, 134
energy, 69, 72 properties, 44
Chain length effect on column permeability, 304 of polymer, 397, 403
and layer thickness, 322 and polyelectrolyte adsorption, 3 18,
322, 365 and potential, 185
Chemical composition of polymer blends, 387, 426
of surfaces, 43, 166 samples of different, 397 separation according to, 397
of polymer coating, 273 of polymer grafting, 300, 308
and surface heterogeneity, 162 on fibers, 133, 136, 139
Chemically-bonded silica column,
Clay
Charge density
and interaction energy, 39 1
Chemical stability
Chemical treatments
283
as a lamellar solid, 157 characterization, 98 mechanical properties of, 148
Coacervation, 3 14, 3 17 Coating, 88, 100, 135, 267, 273, 283,
317, 326 instability of, 274, of paper, 61, 91
Collapse of electrical double layer, 191 of grafted chain, 301
Colloidal silica, 174 separation of, 176
Column calibration, 2 16 conditioning, 168 dead volume of, 132 efficiency, 3 12, 3 16 flow rate, 5 , 149 gas compression in, 162 interstitial volume in, 5 , 389 overloading, 2 12 packing, 46 permeability, 301 -304, 308 plate number, 148, 176 porosity, 301 pressure drop in, 129 resolution, 269, 272, 284 schematic representation of, 340 temperature, 14
surface, 42, 77, 95 interfacial, 77, 88
Compatibilizer, 3 88 Composite, 42, 77, 103
Compatibility
acceptor, donor number of, 67 adhesive force in, 278 elaboration of, 108 interaction parameter in, 1 13 mechanical properties of, 82,
papers, 132 126
internal bond strength of, 138 surface characterics of, 133
Compressibility correction factor for gas, 56,
149 Condensation
approximation, 164 in micropores, 24, 33 of silanol groups, 279 prevention of, 15 reaction, 274
Configurational entropy, 322

Index 439
Conformation of adsorbed polymer, 333, 361 of grafted layer, 301, 308 of macromolecules, 389 of micelles, 373 of probe, 51
Connectiveness index, 236 Connectivity index, 228 Contact angle measurement, 44, 72, 126,
Copolymer blend, 393 Cork, 94, 113 Critical chromatography, 406, 412 Critical point of adsorption, 391, 403,
406,411, 414,421 Cross-linking, 277
agent, 267 degree of, 266
Crystalline silica, structure of, 157 surface energy of, 98
131, 138, 140, 146, 152
Debye length, 176, 182 Degree of micellization, 376 Degree of polymer coating, 267 Desorption, 45, 188, 269, 315, 331, 337,
359, 360, 379, 384 free energy of, 57, 58 free entropy of, 61 isotherm, 161
Destabilization colloid, 180
Detector, 12, 15, 45, 131, 147, 209, 317, 395, 397,403,411, 425
selective, 419, 420 Dipolar interactions, 152 Disc mobility, 347 Dispersion, 88, 105, 146
axial, 413 forces, 27, 30, 166
characteristics, 140 contribution, 126-133, 152 energy, 26, 61, 69, 72, 74, 76, 82, 85,
Dispersive
88, 92, 98, 104
[Dispersive] interactions, 126, 127, 147, 150,
properties, 68, 94, 108
coefficient, 389, 403 Gaussian, 5 nonequilibrium, 14 of adsorbed discs, 343, 346, 350 of adsorption energy, 162-166,
of chain segments, 333 of chemical groups, 160, 378, 403 of colloid in a capillary, 219 of contacts, 136 of electrons, 232, 247 of energy, 198 of molecular weight, 272, 278, 388,
395 of molecules, 2, 240, 244, 333, 389,
393 of potential, 198 of size, 177, 181, 187, 190, 208, 212,
222, 278, 312, 355, 368, 390 selective, 217
number, 52, 67, 111, 128, 131, 136, 146, 154
probe, 62, 66 properties, 127 site, 54
164
Distribution
169
Donor
Double layer thickness, 199
Efficiency, 148, 251, 312, 316 of fractionation, 385 of purification, 72 of separation, 212, 213, 314, 385 of silanol, 267
Electrical double layer, 181, 189, 195,
Electrolyte 198, 213, 217
concentration effect of, 195, 198, 199,
valence effect of, 198 213, 283, 284, 393
Electrophoretic mobility, 322, 324, 326

440 Index
Electrostatic forces, 30, 146, 363 induction, 26, 30 interactions, 27, 54, 153, 198, 247,
292, 312, 359, 390 Elutant, 364, 368, 384, 398 Elution
characteristics, 126 mode, 392 multiple solvent, 398 nonsteric effect in, 273 of probes, 127, 229, 282 order, 285 point method, 161 profile, 219, 233, 378, 395, 409, 428 rate, 369 sequence, 232, 247, 312 size effect in, 284, 312 time, 426 volume, 127, 175, 264, 292, 315, 385,
zone, 403
heterogeneity, 246 parameter, 26 stabilization, 322
barrier, 257 dispersion, 30 dispersive, 44, 48, 52, 74, 77, 82, 92-
electrostatic, 30 Gibbs free, 389, 404 interaction, 27, 30, 31 minimization, 23 of adsorption, 3, 34, 56, 61, 130, 150,
151, 162, 231, 330, 332, 337, 391
394
Energetic
Energy
95
distribution of, 163-168, 198 of bending, 36 of desorption, 57 of electrons, 228 of gas-solid interaction, 3, 19, 22 of interaction, 7, 10, 22, 157, 232, 344,
of molecules, 35 of self-association. 54
3 84
[Energy] of solvation, 155 standard free, 129 surface area of high, 23, 24, 44, 76,
surface, 42, 44, 56, 69, 72, 85 , 102- 138
105, 128, 130, 146, 148, 160 Enthalpy
of adsorption, 66, 67, 126, 129, 146,
of desorption, 61 of formation, 53, 154 of interaction, 13 1, 389 of reaction, 54, 154 of vaporization, 36, 67, 156
effect in interfacial tension, 138 interactions, 389, 391, 397
chain, 330 configurational, 322, 389, 390 of adsorption, 129, 146 of desorption, 61 standard, 60
of carbon atoms, 233 of immobilized molecules, 3 13 of silanol groups, 160
Equation of Drago, 154 Equilibrium partition coefficient, 265 Exchange process, 338 Exclusion
ion, 178 limit, 390 of heterogeneous polymer, 39 1 size, 150, 156, 384
150, 332, 337
Entropic
Entropy
Environment
chromatography, 174, 190- 194, 389,
mode, 389, 391, 403, 408 surface area, 346, 352, 358, 361
chromatography, 364, 385
392
Fiber(s), 42, 147 acid-base properties of
carbon, 110, 111 - .. I - . cellulose, 108, 1 10

Index 441
[Fiber( s)] glass, 111 polyethylene, 11 1 pulp, 108 untreated carbon, 111 untreated glass, 111 untreated polyethylene, 11 1
acid number of, 68 adhesion between, 138 adsorption isotherm on, 48 aramid, 44 based composite, 42 carbon, 68, 77, 82
graphitized, 82 cellulose acetate, 85 cellulosic, 68, 72 surface tension of, 133 chemical characteristics of, 43 column, 46 dispersive energy of, 76, 82 glass, 82-84, 364 heat of adsorption of, 133 interaction parameter between matrix
lignocellulosic, 55, 73, 74, 76, 126,
micro-, 355 paper, 128 polarity of, 133 polyamide, 84 polyethylene, 85, 126, 131, 132, 138 polyethylene terephthalate, 85 specific interaction parameter of, 13 1 sulfite pulp, 76 surface area of, 44, 380 surface modified, 78 thermally treated, 82 thermoplastic, 133 wetting characteristics of, 138
Finite concentration, 69 Henry’s law at, 45 inverse gas chromatography at, 160,
and, 67-68
131, 132
168 Flow rate
of carrier gas, 2, 4, 5, 12-17, 46, 55, 69, 129, 148, 162
[Flow rate]
Fluorescence detection, 209 Form factor, 186 Fractionation, 178, 186, 187, 678, 384,
393, 394 field flow, 223 of blends, 398 under shear, 364
absorption, 429, jump, 336, 345
of eluent, 175, 206, 212, 216, 272, 275
Frequency
Fugacity, 3 Fumed silica, surface energy of, 103 Functionality
polymer, 403 surface chemical, 274, 281
Gaussian peak, non, 14, 15 Geometric area, 24, 33 Gold colloid, 187, 208, 209, 219, 224 Gradient elution, 397, 398 Grafted
filler, 72 silica, 98, 103
Graft polymerization, 293, 296, 299 Grafting agent, 43, 74, 82-84, 88, 98,
103, 108, 158 polymeric, 133-135, 284
of alumina, 98 of muscovite, 158, 166 of silica, 98 prevention of, 148
Grinding
H bond, 152 Hard-soft acid base scale, 154 Heat
of adsorption, 19, 127, 133, 135, 136,
isosteric, 17, 26 treatment, 78, 82, 88, 98, 103, 111,
146, 160, 163
112, 168 Henry’s law, 26, 27,45
constant, 26, 30, 162 theory of electrophoresis, 323

442 Index
Heterogeneity chemical, 3 13 macro-, 166 molecular, 403 surface, 14, 20-24, 159-163, 166,
246 type, 393
Homogeneity chemical, 158, 397 of dispersion, 95 of distribution, 364, 378 of surfaces, 19, 25 parameter, 108 patches, 163
Humidity of carrier gas, 168 Hydrated silica, 355, 358 Hydrocarbons,
adsorbed, 88 adsorption of, 58, 157 aromatic, 251, 254 chains, 247 halogenated, 33
Hydrodynamic chromatography, 216, 384
wide-bore, 2 18 diameter, 187, 229 permeability, 301 radius, 320 thickness, 301, 320 volume, 216, 378, 384, 390, 392,
406 Hydrogen, 12, 24, 93
as inert canier gas, 46 bond acidity and basicity, 155 bonding, 43, 93, 162, 166, 385 energy per, 35 ion exchange, 355 treatment, 25
peroxide, 74 Hydrolysis, 274, 284, 293-295, 355
controlled, 180 Hydrophilic
eluent, 304 gel, 187 groups, 281, 283 polymer, 68
Hydrophobic adsorbent, 232, 244 agent, 133 effect, 312 factor, 228 force, 146 interaction, 152, 283, 284, 292, 385 matrix, 68 site, 138 surface properties, 283
surface, 189, 278, 279, 284 surface concentration of, 293
Hydroxyl groups, 274
Ideal gas, 130 Illites, 95, 98 Infinite dilution,
extrapolation at, 52 measurement at, 44, 56, 76, 82, 126,
128, 130, 147 In-plane mobility, 330, 344, 346, 384 Insertion phenomena, 157-159 Interac tion(s)
acid-base, 66, 68, 85, 127, 130, 135,
adsorbate-adsorbate, 26, 45, 47, 57 adsorbate-adsorbent, 6, 57, 60, 23 1 between matrix and filler, 42, 67 capacity of a solid, 163 composite-blend, 1 13 dispersive, 61, 126, 127, 130, 147 donor-acceptor, 61, 126, 127, 133, 136 double layer, 198 electrostatic, 54, 247, 390 energy, 146 enthalpic, 389, 397 enthalpy of, 155 entropic, 389, 391, 397 London potential of, 150, 155 mechanism, 155 molecular, 228, 231 nonpolar, 185, 187 nonspecific, 232 nonsteric, 264, 270 parameter, 64, 108, 112, 139, 291 physicochemical, 146
146, 153

Index 443
[Interaction( s)] polar, 127 polymer substrate, 384 polymer-polymer, 45, 126 polymer-solvent, 45 probe-substrate, 51, 62, 136, 150 solute-silica, 274, 282, 292 specific parameter of, 66 specific, 152, 229, 235, 246, 248, 254,
391, 404 Interfacial
adsorption energy, 337 area, 380 cake, 362 compatibility, 77 conformation, 333, 359, 379 exchange, 338, 378, 384 layer thickness, 134 phenomena, 330 reconformation, 359, 361, 373 relaxation, 378, 380 shear strength, 113, 139 tension, 138
Intermolecular cohesive energy, 93 hydrogen bonding, 93 probe interaction, 149
diameter of column, 132 pore, 265, 289 rotation, 257 standard, 178, 216
Intrinsic viscosity, 363, 41 1, 419-422 Ion exchange, 264, 265
chromatography, 3 12 Irreversible
adsorption, 149, 181, 195, 199, 331,
retention, 178
Internal
334, 337, 366, 397
James-Martin coefficient, 149 Jamming limit, 337, 343, 361 Jump,
frequency, 336, 344, 345, 347 length, 336, 343, 344
Kaolinite, 95, 98 Kinetic coefficient of adsorption, 33 1 -
333, 337, 357, 361
Lamellar product, 166 structure, 157
Laminar flow, 219, 233 Lateral resolution, 19 1 Layer thickness, 3 19-322 Lewis, 130, 153
acid-base interaction, 358 acid probe, 48, 52, 154 base probe, 48
Lignin, 44, 74, 88, 92 Linear hydrocarbons, 157, 158 Linear semicrystalline structure, 92 Localized model of adsorption, 330 London,
component of surface energy, 58, 84,
interaction potentiel, 150, 155 98, 130, 147
“Magic” agglomeration number, 208 Magnetic fluids, 186 Masking of silanol groups, 265, 267-271,
Matrix 308
acid number of, 68 adhesion, 28 1 chemical modification of, 69 liquid, 113 porous, 286, 290 surface compatibility, 42, 95
compression of carbon black, 88 oscillator method, 395 properties
Mechanical
of composites, 42, 68, 82, 126, 132,
of papers, 139, 140 of particles, 148, 181 of resins, 264, 300
Memory effect of the column, 195, 197 Metallic interaction, 153 Methanol-water mixture, 197
136, 139

444 Index
Methyl group, 25 1, 278 energy of adsorption of, 56, 58, 130,
-substituted polyaromatic hydrocarbon,
surface area of, 51, 58, 72, 76, 130
151
25 5
Mica, 98, 148, 166 Micellar solution, 366, 369-372 Microcapillarity, 69 Micropores, 72, 289 Mobile phase, 178
aqueous, 264 binary, 240 composition, 237, 240, 258, 274, 283 definition, 126, 132, 331 flow rate of, 129, 274 ionic strength of, 284 nonpolar, 231 organic concentration in, 24 1, 242 organic, 263 polar, 234, 244 properties of, 229 viscosity of, 315 water concentration in, 235, 241
Molar mass of probe, 163 Molecular
area, 52, 163 connectivity index, 228 dimensions, 222, 380 layer, 143 level of solid, 150, 158, 160, 168 method, 152 model, 51 modeling, 157 orbital theory, 154 organization, 385 parameters, 150, 227, 228, 246 probe, 126, 147, 157 sieve, 85, 357 size, 66, 166, 263, 284, 290, 291 structure, 228, 255 weight distribution, 300 weight, 48, 57, 155, 264, 265, 286-
290, 331, 338, 357, 363, 366, 378, 3 84
Molecule geometrv. 239
Monodisperse colloids, 191, 209, 212 particle test, 208 polymer, 286, 300, 393
Monomer concentration, 299, 300, 306,
Monomodal distribution function, 166 Morphology index, 157, 158 Multiple surface attachment, 294 Muscovite, 98, 146, 157, 166
307, 314
Nanomorphology index, 158 of surface, 148, 155-157
Negative peak, 185, 410 Nitrogen adsorption, 48
Nondispersive contribution to surface en-
Nonpolar interactions, 185 Nonpolar surface, 152 Nonspecific,
liquid, 290
ergy, 42, 44, 56
adsorption, 264 interactions, 150, 232, 265 surface adsorption, 264
Optical trapping, 2 19 Ostwald ripening, 202, 203 Overadsorption, 343, 347, 359, 373, 376 Oxidation, 203
anodic, 82, 111 electrolytic, 78, 11 1 nitric acid, 88 surface, 43
mineral, 44, 95, 98, 103, 146, 147,
organic, 48, 64, 74, 78, 264, 267, 282,
Oxides
154, 158, 174, 229
305, 398, 427
Packed column, 46, 128, 132, 174, 263, 272,
Packing(s), 46, 175, 182, 187, 215, 216, 303, 307
263-265, 270 v d , ionization, 189

Index 445
[Packing( s)] penetration, 187 profile, 341
Partition coefficient bulk, 59 equilibrium, 265 surface, 57, 60, 61, 129, 149
Peak(s), 152, 349, 372 adsorption, 369, 377 area, 197, 212 asymmetrical, 54, 55, 219 broad, 212 consecutive, 25 1 convection, 2 19 diffusion, 2 19 Gaussian, 175 height, 274 initial, 343, 370, 372, 376 monodisperse, 2 16 negative, 185 second, 166, 205, 209 shape, 285 shifting, 283 single, 155, 161 symmetrical, 54, 132, 219, 251 third, 208 width, 208
Permanent sorption of probe, 47 Phenolate group, 92 Photolysis, 185 Physical
adsorption, 2, 6, 18, 20, 26 characteristics
of paper, 139 of polymer, 147 of sorbent, 228
composition of bonded phase,
condition of chromatography,
interaction, 146 model, 163 nature of interaction, 42 properties, 3, 33, 36 surface imperfection, 24 treatment, 77, 162
28 1
230
Physicochemical affinity, 60 interaction between particles, 146 model of retention, 231 molecular parameter, 228, 230 properties of sorbate, 228, 23 1 surface characterization, 147 surface properties, 148, 163
of oligomers, 313 of polyelectrolytes, 3 14 of polymers, 3 13
Plasma treatment microwave, 88 of graphite, 112 of oxide, 98 of pulp, 76, 108
Plate height, 176 Polar
Phy sisorption
adsorbent, 229, 232 compounds, 272,406, 414 copolymer, 41 8 force, 166 homopolymer, 4 19 interaction, 127, 147 mobile phase, 233-235, 241, 244, 248 molecule, 52, 272 probe, 47, 51, 61-66, 88, 127, 130,
136, 148, 152, 155, 164 stationary phase, 393, 418 surface, 152, 229, 231
molar deformation, 156 molecular, 36 of stationary phase, 155 of surface atoms, 152 probe, 150
Polarizability
Polyacrylonitrile-based fiber, 78, 110, 11 1 Polyamide fiber, 84 Poly dispersi ty
diameter, 181, 209, 212-214 in polymer composition, 4 19 in polymer molecular weight, 313,
3 84 Polyelectrolyte, 199, 313, 379
adsorption, 315, 318, 322, 366, 378

446 Index
[Polyelectrolyte] layer, 318, 319, 320, 321, 326, 380 model, 363
characteristics, 37 8 coacervation, 3 14 desorption, 315, 384 exchange, 378, 384 immobilized, 3 14 molecular dimension of, 380 number of adsorbed, 365 -protein interaction, 326 reduced viscosity, 363 retention, 32 1 selectivity for protein separation, 3 14 treated glass, 317
Polyester, 82 Polyethylene, 68
as reference surface, 51, 152 fiber, 85, 111, 126, 132, 133, 138 glycol, 98, 281 oxide, 282 type polymer, 57 untreated surface, 136, 140
Polyethyleneimine, 3 12 Polyethyleneterephthalate, 85 Polystyrene, 357, 358, 388, 395, 398,
427, 429 as synthetic matrix, 69 block, 367, 368, 372 gel, 174 latex bead, 202, 359, 365 modified fiber, 77, 135 modified silica, 267, 289, 290 -polyvinylpyridine copolymer, 36 1, 366 resin, 263 rubber-modified, 388
Pore( s) adsorption
in, 85, 322, 389 in micro-, 2 in slit-like, 3, 8
condensation in micro-, 24, 33 contact area in micro-, 72 cylindrical, 179, 180, 198, 302 diffusion into, 174, 291
micro-, 72
[Pore (Ql geometry, 319 macro-, 265, 308 radius, 301, 319 random-plane, 179 size, 176, 187, 269, 282, 302, 308,
390, 402 spherical, 179 structure, 292 volume, 189, 265, 269, 289, 389, 391 wall, 300, 304
Precipitation/redissolution, 397, 403 Primary amino groups, 93 Printing ink pigment, 88, 105 Probe(s), 48, 126
acid-base properties of, 52, 64 electron donor-acceptor, 54, 66, 127 enthalpy of vaporization of, 67 heat of adsorption, 136, 163 interaction of, 51 mechanical retention of, 69 model, 67 n-alkane, 130, 147, 148, 151, 155, 156,
permanent sorption of, 47 retention time of, 47, 52, 55, 59, 128,
retention volume of, 61, 149 surface area of, 51, 130, 163
dispersive, 136 surface partition coefficient of, 129 surface tension, 131 topology index of, 156 volatile, 45, 168
adsorption, 312, 385
binding, 314, 315, 317-319, 321,
binding site, 31 1, 315 electrophoretic mobility of, 3 15, 322,
elution sequence of, 312 molecular dimension of, 3 12 net charge of, 324, 326 retention of, 314
158
149, 157
Protein( s)
model for, 334, 344
326
324

Index 447
[Protein(s)] selective binding of, 317 selectivity in separation of, 314
Pyrogenic silica, 148, 152, 158, 162, 175
Q effect, 205
Radial and axial concentration distribu-
Raman spectroscopy, 43, 275 Random walk, 330, 335, 336, 343-345 Reconformation, 359, 361, 373, 379 Reference line, 59, 62, 66, 136 Relative retention, 36, 313 Relaxation process, 360, 370, 378, 380,
Resolution, 326 improved, 215, 223, 265, 270 lateral, 191 molecular weight, 282, 292, 305 peak, 184, 185,426,428 poor, 189, 269 separation, 191, 251, 313, 414
tions, 219
385
Resolving power, 284 Retention, 313, 355
colloid, 178 copolymer, 398 homopolymer, 398 index, 36 mechanism, 228 model, 23 1-232 polyelectrolyte, 321 protein, 285, 292, 314 solute, 290, 364 sorbent, 228, 230, 233-255
Retention times, 2, 4-7, 12-17 and adsorbent size, 24 and adsorption isotherm, 161 and calibration plot, 181 and electrolyte concentration, 199, 202 and flow rate, 69 and internal standard, 178 and negative peak, 185 and particle diameter, 191, 208 and sample concentration, 195
[Retention times] and solubility parameter, 399 and surface properties, 45, 147, 157,
29 1 determination of, 54 net, 149 of potassium iodide, 192 of probe, 47, 127, 128 prediction of, 33 relative, 36
Retention volume, and adsorption sites, 157 and distribution coefficient, 389 and free energy of adsorption, 6 1-65 and hydrodynamic volume, 390 and molecular weight, 393, 401 and polymer interaction, 127 and retention time, 149 and surface energy of substrate, 72 and temperature dependence, 136 net, 56, 57, 59
Sample concentration effects, 195, 212,
Second gas-solid virial coefficient, 2, 3,
Secondary ion mass spectrometry, 43 Selective
369, 370, 377,419
6, 7, 10, 20, 24, 27
adsorption, 384 detection, 211, 388, 419 distribution, 217, 389 protein binding, 326 retardation, 339 separation, 146, 166, 228, 232, 312,
solvent, 358
mobile phase, 242 stationary phase, 242, 248
314, 352, 388
Selectivity
Silanol group, 162, 164, 166, 185, 246, 250, 285, 292, 293, 300, 308, 312, 355
Silica bare, 182, 185, 187, 215 -based resin, 265 colloidal, 174
440 Index
[Silica] crystalline, 157 gel surface, 36, 229, 246-250, 284,
grafted, 98, 103 hydroxylated, 227, 251, 255, 294, 355,
model surface, 158 modification, 266 particles, 95, 148, 178 polymer,
394, 398, 403, 406
365
coated, 268, 269, 270, 271-273, 300, 312, 313, 316, 326
grafted, 286, 289-292, 300, 302, 306, 309, 313
modification of, 313 precipitated, 158 pyrogenic, 152, 158, 162 silylation, 274, 275, 279, 281, 293, 294 wide pore, 181
Softness of acid and base, 154 Solvation energy, 155 Sorbate-cavity interaction, 26, 27, 30 Spatial configuration of probe, 51 Spreading pressure, 57, 129 Stabilizer, 180-183, 228 Stability
chemical, 273, 281, 300, 308 of colloids, 146, 198 of silica, 182 mechanical, 264, 300, 312 thermal, 264
adsorption state, 57 apparatus, 46 calibration plot, 268 colloids, 187, 216 enthalpy of adsorption, 129 entropy change, 60 entropy of adsorption, 129 free energy change, 60 free energy of adsorption, 129 internal, 178, 216 polymers, 189, 400 protein, 283 temperature, 13
Standard
[Standard]
150 variation in free energy of adsorption,
Stationary phase, 14, 45, 65, 166 adsorption at, 174, 182, 188, 274, 331,
composition, 176 packing, 132 partition coefficient, 59, 129, 389 surface energy of, 128
385, 390, 397
Statistical thermodynamic consideration,
Stereochemistry of probe, 150 Steric hindrance, 275, 277-283 Structural information,
2, 4, 330
on adsorbate, 35, 36, 228-234, 246,
on adsorbent, 2-6, 8, 10, 20, 23, 26, 313, 321, 359, 371, 385
28-30, 33, 69-108, 157, 160, 166, 169
Surfactant, 175, 217
Tacticity of macromolecule, 403 Tailing of peak, 14, 168, 182, 195 Talc, 95, 98, 148, 157, 166 Temperature determination, 5 , 12- 17, 47,
Theoretical plates number, 148 Thermal treatment, 78, 82, 88, 98 Thermodynamic equilibrium, 33 1, 359 Transmission electron microscopy, 174,
Two surface approach, 20-25, 32-34
132
179
Universal calibration, 175, 179, 266, 390
van der Waals interactions, 6, 8, 18, 24, 36, 127, 146, 156, 176
Vapor pressure, 13, 17, 48, 57, 66, 129, 148
Virial coefficient treatment, 2-6 Virus, 269
Wettability measurements, 78, 138, 146, 148 Wilhelmy-plate measurements, 48, 13 1, 138
Zeolite, 9, 10, 12, 26-31