Embed Size (px)
Citation preview
Hitotsubashi University Repository
TitleInteractions of the Spot Exchange Rates between the
RMB Onshore and Offshore Markets
Author(s) WANG, Zijiao
Citation
Issue Date 2018-03-20
Type Thesis or Dissertation
Text Version ETD
URL http://doi.org/10.15057/29128
Right

����0# CD142005
Interactions of the Spot Exchange Rates between the RMB Onshore and Offshore Markets
���'-(+&��,/)$'*(+&��,/)$%����
�!�����§§
�����# # ��. � �§
# # # # # # # # # # # # # # #
�# �"§ §

ii
Contents
�&-018.('*(/(054��,7§
�+$25(3��� �0531'6&5,10���§
�+$25(3��� � �,5(3$563(� (7,(8��§
±°§ÄÝâÕàÑÓâÙÞÝṧãÝÙÔÙàÕÓâÙÞÝÑÛ§äá§ÒÙÔÙàÕÓâÙÞÝÑÛ§·§
±±§ÉàÙÓÕ§ÛÙÜÙ⧹§ÕÖÖÕÓâÙäÕ§Þà§ÝÞ⧸§
±²§ÄÝâÕàäÕÝâÙÞݹ§áÙ×ÝÙÖÙÓÑÝâ§äá§ÙÝáÙ×ÝÙÖÙÓÑÝ⧧°±§
�+$25(3� � � (,07(45,*$5,10�1)�5+(��05(3$&5,10��(58((0�5+(� ����04+13(�$0'�
�))4+13(��$3-(54���0��/2,3,&$.��0$.:4,4�%$4('�10��163.:��$5$��§
²§°§¿ÕäÕÛÞßÜÕÝâá§ÞÖ§ËÕÝÜÙÝÒÙ§ÄÝâÕàÝÑâÙÞÝÑÛÙáܧ§°µ§
²±§¿ÕÖÕÓâá§ÞÖ§âØÕ§ÉàÕäÙÞãá§ÌâãÔç§ÑÝÔ§âØÕ§ÁÞã৽àÕÑÚâØàÞã×Øá§ÞÖ§ÍØÙá§ÌâãÔ秧±¯§
²²§ÍåÞ§ÃçßÞâØÕáÕ᧧±±§
²³ ¿Ñâѹ§ÌÞãàÓÕ«§ÌÕÛÕÓâÙÞݧÑÝÔ§¿ÙäÙáÙÞݧ§±´§
²³°§ÁÙäÕ§ÌãÒ¬ßÕàÙÞÔṧÀæÓØÑÝ×Õ§ËÑâÕ§àÙáÙÝקÖàÞܧ¯´§âÞ§±¨§§±´§
²³±§¾ÕÝâàÑÛ§ÉÑàÙâç§ÑÝÔ§ËÑÝ×Õ§ÞÖ§ÏÞÛÑâÙÛÙâ秧±¶§
²´§ÀÜßÙàÙÓÑÛ§¼ÝÑÛçáÙṧÄÝâÕàÑÓâÙÞÝá§ÒÕâåÕÕݧÌßÞâ§ÀæÓØÑÝ×Õ§ËÑâÕá§ÞÖ§âØÕ§¾ÈЧÑÝÔ§
¾ÈçÇÑàÚÕâ᧱·§
²´°§ÂàÑÝ×Õ৾ÑãáÑÛÙâç§ÍÕá⹧ÙݧÌãßßÞàâ§ÞÖ§ÃçßÞâØÕáÙ᧰§§±¸§
²´±§½ÀÅŬ¼˾çÇÞÔÕÛ§²°§
²´²§ËÕáãÛâṧÈÕå§ÁÙÝÔÙÝ×᧧²³§
²µ§ÌãÜÜÑà秧²µ§
�+$25(3����1(4��9&+$0*(� $5(�"3$',0*��$0'��.1&-��133(.$5,10��(58((0�5+(�
�04+13(�$0'��))4+13(��9&+$0*(� $5(���7,'(0&(�)31/� ����$3-(5� �§
³°§ÉàÙÓÕ§ÆÙÜÙâ§ÑÝÔ§ÍàÑÔÙÝק½ÑÝÔ§§²¶§
³°°§ÇÕÑáãàÕá§ÞÖ§ÉàÞÜÞâÙÝקÄÝâÕàÝÑâÙÞÝÑÛÙèÑâÙÞݧ§²·§
³°±§Ëǽ§ÀæÓØÑÝ×Õ§ËÕÖÞàÜ᧧²¸§
³±§ÆÙâÕàÑâãàÕ§ËÕäÙÕå ÍåÞ§¾ÑâÕ×ÞàÙÕ᧧³±§
³²§ÃçßÞâØÕáÙ᧧³µ§
³³§¿Ñâѹ§´¬ÜÙÝãâÕ§§³¶§
³´§ÌÕÕÜÙÝ×Ûç§ÎÝàÕÛÑâÕԧϼ˧ÜÞÔÕÛ§§³¶§
³´°§ÀÜßÙàÙÓÑÛ§àÕáãÛâ᧧³·§

iii
³´±§ÄÜßàÞäÕÔ§ÀæÓØÑÝ×Õ§ËÑâÕ§ÑÝÔ§ÁÛãÓâãÑâÙÞݧ§³¸§
³µ§¿ÏÀ¾¬Â¼Ë¾Ã§ÇÞÔÕÛ¹§ÌâàÕÝ×âØÕÝÙÝק½ÞâاÇÑàÚÕâ᧧³¸§
³¶§ÌãÜÜÑà秧́ °§
�+$25(3��� � �05(37(05,10�51��$3318�5+(�!23($'%(58((0�����$0'���#���§
´°§Äá§âØÕàÕ§¼Ýç§ÄÝâÕàäÕÝâÙÞݧÙݧ¾ÈçÜÑàÚÕâ§ÖàÞܧâØÕ§¾ØÙÝÕáÕ§¼ãâØÞàÙâ继§́ ±§
´±§ÍØÕ§ßàÕäÙÞãá§áâãÔç§ÑÒÞã⧾ÈçÑÝÔ§¾ÈЧÕæÓØÑÝ×Õ§àÑâÕ§§́ ´§
´²§ÃçßÞâØÕáÙ᧧́ ¶§
´³§ÇÙÝãâÕ§¿Ñâѧ§́ ·§
´³°§ÉÕàÙÞÔ§áÕÛÕÓâÙÞݧ©ÁÙ×ãàÕ§´¬°ª§§́ ¸§
´³±§ÍåÞ§ÄÝâÕàäÕÝâÙÞݧÙÝâÕàäÑÛ᧧µ°§
´´§ÀÜßÙàÙÓÑÛ§¼ÝÑÛçáÙ᧧µ°§
´´°§ÀÜßÙàÙÓÑÛ§ËÕáãÛâṧÙݧÌãßßÞàâ§ÞÖ§âØÕ§ÃçßÞâØÕáÙ᧰§§µ±§
´µ§ÌãÜÜÑà秧µ³§
�+$25(3��� � �10&.64,10��§
��� ����!���§
�,*63(4�$0'�"$%.(4���§
�22(0',9����§
§
§
§ §

iv
Acknowledgements
With sincere respect, I’d like to express my heartfelt gratitude to my supervisor,
Professor Eiji Ogawa and Professor Hisashi Nakamura, who has been guiding me
through my study in the past 4 years. I will always be indebted to their wise
recommendation, patient supervision and enlightening comments. It has been a great
honor for me to be able to benefit from their broad range of knowledge and in-depth
insight in the field of finance. I am deeply impressed by their excellent lectures as well
as profound thinking during the seminar study.
This dissertation will not be completed without Prof. Ogawa’s timely and
penetrating advice. He has taught me more than the academic skills and professional
knowledge for writing a dissertation. More importantly, he has taught me how to be a
good teacher, a brilliant scholar and an outstanding intellectual, and how to be a good
person with a sense of responsibility and generosity. Whenever I ran into some trouble
or puzzles at where to go, he is always there to offer generous direction and valuable
advice. Without his arduous support over the entire process of my doctoral study, this
dissertation would not be done.
My thanks also go to the faculty of the Graduate School of Commence and
Management at Hitotsubashi University. Special thanks go to Professor Hideyuki
Takamizawa, Professor Junko Shimizu, Professor Qunyong Wang, Professor
Zhongxian Liang, Professor Wendong Liu, Professor of Mudanjiang Normal University,
etc. Their stimulating lectures and enlightening knowledge and guidance has greatly

v
broadened my horizons and laid a solid academic foundation for my dissertation.
Finally, let me thank my beloved parents for their generous love and
understanding. They are always there with encouraging smiles and enormous supports.

1
§
Chapter 1 Introduction
Before 2009, the Chinese renminbi had been forbidden to exposure in the
international markets because of strict authority controls by Chinese government. US
dollars denominated transactions between Chinese companies and a foreign entity. The
2008 financial crisis rounded the alarm of China, in order to get rid of the U. S. dollar
control, renminbi internationalism, as a as the Pilot Scheme of Cross-Border Trade
Settlement, has been initiated and has undergone several landmarks during last 10 years.
History has seen, in 2007, the establishment of the offshore RMB bond market—
dim sum bonds; in 2008, the implementation of Cross-border Trade RMB Settlement
Pilot Project; in 2010, the establishment of Offshore Renminbi (CNH); in 2013, the
Shanghai Free Trade Zone (SFTZ) was established; in 2016, the initiation of Cross
Border Financing; and now, Renminbi has already become a reserve currency, a step
that marks its entry into the elite grouping of worldwide reserve currencies.
The above measures taken has surely accelerated the international use of Renminbi
over the past few years. According to Cheung and Rime, in 2013, the RMB became the
9th most actively traded currency and ranked the 17th in the world. In October 2013,
RMB rose to be the second most used currency in traditional trade finance covering
letters of credit and collections, and was the number 12th payments currency of the
world (SWIFT, 2013). These developments owe much to the expansion of offshore

2
RMB activities. Since then RMB has squeezed into the top ten, in 2017, the Phoenix
International said the RMB was ranked sixth in global trading and payment settlement.
China has become the second largest economy in the world.
In market participant’s eyes, the RMB transacted in Hong Kong is different from
the RMB in China, thus the RMB traded in Hong Kong was coined as CNH instead of
the usual trading symbol CNY. In this way, people use “RMB” as a general reference
to the Chinese currency renminbi, while CNY and CNH refer to the RMB currencies
transacted, respectively, onshore and offshore. RMB traded in offshore markets, such
as the CNH market, always has a different value to RMB traded in the CNY market,
e.g. while the CNY is not allowed to freely move on the mainland, the CNH has the
freedom to move and circulate without restrictions.
Anyhow, as Feng and Zhang propose�2017 ¢the development of the offshore
RMB market has not only promoted the RMB’s internationalization, but also has
affected the onshore RMB market. The offshore RMB market influences the onshore
RMB market through price transmission that includes exchange and interest rates.
Different values between the CNY and CNH will make it possible for people to run the
risk of arbitrage. Santana Nyekano (2016) points out, when the value of CNH was more
than that of the CNY, investors in China imported from Hong Kong thus increasing
CNH deposits, and when CNY grew in value more than CNH, the investors spent their
earnings on the mainland, which had the effect of reducing their CNH deposits. Based
on the above, this paper aims to investigate the interactions between CNY and CNH
from three aspects.

3
The paper’s first intention is to investigate the Renminbi (RMB) spot exchange
rates against USD to test the interaction between the onshore and offshore markets.
Like previous studies, the use of Granger Causality test and the BEKK-GARCH model
can verify the causalities of both the entire period and the five sub-periods between the
CNH and CNY exchange rates, and then to analyze the volatility spillovers between the
two markets. By means of the two methods, we hope to see whether the two markets
are interactive, and how they work concerning the directions and dimensions of the
information transmission between them. In this way, a better whole view is expected
about the interactions between the spot exchange rates of the CNH and CNY markets.
The empirical results will show the spillover effect in mean, and how the volatility
differs in different periods. We also hope to see whether hourly data analysis is a better
method detecting the subtle changes of the spot exchange rates between the CNY and
the CNH markets; how the bidirectional Granger causalities work between the CNY
and the CNH spot exchange rates in both the entire period and the five sub-periods. In
case the market volatility is high, whether the impacts become unidirectional or
bidirectional by the onshore intervention. What’s more, which renders a stronger
leading role for a longer time, within the opening year of the offshore market, the
exchange rate of CNH or the CNY ones? If there is the bidirectional interactions
between CNY and CNH spot exchange rate, we want a proof of the information
superiority of Chinese government by edging the CNY market over the offshore one,
at the same time, readjusting the exchange rate of the CNY based on the CNH changes
in exchange rates in line with market expectations.
4
The second intention is to reveal whether the exchange rate trading band blocks
correlation between the onshore and offshore exchange rate by evidence from RMB
market. Based on 5-minute of spot exchange rate data of the two markets, this paper
adopts seemingly unrelated VAR model and DVEC-GARCH model with the dummy
variable, to analyze the effects of the exchange rate reform after March 17, 2014. Based
on the hypothesis of the expansion of trading band increasing the correlation between
the two markets, the increase of trading band not only affects the linkage, but also
enhance the information transmission between the two markets.
By VAR model, it presents the liberalisation of trading band has increased the
correlation between the two markets, but unidirectional. The reason is that the
transaction frequency of CNY exchange rate is less than CNH. Due to the 5-minute
data selected, CNY may not change in 5 minutes, but CNH is affected by the existing
CNY values. At the same time, the selection period is too long, from January 1,2013 to
August 10, 2015, which may cause the policy influence to change or other policies to
affect the result. By DVEC-GARCH model with a shorter period, it presents the
increase of RMB exchange rate trading band policy not only strengthens the
information transmission of CNY market, but also strengthens that of CNH, and the
correlation between the two markets.
The third intention is to explore whether the Chinese government has intervened
in the RMB offshore market. If authorities intervene the offshore market, it is likely to
threaten market participants’ trust in the CNH market. It’s known that the purpose of
intervention in the CNH market is to influence the expectation of CNY depreciation as
5
well as to stabilize the Renminbi exchange rate by narrowing the spread between the
CNH and the CHY markets. Therefore, this study is designed to analyze how CNH and
CNY influence the spread between the two and to find out whether the Chinese
authorities intervenes in the offshore market, and then to estimate the time of
intervention.
It is said the offshore market is thought to be intervened twice for narrowing down
the spread between the CNH and CNY, one was on September 10, 2015; the other was
on January 12, 2016. Hong (2016) says the dramatic move was a result of the People's
Bank of China’s interventions to stop people shorting the currency. The paper makes
use of the 1-minute data between August 3, 2015 and February 5, 2016 for analysis.
The method employed is the impulse response function, to analyze influences between
variables in VAR model by observing its characters and study the accumulative effects
among the CNH and CNY exchange rate.
The finding is that among the intervention periods reported by the media, this
paper chooses the spread of sudden narrowing intervals. The main reason causing the
sudden narrow of the spread is the CNH exchange rate appreciation. At the same time,
the intervals which we choose are among the intervention period during which Chinese
authorities intervened CNH market, reported by Bloomberg and the Reuters, this paper
concludes that in the above four intervals, the Chinese authorities is more likely to
intervene CNH exchange rate.
The thesis consists of six parts:
6
Chapter 1 provides an introduction, which briefly introduces the background of
the Renminbi internationalization and the outline of the thesis.
Chapter 2 gives the literature review over the interactions between the between
the onshore and offshore markets, from where this thesis gets its stand ground, offering
a brief view about the previous study.
Chapter 3 deals with the empirical analysis over interactions between the CNY
and CNH markets with hourly data from January 3, 2011 to August 10, 2015, Granger
Causality Tests and the BEKK-GARCH model are used.
Chapter 4 concerns that the exchange rate trading band blocks correlation
between the onshore and offshore exchange rate by evidence from RMB market. It
adopts seemingly unrelated VAR model and DVEC-GARCH model, adding the dummy
variable of the policy change to analyze whether the restriction on trading band of
exchange rate affects the correlation and information transmission.
Chapter 5 investigates the possible interventions from the Chinese government
on CNH markets in narrowing the spread of foreign exchange rates between the CNY
and CNH markets. By the method of impulse response function, we analyze the 1-
minute data from CNH market and CNY market between August 3, 2015 to February
5, 2016 and find how CNH and CNY influence the spread between the two and to find
out whether the Chinese authorities intervenes in the offshore market, and then to
estimate the time of intervention.
Chapter 6 makes a conclusion with summaries and suggestions for the

7
government to make future policies.
8
Chapter 2 Literature Review
As Weller says (2016), “though China has reformed its currency policy to allow a
more market-determined exchange rate over the last few years, policymakers still have
significant influence over the yuan’s value”. This utters the voices of most scholars.
Empirical studies prove it and many have found a unidirectional influence, that is, the
domestic market holding the pricing power of RMB over that of the CNH (Zhu and Liu,
2012), or the CNY price has the leading role over that of the CNH (He and Zhang).
Upon the previous studies, the author plans to investigate more from the following three
aspects: the interactions, the interventions and the spread.
2.1 Interactions: unidirectional vs bidirectional
The current research about interactions of the spot exchange rates between CNY
and CNH markets can be classified into four categories: the ones that study spot
exchange rate along with forward exchange rate and NDF, the ones study it with
forward exchange rate, and the ones with NDF, and the ones focusing on spot exchange
rate. This means the refences on this topic are limited in number.(Table 2-1)
The present research related to interactions between the RMB onshore and
offshore markets shows two different perspectives: one view claims a unidirectional

9
correlation from the CNY exchange rate to that of the CNH, the onshore RMB spot rate
guiding that of the offshore (Xiong, 2011;Maziad, & Kang, 2012; Zhang, & Zhong,
2014; Yang, 2014). It is not applicable in reverse.
The other view is that, being affected by the new exchange rate reform, the
relations between the onshore and offshore spot rate is dynamic and time-varied,
tending to change from unidirectional correlation to bidirectional interactions, between
which the CNY market plays a leading role (Deng, 2016). In terms of research methods,
the previous study involves two: the Granger Causality Test (Xiong, 2011;Yang,
2014;Owyang, Wong, &Horowitz,2015) or the Garch Model (Leung, & Fu, 2014;
Maziad, & Kang, 2012).
The above sets up a relatively general framework of the studies on the interactions
between the CNY and CNH spot exchange rates, which reflects.
2.2 Price limit : effective or not
The prime purpose of the price limit, is to cool off the traders’ emotion and thus to
reduce the price volatility, which hinders the transmission of the stock price information.
However, regarding the effectiveness of price limit, there is some controversy in the
academic circle.
Price-limit supporters believe that it provides the opportunity for investors to
reevaluate the market information to reduce information asymmetry so to make a
rational choice by cooling off traders’ overreaction and reducing the volatility of price.

10
Arak & Cook�1997 , based on the analysis of the U.S. Treasury bond futures market,
concludes that the price limit causes a small price reversal when futures price is close
to price limit to make the market stable. Berkman & Lee (2002) use the data of Korean
stock market to find that the larger is the price limit, the more volatility of long-term
stock price is, meanwhile the trading volume reduces. While otherwise, the stricter is
the price limit, the more likely the volatility is restrained. Therefore, the strict price
limit in the emerging market is effective. The result of the analysis of Taiwan stock
market by Kim & Yang (2008) shows that only when the consecutive limit hitting
happens can restrain investor overreaction, and stock price volatility decrease. The
reduction of price volatility will certainly affect the transmission of the price
information.
Opponents argue that price limit is ineffective and will lead to price discovery
delay. At the same time, the price volatility restrained by the price limit will be
transmitted to the next trading day and cause the volatility spillover. Kim & Rhee�1997
point out in the study on the Tokyo stock market that the price limit increase volatility
in the stock market on subsequent days, lead to the delayed price discovery, with the
stock trading being interfered. In the later study of Kuala Lumpur stock market, they
(Chan¢Kim & Rhee, 2005) find that a wider price (30%) limit would also lead to
information asymmetry, price discovery delay, causing the imbalanced transaction.
Kim’s (2001) analysis on Taiwan stock market with 11 different price limit range shows
that the stricter the price limit is, the greater the volatility of stock price would be, while
the same analysis on Taiwan stock market by Huang et al. (2001) shows that
11
overreaction would occur on the following day of price limit, which means that price
limit does not retrain overreaction, only delay it. Lin et al. (2009) also investigate
Taiwan stock market get same result.
The interesting point is that, upon the data of Tokyo stock market, Deb et al. (2017),
using modified Kim & Rhee’s (1997) methodology, find that when the stock price hit
the lower limit, the volatility of the stock price is restrained, and the price volatility
spillover occur when the upper limit is hit. That includes both the proponents' opinions
and the opponents' opinions.
For the information transmission between different commodities in the same
market, Guo et al. (2017) believes that for the stocks hitting the price limit, informed
traders may choose the connected stocks as a substitute, meanwhile, the connected
stocks also provide an alternative for uninformed traders to reverse their earlier
suboptimal trades in anticipation of limit hit. That is to say, when the stock price hits
the limit, the information transmission to the related stock will be enhanced, and thus
the price volatility of the related stock will be increased.
Being different from stocks market, the foreign exchange market doesn’t force the
market participants to stop the buying and selling of exchange rate demands, but to
achieve the purpose of restraining exchange rate fluctuations by the central bank's
intervention, to keep exchange rates at a stable level by market mechanism. In this way,
so long as the exchange market has sufficient supplies, the market will be protected
from sudden rise or fall, and the spillover would not appear in exchange rate markets.
Therefore, the author believes the problems which the opponents of price limit worry

12
about would not emerge, the “price limit” will inhibit the information transmission
between the two markets.
2.3. Intervention: significant vs insignificant
In some scholars’ eyes, the Chinese government the PBOC sets a daily reference
rate for the CNY through an opaque process, traders are only allowed to sell or buy the
currency within a range of only 2% set by the daily fix. While the CNH enjoys a more
liberal trading band, the PBOC does sometimes influence its liquidity by regulating the
CNY exchange rate. They describe such a situation of the CNH as a sort of “black
market” for the country’s currency (Weller 2016) �
Though there is little previous study on the Chinese government’s intervention on
the CNH foreign exchange rate, the issue of foreign exchange rate intervention by
central banks has long been a debate. Some hold positive views. According to Liu
(2016), the effectiveness of foreign exchange intervention by central banks has been
studied extensively in the past thirty years. In general, it is a matter of controversy and
the subject of a vast academic and policy-related literature. Central banks continue to
intervene the foreign exchange rate, because authorities believe that intervention does
indeed bring positive effects, the advantages brought by intervention are more than
disadvantages.
For scholars like Friedman (1953), Almekinders and Eijffinger (1996) , Bonser-
Neal and Tanner (1996) insist that necessary intervention causes significant positive

13
effects on exchange rate volatilities, but some others hold that central banks officers are
lack of professional knowledge in foreign exchange marketplace, and, if there are no
enough reserve resources, interventions made by the bankers will cause turbulences, so
other researches by Baillie and Osterberg’s (1997) show that foreign exchange
intervention has no significant effect.
Scholars like Andrew and Broadbent (1994) , argue that most central banks
intervene with the main objective of stabilizing their exchange rate; they do not take
portfolio considerations into account. Schwartz, Anna J (1996) hold that the U.S. has
kept intervention on foreign exchange rate since 1962, The tests of Michael McKenzie
(2004) show that the Australian central bank has achieved its goal by intervention as
evidenced by its trading profit of AUD$3.4bn over the period December 1983 to June
1994. Ito (2002) points out, in the past, Japanese foreign exchange intervention was
almost universally sterilized.
As for the issue of whether Chinese government intervene in the exchange rate of
foreign exchange rate, Robert et al (2016) have proved that there are indicates showing
Chinese intervention thwarted the market forces driving the exchange rate. They say
that “the Chinese monetary authorities mainly deploy two tools to prevent or restrict
undesirable fluctuations in the exchange rate: one is the government controlled central
parity rate and the other is the band in which the RMB rate is allowed to fluctuate in
the marketplace”.
These two tools, as we will see in the later chapter, have both been employed in
the foreign exchange rates between CNY and CNH for keeping exchange rate balance

14
between the two markets.
In the process of study, the most embarrassing situation is that the Chinese
Central bank has always been ashamed to release the data concerns the interactions
between FX rates of the CNY and CNH. The author has to spend a lot of time searching
for data. Moreover, the most difficult thing for the author is to consult the literature
relevant to the interventions of the Chinese authorities in the FX rate of the RMB
offshore markets. The current information about it has mainly been in the forms of
media release and IMF working reports. The last and the most regrettable is that data
concerning the intervening the FX rates between the CNY and CNH remains
incomplete, too expensive for any academic institutions to buy. Thus, there is still some
limits in the work.

15
Chapter 3 Reinvestigation of the Interaction Between the
RMB Onshore and Offshore Markets: An Empirical Analysis
based on Hourly Data
Since the global financial crisis in 2008, there has been an urgent need for China
to have the Renminbi internationalized for its economic integration into the global
financial system as well as freedom from USD hegemony1. With its rising status in
international trade, “China has become the second largest economy after the U.S. and
second largest exporter after the euro area…In fact, China has become the most central
economy to global trade, supporting demand for the RMB as a currency of settlement
for cross-border trade (Maziad, & Kang, 2012)”. As long as the USD is the dominant
invoicing, investment, and reserve currency in the world, China will always be under
risks whenever USD depreciation takes place, for it will cause huge losses to China. As
a firm step towards internationalizing its currency, Beijing began to encourage the use
of Renminbi in international trade, swap arrangements between central banks, and bank
deposits and bond issuances in Hong Kong (Mallaby, & Wethington, 2012).
§§§§§§§§§§§§§§§§§§§§§§§§§§§§§§§§§§§§§§§§§§§§°§As Bowles and Wang (2013) noted, “Renminbi internationalization measures have been introduced as responses to crises — first the Asian financial crisis, then the global financial crisis.” Their conclusion is that instead of the “Grand Design” of becoming the world’s dominant currency, the internationalization of the Renminbi has arisen as a policy response to crises, it is only a journey to normalization.§
16
3. 1 Developments of Renminbi Internationalism
The internationalization of the Renminbi means the use of currency beyond the
jurisdiction of the Peoples’ Republic of China and allows nonresidents to hold the
Renminbi extensively overseas as a currency for routine payments, settlements,
investments, and reserves. We can measure the level of the RMB internationalization
by the RMB internationalization index (RII) compiled by the International Monetary
Institute at Renmin University of China (Figure 3-1). The RII starts from the basic
functions of international currencies (measure of value, means of payment, and store of
value), and at the same time takes into consideration the functions of international
valuation and payment (in trades and finance), and the function of the international
reserve. From the time that the pilot scheme of the RMB denominated cross-border
trade settlement was announced in 2009, the Renminbi gradually moved onto the
international stage. The RII in the first season of 2010 was 0.02. The RII has presented
a faster growth trend since 2012, when the proportion of the RMB international
financial denominated settlement in the world speeded up, the RII presented a faster
growth trend. In accordance with the introduction of the RMB cross-border policy, as
well as improvement of the RMB offshore and the clearing system, Renminbi business
expanded year-by-year in the international trades, finance and in the foreign exchange
reserve. Also, the RII also presented a leap in 2014, reaching a proportion of 2.47.
Though the RII fell back somewhat in 2015, because of the domestic downward
pressure on the economy, it was still on the rise overall by reaching to 3.60, with an
increase of 46% compared to that in the year before. It is worth mentioning that on
17
November 30th, 2015, the IMF’s Executive Board decided to include the RMB in the
Special Drawing Rights (SDR), which is an important milestone for the RMB on its
road to internationalization.
During seven years, as a trade settlement currency, the offshore RMB-
denominated trade settlement business grew steadily in the international market, the
range of holding and using RMB also expanded, an indication that the Hong Kong
offshore market played an important role.
As the premier offshore Renminbi business center, the Hong Kong Renminbi
offshore market2 came into being on July 19, 2010, when the People's Bank of China
�PBOC and the Bank of China(Hong Kong) signed the amendment of Settlement
Agreement on the Clearing of Renminbi Businesses. Since then, offshore markets3 have
experienced an exponential growth of Renminbi as a trading currency for cross-border
RMB trade settlement. According to the report by BOCHK, the RMB-denominated of
trade settlements processed by Hong Kong offshore jumped over 10 times from 369.2
billion yuan in 2010 to 3.841 trillion in 2013. By the end of 2015, the annual value of
RMB cross-border trade settlements reached 7.23 trillion yuan 4 , nearly doubled
§§§§§§§§§§§§§§§§§§§§§§§§§§§§§§§§§§§§§§§§§§§§±§ In respect of the offshore market, He and McCauley (2010) claims, “When non-US residents use the US dollar to settle trade and make investments, they do not transact onshore through banks and in financial markets in the United States. Rather, they concentrate their transactions in international financial centres such as the Eurodollar market in London. In fact, one may argue that, without the offshore markets, the US dollar would not have attained the dominant position in international trade and payments that it occupies today.”§²§ In Liu (2015) ’s view, “Traditional offshore market, such as Eurodollar market, was established mainly to expand business hour and escape regulation, so government wouldn’t foster its development. In contrast, CNH market was officially launched in a high profile manner, and it’s regarded as an experiment field for further financial reform in mainland China.”§³§HKMA¢2015.§
18
compared with that in 2013.It not only accounts for 29.36% of China’s total foreign
exports and imports in 2015, but also increases by 4.6% from the year before. By then,
the CNH market fully played its role as the important platform to improve the RMB
external circulation system in the process of the RMB internationalization. It accounts
for 94.5% of the total annual trade, of which 6.8331 trillion yuan was settled in the
Hong Kong offshore market.
According to the Settlement Agreement on the Clearing of Renminbi Businesses,
RMB deposits in Hong Kong can be transferred between banks, and, for enterprises,
the upper limits of currency conversion has been removed. Free trade of various
financial commodities such as RMB convertibility, RMB deposits, and the issuance of
RMB denominated bonds, have become reality. Since then, RMB foreign exchange
markets between HK banks picked up speed, and continue to enhance the market
liquidity, along with an increase of participants based on RMB cross-border trade
settlements. In December 2015, the daily trading of Renminbi and foreign currency on
HK offshore market reached 962.7 billion yuan. Meanwhile, the amount of RMB
deposits in Hong Kong stood at 851.1 billion yuan5.
Unlike the Shanghai CNY market which is regulated by the People’s Bank of
China, RMB-FX transactions on the offshore market in Hong Kong are wholly
determined by market supply and demand, and thus it is called the CNH market
(offshore market). On the one hand, the offshore market fixes its price in accordance
with market supply and demand, suitable for transactions between the non-residents in
§§§§§§§§§§§§§§§§§§§§§§§§§§§§§§§§§§§§§§§§§§§§´§HKMA¢2015§

19
China. So, market participants can buy and sell RMB freely for trading, speculations,
investment and so on. On the other hand, the CNY market in Shanghai is subject to the
regulation of the People’s Bank of China, serving all legitimate transactions on
mainland China, such as the current account transactions like RMB trade settlements,
imports and exports, services, and Foreign Direct Investment (FDI). The onshore and
offshore markets also differ in their exchange rate regimes as well as in their market
participants and motives (see Table 3-1). In fact, there has formed a two-tier exchange
rate system for the RMB markets, indicating possible interactions between the onshore
and the offshore. Since the offshore is free from the BOPC’s control, “Unexpected
exchange rate fluctuations and exchange rate exposure risks, have been a major source
of uncertainty to multinational corporations around the world (Chen, Lee, Lee &Huang,
2016).” Therefore, it is necessary to reveal these interactions and evidence of spillovers
between spot exchange rates on the CNY and CNH markets. The differences between
the CNY market and CNH market are exposed by Table 3-1.
The paper carries out this study by employing econometric analysis with hourly
data from January 3, 2011 to August 10, 2015. Granger Causality Tests and the BEKK-
GARCH model are used, one is to testify the causality between CNH and CNY spot
exchange rates, the other is to analyze the volatility spillover effects of both markets.
Firstly, we examine the interactions between the two markets within the entire period,
and then split the whole period into five sub-periods based on the market fluctuation
and policy adjustment. The result of the analysis may provide both reference data for
the onshore RMB exchange rate stability-oriented policy and policy suggestions for

20
capital control of the onshore RMB market to promote the development of the offshore
RMB market.
3.2 Defects of the Previous Study and the Four Breakthroughs of This
Study
To find out whether there are interactions between the RMB onshore and offshore
spot rate markets, the paper identifies the causality and the volatility spillovers effects,
i.e. the information fluidity between the two markets.
A fact that previous studies overlooked is that if we take the forward exchange rate
or NDF into consideration on base of spot exchange rate, then we have to consider the
changes in interest rates affecting the interaction, which makes the problem more
complicated. Since the HIBOR appear relatively late on June 24th, 2013¢far later than
the research period, the thesis’s focus is solely on interactions of spot exchange rates
between the two markets, excluding the forward exchange rate and NDF.
The defects of the previous study are as follows: the first is the insufficient
coverage of the data chosen. Most sample data chosen is within a two-year period, for
example, Xiong(2001) covers from August 23, 2010 to June 17, 2011¥Maziad and
Kang(2012) cover from January 3, 2011 to September 16, 2011; only Yang (2014) ’s
sample data covers more than three years, which is from October 1st, 2011 to January
2nd, 2014. The second is that most of previous studies employ the closing price as
sample data to explore the interactions of spot exchange rates between CNH and CNY.
21
In fact, the CNY market closes earlier than that of CNH and, as efficient markets
respond instantly to new information, this will surely leave space for changes in the
latter. Therefore, if the daily closing price is used as the research data, it is hard to detect
the prompt changing relationships between the two. The third is that the existing studies
basically cover the entire period, which cannot reflect exact variations in exchange rates
between CNY and CNH markets. External stimulus and policy variation, also possibly
influence for changes in the relations between exchange rates of the two markets. The
fourth is, in terms of methods, most scholars adopted the Granger Causality Tests or the
GARCH Model to explore the interactions between the two markets, very few
synthesize the advantages of both methods.
Therefore, in order to resolve the above-mentioned shortcomings, this paper aims
to achieve the four breakthroughs: First, in regards to the sample period, the data covers
a period of four and a half years, which is from Jan. 3,2011 to August 10th, 2015, with
a larger span, presenting a more complete view of the changing relation between the
two markets. Second, differing from the existing results, the paper chooses hourly data
of RMB transactions to research the exchange rates between CNY and CNH markets,
which can more promptly describe the interactions between the RMB onshore and
offshore markets. Thirdly¢while studying the relationships in the entire period, it is
further split into five sub-periods according to external stimulus and policy variation.
The thesis analyzes each sub-period to discover whether the relationship between the
CNH and CNY exchange rates changes or not at different times. Fourthly, as far as
research methods are concerned, this paper not only adopts Granger causality to certify

22
the causality of both the entire period and each sub-period, but also employs the BEKK-
GARCH model to analyze the volatility spillover effects between the two markets. In
this way, we can accurately certify the interactions between the CNY and CNH spot
rate exchange, as well as the directions of information transmission between the two
markets. The breakthroughs of this paper can provide sufficient evidence as reference
to promote the healthy development of the CNH and CNY markets, and at the same
time, to prevent financial risks.
3.3 Two Hypotheses
As one of the China’s national strategies, the establishment and development of
the Renminbi offshore are the embodiments of the process to the Renminbi
internationalization. It is different from foreign countries in which the emergence of the
offshore markets overseas is spontaneous, e.g. Japan, the United States and the U.K.
Direct trading can be done between the onshore and offshore markets with no regulation.
Therefore, the exchange rates between the offshore and onshore markets are completely
interactive and almost equal. The reasons for the Renminbi offshore to be different are
as follows: firstly, it is the Chinese government that has promoted the offshore market;
secondly, the capital accounts in China has not achieved free convertibility; thirdly, the
financial management system is still imperfect. In this way, there are two completely
different RMB exchange rate formation mechanisms in the foreign exchange rate
markets: one is the onshore exchange rate formation mechanism manipulated by the

23
PBOC, the other is the offshore Renminbi exchange rate formation mechanism
determined by the market demand and supply, thus formed the fundamental difference:
direct trading is forbidden between CNH and CNY markets due to the regulation of
cross-border capital transactions.
But, restrained by the different exchange rate systems and affected by the
participants with different trading motivations, there is a certain price gap between the
exchange rates of the two markets, possibility of arbitrage will arise for the store of
value¥ especially when under certain circumstances (cross-border RMB trade
settlement), indirect transactions can be made between the two markets, which may
also lead to arbitrage. For example¢between a parent company in China and its branch
company in HK, investors may practice arbitrage transactions by false invoice, though
very slim, the offshore takes its shape related to the CNY exchange rate�Sato, 2012 .
At the same time, the foreign exchange settlement derived from export payment via the
commercial or bank agents will also generate revenue from the exchange rate spread.
Just as Li (2011) points out, “After the promotion of the RMB cross-border trade
settlement, the long-expected Renminbi appreciation overseas causes a higher RMB
exchange rate against USD in the offshore market, which will greatly increase the space
for enterprises to arbitrage bilaterally.” Thus the existing arbitrage surely causes
interactions between CNH and CNY.
Murase (2013) also mentioned that¢ the CNH and CNY exchange rates are
mutually interactive. Since the CNH exchange rate reflects RMB’s market changing
trend, the CNY exchange rate may follow that trend, and vice versa. The CNY price

24
mirrors most information about RMB value variations, the price shocks brought by the
various information flow will be first reflected in the CNY price, and then transmitted
onto the price of CNH (Wu, 2015). Even though there is no arbitrage, the CNH and
CNY exchange rates are still mutually interactive, giving rise to bidirectional Granger
casualty.
Thereby hypothesis 1 is proposed: there exists Granger Casualty between the CNH
and CNY exchange rates mutually.
As a managed floating exchange rate system, the RMB exchange rate of the CNY
market is only allowed to change within the Trading Band according to the daily
reference rate set by the People’s Bank of China. In other words, the CNY exchange
rate is fixed daily by the PBOC, which better reflects the exchange rate policy of the
authority, indicating its local advantages compared with the CNH exchange rate.
Therefore, the information is first transmitted from the CNY market to the CNH market.
Despite its rapid development, the offshore market is still smaller than its onshore
counterpart, for the transaction volume of the onshore spot market is bigger than that
of offshore. Hence, the exchange rate of the CNY market has the initiative to price the
RMB, playing a guiding role to the CNH exchange rate (Wu, & Pei, 2012). Leung and
Fu (2014) also concluded by their empirical analysis that the CNY exchange rate plays
a leading role in the volatility transmission between the two markets because of the
recent relaxation of capital control measures and other regulations, which shows the
dominant role of the onshore authority in the interactions by monetary policies. Despite
25
the mutual causality between the two markets, the CNY exchange rate plays a leading
role.
Thereby hypothesis 2 is proposed: compared with the CNH¢the CNY exchange
rate is more influential, playing a leading role in the RMB’s information transmission.
3.4 Data: Source, Selection and Division
As we have said, the current studies choose the closing price for data analysis
concerning the exchange rate interactions between the onshore and offshore markets.
The weakness in these is that the onshore market closes earlier than the offshore. At
first, there is a 30 minute difference, then, with the CNH trading hours being extended,
the difference expands to 7 hours¢and to 12 and a half hours from October 1, 2014
(see Table 3-1, Note3). The exchange rate of the offshore market can be influenced by
the closing price of the CNY market so, if we analyze using the closing time data, there
will be a deviation in the empirical result. Therefore taking the difference in closing
time into account, this paper starts with the hourly data, selecting 7 hour points of CNY
and CNH exchange rates of simultaneous transactions at 10:00, 11:00, 12:00, 13:00,
14:00, 15:00, and 16:00 from January 3, 2011 to August 10, 2015,as well as the closing
price for data analysis in comparison. In doing this, it is hoped that we can obtain more
sensitive and accurate interconnects between the two markets. The data source is
Bloomberg.
3.4.1 Five Sub-periods: Exchange Rate rising from 0.5 to 2%

26
This paper splits the whole period into five sub-periods by the influence of external
stimulus and policy variation. We first divide the whole period into 3 periods: 0.5%
(sub-periods A+B+C), 1%( period D) and 2% (period E) by the Trading Band of CNY
market. And then we find that, when the CNY exchange rate has the Trading Band
within 0.5% (sub-periods A+B+C), the CNH exchange rate changes greatly (see Figure
3-2 and Figure 3-3) because of Italy’s sovereign debt rating being downgraded. So,
period B is taken out as a separate period and, in this way, the range of 0.5% is further
divided into three sub-periods (periods A, B and C).
The details of the divisions are as follows.
Period A: From January 3, 2011 to September 20, 2011.
On average, the trading band of the RMB exchange rate against the US Dollar
moved 0.5% below or above the rate set by PBOC in a single day on average.
Period B: From September 21, 2011 to December 30, 2011
In this period, Italy’s sovereign debt rating was downgraded one notch by the
American international credit rating agency Standard & Poor's Corporation. Its
negative prospect not only intensified the investors’ worries about the European debt
crisis, but also stimulated more demands for dollars to hedge risks. Meanwhile the CNH
exchange rate was decreased by a big margin. Besides, in December 2011, some banks
and enterprises in both Europe and America repatriated more capital to their domestic
markets to reduce the total indebtedness and improve their balance sheets. Therefore,
the RMB weakened against the U.S. dollar, a proof of the RMB’s reversal on the Hong
Kong offshore market. But the daily trading band of the currency against the U.S.

27
dollars was still 0.5%.
Period C: From January 2, 2012 to April 13, 2012
The daily band of the RMB exchange rate against the U.S. dollar moved on
average, above or below 0.5%.
Period D: From April 16, 2012 to April 14, 2014.
The People’s Bank of China announced that the daily trading band of the RMB
exchange rate against the U.S. dollar widened to an average of 1% above or below the
rate set by the PBOC on any given day since April 16, 2012.
Period E: From March 17, 2014 to August 10, 2015.
The People’s Bank of China announced that the daily trading band of the RMB
exchange rate against the U.S. dollar was widened by 2% on average for each single
day since March 17, 2014.
3.4.2 Central Parity and Range of Volatility
The CNY is managed floating exchange rate system, restricted by the trading band.
The benchmark of the trading band is called “central parity rate” which is announced
at 9:15 each day by the China Foreign Exchange Trading Center. The CNY fluctuates
within the upper and lower limits of the specified floating range. The central parity rate
of Renminbi is calculated by eliminating the highest and lowest quotations which are
requested from the market maker in the interbank system every day, to a weighted
average figured out by the China Foreign Exchange Trading Center. It is clearly seen
from Figure 3-4 that the CNY volatility range against the central parity rate maintained
within 0.5% before the exchange rate reform on April 16th, 2012, and then the volatility

28
rose to 1% after the reform. Again, after the exchange rate on March 17, 2014, the
volatility range of the CNY rapidly exceeded 1%, and then remained above 1% after
December 2014. Meanwhile, the expansion of the volatility is bound to affect the
correlation between the two markets. We can see from Figure 3-2 and Figure 3-3, in
period B, there is a sharp wave on the CNH market, the maximum of spread between
CNH and CNY exceeded 0.12. Therefore, this paper takes the first step to do the period
partition according to the CNY trading band limitation, and then takes out the period
affected by the Italy’s sovereign debt rating downgraded as a separate period, in which
there is greater change for the CNH exchange rate (Figure 3-2). Table 3-2 lists the
descriptive statistics of the CNH and CNY hourly data.
3.5 Empirical Analysis: Interactions between Spot Exchange Rates of
the CNY and CNH Markets
To test the stationary time series used in the analysis, the paper employs the Unit
Root Test for analyzing the stability of the exchange rate between the CNH and CNY
markets. Table 3-3 is the results of the Unit Root Test. All the results of the unit root
test for the whole period and each sub-period show that, the test for all the level
variables accept the hypothesis and the first differenced variables accept the hypothesis.
So, both the CNH and CNY exchange rates have one unit root. This paper adopts
change rate (the differenced series of the logarithm) for the following econometric
models.

29
We first employ the Granger Casualty Test to verify the causalities of both the
entire period and the sub-periods between the CNH and CNY exchange rates, and then
adopt the BEKK – GARCH model to analyze the volatility spillovers between the two
markets. By means of the two methods, we can analyze whether the two markets are
interactive, as well as the directions and dimensions of the information transmission
between them. In this way, we hope to get a better whole view about the interactions
between the spot exchange rates of the CNH and CNY markets.
3.5.1 Granger Causality Test: in Support of Hypothesis 1
The paper aims to analyze if there is the Granger causality between the CNH and
CNY exchange rate at each hour from 10:00 to 16:00 during the entire period and each
sub-period. At the same time, by way of contrast, we also analyze the closing price to
see if there is causality between the two markets.
The results are manifested in Table 3-4 and Table 3-5 via the Granger casualty test.
Over the entire period, there exists bidirectional causality between the two markets
and, it is also evident in the sub-periods A, D and E. Thus, hypothesis 1 is tenable,
meaning the two markets are interactive.
The fundamental reason for the result is that the exchange rate of the CNH reflects
not only the changing trend of the RMB, but also the local superiority of the CNY
market in information transmission, indicating the interactions between the two markets.
The fact that the currency is unified determines the unification and interactions between
the CNH and CNY from within, despite the different exchange rate systems. The
influence of arbitrage cannot be neglected, though in the case of no-arbitrage, the two

30
markets interact with each other. Price difference between the CNH and CNY caused
by the existence of cross-border capital controls becomes the very reason for the
speculation opportunity. Market speculators speculate by taking advantage of the
loophole of cross-border RMB trade settlement, giving rise to certain interactions in the
exchange rates between the CNH and CNY markets. This is an arbitrage of the rate
disparity between a restricted China and the free market. If free arbitrage is allowed
between the two markets, then the gap should disappear, or near zero. When there is
always a spread between the CNY and CNH exchange rates, there is little speculation,
a proof that the RMB capital regulation is still effective (Figure 3-2).
But there exists unidirectional causality in the B and C sub-periods from the CNH
to the CNY exchange rate, with no converse causality. This means that Hypothesis 1 is
untenable in these two sub-periods. In order to find out reasons for the unidirectional
causality during the B and C sub-periods, the average volatility has been calculated
between the CNH and CNY change rate during each subperiod�Table 3-6 . We can
see from Table 3-6 that the average volatility of the exchange rate concerning rate of
change during the A, D, E sub-periods is about 0.0004, while the average spillover
during the B and C sub-periods is relatively larger, at an exchange rate of 0.00202 and
0.0006 on the CNH market, while that on the CNY is 0.0008 and 0.0006. The volatility
of the two markets is relatively greater during the subperiods B and C. By the results
of the Granger causality test, we can see that, when there is greater volatility on the
markets, there is only unidirectional Granger causality from CNH to CNY.
The reason is that the CNY market has a closed nature with a managed floating
31
exchange rate system, which limits the trading band, and implies the PBOC will
intervene in the onshore market according to the market situation. Therefore, the CNH
exchange rate may suggest higher volatility than that of the CNY, which is shown more
obviously when there is greater market fluctuation. Due to the intervention of the
People's Bank of China, the changes of the CNY exchange rate are suppressed when
necessary. With the anticipation of the whole trend of the RMB exchange rate, the
offshore participants’ demand for selling RMB is still great, therefore investors in the
offshore market will ignore the intervened changes of the CNY exchange rate, CNY’s
influence over CNH in this case seems to disappear. On the other hand, the offshore
market more closely reflects the RMB future trend, even if the CNY exchange rate is
intervened upon, the exchange rate of the CNH will still exert influence over that of the
CNH.
Looking at the closing prices, there is almost no causality between the two markets
except in period E, during which there is mutual Granger causality.
Most researchers claim that the CNY exchange rate is the Granger causality of the
CNH one, but while conversely there is no causality. In the author’s view, this is because
the CNY market closes earlier than the CNH market, so, information will be naturally
transmitted to the CNH, causing some deviation in the empirical results. The results of
the hourly data analysis in this paper prove this.
3.5.2 BEKK-GARCH Model
In order to investigate the information transmission direction between the two
markets, we adopt the multiple GARCH model (BEKK-GARCH model) proposed by

32
Engle and Kroner�1995 for testifying the volatility spillover effects of the two markets.
This method is the same as that of Maziad and Kang’s�2012 .
Considering the influence of the volatility between various markets, the BEKK-
GARCH Model can both analyze the volatility spillover of the different markets, and
at the same time, reduce the numbers of the parameters to be estimated, thus
guaranteeing the variance-covariance matrix positive definite.
The concrete BEKK-GARCH Model¤
The mean equation is:
!"¦#¡$!"%& + ("|*"%&~,(0,0") (1)
Since the paper aims to analyze the volatility between the two markets, we employ
the binary BEKK-GARCH (1,1) for analysis. In this way, the mean equation becomes
the Two Variable Matrix (2).
34&,"45,"6 = 3
#8 + 8
$&& $&5$5& $55
9 34&,"%&45,"%&6 + 3
(&,"(5,"6 (2)
Y; refers to the return rate of exchange rates in the onshore and offshore markets.
The subscript 1 is the CNH exchange rate, and the subscript 2 is the CNY exchange
rate. θ refers to the influence the CNH exchange rate (CNY exchange rate) volatility
in t-1 phase has on the volatility of the CNY exchange (CNH exchange rate) rate in the
phase of t. (" is the residual term of the mean equation, under the information set
before 1 phase, obeying the mean value of 0 variance which is the normal distribution
of H;.
Variance equation¤

33
0" = >?> + @?("%&("%&?@ + A?0"%&A (3)
0" = BC&,"5 C&5,"
C&5," C5,"5 D , > = 8
E&& 0E5& E55
9 , @ = 3F&& F&5F5& F55
6 , A = 8G&& G&5G5& G55
9
C is a lower triangular matrix. A is a 2*2 matrix, referring to the coefficient of
ARCH term which represents the degree of influence from the random disturbances
with past value of the return rate series over the current conditional variance. While the
diagonal parameter is used to measure the early impact of the single market on the
current volatility, the non-diagonal parameter is used to evaluate the shock spillover
effect between the two markets. B is a 2*2 matrix, referring to GARCH term coefficient
which represents the degree of influence from the predictive conditional variance with
past value of the return rate series over the current conditional variance. The diagonal
parameter is used to evaluate the continuity of volatility persistence of the single market;
while the non-diagonal parameter is used to designate the volatility spillover between
the two markets.
The variance equation (3) expanses as follows:
C&,"5 = E&&
5 + F&&5 (&,"%&
5 + 2F&&F5&(&,"%&(5,"%& + F5&5 (5,"%&
5
+G&&5 C&,"%&
5 + 2G&&G5&C&,"%&C5,"%& + G5&5 C5,"%&
5
C5,"5 = E5&
5 + E555 + F&5
5 (&,"%&5 + 2F&5F55(&,"%&(5,"%& + F55
5 (5,"%&5
+G&55 C&,"%&
5 + 2G&5G55C&,"%&C5,"%& + G555 σ5,"%&
5
C&5,"¦E&&E5& + F&&F&5(&,"%&5 + (F&5F5& + F&&F55)(&,"%&(5,"%& + F5&F55(5,"%&5
+G&&G&5C&,"%&5 + (G&5G5& + G&&G55)C&,"%&C5,"%& + G5&G55C5,"%&
5
The non-diagonal parameter is employed to verify the spillover between the two

34
markets, and the four variables are drawn as follows:
F&5 is the shock spillover effect from the CNH exchange rate to the CNY one.
F5& is the shock spillover effect from the CNY exchange rate to the CHH one.
G&5 is the volatility spillover effect from the CNH exchange rate to the CNY one.
G5& is the volatility spillover effect from the CNY exchange rate to the CNH one.
3.5.3 Results: New Findings
Based on the result of the volatility, the analysis with hourly data shows quite
different conclusions from that of Maziad & Kang (2012).
Table 3-7 shows that in the periods of C�D and over the entire period, positive
effects of bidirectional shock spillover appear between the exchange rates of the CNH
and CNY. In the periods of C and D, the shock spillover effects of exchange rate from
CNH to CNY are higher than that from CNY to CNH, while, the result of the entire
period is just the opposite.
The calculation results of the conditional variance equation show that, in period A,
when the exchange rate of CNH’s conditional standard deviation increase by 1%, the
exchange rate of CNY’s conditional standard deviation will increase by 0.3504% in the
next period, which is the maximum value in Table 3-7. Thus, there is unidirectional
volatility spillover of significant numerical value from the CNH exchange rate to that
of the CNY. Therefore, hypothesis 2 is untenable.
That is because, period A covers from January 3rd, 2011 to September 20th, 2011,
within a year after the CNH was open. Since the exchange rate of the CNH depends on
market demand and supply, it plays a stronger leading role in information transmission

35
in that year. As we know, RMB cannot be traded freely on the onshore market, so the
appearance of a free trading offshore Renminbi market not only meets the needs of
foreign investors in RMB, but also convinces the market participants of the Chinese
Government’s determination on RMB internationalization. The changes of the offshore
market’s spot exchange rates fully express the international expectations of the RMB’s
future trend, which is the reason why its stronger volatility spillover directs that of the
CHY in the first year after its opening and pushes for the currency’s appreciation.
Meanwhile, the exchange rates of the CNY in periods C�D and during the whole
period show unidirectional volatility spillover effects to that of the CNH of 0.0074¢
0.0247¢and 0.0769 respectively. Compared with period A, the volatility spillover
effects are relatively smaller¢but with longer duration. Results show, in periods C and
D and the whole period¢the CNY market plays a stronger leading role. Hypothesis 2
is tenable.
The novelty gradually wore off after the opening year and, the offshore market
tends to be stable. As a managed floating exchange rate system, the exchange rates of
the CNY market change over the upper and lower bands of the daily central parity rate
set by the China Foreign Exchange Trading Center at 9:15, whereas publishing the
central parity rate is equivalent to Renminbi pricing set daily by the PBOC, which
manipulates price changes of the onshore RMB market. At the same time, the onshore
Renminbi enjoys more local information superiority, which guarantees the onshore
market with a transaction volume of 1.5 times as much as that of the offshore market6
§§§§§§§§§§§§§§§§§§§§§§§§§§§§§§§§§§§§§§§§§§§§µ§Calculated by data from Funke. et al. (2015). The time point is Q4, 2013.§
36
in spot exchange rates, allowing the CNY exchange rate to play a dominant role in
RMB exchange rate marketization over a long period.
3.6 Summary
Since the hourly data analysis can remove the effects caused by the different
closing time of the two markets, compared with the previous studies, this paper draws
different conclusions as follows:
First, the result shows that there is a bidirectional Granger causality between CNY
exchange rates and the CNH ones. When the volatility is high, the impacts of the
exchange rate from CNY to that of CNH disappears with the onshore intervention.
Secondly, looking at the volatility result, within the opening year of the offshore
market, we see the exchange rate of the CNH takes a stronger leading role. After that,
the market participants gradually calm down from the fervent demand for CNH market
and return to normal, the CNY exchange rates guide the RMB exchange rates for a long
time.
Thirdly, based upon the above conclusions, hourly data analysis is a better method
for detecting the subtle changes of the spot exchange rates between the onshore and the
offshore markets, especially the latter, which signifies more implications of the global
market information.

37
Chapter 4 Does Exchange Rate Trading Band Block
Correlation Between the Onshore and Offshore Exchange Rate:
Evidence from RMB Market
4.1 Price Limit and Trading Band
Price limit as one of the important market stability mechanisms in financial
market is usually specifically applied in the stock market the system was first used
in the futures market with a purpose to prevent volatility in financial market for
maintaining market stability. Therefore, as the benchmark price, the closing price of the
previous trading day allows the stock or futures price to vary within the upper and lower
limits during a single trading session.
Different countries will settle different benchmark prices and fluctuating range.
Likewise, the trading band in the foreign exchange market is also based on the central
parity rate which is announced daily by the China Foreign Exchange Trading Center
before markets open allowing the exchange rate to change up and down within it. This
shows that the trading band in the foreign exchange market can be considered as another
application of price limit in foreign exchange markets. However, there are still
differences between the two. The price limit is that when the futures or stock prices rise
to the upper limit or fall to the lower limit, any quotation beyond or below the limits
will no longer be traded, but the transaction in the market does not stop with price

38
unchanged. When the fluctuation of exchange rate is near to or reaches limit, the central
bank will intervene to make the exchange rate fluctuating within the band. Therefore,
there should be differences between the effectiveness of the two similar but different
systems concerning the price limit and the trading band
There have been controversies about the effect of price limit among the academia.
Scholars who support the view believe it reduces the price volatility of the stock
Berkman & Lee 2002 and prevent severe overreactions Bildik & Elekdag 2004 .
As the transmission of stock price is limited, the response of information on stock price
is delayed and the information flow is restrained. Opponents argue that price limit
does not reduce the stock price volatility, but delay price discovery effect and cause
volatility spillover on subsequent days Kim & Rhee, 1997; Lin & Swanson 2010 .
This will increase the price volatility and enhance the market information flow.
Therefore, the effectiveness of price limit is still a debate in the academia. To study
its impact and find out how it affects the information flow in the financial market, we
choose a different market- China's foreign exchange market, as the research object.
4.1.1 Measures of Promoting Internationalization
Affected by the subprime crisis, the Chinese government takes active measures to
promote the internationalization of RMB, which plays an increasing role in the
international stage with its development, after the pilot project of RMB denominated
cross-border trade settlement was announced in 2009. On July 19, 2010, the People’s
Bank of China signed the revised Settlement Agreement on the Clearing of Renminbi
Businesses with Bank of China (Hong Kong) BOCHK , Hong Kong officially became

39
RMB offshore market. Since then, offshore markets have experienced a rapid growth
of Renminbi as a trading currency for cross-border RMB trade settlement. Meanwhile,
CNH, the offshore RMB which can be free trading makes RMB a dual exchange rate
regime. Since 2012, there has been rising proportions of RMB international financial
valuation and denominated settlement. With the promotion of RMB cross-border policy
and the improvement of the RMB offshore market and the clearing system, RMB
business has been expanding year by year in the international trade, international
finance and foreign exchange reserves. According to the report of BOCHK, the RMB-
denominated trade settlement of Hong Kong offshore market has grown tenfold from
369.2 billion yuan in 2010 to 3.841 trillion yuan in 2013. By the end of 2015, the annual
value of RMB cross-border trade settlement reached 7.23 trillion yuan, nearly doubled
compared with that of the previous year, accounting for 29.36 percent of China’s total
imports and exports, which increased 4.6 percent in 2014. While in 2015, the trade
settlement in Hong Kong accounted for 94.5 percent of the total cross-border
transactions. On November 30, 2015, the IMF’s Executive Board decided to include
RMB in the Special Drawing Rights(SDR), which serves as a significant milestone of
RMB internationalization.
4.1.2 RMB Exchange Reforms
As the internationalization of RMB develops, the onshore RMB exchange rate
reform has become the focus of attention. Since the establishment of the offshore RMB
market, the onshore RMB exchange rate has undergone three reforms.
The People’s Bank of China (PBOC) announced from April 16, 2012, the average
40
of the daily trading band for RMB exchange rate against the U.S. dollar moved up from
0.5% to 1%. The benchmark exchange rate is “central parity rate” quoted by the China
Foreign Exchange Trading Center at 9:15 a.m. and the onshore RMB exchange rate
fluctuates within the range of 1% above and below it. The central parity rate of
Renminbi is calculated by eliminating the highest and lowest quotations which are
requested from the market maker in the interbank system every day, to a weighted
average figured out by the China Foreign Exchange Trading Center.
With an intention of making the onshore RMB more marketization, the PBOC
needs to enhance the floating flexibility of the RMB exchange rate, as well as promote
the development of the onshore foreign exchange market, then on March 17th, 2014,
the PBOC announced the trading band of RMB against the US dollar in the inter-bank
spot foreign exchange market will fluctuate from 1% to 2%.
It is clearly seen from figure 4-1 that after the increase of RMB exchange rate
trading band on March 17, 2014, the fluctuation range of onshore RMB rapidly
exceeded 1% and remained above 1% after December 2014.
On August 11, 2015, the PBOC announced that it will adjust quotation mechanism
concerning the central parity rate of the onshore RMB against the U.S. dollar, valuing
much on the closing rate of the previous day to make it closer to the law of
marketization.
As for the impact of “price limit” on information transmission, the existing
research focuses more on the stock market and futures market, while there is almost no
research on China’s foreign exchange market. The main reasons for choosing China’s

41
foreign exchange market as the research object are as follows:
Firstly, the reform of RMB exchange rate is carried out. Since March 17, 2014, the
trading band of the RMB exchange rate against the U.S. dollar in the inter-bank spot
foreign exchange market has increased from 1% to 2%. The expansion of the trading
band of exchange rate provides a tool for judging the impact of the “price limit” in the
foreign exchange market on information transmission. Meanwhile, with the
establishment of the offshore RMB market in Hong Kong on July 19, 2010, there
emerges an offshore RMB foreign exchange market with a different exchange rate
regime from the onshore foreign exchange market and direct trading between two
markets are not permitted. In this special circumstance, the expansion of the trading
band on one side provides an opportunity for research on the information transmission
between onshore and offshore markets.
Secondly the trading band in foreign exchange markets is basically different from
price limits, the latter imposes price limits on to fluctuations of stocks and futures.
Therefore, as the opponents predict, there might be volatility spillovers after the price
limit day. By means of intervention, the foreign exchange markets maintain exchange
rates within the trading band by increasing or reducing supplies in exchange markets,
so there will be no spillover or overreactions, excluding the adverse effects of price
limits.
Finally, with the rising international status of RMB, more and more market
participants choose RMB as their trading, investing and reserve currency. Therefore,
whether the expansion of the “price limit” have an impact on the information
42
transmission between the offshore market which trade RMB by overseas investors and
the onshore RMB market which is controlled by the government will also become the
focus of attention of all parties.
Therefore, this paper adopts seemingly unrelated VAR model and DVEC-
GARCH model, adds the dummy variable of the policy change to analyze whether the
restriction on fluctuation range of exchange rate affects the information transmission.
4.2 Literature Review Two Categories
With different exchange rate regimes and market participants, there is no direct
transaction between onshore and offshore RMB exchange rate markets. Since they are
ultimately the same currency, there is indispensable information transmission between
the two. Different exchange rate regimes, with participants of different trading
motivations, there is a certain spread between them, which implies the possibility of
arbitrage. Especially under certain conditions (Cross-border RMB trade settlement),
transactions can be made indirectly between them, causing arbitrage phenomenon likely.
For example between a parent company in China and its branch company in HK,
investors may practice arbitrage transactions by false invoice, though very slim, the
offshore takes its shape related to the CNY exchange rate Sato, 2012 . At the same
time, the foreign exchange settlement derived from export payment via the commercial
or bank agents abroad will also generate revenue from the exchange rate spread. As Li
2011 points out, " After the promotion of the RMB cross-border trade settlement,

43
the long-expected Renminbi appreciation overseas causes a higher RMB exchange rate
against USD in the offshore market, which will greatly increase the space for
enterprises to arbitrage bilaterally (2011: 21) ". As an objective existence, arbitrage will
inevitably lead to the mutual interaction and information flow between the CNY
exchange rate and the CNH exchange rate.
Murase (2013) also mentioned that the CNH and CNY exchange rates are
mutually interactive. As the CNH exchange rate changes according to market demand,
the offshore exchange rate reflects the changing trend of RMB, and the CNY exchange
rate tends to follow that of CNH, and vice versa. The CNY price mirrors most
information about RMB value variations, bringing price shocks which are reflected in
the CNY price changes and then transmitted onto the price of CNH (Wu, 2015). Due
to the regulation of the onshore exchange rate its local advantages, and the
precondition of offshore exchange rates, the fluctuation of the onshore exchange rate
will inevitably cause the fluctuation of offshore exchange rate in Hong Kong. Therefore,
even if there is no arbitrage, the exchange rates of CNH and CNY still affect each other,
with bidirectional information transmission.
Therefore, there is mutual information transmission between the two markets, the
purpose of this article is to discuss whether the information transmission is affected by
the trading band of the onshore RMB exchange rate. The existing empirical studies on
the onshore and offshore RMB exchange rates are mainly divided into two categories:
The first category study is on the correlation between the CNH exchange rate and
the CNY exchange rate. Based on the BEKK-GARCH model, Maziad and Kang (2012)

44
conclude that there is a unidirectional correlation between the CNY exchange rate and
the CNH exchange rate, the CNY spot exchange rate guides the CNH spot exchange
rate, at the same time, the offshore forward exchange rate can be used on the onshore
forward exchange rate forecast. By the method of impulse response, Ding et al. (2012)
find that there is mutual and strong correlation between onshore and offshore spot
exchange rates. At the same time, there is no price guidance relationship between the
two markets. With the Garch model, Leung and Fu (2014) conclude that the CNY
exchange rate plays a leading role in the volatility transmission between the two
markets because of the recent relaxation of capital control measures and other
regulations.
Another category study is on the factors that affect the pricing differential between
onshore spot exchange rate and offshore spot exchange rate. Funke et al. (2015) add
explanatory variables to the Garch (p, q) model, and draw the conclusion that liquidity
difference of the two markets, global risk aversion and permitting cross-border RMB
outflows, play an important role to influence the pricing gap between the onshore and
offshore RMB exchange rates.
Being different from stocks market, the foreign exchange market doesn’t force the
market participants to stop the buying and selling of exchange rate demands, but to
achieve the purpose of restraining exchange rate fluctuations by the central bank's
intervention, to keep exchange rates at a stable level by market mechanism. In this way,
so long as the exchange market has sufficient supplies, the market will be protected
from sudden rise or fall, and the spillover would not appear in exchange rate markets.
45
Therefore, the author believes the problems which the opponents of price limit worry
about would not emerge. The trading band can restrain the fluctuation of exchange rates,
reduce the overreactions of market participants, and suppress the information
transmission of exchange rate. While the onshore and offshore renminbi (RMB) are the
same as foreign exchange markets but fall into two different trading markets with
different exchange rate regimes and cannot be traded directly. Therefore, unlike how it
will be functioning in the stock market, the "price limit" will inhibit the information
transmission between the two markets.
The interaction between the two different markets of onshore and offshore is
ultimately caused by the information transmission between two markets. Due to the
differences, the two markets react differently to information. The existing studies have
analyzed the correlation between the onshore and offshore RMB exchange rates from
various aspects, ignoring the correlation between two markets when the onshore spot
exchange rate trading band increased. There is almost no literature about the effects of
the trading band on information transmission between the two markets. The increase of
exchange rate trading band makes the information flow sufficiently between single
market and different markets. The increase of information can not only reflect the
information of other markets, but also accommodate other markets. Therefore, the
influence of "price limit" expansion on correlation and information transmission cannot
be ignored. Meanwhile there is not much literature on high-frequency data analysis,
which can reflect intraday and short-term effect more exactly. Therefore, based on 5
minutes of two market spot exchange rate data, this paper adopts seemingly unrelated

46
VAR model and DVEC-GARCH model with the dummy variable, to analyze the
effects of the exchange rate reform on March 17, 2014.
Three reasons that this paper only focusses on the trading band moved up from 1%
to 2% are the follows: the first is that 1% to 2% is relatively larger range of changes,
therefore the response to information transmission is more obvious. The second is
because of the data, since the author only collected high frequency data after January 1,
2013. The last reason is that the third exchange rate reform focuses on the formation of
the RMB’s central parity rate, nothing to do with the trading band. Therefore, the author
makes data analysis only based on the period in which the trading band increased from
1% to 2% between January 1, 2013 and August 10, 2015 (before the 3rd exchange rate
reform).
4.3 Hypothesis
In extreme cases, when CNY's trading band equals 0, the CNY exchange rate
remains unchanged, there will be no correlation between the CNH and CNY exchange
rate, neither will there be information flow between them.§When the trading band of
the CNY exchange rate expands from 0 to 0.5%, the CNY exchange rate can fluctuate.
So, the local superiority of the CNY exchange rate and changing trend of the CNH
exchange rate will increase the correlation between the two markets. In other words,
the correlation between the two markets will increase as the trading band of the CNY
exchange rate increases from 0% to 0.5%. And the expansion of trading band will

47
increase the exchange rate fluctuation, making the exchange rate more responsive to
information and accelerating information transmission.
Therefore, as mentioned above, the hypothesis is proposed:§when the trading band
of the CNY exchange rate increases from 1% to 2%, the correlation between the CNH
exchange rate and that of the CNY increases.
4.4 Data: 5-minute
We choose 5-minute data of CNH and CNY exchange rate from January 1, 2013
to August 10, 2015. All the data comes from Bloomberg. Table 4-1 lists the descriptive
statistics of the CNH and CNY 5-minute data.
All the results of the unit root test for the data show that (Table 4-2), the test for
all the level variables accept the hypothesis and the first differenced variables reject the
hypothesis. So, both the CNH and CNY exchange rates have one unit root. This paper
adopts the exchange rate (the differenced series of the logarithm) for the following
econometric models.
4.5. Seemingly Unrelated VAR model
In order to reflect the influence of policy changes on information transmission, we
added the product items of dependent variables and policy dummy variables in the VAR
model. Define dummy variable JKL" = 1 if t > Mar 17.2014, and JKL" = 0
otherwise. Let N" = (N&", N5")? be the change rate of CNH and CNY exchange rate. The
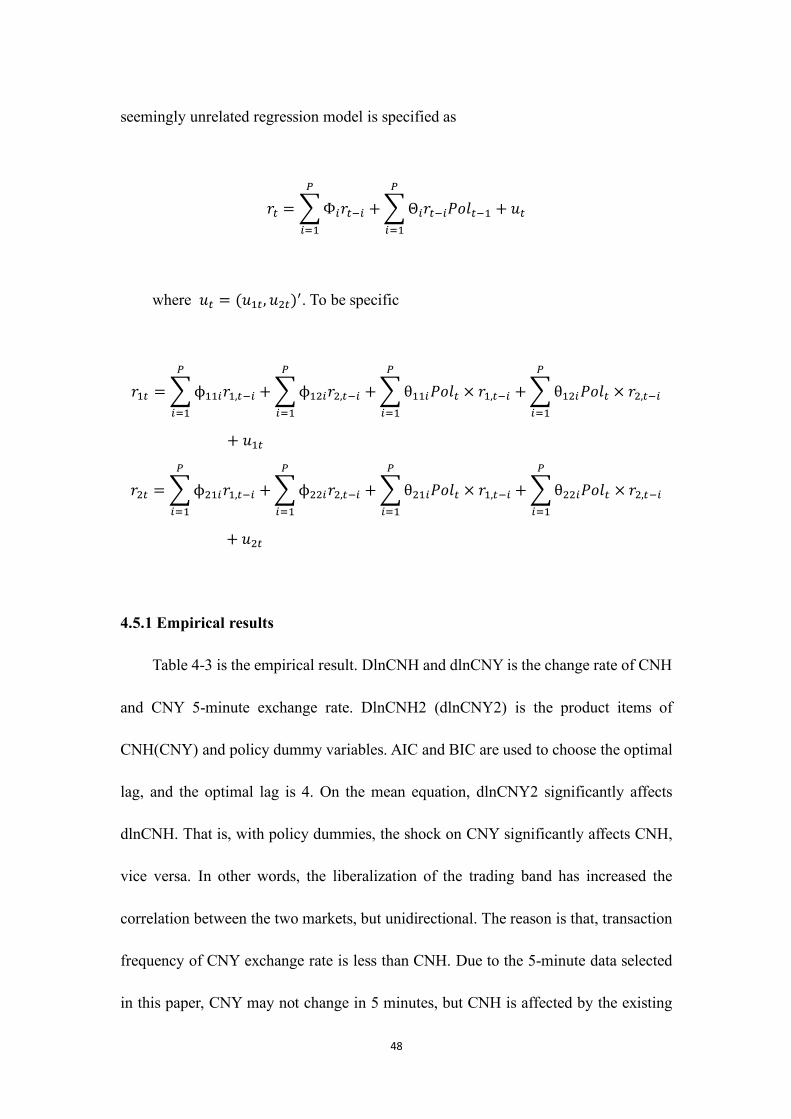
48
seemingly unrelated regression model is specified as
N" = OΦQN"%Q
R
QS&
+OΘQN"%QJKL"%&
R
QS&
+ U"
where U" = (U&", U5")?. To be specific
N&" =Oϕ&&QN&,"%Q
R
QS&
+Oϕ&5QN5,"%Q
R
QS&
+Oθ&&QJKL" × N&,"%Q
R
QS&
+Oθ&5QJKL" × N5,"%Q
R
QS&
+ U&"
N5" =Oϕ5&QN&,"%Q
R
QS&
+Oϕ55QN5,"%Q
R
QS&
+Oθ5&QJKL" × N&,"%Q
R
QS&
+Oθ55QJKL" × N5,"%Q
R
QS&
+ U5"
4.5.1 Empirical results
Table 4-3 is the empirical result. DlnCNH and dlnCNY is the change rate of CNH
and CNY 5-minute exchange rate. DlnCNH2 (dlnCNY2) is the product items of
CNH(CNY) and policy dummy variables. AIC and BIC are used to choose the optimal
lag, and the optimal lag is 4. On the mean equation, dlnCNY2 significantly affects
dlnCNH. That is, with policy dummies, the shock on CNY significantly affects CNH,
vice versa. In other words, the liberalization of the trading band has increased the
correlation between the two markets, but unidirectional. The reason is that, transaction
frequency of CNY exchange rate is less than CNH. Due to the 5-minute data selected
in this paper, CNY may not change in 5 minutes, but CNH is affected by the existing

49
CNY values. At the same time, the selection period is too long, from January 1,2013
to August 10, 2015, which may cause the policy influence to change or other policies
to affect the result.
4.5.2 Improved Exchange Rate and Fluctuation
Figure 4-2,4-3,4-4,4-5 is the exchange rate and volatility of CNH and CNY
exchange rate(5-minute) in the week before and after policy change. The vertical line
is the policy change time point. We can see from the figure that the exchange rate and
fluctuation of the two markets have all been improved, and the fluctuation of Shanghai
market is the most obvious.
4.6 DVEC-GARCH Model: Strengthening Both Markets
The reason for choosing DVEC-GARCH is that its variables are less than the
VECH-GARCH model and the BEKK-GARCH model. At the same time, considering
the correlation between the two markets, not the spillover effect, the DVEC-GARCH
model is selected.
We adopt an extended VECH-GARCH model. The variance of U" is
XFN(U") = Y" = Z0&&," 0&5,"0&5," 055,"
[
Y" = \ +O]Q⨀(U"%QU"%Q? )
R
QS&
+O_`⨀Y"%`
a
`S&
+ b × JKL"
Where A, B, and C are parameter matrix, and ⨀ is the elementwise or Hadarmard

50
product. U" is the residual term of the mean equation, under the information set before
1 phase, obeying the mean value of 0 variance which is the normal distribution of H;.
We only consider the lower triangular part of the symmetric metrics of C, A, B and D.
The covariance matrix must be positive semi-definite (PSD). To be specific, each
element in Y" can be written as
0&&," = E&& +OF&&QU&,"%Q5
R
QS&
+OG&&,`0&&,"%`
a
`S&
+ c&&JKL"
0&5," = E&5 +OF&5QU&,"%QU5,"%Q
R
QS&
+OG&5,`0&5,"%`
a
`S&
+ c&5JKL"
055," = E55 +OF55QU5,"%Q5
R
QS&
+OG55,`055,"%`
a
`S&
+ c55JKL"
AIC and BIC are used to choose the optimal lag of P and Q, and the optimal lags
are 1. The result of seemingly unrelated VAR model is unidirectional correlation
because of the selection period is too long, which may cause the policy influence to
change or other policies to affect the result. Therefore, this time we choose a much
shorter range to analyze, taking the exchange rate reform on March 17, 2014 as the base
day, with the five-minute data of one week before and after the base day. Table 4-4 is
the result of estimation. We can see that all the results are almost significant. That is,
after adding the trading band policy dummy, the two markets are still related, and
dummy is significant. The increase of RMB exchange rate trading band policy not only
strengthens the information transmission of CNY market, but also strengthens that of

51
CNH, and the correlation between the two markets.
4.7 Summary
We use seemingly unrelated VAR model and DVEC GARCH model and add the
policy dummy variable which describes the trading band increasing from 1% to 2% on
March 17, 2014, to analyze if the trading band has an impact on the correlation and
information transmission between the two markets. In terms of the results, both mean
equation and variance equation show that the increasing trading band affects the
correlation between the two markets, and at the same time, strengthens the information
flow, which supports the hypothesis, with only unidirectional correlation in mean
equation.§
52
Chapter 5 Intervention to Narrow the Spreadbetween CNH
and CNY
In July 2009, the Chinese government initiated Renminbi settlement in some
companies among China, Hong Kong, Macao and 10 ASEAN countries. Since then,
the RMB settlement between China and Hong Kong has been developing rapidly. The
early settlement of RMB between China and Hong Kong made a large number of RMB
kept in Hong Kong. Thus, the offshore RMB market was formally established on July
19, 2010.
Being different from the “onshore RMB (CNY)” circulating in mainland China,
the RMB flows abroad with Hong Kong as the center is called the “offshore RMB
(CNH)”. The exchange rate in the CNY market is controlled by the central bank, while
the exchange rate in the CNH market is determined by the market, a dual rate system
of the Renminbi has then been developed. Table 3-1 shows the comparison between the
CNY market and the CNH market.
5.1 Is there Any Intervention in CNH market from the Chinese
Authority?
The CNH is a foreign exchange market in which non-Chinese residents participate
with a floating exchange rate. And it is the Renminbi market of free trading without
53
government’s manipulation. In contrast, the CNY market is the foreign exchange
market for the local Chinese residents, with a managed floating exchange rate system,
whose fluctuation moves within the upper and lower limits based on the central parity
rate of RMB announced by the People's Bank of China every morning. When the CNY
approaches the upper or lower limits, the People's Bank of China will intervene in the
market in order to control the RMB appreciation or depreciation. That is, the CNY
market is controlled by the Chinese monetary authorities.
Relying on the dual exchange rate, the Chinese government boosts the
liberalization of capital transactions and the diversification of financial products in
CNH market, and thus to promote the opening and financial reform in China's domestic
market.
On August 11, 2015, the People's Bank of China declared that it would reset the
central parity rate quotation mechanism of Renminbi against U.S. dollars, valuing much
on the closing price with a more market-based central parity rate. Before the reform of
the RMB exchange rate, the CNY remained at the lower level near the lower limit of
the central parity price announced by the People's Bank of China, while the CNH
fluctuated relatively within the same range. After the announcement of the exchange
rate reform, the RMB central parity rate fell by 4.7% in three days. The PBOC
explained it is an "one-off depreciation". Affected by the slowdown of China's economy
and the rise of US interest rates, the RMB foreign exchange rate underwent pressures
of RMB depreciation,
Figure 5-1 shows the spot exchange rate and the spread between the CNH and the

54
CNY markets. As shown in Figure 5-1, the RMB exchange rate had been in depreciation
between the exchange rate reform on August 11, 2015 and February 5, 2016. In the
meantime, the CNY market had been obviously intervened to avoid excessive
depreciation. On the other hand, there was a sharp decline in CNH since there is no
intervention in the CNH market. Moreover, because direct trading is forbidden between
CNH and CNY exchange rate markets, the spread became much larger. By September
8, 2015, the spread between CNH and CNY rose to 0.1254 and on January 7, 2016, the
spread reached its maximum of 0.1651.
According to Bloomberg and Reuters etc., the People 's Bank of China intervened
twice in the offshore market between September 10, 2015 and February 6, 2016 to
stabilize RMB. Both Chinese banks and foreign banks are restricted to buy dollars in
the offshore markets, suspending renminbi accounts of cross-border financing in the
offshore banks, and then there appeared interventions in the market on a large scale by
the state-owned banks. The first intervention in the offshore market took place on the
10th, September 2015, with an approximately amount of $ 1 billion to $ 3 billion. When
the spread reaches its maximum, intervention emerged again on January 11, 2016, then
the spread between CNH market and CNY market was eliminated on December 12.
According to the Reuters, the single-day trading volume is 10 times higher than before.
The People’s Bank of China does not confirm the intervention, but market
participants believe that the Bank of China (Hong Kong) participated in the intervention.
Because of the intervention, there exists no longer free trading advantage of the offshore
market, which may aggravate the market participants’ distrust on the CNH market.

55
The paper uses minute data of CNH market and CNY market from August 3, 2015
to February 5, 2016, to analyze how CNH and CNY influence the spread between the
two and to find out whether the Chinese authorities intervenes in the offshore market,
and then to estimate the time of intervention.
5.2 The previous study about CNH and CNY exchange rate
Issues about whether or not the Chinese government has intervened in the foreign
exchange rate in the offshore market has remained a debate. Vast media release insists
on the Chinese government’s control on the matter, which has always been kept silent
by the Central Bank of China. So it is perhaps something of a mystery as to whether
the Chinese monetary authorities maintain untold intervention operations. As little
research has been done on the intervention of the Renminbi offshore market, this study
has to begin with a literature review about the relevance of the CNH exchange rate and
CNY exchange rate.
The previous study concerns three perspectives. Firstly, unidirectional relevance
is recognized, and CNY plays the leading role in the market (Xiong 2011; He & Zhang
2014; Maziad & Kang 2012). Secondly, according to Granger causality test, there is no
price discovery relationship between the CNH spot exchange rate and the CHY spot
exchange rate (Ding & Tse, 2012). Thirdly, there is no linkage between the CNY market
and the CNH market before the August 11, 2015. Since the reform, the linkage has been
bidirectional, and CNY plays the leading role in the market (Deng 2016).
Three methods are adopted in the former researches. Granger's causality test

56
(Xiong 2011, Owyong, Wong & Horowitz 2015), the VAR model impulse response
function (He & Zhang 2012; Tse & Williams 2014), and the GARCH model (Leung &
2014, Maziad & Kang 2012). Furthermore, Funke et al. (2015) analyze the spread
between the CNY market and the CNH market, explanation variables are added to the
Garch (p, q) model, and conclude that the liquidity difference between the two markets,
Global risk aversion index, and cross-border Renminbi outflow, assert an influence on
the spread between the CNH and CNY exchange rate.
The purpose of intervention in the CNH market is to influence the expectation of
CNY depreciation as well as to stabilize the Renminbi exchange rate by narrowing the
spread between the CNH and the CHY markets. Therefore, when the spread being
suddenly narrowed, according to the difference between the CNH and CNY impact on
spread, the author intends to analyze whether the Chinese authorities intervene the
offshore market and to estimate the time points when the interventions takes place in
the CNH market. The methods employed is the impulse response function.
The above study analyzes the linkage of spot exchange rate, but problems exists
as follows. Firstly, focusing on the problem of intervention in the offshore market, it is
unable to draw conclusions by daily data. Besides, while intending to test the impacts
of CNH and CNY on spread, it is still difficult to know how it changes based on the
whole period data.
Therefore, starting with the previous literature, this study analyzes the impacts of
CNH and CNY on spread in the following ways. Firstly, since the intervention time is
too short to use daily data, we use minute data from the 3th of August, 2015 to the 5th
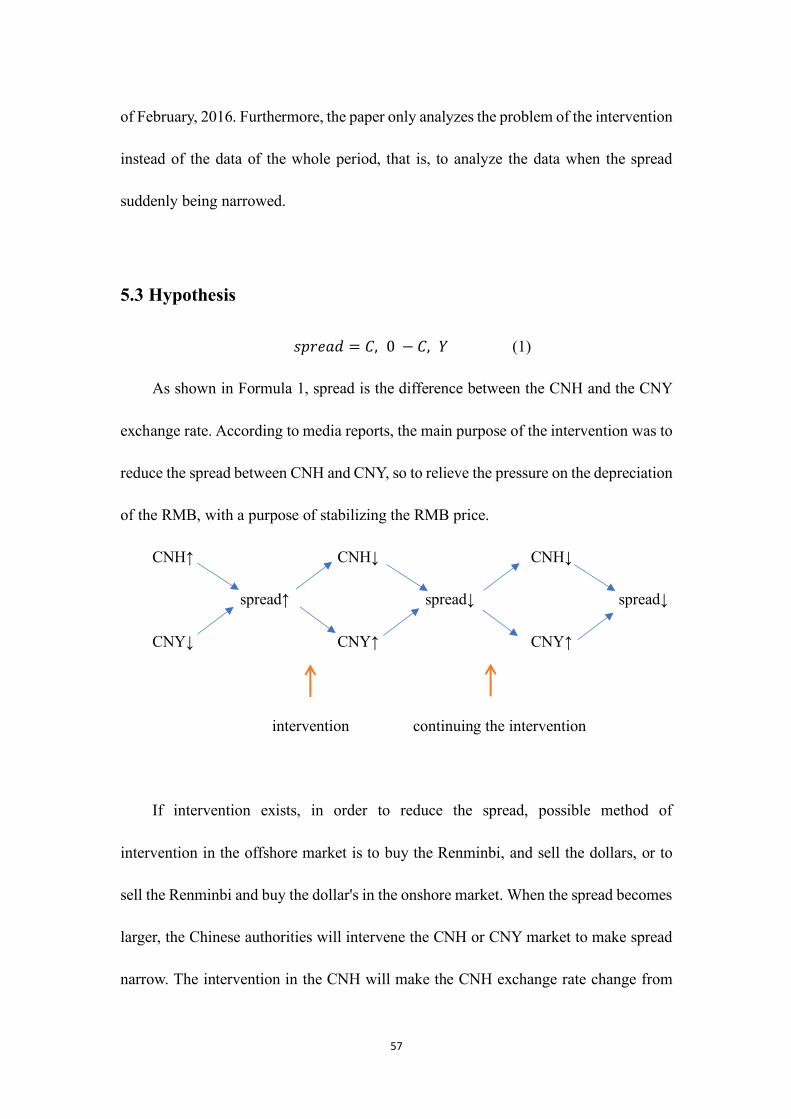
57
of February, 2016. Furthermore, the paper only analyzes the problem of the intervention
instead of the data of the whole period, that is, to analyze the data when the spread
suddenly being narrowed.
5.3 Hypothesis
deNfFc = >,0 − >,! (1)
As shown in Formula 1, spread is the difference between the CNH and the CNY
exchange rate. According to media reports, the main purpose of the intervention was to
reduce the spread between CNH and CNY, so to relieve the pressure on the depreciation
of the RMB, with a purpose of stabilizing the RMB price.
CNH↑ CNH↓ CNH↓
spread↑ spread↓ spread↓
CNY↓ CNY↑ CNY↑
intervention continuing the intervention
If intervention exists, in order to reduce the spread, possible method of
intervention in the offshore market is to buy the Renminbi, and sell the dollars, or to
sell the Renminbi and buy the dollar's in the onshore market. When the spread becomes
larger, the Chinese authorities will intervene the CNH or CNY market to make spread
narrow. The intervention in the CNH will make the CNH exchange rate change from

58
depreciation to appreciation, with an exchange rate near to that of the CNY, then the
spread is narrowed, with the purpose of stabilizing RMB exchange rate being achieved.
Therefore, it is possible that the intervention in the CNY makes the CNY exchange rate
depreciation and spread narrow.
Let’s look at the changes in CNH, CNY and spread after the initial intervention.
CNH(CNY) will be in a state of appreciation (depreciation), and if the intervention fails
to narrow the gap as expected, the Chinese authorities may continue to intervene, for
interventions at large degree will influence behaviors of market participants by
appreciation (depreciation) in CNH(CNY) exchange rate, somehow meeting the
authority’s expectations. Therefore, if there exist interventions, the impact of
CNH(CNY) on spread is positive(negative).
So, hypothesis 1 is that when the impact of CNH on spread is positive and much
greater than that of CNY on spread, along with Bloomberg and the Reuters’ report of
the Chinese authorities' intervention in the CNH exchange rate, we can assume that the
Chinese authorities are more likely to intervene in the offshore market.
Hypothesis 2 is that if the impact of CNY on spread is negative and far greater
than that of CNH on spread, and there is always the central bank intervention in the
CNY market, we suppose that the spread is adjusted by intervention.
5.4 Minute Data
The analysis is based on the minute data from CNH market and CNY market

59
between August 3, 2015 to February 5, 2016. The data used in this study is taken from
the Bloomberg.
5.4.1 Period selection (Figure 5-1)
On September 10, 2015, the CNH market dropped 700pips in 45 minutes, about
1.4 %. According to Thomson Reuters data, the trading volume of offshore RMB
reached 10 times a month average. Such a big fluctuation indicates more than it
appeared to be, thus it is believed that such anomalous changes have been caused by
the intervention of the Chinese authorities, the amount of intervention may be 1 billion
to 3 billion US dollars. Bloomberg, Reuters and others reported, this was the first
intervention in the CNH market.
On January 7, 2016, the spread between the CNH exchange rate and that of the
CNY exceeded 2%. To eliminate this disparity, they said the Chinese authorities had
conducted a second intervention on January 11, 2015. This time the intervention
exceeded the previous one and it was learned that there had been relatively an amount
of 10 to 200 billion of US dollars spending on selling RMB to buy dollars. Both
Bloomberg and Reuters reported the intervention.
According to the above references, it is generally believed that the intervention on
the CNH exchange rate might reduce the expectation of RMB depreciation by
narrowing the spread between CNH and CNY to stabilize the RMB exchange rate.
According to Reuters, the Chinese government has restricted Chinese banks and foreign
banks to buy dollars in the offshore market, suspending the cross-border financing of
offshore RMB accounts and conducted large-scale intervention through state-owned

60
banks. The People's Bank of China controls the devaluation of the CNH exchange rate
by swab-off the RMB liquidity in the offshore market.
The purpose of intervening CNH exchange rate is to stabilize the RMB exchange
rate in the offshore market by reducing the spread between the CNH exchange rate and
the CNY exchange rate which will affect the expectation of RMB devaluation.
Therefore, this paper only analyzes the possible range of intervention, that is, the sharp
decline of different periods.
First, we select the period in which the spread decreases more than of 0.0948 (3
times of the standard deviation) within three days. The criteria for period selection is
from the maximum value of spread to the minimum value of the spread before sudden
reduction, excluding the first abrupt decrease period which is too difficult to analyze,
altogether we select the remaining two periods of A and B (Figure5-1).
Period A: September 8, 2015 10:33 --- September 11, 2015 10:30
Period B: January 11, 2016 10:43 --- January 13, 2016 11:33
In the meantime, as shown in A, B (Figure 5-2, 5-3), the sudden narrowing
intervals of spread are taken to analyze as intervention potential intervals. Because of
the reliability of data, more than 60 data are required, and altogether 4 intervals,
including A1 B1 B2 and B3, are selected.
The specific interval selections are as follows:
A1 interval September 10, 2015 15:43 --- September 11, 2015 10:30
B1 interval January 11, 2016 13:15 --- January 11, 2016 17:51
B2 interval January 12, 2016 10:31 --- January 12, 2016 12:22

61
B3 interval January 12, 2016 13:02 --- January 12, 2016 15:38
Table 5-1 lists the descriptive statistics of the CNH, CNY and spread minute data.
5.4.2. Two Intervention intervals
According to media reports, the first intervention interval is approximately from
15:00 to 16:30 on September 10, 2015. The selected interval A1 cover the intervals
reported. There are two kinds of report about the timing of the second intervention. One
is on January 11, 2016 and the spread reduces close to zero on January 12, 2016.
Another took place on January 12, 2016. In combination with this two, it is possible
that the selected interval B1, B2 and B3 cover the intervention interval. Therefore, we
also infer from the empirical analysis to find out which interval is the intervention
interval.
5.5 Empirical Analysis
Dealing with minute data between August 3, 2015 and February 5 2016, this
paper analyzes the four intervals in which the spread is suddenly narrowed by using the
impulse response function, observing the accumulative effects of influence between the
CNH exchange rate and the CNY exchange rate . The impulse response function is a
way to express how impulse is given to a variable residual term and how it transmits to
other variables, a method used to analyze influences between variables in VAR model
by observing its shape.
Therefore, by analyzing the impact between the CNH and CNY exchange rate, we

62
can see how CNH and CNY exchange rate influence the spread between the two. The
spread is determined by CNH and CNY exchange rate, since it is the difference between
CNH and CNY exchange rate. When the impact is given to CNH and CNY exchange
rate, the CNH exchange rate has a different reaction to the two impacts. The impact of
CNH exchange rate on itself minus the impact of CHY exchange rate on CNH exchange
rate will be the impact of CNH exchange rate on spread. If the impact on spread by
CNH exchange rate is positive and far greater than that of CNY exchange rate, that
means it is the CNH exchange rate’s main effect to reduce spread. If the impact of CNY
exchange rate on spread is positive and greater than that of CNH exchange rate, it means
CNY exchange rate’s main effect of reducing the spread.
5.5.1 Empirical Results: in Support of the Hypothesis 1
Figure 5-4, 5-5, 5-6 and 5-7 respectively show the impulse response
decompositions in combined graph (accumulative) in interval A1, B1, B2 and B3(The
multiple graph of impulse response is in the appendix). The above graph is the impact
of CNH and CNY exchange rate on CNH exchange rate. The blue line is the impact
caused by CNH exchange rate with 1 unit standard deviation affecting itself. The red
line is the 1unit standard deviation impact by CNY exchange rate effect on CNH
exchange rate. Subtracting the impact of CNY exchange rate on CNH exchange rate
from the impact of CNH exchange rate on itself, we can obtain the impact of CNH
exchange rate on spread. The following graph is the impact on CNY exchange rate from
CNH and CNY exchange rate. The blue line is the 1 unit standard deviation impact of

63
CNH exchange rate on CNY exchange rate, and the red line is 1 unit standard deviation
of CNY exchange rate’s impact on itself. The difference between the two is the impact
of CNY exchange rate on spread.
It can be clearly seen from figure 5-4 (A1 interval) that the impact of CNH
exchange rate on spread is about 0.002 in the first period, and then gradually expanded
to around 0.01. However, the impact of CNY exchange rate on spread is around 0.0004
in the first period, then expands to around 0.0015, and gradually narrows to 0.001. In
other words, during the A1 interval, the impact of CNH exchange rate on spread was 5
times than that of CNY exchange rate, and gradually expands. That is, in this interval,
the impact of CNH exchange rate narrows the spread, the Chinese authorities is more
likely to intervene in CNH exchange rate. The hypothesis 1 is supported and hypothesis
2 is rejected.
Figure 5-5 is the accumulative result of impulse response during B1 interval. As
can be seen from the figure, during the interval of B1, the influence of CNY exchange
rate on CNH exchange rate is very small, and the influence of CNH exchange rate on
its own gradually expands, resulting in the impact of CNH exchange rate on spread
from about 0.001 to 0.01. However, the impact of CNY exchange rate on spread is very
small, only about 0.0002, and in the 9th period, the influence gradually disappears. In
other words, during this period, the impact of CNH exchange rate on spread is initially
5 times of CNY exchange rate, and gradually increases to 50 times. In this interval, the
impact of CNH exchange rate on spread is positive and very large, the Chinese
authorities is more likely to intervene in the offshore foreign exchange market. In this

64
case, hypothesis 1 is supported, and hypothesis 2 is rejected.
Figure 5-6 is the accumulative result of impulse response during B2 interval.
During the interval of B2, the influence of CNY exchange rate on CNH exchange rate
is negative, and the impact of CNH exchange rate on spread is gradually extended from
0.002 to about 0.018. CNY exchange rate's impact on spread is still small, from about
0.0002 at the beginning to about 0.0004. The impact of CNH exchange rate on spread
is about 10 times that of CNY exchange rate and gradually expands. During this interval,
the CNH exchange rate appreciation, which leads to the reduction of spread, the
Chinese authorities is more likely to intervene in CNH exchange rate, and hypothesis 1
is established, the hypothesis 2 is rejected.
Figure 5-7 is the accumulative result of impulse response during B3 interval. The
impact of CNH exchange rate on spread increases from about 0.0015 initially to about
0.012, while CNY exchange rate's impact on spread is only 0.0001 and gradually
increase to about 0.0004. The impact of CNH exchange rate on spread exceeds CNY
exchange rate 15 times and gradually expands. In other words, during this interval,
CNH exchange rate mainly affects the reduction of spread. In order to maintain the
stability of the Renminbi exchange rate, the Chinese authorities is more likely to
intervene in CNH exchange rate, and the hypothesis 1 is supported, and hypothesis 2 is
rejected.
5.6 Summary

65
In this paper, we use impulse response function to analyze the effectiveness of
offshore intervention. As a result, among the intervention periods reported by the media,
this paper chooses the spread of sudden narrowing intervals, A1, B1, B2, B3. The main
reason causing the sudden narrow of the spread is the CNH exchange rate appreciation.
At the same time, the intervals A1, B1, B2, B3 are among the intervention period during
which Chinese authorities intervened CNH market, reported by Bloomberg and the
Reuters, this paper concludes that in the above four intervals, the Chinese authorities is
more likely to intervene CNH exchange rate.
66
Chapter 6 Conclusion
The internationalized RMB has entered major countries worldwide. The Daily
Mail reported “China leapfrogs the U.S. to become the world's largest trading nation
with £2.45trillion in imports and exports”7. By the end of 2015, China surpassed
America to take the title of the world’s biggest goods trading nation, and the Renminbi
has become the fourth largest currency in the world for cross-border payment. The
PBOC has set up Renminbi Clearance Arrangement mechanisms with more than 20
countries, with the RMB business services covering nearly 200 countries and regions.
Besides Hong Kong, Singapore and London emerged as two other RMB offshore
markets developing a diversified range of Renminbi products including deposits,
exchange and remittance, investment and Renminbi bonds service to meet the demands
of the international market.
In this thesis, we analyze the interactions between the CNY and CNH spot
exchange rate by different market participants and exchange rate regimes. Then, we
explore the trading band’s effects on the correlation between the two exchange rates to
see if there exists intervention in CNH market. Because the closing time of the two
markets is different, using closing data is hard to detect the prompt changing
relationships between the two. So we use hourly data in the chapter 3 ,5-minute data in
§§§§§§§§§§§§§§§§§§§§§§§§§§§§§§§§§§§§§§§§§§§§¶§Duncan, H. (2013, February 12)§

67
the chapter 4, and 1-minute data in the chapter 5 to remove the effects caused by
different closing time of the two markets, which is more agile reflecting the interactions
of the two markets. Compared with the previous studies, by empirical research, this
thesis has drawn conclusions in three characteristics:
The first is about interactions between the exchange rates of the CNY and CNH—
the mutual influence. It is interesting that there is not only one result. We see from the
Granger causality test, there is a bidirectional influence between CNY exchange rates
and the CNH ones. When the volatility is high, the impacts of the exchange rate from
CNY to that of CNH disappears with the onshore intervention. We can also see there is
no bidirectional Granger causality between the exchange rates of the CNY and CNH
markets by closing time analysis. This is completely different with the results of the
previous studies using the closing data holding that there is unidirectional correlation
from the CNY exchange rate to that of the CNH.§At the same time, the correlation
between the two markets can be affected by the presence of external stimuli through
split the whole period into five sub-periods.
When the volatility is high, there is unidirectional causality from the CNH
exchange rate to that of the CNY. The Chinese authorities need to consider that when
the exchange rate of the offshore market is fluctuated by the international influence,
how to ensure the relative stability of the onshore exchange rate in the world situation
of exchange rate liberalization.
Looking at the volatility result, within the opening year of the offshore market, we
see the exchange rate of the CNH taking a stronger leading role. After that, the market

68
participants gradually calm down from the fervent demand for CNH market and return
to the normal, with the CNY exchange rates guiding RMB exchange rates for a long
time. This is also different from the previous studies by using the whole period to
analyze, with a conclusion of CNY exchange rate guiding CNH exchange rate.
Based upon the above conclusions, hourly data analysis is a better method for
detecting the subtle changes of the spot exchange rates between the onshore and the
offshore markets, especially the latter, which signifies more implications of the global
market information. The fact of the bidirectional interactions between the CNY and
CNH spot exchange rate gives the Chinese government information superiority8 by
edging the CNY market over the offshore one, at the same time, readjusting the
exchange rate of the CNY based on the changes in exchange rates of the CNH in line
with market expectations.
The second characteristic indicates the strong function of the trading band in
blocking correlation between the onshore and offshore exchange rate. Although we
have divided periods according to the increase of trading band by policy influence in
Chapter 3,§âhe results does not show the effect of this policy on the correlation between
CNH and CNY.§To solve this problem, we add the policy dummy variable which
describes the trading band increase from 1% to 2% on March 17, 2014 to analyze if
there is trading band impact on the correlation and information transmission between
the two markets. In terms of the results, the VAR model test shows that the increasing
of trading band affects the correlation between the two markets by only unidirectional
correlation. The reason is that, transaction frequency of the CNY exchange rate is less
69
than that of the CNH, CNY may not change in 5 minutes, but CNH is clearly affected
by the existing CNY values. At the same time, the selection period is too long, from
January 1, 2013 to August 10, 2015, which may cause the policy influence to change
or other policies to affect the result.
With a much shorter period being selected, DVEC-GARCH model has signified not
only the increase of trading band affecting the correlation between the two markets, but
also the increase of impact on both the CNH and CNY exchange rate. At the same time,
it strengthens the information transmission between the two markets. In the previous
study, only the correlation between the two markets has been explored, without
considering the affect by the relaxation of the onshore exchange rate policy on the two-
market correlation. With only the period divided in the Chapter 3, we cannot obtain any
significant result. Therefore, we use the high frequency 5-minute data, and add dummy
variable which describes the exchange reform in the Chapter 4, concluding that the
wider the trading band is, the higher the correlation is between the CNH and CNY
exchange rates, with stronger information transmission between the two markets.
Because the trading band influences the correlation between CNH and CNY
exchange rates, Chinese authorities should start planned and step-by-step deregulation
of the exchange rates, providing more relevance of the two markets. As it has been
witnessed, the Renminbi trading band went from 0.5% �before April, 2012 up to 2%
�after march, 2014 year by year, China had tried to maintain its own pace in relaxing
the trading band with more perfect measures of financial regulations. By making it more
flexible on the one hand, and increasing more diversified market participants on the

70
other hand, China can both avoid the risks brought by single market preference and
keep the market exchange rates relatively stable.
The third characteristic is the intervention in the CNH market. After the exchange
rate reform, Bloomberg and Reuters etc. report that Chinese authorities intervened
twice in the CNH market: one is on September 10, 2015, with the spread between CNH
exchange rate and CNY exchange rate rising to 0.1254 on September 8, 2015, then
sharply fell on September 10, 2015. However, when the spread reached 0.1651 on
January 7, 2016, it sharply fell again on January 11, 2016. This might mean the second
intervention of the Chinese authorities in the offshore RMB market.
By impulse response, we analyze the possibility of offshore intervention. As a result,
among the intervention periods reported by the media, this paper chooses the spread of
sudden narrowing intervals, from 15:00 to 16:34 on September 10, 2015, from 13:15 to
17:51 on January 11, 2016, from 10:31 to 12:22 on January 12, 2016, from 13:02 to
15:38 on January 12, 2016. The main reason causing the sudden narrow of the spread
is the CNH appreciation. At the same time, these 4 intervals are among the intervention
period during which Chinese authorities intervened CNH market, reported by
Bloomberg and the Reuters. This paper concludes that in the above four intervals, the
Chinese authorities are more likely to have intervened CNH. Different from the
previous studies, we use 1-minute data to analyze the problem of the offshore market
intervention, because the intervention period is very short. We can conclude that the
impact of CNH on spread is positive and very large, by which we could estimate that
the Chinese authorities are more likely to have intervened in the offshore foreign

71
exchange market.
However, there are many reasons for the changes in the CNH, which may not only
be limited to interventions. So, we can only conclude that there is a possibility of
intervention. Therefore, without the use of Bloomberg and Reuter’s report, the author's
next research direction remains how to explore the interventions of the Chinese
authorities as the hidden reasons for the changes in the CNH market.
The intervention of the offshore market makes the CNH exchange rate more stable,
but with a negative impact on the internationalization of RMB. The Chinese authorities
need to figure out another more perfect way to sustain RMB’s stability.
§

72
REFERENCES
[References in English]
Arak, M & Cook, E (1997). Do Daily Price Limits Act as Magnets? The Case of
Treasury Bond Futures, Journal of Financial Services Research, vol.12, no.1, pp.5-
20.
Ballantyne, A., Megan, G., & Michelle, W. (2013). Developments in Renminbi
Internationalization, Bulletin, 2, 65-74.
Berkman, H & Lee, T (2002). The effectiveness of price limits in an emerging market:
Evidence from the Korean Stock Exchange, Pacific-Basin Finance Journal 10,
January, pp.517–530.
Bildik, R & Elekdag, S (2004). Effects of Price Limits on Volatility: Evidence from the
Istanbul Stock Exchange, Emerging Markets Finance and Trade, vol. 40, no. 1,
January–February, pp. 5–34.
Bloomberg News. (2015.9.10). China Said to Take Rare Step of Bolstering Yuan's
Offshore Value, Bloomberg. Retrieved from
https://www.bloomberg.com/news/articles/2015-09-10/offshore-yuan-jumps-most-
in-four-weeks-narrows-gap-with-onshore
Bloomberg News. (2016.9.8). Yuan Intervention Signs Intensify as Offshore Loan
Rates Surge, Bloomberg. Retrieved from
https://www.bloomberg.com/news/articles/2016-09-08/yuan-intervention-bets-
intensify-as-offshore-loan-rates-surge

73
BOCHK Asset. (2013, November).An Overview of Offshore RMB Market, BOCHK
Asset Management Limited. Retrieved from
http://www.lseg.com/sites/default/files/content/documents/Presentation%20by%20
BOCHK_Nov2013.pdf
Business Times. (2015.9.10) China's yuan jumps offshore in suspected intervention,
Business Times. Retrieved from http://www.businesstimes.com.sg/banking-
finance/chinas-yuan-jumps-offshore-in-suspected-intervention
Bowles, P., & Wang, B. (2013). Renminbi Internationalization, A Journey to Where?.
Development & Change, 44(6), 1363-1385.
Chan, et al. (2005). Price limit performance: evidence from transactions data and the
limit order book, Journal of Empirical Finance, vol.12, Issue 2, March, pp.269-290.
Chen, M., & Chatterjee, S. (2015.9.10). China's yuan jumps offshore in suspected
intervention, Reuters. Retrieved from http://www.reuters.com/article/uk-china-
offshore-yuan-idUKKCN0RA1KK20150910
Chen, P. F., Lee, C. C., Lee, C. C., & Huang, J. X. (2016). A Dynamic Analysis of
Exchange Rate Exposure: The impact of China’s Renminbi, The World Economy,
39(1), 132-157.
Deb, et al. (2017). Price limits and volatility. Pacific-Basin Finance Journal, vol.45,
October, pp.142-156.
Ding, D. K., Tse, Y., & Michael, R. W. (2014). The Price Discovery Puzzle In Offshore
Yuan Trading: Different Contributions For Different Contracts, Journal of Futures
Markets, 34(2), 103–123.

74
Duncan, H. (2013, February 12). China leapfrogs the U.S. to become the world's largest
trading nation with £2.45trillion in imports and exports, The Daily Mail. Retrieved
from http://www.dailymail.co.uk/news/article-2277254/China-Becomes-worlds-
largest-trading-nation-ahead-America.html
Durden, T. (2015.9.10). Yuan Soars Most On Record In Offshore Market As PBoC
Intervenes, Zero Hedge. Retrieved from http://www.zerohedge.com/news/2015-09-
10/yuan-soars-most-record-offshore-market-pboc-intervenes
Durden, T. (2015.9.29). Yuan Liquidity Dries Up In Hong Kong After Dramatic PBoC
Offshore FX Intervention, Zero Hedge. Retrieved from
http://www.zerohedge.com/news/2015-09-29/yuan-liquidity-dries-hong-kong-after-
dramatic-pboc-offshore-fx-intervention
Funke, M., Shu, C., Cheng, X., & Eraslan, S. (2015). Assessing the CNH–CNY pricing
differential: Role of fundamentals, contagion and policy, Journal of International
Money and Finance, 59, 245–262.
Garber, P. (2011). What Currently Drives CNH Market Equilibrium, CGS/IIGG
Working Paper, 19.
Gu, L., & McNelis, P. D. (2013). Yen and Dollar volatility and Chinese fear of
floating—Pressures from the NDF market¢Pacific-Basin Finance Journal, 22, 37–
49.
Guo, et al. (2017). Limit hits and informationally-related stocks, Journal of Financial
Markets, vol.34, February, pp.31-47.
He, D. (2012). Renminbi Internationalization: A Primer, MPRA Paper, No. 40672

75
He, D., & McCauley, R. N. (2010). Offshore Market for the Domestic Currency:
Monetary and Financial Stability Issues, BIS Working Paper, No.320.
Huang, Y., & Lynch, C. (2013). Does Internationalizing the RMB Make Sense for
China?. Cato Journal, 33, 571-585.
Kim, A (2001). Price limits and stock market volatility, Economics Letters, vol.71, Issue
1, April, pp.131-136.
Kim, A & Rhee, G (1997). Price Limit Performance: Evidence from the Tokyo Stock
Exchange, The Journal of Finance, vol. LII, no. 2. June, pp.885-901.
Kim, H. & Yang, J (2008). The effect of price limits on intraday volatility and
information asymmetry, Pacific-Basin Finance Journal, vol.16, Issue 5, November,
pp.522-538.
Kim, K (2016.9.15). Offshore Yuan Set for Weekly Gain Amid PBOC Intervention
Signs, Bloomberg. Retrieved from https://www.bloomberg.com/news/articles/2016-
09-15/offshore-yuan-set-for-weekly-gain-amid-pboc-intervention-signs
Lai, E. (2015). Renminbi Internationalization: The prospects of Chinese Yuan as the
nest global currency, Thought Leadership Brief, 9,1-4. Retrieved from
http://iems.ust.hk/thought-leadership-briefs/
Lee, J. W. (2014). Will the Renminbi emerge as an international reserve currency?. The
World Economy, 37(1), 42-62.
Leung, D., & Fu, J. (2014). Interactions between CNY and CNH Money and Forward
Exchange Markets, HKIMR Working Paper, No.13, pp.1-33.
Lin, Y & Swanson, E (2010). Contrarian strategies and investor overreaction under

76
price limits, Journal of Economics and Finance, 34: pp.430–454.
Liu Hai Yue, Jiang Qiang, and Tang Ying Kai (2016), Determination of Renminbi
Equilibrium Exchange Rate, Misalignment, and Official Intervention, Emerging
Markets Finance & Trade, 52:420–433, , Routledge, Taylor and Francis Group.
Liu, T. (2015). The onshore-offshore interaction of RMB market: a high-frequency
analysis, MPRA Paper, No. 64057.
Lockett, H (2016.9.14). Intervention speculation as offshore renminbi volatility rises,
Financial Times. Retrieved from https://www.ft.com/content/6371663c-9ab5-30f2-
9b3e-98de82d564a3
Mallaby, S., &Wethington, O. (2012). The Future of the Yuan, China’s Struggle to
Internationalize Its Currency, Foreign Affairs, 91,135-146.
Maziad, S., &Kang, J. S. (2012). RMB Internationalization: Onshore/Offshore Links,
IMF Working Paper, No.12/133, May 2012, International Monetary Fund.
Øââßá¹®®ááàÝÓÞÜ®ÑÒáâàÑÓ⺱°±¶¯±¶
McCauley, R. (2011). Internationalizing the Renminbi and China’s Financial
Development, BIS Quarterly Review, 4, 41-56.
Mehren, A. V. (2015.9.10). China: Intervention in CNH narrows CNH-CNY spread,
FXStreet. Retrieved from https://www.fxstreet.com/analysis/flash-
comment/2015/09/10
Murase, T. (2010, December 7th). Hong Kong Renminbi Offshore Market and Risks
to Chinese Economy, Newsletter. Retrieved from
http://www.iima.or.jp/Docs/newsletter/2010/NLNo_40_e.pdf

77
Owyong, D., Wong, W., &Horowitz, I. (2015). Cointegration and causality among the
onshore and offshore markets for China’s currency, Journal of Asian Economics,41,
20-38.
Reuters. (2015.9.10). China's yuan jumps offshore in suspected intervention, Reuters.
Retrieved from http://www.reuters.com/article/china-offshore-yuan-
idUSL4N11G36Q20150910
Reuters. (2016.1.11). HK offshore yuan interbank rates hit record highs on China
central bank interventions, The Straits Times. Retrieved from
http://www.straitstimes.com/business/economy/hk-offshore-yuan-interbank-rates-
hit-record-highs-on-china-central-bank
Wu, et al. (2015). Price performance following stock’s IPO in different price limit
systems, Physica A: Statistical Mechanics and its Applications, vol. 490, 15 January,
pp.953-966.
[References in Japanese]
X j id e j g Business
& economic review )
X j gX rc
lj
(X j gh g
(
X i _ w u

78
:M (
X y j t
j
X j . w u w uj j p
nam - Xw u nam
84 :.-9 /: 5 /: : - 1 : 0 492: /90. 1 : 8-
1 8. 02 02
- X f h
i F N. SSS LG CG AMK GAJC 24 / 49 5 : 1 /-33
( Xw u f i
spa F N. HN CR C P AMK GAJC AFGL K C P MDDPFM C
R L GB6 (: ) : (
, , Xu j o
k F N. HN CR C P AMK GAJC L JC R L GB6 70: 0)
[References in Chinese]
��l�2016 ��^>*=�r=?,�mK�d�&`�d��{ou�}
b�Q��, 2016@y1U¢38-48�
�S Bx[ �2012 �/�0�^>0_?,�ZA;�{m9�nu—.
��c�/�&NDF?,mOL�)���nu¢2012@y6U¢58-66�
)�^14�>nuI �2012 ��^>)��K%¢2012�� ¢)�^

79
14�gp
)�^14�>nuI �2013 ��^>)��K%¢2013�� ¢)�^
14�gp
)�^14�>nuI �2014 ��^>)��K%¢2014�� ¢)�^
14�gp
)�^14�>nuI �2015 ��^>)��K%¢2015�� ¢)�^
14�gp
)�^14�>nuI �2016 ��^>)��K%¢2016�� ¢)�^
14�gp
WS�2011 �j�]�^>)��m�<!�m���)?,¢2011@y
20U¢12-23�
���2014 ��^>r=?,�*=?,��V�m9��Y�7�}bnu¢
2014@y1U¢89-96¢143�
�e5 �P�2013 ��^>r=3�:*=0_?,m�EC'—.�hE
v�\-m9��Y,�}��nu�2013@y2U¢66-73�
XJ��2014 ���^>r=?,�*=?,~��{nu��� ¢)�
��gp�
f��2011 �/�0�^>_i���{9�nu—.��cr=?,Hw#
mOL�Y����}b¢2011@y10U¢51-56�
�T�2012 ��^>)���t�"?,_i�~Fm9�nu—.�CNH�
CNY&NDF?,mOL��R��¢2012@y8U¢17-22�
�T�2016 ���^>)��r=?,�*=?,m��C'��� ¢)
80
p�s4�gp�
62-73.
�G ���2012 �/�0�^>_i�Z�{m8�nu���nu¢2012@
y9U¢62-73�
$2a�2015 �r=�^>�*=�^>m���{�Y�6D��144K
�p�s4g ¢2015@y3U¢46-49¢92�
B|+ �q��2014 �*=�^>?,��cr=�^>?,~��{m9�
nu���N�nu¢2014@y4U¢8-14�
B(k�2014 ���cr=�^>:/��>MzmC'nu��� ¢}bs
4�gp�
§ §

81
Figures and Tables
Table 2-1. Four Categories on Interactions between the Spot Exchange Rates of
CNY and CNH Markets
S/N
Spot exchange
rate�CNH,
CNY
Forward exchange
rate�CNH,
CNY
NDF Representing Paper
1 ○ ○ ○ Liu (2014)
2 ○ ○ Gu & McNelis (2011)
3 ○ ○ Maziad � Kang (2012)
4 ○ Wu (2015)
Note: “○” represents the study object
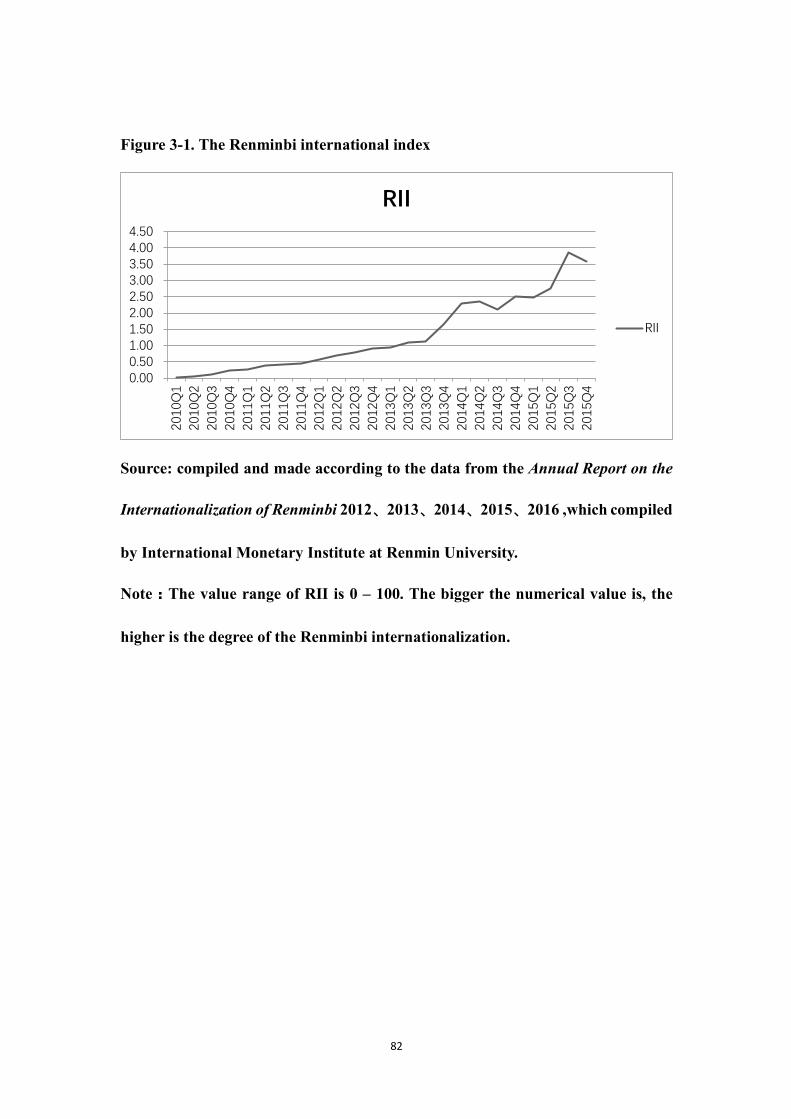
82
Figure 3-1. The Renminbi international index
Source: compiled and made according to the data from the Annual Report on the
Internationalization of Renminbi 2012�2013�2014�2015�2016 ,which compiled
by International Monetary Institute at Renmin University.
Note�The value range of RII is 0 – 100. The bigger the numerical value is, the
higher is the degree of the Renminbi internationalization.
¯¯¯¯´¯°¯¯°´¯±¯¯±´¯²¯¯²´¯³¯¯³´¯
±¯°¯Ê°
±¯°¯Ê±
±¯°¯Ê²
±¯°¯Ê³
±¯°°Ê°
±¯°°Ê±
±¯°°Ê²
±¯°°Ê³
±¯°±Ê°
±¯°±Ê±
±¯°±Ê²
±¯°±Ê³
±¯°²Ê°
±¯°²Ê±
±¯°²Ê²
±¯°²Ê³
±¯°³Ê°
±¯°³Ê±
±¯°³Ê²
±¯°³Ê³
±¯°´Ê°
±¯°´Ê±
±¯°´Ê²
±¯°´Ê³
��
ËÄÄ
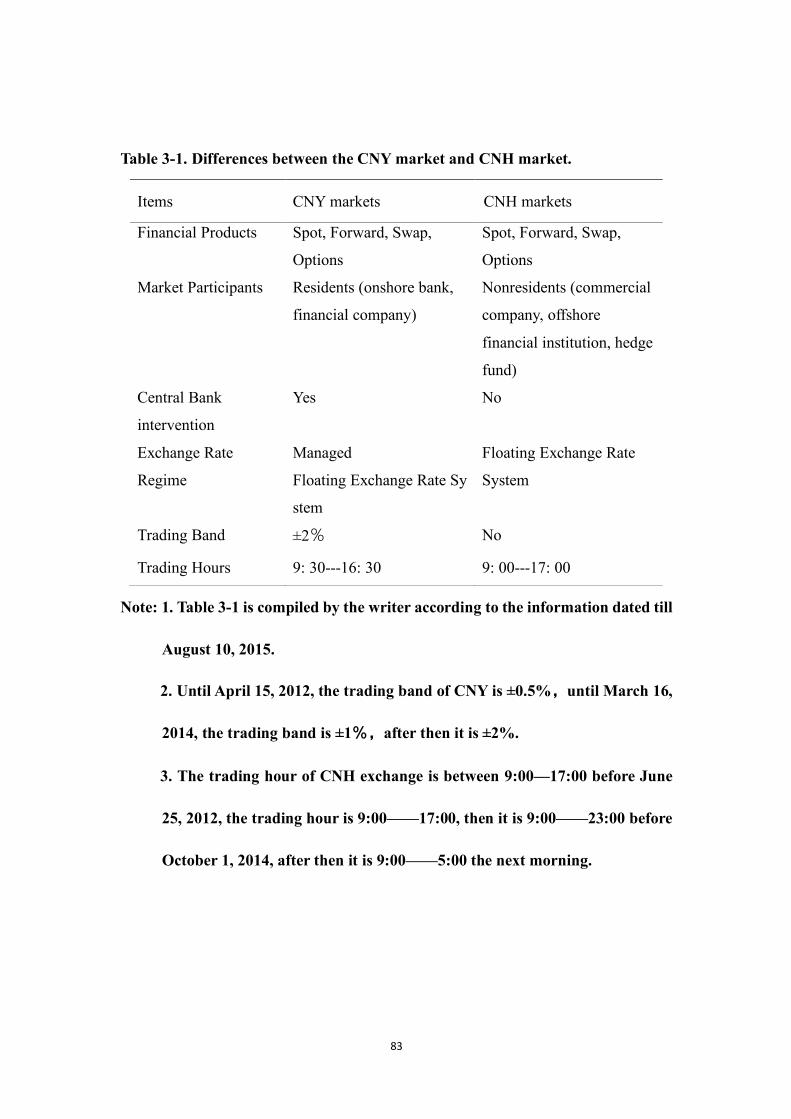
83
Table 3-1. Differences between the CNY market and CNH market.
Items CNY markets CNH markets
Financial Products Spot, Forward, Swap,
Options
Spot, Forward, Swap,
Options
Market Participants Residents (onshore bank,
financial company)
Nonresidents (commercial
company, offshore
financial institution, hedge
fund)
Central Bank
intervention
Yes No
Exchange Rate
Regime
Managed
Floating Exchange Rate Sy
stem
Floating Exchange Rate
System
Trading Band ±2� No
Trading Hours 9: 30---16: 30 9: 00---17: 00
Note: 1. Table 3-1 is compiled by the writer according to the information dated till
August 10, 2015.
2. Until April 15, 2012, the trading band of CNY is ±0.5%�until March 16,
2014, the trading band is ±1��after then it is ±2%.
3. The trading hour of CNH exchange is between 9:00—17:00 before June
25, 2012, the trading hour is 9:00——17:00, then it is 9:00——23:00 before
October 1, 2014, after then it is 9:00——5:00 the next morning.

84
Figure 3-2�Changes of the Spot Exchange Rates in the CNH Market and CNY
Market �Yuan/ Dollar , Daily�
Source: Made by the author based on Bloomberg Data
¬¯¯µ
¬¯¯³
¬¯¯±
¯
¯¯±
¯¯³
¯¯µ
¯¯·
¯°
¯°±
¯°³
´¶
´·
´¸
µ
µ°
µ±
µ²
µ³
µ´
µµ
µ¶
±¯°°®°®²
±¯°°®³®²
±¯°°®¶®²
±¯°°®°¯®²
±¯°±®°®²
±¯°±®³®²
±¯°±®¶®²
±¯°±®°¯®²
±¯°²®°®²
±¯°²®³®²
±¯°²®¶®²
±¯°²®°¯®²
±¯°³®°®²
±¯°³®³®²
±¯°³®¶®²
±¯°³®°¯®²
±¯°´®°®²
±¯°´®³®²
±¯°´®¶®²
¾Èà ¾ÈÐ ÌßàÕÑÔ¦¾Èã¾ÈÐ

85
Figure 3-3. Change Rate in the CNH Market and CNY Market (Daily)
Source: Calculated by the author based on Bloomberg Data
¬¯¯µ
¬¯¯³
¬¯¯±
¯
¯¯±
¯¯³
¯¯µ
¯¯·
¯°
±¯°°®°®²
±¯°°®³®²
±¯°°®¶®²
±¯°°®°¯®²
±¯°±®°®²
±¯°±®³®²
±¯°±®¶®²
±¯°±®°¯®²
±¯°²®°®²
±¯°²®³®²
±¯°²®¶®²
±¯°²®°¯®²
±¯°³®°®²
±¯°³®³®²
±¯°³®¶®²
±¯°³®°¯®²
±¯°´®°®²
±¯°´®³®²
±¯°´®¶®²
¾ÈÃÏ ¾ÈÐÏ

86
Figure 3-4. The volatility Range between CNH and CNY (Yuan/Dollar, Closing)
against the central parity rate
Source: Made by the author based on data from Bloomberg and SAFE (State
Administration of Foreign Exchange).
Note: CNH* = (CNH-Central parity rate)/Central parity rate*100
CNY* = (CNY-Central parity rate)/Central parity rate*100

87
Table 3-2. Descriptive statistics
Period Statistics Full A B C D E
CNY Mean 6.2644 6.5036 6.3679 6.3230 6.2010 6.1974
Max 6.6346 6.6346 6.4006 6.3847 6.3954 6.2754
Min 6.0410 6.3777 6.3365 6.2865 6.0410 6.1091
Sd 0.1350 0.0704 0.0164 0.0248 0.0980 0.0413
Skewness 0.7316 -0.1803 0.1398 0.7282 0.3051 -0.4799
Kurtosis 2.9095 1.9220 1.8495 2.2400 1.9412 2.3555
CNY Mean 6.2640 6.4938 6.4265 6.3269 6.1963 6.2014
Sd 6.6015 6.6015 6.5475 6.4170 6.3935 6.2898
Min 6.0192 6.3513 6.3525 6.2868 6.0192 6.1118
Max 0.1365 0.0704 0.0402 0.0319 0.1024 0.0412
Skewness 0.6056 -0.3854 0.5990 0.8515 0.2975 -0.3323
Kurtosis 2.6679 2.0787 2.7468 2.4401 2.0123 2.4335
Obs 8295 1310 252 784 3647 2302

88
Table 3-3. Result of ADF unit root test
Period Variable 4" ∆4"
A CNH 0.9333 0.0000***
CNY 0.9366 0.0000***
B CNH 0.3931 0.0000***
CNY 0.1889 0.0000***
C CNH 0.4916 0.0000***
CNY 0.3987 0.0000***
D CNH 0.7030 0.0001***
CNY 0.6888 0.0001***
E CNH 0.6285 0.0000***
CNY 0.6803 0.0000***
Full sample CNH 0.0843* 0.0000***
CNY 0.0705* 0.0001***
Note�1.* refers to confidence level ***�1�� **�5�� *�10�
2. Period: Whole: January 3, 2011 -- January 3, 2011; A: January 3, 2011
-- September 20, 2011; B: September 21, 2011 -- December 30, 2011; C:
January 2, 2012 -- April 13, 2012; D: April 16, 2012 -- April 14, 2014; E:
March 17, 2014 -- August 10, 2015.

89
Table 3-4. Hourly Data
Period Lag CNHV⇒CNYV CNYV⇒CNHV
Whole 8 5.E-14*** 9.E-07***
A 7 0.0248** 0.0030***
B 2 0.0253** 0.4557
C 1 0.0408** 0.8109
D 8 5.E-13*** 0.0084***
E 3 0.0005*** 0.0004***
Note�1.* refers to confidence level ***�1�� **�5�� *�10�
2. Period: Whole: January 3, 2011 -- January 3, 2011; A: January 3, 2011
-- September 20, 2011; B: September 21, 2011 -- December 30,
2011; C: January 2, 2012 -- April 13, 2012; D: April 16, 2012 --
April 14, 2014; E: March 17, 2014 -- August 10, 2015.

90
Table 3-5. Closing Time Data. Granger causality test between CNY and CNH
Period Lag CNH CNY CNY CNH
Whole 8 0.0000*** 0.0000***
A 7 0.0248** 0.0030***
B 2 0.0253** 0.4557
C 1 0.0408** 0.8109
D 8 0.0000*** 0.0084***
E 3 0.0005*** 0.0004***
Note�1.* refers to confidence level ***�1�� **�5�� *�10�
2. Period: Whole: January 3, 2011 -- January 3, 2011; A: January 3, 2011
-- September 20, 2011; B: September 21, 2011 -- December 30,
2011; C: January 2, 2012 -- April 13, 2012; D: April 16, 2012 --
April 14, 2014; E: March 17, 2014 -- August 10, 2015.
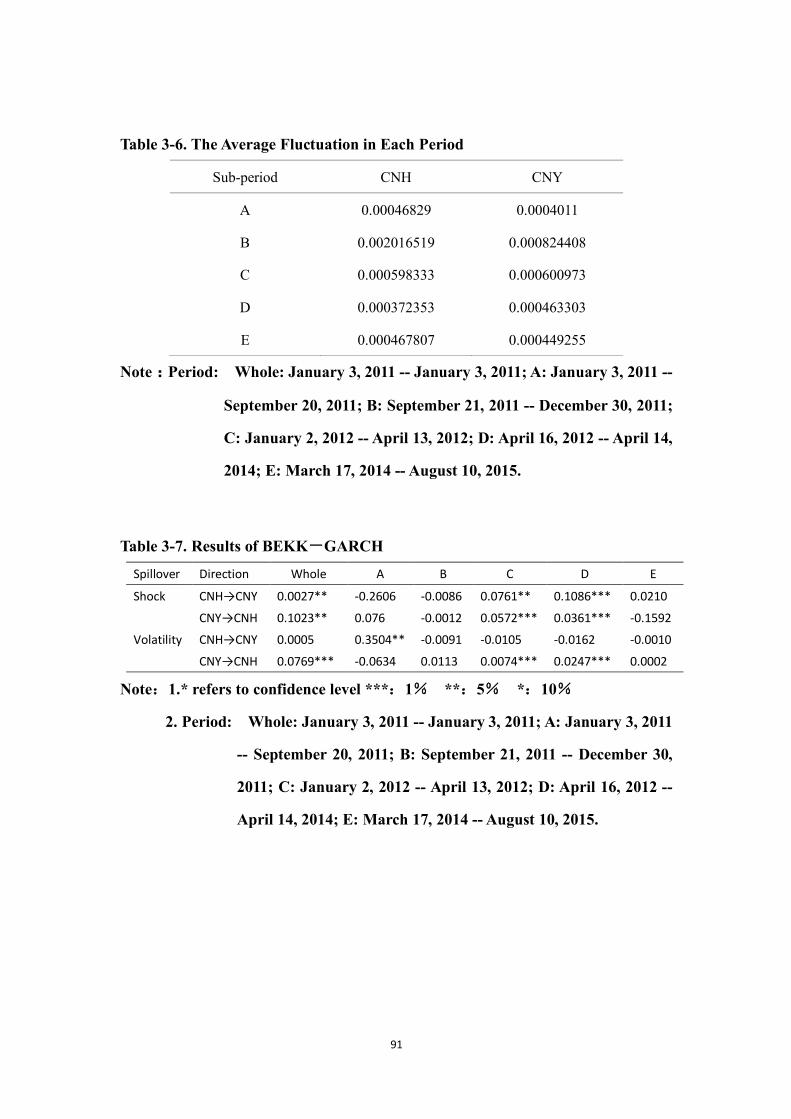
91
Table 3-6. The Average Fluctuation in Each Period
Sub-period CNH CNY
A 0.00046829 0.0004011
B 0.002016519 0.000824408
C 0.000598333 0.000600973
D 0.000372353 0.000463303
E 0.000467807 0.000449255
Note�Period: Whole: January 3, 2011 -- January 3, 2011; A: January 3, 2011 --
September 20, 2011; B: September 21, 2011 -- December 30, 2011;
C: January 2, 2012 -- April 13, 2012; D: April 16, 2012 -- April 14,
2014; E: March 17, 2014 -- August 10, 2015.
Table 3-7. Results of BEKK GARCH
Spillover Direction Whole A B C D E Shock CNH→CNY 0.0027** -0.2606 -0.0086 0.0761** 0.1086*** 0.0210
CNY→CNH 0.1023** 0.076 -0.0012 0.0572*** 0.0361*** -0.1592 Volatility CNH→CNY 0.0005 0.3504** -0.0091 -0.0105 -0.0162 -0.0010
CNY→CNH 0.0769*** -0.0634 0.0113 0.0074*** 0.0247*** 0.0002
Note 1.* refers to confidence level *** 1 ** 5 * 10
2. Period: Whole: January 3, 2011 -- January 3, 2011; A: January 3, 2011
-- September 20, 2011; B: September 21, 2011 -- December 30,
2011; C: January 2, 2012 -- April 13, 2012; D: April 16, 2012 --
April 14, 2014; E: March 17, 2014 -- August 10, 2015.
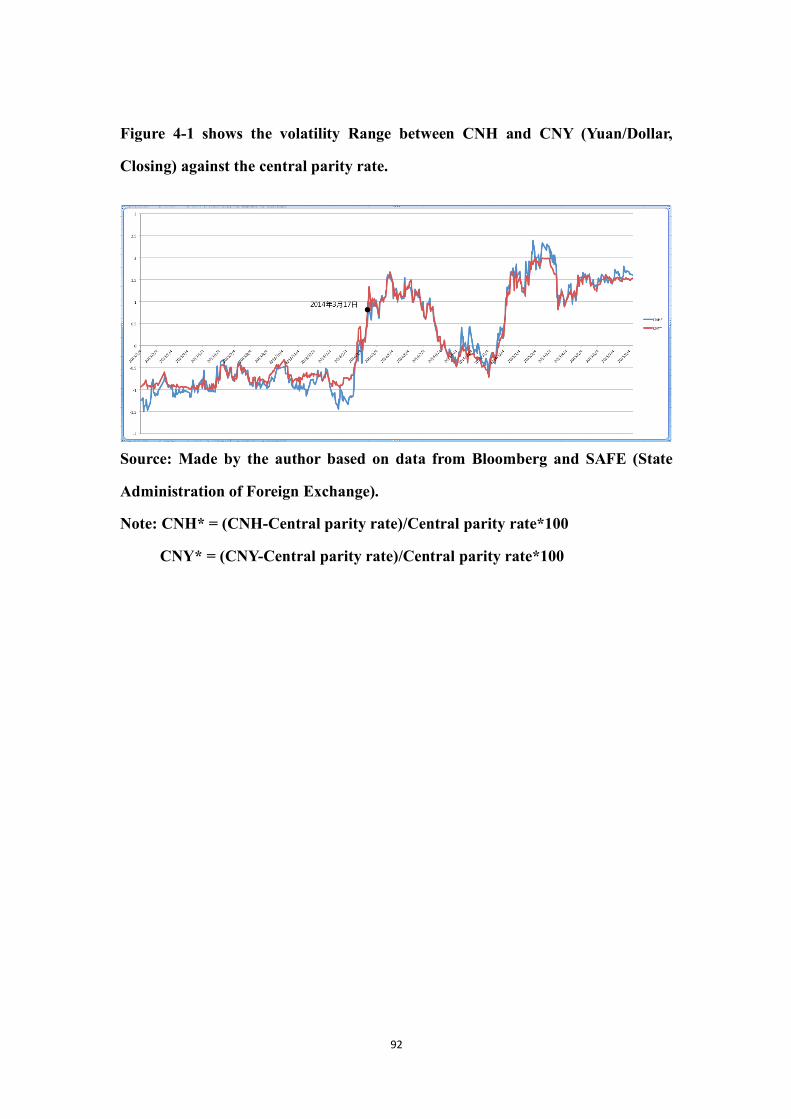
92
Figure 4-1 shows the volatility Range between CNH and CNY (Yuan/Dollar,
Closing) against the central parity rate.
Source: Made by the author based on data from Bloomberg and SAFE (State
Administration of Foreign Exchange).
Note: CNH* = (CNH-Central parity rate)/Central parity rate*100
CNY* = (CNY-Central parity rate)/Central parity rate*100

93
Table 4-1. Descriptive statistics
CNH CNY
Mean 6.168440 6.169741
Maximum 6.187800 6.190800
Minimum 6.513400 6.427100
Std. Dev. 6.018700 6.040900
Skewness 0.061097 0.057148
Kurtosis -0.408934 -0.306958
Observations 44530 44530
Table 4-2. Result of ADF unit root test
Variable 4" ∆4"
CNH 0.7564 0.0001***
CNY 0.9129 0.0000***
Note: *** denotes the significance at the level of 1%.

94
Table 4-3. VAR model estimation result with the policy dummy variable
(1) (2) VARIABLES dlnCNH dlnCNY L.dlnCNH -0.5130*** 0.2010 (0.0152) (1.7184) L2.dlnCNH -0.2499*** -0.0104 (0.0170) (1.9205) L3.dlnCNH -0.1207*** -0.2239 (0.0170) (1.9204) L4.dlnCNH -0.0405*** -0.0817 (0.0152) (1.7184) L.dlnCNH2 -0.0047 -0.2502 (0.0165) (1.8690) L2.dlnCNH2 -0.0027 -0.0102 (0.0184) (2.0837) L3.dlnCNH2 0.0125 0.2148 (0.0183) (2.0782) L4.dlnCNH2 -0.0040 0.0673 (0.0163) (1.8496) L.dlnCNY 0.0000 -0.0000 (0.0000) (0.0047) L2.dlnCNY -0.0000 -0.0000 (0.0000) (0.0047) L3.dlnCNY -0.0000 -0.0000 (0.0000) (0.0047) L4.dlnCNY 0.0000 0.0000 (0.0000) (0.0047) L.dlnCNY2 -0.0767*** -0.1298 (0.0080) (0.9057) L2.dlnCNY2 -0.0937*** -0.0635 (0.0080) (0.9085) L3.dlnCNY2 -0.0553*** -0.0205 (0.0080) (0.9041) L4.dlnCNY2 -0.0203*** 0.0014 (0.0078) (0.8864) Constant 0.0001 0.0000 (0.0001) (0.0146) R-squared 0.2367 0.0000
Standard errors in parentheses
*** p<0.01, ** p<0.05, * p<0.1

95
Figure 4-2 CNY Price change rate
Figure 4-3 CNY standard deviation
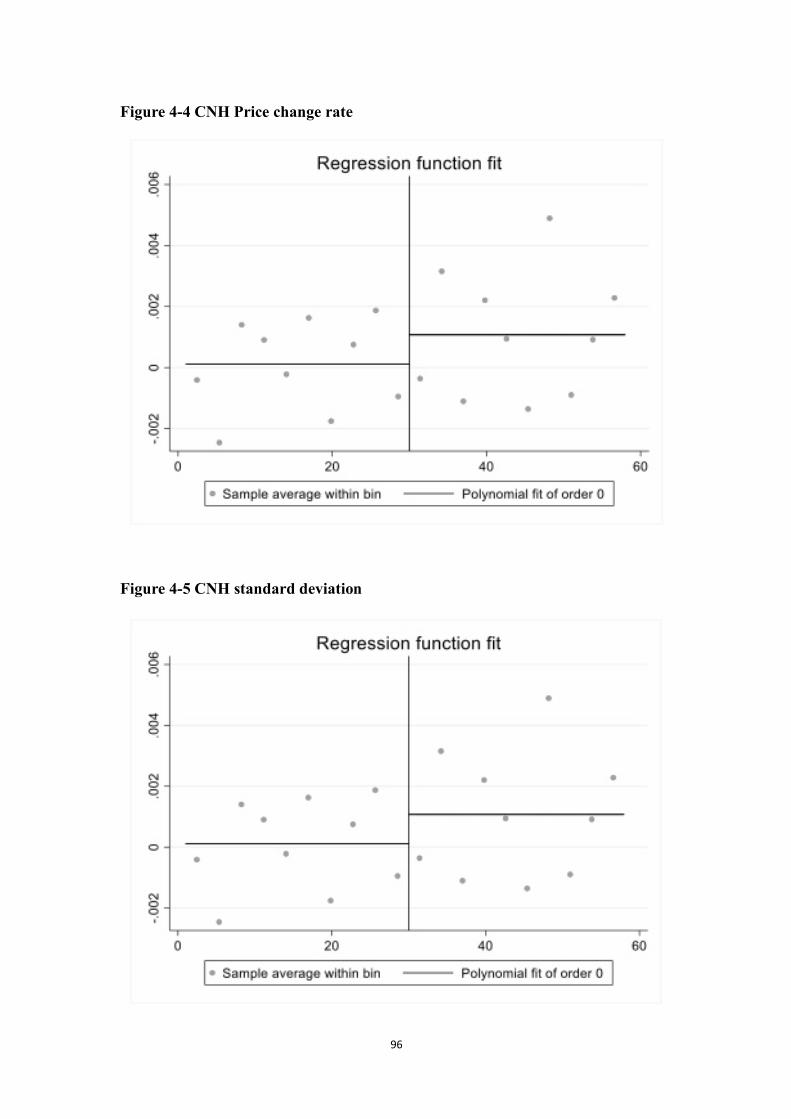
96
Figure 4-4 CNH Price change rate
Figure 4-5 CNH standard deviation

97
Table 4-4 DVEC-GARCH model estimation result with the policy dummy variable
(1) (2) (3)
VARIABLES CNH Covariance CNY
Constant 0.0001140*** -0.0200388 0.6640222***
(0.0000261) (0.0302998) (0.0690513)
Level 0.0392056*** -0.8245916*** 0.0002915***
(0.0137013) (0.1749146) (0.0000658)
Volatility 0.5677367*** 0.0000390*** 0.0000756*
(0.0864160) (0.0000099) (0.0000445)
Dummy 0.0001473*** 0.1595064*** 0.0000443**
(0.0000257) (0.0379225) (0.0000205)
Standard errors in parentheses
*** p<0.01, ** p<0.05, * p<0.1
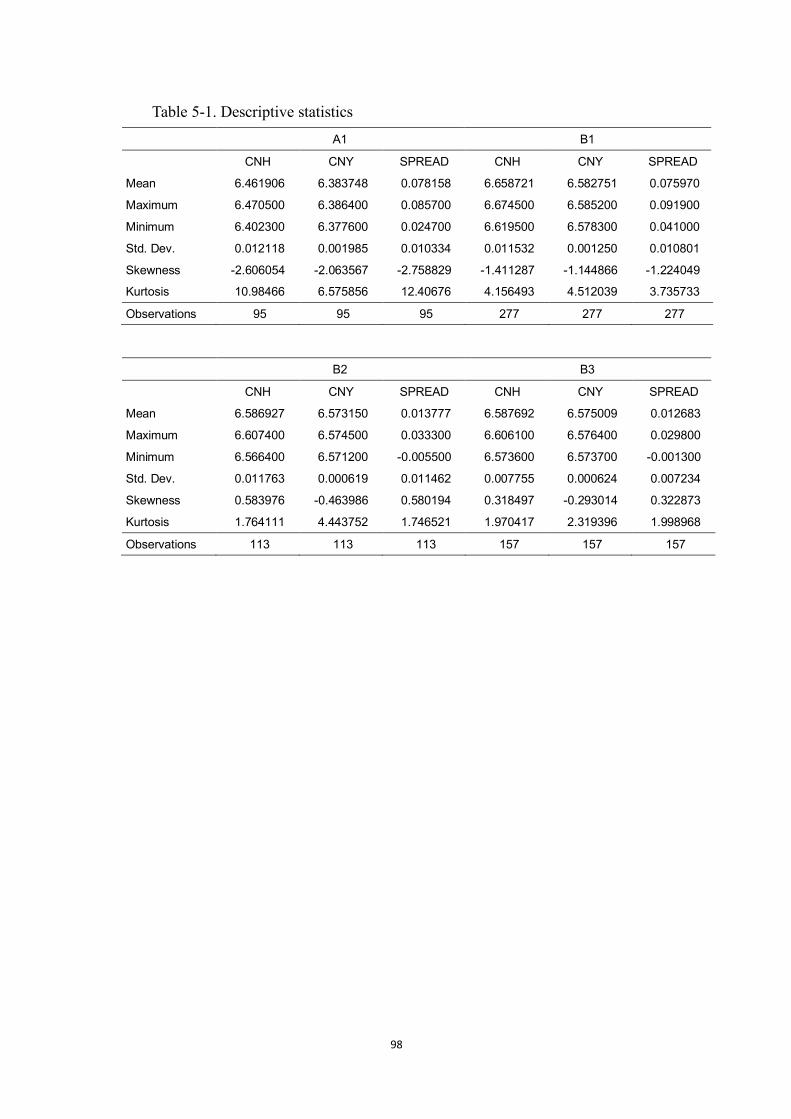
98
Table 5-1. Descriptive statistics
A1 B1
CNH CNY SPREAD CNH CNY SPREAD
Mean 6.461906 6.383748 0.078158 6.658721 6.582751 0.075970
Maximum 6.470500 6.386400 0.085700 6.674500 6.585200 0.091900
Minimum 6.402300 6.377600 0.024700 6.619500 6.578300 0.041000
Std. Dev. 0.012118 0.001985 0.010334 0.011532 0.001250 0.010801
Skewness -2.606054 -2.063567 -2.758829 -1.411287 -1.144866 -1.224049
Kurtosis 10.98466 6.575856 12.40676 4.156493 4.512039 3.735733
Observations 95 95 95 277 277 277
B2 B3 B3
CNH CNY SPREAD CNH CNY SPREAD
Mean 6.586927 6.573150 0.013777 6.587692 6.575009 0.012683
Maximum 6.607400 6.574500 0.033300 6.606100 6.576400 0.029800
Minimum 6.566400 6.571200 -0.005500 6.573600 6.573700 -0.001300
Std. Dev. 0.011763 0.000619 0.011462 0.007755 0.000624 0.007234
Skewness 0.583976 -0.463986 0.580194 0.318497 -0.293014 0.322873
Kurtosis 1.764111 4.443752 1.746521 1.970417 2.319396 1.998968
Observations 113 113 113 157 157 157

99
Figure 5-1 The spot exchange rate and the spread between the CNH and the CNY markets yuan/dollar �
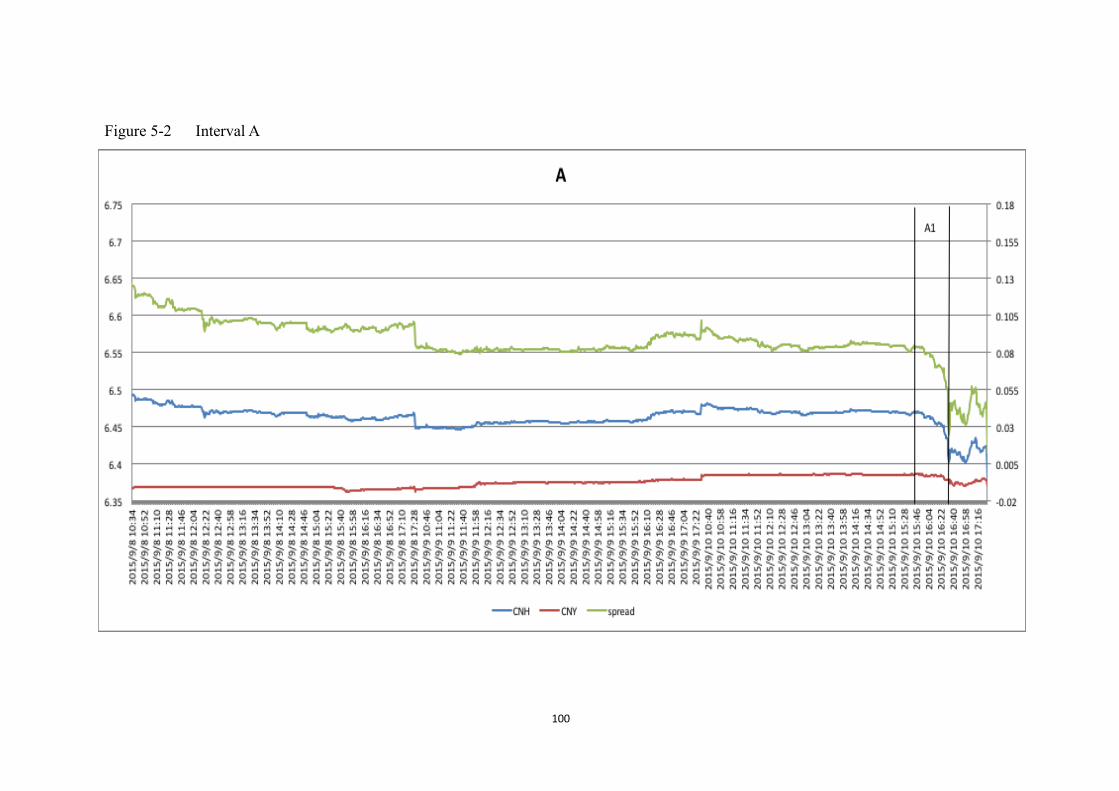
100
Figure 5-2 Interval A
�
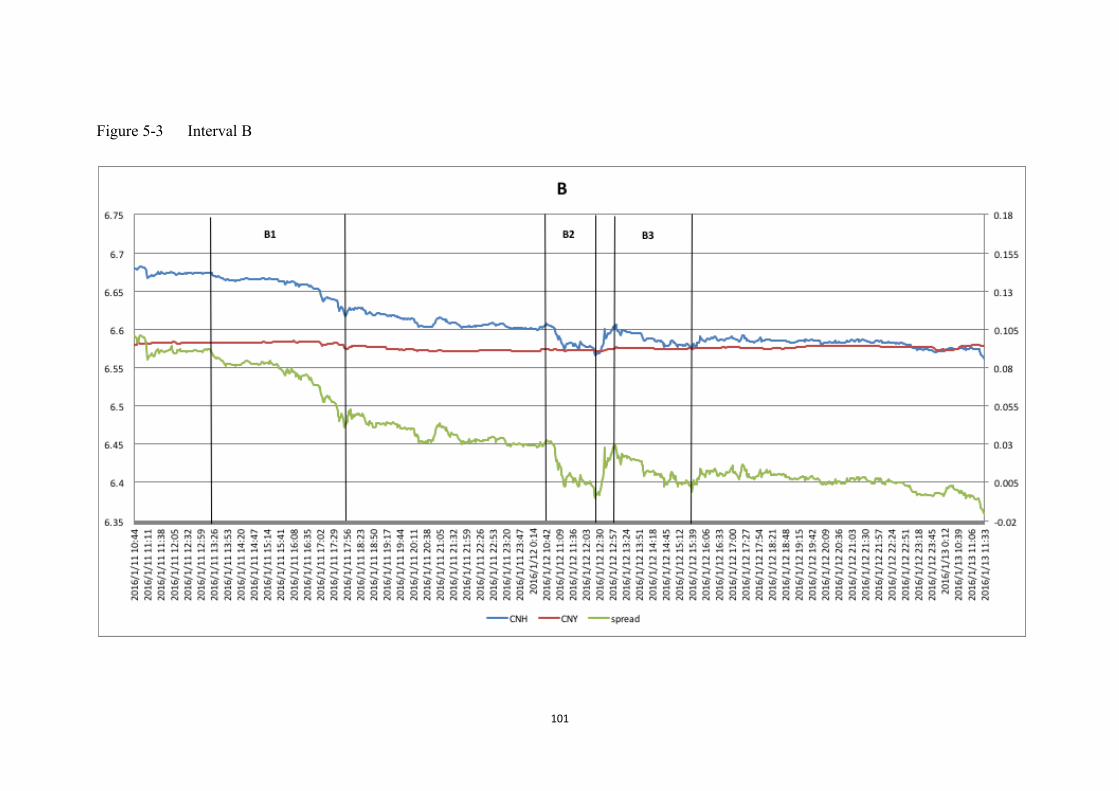
101
Figure 5-3 Interval B �
�

102
Figure 5-4 Interval A1 �
���
.000
.005
.010
.015
.020
.025
.030
1 2 3 4 5 6 7 8 9 10
CNH CNY
Accumulated Response of CNH to CholeskyOne S.D. Innovations
.000
.001
.002
.003
.004
1 2 3 4 5 6 7 8 9 10
CNH CNY
Accumulated Response of CNY to CholeskyOne S.D. Innovations

103
Figure 5-5� Interval B1 �
����
.000
.002
.004
.006
.008
.010
.012
.014
1 2 3 4 5 6 7 8 9 10
CNH CNY
Accumulated Response of CNH to CholeskyOne S.D. Innovations
.0000
.0005
.0010
.0015
.0020
.0025
1 2 3 4 5 6 7 8 9 10
CNH CNY
Accumulated Response of CNY to CholeskyOne S.D. Innovations

104
Figure 5-6� Interval B2 �
�����
-.004
.000
.004
.008
.012
.016
1 2 3 4 5 6 7 8 9 10
CNH CNY
Accumulated Response of CNH to CholeskyOne S.D. Innovations
.0000
.0002
.0004
.0006
.0008
.0010
.0012
1 2 3 4 5 6 7 8 9 10
CNH CNY
Accumulated Response of CNY to CholeskyOne S.D. Innovations
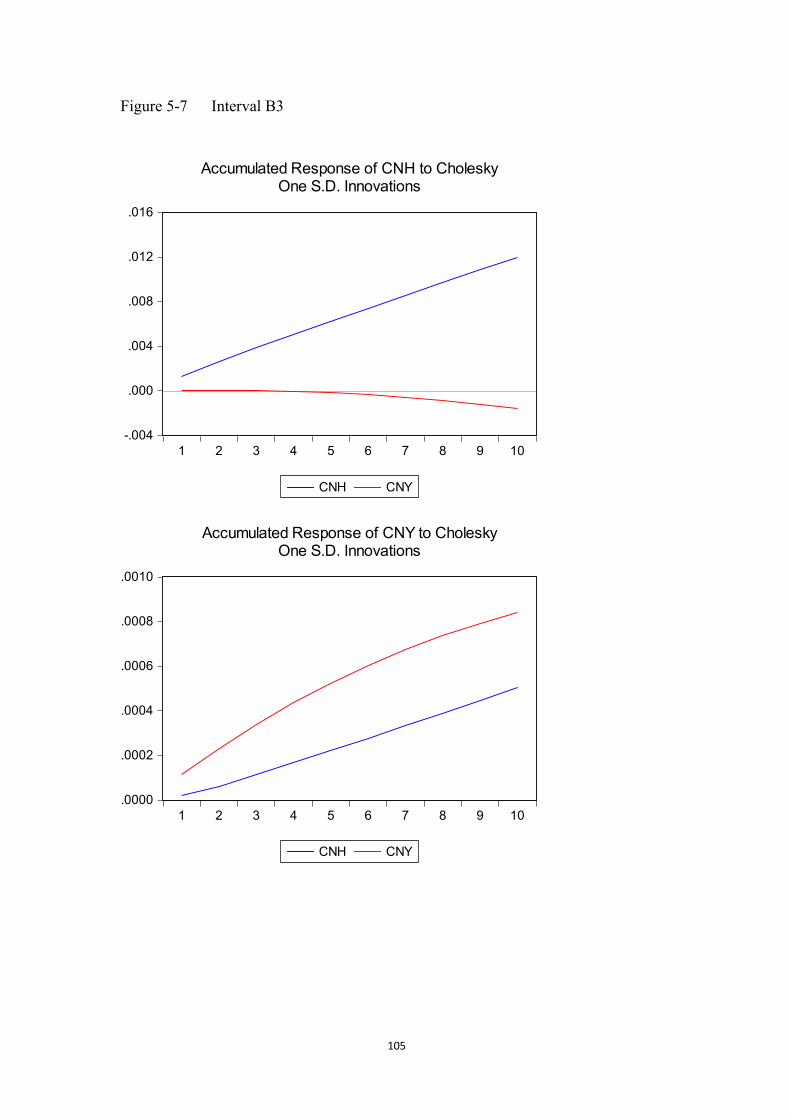
105
Figure 5-7� Interval B3
�
�
�
�
�
-.004
.000
.004
.008
.012
.016
1 2 3 4 5 6 7 8 9 10
CNH CNY
Accumulated Response of CNH to CholeskyOne S.D. Innovations
.0000
.0002
.0004
.0006
.0008
.0010
1 2 3 4 5 6 7 8 9 10
CNH CNY
Accumulated Response of CNY to CholeskyOne S.D. Innovations

106
Appendix
Appendix1. Impulse response of A1 interval (accumulate) in Chapter5
�
���
-.01
.00
.01
.02
.03
.04
.05
1 2 3 4 5 6 7 8 9 10
Accumulated Response of CNH to CNH
-.01
.00
.01
.02
.03
.04
.05
1 2 3 4 5 6 7 8 9 10
Accumulated Response of CNH to CNY
-.002
.000
.002
.004
.006
.008
1 2 3 4 5 6 7 8 9 10
Accumulated Response of CNY to CNH
-.002
.000
.002
.004
.006
.008
1 2 3 4 5 6 7 8 9 10
Accumulated Response of CNY to CNY
Accumulated Response to Cholesky One S.D. Innovations ?2 S.E.

107
Appendix2. Impulse response of B1 interval (accumulate) in Chapter5
�
����
-.004
.000
.004
.008
.012
.016
1 2 3 4 5 6 7 8 9 10
Accumulated Response of CNH to CNH
-.004
.000
.004
.008
.012
.016
1 2 3 4 5 6 7 8 9 10
Accumulated Response of CNH to CNY
.0000
.0004
.0008
.0012
.0016
.0020
.0024
.0028
.0032
1 2 3 4 5 6 7 8 9 10
Accumulated Response of CNY to CNH
.0000
.0004
.0008
.0012
.0016
.0020
.0024
.0028
.0032
1 2 3 4 5 6 7 8 9 10
Accumulated Response of CNY to CNY
Accumulated Response to Cholesky One S.D. Innovations ?2 S.E.
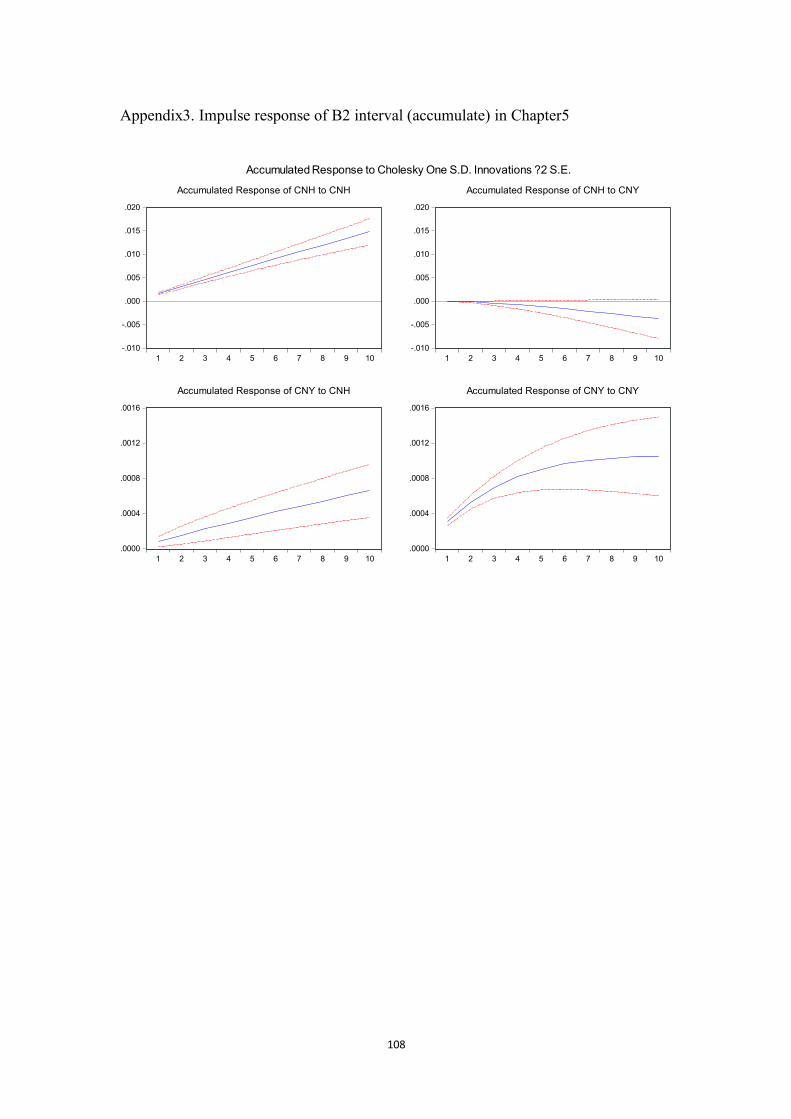
108
Appendix3. Impulse response of B2 interval (accumulate) in Chapter5
�
�����
-.010
-.005
.000
.005
.010
.015
.020
1 2 3 4 5 6 7 8 9 10
Accumulated Response of CNH to CNH
-.010
-.005
.000
.005
.010
.015
.020
1 2 3 4 5 6 7 8 9 10
Accumulated Response of CNH to CNY
.0000
.0004
.0008
.0012
.0016
1 2 3 4 5 6 7 8 9 10
Accumulated Response of CNY to CNH
.0000
.0004
.0008
.0012
.0016
1 2 3 4 5 6 7 8 9 10
Accumulated Response of CNY to CNY
Accumulated Response to Cholesky One S.D. Innovations ?2 S.E.

109
Appendix4. Impulse response of B3 interval (accumulate) in Chapter5
�
�
�
�
�
-.005
.000
.005
.010
.015
.020
1 2 3 4 5 6 7 8 9 10
Accumulated Response of CNH to CNH
-.005
.000
.005
.010
.015
.020
1 2 3 4 5 6 7 8 9 10
Accumulated Response of CNH to CNY
.0000
.0004
.0008
.0012
1 2 3 4 5 6 7 8 9 10
Accumulated Response of CNY to CNH
.0000
.0004
.0008
.0012
1 2 3 4 5 6 7 8 9 10
Accumulated Response of CNY to CNY
Accumulated Response to Cholesky One S.D. Innovations ?2 S.E.