Embed Size (px)
Citation preview

Copyright is owned by the Author of the thesis. Permission is given for a copy to be downloaded by an individual for the purpose of research and private study only. The thesis may not be reproduced elsewhere without the permission of the Author.

Interactions
Human Saliva
of Whey Protein Beverages
A thesis in partial fulfilment of the requirement of the degree of Master of Technology in Food Technology at Riddet Institute, Mass
s of Whey Protein Isolate and
– as related to the Astringency
of Whey Protein Beverages
A thesis in partial fulfilment of the requirement of the degree of Master of Technology in Food Technology at Riddet Institute, Mass
New Zealand
Christina Streicher
2010
of Whey Protein Isolate and
as related to the Astringency
A thesis in partial fulfilment of the requirement of the degree of Master of Technology in Food Technology at Riddet Institute, Massey University,


Tables of Content
I
Table of Content
Table of Figures ........................................................................................................IV
Table of Tables ........................................................................................................VII
Abstract ...................................................................................................................... 1
Acknowledgement...................................................................................................... 4
Chapter 1: Introduction............................................................................................... 5
Chapter 2: Literature review ....................................................................................... 9
2.1 Whey proteins................................................................................................... 9
- -lg)................................................................................. 10
-lactalbumin............................................................................................ 11
2.1.3 Bovine Serum Albumin (BSA) .................................................................. 12
2.1.4 Lactoferrin ................................................................................................ 12
2.2 Human Saliva ................................................................................................. 13
2.2.1 Composition of human saliva ................................................................... 13
2.2.2 Properties and functions of human saliva ................................................ 15
2.2.3 Handling of human saliva ......................................................................... 15
2.3 Astringency – definition and perception .......................................................... 16
2.3.1 Definition of astringency........................................................................... 16
2.3.2 Astringency: tactile versus gustatory sensation........................................ 16
2.3.3 Perception of astringency......................................................................... 17
2.3.4 Factors influencing the astringent sensation ............................................ 18
2.3.4.1 Salivary flow ...................................................................................... 18
2.3.4.2 Salivary proteins ................................................................................ 19
2.3.4.3 pH change ......................................................................................... 19
2.3.4.4. Sweeteners....................................................................................... 20
2.4 Interactions between proteins and human saliva ............................................ 20
2.4.1 Chitosan-saliva interactions ..................................................................... 20
2.4.2 Whey protein-saliva interactions .............................................................. 21
2.5 Approach to determine protein-saliva interactions.......................................... 21
2.5.1 Hydrodynamic diameter ........................................................................... 22
2.5. -Potential ................................................................................................ 22

Tables of Content
II
2.5.3 Turbidity ................................................................................................... 23
2.5.4 Electrophoresis (SDS-PAGE)................................................................... 24
Chapter 3: Materials and methods ........................................................................... 27
3.1 Materials ......................................................................................................... 27
3.2 Protein solution preparation............................................................................ 27
3.3 Human saliva collection .................................................................................. 28
3.4 Preparation of protein-saliva mixtures ............................................................ 28
3.5 Mixtures of WPI and saliva collected from the mouth ..................................... 29
3.6 Measurement of the hydrodynamic diameter.................................................. 30
-Potential measurement ................................................................................ 30
3.8 Turbidity measurement ................................................................................... 31
3.9 Electrophoresis (SDS-PAGE) ......................................................................... 31
3.10 Statistical analysis ........................................................................................ 33
Chapter 4: Results.................................................................................................... 35
4.1 Behaviour of human saliva at different pH-levels............................................ 35
4.2 Interactions between lactoferrin and human saliva ......................................... 40
4.2.1 Interactions between lactoferrin (unheated/heat-treated), which was adjusted to different pH-levels, and human saliva............................................. 40
4.2.1.1 Hydrodynamic diameter..................................................................... 40
-Potential.......................................................................................... 43
4.2.1.3 Turbidity............................................................................................. 45
4.2.1.4 SDS-PAGE........................................................................................ 47
4.2.2 Interactions between lactoferrin (unheated/heated), which was adjusted to different pH-levels, and human saliva at readjusted pH-levels.......................... 49
4.2.2.1 Hydrodynamic diameter..................................................................... 49
-Potential.......................................................................................... 51
4.2.2.3 Turbidity............................................................................................. 53
4.2.2.4 SDS-PAGE........................................................................................ 55
4.3 Inter -lactoglobulin and human saliva.................................. 60
4.3.1 Interactions between -lactoglobulin (unheated/heated), which was adjusted to different pH-levels, and human saliva............................................. 60
4.3.1.1 Hydrodynamic diameter..................................................................... 60
-Potential.......................................................................................... 63
4.3.1.3 Turbidity............................................................................................. 65

Tables of Content
III
4.3.1.4 SDS-PAGE........................................................................................ 67
-lactoglobulin (unheated/heated), which was adjusted to different pH-levels, and human saliva at readjusted pH-levels ....... 69
4.3.2.1 Hydrodynamic diameter..................................................................... 69
-Potential.......................................................................................... 71
4.3.2.3 Turbidity............................................................................................. 73
4.3.2.4 SDS-PAGE........................................................................................ 75
4.4 Interactions between WPI and human saliva .................................................. 80
4.4.1 Interactions between WPI (unheated/heated), which was adjusted to different pH-levels, and human saliva ............................................................... 80
4.4.1.1 Hydrodynamic diameter..................................................................... 81
-Potential.......................................................................................... 83
4.4.1.3 Turbidity............................................................................................. 85
4.4.1.4 SDS-PAGE........................................................................................ 87
4.4.2 Interactions between WPI (unheated/heated), which was adjusted to different pH-levels, and human saliva at readjusted pH-levels.......................... 89
4.4.2.1 Hydrodynamic diameter..................................................................... 89
-Potential.......................................................................................... 91
4.4.2.3 Turbidity............................................................................................. 93
4.4.2.4 Electrophoresis.................................................................................. 95
4.5 Mixtures of heated WPI and saliva collected from the mouth ....................... 100
4.6 Proteins remaining on the tongue following the consumption of heated WPI-solutions, which were adjusted to different pH-levels ......................................... 108
Chapter 5: Discussion ............................................................................................ 113
5.1 Lactoferrin..................................................................................................... 113
5.2 -Lactoglobulin ............................................................................................. 114
5.3 WPI............................................................................................................... 115
Chapter 6: General discussion ............................................................................... 118
Chapter 7: Conclusions .......................................................................................... 122
References............................................................................................................. 123

Tables of Figures
IV
Table of Figures
Figure 1: Particle sizes of human saliva at adjusted pH-levels................................. 36Figure 2: -Potentials of human saliva at adjusted pH-levels. .................................. 36Figure 3: SDS-PAGE of human saliva...................................................................... 37Figure 4: Hydrodynamic diameter of the mixtures of unheated (A) and heated (B) lactoferrin and human saliva. ................................................................................... 42
-Potentials of the mixtures of unheated (A) and heated (B) lactoferrin and human saliva (1:1).................................................................................................... 44Figure 6: Turbidity of the mixtures of unheated (A) and heated (B) lactoferrin and human saliva (1:1).................................................................................................... 46Figure 7: SDS-PAGE of the sediments of the mixtures of unheated lactoferrin and saliva (1:1)................................................................................................................ 48Figure 8: SDS-PAGE of the sediments of the mixtures of heated lactoferrin and saliva (1:1)................................................................................................................ 48Figure 9: Hydrodynamic diameter of (A) lactoferrin (unheated) and the mixture of unheated lactoferrin and human saliva 1:1 at adjusted pH-levels and (B) heated lactoferrin and mixture of heated lactoferrin with human saliva (1:1). ...................... 50
-Potential of (A) lactoferrin (unheated) and the mixture of unheated lactoferrin and human saliva 1:1 at adjusted pH-levels and (B) lactoferrin (heated)and the mixture of heated lactoferrin and human saliva 1:1 at adjusted pH-levels .. 52Figure 11:Turbidity of (A) unheated lactoferrin, the mixture of unheated lactoferrin with human saliva (1:1) and (B) heated lactoferrin and the mixture of heated lactoferrin and human saliva 1:1 at adjusted pH-levels . .......................................... 54Figure 12: SDS-PAGE of the sediment of the mixture of unheated lactoferrin with saliva at adjusted pH levels (unheated).................................................................... 56Figure 13: SDS-PAGE of the sediment of the mixture of heated lactoferrin with saliva at adjusted pH levels (heated).................................................................................. 56Figure 14: Hydrodynamic diameter of the mixture of unheated (A) and heated (B -lg and human saliva (1:1) ......................................................................................... 62
- -lg andhuman saliva (1:1).................................................................................................... 64Figure 16: Turbidity of the mixture of unheated (A) and heated (B) -lg and human saliva (1:1)................................................................................................................ 66Figure 17: SDS-PAGE of the sediments of the mixtur -lg with saliva.................................................................................................................................. 68Figure 18: SDS- -lg with saliva.. 68Figure 19: Hydrodynamic -lg (unheated) -lg and human saliva 1:1 at readjusted pH-levels -lg (heated) and the
-lg and human saliva 1:1 at readjusted pH-levels. ..................... 70

Tables of Figures
V
-P -lg (unheated) -lg and human saliva 1:1 at readjusted pH-levels -lg -lg and human saliva 1:1 at readjusted pH-levels.......................................................... 72Fig - -lg and human saliva 1:1 at readjusted pH-levels -lg -lg and human saliva 1:1 at readjusted pH-levels................................................................. 74Figure 22: SDS- -lg with saliva at readjusted pH-levels............................................................................................. 76Figure 23: SDS- -lg with saliva at adjusted pH-levels.................................................................................................... 76Figure 24: Hydrodynamic diameter of the mixture of unheated (A) and heated (B) WPI and human saliva (1:1) ..................................................................................... 82
-Potential of the mixture of unheated (A) and heated (B) WPI and human saliva (1:1)................................................................................................................ 84Figure 26: Turbidity of the mixture of unheated (A) and heated (B) WPI and human saliva (1:1)................................................................................................................ 86Figure 27: SDS-PAGE of the sediments of the mixtures of unheated WPI and saliva (1:1).......................................................................................................................... 88Figure 28: SDS-PAGE of the sediments of the mixtures of heated WPI and saliva (1:1).......................................................................................................................... 88Figure 29: Hydrodynamic diameter of (A) WPI (unheated), the mixture of unheated WPI and human saliva 1:1 at readjusted pH-levels and (B) heated WPI and the mixture of heated WPI and human saliva 1:1 at readjusted pH-levels ..................... 90
-Potentials of (A) WPI (unheated), the mixture of unheated WPI and human saliva 1:1 at readjusted pH-levels and (B) heated WPI and the mixture of heated WPI and human saliva 1:1 at adjusted pH-levels ......................................... 92Figure 31: Turbidity of (A) WPI (unheated), the mixture of unheated WPI and human saliva 1:1 at readjusted pH-levels and (B) heated WPI and the mixture of heated WPI and human saliva 1:1 at readjusted pH-levels.......................................................... 94Figure 32: SDS-PAGE of the sediments of the mixtures of unheated WPI with saliva at readjusted pH-levels............................................................................................. 96Figure 33: SDS-PAGE of the sediments of the mixtures of heated WPI with saliva at adjusted pH-levels.................................................................................................... 96Figure 34: Astringency ranking of 5 participants (averaged) after consuming WPI (heat-treated) solutions adjusted to pH 6.8, 3.6, 3.4, 3.0, 2.5 and 2.0.................... 101Figure 35: Hydrodynamic diameter of 5 participants (averaged) consuming WPI solutions (heat-treated) at different pH-levels......................................................... 102
-Potential of 5 individuals (averaged) consuming WPI solutions (heat-treated) with different pH-values ............................................................................ 103Figure 37: Turbidity of 5 individuals (averaged) consuming heated WPI solutions adjusted to different pH-values............................................................................... 104Figure 38: SDS-PAGE of the sediments of the mixtures of heated WPI and saliva of 1 participant 105
Tables of Figures
VI
Figure 39: Particle size of the remaining material on the tongue of 5 participants (averaged) after consuming WPI solutions (heat-treated), which were adjusted toparticular pH-values ............................................................................................... 109
-Potentials of the remaining material on the tongue of 5 participants (averaged) after consuming WPI solutions (heat-treated), which were adjusted toparticular pH-values ............................................................................................... 110

Tables of Tables
VII
Table of Tables
Table 1: pH change in lactoferrin (unheated/heated) solutions when mixed with human saliva (1:1).................................................................................................... 40Table 2: pH change in ß-lg (unheated/heated) solutions when mixed with human saliva (1:1)................................................................................................................ 60Table 3: pH change in WPI (unheated/heated) solutions when mixed with human saliva (1:1)................................................................................................................ 80Table 4: The pH changes of heated WPI solutions, adjusted to different pH-levels, when mixed with human saliva in the mouth. ......................................................... 100Table 5: pH change on the tongue after consuming heated WPI solutions. ........... 108


Abstract
1
Abstract
Interactions between 3 diffe -lactoglobulin and Whey
Protein Isolate) and human saliva were determined. Lactoferrin and whey proteins
are known to be astringent at low pH. Astringency is defined as the tactile sensation,
mainly on the tongue, caused by astringent compounds when in contact with human
saliva. Proline-rich proteins are already known to be directly involved in the
astringency of polyphenols. Whey proteins do not contain polyphenols. However,
because whey proteins at low pH develop an astringent sensation when consumed,
it was expected to detect proline-rich proteins in the interaction between Whey
Protein Isolate (WPI) and saliva as well.
The protein solutions were adjusted to different pH-levels, ranging from neutral to
high acidic, where a part of each protein solution was heat-treated. All solutions were
mixed with human saliva in the same ratio (w/w). One part of all mixtures was
pH-readjusted. Additionally, WPI model solutions were prepared, adjusted to
different pH-levels, heat-treated and then consumed by voluntary participants, who
swirled each solution in their mouth for at least 10 seconds. These mixtures of WPI
and saliva were collected for further analysis. After consuming the WPI model
solutions, followed by rinsing the mouth with water, tongue swabs were taken to
determine the particle s -potentials of the remaining material on the tongue.
Control tongue swabs of the clean tongue were taken by the participants before any
consumption of the WPI model solutions.
All mixtu -lactoglobulin -lg), WPI and saliva on their own,
were analysed for -potential and turbidity, which may give an indication
for possible aggregation/precipitation of the proteins as well as the analysis of the
SDS-PAGE profile of the sediments of the sample mixtures.
Saliva is negatively charged between neutral pH and 3.0, whereas lactoferrin has a
positive charge below pH 8.0. WPI has a positive charge below pH 5.1; the same
-lg. None of the proteins themselves showed aggregation/precipitation at

Abstract
2
pH-levels 6.8, 3.6, 3.4, 3.0, 2.5 or 2.0. However, after the proteins were mixed with
saliva, the pH of mixtures shifted towards neutral pH.
The mixtures of lactoferrin (unheated/heat-treated) and saliva neither showed any
significant increases in particle size nor the presence of turbidity. Salivary proteins
were not detected in any mixtures at any observed pH either, despite the known fact
-lg (unheated/heated) and
saliva displayed high particle sizes below final pH 3.6, whereas the high turbidities of
both mixtures were measured between final pH 3.6 and 3.4. Furthermore, only at
final pH 2.8 were salivary proteins (mainly glycosylated proline-rich proteins and
-amylase) detected. However, higher concentrations of salivary proteins were
measured when heat-treated -lg was mixed with saliva. The mixtures of WPI and
saliva presented the strongest interaction compared to l -lg. High
aggregation/precipitation occurred in the mixtures between pH 4.3 and 3.0, where
significantly high particle sizes and turbidities were detected.
The pH-readjusted mixtures of lactoferrin -lactoglobulin/WPI and saliva showed
similar values in particle size and turbidity as the mixtures of the proteins and saliva
without pH-readjustment at similar pH-values. Furthermore, the pH-readjusted
mixtures of the proteins and saliva showed in their sediments the presence of
-amylase and glycosylated proline-rich proteins.
The mixtures of heat-treated WPI and saliva, collected from the mouth after taking a
sip (ratio unknown), revealed that the strongest interactions occurred when
WPI-solutions were adjusted to pH 3.6 and 3.4. Similar observations were made for
heat-treated WPI-solutions, which were adjusted to pH 3.6 and 3.4, when mixed with
saliva 1:1 (w/w). However, additionally to the glycosylated proline-rich proteins and
-amylase, faint bands of mucin as well as basic proline-rich proteins were detected
in the mixtures collected from the mouth.
The proteins of the material remaining on the tongue followed the consumption of
WPI-solutions and rinsing with water showed that the particle size measurements

Abstract
3
were not reliable. However, pH-levels between 6.8 and 5.7 occurred and negative
charges were measured on the tongue after rinsing the mouth twice with water.
The strongest interactions between the proteins and human saliva occurred when
the proteins, in particular -lg and WPI, were positively charged and then mixed with
saliva (negative charge). Concluding from that it is suggested that electrostatic
interactions may cause the astringent sensations. However, since no evidence could
be found that salivary proteins were involved in the interaction between lactoferrin
and saliva (without pH-readjustment), it is suggested that other interactions than
electrostatic interactions cause the astringent sensation of lactoferrin.

Acknowledgement
4
Acknowledgement
First of all, I would like to express my gratitude to the Riddet Institute and in
particular Prof. Harjinder Singh, for giving me the opportunity to work on “the
interactions of Whey Protein Isolate and human saliva”, which is related to the
astringency of whey protein beverages.
I am especially thankful to my supervisor Dr. Aiqian Ye, who extensively supported
me throughout this project with his patience, constructive talks, advises and
suggestions.
I would like to thank Dr. Sharon Henare for her support and help dealing with the
application to the Ethics Committee at Massey University for this project. Without her
help it would not even be possible to start this project.
Janiene Gilliand and all the other lab colleagues supported my project enormously
with their help in laboratory endeavors, their help in operating the instruments as well
as giving helpful suggestions.
Likewise, I am deptful to the participants of the saliva-collection group and the
whey protein-tasting group. They spend a lot of time in the sensory booths for this
project and this thesis could not be finished without their help. I hope that all the
chocolate bars I offered could compensate a bit for the effort they have put into this
project.
I would like to thank all co-workers at the Riddet Institute, who were welcoming and
always keen to help.

Chapter 1: Introduction
5
Chapter 1: Introduction
The growing interest in a healthy lifestyle has caused an increase in the use of milk
proteins to meet consumer demands for healthy foods and beverages. For the past
few years, nutritionally-enhanced food and beverages, such as whey protein
beverages, have experienced a large increase in sales growth. The demand for
energy and sport beverages rose to about 19% from 2006 to 2008 (Anonymous,
2008), which implies that whey proteins will be more often used to meet consumer
demands for high protein beverages.
The use of whey proteins in beverages is becoming increasingly common because
of their high nutritional value and wide functional versatility. They are designed to be
attractive to a variety of markets due to the high-quality proteins they provide. Whey
proteins have the highest concentration of the essential amino acids and the
branched-chain amino acids (BCAA), such as leucine, isoleucine and valine. BCAA
are important in the muscle metabolism and can be used as a source of energy
during or after exercise.
Whey protein beverages have a protein concentration range between 3 - 8% and are
available at low and high acid pH. Beverages, which contain whey proteins, can be
controlled by pH. Beverages produced at neutral pH (~6.8) are generally opaque and
usually available in flavours, such as chocolate, orange cream and vanilla. Acidic
beverages (pH <3.5) are relatively clear and usually available in fruity flavours
(Beecher, 2006). Low pH not only allows an increase in clarity of the beverages, but
also has a significant impact on heat stability, which extends the shelf life and
improves storage conditions (Hazen, 2006, Miller, 2007). Phosphoric acid can be
used to achieve the low pH, as it gives the best flavour for acidic whey protein
beverages (Burrington, 2001). Whey protein beverages have shown to be astringent
at low pH-levels, which may limit consumer acceptance of these products (Beecher,
2006, Monteleone et al., 2004). Astringency is defined as the complexation and
precipitation of astringent compounds with salivary proteins (PRP) which increase
the friction in the mouth. That is perceived as a dry and rough sensation on the
tongue and palate (Jöbstl et al., 2004). The exact cause of astringency in acidic

Chapter 1: Introduction
6
whey protein beverages is still unknown. Other foods, such as wines, teas, fruits and
soy-based products, also display astringency which has been attributed to the
phenolic compounds they contain. Several researchers already suggested that
positively charged whey proteins (at low pH) are capable of binding and aggregating
salivary proteins, therefore causing astringency (Beecher, 2006; Sano et al., 2005;
Vardhanabhuti et al., 2010).
The objective of the thesis is to analyse the interactions between three proteins
(adjusted to different pH-levels) and human saliva. The three protein products are:
1. Lactoferrin
à ambient temperature
à heat-treated
2. -Lg
à ambient temperature
à heat-treated
3. WPI
à ambient temperature
à heat-treated
The interactions between WPI at low pH and human saliva have shown to cause an
astringent sensation (Beecher et al., 2008, Lee and Vickers, 2008, Sano et al., 2005,
Vardhanabhuti et al., 2010). WPI consists of several -lg and
lactoferrin are chosen to be mixed individually with human saliva, as lactoferrin has a
positive net charge, in contrast to WPI -lg. Lactoferrin on its own has already
shown to cause astringency when in contact with human saliva.
One part of the project deals with the determination of the interaction of saliva with
all three proteins, as well as the influence of the heat-treatment of these proteins. For
this part, human saliva is collected from participants and is mixed with each of the
protein solutions (5.0 wt% WPI or 2.0 wt% -lg/lactoferrin) in a ratio 1:1 (w/w). Saliva
Chapter 1: Introduction
7
will have a diluting effect on the mixtures. Therefore, it is expected that the mixtures
will contain approximately 2.5% WPI/1% -lg/lactoferrin. It will be analysed in which
way the pH is affecting the protein-saliva mixture. Therefore, interaction
measurements are also carried out at readjusted pH-levels.
The second part of the project will show the interaction of heat-treated WPI with
saliva in the mouth, where the ratio of the two proteins is unknown. Furthermore, it
will be determined whether whey proteins remain on the tongue, after rinsing the
mouth with water.
Measurements of particle size, charge and turbidity will give a better understanding
of the saliva-whey protein interactions. Electrophoresis (SDS-PAGE) will be
performed to identify which whey proteins and which salivary proteins are involved in
the protein-saliva interaction. Therefore, the analysis of the sediment of each mixture
will be performed.
This project has been reviewed and approved by the Massey University Human
Ethics Committee: Southern A, Application 09/16.

8
Chapter 2: Literature review
9
Chapter 2: Literature review
2.1 Whey proteins
Whey is the liquid part of milk that remains after coagulation of casein when
manufacturing cheese. There are two major types of whey, the acid and the sweet
whey. Acid whey is produced from mineral or lactic-coagulated casein and has a pH
of <5.1, whereas sweet whey is produced from rennet-coagulated cheese
manufactured with a pH >5.6 (Anonymous, 2009a). During the production of 1 kg
cheese, approx. 9 litres of whey are produced (Durham and Hourigan, 2007). Whey
was traditionally treated as a waste product and therefore disposed of as effluent or
used as animal feed. However, there was a growing concern about polluting the
environment, which resulted in developing new methods to use the whey.
Whey protein is concentrated by several filtration steps, which allows producing a
range of whey proteins at different concentrations, from 30% up to 89% protein
concentration (Whey Protein Concentrate - WPC). Higher protein contents are
obtained by removing non-protein constituents to achieve at least a 90% protein
concentration (Whey Protein Isolate - WPI). WPC is produced by ultrafiltration, to
concentrate the protein. The whey is then spray dried to a powder. The higher the
protein content, the more filtration steps are included in the process. The filtration
steps wash out the lactose and minerals. There are two ways of processing WPI -
through microfiltration or ion exchange. In both processes the first step is to
pasteurise the whey proteins and then to ultrafiltrate them. In the microfiltration
process water is added to the whey proteins, followed by microfiltration, which
washes out the residual lipids. Then a diafiltration removes the permeate so that WPI
remains. WPI is then concentrated and spray dried into powder. In the ion exchange,
the pH of the whey proteins is lowered below pH 4.5 so the proteins carry a positive
charge. To desorb the proteins, they will be attached to the resin beads. During
ultrafiltration the other components, such as fat, lactose and minerals, will flow
through. After that the whey protein is detached from resin beads by raising the pH
to 8.0. The proteins are then utrafiltrated and finally spray dried into powder (Dairy
Chapter 2: Literature review
10
Export Council, 2004, Durham and Hourigan, 2007). The major component of whey
- -lactalbumin, immunoglobin and bovine serum
albumin (BSA). Lactoferrin is also a component of whey but comprises a very small
amount.
Whey proteins are highly soluble in their native form due to a large proportion of
surface hydrophilic residues. The solubility of whey proteins is an important aspect of
the functionality in beverages and is strongly affected by the pH. Whey proteins are
the most soluble at low and high pH-values, since the electrostatic forces of the
molecules are strong which contributes to a high solubility (Pelegrine and
Gasparetto, 2005). The proteins display the least solubility at the isoelectric point
(pI), as the electrostatic forces of the molecules are very low and less water interacts
with the protein molecules. Under these conditions, it is likely that the protein
molecules aggregate or even precipitate.
Heat-treatment at high acidic or basic pH-values may cause the protein to unfold the
secondary and tertiary protein structure, enabling the hydrophobic groups (sulfhydryl
groups) to interact so that the water binding is reduced (Pelegrine and Gasparetto,
2005). The immunoglobin fraction of the whey protein is denatured, first followed by
serum alb - -Lactalbumin is the most
resistant protein of the whey protein fraction. Hydrophobic interactions lead to
aggregation, followed by coagulation and precipitation.
- -lg)
-Lg is the major protein in whey and comprises about 58% (Kilara and Vaghela,
2004). It has a molecular weight of ~18 kDa. Bovine milk contains six genetic
- -Lg contains
two disulphide bridges and one free sulphydryl group. Below pH 3.0 and above
pH 8.0 -lg exists as a monomer (Hill, 1988). In the pH range of 3.0 to 5.0 -lg
-lg is predominantly
present as a dimer (Verheul et al., 1998). Under heat- -lg undergoes

Chapter 2: Literature review
11
intra- and intermolecular changes. It changes its structure from monomer-dimer
equilibrium towards monomers due to electrostatic repulsion (Verheul et al., 1998).
Above 60 -lg undergoes partially unfolding, exposing thiol groups (Lametti et al.,
1996). This is equal to a denaturation. The denaturation can be followed by
irreversible aggregation.
- -lg is
-lg shows high solubility over a wide pH
range, similarly to whey proteins. It is acid stable (except between pH 5.1 – 4.0) and
also stable during UHT treatment (Smithers et al., 1996). The pI -lg is around
-lg solutions with a pH close to the pI will be cloudy and will increase
in clarity by lowering the pH. However, although the functionality of whey proteins
-lg, the overall functionality is dependent on the
combined properties of all whey protein components.
-lactalbumin
-Lactalbumin is the second most prevalent protein in whey. It constitutes 13% of the
total whey protein (Kilara and Vaghela, 2004). The molecule has a molecular weight
of ~14 kDa. It contains four disulphide linkages but no phosphate group. It is the only
whey protein capable to bind calcium. This is very important, as dairy foods are an
essential source of bioavailable calcium for this reason. Furthermore,
-lactalbumin has excellent amino acid and structure homology compared to human
milk proteins. It is therefore widely used in infant formula.

Chapter 2: Literature review
12
2.1.3 Bovine Serum Albumin (BSA)
BSA represents about 1.5% of total milk proteins and is the smallest protein
compound in whey. It comprises about 8.0% of total whey protein (Farrell et al.,
2004). It has a molecular weight of ~69 kDa and consists of 17 disulphide and one
free sulfhydryl group but no phosphorus (Kilara and Vaghela, 2004). In blood, the
molecule binds the free fatty acids and has specific binding sites for hydrophobic
-lactalbumin are sensitive to acidic environment, regardless of
the heat treatment.
2.1.4 Lactoferrin
The glycoprotein lactoferrin constitutes only a small part of whey. Lactoferrin occurs
as a single-chain polypeptide, varying with glycosylation. It consists of 17 disulphide
bonds and its molecular weight is about 76 kDa. The molecular weight varies
depending on the level of glycosylation (Farrell et al., 2004). It has an isoelectric
point of 9.0 and is positively charged, which differentiates it from the other whey
proteins. Lactoferrin can be commercially extracted applying the cat ion-exchange
method (Tomita M et al., 1994). It is only partly saturated with iron (15 - 20%)
(Steijns and van Hooijdonk, 2000). Lactoferrin has a salmon colour in its native form.
The intensity in colour is dependent on the degree of iron saturation. The protein is
-helix peptide. The two
lobes can reversibly bind a ferrin ion, which generates the salmon colour. Lactoferrin
shows bacteriostatic as well as bacteriocidal properties towards a wide variety of
microorganisms including those responsible for gastrointestinal infections, food
poisoning and listeriosis (Smithers et al., 1996).

Chapter 2: Literature review
13
2.2 Human Saliva
Human saliva has several functions, such as lubrication and protection in the mouth,
moistening and taste, digestion of food and maintaining oral health (Humphrey and
Williams, 2001). Saliva is a clear secretion, and has a pH between 6.2 and 7.0
(Schipper et al., 2007). It is produced by three pairs of major glands (parotid,
submandibular and sublingual) as well as several minor salivary glands, which are
located in the mucosa of the tongue (von Ebner’s cells) (Dodds et al., 2005, Schipper
et al., 2007). The isoelectric point of the salivary proteins may be found between
pH 2.9 - 3.1. Hydrodynamic diameter measurements showed particle sizes between
100 - 500 nm at physiological pH (Rykke et al., 1996). The parotid glands are
positioned at the opposite of the maxillary firstmolars, while the
submandibular/subsingual glands are found on the floor of the mouth. The minor
glands are located in the lower lip, tongue, cheek and pharynx (Humphrey and
Williams, 2001).
2.2.1 Composition of human saliva
Saliva is mainly composed of water (99.5%), proteins (0.3%) and inorganic as well
as trace substances (0.2%) (Schipper et al., 2007). The proteins of the saliva are
synthesized in the acinar cells of the major salivary glands.
The major proteins in saliva are proline-rich proteins (PRP), which constitute about
70% of the human parotid saliva (Bacon and Rhodes, 2000, Dodds et al., 2005).
These proteins contain about 35 - 40% proline (Dodds et al., 2005). The remaining
-amylase and in much lower concentration antibacterial
proteins, such as lysozyme, lactoferrin and immunoglobulins (mainly sIgA) as well as
histatin (Dodds et al., 2005).
P -amylase and histatin-like components but no mucin.
In addition, submandibular and sublingual saliva contain high levels of mucin as well
as lysozyme (Beeley, 1993). Mucin is a large glycoprotein and consists of two major

Chapter 2: Literature review
14
groups, MG1 (103 kDa) and MG2 (200-250 kDa) (Beeley, 1993, Dodds et al., 2005).
Mucins are responsible for the viscoelastic properties and cleanse saliva by
attaching/aggregating oral microorganism. MG1 provides better lubrication than
MG2.
There are three types of PRP, the acidic, basic and glycosydated PRP (GPRP),
which constitute 30%, 23% and 17% of the total salivary proteins, respectively
(Kauffman and Keller, 1979, Minaguchi and Bennick, 1989). PRPs have a flat, open
structure, which allows the PRP to bond hydrogen and to interact hydrophobically
with other open structures, such as tannic acid (Guinard et al., 1998, Lawless et al.,
1996).
Acidic PRPs are the major proline proteins. They bind calcium and serve as a
reservoir of calcium to protect the teeth against demineralisation (Bennick, 1982).
There are four proteins reported (A, B, C and D). Protein A and C are known to be
the two major acidic proteins taking 28% of the parotid PRP in account
(Clifford, 1997). Acid PRPs can be detected at a molecular weight of 25 and 50 - 60
kDa (Bacon and Rhodes, 2000).
Basic PRP are produced by submandibular glands. They have a molar mass in the
range of 6 - 12 kDa (Beeley, 1993). The only known function of the basic PRP is to
bind to polyphenols (Clifford, 1997, Hagerman and Butler, 1981, Lu and Bennick,
1998).
Proline-rich glycoproteins (GPRP) have a molecular weight of about 40 - 60 kDa
(Bacon and Rhodes, 2000) or even higher of about 78 kDa (Clifford, 1997). They
have lubricating properties and bind to some microorganism. By doing that, they may
modulate the microflora in the mouth. Several studies have shown that glycosylated
PRP are directly involved in the binding of polyphenol compounds (Bacon and
Rhodes, 2000, Dinnella et al., 2010, Gambuti et al., 2006, Sarni-Manchado et al.,
1999).

Chapter 2: Literature review
15
Furthermore, saliva contains antibacterial proteins, such as lysozyme (~15 kDa),
lactoferrin (~80 kDa) and immunoglobulins (mainly sIgA) (~400 kDa) and in a much
lower concentration histatin (4 - 7 kDa) (Beeley, 1993, Dodds et al., 2005). Salivary
amylase is a glycoprotein with a molecular weight of 55 - 70 kDa (Bacon and
Rhodes, 2000).
2.2.2 Properties and functions of human saliva
The average flow rate of saliva ranges between 1 - 1.5 L per day (Humphrey and
Williams, 2001). Factors influencing the salivary flow rate are of mechanical,
gustatory and psychic origin. These factors have varying effects on individuals.
Therefore, it is difficult to make comparisons between individual salivas. The main
function of saliva is to maintain oral health by lubrication, clearance, antimicrobial
activity and tasting as well as beginning to digest food.
The most important function of saliva is lubrication. Lubrication is the ability of a
substance to reduce the friction between moving surfaces. Reduced lubrication may
result in a complex formation with salivary proteins, especially PRP and histatin
(Schipper et al., 2007). Precipitation of salivary proteins results in a decreased
viscosity and increases friction of particles including the precipitates.
2.2.3 Handling of human saliva
Besides proteins, human saliva contains enzymes and mineral buffer ions. The
buffer activity may remain up to 48 hours after collection (Schipper et al., 2007). To
keep the saliva stable and fresh after collection, it is recommended to store it at
-80 °C up to 6 months (Schipper et al., 2007). However, little precipitation of
-amylase can occur after thawing (Francis et al., 2000).
It is recommended to centrifuge the saliva prior to usage for further experiments in
order to remove cellular debris bacteria, high molecular weight mucins and

Chapter 2: Literature review
16
glycoproteins that are bound to cells or bacteria (Schipper et al., 2007). Furthermore,
centrifugation leads to a reduction of salivary lysozyme due to the removal of the
lysozyme-mucin complex (Virella and Goudswaard, 1978).
2.3 Astringency – definition and perception
2.3.1 Definition of astringency
Astringency is derived from the Latin word ad stringere, which means ‘to bind’. That
relates to the ability of astringent materials (astringents) to bind and precipitate
proteins. Astringency occurs in several foods and beverages, such as tea (especially
black tea), wine, grapes and unripe fruits, coffee, cacao, berries, nuts, soymilk, and
whey proteins (Bajec and Pickering, 2008, Bate-Smith, 1954, Lee and Lawless,
1991, Peleg and Noble, 1999, Sano et al., 2005). Compounds such as acids,
polysaccharides, tannins/polyphenols and whey proteins in interaction with saliva
show astringent behaviour (Bennick, 1982, Lawless et al., 1996, Prinz and Lucas,
2000, Rodriguez et al., 2003, Sano et al., 2005).
2.3.2 Astringency: tactile versus gustatory sensation
Bate-Smith (1954) was one of the first researchers who worked on astringency. He
described the astringent feeling as a resistance to movement in the form of a
roughness and dryness, which covers the surface tissue of the tongue, palate and
lips (Bate-Smith, 1954). Furthermore, he claims that astringency is not a taste,
but a feeling. Schiffman et al. (1992) suggested that astringency is a gustatory rather
than a tactile sensation, because astringency compounds stimulate the chorda
tympani nerve, but not the lingual (trigeminal) nerve (Schiffman et al., 1992). Several
researchers have a contrary opinion to astringency and the gustatory sensation.
They suggest that astringency is a tactile sensation where the normal lubrication of
oral surfaces is impaired, which is caused by precipitated salivary proteins
(Green, 1993, Lawless et al., 1996, Siebert and Chassy, 2003). Breslin et al. (1993)

Chapter 2: Literature review
17
shares a similar opinion, stating that astringency is caused primarily by increased
friction between oral membranes. The sensation is also applied to the area between
gum and upper lip, where no taste receptors exist (Lim and Lawless, 2005). Breslin
et al. (1993) gives two reasons for this opinion. First, there is no causal relationship
between protein precipitation and astringency. The second reason is that taste
sensations are mostly accompanied by sensations of astringency. Furthermore, it is
stated that astringency is a tactile sensation because it results from the stimulation of
mechanoreceptors during movements of the oral mucosa. Moreover, astringent
compounds are not excluded from interacting with the taste pathway. The sensation
of astringency does not require activation of these pathways in humans, nor is
activation of these gustatory pathways sufficient to allow differentiation of levels of
astringency (Breslin et al., 1993).
Another argument why astringency is rather a tactile than a gustatory sensation is
based on the fact that astringency does not show adaptation. Perceived astringency
stimuli will increase with repeated ingestion, which will result in a significant increase
in mouth dryness (Lymann and Green, 1990). Therefore, astringency cannot be
rated a gustatory sensation (Green, 1993). However, Lawless and Heymann (1998)
add to this statement that astringency is clearly a critical element of overall flavour
(Lawless and Heymann, 1998).
2.3.3 Perception of astringency
Astringency is not limited to a particular region of the mouth or tongue. The intensity
of astringency increases up to 15 seconds after ingestion, regardless of the
concentration of the astringent compound. It is known as the delayed effect as it is
often the last sensation detected (Bajec and Pickering, 2008, Haslam, 1988, Limieux
and Simard, 1994) and the intensity may persist up to one minute (Guinard et al.,
1986). In addition, many astringent materials also have a sour side taste associated
with them (Bate-Smith, 1954, Lee and Lawless, 1991). Beecher et al. (2008) could
not detect sourness in beverages at neutral pH, which displayed only low
Chapter 2: Literature review
18
astringency. However, the sourness increased significantly in the pH range of
3.4 - 2.6, while astringency decreased (Beecher et al., 2008).
Lea & Arnold (1978) term mouth drying and bitterness as a ‘twin-sensation’ because
they mostly occur at the same time (Lea and Arnold, 1978). This fact makes it
difficult for untrained panellists to distinguish between astringency and bitterness.
However, Green (1993) implies that pucker, sourness and bitterness are not
essential to the sensation of astringency (Green, 1993).
Guinard et al. (1986) discovered that the total perceived astringency increased
significantly as ingestions repeated, i.e. red wine sips were taken at 20 sec intervals
(Guinard et al., 1986). In soymilk, a carry-over effect was discovered, when several
astringent solutions were consumed (Corregelongue et al., 1999). To decrease the
carry-over effect when tasting samples, a pectin - mouth rinse as well as
carboxymethylcellulose is recommended (Collonna et al., 2004, Smithers et al.,
1996).
2.3.4 Factors influencing the astringent sensation
2.3.4.1 Salivary flow
It is generally accepted that astringency causes the loss of lubrication due the
development of a protein-astringent complex (Kallithraka et al., 2001). Astringency is
clearly linked to the interaction between astringent materials (such as polyphenols)
and saliva, basic PRP in particular (Jöbstl et al., 2004, Kallithraka and Bakker, 1998).
A lot of research has already been done on the polyphenol-saliva interactions. PRP
bind strongly to tannin, which is thereby removed from the ingested food. It is
suggested that, during this mechanism, tannin is prevented from binding to nutrients
and blocking their absorption (Bennick, 2002, Haslam, 1988).

Chapter 2: Literature review
19
2.3.4.2 Salivary proteins
Charlton et al. (2002) describes the mechanism, which is probably responsible for
astringency, in three steps. First, the polyphenols bind the peptide. Several
polyphenols can bind the same PRP. This continues until enough polyphenol is
bound to the PRP and the polyphenol acts as a linkage between two PRP
molecules. Second, the PRP form a polyphenol-coated dimer, which start to
precipitate. Third, when precipitation occurs, more molecules are added so that the
complex aggregates into large particles (Charlton et al., 2002).
PRP have a high affinity to bind astringent compounds, such as tannins. Although
with lowe - -amylase-
-amylase’s activity (Bajec and
Pickering, 2008). However, the composition of salivary proteins varies greatly
between individuals, the most obvious individual difference being the salivary flow.
Individuals who have higher levels of salivary protein might be expected to show
lower levels of astringent responses (Lee and Lawless, 1991).
2.3.4.3 pH change
The pH of human saliva is influenced by the bicarbonate content, while bicarbonate
secretion is dependent on stimulation by food. Acids increase the bicarbonate
secretion. The ingestion of the acid in the mouth decreases the pH-value in the
mouth. A change in the PRP net charge affects their configuration and possibly
influences the viscosity of saliva or enhancing precipitation of PRP (Clifford, 1997,
Kallithraka et al., 1997, Sowalsky and Noble, 1998). However, Guinard et.al. (1998)
and Kallithraka et.al. (1997) could not find any correlation between precipitation of
astringency and salivary protein composition.
Proteins are expected to have the lowest solubility at their isoelectric point (pI). At
this pI, the least net charge of the protein is expected, resulting in minimum repulsion
between protein molecules. Maximum protein-polyphenol interaction has been
reported to occur close to the pI of a protein (Siebert and Chassy, 2003).

Chapter 2: Literature review
20
2.3.4.4. Sweeteners
The astringent sensation may be altered by the presence of some other compounds.
Sweeteners, in particular, reduce the astringent sensation (Green, 1993, Lymann
and Green, 1990). They increase the salivary volume and therefore reduce the
dryness and bitterness. Astringency was decreased in the presence of sucrose or
even unaffected by that. It probably interferes in the binding of tannins and salivary
proteins (Green, 1993, Lymann and Green, 1990). However, astringency does not
affect the sweetness of sucrose (Brannan et al., 2001).
2.4 Interactions between proteins and human saliva
2.4.1 Chitosan-saliva interactions
The polysaccharide chitosan in interaction with saliva displays astringent sensations
in the same way as polyphenol solutions do. When chitosan is dissolved in an acidic
medium and when it is positively charged due to protonated amine groups, it shows
astringency (Rodriguez et al., 2003). Astringency happens to be higher at pH 3.9
than at 6.7 (Rodriguez et al., 2003). In the protein-chitosan interactions, hydrophobic
as well as electrostatic interactions and/or hydrogen bonding may be involved,
similarly to protein-tannin interactions. This indicates that molecular interactions
between the positively charged chitosan and salivary proteins are involved in
astringency (Rodriguez et al., 2003).

Chapter 2: Literature review
21
2.4.2 Whey protein-saliva interactions
Acidic WPI-solutions induce astringency in a similar way to the complex precipitation
formed by salivary proteins and polyphenolic compounds (Sano et al., 2005). When
a WPI-solution at pH 3.5 is placed in the oral cavity, the acid solution is mixed with
human saliva (neutral pH), causing the pH of the WPI solution to increase and reach
a pH of about 5.0. At this pH, whey proteins would aggregate and precipitate in the
mouth. According to Sano et al. (2005), the aggregation may be explained by two
possible mechanisms. First, mixing WPI at acidic pH with neutral saliva might result
in a solution mixture at a pH close to the pI of whey proteins, where aggregation is
observed. In this case, the whey protein aggregates are the cause of astringency.
The second possible mechanism is that aggregation might be a result of interactions
between positively charged whey proteins (pH < pI) and negatively charged saliva
proteins. Beecher (2006) also considers the second possible mechanism because
polyphenol compounds show astringency when interacting with PRP. If salivary
proteins have their pI below the pI of whey proteins, there will be a pH range that
results in a net electrostatic attraction causing aggregation (Beecher, 2006).
2.5 Approach to determine protein-saliva interactions
A change in particle size and turbidity may be related to particle aggregation, as well
as a change in the net charge of the protein, and that may be related to astringency.
Therefore, the interactions between the whey proteins and saliva may be determined
by applying several methods to discern the particle size (hydrodynamic diameter),
the charge of a protein solution and the turbidity of the solution. SDS-PAGE may be
used to separate the proteins in the solution. A background of these four methods
will be given in this subchapter.

Chapter 2: Literature review
22
2.5.1 Hydrodynamic diameter
The Nano Zetasizer performs size measurements using Dynamic Light Scattering
(DLS). The particles are constantly moving, because they are in Brownian motion.
Brownian motion is the movement of particles, which is created by random collision
with the molecules of the liquids that surrounds the particle. These movements are
measured by DLS. Small particles move faster than larger ones. The particles are
illuminated by a light source, like a laser, where the particles will scatter the light.
The scattered light will cause dark and bright areas, where their intensities fluctuate.
Small particles will fluctuate quicker than large particles. The Zetasizer Nano system
measures these fluctuating intensities and uses these measurements to calculate
the size of the particles. As the laser passes through the cell with the sample, the
particles will scatter in all directions, whereas the detector will be at an angle of 173°.
That is known as backscatter detection. Therefore, the beam does not need to go
through the entire sample and the effect of multiscattering is reduced, as well as the
effect of contaminants. As the light passes through a shorter path length of the
sample, it is possible to measure higher concentrated samples (Malvern, 2003).
-Potential
-potential is the electrical potential which exists on the hydrodynamic plane of
shear. Each particle is counterbalanced by charges of the opposite sign in the
surrounding solution. The particle net charge attracts ions of the opposite charge,
which is the first layer called stern layer. Further away from the stern layer, ions
diffuse more freely. Between diffuse layer and stern layer is the hydrodynamic plane
of shear (or also called slipping lane). Ions which are in the area between slipping
lane and diffuse layer will not move with the particle to a single entity. The
electrostatic potenti -potential. At this point, the mobility is
assessed, by measuring the velocity of the particles in an electric field (Anonymous,
1999). Ions between the stern layer and the slipping plane will move with the particle
to a single entity (Malvern, 2003).

Chapter 2: Literature review
23
When the field is applied to the suspended particles, they will migrate towards the
electrode of opposite charge with a velocity proportional to the magnitude of the
-potential. The used technique to measure the velocity is the Laser Doppler
Velocimetry. An incident laser beam is sent through the sample and the light is
scattered at an angle of 17°. This causes a fluctuating intensity signal, where the rate
of fluctuation is proportional to the speed of the particles.
-potential of either ± 30 or more will have a higher stability. The
particles tend to repel each other, so there is no tendency to aggregate. When the
-potentials (closer to zero), the force between the particles is low.
The particles will move closer and it is likely that they will aggregate. The point,
where the forces between the particles are very low, is called isoelectric point (pI).
-potential may be affected by ionic strength and change in pH-levels. When the
pH of solutions is lowered from neutral pH towards the pI, the repulsive forces are
reduced, which may expose the hydrophobic groups of the protein. That may result
in protein-protein interactions and finally in aggregation (Ju and Kilara, 1998). At
pH-values above or below the pI, where the protein charge is either negative or
positive, electrostatic forces are strong, repelling the molecules from each other.
Therefore, the protein is likely to stay in solution.
2.5.3 Turbidity
Turbidity may be measured in turbidity meters or spectrophotometers. For the
turbidity measurements in this project, the spectrophotometer was used. The use is
non-destructive, rapid as well as inexpensive and requires only small sample
amounts. The spectrophotometer consists of two parts, the spectrometer and the
photometer. The spectrometer emits the light from a tungsten light as white light. The
emitted light is then separated into individual wavelengths by a prism. A specific
wavelength may then be selected for the turbidity measurements. The range of
wavelengths measured by the machine varies between 400 - 700 nm. For protein
samples, 400 nm is usually used. In the second part, the photometer, the intensity of

Chapter 2: Literature review
24
the light is measured. The cuvette, containing the liquid sample, is placed between
the spectrometer beam and the photometer. The light enters the cuvette and is
scattered to multiple directions and absorbed. The light is then detected by a
photocell, which displays the absorbance values at the specific wavelength
(Anonymous, 2009b).
Turbidity presents indirectly the function of the size, shape, and concentration of
particles, as it shows high values when particle aggregation occurs. A variation in
each of the aspects causes a change in turbidity.
2.5.4 Electrophoresis (SDS-PAGE)
Electrophoresis is a method where protein molecules are separated when an electric
field is applied. The proteins migrate through a gel, which is connected to an
electrical field. Prior to separation, the structure of the protein needs to be destroyed,
thus the protein is unravelled by heat treatment (90 - 100
containing Tris, SDS, mercaptoethanol and glycerol, is added to the protein. The
addition of mercaptoethanol breaks the disulphide bonds, while SDS binds to the
polypeptide chain. It coats the primary structure with hydrophobic dodecyl residues,
each of them carrying a negative charge (Walker, 2002). Glycerol makes the sample
denser, so that the sample will settle easily through the electrophoresis buffer to the
bottom of the well rather than float.
The electrophoretic separation of proteins is mostly performed in polyacrylamide
gels. When polyacrylamide is in form of a gel, and a current is applied, it will pull the
proteins through the gels. Therefore the process is called polyacrylamide gel
electrophoresis (PAGE). SDS-PAGE is a discontinuous gel, which consists of two
gels, the resolving gel and the stacking gel.
Polyacrylamide gels are prepared by cross-linking acrylamide with bis-acrylamide.
Polyacrylamide polymerizes when APS is added and uses TEMED as a catalysator
to speed up the polymerization.

Chapter 2: Literature review
25
The gels are made from different buffers, containing different concentrations of Tris.
Before APS and TEMED are added, both gel buffers need to be degassed to remove
the oxygen from the solution because acrylamide only polymerizes in the absence of
oxygen. The resolving gel solution is then poured between to glass plates.
Immediately after pouring the resolving gel solution in, the gel is overlaid with water
to produce a smooth surface. The difference in density of water and the gel solution
prevents the gels solution from mixing with water. On top of the resolving gel, the
stacking gel is added (after removing the water from the surface). A comb is placed
into the stacking gel, with which the sample will be loaded later on.
Once the samples are loaded (5.0 -
gel. Usually, 200 V are applied, which will take the sample 45 - 60 minutes to pass
through the gel. The sample passes the stacking gel fast, as it contains larger pores.
The low ionic strength in the stacking gel results in a higher electric field. When the
samples enter the resolving gel, the protein-SDS complex will move slower through
the gel, because the pores are much smaller than in the stacking gel. As the sample
is coated with negative charges, it will move towards the positive electrode when a
current is applied. This results in a separation of the protein bands in the sample.
The protein bands are separated according to their size. Small proteins may pass
easily through the pores of the gel compared to large proteins, which have to
overcome the frictional resistance of the smaller pores. When the dye reaches the
bottom of the gel, the current needs to be turned off, otherwise some proteins just
pass out the gel. The gel is then removed from the glass plates and stained and
afterwards destained. The gel may be stored in milli-Q water until further usage.

26

Chapter 3: Materials and methods
27
Chapter 3: Materials and methods
3.1 Materials
Whey Protein Isolate (WPI 8855) was kindly provided by Fonterra, Palmerston North
(New Zealand) and it contained at least 90% p -lg (Sigma Chemical
Co., St. Louis, Mo, USA -lg. Lactoferrin (Tatua,
Morrinsville, New Zealand) contained at least 90% of lactoferrin. Milli-Q water (water
purified by treatment with a Milli-Q apparatus, Millipore Corp., redford, MA, USA)
was used for the preparation of all solutions. All other chemicals were purchased
from Sigma (Sigma Chemical Co., St. Louis, Mo, USA) unless otherwise specified.
3.2 Protein solution preparation
WPI (5.0 wt%) -lg (2.0 wt%) and lactoferrin (2.0 wt%) were dissolved in deionised
water. The solutions were hydrated overnight at room temperature under stirring
conditions until fully dissolved. All solutions were adjusted to pH 6.8, 3.6, 3.4, 3.0,
2.5 and 2.0, using 0.1 M and 1 M of NaOH/H3PO4. The solutions were divided into
two parts. One part was heat-treated in a shaking water bath at 90 utes.
The solutions were then cooled to room temperature and stored at -80
further usage.
A 5.0 wt% WPI solution was hydrated overnight in deionised water under stirring
conditions until fully dissolved. Sucrose (7.0 wt%) was added. The solutions were
adjusted to pH 6.8, 3.6, 3.4, 3.0, 2.5 and 2.0, using 0.1 M and 1 M of NaOH/H3PO4.
The solutions were heat-treated in a shaking water bath at 90 utes and
then cooled to room temperature and stored at -20

Chapter 3: Materials and methods
28
3.3 Human saliva collection
Saliva was collected from 5 participants per session for several weeks. Before
attending the study, all participants were asked to fill out a health check
questionnaire. Only participants who passed this test were allowed for the collection.
The participants were asked not to eat or drink (except for water) two hours prior the
saliva collection. At the time of collection the participants chewed a sugar and flavour
free chewing gum (Wrigley’s Extra®) for three minutes to stimulate the saliva
production by mastication. The aim was to receive clean saliva. The chewing gum
was chewed again with 10 mL of water for 30 seconds, twice. The water was
discarded, while the chewing gum remained in the mouth. The last step before the
saliva collection was to chew the chewing gum for 30 seconds to stimulate saliva
production. The stimulated saliva was then discarded. The collection time was about
15 minutes and it was expected that each participant would give about 10 mL of
saliva per session. The collected samples were stored on chilled ice during the
collection time. The saliva samples were then centrifuged (Sorvall® Evolution™ RC
superspeed centrifuge, Thermo Scientific, Ashville, North Caroline, U.S.A.) at 4
10,000g for 30 minutes. All saliva samples were then pooled and stored in a -80
freezer (Forma 900 series, Thermo Scientific, Marietta, Ohio, USA) until usage.
3.4 Preparation of protein-saliva mixtures
Saliva and the protein solutions (5.0 wt% WPI, 2.0 wt% -lg/lactoferrin) were thawed
at 4 to room temperature. Saliva and each of the protein
solutions were mixed in the same ratio (w/w), vortexed and then stored at 4
24 hours before the measurements. It is expected that the mixtures of WPI and
saliva have a final concentration of ~2.5% protein content and the mixtures of
-lg/lactoferrin will have an estimated protein content of 1%, because saliva has a
diluting effect. Before any measurements, the samples were divided into two parts.
One part was used to readjust the pH of the sample-mixtures back to 6.8, 3.6, 3.4,
3.0, 2.5 and 2.0, which had shifted when saliva was added.
Chapter 3: Materials and methods
29
The 5.0 wt% WPI-solutions, which contained sucrose, were thawed at 4
warmed to room temperature prior consumption. 40 mL of each solution was
provided in a sample cup for the consumption.
3.5 Mixtures of WPI and saliva collected from the mouth
Participants (not necessarily the same who provided saliva) were asked to fill out a
health check questionnaire. Furthermore, they needed to attend a session where the
feeling of astringency was explained as well as the understanding of astringency and
the procedure of the experiment. Three heat-treated WPI-solutions at pH 6.8, 3.6
and 2.0 needed to be consumed. The participants were asked to rank the perceived
astringency, where 0 = absent, 1 = threshold, 2 = slight, 3 = slight – moderate,
4 = moderate, 5 = intense, 6 = very intense were the given attributes. According to
the ranking and the answers from the heath check questionnaire, 5 participants
remained.
The participants were not allowed to eat or drink (except for water) two hours prior to
the experiment. All WPI-samples were heat-treated but were consumed at room
temperature. Before the experiment, the participants rinsed their mouth with water
water), returning the swab (Johnson-Johnson Pacific®) into 2.0 ml Eppendorf tubes
(Eppendorf AG, Hamburg, Germany). This was labelled as the control. All
WPI-samples were provided with a three digit code and in a randomized order. All
sample cups were filled in the same amount (40 mL). The participants consumed the
whole sample and kept it in the mouth for at least 10 seconds. Then, they discarded
the solution in a provided container and ranked the intensity of the astringent
sensation in the mouth. The mouth was rinsed twice with 20 mL deonized water. A
swab of the tongue with a pre-moistened cotton swab was taken. To avoid a
cross-over effect between the samples, the participants rinsed their mouth with water
until the astringent sensation disappeared.

Chapter 3: Materials and methods
30
The pH of the mixtures was measured (CyperScan pH 510 Meter, eutech
Instruments). The protein-saliva mixtures were extracted from the cotton swabs by
centrifugation (Microcentrifuge Robo-Spin DAIHAN Precesion Co.,Ldt., Korea) at
6600 rpm for 10 minutes. The pH was measured (Mini Lab, IQ120, IQ Scientific
Instruments, Carlsbad, USA) and all samples were stored at -80
usage.
3.6 Measurement of the hydrodynamic diameter
The mean hydrodynamic diameters of all samples were measured by a dynamic light
scattering technique. The Zetasizer Nano ZS (Malvern Instruments Ldt., Malvern,
Worcestershire, UK) uses a 4 mW helium/neon laser at a wavelength output of
633 nm. The Zetasizer Nano ZS is able to measure the hydrodynamic diameter
within a range of 0.6 nm – 6.0 t 25
in a particle-sizing cell using backscattering technology at a detection angle of 173
The intensity of light scattered from the particles was used to calculate the
measurement for each sample was repeated four times.
3.7 -Potential measurement
Samples containing WPI were diluted 200 times with milli-Q water, whereas samples
containing -lg and lactoferrin were diluted with milli-Q water 100 times. Human
saliva has not been diluted for the measurements as saliva is already mainly
composed of water (Schipper et al., 2007). T -potentials of all samples at their
particular pH were measured by a Laser Doppler Velocimetry using the Malvern
Nano Zetasizer (Malvern Instruments Ldt., Malvern, Worcestershire, UK). 1.0 mL of
sample was put in the folded capillary cell and the measurements were performed at
25

Chapter 3: Materials and methods
31
3.8 Turbidity measurement
The turbidity measurements were carried out using a spectrophotometer
(Spectrophotometer™ Genesys 10 series, Thermo Scientific Electron Corporation,
Wisconsin, USA). The measurements were performed at a wavelength of 400 nm.
All measurements were repeated twice.
3.9 Electrophoresis (SDS-PAGE)
Electrophoresis was used to qualitatively determine the protein composition in the
sample-mixes. The technique was carried out by the sodium dodecylsulphate gel
electrophoresis (SDS-PAGE) technique. All sample-mixtures (unheated/heated)
were centrifuged in a Mini Spin plus Centrifuge (Eppendorf, Hamburg, Germany) at
11,500 rpm for 15 minutes. The supernatant and the sediment were collected. The
sediments were freeze dried. Freeze dried aliquots of all sample mixtures (containing
estimated 0.1% protein) were weight in for the analysis. Aliquots of estimated 0.1%
protein content of WPI (unheated/heat-treated), -lg (unheated/heat-treated) and
lactoferrin (unheated/heat-treated) were used as control. Furthermore, fresh saliva
was also used as control.
The sample buffer (0.5 M Tris-HCl pH 6.8, 2.0% SDS, 5.0 -mercaptoethanol, 10%
glycerol and 1.0% bromophenol blue) was mixed with the samples in a ratio of 1:10.
They were then heated at 95
down to room temperature. The sample buffer was stored at 4
-80 -gel was prepared in a Mini-PROTEAN II system
(Bio-RAD Laboratories, Richmond, CA, USA).
The resolving gel contained 16% acrylamide and 1.5 M Tris-HCl buffer pH 8.8, 10%
SDS and milli-Q water. The solution was then degassed for about 15 minutes. 10%
APS (Ammonium Persulfate) and TEMED (N, N, N’-Tetramethylethylene-diamine)
were immediately added to the solution and gently swirled. The content was poured
Chapter 3: Materials and methods
32
between two electrophoresis casting plates (0.075 mm gap) (Bio-RAD, Richmond,
CA, USA). On top of the solution, some water drops were added, forming an upper
layer and preventing the acrylamide solution to dry. The solution was allowed to
polymerize at room temperature for about 45 - 60 minutes. The water was removed
using filter paper before the stacking gel was poured on top.
The stacking gel contained 4% acrylamide, 0.5 M Tris-HCL buffer pH 6.8 and milli-Q
water. The solution was degassed for 15 minutes and 10% APS as well as TEMED
were immediately added. After a gentle swirl the solution was poured on top of the
resolving gel and a plastic comb (Bio-RAD, Richmond, CA, USA) was placed in the
liquid stacking gel solution between the two glass plates to provide slots for the
samples. The stacking gel was allowed to polymerize at room temperature for
45 - 60 minutes. The prepared gel was either used straightaway or stored at 4
a moistened airtight plastic bag for up to three weeks.
The prepared SDS-gel was assimilated to room temperature and meanwhile the
electrode buffer, containing Tris, SDS glycine and milli-Q water, was prepared, which
was five times concentrated, so that for each electrophoresis run the buffer was
four times diluted with milli-Q water. The concentrated electrode buffer was stored at
4
The sample aliquots in the sample buffer were thawed at room temperature. The gel
plates were placed in the electrode chamber and the electrode buffer was filled in the
marker (Precision Plus Protein Standard, Bio-RAD, Richmond, CA, USA), 10 of
saliva and the control samples (0.1% estimated protein content of WPI/
-lg/lactoferrin, as well as 10 of the saliva-protein mixtures were transferred in the
slots. The Mini-Protean II system was applied to the electric source via power pac
(PowerPac Basic™) (Bio-RAD, Richmond, CA, USA) at 200 V for approx. 60
minutes until the tracking dye moved out of the gel.
The gel was removed from the case as well as the plates and transferred into a
staining solution of (0.3% (w/v) Coomassie-Blue R0250, 10% (v/v) glacial acetic acid

Chapter 3: Materials and methods
33
and 20% (v/v) isopropanol) and was put on a shaker for 30 minutes for a uniform
staining of the gel. The gel was then transferred into a destaining solution (10% (v/v)
of isopropanol and 10% (v/v) glacial acetic acid) for 30 minutes. The destaining
solution was replaced again with a fresh one after 30 minutes and the gel was
destained over night. The gel was then stored in a milli-Q water solution until further
usage.
The gels were scanned in a (Molecular Imager®. Gel Doc™ XR, BIO-RAD) and the
protein bans were detected and analyzed using the software Quantity One®, version
4.6.3.
3.10 Statistical analysis
Analysis of means and standard deviations from 5 measurements (particle size and
-potential) and 2 measurements in turbidity were carried out on two freshly prepared
protein-saliva samples.

34

Chapter 4: Results
35
Chapter 4: Results
4.1 Behaviour of human saliva at different pH-levels
The aim of the experiment was to determine if saliva would precipitate under acidic
conditions. The measured pH of the collected saliva was between 7.0 and 7.2. Saliva
was centrifuged and adjusted to pH-levels 6.8, 3.6, 3.4, 3.0, 2.5 and 2.0. An average
particle size of ~100 nm was measured for human saliva at pH 6.8 (Fig. 1). An
increase in particle size to about 520 nm was measured between natural pH and
pH 4.6 (data not shown), while the size increased to almost 1500 nm when saliva
was adjusted to pH 3.6. Within the range between pH 3.6 and 2.5, the particle sizes
remained between 1000 and 1500 nm, even though a slight decrease to ~1000 nm
occurred at pH 2.0.
-potentials of saliva (adjusted to different pH-levels) showed negative values
between pH 6.8 and 3.0 (Fig. 2). The lowest -potential of -22 mV was measured at
neutral pH. The -potential increased to -6 mV at pH 3.6 and converged close to zero
as pH-levels decreased. Positive values between 0 and 2 mV were measured at
pH 2.5 and pH 2.0.
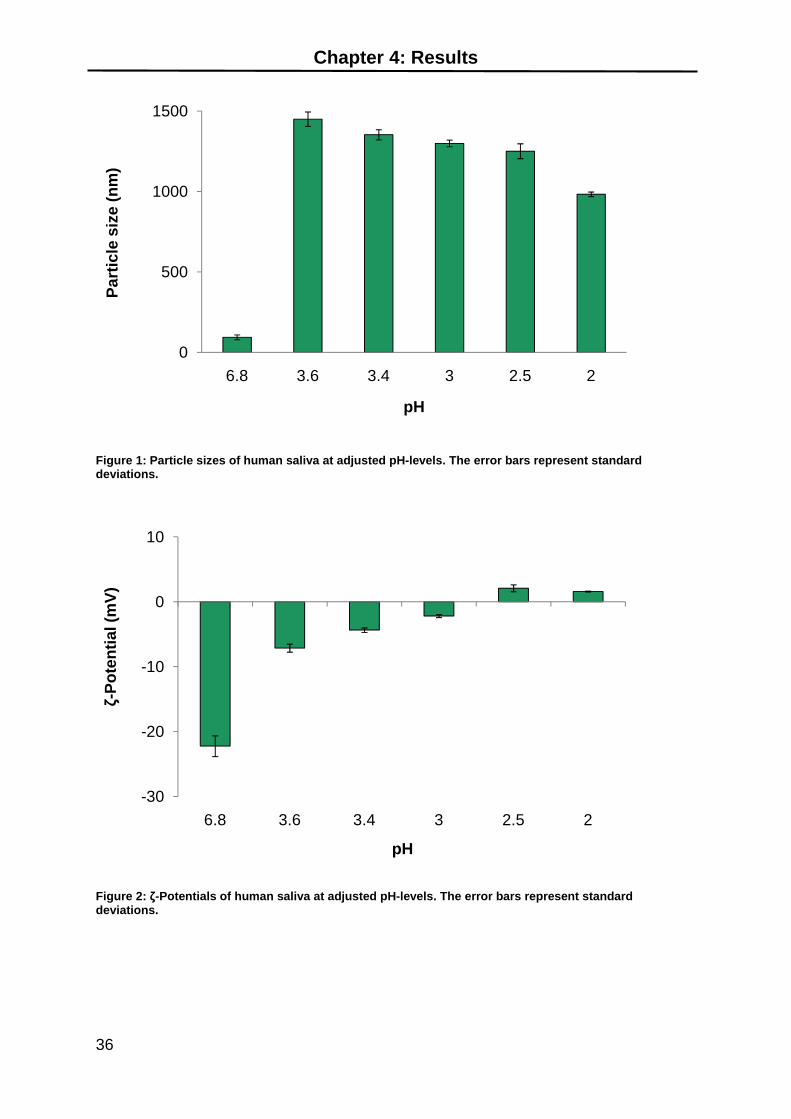
Chapter 4: Results
36
Figure 1: Particle sizes of human saliva at adjusted pH-levels. The error bars represent standard deviations.
Figure 2: -Potentials of human saliva at adjusted pH-levels. The error bars represent standard deviations.
0
500
1000
1500
6.8 3.6 3.4 3 2.5 2
Par
ticl
e si
ze (
nm
)
pH
-30
-20
-10
0
10
6.8 3.6 3.4 3 2.5 2
-Po
ten
tial
(m
V)
pH

Four salivary proteins (lane 2), i.e. glycosylated
-amylase and basic PRP, were
saliva, without pH adjustment (Fig. 3)
Figure 3: SDS
Mw
Chapter 4: Results
Four salivary proteins (lane 2), i.e. glycosylated PRP, secretory comp
amylase and basic PRP, were detected in the SDS-PAGE of centrifuged human
saliva, without pH adjustment (Fig. 3). Mucin or lysozyme was not detected
: SDS-PAGE of human saliva (lane 2). Lane 1 – marker.
basic PRP
-amylase
Secretory component
GPRP
(kDa)
75
50
25
15
37
, secretory component/GPRP,
PAGE of centrifuged human
detected.
marker.
basic PRP
amylase
Secretory component
GPRP

Chapter 4: Results
38
At neutral pH, particle sizes of almost 100 nm for human saliva were measured,
which is consistent with the results of Rykke et al. ( 1995), who reported particle
sizes between 100 and 350 nm at pH 7.0. Higher particle sizes of saliva below
pH 7.0 indicate that human saliva may aggregate/precipitate at pH-levels below
neutral pH (Fig. 1).
The identified -potential of human saliva of about -22 mV at neutral pH corresponds
with Rykke et al. (1995), who showed a -potential between -13 and -17 mV at the
same pH. Furthermore, -potentials between -4 and -2 mV have been reported
between pH 4.0 and 3.0 (Rykke et al., 1996), which were also obtained in this study
(Fig. 2). On these grounds, Rykke et al. (1996) determined the pI for human saliva
between pH 2.9 to 3.1. -Potential measurements of saliva at different pH-levels in
this study confirmed that the pI of saliva is around pH 3.0 (Fig. 2). Rykke et al. (1996)
also reported that human saliva may aggregate/precipitate around pH 3.0 due to low
repulsive forces. The study at hand pointed out that between pH 3.6 to 2.0,
increased particle sizes, -potentials converging to zero, occurred, and
indicating that aggregation may occur. However, Kelly (2009) showed that saliva did
not precipitate at pH 3.52. Moreover, Vardhanabhuti et al. (2010) stated that saliva
did not show any precipitation or change in turbidity when saliva was adjusted to
pH 7.0, 3.5 and 2.6. This study could not find visual changes in turbidity at any
observed pH (data not shown).
The SDS-PAGE of saliva presented salivary proteins of glycosylated PRP (GPRP),
secretory compone -amylase and basic PRP (Fig. 3). Several researchers also
detected the same salivary proteins (Bacon and Rhodes, 2000, Beeley, 1993,
Dinnella et al., 2010, Gambuti et al., 2006, Hong et al., 2009, Sarni-Manchado et al.,
1999). Mucin or lysozyme was not detected, as saliva was centrifuged before usage,
removing any mucin and/or lysozyme.
Bacon and Rhodes (2000) reported that basic and glycosylated PRPs have higher
contents of proline and are therefore presumed to be the major component in the
interaction between saliva and polyphenols. Furthermore, several researchers
(Dinnella et al., 2010, Gambuti et al., 2006, Sarni-Manchado et al., 1999) described

Chapter 4: Results
39
that glycosylated -amylase) are predominantly involved in
binding polyphenols (in interaction with polyphenols).

Chapter 4: Results
40
4.2 Interactions between lactoferrin and human saliva
4.2.1 Interactions between lactoferrin (unheated/heat-treated), which was adjusted to different pH-levels, and human saliva
Lactoferrin was adjusted to pH-levels 6.8, 3.6, 3.4, 3.0, 2.5 and 2.0. One part of the
samples was heat-treated at 90 °C for 15 minutes. After cooling down,
unheated/heated lactoferrin samples were mixed with human saliva according to the
ratio 1:1 (w/w). The pH shifting of the mixtures of unheated/heated lactoferrin and
saliva is shown in Table 1 below. The pH-level shifted towards neutral pH, so that
the mixtures of unheated as well as heated lactoferrin and saliva decreased in
acidity.
Table 1: pH change in lactoferrin (unheated/heated) solutions when mixed with human saliva in the ratio 1:1 (w/w).
pH of 2% Lactoferrin (not heated/heated) 6.8 3.6 3.4 3.0 2.5 2.0
pH shifting of 2% Lactoferrin (unheated) when mixed with human saliva 1:1 (w/w) 8.15 7.0 6.94 5.61 4.3 2.88
pH shifting of 2% Lactoferrin (heated) when mixed with human saliva 1:1 (w/w) 8.3 7.4 7.3 6.0 4.1 3.2
4.2.1.1 Hydrodynamic diameter
The particle size of the mixtures of unheated lactoferrin (adjusted to different pHs)
and human saliva displayed low values for all pH-levels (Fig. 4A). The particle size
was about 30 nm at neutral pH, whereas a slight increase in size to 55 nm could be
observed below pH 5.6. At pH 2.8, the mixture indicated a particle size of 65 nm.
Heated lactoferrin, adjusted to different pH-levels and mixed with human saliva,
indicated a particle size below 100 nm at pH 8.3 (Fig. 4B). The size increased to
almost 300 nm at pH 7.4, but decreased once again to about 50 nm between pH 7.3

Chapter 4: Results
41
and 6.0. At pH 4.1, another increase to 200 nm was measured, reaching 780 nm at
pH 3.2. Thus, the mixtures of heated lactoferrin and saliva reached two peaks in
particle size. In contrast, the mixture of unheated lactoferrin and saliva did not vary in
particle size for the entire pH range, so that the values remained below 70 nm
(Fig. 4A), whereas the mixtures of heated lactoferrin and saliva showed particle size
increases at pH 7.4 and 3.2 (Fig. 4B).

Chapter 4: Results
42
A
B
Figure 4: Hydrodynamic diameter of the mixtures of unheated (A) and heated (B) lactoferrin and human saliva in the ratio 1:1 (w/w). Prior to mixing, lactoferrin was adjusted to pH 6.8, 3.6, 3.4, 3.0, 2.5 and 2.0.The error bars represent standard deviations.
0
500
1000
8.15 7 6.94 5.61 4.3 2.88
Par
ticl
e si
ze (
nm
)
pH
0
500
1000
8.3 7.4 7.3 6 4.1 3.2
Par
ticl
e si
ze (
nm
)
pH
Chapter 4: Results
43
4.2.1.2 -Potential
-potentials of the mixtures of unheated lactoferrin and saliva showed positive
values for the entire pH range observed (Fig. 5A). Between pH 8.15 and 6.9, the
-potential measurements displayed values below 10 mV, while they increased up to
30 mV at pH 2.88.
The mixtures of heated lactoferrin and saliva (Figure 5B) also showed positive
-potentials for all observed pH-levels. Values between 20 - 30 mV were measured
at pH 8.3 and 6.0. However, the lowest -potential was measured at pH 4.1. Below
that pH the value increased again.
The mixtures of unheated lactoferrin and saliva as well as the mixtures of heated
lactoferrin and saliva showed positive -potentials for the entire pH range. However,
the mixtures of unheated lactoferrin and saliva showed lower values (below 10 mV)
around neutral pH, whereas the mixtures of heated lactoferrin and saliva showed
high values (between 10 and 20 mV) for the same pH range.

Chapter 4: Results
44
A
B
Figure 5 -Potentials of the mixtures of unheated (A) and heated (B) lactoferrin and human saliva in the ratio 1:1 (w/w). Prior to mixing, lactoferrin was adjusted to pH 6.8, 3.6, 3.4, 3.0, 2.5 and 2.0.The error bars represent standard deviations.
0
10
20
30
40
8.15 7 6.94 5.61 4.3 2.88
-Po
ten
tial
(m
V)
pH
0
10
20
30
8.3 7.4 7.3 6 4.1 3.2
-Po
ten
tial
(m
V)
pH
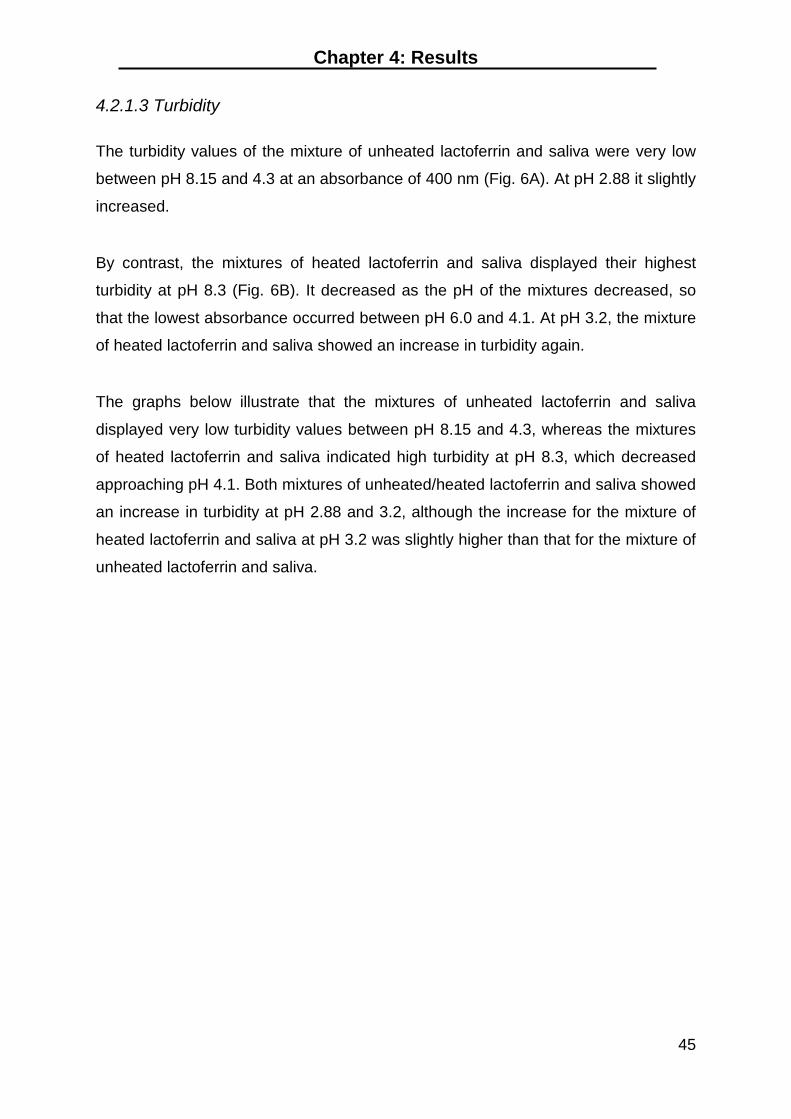
Chapter 4: Results
45
4.2.1.3 Turbidity
The turbidity values of the mixture of unheated lactoferrin and saliva were very low
between pH 8.15 and 4.3 at an absorbance of 400 nm (Fig. 6A). At pH 2.88 it slightly
increased.
By contrast, the mixtures of heated lactoferrin and saliva displayed their highest
turbidity at pH 8.3 (Fig. 6B). It decreased as the pH of the mixtures decreased, so
that the lowest absorbance occurred between pH 6.0 and 4.1. At pH 3.2, the mixture
of heated lactoferrin and saliva showed an increase in turbidity again.
The graphs below illustrate that the mixtures of unheated lactoferrin and saliva
displayed very low turbidity values between pH 8.15 and 4.3, whereas the mixtures
of heated lactoferrin and saliva indicated high turbidity at pH 8.3, which decreased
approaching pH 4.1. Both mixtures of unheated/heated lactoferrin and saliva showed
an increase in turbidity at pH 2.88 and 3.2, although the increase for the mixture of
heated lactoferrin and saliva at pH 3.2 was slightly higher than that for the mixture of
unheated lactoferrin and saliva.

Chapter 4: Results
46
A
B
Figure 6: Turbidity of the mixtures of unheated (A) and heated (B) lactoferrin and human saliva in the ratio 1:1 (w/w). Prior to mixing, lactoferrin was adjusted to pH 6.8, 3.6, 3.4, 3.0, 2.5 and 2.0.
0
0.2
0.4
0.6
0.8
1
1.2
1.4
1.6
1.8
2
8.15 7 6.94 5.61 4.3 2.88
Ab
sorb
ance
at
400
nm
pH
0
0.2
0.4
0.6
0.8
1
1.2
1.4
1.6
1.8
2
8.3 7.4 7.3 6 4.1 3.2
Ab
sorb
ance
at
400
nm
pH

Chapter 4: Results
47
4.2.1.4 SDS-PAGE
The protein components of the sediment of the mixtures of unheated lactoferrin and
saliva are illustrated on lane 4 to 9 (Fig. 7). Salivary proteins, such as basic PRP,
-amylase and GPRP, were detected after saliva was centrifuged (lane 2). Prior to
mixing with saliva, lactoferrin was detected at a molecular weight of ~80 kDa
(lane 3). In the mixtures of unheated lactoferrin and saliva, a high concentration of
lactoferrin was measured, whereas salivary proteins were completely absent. The
lowest amount of lactoferrin in the mixture was detected at pH 6.97 (lane 6).
However, the amount of lactoferrin increased again in the lower pH ranges
(pH 5.61 - 2.88).
In the sediments of the mixtures of heated lactoferrin and saliva, lactoferrin was only
faintly detected at pH 8.3 (lane 4) (Fig. 8), whereas the concentration of lactoferrin
increased significantly at pH levels between 7.4 and 3.2 (lane 5 to 9), with the
highest detected amount at pH 7.4 (lane 5). Again, no salivary proteins were found in
any sediment of the mixtures of heated lactoferrin and saliva at any pH-levels.
The sediments of the mixtures of unheated/heated lactoferrin and saliva displayed a
high concentration of lactoferrin at all observed pH-levels, except for the sediment of
the mixture of heated lactoferrin and saliva at pH 8.3 (Fig. 8). Neither the sediments
of the mixtures of unheated lactoferrin and saliva, nor the sediments of the mixtures
of heated lactoferrin and saliva indicated the presence of salivary proteins in the
SDS-PAGE.
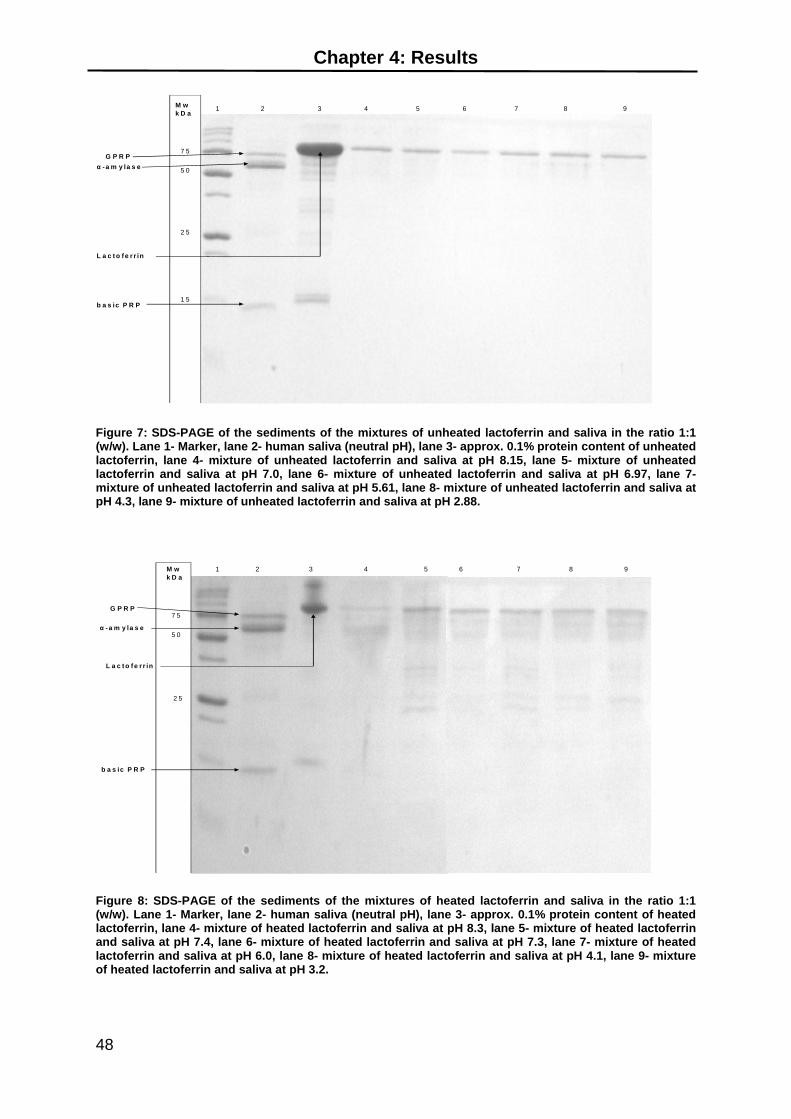
Chapter 4: Results
48
M wk D a
1 2 3 4 5 6 7 8 9
7 5
5 0
2 5
1 5
L a c t o f e r r in
- a m y la s e
b a s ic P R P
G P R P
Figure 7: SDS-PAGE of the sediments of the mixtures of unheated lactoferrin and saliva in the ratio 1:1(w/w). Lane 1- Marker, lane 2- human saliva (neutral pH), lane 3- approx. 0.1% protein content of unheated lactoferrin, lane 4- mixture of unheated lactoferrin and saliva at pH 8.15, lane 5- mixture of unheated lactoferrin and saliva at pH 7.0, lane 6- mixture of unheated lactoferrin and saliva at pH 6.97, lane 7-mixture of unheated lactoferrin and saliva at pH 5.61, lane 8- mixture of unheated lactoferrin and saliva at pH 4.3, lane 9- mixture of unheated lactoferrin and saliva at pH 2.88.
L a c t o f e r r in
- a m y la s e
M wk D a
7 5
5 0
2 5
1 2 3 4 5 6 7 8 9
b a s ic P R P
G P R P
Figure 8: SDS-PAGE of the sediments of the mixtures of heated lactoferrin and saliva in the ratio 1:1(w/w). Lane 1- Marker, lane 2- human saliva (neutral pH), lane 3- approx. 0.1% protein content of heated lactoferrin, lane 4- mixture of heated lactoferrin and saliva at pH 8.3, lane 5- mixture of heated lactoferrin and saliva at pH 7.4, lane 6- mixture of heated lactoferrin and saliva at pH 7.3, lane 7- mixture of heated lactoferrin and saliva at pH 6.0, lane 8- mixture of heated lactoferrin and saliva at pH 4.1, lane 9- mixture of heated lactoferrin and saliva at pH 3.2.

Chapter 4: Results
49
4.2.2 Interactions between lactoferrin (unheated/heated), which was
adjusted to different pH-levels, and human saliva at readjusted pH-levels
4.2.2.1 Hydrodynamic diameter
The particle size of the pH-adjusted unheated lactoferrin presented no change for
the entire pH range observed and remained at about 30 nm (Fig. 9A). After mixing
unheated lactoferrin with saliva and adjusting the pH-level to 6.8, a particle size of
about 100 nm was measured (Fig. 9A). However, at pH 3.6 and 3.4, particle sizes in
the same mixtures of unheated lactoferrin and saliva decreased to 30 nm, while
below pH 3.0, they once again increased to about 200 nm, peaking at pH 2.0 with a
particle size of 670 nm.
In contrast, heated lactoferrin, which was adjusted to several pH-levels, indicated
particle sizes between 200 and 300 nm (Fig. 9B). Heated lactoferrin and the mixtures
of pH-readjusted heated lactoferrin and saliva presented low particle size values of
about 50 nm at pH 6.8 and 3.0. However, at readjusted pH-levels 3.6 and 3.4, the
particle sizes of the same mixtures increased to almost 300 nm. The highest particle
size of 1650 nm was measured at the readjusted pH 2.0.
Compared to pH-adjusted mixtures and heated lactoferrin, unheated lactoferrin and
pH-adjusted mixtures displayed lower particle sizes for the pH range observed
(Fig. 9A and B). The measurements in particle size of the pH-readjusted mixtures of
unheated lactoferrin and saliva presented higher values at pH 6.8, 3.0 and 2.5 than
the mixtures of heated lactoferrin and saliva at the same pH-levels. In turn, the
pH-readjusted mixtures of heated lactoferrin and saliva presented higher values at
pH 3.6 and 3.4 than the mixtures of unheated lactoferrin and saliva. However, both
mixtures of unheated/heated lactoferrin and saliva showed the highest particle size
at pH 2.0, although the particle size of the mixture of pH-readjusted heated
lactoferrin and saliva was more than twice the size compared to the pH-readjusted
mixture of unheated lactoferrin and saliva at the same pH.

Chapter 4: Results
50
A
B
Figure 9: Hydrodynamic diameter of (A) lactoferrin (unheated) and the mixture of unheated lactoferrin
and human saliva in the ratio 1:1 (w/w) at readjusted pH-levels and (B) heated lactoferrin and
mixture of heated lactoferrin with human saliva in the ratio 1:1 (w/w) .The error bars represent standard deviations.
0
500
1000
1500
2000
6.8 3.6 3.4 3 2.5 2
Par
ticl
e si
ze (
nm
)
pH
0
500
1000
1500
2000
6.8 3.6 3.4 3 2.5 2
Par
ticl
e si
ze (
nm
)
pH

Chapter 4: Results
51
4.2.2 -Potential
Unheated lactoferrin, adjusted to different pH-levels, displayed positive -potentials
of 5.0 mV below pH 6.8 (Fig. 10A). However, as pH-levels decreased, -potentials
increased up to 30 mV at pH 2.0. However, high standard deviations at pH 3.6, 3.0,
2.5 and 2.0 were also measured.
The mixture of unheated lactoferrin and saliva at readjusted pH 6.8 showed a
–potential of about 3.0 mV (Fig. 10A). However, between readjusted pH 3.6 and 2.0
the -potentials were measured between 17 and 30 mV.
Similarly, heated lactoferrin, adjusted to different pH-levels, showed positive
-potentials for the entire pH range observed (Fig. 10B). -Potentials of about 5.0 mV
were measured at pH 6.8, while constant -potentials of over 30 mV were measured
between pH 3.6 and 2.0.
The mixtures of pH-readjusted heated lactoferrin and saliva displayed -potentials
between 20 and 30 mV within the pH range between 6.8 and 3.4. The -potential had
a decreased value of 10 mV at pH 3.0, whereas the -potential increased again
when the pH of the mixtures decreased below 3.0.
-potential at pH 6.8 but
the values increased below pH 6.8. However, heated lactoferrin indicated higher
values at all observed pH-levels. Furthermore, the mixtures of heated lactoferrin and
-potentials at pH 3.6 and 3.4, whereas the mixture of
-potential at pH 2.5. In general, the
-potentials of the mixtures of heated lactoferrin and saliva were higher than those of
the mixtures of unheated lactoferrin and saliva.
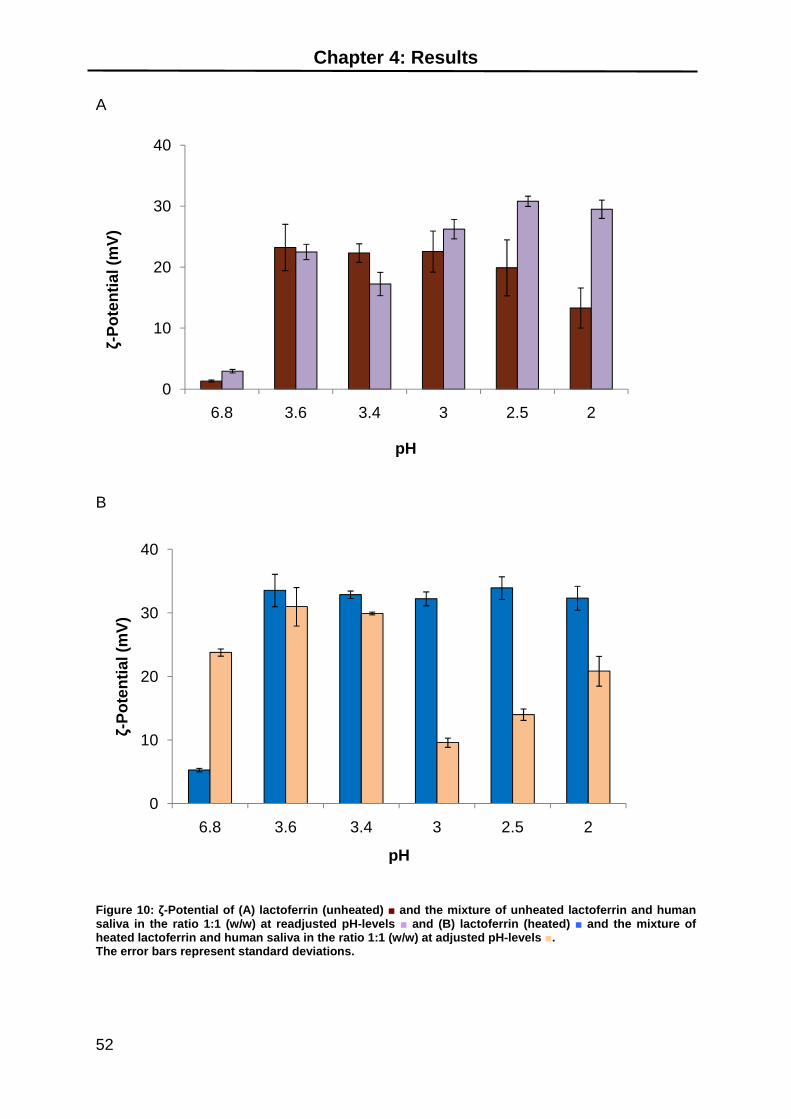
Chapter 4: Results
52
A
B
Figure 10: -Potential of (A) lactoferrin (unheated) and the mixture of unheated lactoferrin and human saliva in the ratio 1:1 (w/w) at readjusted pH-levels and (B) lactoferrin (heated) and the mixture of heated lactoferrin and human saliva in the ratio 1:1 (w/w) at adjusted pH-levels .The error bars represent standard deviations.
0
10
20
30
40
6.8 3.6 3.4 3 2.5 2
-Po
ten
tial
(m
V)
pH
0
10
20
30
40
6.8 3.6 3.4 3 2.5 2
-Po
ten
tial
(m
V)
pH

Chapter 4: Results
53
4.2.2.3 Turbidity
Unheated lactoferrin showed very low absorbance for the entire pH range observed
(Fig. 11A). However, the highest turbidities were detected at pH 6.8 and pH 2.0,
while lower turbidities were measured within the pH range from 3.6 to 2.5.
The mixtures of pH-readjusted unheated lactoferrin and saliva displayed slightly
higher turbidity values for all observed pH-levels, although the measured turbidities
were still low. However, the mixture of unheated lactoferrin and saliva showed higher
absorbencies at pH 6.8 and 2.0, thus indicating a similar behaviour in turbidity as
unheated lactoferrin alone at the same pH-levels.
Heated lactoferrin showed the highest turbidity at pH 6.8, although the absorbance
was very low (Fig. 11B). However, the turbidity decreased as pH-levels decreased.
The pH-readjusted mixture of heated lactoferrin and saliva also displayed the highest
turbidity development at pH 6.8 (Fig. 11B). Furthermore, high turbidity developments
were also measured for the mixtures of heated lactoferrin and saliva at readjusted
pH-levels 3.6 and 3.4. As pH-levels decreased to pH 2.5, the turbidity decreased as
well. Below pH 2.5 however, the mixture registered an increase in turbidity again,
while the intensity was similar to that at pH 3.4. Thus, the pH-readjusted mixtures of
heated lactoferrin and saliva showed the same intensity in turbidity at pH 3.0 and
2.5, as heated lactoferrin alone.
In general, unheated lactoferrin showed much lower turbidities than heated
lactoferrin for the entire pH range observed. The pH-readjusted mixtures of unheated
lactoferrin and saliva presented much lower intensities in turbidity for the observed
pH range than those of heated lactoferrin and saliva in the same pH range. The
pH-readjusted mixtures of unheated lactoferrin and saliva did not show significant
differences in turbidity at any observed pH (Fig. 11A), whereas pH-readjusted
mixtures of heated lactoferrin and saliva displayed significantly high intensities in
turbidity at pH-levels 6.8 and 3.6.

Chapter 4: Results
54
A
B
Figure 11: : Turbidity of (A) unheated lactoferrin , the mixture of unheated lactoferrin with human saliva in the ratio 1:1 (w/w) and (B) heated lactoferrin and the mixture of heated lactoferrin and human saliva in the ratio 1:1 (w/w) at readjusted pH-levels .
0
0.2
0.4
0.6
0.8
1
1.2
1.4
1.6
1.8
2
6.8 3.6 3.4 3 2.5 2
Ab
sorb
ance
at
400
nm
pH
0
0.2
0.4
0.6
0.8
1
1.2
1.4
1.6
1.8
2
6.8 3.6 3.4 3 2.5 2
Ab
sorb
ance
at
400
nm
pH

Chapter 4: Results
55
4.2.2.4 SDS-PAGE
The SDS-PAGE of the proteins obtained from the sediments of the pH-readjusted
mixtures of unheated lactoferrin and saliva indicated a high concentration of
lactoferrin at all observed pH-levels (lanes 4 - 9) (Fig. 12). However, the lowest
amount of lactoferrin was detected at pH 3.0 (lane 7). The bands in lanes 4 - 9,
presenting a molecular weight of about 13 kDa, were not related to the band of saliva
in lane 2 (basic PRP), although these bands are of very similar molecular weight.
The bands in lanes 3 - 9 are more likely to be fragments of lactoferrin, resulting from
the reducing conditions (Massucci et al., 2004). No salivary proteins were detected in
any pH-readjusted mixtures of unheated lactoferrin and saliva.
The pH readjusted mixtures of heated lactoferrin and saliva provided sediments
sufficient only for the electrophoresis determination at pH 6.8, 3.6 and 2.0. The
pH-readjusted mixtures of heated lactoferrin and saliva clearly revealed the presence
of lactoferrin in the sediments at pH 6.8 and 3.6 (lane 4 and 5) (Fig. 13). However,
lactoferrin was only faintly indicated at pH 2.0 (lane 6), while GPRP was clearly
detected in lane 4 and 5. However, -amylase was intensely present only in lane 6,
compared to the mixtures of lactoferrin and saliva at re-adjusted pH 6.8 and 3.6.
Both mixtures of unheated/heated lactoferrin and saliva showed a strong
concentration of lactoferrin in their sediment. However, only the mixture of heated
lactoferrin and saliva evidenced the presence of salivary proteins, although only
three mixtures provided sedimentation.
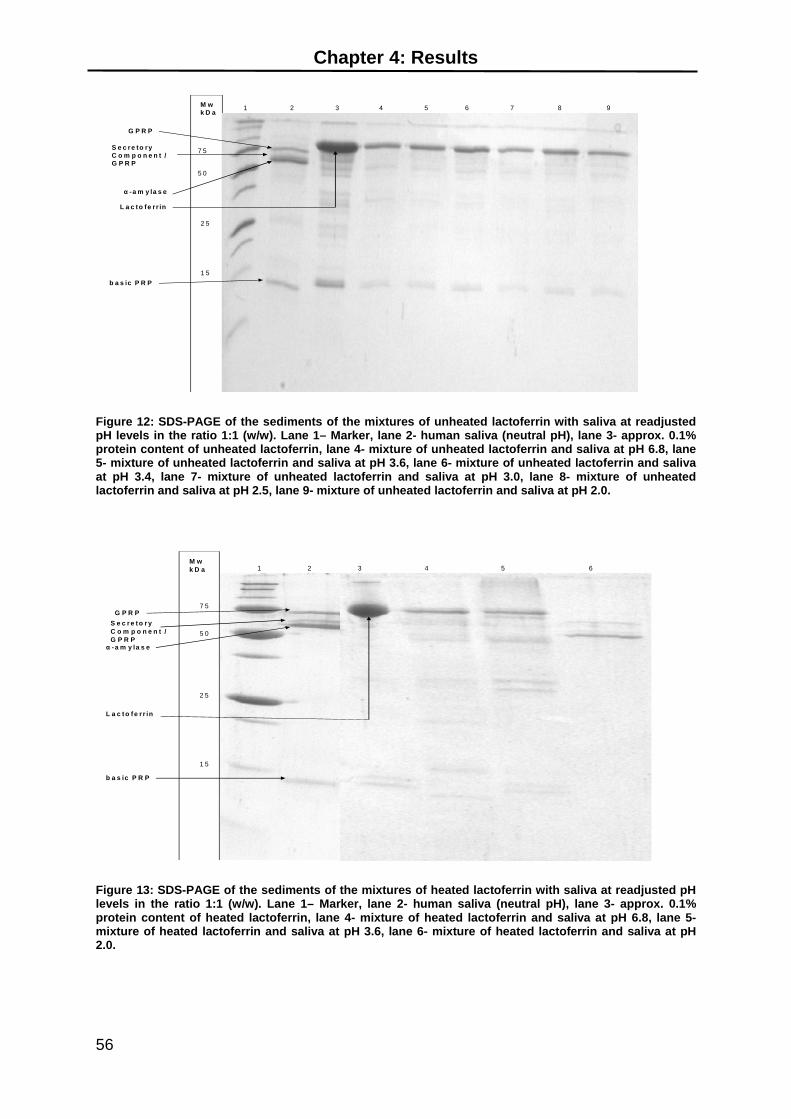
Chapter 4: Results
56
M wk D a
7 5
5 0
2 5
1 5
1 2 3 4 5 6 7 8 9
L a c to fe r r in
-a m y la s e
S e c re to ry C o m p o n e n t /G P R P
b a s ic P R P
G P R P
Figure 12: SDS-PAGE of the sediments of the mixtures of unheated lactoferrin with saliva at readjusted pH levels in the ratio 1:1 (w/w). Lane 1– Marker, lane 2- human saliva (neutral pH), lane 3- approx. 0.1% protein content of unheated lactoferrin, lane 4- mixture of unheated lactoferrin and saliva at pH 6.8, lane 5- mixture of unheated lactoferrin and saliva at pH 3.6, lane 6- mixture of unheated lactoferrin and saliva at pH 3.4, lane 7- mixture of unheated lactoferrin and saliva at pH 3.0, lane 8- mixture of unheated lactoferrin and saliva at pH 2.5, lane 9- mixture of unheated lactoferrin and saliva at pH 2.0.
M wk D a
7 5
5 0
2 5
1 5
1 2 3 4 5 6
L a c t o f e r r in
- a m y la s e
S e c re t o ry C o m p o n e n t /G P R P
b a s ic P R P
G P R P
Figure 13: SDS-PAGE of the sediments of the mixtures of heated lactoferrin with saliva at readjusted pH levels in the ratio 1:1 (w/w). Lane 1– Marker, lane 2- human saliva (neutral pH), lane 3- approx. 0.1% protein content of heated lactoferrin, lane 4- mixture of heated lactoferrin and saliva at pH 6.8, lane 5-mixture of heated lactoferrin and saliva at pH 3.6, lane 6- mixture of heated lactoferrin and saliva at pH 2.0.

Chapter 4: Results
57
Unheated and heated lactoferrin were adjusted to pH 6.8, 3.6, 3.4, 3.0, 2.5 and 2.0.
For the given pH range, heated lactoferrin displayed higher particle sizes and
-potentials than unheated lactoferrin. Turbidity values were very low for unheated
lactoferrin and slightly higher for heated lactoferrin at all observed pH-levels.
However, both registered their highest turbidity at pH 6.8. Under acidic pH
conditions, the turbidity decreased for heated lactoferrin (Fig. 11B). These results
have also been reported by several researchers (Abe et al., 1991, Kawakami et al.,
1992, Kussendraeger, 1994). Abe et al. (1991) and Kawakami et al. (1992) observed
that heated lactoferrin remained clear under high acidic conditions. Therefore, they
suggested that lactoferrin is resistant to unfolding at acidic pH but can easily unfold
at neutral pH. In contrast Kussendraeger (1994) stated that the structure of
lactoferrin unfolds when heat-treated, while after cooling it refolds. However, it is not
clear if the structure can be fully refolded. Heat-induced unfolding of lactoferrin may
result in irreversible aggregation. In addition, due to the strong repulsive charges
below pH 7.0, aggregation or precipitation is unlikely (Kawakami et al., 1992).
The mixtures of unheated lactoferrin and saliva showed low particle sizes and
turbidities for the entire pH range. Furthermore, no salivary proteins were detected in
the sediment of the mixtures. However, the mixtures of heated lactoferrin and saliva
showed increased particle sizes at pH 7.4 and 3.2, while increased turbidity did not
occur at pH 3.2 but between pH 8.3 and 7.3. One possible explanation for the
increased turbidity developments between pH 8.3 and 7.3 could be that lactoferrin
has its isoelectric point at ~ pH 8.0 and is therefore more likely to aggregate. Particle
size measurements take longer than spectrophotometric measurements. Therefore,
it is possible that the aggregated particles in the mixtures settle down during the
DLS-measurement, whereas during the spectrophotometric analysis the particles are
still properly dispersed providing data which indicate that aggregation may occur at
these pH-levels. However, -potential measurements did not reveal that
aggregations may occur in the mixtures between pH 8.3 and 7.3. An increased
particle size at pH 3.2 and corresponding low turbidity value may be explained by
claiming that only a few small particles are large enough, and therefore they are
more difficult to be detected as turbidity.
Chapter 4: Results
58
Only very small amounts of the sediments of the mixtures of unheated/heated
lactoferrin and saliva were obtained, so that sample amount might contain too little
amount of salivary proteins to detect them in the sediments of the mixtures.
Furthemore, the SDS-PAGES of the sediments of the mixtures of unheated/heated
lactoferrin and saliva (Fig. 7 and 8) -amylase or basic
PRP are involved in the astringent sensation, as it was shown for polyphenols, when
in interaction with human saliva (Bacon and Rhodes, 2000, Dinnella et al., 2010,
Gambuti et al., 2006, Sarni-Manchado et al., 1999). However, Vardhanabhuti et.al.
(2010) recently reported that mucins were detected in the sediments of the mixtures
of unheated lactoferrin (adjusted to pH 7.0, 3.5 and 2.6) and saliva. During this
project, no mucin was detected in the saliva or the mixtures, which might be the
result of centrifugation of the saliva prior to usage.
The pH-readjusted mixtures of unheated/heated lactoferrin and saliva both showed a
significant increase in particle size at readjusted pH 2.0 (Fig. 9). Considering the high
particle size at this pH-level, the developed turbidities did not indicate a significant
increase at pH 2.0 (Fig. 11). It is suggested that a few small particles are large
enough to be detected by DLS, but still too small to be detected as turbidity.
Increased turbidity developments were measured for the mixtures of heated
lactoferrin and saliva between readjusted pH 6.8, 3.6 and 3.4, whereas the particle
size measurements showed only an increase at readjusted pH 3.6 and 3.4. the high
tuirbidity value for the mixture at readjusted pH 6.8 could be explained by the
duration of the measurements for the particle size and turbidity. The particle size
measurement takes longer than the spectophotometric measurement, so that the
aggregated particle will be able to settle down, so that bigger particles will not be
detected. Unheated and heated lactoferrin alone did not display significantly
increased particle sizes or turbidity developments at any of the observed pH-levels.
However, saliva showed high particle sizes below pH 3.6 (Fig. 1). Therefore, it is
suggested that salivary proteins aggregate in the mixtures when additional acid is
added to readjust the pH of the mixtures of unheated/heated lactoferrin and saliva.
This suggestion is supported by the SDS-PAGE of heated lactoferrin and saliva
(Fig. 13), evid -amylase in the sediments of the mixture

Chapter 4: Results
59
at pH 2.0. Moreover, faint -amylase were detected in the sediments of the
mixtures of unheated lactoferrin and saliva at readjusted pH-levels, while very faint
bands of GPRP were identified in the pH-readjusted mixtures of either unheated or
heated lactoferrin with saliva.

Chapter 4: Results
60
4.3 Interactions -lactoglobulin and human saliva
4.3.1 Interactions between -lactoglobulin (unheated/heated), which was
adjusted to different pH-levels, and human saliva
-Lg solutions were prepared as described in section 3.2 and adjusted to pH-levels
6.8, 3.6, 3.4, 3.0, 2.5 and 2.0. The solutions were separated into two parts, one part
was heat-treated, and the other part remained unheated. The heated and unheated
solutions were both mixed with human saliva according to the ratio 1:1 (w/w). The
resulting pH shifting of the solutions may be followed in Table 2. The pH of both
mixture types moved towards neutral pH, even though the mixture of hea -lg and
saliva showed a stronger pH shifting.
Table 2: pH change in ß-lg (unheated/heated) solutions when mixed with human saliva in the ratio 1:1(w/w).
pH of 2% ß-lg(unheated/ heated)
6.8 3.6 3.4 3.0 2.5 2.0
pH shifting of 2%ß-lg (unheated) when mixed with human saliva 1:1(w/w)
7.0 5.8 5.6 4.7 3.4 2.8
pH shifting of 2% ß-lg (heated) when mixed with human saliva 1:1 (w/w)
7.2 6.2 5.9 5.1 3.6 2.8
4.3.1.1 Hydrodynamic diameter
The mixtures of unheated -lg and saliva displayed particle sizes of 500 nm between
pH 7.0 to 5.6 (Fig. 14A). They decreased to 300 nm at pH 4.7. However, particle
sizes increased the more acidic the mixture became, so that the largest particle size
of ~4300 nm was measured at pH 2.8.
Chapter 4: Results
61
In c -lg and saliva showed very low particle sizes
between 34 and 240 nm between pH 7.4 and 6.2 (Fig. 14B). Nevertheless,
increasing particle sizes of about 1000 nm were measured between pH 5.9 and 3.6.
At pH 2.8, the mixture exceeded the upper limit of the detectable particle size of
5000 nm.
-lg and saliva showed
higher particle sizes between pH 6.9 and 2.8. However, between pH 7.2 and 6.2 the
particle sizes are higher for the mictures of unheated -lg and saliva. Furthermore,
both mixtures had their highest particle size measured at pH 2.8.

Chapter 4: Results
62
A
B
Figure 14: Hydrodynamic diameter of the mixture of unheated (A) and heated (B) -lg and human saliva in the ratio 1:1 (w/w -lg was adjusted to pH 6.8, 3.6, 3.4, 3.0, 2.5 and 2. * Sample exceeds 5000 nm. The error bars represent standard deviations.
0
500
1000
1500
2000
2500
3000
3500
4000
4500
5000
7 5.8 5.6 4.7 3.4 2.8
Par
ticl
e si
ze (
nm
)
pH
0
500
1000
1500
2000
2500
3000
3500
4000
4500
5000
7.2 6.2 5.9 5.1 3.6 2.8
Par
ticl
e si
ze (
nm
)
pH
*

Chapter 4: Results
63
4.3.1 -Potential
The -potentials of the mixtures of unheat -lg and saliva showed negative values
between -38 and -22 mV from pH 7.0 to 4.7 (Fig. 15A). At pH 3.4, the mixture
displayed negative values close to zero at pH 3.4, whereas at pH 2.8, they increased
again to 10 mV.
-potentials of the mixture of -lg and saliva showed values in the
negative range between -39 and -14 mV in the pH range 7.2 to 5.0 (Fig. 15B), while
positive values around 32 mV were measured at pH 3.6 and 2.8.
Both mixtures in -potentials before reaching pH 5.6
(Fig. 15A and B). At pH 4.7, t -lg and saliva had developed a
-potential than the mixture in 15B at pH 5.1. However, the mixture of heated
-lg and saliva showed high positive values at pH 3.6, whereas the mixture of
-lg and saliva retained -potential at pH 3.4. At pH 2.8,
-potentials at pH 2.8, although it was lower for
-lg and saliva than for the mixture of heated -lg and
saliva.

Chapter 4: Results
64
A
B
Figure 15 - -lg and human saliva in the ratio1:1(w/w -lg was adjusted to pH 6.8, 3.6, 3.4, 3.0, 2.5 and 2.0.The error bars represent standard deviations.
-40
-30
-20
-10
0
10
20
30
40
7 5.8 5.6 4.7 3.4 2.8
-Po
ten
tial
(mV
)
pH
-40
-30
-20
-10
0
10
20
30
40
7.2 6.2 5.9 5.1 3.6 2.8
-Po
ten
tial
(m
V)
pH

Chapter 4: Results
65
4.3.1.3 Turbidity
The absorbencies of the mixtures of -lg and saliva remained low between pH 7.0
and 4.7 (Fig. 16A). Highest turbidity was measured at pH 3.4, while the second peak
in turbidity occurred at pH 2.8, although the intensity halved compared to the turbidity
at pH 3.4.
The mixtures of heated -lg and saliva showed increasing turbidity values from
pH 7.2 to pH 5.1, where the highest turbidity was measured (Fig. 16B). Decreasing
turbidity values were detected below pH 5.1.
-lg and saliva indicated its highest turbidity,
-lg and saliva showed its highest turbidity value at
pH 5.1, decreasing again below pH 5.1.

Chapter 4: Results
66
A
B
Figure 16 -lg and human saliva in the ratio1:1(w/w -lg was adjusted to pH 6.8, 3.6, 3.4, 3.0, 2.5 and 2.0.
0
0.2
0.4
0.6
0.8
1
1.2
1.4
1.6
1.8
2
7 5.8 5.6 4.7 3.4 2.8
Ab
sorb
ance
at
400
nm
pH
0
0.2
0.4
0.6
0.8
1
1.2
1.4
1.6
1.8
2
7.2 6.2 5.9 5.1 3.6 2.8
Ab
sorb
ance
at
400
nm
pH
Chapter 4: Results
67
4.3.1.4 SDS-PAGE
The electrophoretogram of the sediments of the mixtures -lg and saliva
indicated a strong presence of -lg at all observed pH-levels (lane 4 - 9) (Fig. 17).
Only faint -lg were detected at pH 2.8 (lane 9). However, at the same
pH-level, GPRP an -amylase were also identified in the mixture.
The sediments of the mixtures of -lg and saliva are presented in lanes 6 - 9
(Fig. 18). Compared to the unheated samples, the mixture showed the strongest
-lg at pH 5.9 (lane 6), while t -lg was measured at
pH 7.2 (lane 4) -amylase were detected in all mixtures throughout the
observed pH range, although the bands were only faintly present, except for the
mixture at pH 3.6 (lane 8). There, these salivary proteins indicate their highest
concentration. No basic PRPs were detected in any mixture at any observed pH.
-lg and saliva (Fig. 17) only displayed
the presence of -amylase at pH 2.8 (lane 9). However, in the sediments
- -amylase were
detected at all observed pH-levels.

Chapter 4: Results
68
M w k D a
1 2 3 4 5 6 7 8 9
7 5
5 0
2 5
- la c t o g lo b u l in
- a m y la s e
S e c re t o ry C o m p o n e n t / G P R P
b a s ic P R P
G P R P
Figure 17: SDS-PAGE of the sediments of the mixtures of unhea -lg with saliva in the ratio 1:1 (w/w). Lane 1– Marker, lane 2- human saliva (neutral pH), lane 3- approx. 0.1% protein content of -lg, lane 4- -lg and saliva at pH 7.0, lane 5- -lg and saliva at pH 5.8, lane 6- -lg and saliva at pH 5.6, lane 7- -lg and saliva at pH 4.7, lane 8- -lg and saliva at pH 3.4, lane 9- -lg and saliva at pH 2.8.
7 5
M wk D a
5 0
2 5
1 5
1 2 3 4 5 6 7 8 9
- la c t o g lo b u l in
- a m y la s e
S e c r e t o r y C o m p o n e n t /G P R P
b a s ic P R P
G P R P
Figure 18: SDS- -lg with saliva in the ratio 1:1 (w/w). Lane 1– Marker, lane 2- human saliva (neutral pH), lane 3- approx. 0.1% protein content of -lg, lane 4- mixture of h -lg and saliva at pH 7.2, lane 5- -lg and saliva at pH 6.2, lane 6- -lg and saliva at pH 5.9, lane 7- -lg and saliva at pH 5.1, lane 8-
-lg and saliva at pH 3.6, lane 9- mix -lg and saliva at pH 2.8.

Chapter 4: Results
69
4.3.2 Interactions -lactoglobulin (unheated/heated), which was
adjusted to different pH-levels, and human saliva at readjusted pH-levels
4.3.2.1 Hydrodynamic diameter
The particle sizes of u -lg showed values of about 50 nm for the entire
given pH range (Fig. 19A).
The mixture -lg and saliva displayed their highest particle size at the
readjusted pH 3.4, where the value exceeded the upper limit of the detectable
particle size range of 5000 nm. Two other peaks of about 1500 nm were measured
at readjusted pH 3.6 and 2.0, although the particle sizes at these pH-levels were
much lower than those of the mixture at readjusted pH 3.4.
Particle sizes of heated -lg remained below 100 nm for the entire given pH range
(Fig. 19B). The particle sizes of the mixtures of -lg and saliva increased up
to 1600 nm at readjusted pH 3.4. However, the high error bar may indicate that only
a few large particles were detected. The size decreased the more the pH decreased
until reaching pH 2.0, where the pH-readjusted mixture showed its highest particle
size of 2600 nm.
Particle sizes of unheated -lg were lower than those of heated -lg for the entire pH
range, while both pH-readjusted mixtures showed a high particle size at pH 3.4.
However, at the same pH-level, a significantly higher particle size was measured for
the mixture of unheated -lg -lg and
saliva displayed their highest particle size at readjusted pH 2.0. Both mixtures had
similar particle sizes at pH 3.6.

Chapter 4: Results
70
A
B
Figure 19 -lg (unheated) , -lg and human
saliva in the ratio 1:1 (w/w) at readjusted pH-levels -lg (heated) and the mixture of heated
-lg and human saliva in the ratio 1:1 (w/w) at readjusted pH-levels . * Sample exceeded 5000 nm.The error bars represent standard deviation.
0
500
1000
1500
2000
2500
3000
3500
4000
4500
5000
6.8 3.6 3.4 3 2.5 2
Par
ticl
e si
ze (
nm
)
pH
0
500
1000
1500
2000
2500
3000
6.8 3.6 3.4 3 2.5 2
Par
ticl
e si
ze (
nm
)
pH
*

Chapter 4: Results
71
4.3.2 -Potential
-potential of unhe -lg, which was adjusted to different pH-levels, was
measured at -18 mV at neutral pH (Fig. 20A). Between the range of pH 3.6 and 2.0,
-potentials varied from 4 to 11 mV.
In contrast, the pH-readjusted mixture of -lg and saliva showed at pH 6.8
-potential of -38 mV. The nega -potentials decreased more as the
pH- -potential turned to positive
values. At pH 2.0, increasing values to up to 20 mV were measured.
Heated -lg (adjusted to different pH- -potential of
almost -40 mV (Fig. 20B). Under acidic conditions (pH 3.6 to 2.0), -lg displayed
-potentials between 20 and 44 mV. At the same pH-levels, the
pH-readjusted mixtures of heated -lg and saliva showed a similar behaviour
towards -lg -potentials,
except for the mixture at pH 6.8 (Fig. 20B).
-lg that had been adjusted to different
pH-levels indicated -potentials at pH 6.8. However, both showed positive
values at acidic pH. Furthermore, -lg, h -lg had higher
-potential values for the entire pH range (Fig. 20B). The pH-readjusted mixtures of
-lg and saliva displayed decreasing -potential values from
pH 6.8 to 3.4. In contrast, the pH-readjusted mixtures of heated -lg and saliva
showed only one negative value -potentials of the
mixtures of -lg and saliva were higher for the entire pH range observed
(Fig. 20B) than those of the mixtures -lg and saliva (Fig. 20A).

Chapter 4: Results
72
A
B
Figure 20 - -lg (unheated) , -lg and human saliva in the ratio
1:1 (w/w) at readjusted pH-levels -lg -lg and human
saliva in the ratio 1:1 (w/w) at readjusted pH-levels . The error bars represent standard deviation.
-50
-40
-30
-20
-10
0
10
20
30
40
6.8 3.6 3.4 3 2.5 2
-Po
ten
tial
(m
V)
pH
-40
-30
-20
-10
0
10
20
30
40
6.8 3.6 3.4 3 2.5 2
-Po
ten
tial
(m
V)
pH

Chapter 4: Results
73
4.3.2.3 Turbidity
Absorbance measurements at 400 nm indicated that -lg solutions
(adjusted to different pH-levels) were not turbid at all (Fig. 21A). Absorbance values
converged close to zero for all solutions at any observed pH. The pH-adjusted
mixture of unheated -lg solutions and saliva showed a low absorbance level at
neutral pH. However, the turbidity significantly increased for the pH-readjusted
mixtures between pH 3.6 and 2.0, although the turbidity slightly decreased at
readjusted pH 2.0.
The h -lg solutions, which were adjusted to different pH-levels, measured low
turbidity values, which did not change in intensity for the entire pH range (Fig. 21B).
However, the mixtures of pH-readjusted -lg and saliva displayed a low
turbidity value at neutral pH, which increased under acidic conditions. The highest
absorbance was detected at pH 3.4. Absorbance values decreased between pH 3.0
and 2.5, the lowest value having been measured at pH 2.5. However, the turbidity
increased again at pH 2.0.
Unhea -lg, adjusted to different pH-levels, demonstrated only
little turbidity at the observed pH- -lg
-lg solutions showed higher absorbance values. The
pH-readjusted mixtures of unheated -lg and saliva displayed their highest
absorbance value at pH 3.6, although the intensity did not reach a significant peak
and the values did not radically change for the observed pH range. In contrast, the
pH-readjusted mixtures of heated -lg and saliva showed a significantly high peak at
pH 3.4. Nevertheless, both mixtures presented similar absorbance values at pH 3.6
3.0 and 2.0.

Chapter 4: Results
74
A
B
Figure 21 -lg , the mixture o -lg and human saliva in the ratio 1:1 (w/w) at readjusted pH-levels -lg -lg and human saliva in the ratio 1:1 (w/w) at readjusted pH-levels.
0
0.2
0.4
0.6
0.8
1
1.2
1.4
1.6
1.8
2
6.8 3.6 3.4 3 2.5 2
Ab
sorb
ance
at
400
nm
pH
0
0.2
0.4
0.6
0.8
1
1.2
1.4
1.6
1.8
2
6.8 3.6 3.4 3 2.5 2
Ab
sorb
ance
at
400
nm
pH
Chapter 4: Results
75
4.3.2.4 SDS-PAGE
The protein components of the sediments of the pH-readjusted mixtures of unheated
-lg -lg in all mixtures (lane 4 - 9) (Fig. 22).
The lowest amount of -lg was measured at the readjusted pH-level 6.8 (lane 4).
-amylase were faintly detected in the readjusted mixtures at
pH 6.8, 3.6, 3.4, 3.0 and 2.5. A higher concentration -amylase was measured at
pH 2.0 (lane 9).
The electrophoretogram of the sediments of the pH-readjusted mixtures of heated
-lg and saliva showed a decre -lg in the pH-readjusted mixtures
between pH 3.6 and 2.0 (lane 4 to 8) (Fig. 23). No sediment was provided in the
pH-readjusted mixtures at pH 6.8. The band in the mixture at readjusted pH-level 2.0
showed only a light -lg. GPRP/secretory components were faintly
detected in all mixtures with similar intensities. However, GPRP were clearly
detected in the mixtures at readjusted pH 2.5 and 2.0. Additionally, -amylase was
discerned below pH 3.0 (lane 7 and 8).
The SDS-Pages of the sediments of the pH-readjusted mixtures of unheated/heated
-lg and saliva presented faint bands of GPRP at all observed pH-levels. Both
-amylase at pH 2.0. Additionally, Fig. 23
illustrates the presence of the salivary protein at pH 2.5.

Chapter 4: Results
76
M wk D a
1 2 3 4 5 6 7 8 9
7 5
5 0
2 5
1 5
- la c to g lo b u lin
-a m y la s e
S e c re to ry c o m p o n e n t / G P R P
b a s ic P R P
G P R P
Figure 22: SDS- -lg with saliva in the ratio 1:1 (w/w) at readjusted pH-levels. Lane 1– Marker, lane 2- human saliva (neutral pH), lane 3- approx. 0.1% protein content of -lg, lane 4- -lg and saliva at pH 6.8, lane 5- mixture of
-lg and saliva at pH 3.6, lane 6- -lg and saliva at pH 3.4, lane 7- mixture -lg and saliva at pH 3.0, lane 8- -lg and saliva at pH 2.5, lane 9-
-lg and saliva at pH 2.0.
1 2 3 4 5 6 7 8M wk D a
7 5
5 0
2 5
1 5– lg
-a m y la s e
S e c re to ry C o m p o n e n t /G P R P
b a s ic P R P
G P R P
Figure 23: SDS-PAGE of the sediments of the mix -lg with saliva in the ratio 1:1 (w/w) at readjusted pH-levels. Lane 1– Marker, lane 2- human saliva (neutral pH), lane 3- approx. 0.1% protein content of -lg, lane 4- -lg and saliva at pH 3.6, lane 5- mixture of -lg and saliva at pH 3.4, lane 6- -lg and saliva at pH 3.0, lane 7- -lg and saliva at pH 2.5, lane 8- -lg and saliva at pH 2.0.

Chapter 4: Results
77
-lg and saliva displayed their highest particle sizes at
pH 3.4 and 2.8, at which levels the highest turbidities were also detected. This
indicates that aggregation or even precipitation may occur in these mixtures. This is
supported by the SDS-PAGE of the sediment of the mixtures of u -lg and
-amylase and GPRP were detected at pH 2.8
(Fig. 17). Human saliva itself showed increased particle sizes below pH 3.6 (Fig. 1).
-lg and saliva occurred.
-lg presented negative values between
pH 6.8 and 3.0. As both proteins carry the same charge when mixed together, it is
-lg. That may also be observed in the
SDS- -lg and saliva between pH-levels 7.2 and
-Lg on its own has a negative charge until reaching ~pH 5.1, where
the charge turns positive. Saliva carries a negative charge until pH 3.0, which is why
th -lg and saliva were negatively charged until reaching pH 3.4
(Fig. 15A).
The detection of a high particle size and turbidity at pH 3.4 may be explained by
instances of very few, but large, particle sizes, although, at the same pH-lev -lg
on its own showed a very low particle size (Fig. 19A) as well as turbidity (Fig. 21A),
while saliva displayed a particle size above 1000 nm. No salivary proteins were
-lg and saliva at pH 3.4, but below pH 3.0,
-lg presented a positive charge (Fig. 20A), whereas saliva was still
negatively charged (at neutral pH). Therefore, it is suggested that the interaction
-lg and saliva is caused by electrostatic interactions.
-lg and saliva showed high particle sizes and absorbance
-lg on its own displayed higher particle
-lg, although the values were significantly
-lg and saliva. The highest turbidity was measured
at pH 5.1, which is where the pI -lg occurs. However, the SDS-PAGE of these
-lg and saliva contained the highest
-lg at pH 5.9, while the second highest amount was detected at pH 5.1

Chapter 4: Results
78
(Fig. 18). At pH 2.8, the mixture showed the highest particle size. However, the
measured turbidity did not indicate that aggregation may have occurred in the
mixture, as would be suggested by the high particle size. It is likely that only a few
very large particles were detected by the laser, resulting in such high particle size
values above 5000 nm but relatively low absorbance levels at the same pH.
Furthermore, saliva displayed high particle sizes at acidic pH (Fig. 1), but neither
-lg (Fig. 21B) on their own presented a significant change in
turbidity when adjusted to different pH- -lg itself is positively charged
at pH 3.6, 3.4, 3.0, 2.5 and 2.0, whereas saliva has a negative charge at neutral pH.
When mixed together, the pH of the solutions shifted to 5.9, 5.1, 3.6 and 2.8. At
these pH-levels, the mixtures displayed high particle sizes as well as increased
turbidities -lg, which was
adjusted to pH 6.8, and saliva (at neutral pH).
The SDS- -lg and saliva contained small amounts of
-amylase as well as GPRP (Fig. 18). At pH 7.2, only faint bands of salivary proteins
could be detected for the mixture. However, the highest amounts of these salivary
proteins -lg and saliva at pH 3.6 (Fig. 18). At
-lg is positively charged (Fig. 20B), whereas saliva has a
negative charge at neutral pH. Therefore, the mixture containing both negatively
-lg and saliva showed only faint bands of salivary proteins. However, the
-lg (which was adjusted
to pH between 3.6 and 2.0) as well as negatively charged saliva (at neutral pH),
-lg and saliva presented a negative
charge between pH 7.2 and 5.1 (Fig. 15B). Thus, bands of salivary proteins were
faintly detected as well. However, the mixture showed positive charges at pH 3.6 and
2.8. Therefore, it is suggested that electrostatic interactions between negatively
charged saliva -lg cause the increase in particle size as well
as in turbidity.
The pH-readjusted mixtures of un -lg and saliva showed significantly higher
-lg on its own below the readjusted pH-level of 3.6 (Fig. 19A),
-Lg itself is

Chapter 4: Results
79
positively charged below pH 3.6 (Fig. 20), whereas saliva is still negatively charged
between pH 3.6 and 3.0 (Fig. 2). The mixtures of pH- -lg and saliva
displayed negative charges between pH 3.6 and 3.0 (Fig. 20A), which is likely to be
caused by saliva. Increased turbidity was also measured at these readjusted
pH- -amylase and GPRP (Fig. 22).
-lg
and saliva leads to aggregation/precipitation of the salivary proteins.
The pH- -lg and saliva showed significantly higher
-lg on its own at the same pH-level
(Fig. 19B and 21B). At pH 2.0, the particle size of about 2500 nm of this
pH-readjusted mixture did not show a significantly high turbidity. That indicates that
very few particles in this mixture are of very large particle sizes, which is not
detected during turbidity measurements. However, the other particle size peak
occurred at readjusted pH 3.4, where a significantly higher turbidity was also
-lg is
positively charged between pH 3.6 and 2.0. Therefore, both solutions show positive
charges below pH 3.0, which results in lower particle sizes (considering that the peak
at pH 2.0 is caused by only a few big particles) and turbidities, illustrated in Fig. 19B
-amylase were detected in all pH-readjusted
-lg and saliva (Fig. 23). Higher amounts of these salivary
proteins were detected in the pH-readjusted mixtures below pH 3.0, indicating that
the additional acid used for the pH-readjustments caused the precipitation of salivary
proteins. Saliva shows a high particle size at pH 3.0 -lg on its own
did not precipitate.

Chapter 4: Results
80
4.4 Interactions between WPI and human saliva
4.4.1 Interactions between WPI (unheated/heated), which was adjusted
to different pH-levels, and human saliva
WPI solutions were adjusted to specific pH-levels and then separated into two parts,
where one part was heat-treated. Then, the unheated and heated WPI solutions
were mixed with human saliva according to the ratio 1:1 (w/w). Adding human saliva
to the pH-adjusted WPI-solutions caused the pH-levels of the mixtures to change. All
mixtures of unheated and heated WPI and saliva shifted towards neutral pH
(Table 3). However, the mixtures of heated WPI and saliva showed stronger pH
shifting than the mixtures containing unheated WPI.
Table 3: pH change in WPI (unheated/heated) solutions when mixed with human saliva in the ratio 1:1(w/w).
pH of 5% WPI (not heated/heated) 6.8 3.6 3.4 3.0 2.5 2.0
pH shifting of 5%WPI(unheated) when mixed with human saliva 1:1(w/w) 6.9 4.3 4.1 3.7 3.1 2.7
pH shifting of 5%WPI (heated) when mixed with human saliva 1:1(w/w) 7.26 5.15 4.67 4.16 3.35 2.62
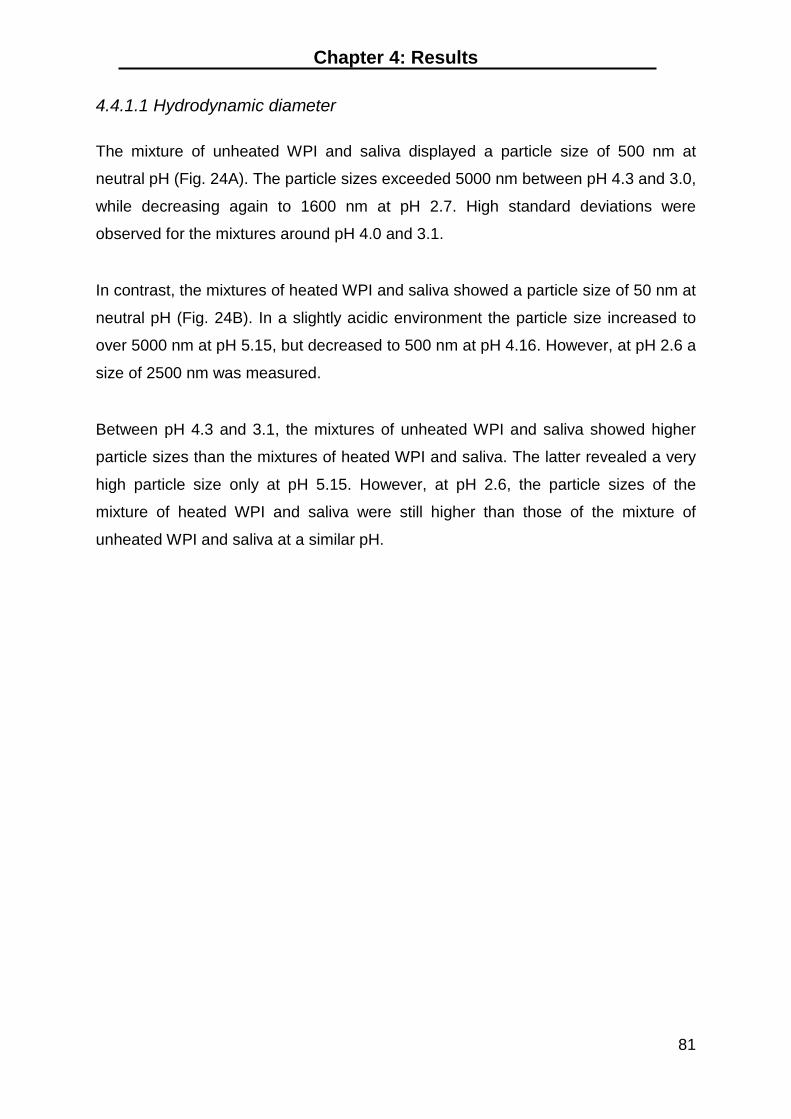
Chapter 4: Results
81
4.4.1.1 Hydrodynamic diameter
The mixture of unheated WPI and saliva displayed a particle size of 500 nm at
neutral pH (Fig. 24A). The particle sizes exceeded 5000 nm between pH 4.3 and 3.0,
while decreasing again to 1600 nm at pH 2.7. High standard deviations were
observed for the mixtures around pH 4.0 and 3.1.
In contrast, the mixtures of heated WPI and saliva showed a particle size of 50 nm at
neutral pH (Fig. 24B). In a slightly acidic environment the particle size increased to
over 5000 nm at pH 5.15, but decreased to 500 nm at pH 4.16. However, at pH 2.6 a
size of 2500 nm was measured.
Between pH 4.3 and 3.1, the mixtures of unheated WPI and saliva showed higher
particle sizes than the mixtures of heated WPI and saliva. The latter revealed a very
high particle size only at pH 5.15. However, at pH 2.6, the particle sizes of the
mixture of heated WPI and saliva were still higher than those of the mixture of
unheated WPI and saliva at a similar pH.

Chapter 4: Results
82
A
B
Figure 24: Hydrodynamic diameter of the mixture of unheated (A) and heated (B) WPI and human saliva in the ratio 1:1 (w/w). Prior to mixing, WPI was adjusted to pH 6.8, 3.6, 3.4, 3.0, 2.5 and 2.0. * Sample exceeded 5000 nm. The error bars represent standard deviations.
0
500
1000
1500
2000
2500
3000
3500
4000
4500
5000
6.9 4.3 4.1 3.7 3.1 2.7
Par
ticl
e si
ze (
nm
)
pH
0
500
1000
1500
2000
2500
3000
3500
4000
4500
5000
7.26 5.15 4.67 4.16 3.35 2.62
Par
ticl
e si
ze (
nm
)
pH
* ***
*

Chapter 4: Results
83
4.4.1 -Potential
The mixtures of unheated WPI and saliva presented a negative -potential of -50 mV
at neutral pH (Fig. 25A). In the pH range between 4.3 and 3.7, the -potentials turned
positive, displaying values of ~ -potentials were
measured below pH 3.1.
In contrast, the mixtures of heated WPI and saliva showed a -potential of -50 mV at
neutral pH (Fig. 25B). Below pH 5.1, positive values between 21 and 31 mV were
measured.
Both mixtures of unheated/ -potential
at neutral pH and positive values within the pH range of 5.1.5 and 2.6. In general,
-potentials were measured for the mixtures of heated WPI and saliva
(Fig. 25B).

Chapter 4: Results
84
A
B
Figure 25: -Potential of the mixture of unheated (A) and heated (B) WPI and human saliva in the ratio 1:1(w/w). Prior to mixing, WPI was adjusted to pH 6.8, 3.6, 3.4, 3.0, 2.5 and 2.0.The error bars represent standard deviations.
-60
-50
-40
-30
-20
-10
0
10
20
30
40
6.9 4.3 4.1 3.7 3.1 2.7
-Po
ten
tial
(m
V)
pH
-60
-50
-40
-30
-20
-10
0
10
20
30
40
7.26 5.15 4.67 4.16 3.35 2.62
-Po
ten
tial
(m
V)
pH
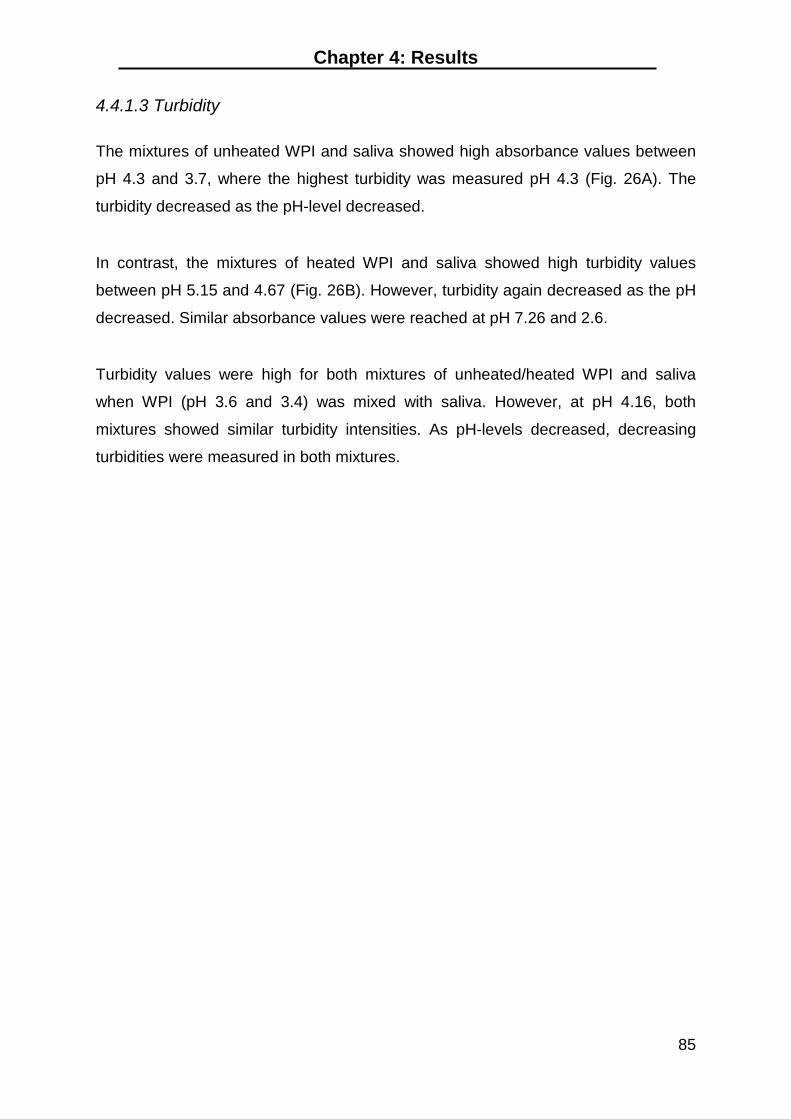
Chapter 4: Results
85
4.4.1.3 Turbidity
The mixtures of unheated WPI and saliva showed high absorbance values between
pH 4.3 and 3.7, where the highest turbidity was measured pH 4.3 (Fig. 26A). The
turbidity decreased as the pH-level decreased.
In contrast, the mixtures of heated WPI and saliva showed high turbidity values
between pH 5.15 and 4.67 (Fig. 26B). However, turbidity again decreased as the pH
decreased. Similar absorbance values were reached at pH 7.26 and 2.6.
Turbidity values were high for both mixtures of unheated/heated WPI and saliva
when WPI (pH 3.6 and 3.4) was mixed with saliva. However, at pH 4.16, both
mixtures showed similar turbidity intensities. As pH-levels decreased, decreasing
turbidities were measured in both mixtures.

Chapter 4: Results
86
A
B
Figure 26: Turbidity of the mixture of unheated (A) and heated (B) WPI and human saliva in the ratio 1:1(w/w). Prior to mixing, WPI was adjusted to pH 6.8, 3.6, 3.4, 3.0, 2.5 and 2.0.
00.20.40.60.8
11.21.41.61.8
22.22.42.62.8
3
6.9 4.3 4.1 3.7 3.1 2.7
Ab
sorb
ance
at
400
nm
pH
00.20.40.60.8
11.21.41.61.8
22.22.42.62.8
3
7.26 5.15 4.67 4.16 3.35 2.62
Ab
sorb
ance
at
400
nm
pH

Chapter 4: Results
87
4.4.1.4 SDS-PAGE
The SDS-PAGE of the proteins, obtained from the sediments of the unheated WPI
and saliva mixtures, indicated that the amounts of -lg increased as the pH-levels
decreased (lanes 4 to 9) (Fig. 27). The highest amount of -lg was detected at
-lg was contained in the mixture at
pH 4.3 (lane 5).
Faint bands of -lactalbumin were detected in all mixtures at all observed pH-levels,
indicating that in contrast to -lg, -lactalbumin was preent at lower concentrations.
BSA and GPRP showed almost identical molecular weights between 73 and 76 kDa,
respectively. Although the molecular weights are very similar, it is suggested that
these bands belong to BSA. This suggestion is based on the comparison between
Fig. 27 and Fig. 17, where no GPRP could be detected in the mixture of unheated
-lg and saliva unless the pH dropped below 3.0. However, only faint amounts of
BSA were identified.
The SDS-PAGE of the sediments of the mixtures of heated WPI and saliva
contained high concentrations of -lg at all observed pH-levels (lanes 4 - 9) (Fig. 28).
-Lactalbumin showed the strongest presence in the mixture at pH 4.67 (lane 6). The
-lactalbumin. Therefore, only faint
bands were detected in all other mixtures.
Both, BSA and GPRP, have similar molecular weight values. Comparing Fig. 28 and
Fig. 18 -lg and saliva) it was found that the proteins, detected at
the molecular weight of ~65 kDa, are likely to be GPRP, because GPRP were also
detected in the mixtures in Fig. 18. They were clearly detected between pH 7.26 and
4.67. Below this pH the bands were only faintly present. A high concentration of
-amylase was only measured in the mixture of heated WPI and saliva at pH 2.62.
Merely faint bands are displayed for the mixtures between pH 7.26 and 3.35.

Chapter 4: Results
88
M wk D a
1 2 3 4 5 6 7 8 9
5 0
2 5
7 5
- la c t a lb u m in
- la c t o g lo b u l in
- a m y la s e
B S A
1 5
b a s ic P R P
G P R P
Figure 27: SDS-PAGE of the sediments of the mixtures of unheated WPI and saliva in the ratio 1:1 (w/w). Lane 1- marker, lane 2- human saliva (neutral pH), lane 3- approx. 0.1% protein content of unheated WPI, lane 4- mixture of unheated WPI and saliva at pH 6.9, lane 5- mixture of unheated WPI and saliva at pH 4.3, lane 6- mixture of unheated WPI and saliva at pH 4.1, lane 7- mixture of unheated WPI and saliva at pH 3.7, lane 8- mixture of unheated WPI and saliva at pH 3.1, lane 9- mixture of unheated WPI and saliva at pH 2.7.
M wk D a
7 5
5 0
2 5
1 5
1 2 3 4 5 6 7 8 9
- la c t a lb u m in
- la c t o g lo b u l in
- a m y la s e
B S A
b a s ic P R P
G P R P
Figure 28: SDS-PAGE of the sediments of the mixtures of heated WPI and saliva in the ratio1:1(w/w). Lane 1- marker, lane 2- human saliva (neutral pH), lane 3- approx. 0.1% protein content of heated WPI, lane 4- mixture of heated WPI and saliva at pH 7.26, lane 5- mixture of heated WPI and saliva at pH 5.15, lane 6- mixture of heated WPI and saliva at pH 4.67, lane 7- mixture of heated WPI and saliva at pH4.16, lane 8- mixture of heated WPI and saliva at pH 3.35, lane 9- mixture of heated WPI and saliva at pH 2.62 .

Chapter 4: Results
89
4.4.2 Interactions between WPI (unheated/heated), which was adjusted to different pH-levels, and human saliva at readjusted pH-levels
WPI (unheated/heated) was adjusted to pH-levels 6.8, 3.6, 3.4, 3.0, 2.5 and 2.0 and
then mixed with saliva according to the ratio 1:1 (w/w). The mixing caused a pH
shifting (Table 3) in the solutions so that the pH-levels of all mixtures were
readjusted.
4.4.2.1 Hydrodynamic diameter
Unheated WPI, adjusted to different pH-levels, showed particle sizes of 130 nm
between pH 6.8 and 2.5 (Fig. 29A). The size increased to 200 nm at pH 2.0. The
pH-readjusted mixtures of unheated WPI and saliva presented a particle size of
400 nm at readjusted pH 6.8. The particle sizes exceeded 5000 nm between
readjusted pH 3.6 and 3.0, whereas at readjusted pH 2.0, they decreased again to
1450 nm. Furthermore, the mixture at readjusted pH 3.0 showed a very high
standard deviation, indicating that particle size measurements were not consistent. It
is likely that the particle size is smaller than 5000 nm but larger than 2500 nm.
Heated WPI was adjusted to different pH-levels and showed particle sizes between
200 - 300 nm for the entire pH range (Fig. 29B). At pH 6.8, a particle size of 50 nm
was measured for the pH readjusted mixtures of heated WPI and saliva, while the
sizes exceeded 5000 nm at pH 3.6 and 3.4. However, at pH 3.0, the pH-readjusted
mixture displayed a particle size of only ~330 nm. Another increase to 2000 and
1500 nm respectively was measured at pH 2.5 and 2.0.
Unheated and heated WPI, adjusted to different pH-levels, showed similar particle
sizes ranging from 100 to 300 nm. The pH-readjusted mixtures of unheated/heated
WPI and saliva presented particle sizes of over 5000 nm at readjusted pH 3.6 and
3.4. Additionally, at readjusted pH 3.0, the particle size of unheated WPI mixed with
saliva exceeded 5000 nm. In contrast, the pH-readjusted mixture of heated WPI and
saliva only displayed a very small particle size at this pH. Particle sizes in both
mixtures decreased as pH-levels decreased. However, compared to the
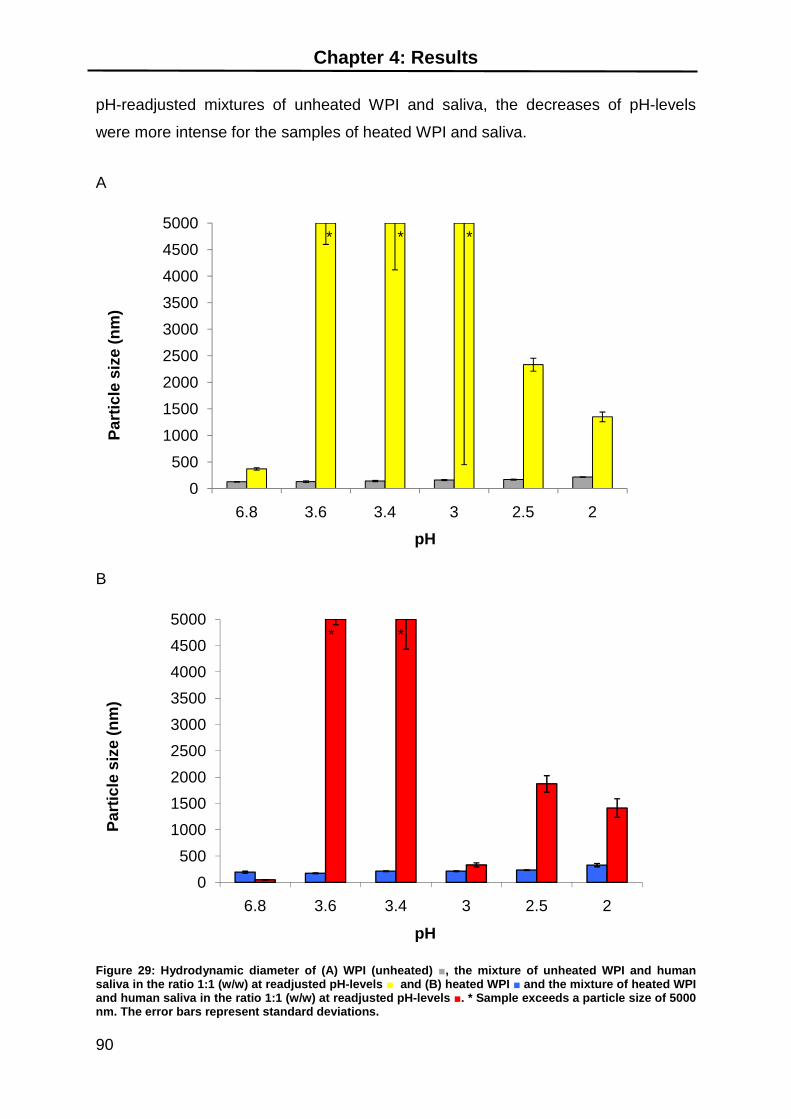
Chapter 4: Results
90
pH-readjusted mixtures of unheated WPI and saliva, the decreases of pH-levels
were more intense for the samples of heated WPI and saliva.
A
B
Figure 29: Hydrodynamic diameter of (A) WPI (unheated) , the mixture of unheated WPI and human saliva in the ratio 1:1 (w/w) at readjusted pH-levels and (B) heated WPI and the mixture of heated WPI and human saliva in the ratio 1:1 (w/w) at readjusted pH-levels . * Sample exceeds a particle size of 5000 nm. The error bars represent standard deviations.
0
500
1000
1500
2000
2500
3000
3500
4000
4500
5000
6.8 3.6 3.4 3 2.5 2
Par
ticl
e si
ze (
nm
)
pH
0
500
1000
1500
2000
2500
3000
3500
4000
4500
5000
6.8 3.6 3.4 3 2.5 2
Par
ticl
e si
ze (
nm
)
pH
* **
* *

Chapter 4: Results
91
4.4.2 -Potential
Unheated WPI showed a -potential of -40 mV at pH 6.8 and above. WPI solutions,
adjusted between pH 3.6 and 2.0, displayed -potentials between 22 mV and 31 mV
(Fig. 30A). At pH 6.8, the pH-readjusted mixtures showed a -potential of -44 mV,
while positive values between 10 mV to 21 mV were measured between pH 3.6 and
2.0.
In contrast, heated WPI, adjusted to different pH-levels, showed a -potential of
-38 mV at pH 6.8 (Fig. 30B). Positive values were measured in the range of 28 mV to
33 mV between pH 3.6 and 2.0. At pH 6.8, the pH-readjusted mixtures of heated
-potential of 53 mV, whereas positive
-potentials between 20 mV and 32 mV were measured for pH-levels between 3.6
and 2.0.
Both pH-readjusted mixtures of unheated/heated WPI and saliva showed a high
-potential at pH 6 -potentials between pH-levels 3.6 to 2.0,
indicating that the sizes increased as the pH decreased. However, for the entire
range of observed pH- -potentials were measured for the
pH-readjusted mixtures of heated WPI and saliva.
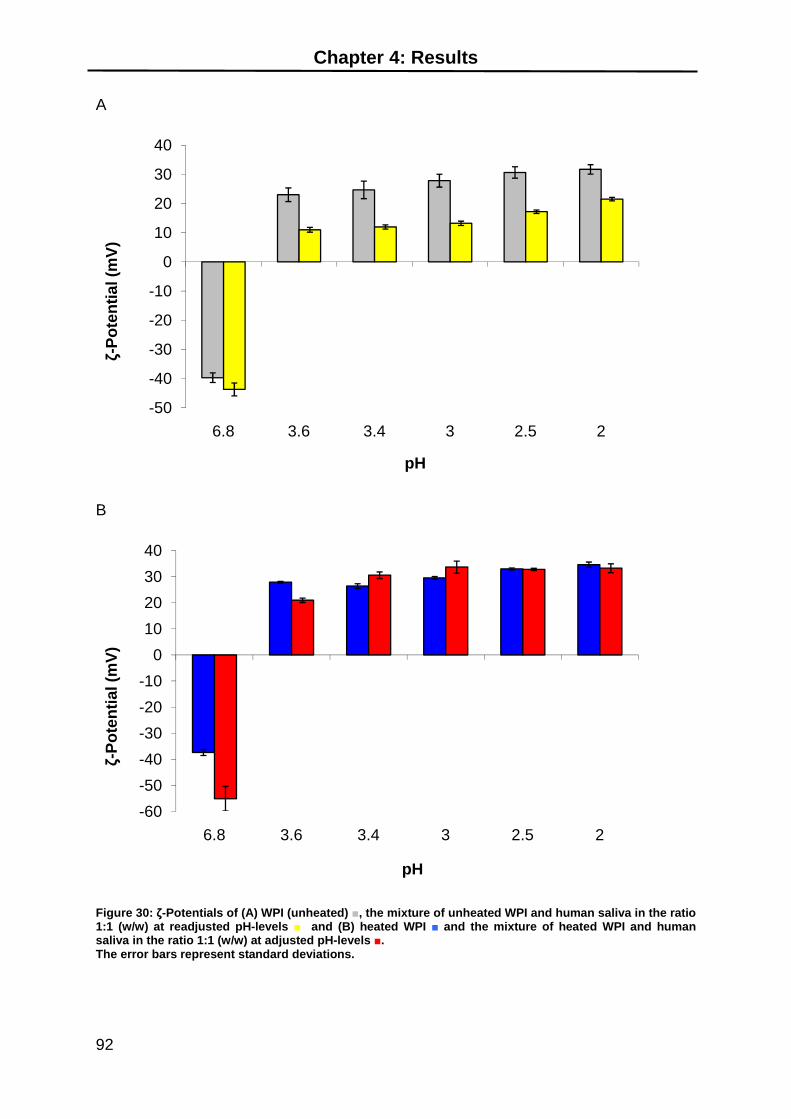
Chapter 4: Results
92
A
B
Figure 30: -Potentials of (A) WPI (unheated) , the mixture of unheated WPI and human saliva in the ratio 1:1 (w/w) at readjusted pH-levels and (B) heated WPI and the mixture of heated WPI and human saliva in the ratio 1:1 (w/w) at adjusted pH-levels .The error bars represent standard deviations.
-50
-40
-30
-20
-10
0
10
20
30
40
6.8 3.6 3.4 3 2.5 2
-Po
ten
tial
(m
V)
pH
-60
-50
-40
-30
-20
-10
0
10
20
30
40
6.8 3.6 3.4 3 2.5 2
-Po
ten
tial
(m
V)
pH

Chapter 4: Results
93
4.4.2.3 Turbidity
Unheated WPI, adjusted to different pH-levels, displayed low turbidity values over
the entire pH range (Fig. 31A).
The pH-readjusted mixtures of unheated WPI and saliva showed increasing turbidity
intensities until reaching readjusted pH 3.6, at which point the highest turbidity was
measured (Fig. 31A). The turbidity decreased as the pH of the mixtures decreased.
Heated WPI was adjusted to different pH-levels. The solutions displayed high
turbidity values at all pH-levels, especially between pH 3.4 and 2.0 (Fig. 31B). The
pH-readjusted mixtures of heated WPI and saliva showed a very low turbidity at
readjusted pH 6.8. In contrast to the mixtures at the other readjusted pH-levels, the
highest turbidities were measured at readjusted pH 3.6 and 3.4. The turbidity
decreased as pH-levels decreased, so that a similar absorbance was measured at
pH 2.0 as at pH 6.8.
Higher turbidities were measured for heated than for unheated WPI for the entire pH
range. Both pH-readjusted mixtures revealed their highest turbidities at pH 3.6 and
3.4, although the pH-readjusted mixtures of heated WPI and saliva had significantly
higher intensities in turbidity than those containing unheated WPI and saliva. Both
mixtures showed decreasing intensity in turbidity as the pH decreased.

Chapter 4: Results
94
A
B
Figure 31: Turbidity of (A) WPI (unheated) , the mixture of unheated WPI and human saliva in the ratio
1:1 (w/w) at readjusted pH-levels and (B) heated WPI and the mixture of heated WPI and human
saliva in the ratio 1:1 (w/w) at readjusted pH-levels .
00.20.40.60.8
11.21.41.61.8
22.22.42.62.8
3
6.8 3.6 3.4 3 2.5 2
Ab
sorb
ance
at
400
nm
pH
00.20.40.60.8
11.21.41.61.8
22.22.42.62.8
3
6.8 3.6 3.4 3 2.5 2
Ab
sorb
ance
at
400
nm
pH

Chapter 4: Results
95
4.4.2.4 Electrophoresis
As pH-levels decreased, the SDS-PAGE of proteins, obtained from the sediments of
the pH-readjusted mixtures of unheated WPI and saliva, showed decreasing
- - -amylase and BSA/GPRP (lanes 4 - 8) (Fig. 32). No
sediment was found in the pH-readjusted mixture at pH 6.8. Although BSA and
GPRP have similar molecular weights, it is suggested that the detected proteins at
these molecular weights are likely to be GPRP, which were also faintly detected in
the sediments of the pH- -lg and saliva (Fig. 22.).
Faint amounts of GPRP and -amylase were identified in all mixtures at all
pH-levels. As pH-levels of the mixtures decreased, the intensity in the bands of the
salivary proteins decreased. - -lactalbumin were clearly detected in all
mixtures at all readjusted pH- -lactalbumin bands
-lg.
The SDS-PAGE of the sediments of the pH-readjusted mixtures of heated WPI and
-lg and at a lower intensity bands of -lactalbumin
(lanes 4 - 9) (Fig. 33). Only faint bands of - -lactalbumin were detected for
the mixture at readjusted pH 6.8 (lane 4). The highest -lg bands was
displayed at pH 3.6 (lane 5). As pH-levels decreased, the intensities fo -lg
-lactalbumin, decreased. -amylase were
measured within the pH range of 3.6 to 2.0 (lanes 5 - 9), whereas at pH 2.5 and 2.0
their intensities increased. The highest amount of GPRP was found in the
pH-readjusted mixture at pH 3.6.
The pH-readjusted mixtures of unheated/heated WPI and saliva both showed the
-amylase for the entire pH range, although the bands were
only faintly detected. Furthermore, as pH-levels decreased, intensi -lg and
-lactalbumin decreased in both mixtures. However, the sediments of the
pH-readjusted mixtures of heated WPI and saliva only contained faint bands of
salivary proteins, whereas in the sediments of the pH-readjusted mixtures of
unheated WPI and saliva no salivary proteins could be detected.
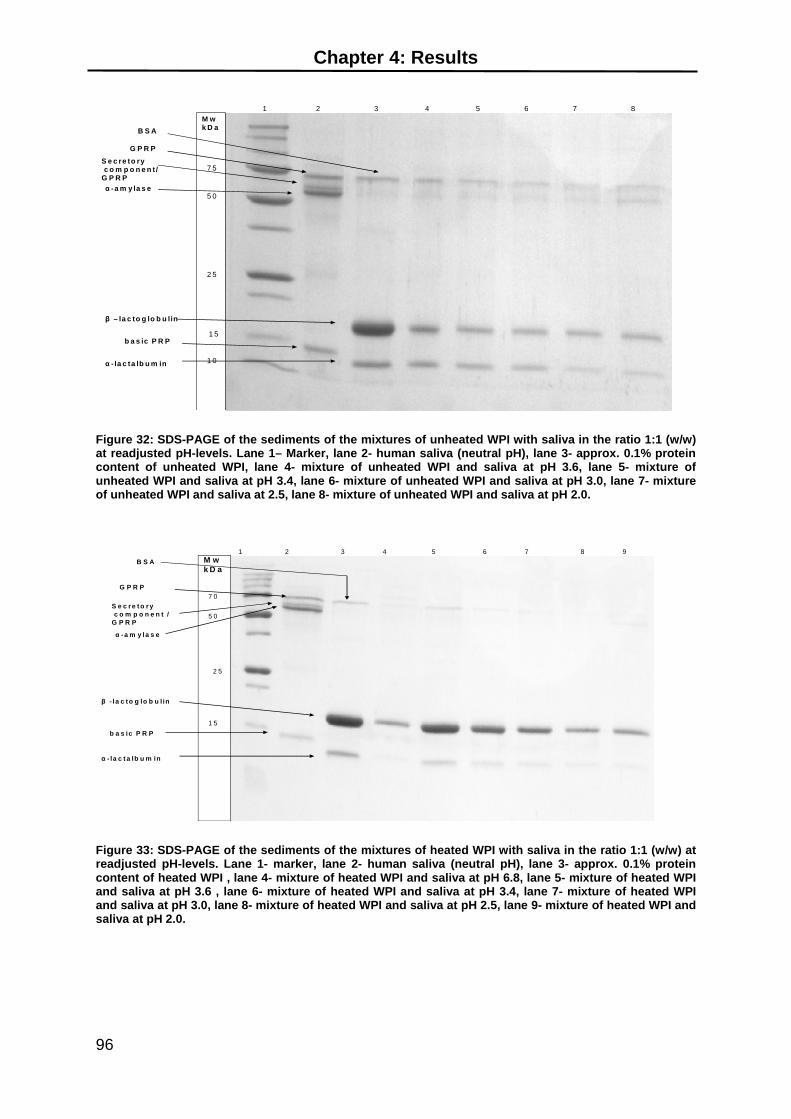
Chapter 4: Results
96
7 5
5 0
2 5
1 5
1 0
1 2 3 4 5 6 7 8
- la c ta lb u m in
– la c to g lo b u lin
-a m y la s e
S e c re to ryc o m p o n e n t /
G P R P
M wk D aB S A
b a s ic P R P
G P R P
Figure 32: SDS-PAGE of the sediments of the mixtures of unheated WPI with saliva in the ratio 1:1 (w/w)at readjusted pH-levels. Lane 1– Marker, lane 2- human saliva (neutral pH), lane 3- approx. 0.1% protein content of unheated WPI, lane 4- mixture of unheated WPI and saliva at pH 3.6, lane 5- mixture of unheated WPI and saliva at pH 3.4, lane 6- mixture of unheated WPI and saliva at pH 3.0, lane 7- mixture of unheated WPI and saliva at 2.5, lane 8- mixture of unheated WPI and saliva at pH 2.0.
1 2 3 4 5 6 7 8 9
5 0
M wk D a
7 0
2 5
1 5
- la c t a lb u m in
- la c t o g lo b u l in
- a m y la s e
S e c r e t o r yc o m p o n e n t /
G P R P
B S A
b a s ic P R P
G P R P
Figure 33: SDS-PAGE of the sediments of the mixtures of heated WPI with saliva in the ratio 1:1 (w/w) at readjusted pH-levels. Lane 1- marker, lane 2- human saliva (neutral pH), lane 3- approx. 0.1% protein content of heated WPI , lane 4- mixture of heated WPI and saliva at pH 6.8, lane 5- mixture of heated WPI and saliva at pH 3.6 , lane 6- mixture of heated WPI and saliva at pH 3.4, lane 7- mixture of heated WPI and saliva at pH 3.0, lane 8- mixture of heated WPI and saliva at pH 2.5, lane 9- mixture of heated WPI and saliva at pH 2.0.

Chapter 4: Results
97
The mixtures of unheated WPI and saliva presented significantly high particle sizes
exceeding 5000 nm (Fig. 24A) as well as high turbidity levels (Fig. 26A) between
pH 4.3 and 3.1. This indicates that aggregation/precipitation may occur in these
mixtures. One possible explanation may be that electrostatic interactions increased
particle size and turbidity. Saliva has a negative charge between pH 4.1 and 3.1,
-lg as the main component in WPI is positively charged below pH 5.1
-potentials of the mixtures of unheated WPI and saliva
displayed positive values converging close to zero between pH 4.1 and 3.1. This
indicates that particles in the mixtures did not repel to keep a distance from each
other, instead coming closer and aggregating, and thus causing the increased values
in particle size and turbidity. At pH 2.7, the mixture displayed a significantly lower
particle size as well as turbidity. This instance may also be explained by the
-lg are positively
charged at pH 3.0 and below. The SDS-PAGE of the sediments of the mixtures of
unheated WPI and saliva did not present salivary proteins, although bands of a
molecular weight of 75 kDa were detected. It is suggested that these bands belong
to -lg and saliva (Fig. 17) did
not indicate the presence of GPRP either. As no salivary proteins were detected in
the sediments of the mixtures, the high particle sizes and turbidities may be
explained by the assumption that the concentration of GPRP is too low to be
-lg and WPI with saliva. Another attempt at
explanation may state that the bands in the mixtures of unheated WPI and saliva
belong to GPRP, because the molecular weights are only estimated and require
more detailed determination to be able to obtain an exact value.
At pH 5.1, the mixtures of heated WPI and saliva showed a high particle size
exceeding 5000 nm as well as high turbidity levels, which is probably due to the
-lg at this pH. However, significantly high particle sizes were also
measured for the mixtures below pH 5.1, while turbidities only reached significant
high values between pH 5.1 and 4.16. The SDS-PAGE of the sediments of the
mixtures of heated WPI and saliva maintained the presence of GPRP at all
pH- -Amylase could not be identified at pH 7.26 (lane 4) but at lower
pH- -amylase and GPRP were
Chapter 4: Results
98
detected at pH 4.16, which might be the reason why the particle size at this pH was
- -lactalbumin,
which might explain the high turbidity values at pH 4.16. However, the highest
amounts of salivary proteins were detected in the sediment of the mixture of
unheated WPI and saliva at pH 2.62. This instance indicates that saliva precipitates
at this pH, as the interaction between WPI and saliva is assumed to be low because
their positive charges are not attracted to each other and the low particle size and
turbidity.
The pH-readjusted mixtures of both unheated/heated WPI and saliva presented
significantly high particle sizes exceeding 5000 nm at readjusted pH 3.6 and 3.4
(Fig. 29A and B). Additionally, the pH-readjusted mixture of unheated WPI and saliva
exceeded the particle size of 5000 nm at pH 3.0 (Fig. 29A). However, the large error
bar for the pH-readjusted mixture of unheated WPI and saliva at pH 3.0 may indicate
that only a few particles have such a high particle size, whereas most of the particles
are likely to have a smaller size but still above 2500 nm. High particle sizes were
also measured in the non-readjusted mixtures when unheated WPI, adjusted to
pH 3.6, 3.4 and 3.0, was mixed with saliva. The mixtures had final pH-values ranging
from 4.3 to 3.0 and indicating that at these pH-levels aggregation occurred in the
mixtures. The mixtures of pH-readjusted heated WPI with saliva as well as the
non-readjusted mixtures of heated WPI and saliva showed high particle sizes
between pH 5.1 and 2.0, except for the mixtures at pH 4.1 and 3.0. Although particle
sizes of the pH-readjusted and the non-readjusted mixtures increased significantly,
their exact values did not correspond to each other at the same pH-levels. However,
at pH 4.16, the mixture of heated WPI (at pH 3.0) and saliva featured a significantly
low particle size as did the pH-readjusted mixture of heated WPI and saliva at
pH 3.0. Both particle sizes were expected to be higher. The pH-readjusted mixtures
of unheated/heated WPI and saliva displayed significantly higher turbidities at
readjusted pH-levels 3.6 and 3.4 (Fig. 31A and B), whereas the pH-readjusted
mixtures of heated WPI and saliva were more turbid due to the denaturation of WPI
during the heat treatment.

Chapter 4: Results
99
The SDS-PAGE of the sediments of the pH-readjusted mixtures of unheated WPI
-amylase and GPRP until reaching
pH 2.0, at which point these salivary proteins increased in quantity. This indicates
that the salivary proteins may precipitate at pH 2.0, which is supported by the
measured increased particle size for saliva at pH 2.0 (Fig.1). The particle sizes and
turbidity values were significantly lower for the mixture of unheated WPI and saliva at
readjusted pH 2.0. Furthermore, it is assumed that not BSA but GPRP are contained
in the sediments, since the pH- -lg and saliva (Fig. 22) also
displayed the presence of GPRP. Between pH 3.6 and 3.0, significantly higher
-amylase and GPRP were detected in the sediments of the pH-
readjusted mixtures of unheated WPI and saliva, which explains the significantly high
particle sizes as well as the high turbidities.
In the sediments of pH-readjusted mixtures of heated WPI and saliva faint amounts
-amylase were found (Fig. 33), as was the case in the mixtures of
-lg and saliva. Moreover, they both contained significantly
higher amounts of the salivary proteins at readjusted pH-level 2.0 when compared to
the other pH-readjusted mixtures. This also indicates that salivary protein may be
precipitated, although saliva and heated WPI on their own did not show precipitation
at pH 2.0.

Chapter 4: Results
100
4.5 Mixtures of heated WPI and saliva collected from the mouth
Heated WPI-solutions (5% w/w)were adjusted to different pH-levels (shown in Table
4 below) and consumed by 5 participants. These mixtures of WPI and saliva were
collected after swirling around in the mouth for at least 10 seconds. The pH shifting
of the mixtures, displayed in the right column of the table, slightly converged towards
neutral pH.
Table 4: The pH changes of heated 5% (w/w) WPI solutions, adjusted to different pH-levels, when mixed with human saliva in the mouth (ratio unknown).
WPI (heated)-solutions, adjusted pH-levels
shifted pH of WPI (heated)-saliva-mixture (ratio unknown)
6.8 6.8
3.6 4.0
3.4 3.8
3.0 3.5
2.5 3.2
2.0 2.4
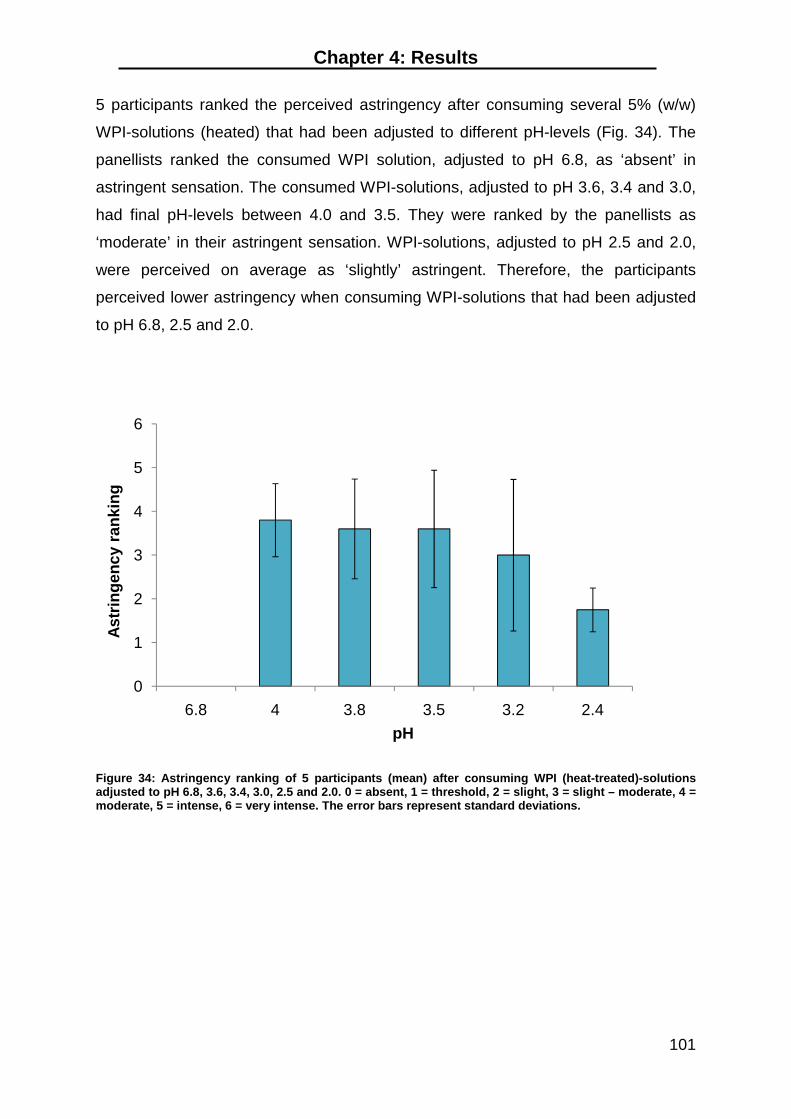
Chapter 4: Results
101
5 participants ranked the perceived astringency after consuming several 5% (w/w)
WPI-solutions (heated) that had been adjusted to different pH-levels (Fig. 34). The
panellists ranked the consumed WPI solution, adjusted to pH 6.8, as ‘absent’ in
astringent sensation. The consumed WPI-solutions, adjusted to pH 3.6, 3.4 and 3.0,
had final pH-levels between 4.0 and 3.5. They were ranked by the panellists as
‘moderate’ in their astringent sensation. WPI-solutions, adjusted to pH 2.5 and 2.0,
were perceived on average as ‘slightly’ astringent. Therefore, the participants
perceived lower astringency when consuming WPI-solutions that had been adjusted
to pH 6.8, 2.5 and 2.0.
Figure 34: Astringency ranking of 5 participants (mean) after consuming WPI (heat-treated)-solutions adjusted to pH 6.8, 3.6, 3.4, 3.0, 2.5 and 2.0. 0 = absent, 1 = threshold, 2 = slight, 3 = slight – moderate, 4 = moderate, 5 = intense, 6 = very intense. The error bars represent standard deviations.
0
1
2
3
4
5
6
6.8 4 3.8 3.5 3.2 2.4
Ast
rin
gen
cy r
anki
ng
pH

Chapter 4: Results
102
Heated WPI, adjusted to pH 3.6, in the mixture with saliva featured a particle size of
about 1000 nm at a final pH of 4.0 (Fig. 35). The mixtures of heated WPI and saliva
showed particle sizes below 500 nm at neutral pH (~100 nm) as well as below
pH 4.0 (~250 nm).
Figure 35: Hydrodynamic diameter of 5 participants (mean) consuming WPI-solutions (heat-treated) at
different pH-levels (shown in table 4). The error bars represent standard deviations.
0
500
1000
1500
6.8 4 3.8 3.5 3.2 2.4
Par
ticl
e si
ze (
nm
)
pH

Chapter 4: Results
103
-potential of
-28 mV (Fig. 36), while positive -potentials of ~30 mV were measured for the
consumed WPI-solutions, which had final pH-levels below pH 4.0.
Figure 36: -Potentials of 5 individuals (mean) consuming WPI-solutions (heat-treated) adjusted to different pH-levels (shown in table 4). The error bars represent standard deviations.
-40
-30
-20
-10
0
10
20
30
40
6.8 4 3.8 3.5 3.2 2.4
-Po
ten
tial
(m
V)
pH

Chapter 4: Results
104
The highest turbidity for the mixture of WPI (adjusted to pH 3.6) and saliva occurred
at a final pH of 4.0 (Fig. 37). The mixture of heated WPI and saliva showed a
significantly high turbidity at pH 3.8, while below pH 3.5, the turbidity turned
significantly lower.
Figure 37: Turbidity of 5 individuals (mean) consuming heated WPI-solutions adjusted to different pH-levels (shown in table 4). The error bars represent standard deviations.
00.20.40.60.8
11.21.41.61.8
22.22.42.62.8
3
6.8 4 3.8 3.5 3.2 2.4
Ab
sorb
ance
at
400
nm
pH

Chapter 4: Results
105
The SDS-PAGE of the sediments of the mixtures of heated WPI and saliva (ratio
unknown) of one participant is displayed in Fig. 38. No sediment was developed for
the mixture at pH 6.8, whereas faint bands of mucin were detected at pH 4.0
(lane 4). However, all mixtures clearly featured the presence of basic PRP, GPRP,
secretory component, -amylase. As pH-levels of the mixtures decreased,
the intensities of salivary proteins, such as GPRP, secretory component and
-amylase, decreased, while the amount of basic PRPs increased. Moreover, the
mixtures showed a strong presence of - -lactalbumin at all observed
pH-levels. The quant -lg in the mixtures did not significantly change at
different pH.
1 2 3 4 5 6 7 8MwkDa
75
50
25
15basic PRP
-lactalbumin
-lactoglobulin
BSA
GPRP
-amylase
secretorycomp. /GPRP
Mucin
Figure 38: SDS-PAGE of the sediments of the mixtures of heated WPI and saliva of 1 participant. Lane 1 –marker, lane 2 – saliva, lane 3 – approx. 0.1% protein content of heated WPI, lane 4- mixture of heated WPI and saliva at pH 4.0, lane 5- mixture of heated WPI and saliva at pH 3.8, lane 6- mixture of heated WPI and saliva at pH 3.5, lane 7- mixture of heated WPI and saliva at pH 3.2, lane 8- mixture of heated WPI and saliva at pH 2.4.

Chapter 4: Results
106
The second aim of this study was to determine the interaction of WPI and saliva in a
mixture, for which the ratio of the two components was unknown. After mixing 5%
(w/w) WPI-solutions (adjusted to different pH-levels) with saliva in the mouth (ratio
unknown), the pH did not shift as much as when WPI was mixed with saliva in the
ratio 1:1 (table 3). This is due to the higher ratio of WPI compared to saliva in the
mouth.
The participants were asked to rank the intensity of the perceived astringency when
consuming the WPI-solutions. The highest astringency was perceived at pH 4.0 and
ranked on average as ‘slight – moderate’ (Fig. 34). The reason for the high standard
deviations might be the participants’ lack of experience in astringent sensations, so
that astringency may have been confused with sourness/bitterness. However, all
participants received training to enhance their sensitivity to detect the astringent
sensation. Another, more likely reason might be the individuals’ varying flow rate of
saliva because the participants had a different amount of saliva in their mouths. The
flow rate of saliva was not measured in this study, but it is generally accepted that
participants with higher flow rates perceive astringency in a lower intensity than
participants with lower flow rates (Humphrey and Williams, 2001).
At pH 4.0, the mixtures of the participants of heated WPI and saliva featured an
average particle size of ~1000 nm (Fig. 35). However, heated WPI and saliva, mixed
in the ratio 1:1, displayed a particle size of ~500 nm at a similar pH, where WPI was
adjusted to pH 3.0 prior to mixing with saliva (Fig. 24B). The mixture of the unknown
ratio consisted of the heated WPI solution, which was adjusted to pH 3.6 prior to
mixing. Furthermore, the mixture of heated WPI, adjusted to pH 3.6, and saliva
(ratio 1:1) showed their highest particle size at a final pH of 5.15. The significantly
high particle size may indicate aggregation/precipitation. Both mixtures, either in an
unknown ratio or according to ratio 1:1, presented their highest particle sizes, when
WPI (adjusted to pH 3.6) was mixed with human saliva, indicating that this
interaction caused the most aggregation/precipitation. This suggestion is supported
by the significantly high turbidities for both types of mixtures, when heated WPI was
adjusted to pH 3.6 and then mixed with saliva, regardless of the final pH
(Fig. 26B and 37). The second highest particle size and turbidity was measured

Chapter 4: Results
107
when heated WPI, adjusted to pH 3.4, was mixed with saliva, either in an unknown
ratio or according to ratio 1:1, which also indicates that the interaction caused
aggregation/precipitation.
The electrophoretogram of the sediments of the mixtures of heated WPI and saliva
(unknown ratio) revealed the presence of -amylase and glycosylated
PRP in all mixtures at all observed pH-levels. Additionally, mucin bands were faintly
detected at pH 4.03 (lane 4) (Fig. 38). No sediment was provided for the mixture of
heated WPI (adjusted to pH 6.8) and saliva, which had a final pH of 6.8. The
mixtures of heated WPI and saliva (ratio 1:1) contained neither basic PRP nor mucin,
which is probably due to the centrifugation of saliva prior to usage, whereas the
mixtures of heated WPI and saliva (unknown ratio) were directly taken from the
mouth.
The mixtures of heated WPI, which were consumed by the participants, contained
7% sucrose to enhance a pleasant taste, especially at acidic pH-levels. Moreover,
commercial WPI sport beverages also contain sucrose. Several authors have
reported that sweeteners may interfere with the binding of the astringent compound
and saliva and could therefore mask the perceived astringency (Brannan et al.,
2001, Green, 1993, Ishikawa and Noble, 1995, Lymann and Green, 1990). However,
the measurements of particle sizes and turbidities clearly showed that sucrose had
no impact on the interaction between WPI and salivary proteins at pH 4.0.
Furthermore, participants ranked the mixture at pH 4.0 as ‘slight – moderate’, which
indicates that sugar had no influence in the astringent sensation for the tasted
WPI-solutions.

Chapter 4: Results
108
4.6 Proteins remaining on the tongue following the
consumption of heated WPI-solutions, which were adjusted to
different pH-levels
Following the consumption of the WPI-solutions, the mouth was rinsed twice with
water and the remaining particle sizes of the consumed material on the tongue were
measured. Table 5 shows the measured pH-levels on the tongue after
WPI-solutions, adjusted to different pH-levels, had been consumed. Beforehand, the
pH in the mouth was measured as neutral pH. When WPI-solutions (adjusted
between pH 6.8 and 2.0 prior to consumption) were consumed, remaining pH-levels
on the tongue were measured between 6.8 and 6.2. After consuming WPI-solutions,
adjusted to pH 2.5 and 2.0, the remaining pH was around 5.7.
Table 5: pH change on the tongue after consuming 5% (w/w) WPI solutions (heated).The ratio of saliva and WPI is unknown).
5% (w/w) WPI-solutions(heated), adjusted pH-levels
shifted pH in the mouth after consuming 5% (w/w) WPI–solutions(heated) followed by two mouth rinses
control 6.8
6.8 6.6
3.6 6.1
3.4 6.2
3.0 6.2
2.5 5.7
2.0 5.8

Chapter 4: Results
109
The particle sizes of clean saliva on the tongue in the control reached almost 2500
nm (Fig. 39). The particle sizes of the remaining particles of the remaining materials
on the tongue after consuming WPI-solutions showed an up and down regardless of
the pH of the consumed WPI-solution. High standard deviations for all samples
showed that the measurements were not consistent. The second highest particle
sizes of 2000 nm were measured at pH 6.16 and 5.72, while the lowest particle size
of 600 nm occurred at pH 6.2 after the WPI solution was adjusted to pH 3.0.
Figure 39: Particle sizes of the remaining material on the tongue of 5 participants (mean) after consuming5% (w/w) WPI-solutions (heat-treated), which were adjusted to particular pH-values (table 5). The error bars represent standard deviations.
0
500
1000
1500
2000
2500
6.8 (control)
6.6 6.1 6.2 6.2 5.7 5.8
Par
ticl
e si
ze (
nm
)
pH

Chapter 4: Results
110
Before the consumption of any WPI-solutions -potential showed a negative
value of -25 mV (control) -potentials of the remaining material on the
tongue were all negative and varied from -23 to -15 mV after consuming
WPI- -potentials decreased as the
pH of the consumed mixtures decreased.
Figure 40: -Potentials of the remaining material on the tongue of 5 participants (mean) after consuming5% (w/w) WPI-solutions (heat-treated), which were adjusted to particular pH-values (table 5). The error bars represent standard deviations.
-30
-20
-10
0
6.8 (control)
6.6 6.1 6.2 6.2 5.7 5.8
-Po
ten
tial
(m
V)
pH

Chapter 4: Results
111
Before and after consuming 5% (w/w) WPI-solutions (heated), which had been
adjusted to different pH-levels, as well as after rinsing the mouth with water, the pH
in the mouth remained within the range of 6.8 and 5.7. The pH-level of about 5.7 was
measured after consuming the WPI-solutions at pH 2.5 and 2.0. This indicates that
the two rinses did not remove the acidity of the WPI-solutions from the tongue.
Particle size measurements of the remaining material on the tongue varied
significantly within the range of the observed pH-levels. Especially the sample of the
clean tongue (control), prior to consuming any WPI-solutions, displayed a very high
particle size. Although the participants were asked not to eat or drink two hours
before the experiment, it is possible that astringent particles may remain up to eight
hours on the tongue (Siebert and Chassy, 2003). Therefore, previously consumed
food might cause such high particle sizes even before any WPI-solutions were
consumed.
High standard deviations of the particle size measurements indicated that the
removal of the material from the tongue is individually different and takes time. The
-potentials featured high negative values after consuming all WPI-solutions
(Fig. 40), indicating that after rinsing, saliva/water are the major present liquids in the
mouth.
Turbidity measurements could not be carried out because the sample amount of all
mixtures was too small.

112

Chapter 5: Discussion
113
Chapter 5: Discussion
5.1 Lactoferrin
Lactoferrin-solutions (unheated and heated), which were adjusted to different
pH-levels ranging from neutral to acidic, were perceived as strong astringent in an
informal sensory test between pH 7.0 and 2.0. That was also reported by
Vardhanabhuti et al. (2010) and Kelly (2009). Therefore, it was expected that
salivary proteins would be identified in the sediments, which would indicate an
interaction between these two proteins. The mixtures of unheated lactoferrin and
saliva did not reveal significantly higher particle sizes at acidic pH (below pH 5.6),
whereas the mixtures of heated lactoferrin and saliva showed significantly higher
values in terms of particle size at pH 3.2, while high turbidity values occurred at
neutral pH. The pH-readjusted mixtures of unheated/heated lactoferrin and saliva
presented significantly increased particle sizes and turbidities below pH 3.0, while
the pH-readjusted mixtures of heated lactoferrin and saliva also showed high
turbidities at neutral pH. The sediments of the pH-readjusted mixtures of heated
-amylase was
detected in higher concentrations than GPRP. In contrast, salivary proteins were not
identified in the sediments of the mixtures of unheated or heated lactoferrin and
saliva, which had not been pH-readjusted. Therefore, the addition of acid may have
caused the precipitat -amylase, which increased the particle sizes at acidic pH
and thus could be related to the intensity in perceived astringency. However, the
determinations of the sediments of the mixtures of unheated/heated lactoferrin and
saliva in this study did not reveal the presence of salivary proteins, despite findings
of significantly high particle sizes in the mixtures of heated lactoferrin and saliva at
pH 7.4 and 3.2, as well as turbidity measurements between pH 8.3 and 7.3.
Therefore, the measurements of particle size, turbidity and electrophoresis of the
mixtures of lactoferrin (unheated/heated) and saliva could not be related to the
astringent sensation, which occurs when lactoferrin is in contact with human saliva. It
is suggested that other interaction processes may cause the astringent sensation on
the tongue.
114
5.2 -Lactoglobulin
Whey protein has shown to be astringent in a certain pH-range (Beecher et al., 2008,
Kelly, 2009, Lee and Vickers, 2008, Sano et al., 2005, Vardhanabhuti et al., 2010).
-lg, which is the main component of the whey,
would be astringent as well. The mixtures of -lg (pH 2.5) and
saliva showed an increase in particle size and turbidity below final pH 3.6. The
-lg and saliva contained high concentrations
-amylase and lower concentrations of GPRP at pH 3.4 and 2.8. Between pH 5.6
and 3.4, very faint amounts of salivary proteins were detected in these mixtures.
However, the mixture of unheated -lg (pH 2.0) and saliva had a final pH of 2.8, at
which point the particle size was measured at the significantly highest peak, whereas
the turbidity measurement was not significantly high. Instead, the pH-readjusted
-lg and saliva showed similar turbidities below pH 3.6,
regardless of the differences in particle size.
Furthermore, the pH- -lg and saliva showed a similar
behaviour in particle size and turbidity as the non- -lg
and saliva. Therefore, the highest particle size was identified at readjusted pH 2.0,
whereas the highest turbidity was measured at readjusted pH 3.4. The sediments of
the pH-readjusted mixtures of unheated/he -lg and saliva contained the highest
-amylase and lower concentrations of GPRP at readjusted pH 2.5
and 2.0, which corresponds with the behaviour of the non-readjusted mixtures. This
indicates that acidity causes the precipitation o -amylase, especially in the mixtures
-lg which is likely to cause astringency.
Concluding to the findings for the mixtures of -lg and saliva, it seems that particle
sizes, turbidity development and concentrations of salivary proteins are not related to
-lg.

Chapter 5: Discussion
115
5.3 WPI
Several researchers have reported that the development of astringency is dependent
on the pH of the astringent solution (Beecher et al., 2008, Lee and Vickers, 2008,
Siebert and Chassy, 2003, Vardhanabhuti et al., 2010). Therefore, it was expected
that aggregation/precipitations of the mixtures of whey proteins and saliva would be
significantly higher at particular pH-values. The whey proteins and human saliva
were adjusted to different pH-levels to determine if aggregation/precipitation of the
proteins would exist at any observed pH-level. Furthermore, the mixtures of whey
proteins and saliva were pH-readjusted to determine a dependence on pH to protein
aggregation/precipitation.
WPI at low pH is known to cause astringency (Beecher et al., 2008, Kelly, 2009,
Sano et al., 2005, Vardhanabhuti et al., 2010) when exposed to human saliva. The
mixtures of unheated WPI and saliva showed significantly high particles sizes
between pH 4.3 and 3.1, but decreasing particle sizes below pH 3.0. The same
applies to pH-readjusted mixtures of unheated WPI and saliva. Both types of
mixtures show significantly high turbidity values between pH 4.3 and 3.4, indicating
that the additional acid for the pH-readjustment did not cause an increase in particle
size and/or turbidity. However, the increases in particle sizes and turbidities were
related to the pH-level, to which WPI was adjusted prior to mixing with saliva. The
same may be stated regarding the mixtures of heated WPI and saliva as well as the
pH-readjusted mixtures of heated WPI and saliva. There, the particle sizes and
turbidity developments were not related to the final pH but to the pH, to which WPI
was adjusted prior to mixing with saliva. Moreover, decreasing pH-levels caused a
decrease in particle size and turbidity in both these types of mixtures. No salivary
proteins were detected in the sediments of the mixtures of unheated WPI and saliva.
However, in the pH-readjusted mixtures of unheated WPI and saliva faint bands of
-amylase were detected, indicating that salivary proteins precipitate
under additional acid. However, the sediments of the mixtures of heated WPI and
saliva as well as the pH-readjusted mixtures of heated WPI and saliva contained
both GPRP an -amylase at all pH-levels. They were higher in concentration below
pH 3.0. This indicates that not only additional acid for pH-readjustments may cause

116
precipitation of salivary proteins but also the low pH of WPI prior to mixing with
saliva.
The mixtures of heated WPI and saliva in an unknown ratio clearly showed that the
perceived astringent sensation decreased under acidic conditions. Furthermore, the
highest particle sizes and turbidity values were measured around final pH 4.0 and
decreased significantly below pH 3.8. The sediments of the mixtures of heated WPI
and saliva collected from the mouth contained increasing concentrations of basic
PRP as pH- -amylase
decreased under acidic conditions. This indicates that basic PRP precipitate under
acidic conditions, which is likely to cause astringency. After consuming heated WPI
solutions, adjusted to pH 2.5 and 2.0, and rinsing the mouth with water twice, the pH
in the mouth was measured at around 5.7. In contrast, following the consumption of
WPI solutions, adjusted to pH-levels between 6.8 and 3.0, and rinsing the mouth with
water twice, the pH in the mouth was measured between 6.8 and 6.1. Therefore, it
may be stated that the acidity of highly acidic WPI solutions remained longer in the
mouth than WPI-solutions of lower acidity.
Due to the denaturation of the proteins, the heat- -lg and
WPI on their own displayed high particle sizes as well as turbidities at all pH levels.
Therefore, despite the higher values for particle sizes and turbidities in the mixtures
of heated -lg and saliva, it cannot be concluded that the heat -treatment
would increase the astringent sensation. However, when compared to the mixtures
of unheated WPI and saliva, the mixtures of heated WPI and saliva showed higher
particle sizes and turbidity values at all observed pH-levels. Except for the mixtures
-lg and saliva as well as the mixtures of
heated WPI and saliva featured higher amounts of salivary proteins in the sediments
of the mixtures at all pH-levels.
-lg show higher particle sizes and
turbidity developments at low pH, where also salivary proteins were found in the
-lg alone

Chapter 5: Discussion
117
aggregated/precipitated at any of the observed pH-levels. It seems that the presence
of either saliva or one of the whey proteins may cause aggregation/precipitation,
which could be also perceived as astringent sensation.

Chapter 6: General discussion
118
Chapter 6: General discussion
Lactoferrin is known to be astringent at neutral pH as well as at acidic pH (Beecher
et al., 2008, Vardhanabhuti et al., 2010). Lactoferrin is positively charged below
pH 8.0, whereas saliva has a negative charge until reaching pH 3.0. It was assumed
that negatively charged saliva would interact with positively charged lactoferrin. This
electrostatic interaction was also reported by Vingerhoeds, 2009. Similarly,
Vardhanabuti et al. (2010) and Kelly et al. (2009) found salivary proteins in the
sediments of the mixture of unheated lactoferrin and saliva, concluding that
interactions between lactoferrin and saliva occurred. However, in this study no
salivary proteins (indicating interactions) could be found between unheated
lactoferrin and saliva. Therefore, it is suggested that other than electrostatic
interactions cause the astringent sensation of lactoferrin.
The addition of acid had no influence on l -lg or WPI, either unheated or
heated, whereas human saliva displayed significantly higher particle sizes between
pH 3.6 and 2.0.
-lg and saliva revealed their highest turbidity at pH 3.4 and
2.8, whereas the pH-readjus -lg featured turbidities in
similar intensities below pH 3.6. The highest turbidities of the mixtures of unheated
WPI and saliva, either pH-readjusted or not, were detected between pH 4.3 and 3.0,
while below pH 3.0, the samples were significantly less turbid. Turbidities of the
-lg and saliva as well as the mixtures of heated WPI and saliva,
either pH-readjusted nor not, reached their highest peak between pH 5.1 and 3.4.
However, the mixtures of heated WPI and saliva in an unknown ratio clearly showed
that astringency increased between pH 4.0 and 3.8. This indicates that between pH
5.1 and 3.4, the perceived astringent sensation is the highest when consuming
-lg. Sano et al. (2005), Beecher et al. (2008) and Vardhanabhuti et al. (2010)
found that the mixture of acid WPI (pH 3.5) and saliva resulted in pH ~5.0. They
suggested that either the whey proteins and/or saliva precipitate due to the pH
change in the mouth when consuming acidic whey protein solutions, or, the

Chapter 6: General discussion
119
interactions between saliva and an astringent, such whey proteins, may be due to
the electrostatic interactions.
This study has shown that, at pH 5.1 and 2.6, salivary proteins were detected in the
mixtures of WPI (unheated/heated) and saliva, indicating interactions between saliva
and WPI. Furthermore, the band intensity -amylase increased as pH-levels
decreased, while GPRP decreased at the same time. Therefore, it is suggested that
saliva precipitates under acidic conditions of WPI-solutions, although saliva itself did
not show any precipitation between pH 6.8 and 2.0.The other possible mechanism
could be that negatively charged saliva interacts with positively charged WPI (below
pH 5.1), causing electrostatic interactions and resulting in astringent sensation.
Human saliva is negatively charged between pH-levels 7.0 and 3.0. Below pH 3.0,
the charge of saliva is positive. -Lg and WPI are positively charged below pH 5.1.
This suggestion is supported by increased particle sizes and turbidity developments
between pH 5.1 and 3.0.
Below pH 3.0, the interactions were of much lower intensity, although still greater
than at neutral pH. Beecher et al. (2008) also reported that astringency and turbidity
values were the highest when WPI (pH 3.5) was interacting with saliva. Moreover, he
reported that astringency decreased when WPI was adjusted to pH 2.6. However,
astringency at this pH was still greater than for the WPI solution adjusted to pH 6.8.
Lactoferrin is positively charged below pH 7.0 and is likely to also interact with saliva.
Vandhanabhuti et al. (2010) described the same phenomenon of increasing
astringency as pH-levels decreased until the pH was below 3.0. The electrostatic
interactions between negatively charged saliva and positively charged proteins were
reported by Rodriguez et al. (2003), who revealed that chitosan at acidic pH (positive
charged) interacted stronger with saliva when adjusted to pH-levels between 4.6 and
3.5 than at neutral pH.
Vardhanabhuti et al. (2010) reported that salivary proteins were detected in the
sediments of the mixture of unheated lactoferrin and saliva. This study could not
confirm that any salivary proteins are contained in the sediments of the mixture of

Chapter 6: General discussion
120
unheated lactoferrin and saliva, although informal sensory tests have shown that
unheated lactoferrin is as astringent. Additionally, the mixtures provided only little or
no sediment at different pH-levels. One reason might be that the concentrations of
salivary proteins were too low to be detected in the sediments of the mixtures.
Another explanation might be that other than electrostatic interactions are involved in
the astringent sensation. However, the sediments of the mixtures of heated
lactoferrin and saliva contained salivary proteins at all observed pH-levels.
Contrary to Vardhanabhuti et al. (2010), who reported that mucins were contained in
-amylase, which were not detected by
Vardhananbhuti et al. (2010). However, several studies have shown that GPRP are
directly involved in astringency of polyphenolic solutions (Bacon and Rhodes, 2000,
Dinnella et al., 2010, Gambuti et al., 2006, Sarni-Manchado et al., 1999). This study
illustrates that GPRP were mainly involved in the interactions between whey proteins
and sal -amylase was mostly detected in very acidic solutions,
indicating the precipitation below pH 3.0. The saliva used in this study was
centrifuged prior to usage, in order to remove cellular debris bacteria. Mucins are
known to be bound to the bacteria so that they were removed by centrifugation as
well.
Vandhanabhuti et al. (2010) found that the strongest interaction between saliva and
- -lg was adjusted to pH 3.5. The mixture had a final
pH of ~5.3. However, this study revealed the strongest interaction when unheated
-lg was adjusted to pH 2.5, which caused a final pH of 3.4. Similarly, the mixture of
pH- -lg and saliva also showed the greatest
interaction at pH 3.4.
Lee and Vickers (2008) reported that astringency in acidic WPI solutions were
exclusively caused by acidity (Lee and Vickers, 2008). This study discovered that
-lg nor WPI precipitated at acidic pH. Although, the mixtures
-lg and saliva featured significantly higher particle sizes at acidic pH,
and salivary proteins were found in higher concentrations in the sediments of the
mixtures, they did not show higher turbidities at acidic pH. Furthermore, the mixtures
of WPI and saliva clearly indicated that the interactions between saliva and WPI

Chapter 6: General discussion
121
were reduced at acidic pH. However, the pH-readjusted mixtures of lactoferrin/
-lg/WPI and saliva revealed that the interactions were neither necessarily higher nor
lower below pH 3.0. Adding acid to the mixtures may cause precipitation of salivary
proteins (Siebert and Chassy, 2003), which were also found in higher concentrations
in the sediments of all readjusted mixtures. Therefore, acidity may increase the
astringent sensation, but is not exclusively responsible for the astringent sensation.

Chapter 6: Conclusions
122
Chapter 7: Conclusions
This st -lg
and WPI) and human saliva, which could be related to the astringent sensation. The
proteins were mixed with human saliva in the same ratio (w/w). Particle size as well
as turbidity measurements were performed to provide information on particle
aggregation. -potential measurements were performed, which also may indicate
possible aggregations of the proteins. The mixtures of lactoferrin and saliva did not
show an interaction, wherea -lg and saliva did show increases in
particle sizes and turbidity, indicating protein aggregation. However, the strongest
interaction occurred between WPI and saliva, because the mixtures show the
highest particle sizes, as well as turbidity values. Electrophoresis was carried out on
the sediments of the mixtures and showed that mainly GPRP were involved in the
- -amylase amounts
were detected. Additionally, higher amounts of -amylase were detected in the
electrophoresis profile of the pH-readjusted mixtures of the proteins and saliva.
Furthermore, the mixtures of heated WPI and saliva (unknown ratio) showed the
presence of mucin and basic PRP.
Higher particle sizes and turbidity developments were found when negatively
charged saliva was mixed with opposite charged -lg/WPI. That could be related to
the astringent sensation. Therefore, it is suggested that the astringency in
WPI-beverages is caused by electrostatic interactions.

References
123
References
Abe, H., H. Saito, H. Miyakawa, Y. Tamura, S. Shimamura, and E. Nagao. 1991. Heat-stability of bovine lactoferrin at acidic pH. Journal of Dairy Science 74:65-71.
Anonymous. 1999. The zeta potential. Electroacoustics tutorials. www.colloidal-dynamics.com.
Anonymous. 2008. Executive news reports - what's hot around the globe: insights on food & bevergage categories, Nielsen Company.
Anonymous. 2009a. Facts about whey. http://www.innovatewithdairy.com/Pages/FactsAboutWhey.aspx?Category=Ingredients&Filter=Whey%20protein.
Anonymous. 2009b. Principles of spectrophotometry. www.ruf.rice.edu/~bioslabs/methods/protein/spectrophotometer.html. Online. Available: www.ruf.rice.edu/~bioslabs/methods/protein/spectrophotometer.html.
Bacon, J. and M. Rhodes. 2000. Binding affinity of hydrolyzable tannins to parotid saliva and to proline-rich proteins dereived from it. J. Agric. Food Chem 48(838-843).
Bajec, M. and G. Pickering. 2008. Astringency: mechanism and perception. Critical Reviews in Food Science and Nutrition 48(9):858-875.
Bate-Smith, E. C. 1954. Astringency in Foods. Food Process Packag. 23:124-127.
Beecher, J. W. 2006. Factors regulating astringency of whey protein-fortified beverages. in Department of Food Science. Vol. Master of Science. North Carolina State University, Raleigh.
Beecher, J. W., A. M. Drake, P. J. Luck, and E. A. Foegeding. 2008. Factors regulating astringency of whey protein beverages. J. Dairy Sci. 91:2553-2560.
Beeley, J. 1993. Fascinating families of protein: electrophoresis of human saliva. Biochemical Society transaction 21(1):133-138.
Bennick, A. 1982. Salivary proline-rich proteins. Molecular and Cellular Biochemistry 45:83-99.
Bennick, A. 2002. Interactions of plant polyphenols with salivary proteins. Critical Reviews in Oral Biology & Medicine 13:184-196.
Brannan, G. D., C. S. Setser, and K. E. Kemp. 2001. Interaction of astringency and taste characteristics. Journal of Sensory Studies 16:179-197.

References
124
Breslin, G. D., M. Gilmore, G. K. Beauchamp, and B. G. Green. 1993. Psychological eviodence that oral astringency is a tactile sensation. Chemical Senses 18(4):405-417.
Burrington, K. 2001. An overview: beverage applications for whey and lactose products. Pages 116-117 in Reference Manual for U.S. Wey and Lactose Products. Vol. 11. K. Nelson, ed.
Charlton, A. J., N. J. Baxter, M. L. Khan, A. J. G. Moir, E. Haslam, A. P. Davies, and M. P. Williamson. 2002. Polyphenol/peptide binding and precipitation. Journal of Agriculture and Food Chemistry 50:1593-1601.
Clifford, M. 1997. Astringency. Pages 87-107 in Phytochemistry of fruits and vegetables. F. A. Tomás-Barberán and R. J. Robins, ed. New York Clarendon PressOxford University Press, Oxford.
Collonna, A. E., D. O. Adams, and A. C. Noble. 2004. Comparison of procedures for reducing astringency carry-over effects in evaluation of red wines. Australien Journal of Grape and Wine Research 10:26-31.
Corregelongue, S., P. Schlich, and A. C. Noble. 1999. Using repeated ingestion to determine the effect of sweetness, viscosity and oilness on temporal perception of soymilk astringency. Food Quality and Preference 10:273-279.
Dairy Export Council, U. S. 2004. Whey products: definition, composition, functions Pages 27-40. USDEC: Reference Manual for U.S. Whey and Lactose products.
Dinnella, C., A. Reccia, S. Vencenzi, H. Tuorila, and E. Monteleone. 2010. Temporary modification of salivary protein profile and individual responses to repeated phneolic astringent stimuli. Chemical Senses 35:75-85.
Dodds, M. W. J., D. A. Johnson, and C.-K. Yeh. 2005. Health benefits of saliva: a review. Journal of Dentistry 33:223-233.
Durham, R. J. and J. A. Hourigan. 2007. Wastemanagement and co-product recovery in dairy processing. Handbook of waste management and co-product recovery in food processing. CRC Press.
Farrell, H. M., R. Jimenez-Flores, G. T. Bleck, E. M. Brown, J. E. Butler, L. K. Creamer, C. L. Hicks, C. M. Hollar, K. F. Ng-Kwai-Hang, and H. E. Swaisgood. 2004. Nomenclature of the proteins of cow's milk - sixth reversion. Journal of Dairy Science 87:1614-1674.
Francis, C. A., M. P. Hector, and G. P. Proctor. 2000. Precipitation of specific proteins by freeze-thawing of human saliva. Archives of Oral Biology 45:600-606.

References
125
Gambuti, A., A. Rinaldi, R. Pessina, and L. Moio. 2006. Evaluation of aglianico grape skin and seed polyphenol astringency by SDS-PAGE electrophoresis of salivary proteins after the binding reaction. Food Chemistry 97:614-620.
Green, B. G. 1993. Oral astringency: a tactile component of flavour. Acta Psychologia 84:119-125.
Guinard, J.-X., C. Zoumas-Morse, and C. Walchak. 1998. Relation between parotid saliva flow and composition and the perception of gustatory and trigeminal stimuli in foods. Physiology & Behaviour 63(1):109-118.
Guinard, J. X., R. M. Pangborn, and M. J. Lewis. 1986. The time-course of astringency in wine upon repeated ingestion. American Journal of Enology and Viticulture 37(3):184-189.
Hagerman, A. E. and L. G. Butler. 1981. The specificity of proanthocyanidin-protein interaction. American Journal of Enology and Viticulture 37:184-189.
Haslam, E. 1988. Natural astringency in foodstuffs - a molecular interpretation. Critical Reviews in Food Science and Nutrition 27(1):1-40.
Hazen, C. 2006. The power of protein. www.foodproductdesign.com. (06/05/2006).
Hill, A. R. 1988. Thermal precipitation of whey proteins. Milchwissenschaft 43(9565-566).
Hong, J. H., S. E. Ducan, A. M. Dietrich, S.F.O'Koefe, W. N. Eigel, and K. Mallikarjunan. 2009. Interaction of copper and human salivary proteins. J. Agric. Food Chem 57:6967-6975.
Humphrey, S. P. and R. T. Williams. 2001. A review of saliva: normal composition, flow and function. J. Prosthet. Dent 85:162-169.
Ishikawa, T. and A. C. Noble. 1995. Temporal perception of astringency and sweetness in red wine. Food Quality and Preference 6:27-33.
Jöbstl, E., J. O'Connell, J. P. A. Fairclouth, and M. P. Williamson. 2004. Molecular model for astringency produced by polyphenol/protein interactions. Biomacromolecules 5:942-949.
Ju, Z. J. and A. Kilara. 1998. Gelation of pH-aggregated whey protein isoltae solution induced by heat, protease, calcium salt and acidulant. J.Agric. Food Chem 46:1830-1835.
Kallithraka, S. and J. Bakker. 1998. Evidence that salivary proteins are involved in astringency. Journal of Sensory Studies 13:29-43.

References
126
Kallithraka, S., J. Bakker, and M. N. Clifford. 1997. Effect of pH on astringency in model solutions and wines. J. Agric. Food Chem 45:2211-2216.
Kallithraka, S., J. Bakker, M. N. Clifford, and L. Vallis. 2001. Correlations between saliva protein composition and some T-I parameters of astringency. Food Quality and Preference 12:145-152.
Kauffman, D. and P. Keller. 1979. The basic proline-rich proteins in human parotid saliva from a single subject. Arch. Oral Biol. 24:249-256.
Kawakami, H., M. Tanaka, K. Tatsumi, and S. Dosako. 1992. Effects of ionic strength and pH on the thermostability of lactoferrin. International Dairy Journal 2:287-298.
Kelly, M. A. 2009. Determining the role of the astringency mechanism of whey protein at acid pH's. Vol. Master of Science. North Carolina State University.
Kilara, A. and M. N. Vaghela. 2004. Chapter 4: Whey proteins. in Proteins in food processing. CRC Press.
Kussendraeger, K. D. 1994. Effects of heat treatment on structire and iron-binding capacity of bovine lactoferrin. Indigenous antimicrobial agents in milk: Recent developments (pp 133-146). International Dairy Federation, Brussels, Belgium.
Lametti, S., B. d. Gregori, G. Vechio, and F. Bonomi. 1996. Modifications occur at different structural levels during the heat-denaturation of beta-lactoglobulin. Eur. J. Biochemm 237:106-112.
Lawless, H. T. and H. Heymann. 1998. Sensory evaluation of food: principles and practises. Chapman & Hall, New York.
Lawless, H. T., J. Horne, and P. Giasi. 1996. Astringency of organic acids is related to pH. Chemical Senses 21:397-403.
Lea, A. G. H. and G. M. Arnold. 1978. Phenolics of ciders - bitterness and astringency. J. Sci. Food. Agri 29:478-483.
Lee, C. A. and Z. M. Vickers. 2008. The astringency of whey protein beverages is caused by their acidity. International Dairy Journal 18:1153-1156.
Lee, C. T. and H. T. Lawless. 1991. Time-course of astringent sensations. Chemical Senses 16(3):225-238.
Lim, J. and H. T. Lawless. 2005. Oral sensations from iron and copper sulfate. Physiology & Behaviour 85:308-313.

References
127
Limieux, L. and R. E. Simard. 1994. Astringency, a textural defect in dairy products. Lait 74:217-240.
Lu, Y. and A. Bennick. 1998. Interactions of tannin with human salivary proline-rich proteins. Arch. Oral Biol. 43:717-728.
Lymann, B. and B. G. Green. 1990. Oral astringency: effects of repeated exposure and interactions with sweeteners. Chemical Senses 15:151-164.
Malvern. 2003. Manual for Zetasizer Nano Systems.
Massucci, M. T., F. Giansanti, G. d. Nino, M. Turacchio, M. F. Giardi, D. Botti, R. Ippoliti, B. d. Giulio, R. Siciliano, G. Donnarumma, P. Valenti, A. Bocedi, F. Polticelli, P. Ascenzi, and G. Antonini. 2004. Proteolytic activity of bovine lactoferrin. BioMetals 17:249-255.
Miller, G. 2007. Sport Attitude. Prepared Foods. 2007(23.07.2007).
Minaguchi, K. and A. Bennick. 1989. Invited review: genetics of human salivary proteins. Journal of Dental Research 68(1):2-15.
Monteleone, E., N. Condelli, C. Dinella, and M. Bertuccioli. 2004. Prediction of perceived astringency induced by phenolic compounds. Food Quality and Preference 15: 761–769.
Peleg, H. and A. C. Noble. 1999. Effect of viscosity, temperature and pH on astringency in cranberry juice. Food Quality and Preference 10:343-347.
Pelegrine, D. H. G. and C. A. Gasparetto. 2005. Whey proteins solubility as function of temperature and pH. Lebensmittelwissenschaft und -technologie 38:77-80.
Prinz, J. F. and P. W. Lucas. 2000. Saliva tannin interactions. Journal of Oral Rehab. 27:991-994.
Rodriguez, M. S., L. A. Albertengo, and E. Agullo. 2003. Relationship between astringency and chitosan-saliva solutions turbidity at different pH. Journal of Food Science 68(2):665-667.
Rykke, M., A. Young, G. Smidstad, G. Roella, and J. Karlsen. 1996. Zeta-potentials of human salivary micelle-like particles. Colloids and Surfaces B: Biointerfaces 6:51-56.
Sano, H., T. Egashira, Y. Kinekawa, and N. Kitabatake. 2005. Astringency of bovine milk whey protein. Journal of Dairy Science 88:2312-2317.

References
128
Sarni-Manchado, P., V.Cheynier, and M. Moutounet. 1999. Interactions of grape seed tannins with salivary proteins. J. Agric. Food Chem 47(1):42-47.
Schiffman, S. S., M. S. Suggs, A. L. Sostman, and S. A. Simon. 1992. Chorda tympani and lingual nerve response to astringent compounds in rodents. Physiology & Behaviour 51:55-63.
Schipper, R. G., E. Silletti, and M. H. Vingerhoeds. 2007. Saliva as research material: biochemical, physicochemical and practical aspects. Arch. Oral Biol. 52:1114-1135.
Siebert, K. J. and A. W. Chassy. 2003. An alternate mechanism for the astringent sensation of acids. Food Quality and Preference 15:13-18.
Smithers, G. W., F. J. Ballard, A. D. Copeland, K. J. d. Silva, D. A. Dionysius, G. F. Francis, C. Goddard, P. A. Grieve, G. H. Mcintosh, I. R. Mitchell, R. J. Pearce, and G. O. Regester. 1996. New opportunities from the isolation and utilization of whey proteins. Symposium: Advances in dairy foods processing and engeneering. Journal of Dairy Science 79:1454-1459.
Sowalsky, R. A. and A. C. Noble. 1998. Comparison of the effects of concentration, pH and anion species on astringency and sourness of organic acids. Chemical Senses 23:343-349.
Steijns, J. M. and A. C. van Hooijdonk. 2000. Occurrence, structure, biochemical properties and technological characteristics of lactoferrin. British Journal of Nutrition 84 (Suppl. 1):S11–S17.
Tomita M, Takse M, W. H, and B. W. 1994. Antimicrobial peptides of lactoferrin. Advances in Experimental Medicine and Biology 357:209-218.
Vardhanabhuti, B., M.A. Kelly, P. J. Luck, M. A. Drake, and E. A. Foegeding. 2010. Roles of charge interactions on astringency of whey proteins at low pH. Journal of Dairy Science 93 (5):1890-1899.
Verheul, M., S. P. F. M. Roefs, and K. G. d. Kruifs. 1998. Kinetics of heat-induced aggregation of beta-lactoglobulin. J. Agric. Food Chem 46:896-903.
Virella, V. and J. Goudswaard. 1978. Measurement of salivary lysozyme. Journal of Dental Research 57:326-328.
Walker, J. M. 2002. SDS polyacrylamide gel electrophoresis of proteins. in The protein protocols handbook. J. M. Walker, ed. Humana Press Inc, Totowa, NJ.