Embed Size (px)
Citation preview
DRAFT MIA Project White Paper v5.doc Created by Elizabeth Van Couvering Page 1 Last printed 12/11/2009 06:32:00
Interactive Audience and Traffic Measurement White Paper
June 2009
www.miaproject.org
DRAFT MIA Project White Paper v5.doc Created by Elizabeth Van Couvering Page 2 Last printed 12/11/2009 06:32:00
Contents 1 Executive Summary .................................................................... 4 2 Introduction............................................................................... 7
2.1 Structure and funding of the MIA Project .................................. 8 2.2 Introduction to the Audience and Traffic Measurement Survey..... 8
3 Research Methodology............................................................... 10 4 Results.................................................................................... 12
4.1 Respondent Profile .............................................................. 12 4.2 The global landscape ........................................................... 19
4.2.1 Data sources................................................................. 19 4.2.2 The value of metrics....................................................... 24
4.3 Satisfaction with the current measurement system .................. 30 4.3.1 Procuring accurate and reliable metrics............................. 30 4.3.2 Gaps in the current system ............................................. 34 4.3.3 Challenges specific to international work ........................... 37 4.3.4 User understanding of data provision................................ 38
4.4 Future measurement systems ............................................... 43 4.5 The importance of measurement issues.................................. 47
4.5.1 Quality in online advertising and traffic measures............... 47 4.5.2 A consistent global approach to online and traffic measurement.......................................................................... 50
4.6 Cluster analysis .................................................................. 54 5 Appendix I – Questionnaire Text ................................................. 57

DRAFT MIA Project White Paper v5.doc Created by Elizabeth Van Couvering Page 3 Last printed 12/11/2009 06:32:00
DRAFT MIA Project White Paper v5.doc Created by Elizabeth Van Couvering Page 4 Last printed 12/11/2009 06:32:00
1 Executive Summary The Measurement of Interactive Audience Project (MIA Project) is a joint initiative between the European Interactive Advertising Association (EIAA, www.eiaa.net) and the Interactive Advertising Bureau Europe (IAB Europe, www.iabeurope.eu) with the objectives of: • Analysing audience measurement methodologies including user‐centric, site‐centric and
combination systems across the world • Outlining the existing standards • Increasing understanding of these systems and standards and how they can be
compared • Studying the potential for industry‐agreed guidelines and standards that can be applied
to the planning phase of international advertising campaigns. We believe that the Project’s recommendations will help the industry move forward as it shows its effectiveness alongside other media using a measurement methodology that is acceptable to all. Read more about the MIA Project structure and funding in Section 2.1. This white paper reports the results of a survey of 820 online advertising professionals. These professionals were based in 35 countries, with the majority coming from Western Europe. They were planners, buyers, sellers, marketers and evaluators of online advertising, and they worked in agencies, publishers, ad distribution networks and advertisers. Respondent profiles are explored in more detail in Section 4.1, and the research methodology for the survey is explained in Section 3. In summary, the findings from our research are as follows:
• Online advertising professionals around the globe use a wide variety of sources for their online traffic and measurement data, including internal data, syndicated research and custom research. We suggest that these data sources form a measurement ecosystem with different data used for decision-making depending upon the decision (see Section 4.2.1 for more detail). • Professionals place a high value on online metrics, particularly those to do with the audience and with advertising performance, but in some cases are unable to get easy access to the measures they would like. We have called this a “needs gap.” The greatest need overall is for demographic profile information, but the needs gap varies by region, with the highest gap in the UK and Ireland, North America, Latin America and the Asia/Pacific region, and the lowest gap in Poland, other Eastern European countries and Italy (see Section 4.3.2).
DRAFT MIA Project White Paper v5.doc Created by Elizabeth Van Couvering Page 5 Last printed 12/11/2009 06:32:00
• Those with an international remit face greater challenges, particularly with regard to the consistency of the information they are able to gather (see Section 4.3.3). In-depth analysis of the international planners’ experience will be a focus of future MIA Project activity. • Professionals are broadly confident about their ability to understand online measures in theory, but are rather less confident when it comes to how measures are calculated in practice and are even less trusting about the measures they receive from external sources. This also varies by role, with buyers and sellers markedly more confident in their understanding of measures (see section 4.3.4). • There is a widespread and high level of agreement that high quality information should be available, that is, metrics that are consistently calculated, transparent to the end user, based on industry standards and independently verified. Many users are dissatisfied with the quality of the information they are currently receiving. The gap between the importance that professionals attach to high quality information and their satisfaction that the industry is currently delivering it (the “satisfaction gap”) varies by region. There is a high gap on all measures in the UK/Ireland and Spain, and much less of a gap in the Nordic countries and Eastern Europe, including Poland. In many respects this echoes regional distribution of the needs gap discussed above (see Section 4.5.1). • While broadly agreeing that metrics such as those used to measure audio and video and social networks online would be useful, and that it would be desirable to have measures comparable with other digital platforms and traditional advertising, the real call from professionals is for online to put its own house in order first. Transparency, consistency, and standards were listed again and again as key to the future development of online measures in responses to an open question about the future of online measurement (see Section 4.4.). • A large majority (over 80%) of respondents agree that a consist global approach (in terms of the metrics used, standards adopted, and independent verification) would be very beneficial, although many were not convinced it could happen in the short or medium term (see section 4.5.2). • A cluster analysis of the respondents (see section 4.6) showed three major groupings of respondent answers: a group of “optimistic leaders” who use and are confident with online metrics; a second smaller group of “constructive sceptics” who are much less convinced about the reliability of metrics on all
DRAFT MIA Project White Paper v5.doc Created by Elizabeth Van Couvering Page 6 Last printed 12/11/2009 06:32:00
counts, but are still convinced of their value; and a third group of “peripheral players” who value and use online metrics less than the first two groups.
Moving forward from this research the MIA Project is undertaking a consultation process including a series of in-depth interviews with industry bodies involved in the monitoring, regulation and validation of online audience and traffic measurement (Industry Body Consultation) (See Section 2, below). The Audience and Traffic Measurement Survey and the Industry Body Consultation results will then be reviewed together and discussed with the MIA Project Working Group, the MIA Project Vendor Forum, and at conferences and presentations throughout the world, as well as on our website at http://www.miaproject.org. At this stage the MIA Project does not have specific recommendations; however we hope that the data in this paper will serve as a call for action and debate on this topic as our findings to date clearly show that professionals would welcome an improvement in the overall measurement ecosystem, particularly in terms of increasing clarity, transparency, and consistency. We also recognise that the differences between markets are important and that any solution has to respect those differences. We therefore encourage further dialogue between the key industry participants to ensure the industry benefits from this project.
DRAFT MIA Project White Paper v5.doc Created by Elizabeth Van Couvering Page 7 Last printed 12/11/2009 06:32:00
2 Introduction The MIA Project has been undertaking work in several phases, as detailed below, of which this White Paper forms the output of Phase 2. Phase 1: Directory of Definitions The MIA Project has produced a Directory of Definitions (June 2008), outlining and explaining the complete spectrum of terms used globally to make them more transparent and comprehensible. The directory is available on the MIA project website at http://www.miaproject.org. Phase 2: Audience and traffic measurement survey The MIA Project has completed an audience and traffic measurement survey with online advertising professionals globally, whose results form the bulk of this white paper. We had 820 responses to a series of detailed questions about online audience and traffic measurement. Phase 3: Consultation process This survey represents the first step in a process of consultation and dialogue with the industry on measurement issues and we are following up the survey with a series of meetings with the MIA Project Working Group and in‐depth interviews with the local and international bodies involved with the regulation, monitoring and validation of measurement in online advertising.
Working Group Within the working group there is a consultation process where the results of the Audience and Traffic Measurement survey are being analysed in depth. Industry Body Consultation Presentations and interviews with organisations involved in the monitoring, regulation and validation of audience and traffic measurement data, in orderto share knowledge, identify best practice, and point up key challenges in producing clear and transparent audience and traffic measurement standards. Vendor Forum We welcome both the chance to share what we have learned and to hear the views of vendors on the matter as vendors in particular are very experienced with the complexities of online measurement and are aware of upcoming issues. The MIA Project is setting up an ongoing "Vendor Forum" to serve as a co‐ordinated space for senior level dialogue between the industry and measurement vendors. Conferences Outreach at conferences and key events such as ESOMAR

DRAFT MIA Project White Paper v5.doc Created by Elizabeth Van Couvering Page 8 Last printed 12/11/2009 06:32:00
These streams are enabling the MIA Project to create a detailed picture of local and international structures and systems and to produce a map of the current approaches around the world and take forward a body of data and opinion unrivalled in the world of audience measurement.
2.1 Structure and funding of the MIA Project The MIA Project is an industry‐led initiative, primarily funded by Interactive Advertising Bureau (IAB) Europe (www.iabeurope.eu) and the European Interactive Advertising Bureau (EIAA) (www.eiaa.net). The Audience and Traffic Measurement Survey was also supported by ABCelectronic (ABCe) (www.abc.org.uk). • The MIA Project therefore includes EIAA members (AD Europe (Orange, United Internet
Media, Libero), AdLINK Group, blinkx, CNN International, DoubleClick, Disney, eBay International Advertising, Gruner + Jahr, Linkedin, LYCOS Network Europe, Microsoft Advertising, MTV Networks International, Platform‐A, PREMIUM PUBLISHERS ONLINE, Smartclip, Specific Media, wunderloop and Yahoo! Europe)
• The 23 national IABs in Europe: Austria, Belgium, Croatia, Denmark, Finland, France, Germany, Greece, Hungary, Ireland, Italy, Luxembourg, Netherlands, Norway, Poland, Portugal, Romania, Slovenia, Spain, Sweden, Switzerland, Turkey and the UK and more than 5000 company members
• IAB US and IAB Canada in North America • IAB Australia • IAB Chile (representing South America) • The Asia Digital Marketing Association • IFABC members worldwide and media agency and advertiser representatives The MIA Project is co‐chaired by Alison Fennah, Executive Director, EIAA and Nicki Lynas, Head of Research, IAB UK. The MIA Project Steering Committee takes advantage of the industry experience and expertise of Anita Caras, Market Insight Lead EMEA, Microsoft Advertising; Jürgen Sandhöfer, Vice Chairman of the Board ‐ AGOF (www.agof.de) and Richard Foan, ABCe, JICWEBS Chair (www.jicwebs.org) and IFABC WWW Standards Chair (www.ifabc.org). Together, they define the focus and agenda of the project.
2.2 Introduction to the Audience and Traffic Measurement Survey The bulk of this white paper presents the results of the survey the MIA Project carried out with online advertising professionals worldwide (see Section 2 for research methodology). The core research questions to be answered by this survey were as follows:
1. What does the current global landscape of online audience and traffic measurement look like?

DRAFT MIA Project White Paper v5.doc Created by Elizabeth Van Couvering Page 9 Last printed 12/11/2009 06:32:00
a. What major measurement systems are in use for online advertising in the major world markets excluding the US?
b. Are there regional or global systems, and if so, how do these differ from national systems?
2. How good is the current system of measurement provision? a. How much confidence do end users have in the accuracy and validity
of the information reported by these systems? b. How satisfied are they with the amount and type of measures collected
by these systems? 3. What do end users imagine they will need in future measurement systems? 4. The “so what” question: How important are measurement issues to end users
in the context of their online business? Surveys cannot reveal everything, so this research is supplemented by an ongoing programme of in-depth one-on-one interviews with representatives of industry bodies in a variety of countries. The aim of this white paper is to present the results of the survey and to propose some suggestions going forward for the industry to debate and discuss. The MIA Project steering committee welcomes responses to this paper, which may be directed to [email protected].
DRAFT MIA Project White Paper v5.doc Created by Elizabeth Van Couvering Page 10 Last printed 12/11/2009 06:32:00
3 Research Methodology This section discusses the setup and analysis of the survey. We chose initially to do a survey since although in the view of the MIA Project there were issues with online measurement, we wanted to discover whether our views were shared by the industry at large, and whether issues were the same across the globe. Surveys are, however, unable to reveal details and complexities, which is why the survey research is currently being supplemented with one-on-one interviews with industry bodies (through the Industry Body Consultation stream of work) and with discussions with measurement vendors (through the Vendor Forum). Updates to this research will be available at http://www.miaproject.org. For the survey, we targeted advertising professionals who used and came into contact with online audience and traffic measurements in their day-to-day business. We divided these into five role groups: planning, buying, selling, evaluating, and marketing; and into four organisational groups: advertising/marketing agencies, online publishers/media owners, advertisers, and advertising network/online ad distributors. We also targeted 19 countries for survey. These included the top 15 countries in the world by broadband penetration, according to the most recent OECD figures, and four emerging market countries: Brazil, Russia, India and China. The questionnaire was translated into the local languages of these countries as indicated below.
United States Japan (Japanese) Germany (German) Korea (Korean) UK France (French) Italy (Italian) Canada Spain (Spanish) The Netherlands (Dutch) Mexico (Spanish) Australia Turkey (Turkish) Poland (Polish) Sweden (Swedish) Brazil (Portuguese) Russia (Russian) India (Hindi) China (Chinese)
DRAFT MIA Project White Paper v5.doc Created by Elizabeth Van Couvering Page 11 Last printed 12/11/2009 06:32:00
The survey was distributed through the MIA Project Working Group, the EIAA, through local IABs, and through other industry associations who agreed to pass the message along to their members. The survey was also marketed through international media coverage and through a variety of conference presentations. We also encouraged respondents to pass along the link to others they knew. Thus the answers to this survey are not a random sample; in other words the findings we present in this white paper can not be extrapolated to the entire population of global online advertising professionals with statistical accuracy. Having said that, there are no lists of global online advertising professionals it would have been impossible to create a truly random sample. Our aim therefore was to achieve a wide distribution with minimum sample counts in each area. We also did not restrict our survey to those countries we had initially targeted, but rather accepted responses from all participants. We were not uniformly successful in achieving sample size in all our target countries. In our analysis, we aggregated regional responses to achieve a minimum sample size of 30 respondents so that further analysis would be possible. Most notably, our emerging markets (with the exception of Russia) and our Asian Pacific targets (most notably Japan and Korea) were quite under-represented in the final survey. Also under-represented given the size of the market was the United States. Conversely, we were over-represented in Western Europe. We may therefore say that while this survey can make a legitimate claim to representing the voice of the industry globally, the Western European voices are heard most loudly. Perhaps this is not altogether a bad thing, as Western Europe is the area of the globe where the largest number of significant advertising markets co-exist and where regional planning and buying of advertising is most common.
DRAFT MIA Project White Paper v5.doc Created by Elizabeth Van Couvering Page 12 Last printed 12/11/2009 06:32:00
4 Results
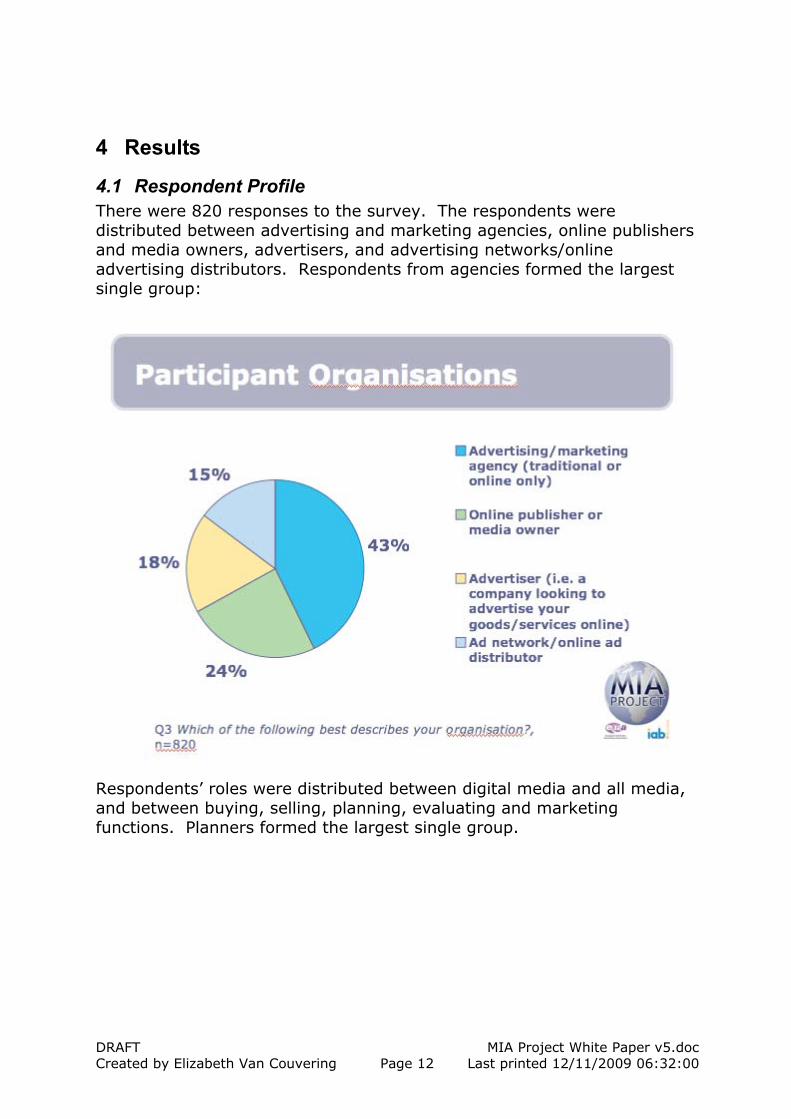
4.1 Respondent Profile There were 820 responses to the survey. The respondents were distributed between advertising and marketing agencies, online publishers and media owners, advertisers, and advertising networks/online advertising distributors. Respondents from agencies formed the largest single group:
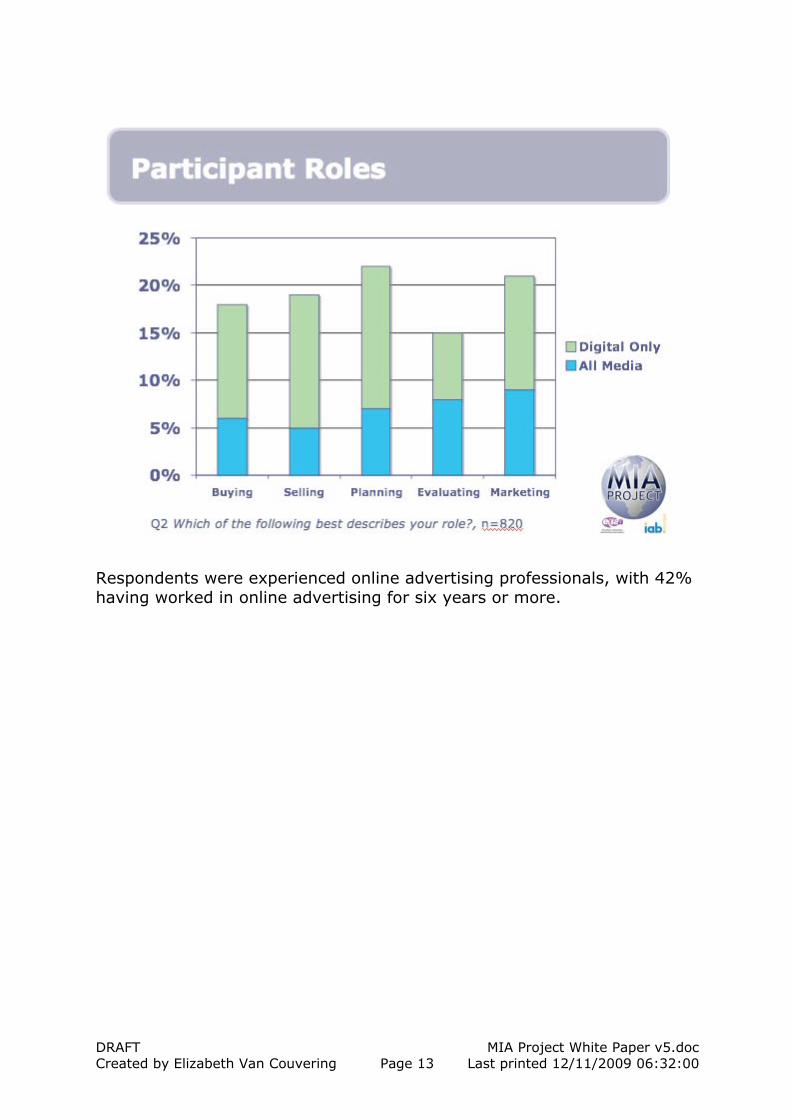
Respondents’ roles were distributed between digital media and all media, and between buying, selling, planning, evaluating and marketing functions. Planners formed the largest single group.
DRAFT MIA Project White Paper v5.doc Created by Elizabeth Van Couvering Page 13 Last printed 12/11/2009 06:32:00
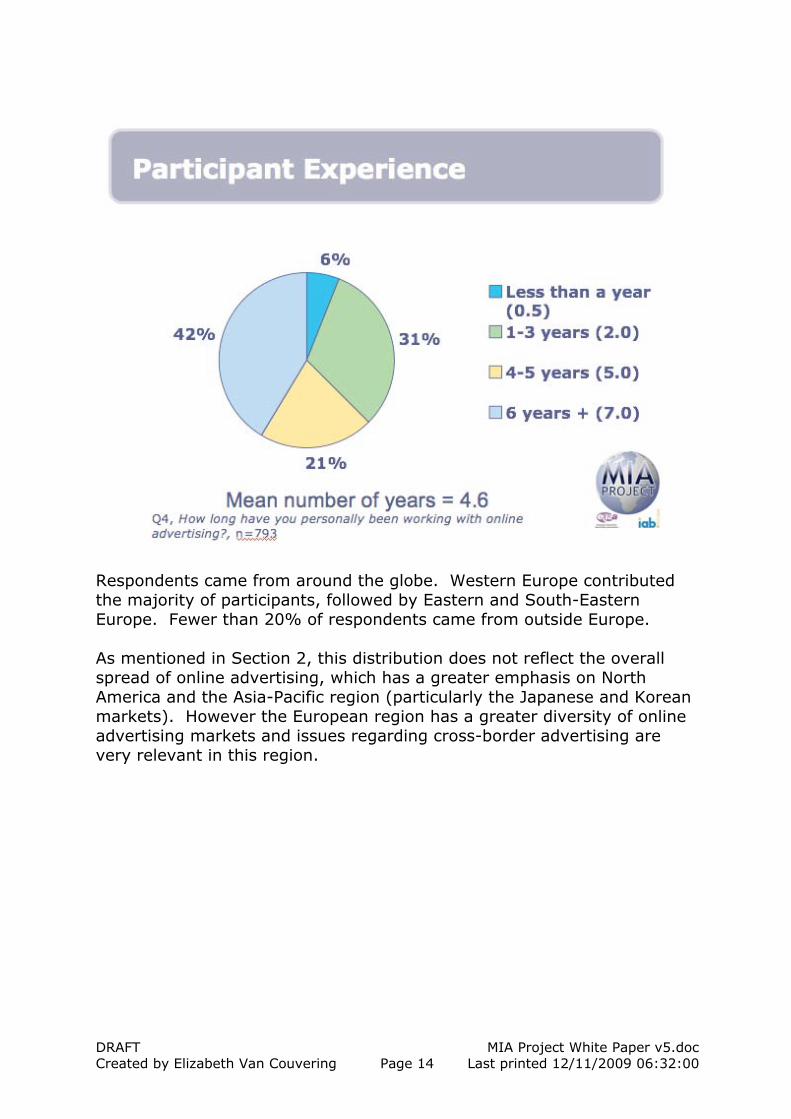
Respondents were experienced online advertising professionals, with 42% having worked in online advertising for six years or more.
DRAFT MIA Project White Paper v5.doc Created by Elizabeth Van Couvering Page 14 Last printed 12/11/2009 06:32:00
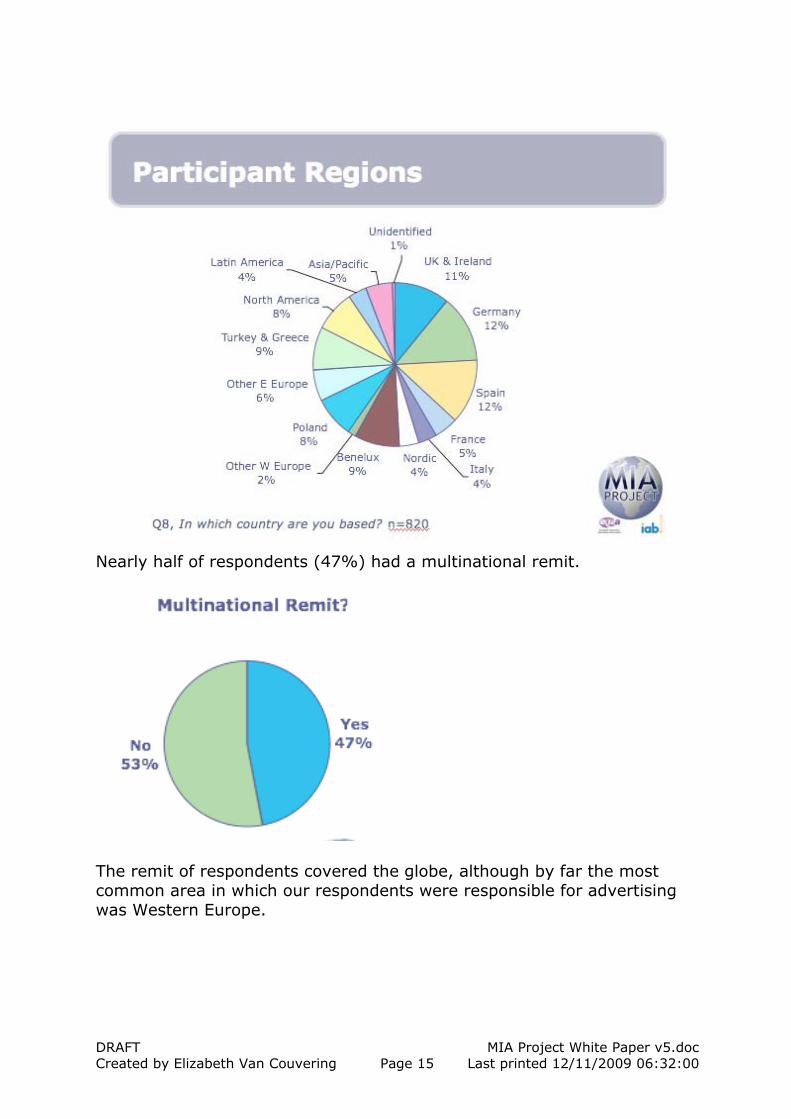
Respondents came from around the globe. Western Europe contributed the majority of participants, followed by Eastern and South-Eastern Europe. Fewer than 20% of respondents came from outside Europe. As mentioned in Section 2, this distribution does not reflect the overall spread of online advertising, which has a greater emphasis on North America and the Asia-Pacific region (particularly the Japanese and Korean markets). However the European region has a greater diversity of online advertising markets and issues regarding cross-border advertising are very relevant in this region.
DRAFT MIA Project White Paper v5.doc Created by Elizabeth Van Couvering Page 15 Last printed 12/11/2009 06:32:00
Nearly half of respondents (47%) had a multinational remit.
The remit of respondents covered the globe, although by far the most common area in which our respondents were responsible for advertising was Western Europe.
DRAFT MIA Project White Paper v5.doc Created by Elizabeth Van Couvering Page 16 Last printed 12/11/2009 06:32:00
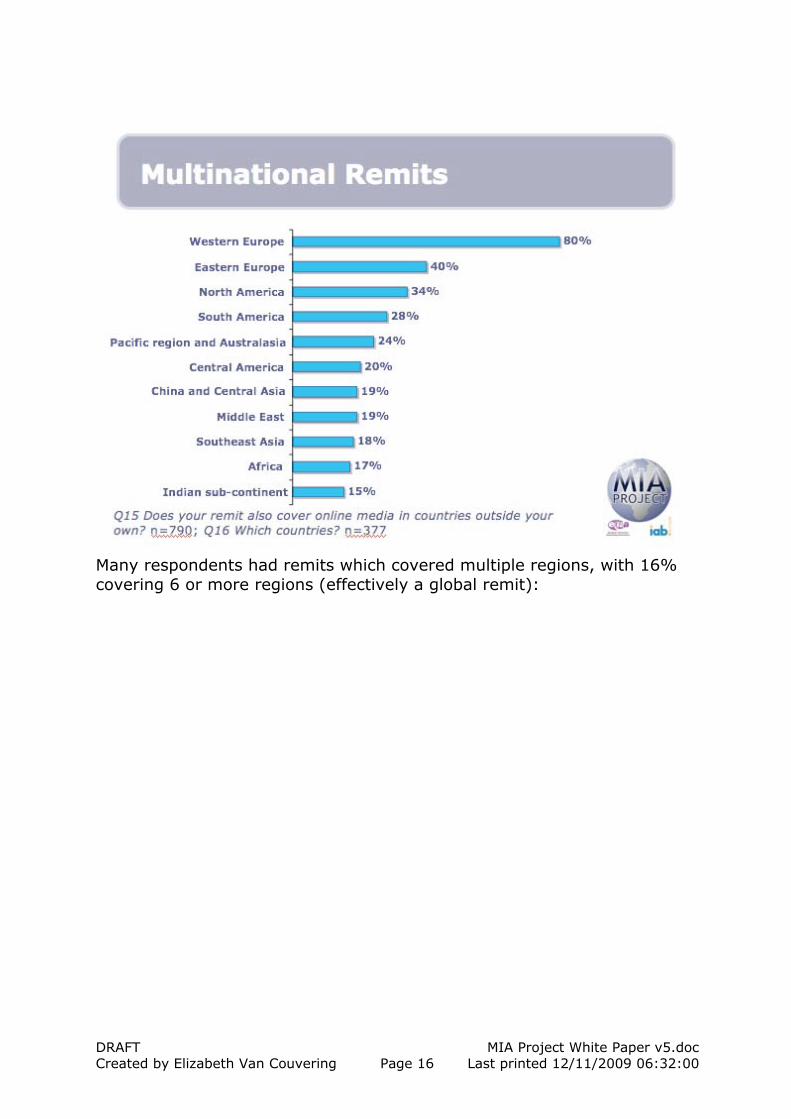
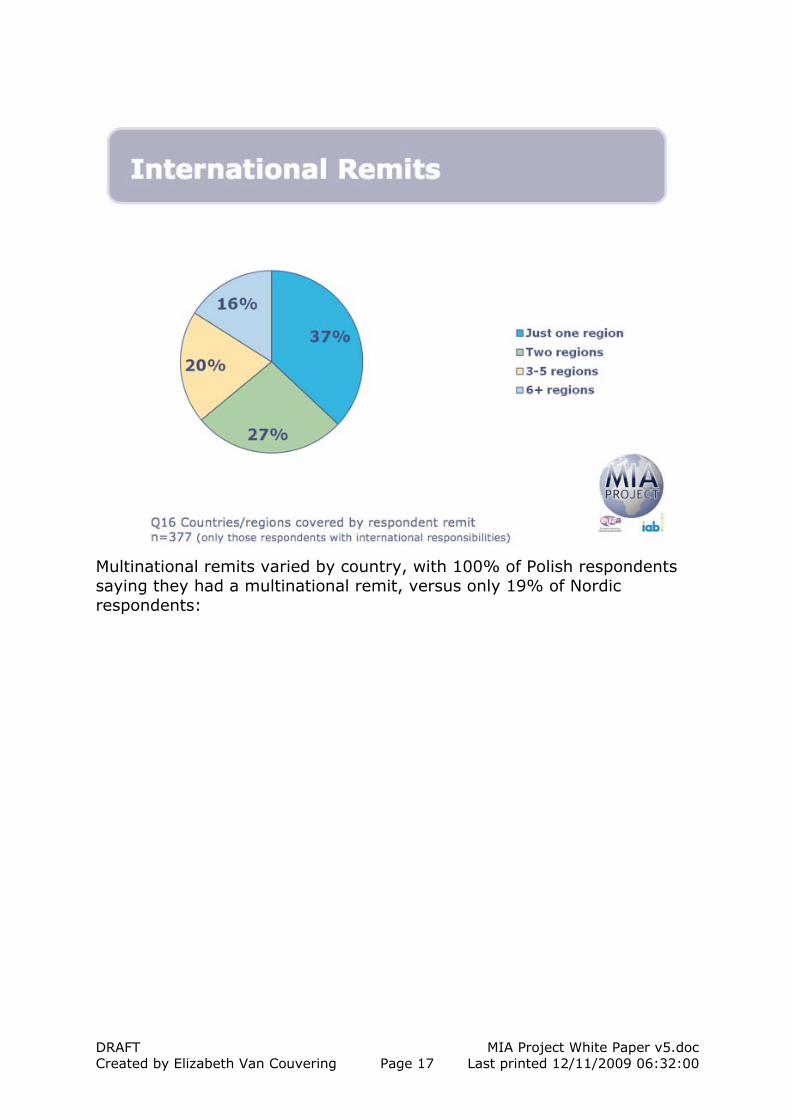
Many respondents had remits which covered multiple regions, with 16% covering 6 or more regions (effectively a global remit):
DRAFT MIA Project White Paper v5.doc Created by Elizabeth Van Couvering Page 17 Last printed 12/11/2009 06:32:00
Multinational remits varied by country, with 100% of Polish respondents saying they had a multinational remit, versus only 19% of Nordic respondents:
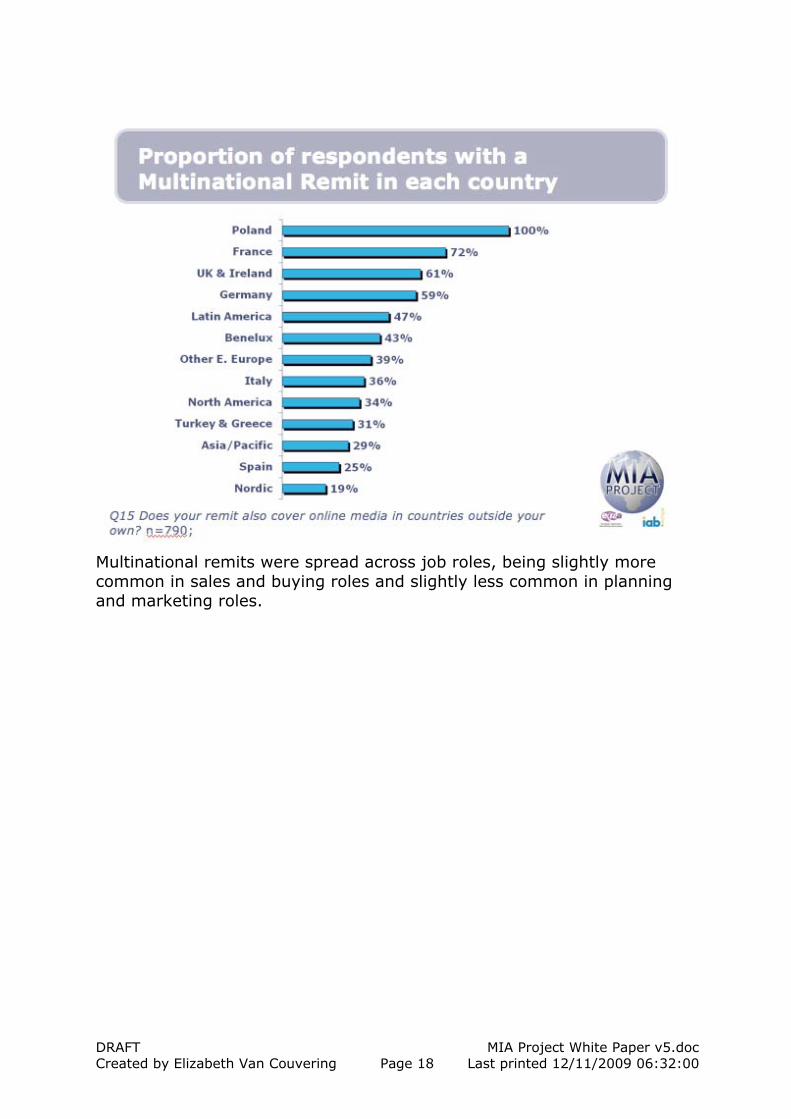
DRAFT MIA Project White Paper v5.doc Created by Elizabeth Van Couvering Page 18 Last printed 12/11/2009 06:32:00
Multinational remits were spread across job roles, being slightly more common in sales and buying roles and slightly less common in planning and marketing roles.
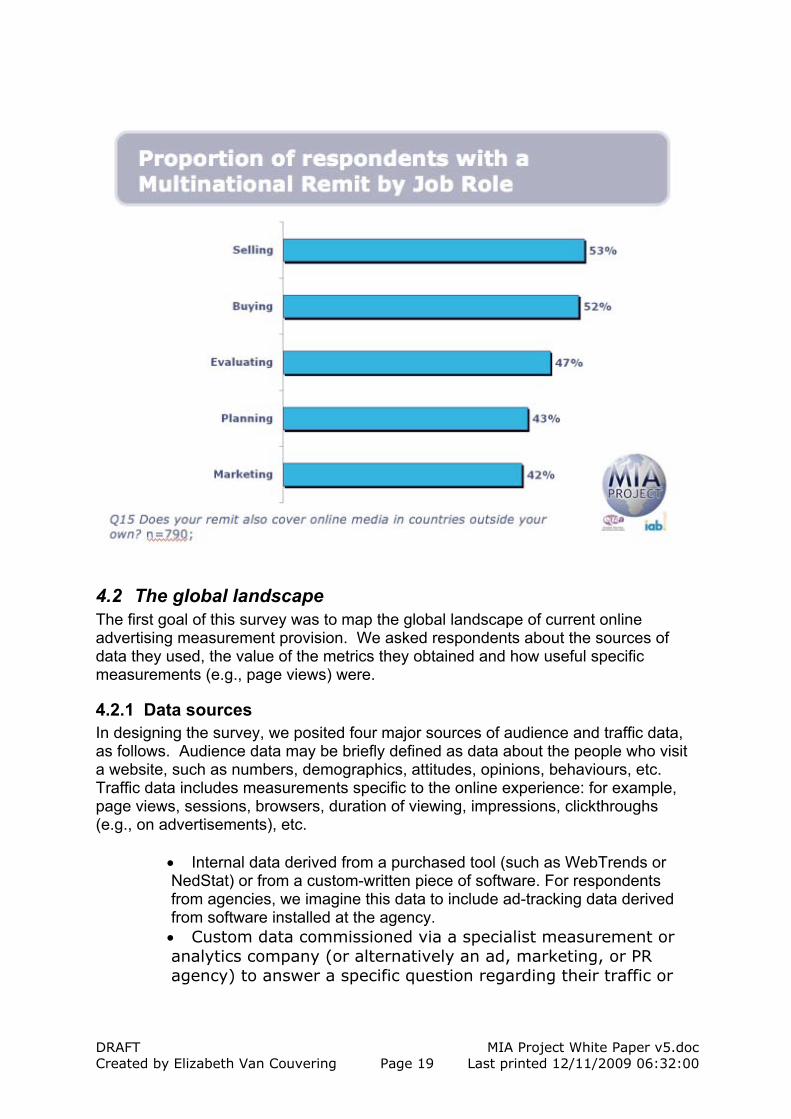
DRAFT MIA Project White Paper v5.doc Created by Elizabeth Van Couvering Page 19 Last printed 12/11/2009 06:32:00
4.2 The global landscape The first goal of this survey was to map the global landscape of current online advertising measurement provision. We asked respondents about the sources of data they used, the value of the metrics they obtained and how useful specific measurements (e.g., page views) were.
4.2.1 Data sources In designing the survey, we posited four major sources of audience and traffic data, as follows. Audience data may be briefly defined as data about the people who visit a website, such as numbers, demographics, attitudes, opinions, behaviours, etc. Traffic data includes measurements specific to the online experience: for example, page views, sessions, browsers, duration of viewing, impressions, clickthroughs (e.g., on advertisements), etc.
• Internal data derived from a purchased tool (such as WebTrends or NedStat) or from a custom-written piece of software. For respondents from agencies, we imagine this data to include ad-tracking data derived from software installed at the agency. • Custom data commissioned via a specialist measurement or analytics company (or alternatively an ad, marketing, or PR agency) to answer a specific question regarding their traffic or
DRAFT MIA Project White Paper v5.doc Created by Elizabeth Van Couvering Page 20 Last printed 12/11/2009 06:32:00
audience data (for example, which other online sites do my most frequent visitors also visit); • Syndicated data purchased either directly or via an agency. This data, which typically gives traffic and audience measurements for top sites in a market, may be produced by a research agency such as Nielsen, comScore, or Gemius, or by an industry association such as AGOF in Germany or PBI in Poland, or may be obtained from an ad, marketing, or PR agency. • Publisher data produced for advertisers to assist in planning and campaign evaluation by website owners.
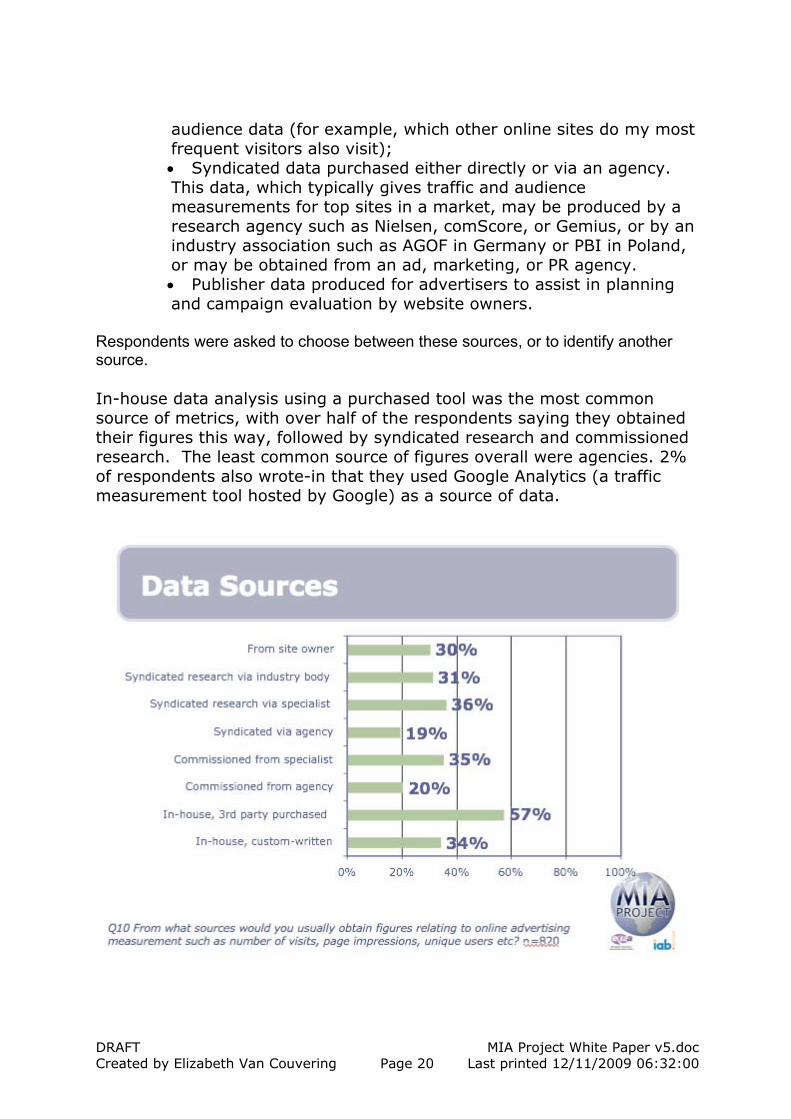
Respondents were asked to choose between these sources, or to identify another source. In-house data analysis using a purchased tool was the most common source of metrics, with over half of the respondents saying they obtained their figures this way, followed by syndicated research and commissioned research. The least common source of figures overall were agencies. 2% of respondents also wrote-in that they used Google Analytics (a traffic measurement tool hosted by Google) as a source of data.
DRAFT MIA Project White Paper v5.doc Created by Elizabeth Van Couvering Page 21 Last printed 12/11/2009 06:32:00
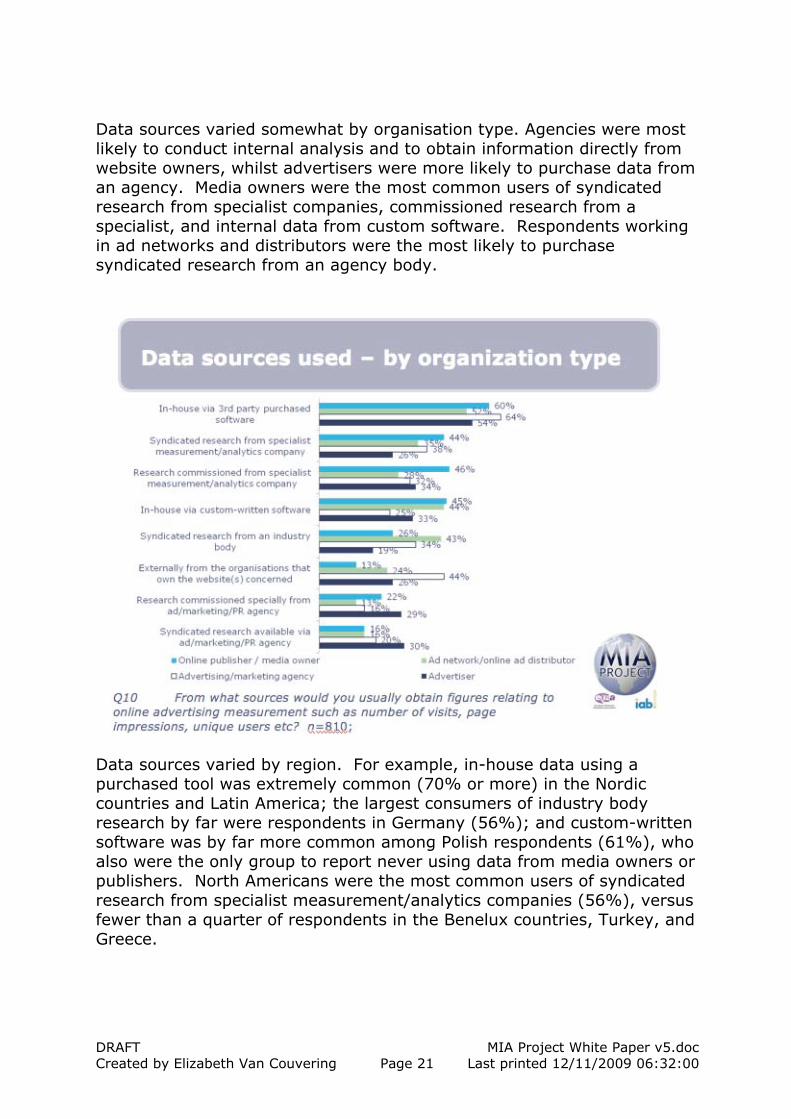
Data sources varied somewhat by organisation type. Agencies were most likely to conduct internal analysis and to obtain information directly from website owners, whilst advertisers were more likely to purchase data from an agency. Media owners were the most common users of syndicated research from specialist companies, commissioned research from a specialist, and internal data from custom software. Respondents working in ad networks and distributors were the most likely to purchase syndicated research from an agency body.
Data sources varied by region. For example, in-house data using a purchased tool was extremely common (70% or more) in the Nordic countries and Latin America; the largest consumers of industry body research by far were respondents in Germany (56%); and custom-written software was by far more common among Polish respondents (61%), who also were the only group to report never using data from media owners or publishers. North Americans were the most common users of syndicated research from specialist measurement/analytics companies (56%), versus fewer than a quarter of respondents in the Benelux countries, Turkey, and Greece.
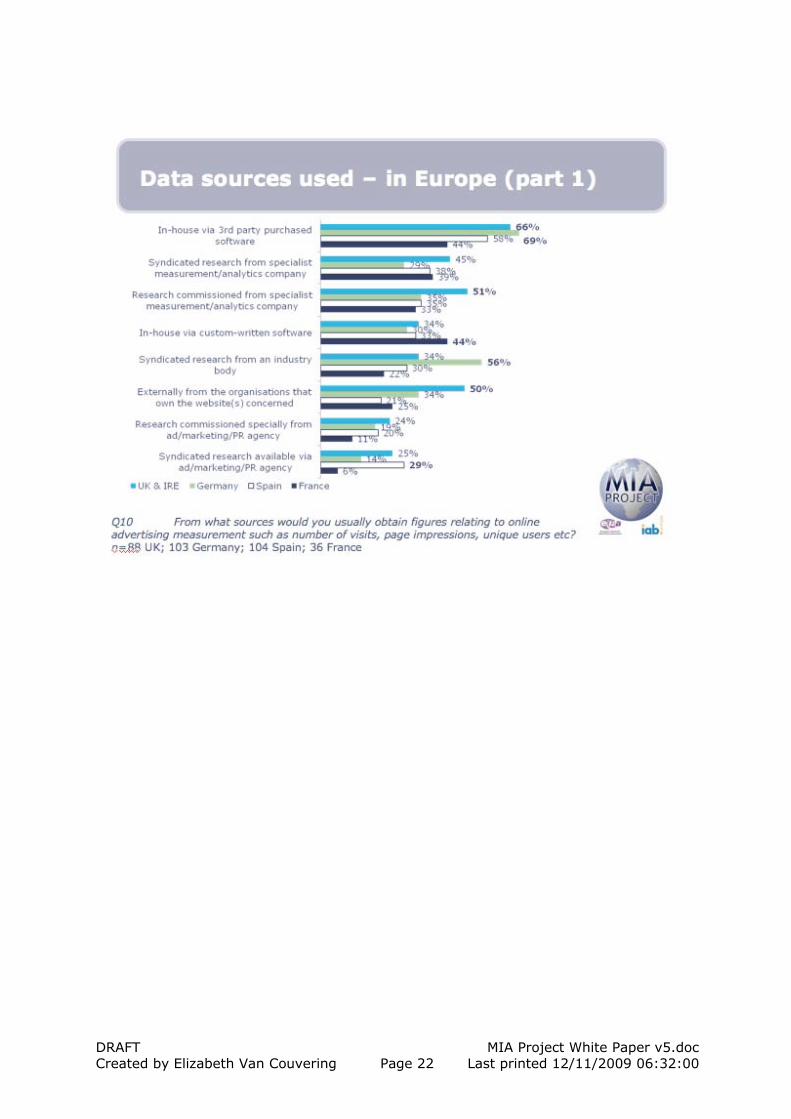
DRAFT MIA Project White Paper v5.doc Created by Elizabeth Van Couvering Page 22 Last printed 12/11/2009 06:32:00
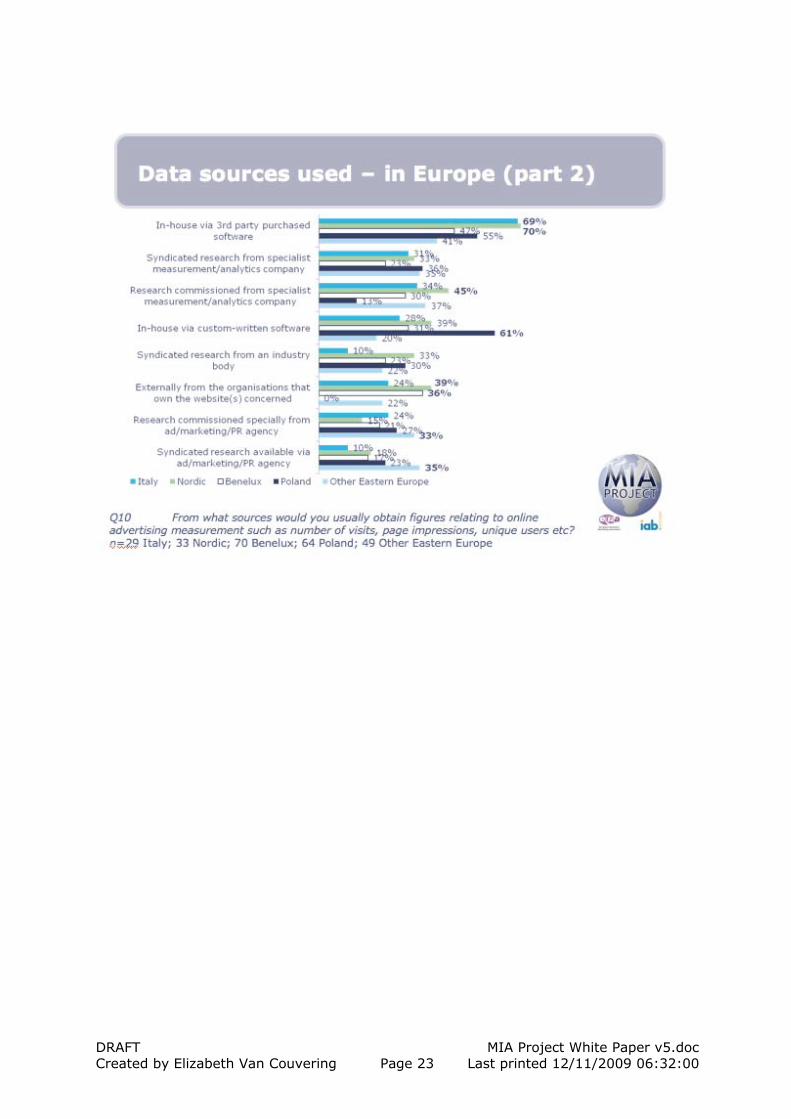
DRAFT MIA Project White Paper v5.doc Created by Elizabeth Van Couvering Page 23 Last printed 12/11/2009 06:32:00
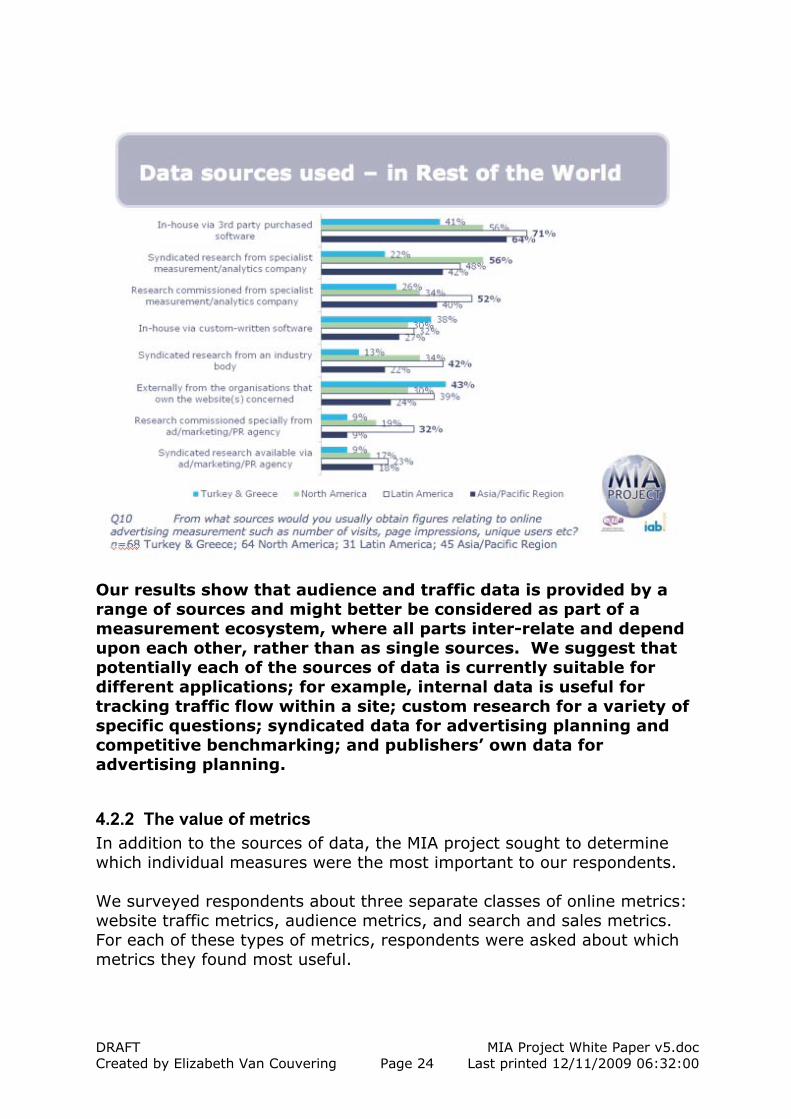
DRAFT MIA Project White Paper v5.doc Created by Elizabeth Van Couvering Page 24 Last printed 12/11/2009 06:32:00
Our results show that audience and traffic data is provided by a range of sources and might better be considered as part of a measurement ecosystem, where all parts inter-relate and depend upon each other, rather than as single sources. We suggest that potentially each of the sources of data is currently suitable for different applications; for example, internal data is useful for tracking traffic flow within a site; custom research for a variety of specific questions; syndicated data for advertising planning and competitive benchmarking; and publishers’ own data for advertising planning.
4.2.2 The value of metrics In addition to the sources of data, the MIA project sought to determine which individual measures were the most important to our respondents. We surveyed respondents about three separate classes of online metrics: website traffic metrics, audience metrics, and search and sales metrics. For each of these types of metrics, respondents were asked about which metrics they found most useful.
DRAFT MIA Project White Paper v5.doc Created by Elizabeth Van Couvering Page 25 Last printed 12/11/2009 06:32:00
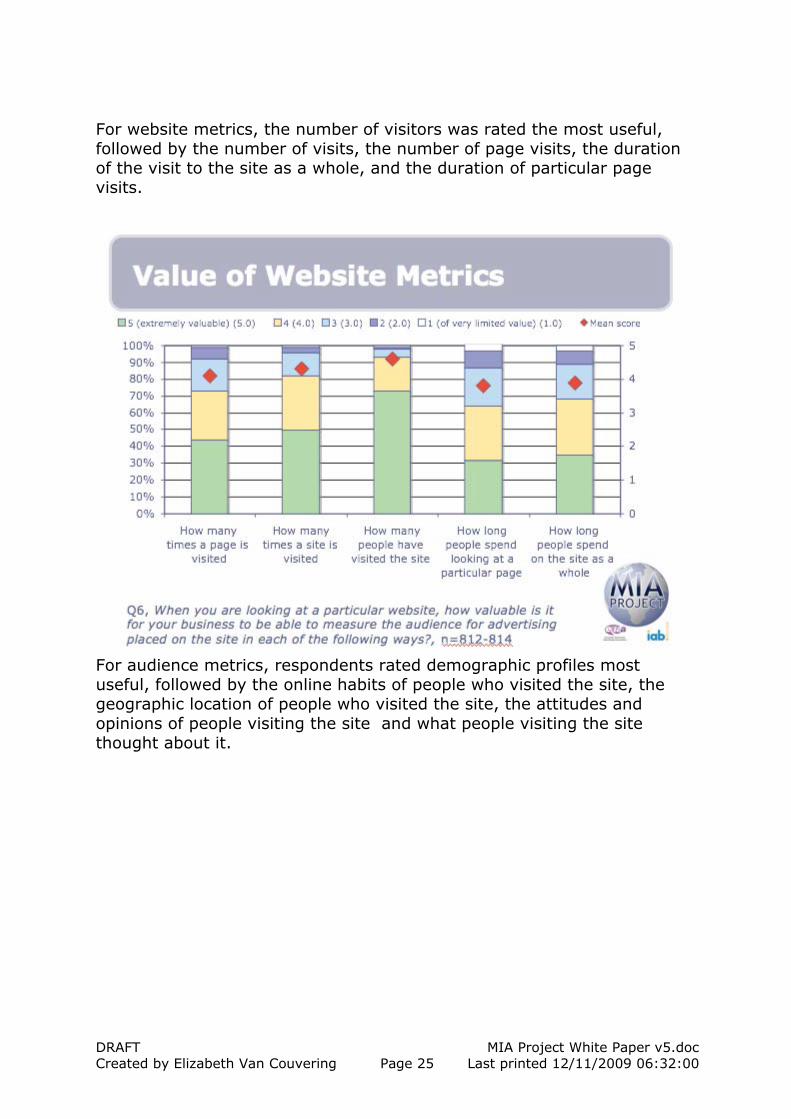
For website metrics, the number of visitors was rated the most useful, followed by the number of visits, the number of page visits, the duration of the visit to the site as a whole, and the duration of particular page visits.
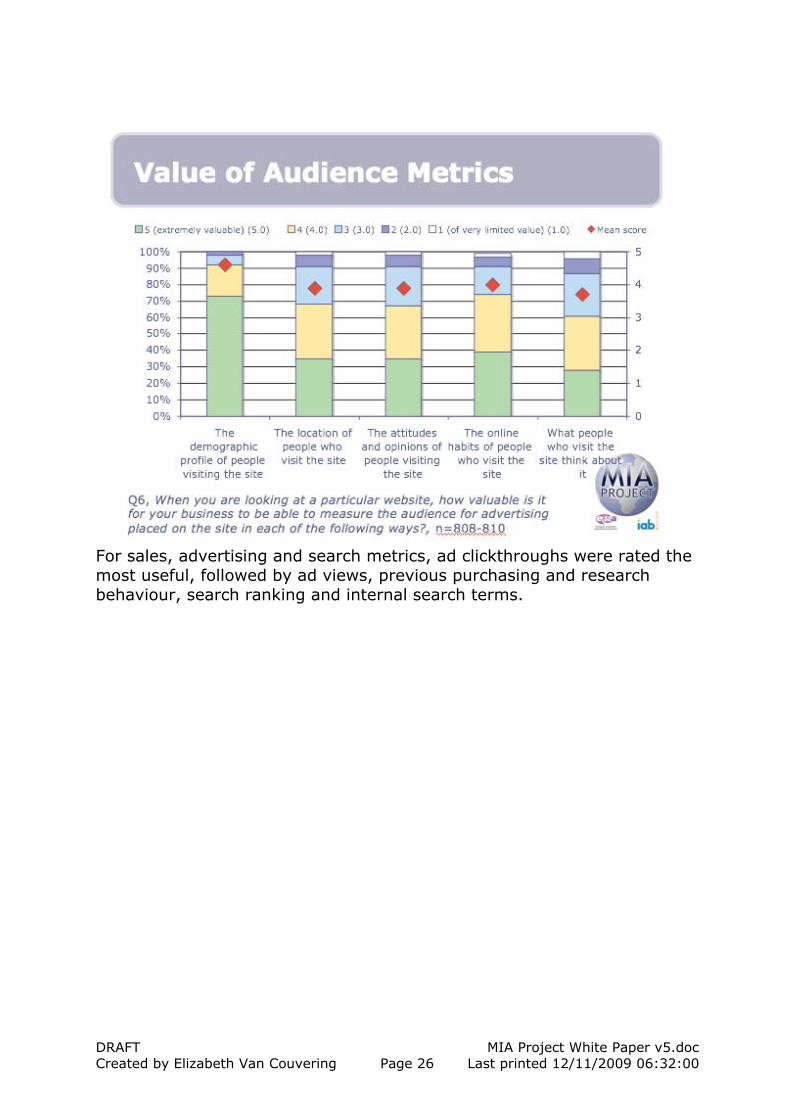
For audience metrics, respondents rated demographic profiles most useful, followed by the online habits of people who visited the site, the geographic location of people who visited the site, the attitudes and opinions of people visiting the site and what people visiting the site thought about it.
DRAFT MIA Project White Paper v5.doc Created by Elizabeth Van Couvering Page 26 Last printed 12/11/2009 06:32:00
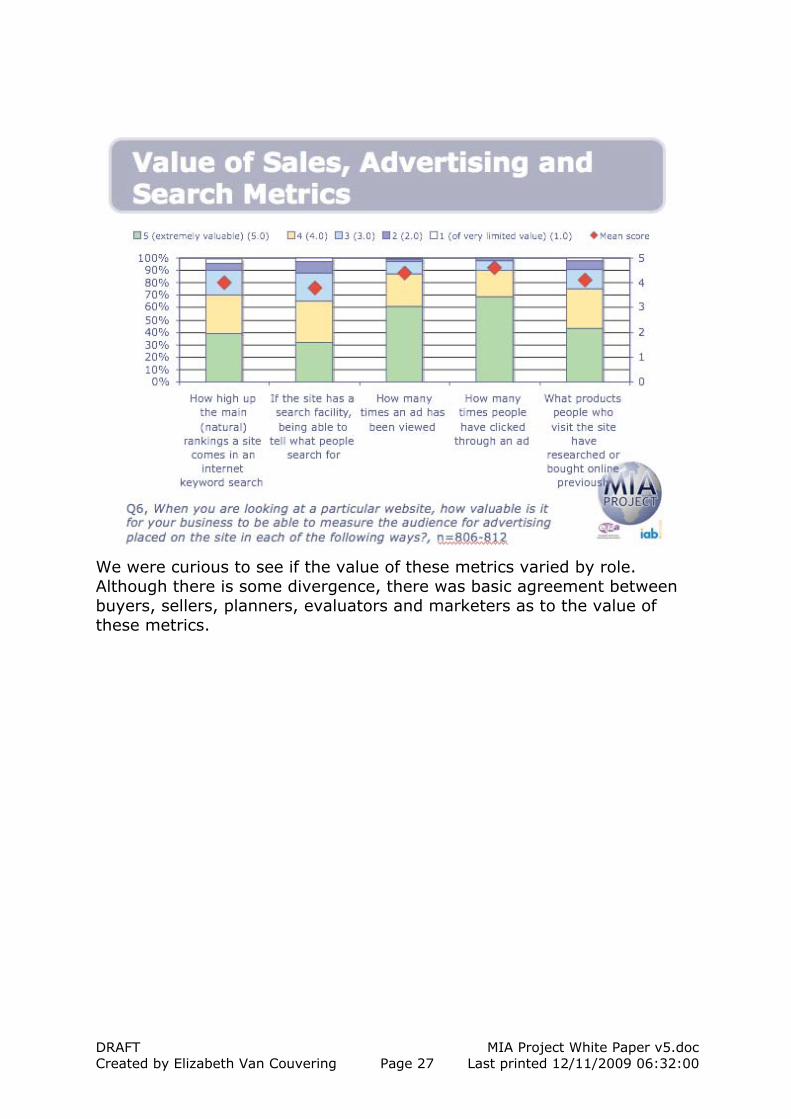
For sales, advertising and search metrics, ad clickthroughs were rated the most useful, followed by ad views, previous purchasing and research behaviour, search ranking and internal search terms.
DRAFT MIA Project White Paper v5.doc Created by Elizabeth Van Couvering Page 27 Last printed 12/11/2009 06:32:00
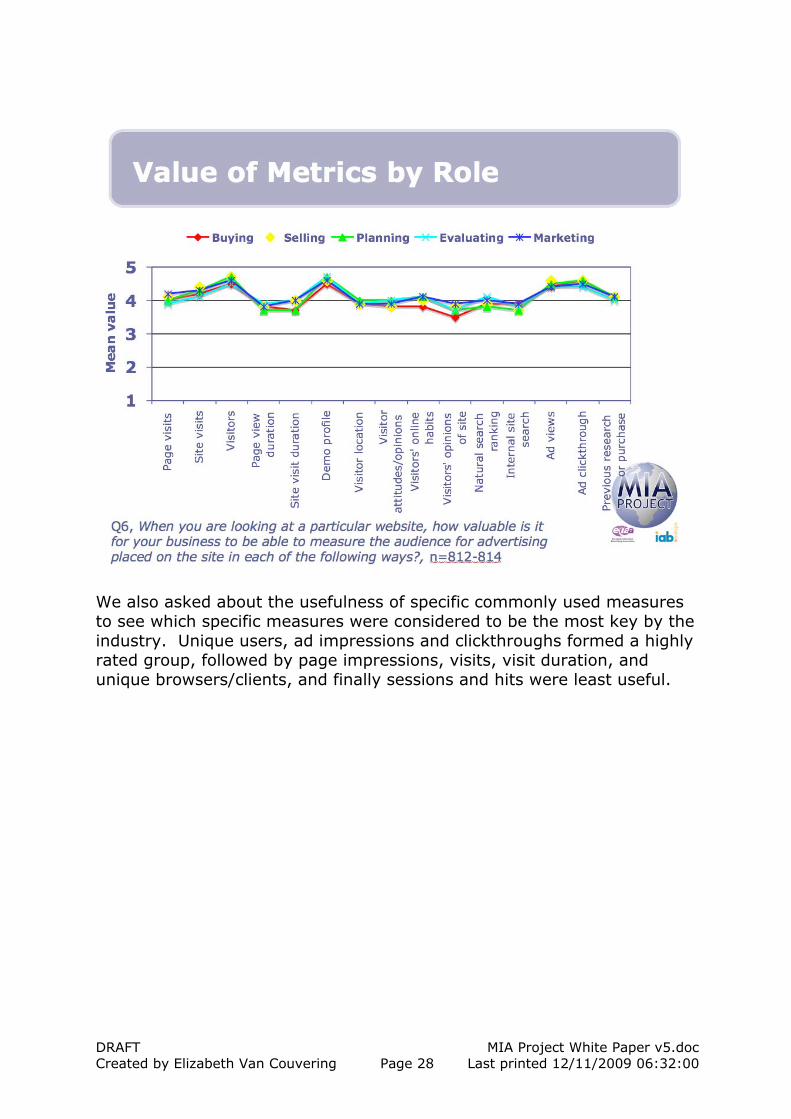
We were curious to see if the value of these metrics varied by role. Although there is some divergence, there was basic agreement between buyers, sellers, planners, evaluators and marketers as to the value of these metrics.
DRAFT MIA Project White Paper v5.doc Created by Elizabeth Van Couvering Page 28 Last printed 12/11/2009 06:32:00
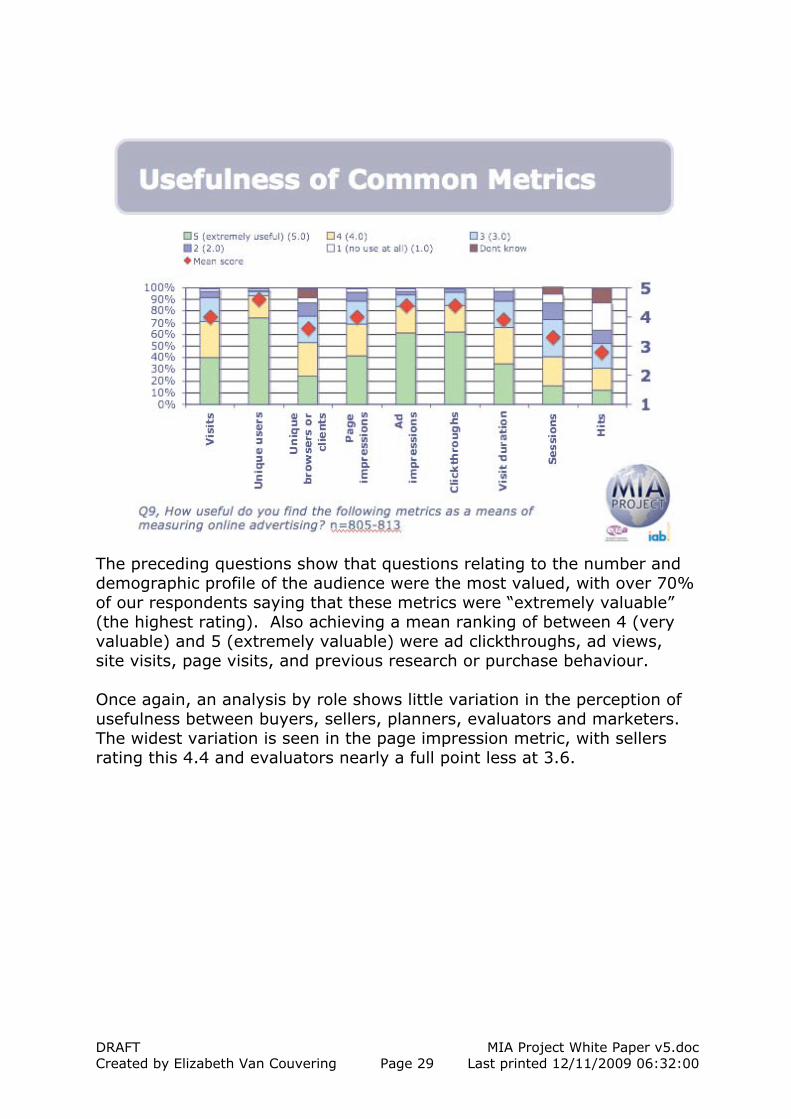
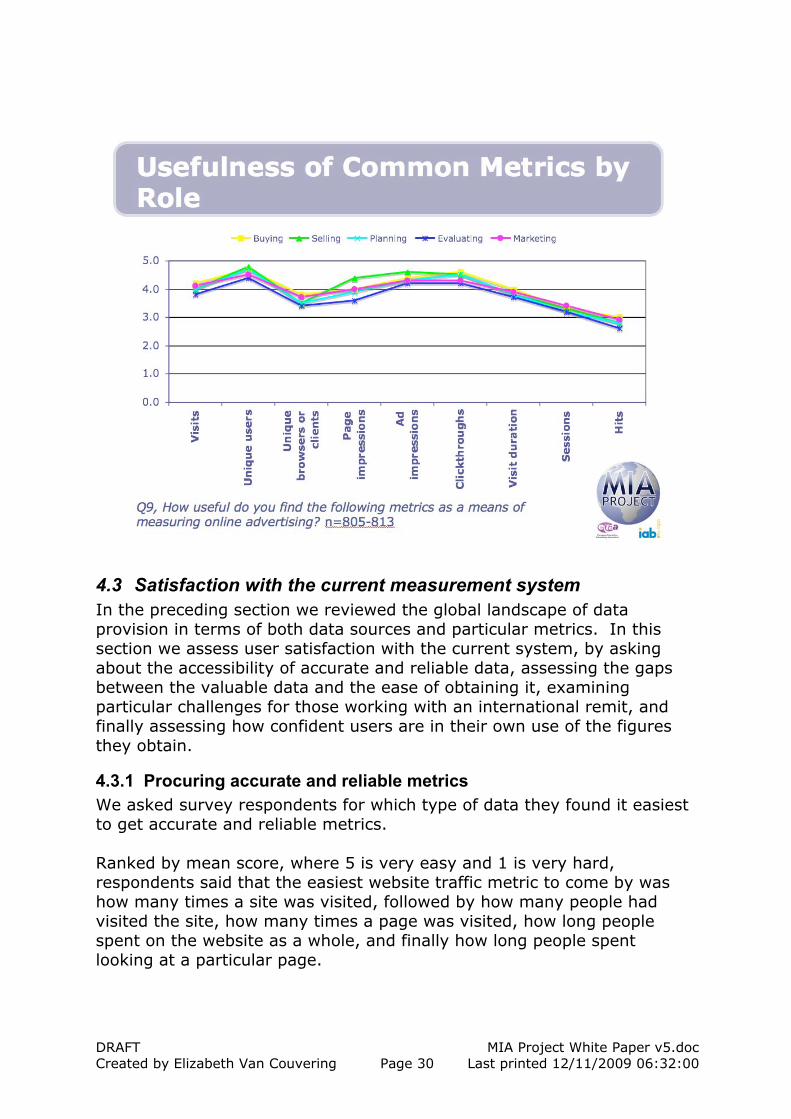
We also asked about the usefulness of specific commonly used measures to see which specific measures were considered to be the most key by the industry. Unique users, ad impressions and clickthroughs formed a highly rated group, followed by page impressions, visits, visit duration, and unique browsers/clients, and finally sessions and hits were least useful.
DRAFT MIA Project White Paper v5.doc Created by Elizabeth Van Couvering Page 29 Last printed 12/11/2009 06:32:00
The preceding questions show that questions relating to the number and demographic profile of the audience were the most valued, with over 70% of our respondents saying that these metrics were “extremely valuable” (the highest rating). Also achieving a mean ranking of between 4 (very valuable) and 5 (extremely valuable) were ad clickthroughs, ad views, site visits, page visits, and previous research or purchase behaviour. Once again, an analysis by role shows little variation in the perception of usefulness between buyers, sellers, planners, evaluators and marketers. The widest variation is seen in the page impression metric, with sellers rating this 4.4 and evaluators nearly a full point less at 3.6.
DRAFT MIA Project White Paper v5.doc Created by Elizabeth Van Couvering Page 30 Last printed 12/11/2009 06:32:00
4.3 Satisfaction with the current measurement system In the preceding section we reviewed the global landscape of data provision in terms of both data sources and particular metrics. In this section we assess user satisfaction with the current system, by asking about the accessibility of accurate and reliable data, assessing the gaps between the valuable data and the ease of obtaining it, examining particular challenges for those working with an international remit, and finally assessing how confident users are in their own use of the figures they obtain.
4.3.1 Procuring accurate and reliable metrics We asked survey respondents for which type of data they found it easiest to get accurate and reliable metrics. Ranked by mean score, where 5 is very easy and 1 is very hard, respondents said that the easiest website traffic metric to come by was how many times a site was visited, followed by how many people had visited the site, how many times a page was visited, how long people spent on the website as a whole, and finally how long people spent looking at a particular page.

DRAFT MIA Project White Paper v5.doc Created by Elizabeth Van Couvering Page 31 Last printed 12/11/2009 06:32:00
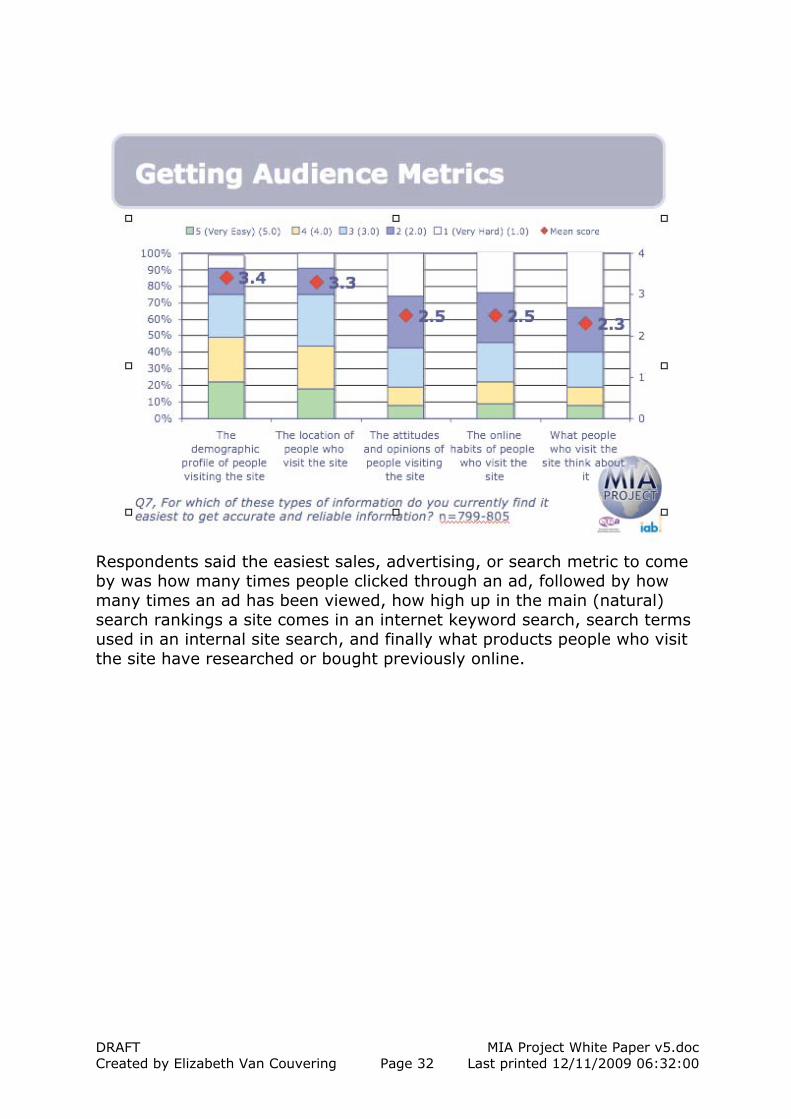
Respondents said that the easiest audience metric to come by was the demographic profile of people visiting the site, followed by the location of people who visit the site. Much less easy to come by were the attitudes and opinions of people visiting the site, the online habits of people who visit the site, and what people who visit the site think about it.
DRAFT MIA Project White Paper v5.doc Created by Elizabeth Van Couvering Page 32 Last printed 12/11/2009 06:32:00
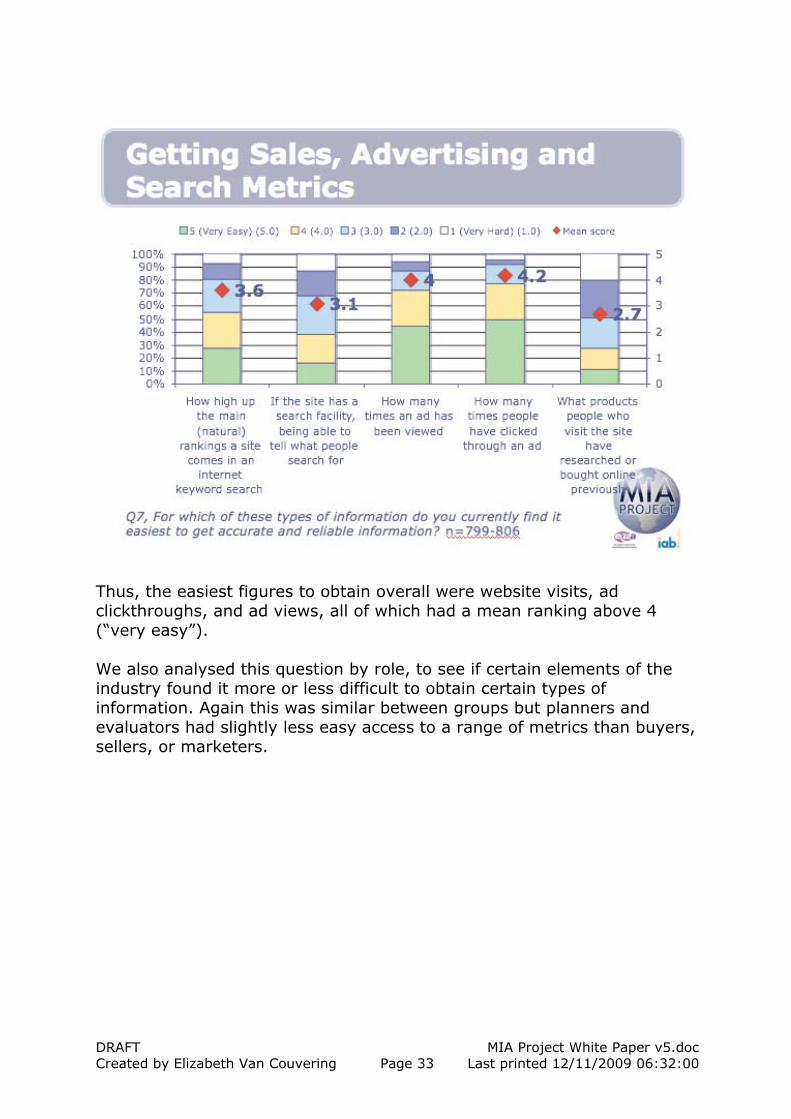
Respondents said the easiest sales, advertising, or search metric to come by was how many times people clicked through an ad, followed by how many times an ad has been viewed, how high up in the main (natural) search rankings a site comes in an internet keyword search, search terms used in an internal site search, and finally what products people who visit the site have researched or bought previously online.
DRAFT MIA Project White Paper v5.doc Created by Elizabeth Van Couvering Page 33 Last printed 12/11/2009 06:32:00
Thus, the easiest figures to obtain overall were website visits, ad clickthroughs, and ad views, all of which had a mean ranking above 4 (“very easy”). We also analysed this question by role, to see if certain elements of the industry found it more or less difficult to obtain certain types of information. Again this was similar between groups but planners and evaluators had slightly less easy access to a range of metrics than buyers, sellers, or marketers.
DRAFT MIA Project White Paper v5.doc Created by Elizabeth Van Couvering Page 34 Last printed 12/11/2009 06:32:00
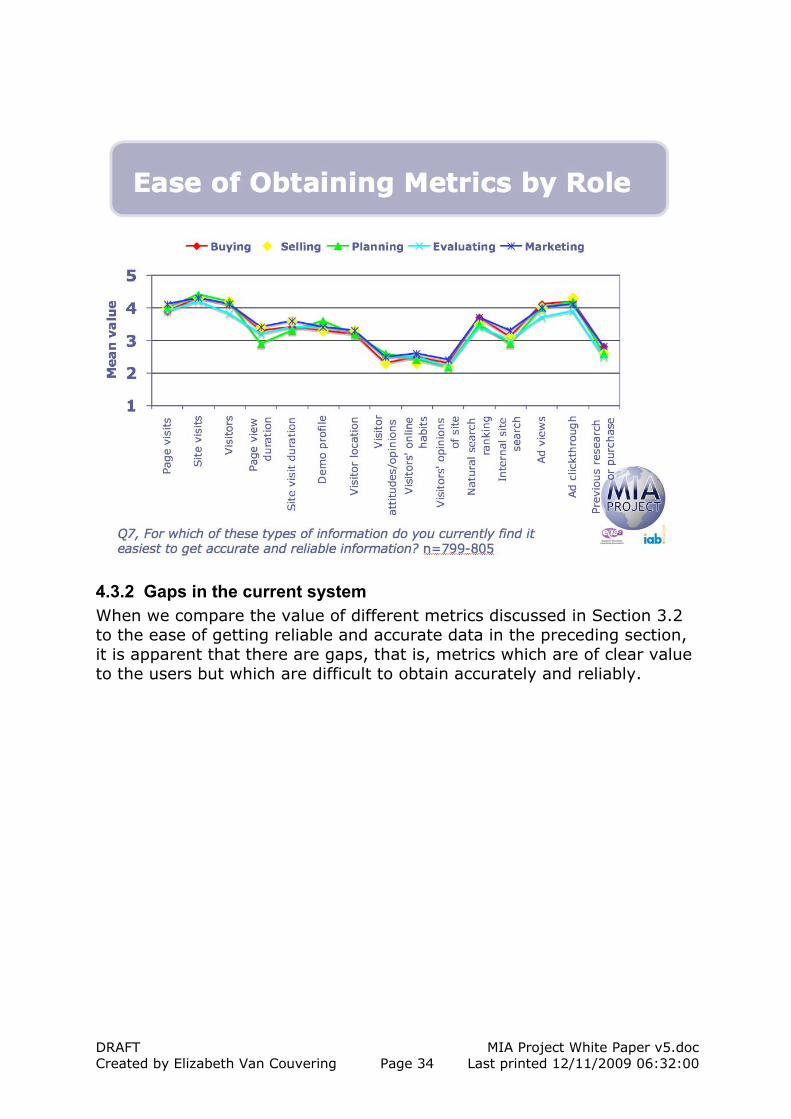
4.3.2 Gaps in the current system When we compare the value of different metrics discussed in Section 3.2 to the ease of getting reliable and accurate data in the preceding section, it is apparent that there are gaps, that is, metrics which are of clear value to the users but which are difficult to obtain accurately and reliably.
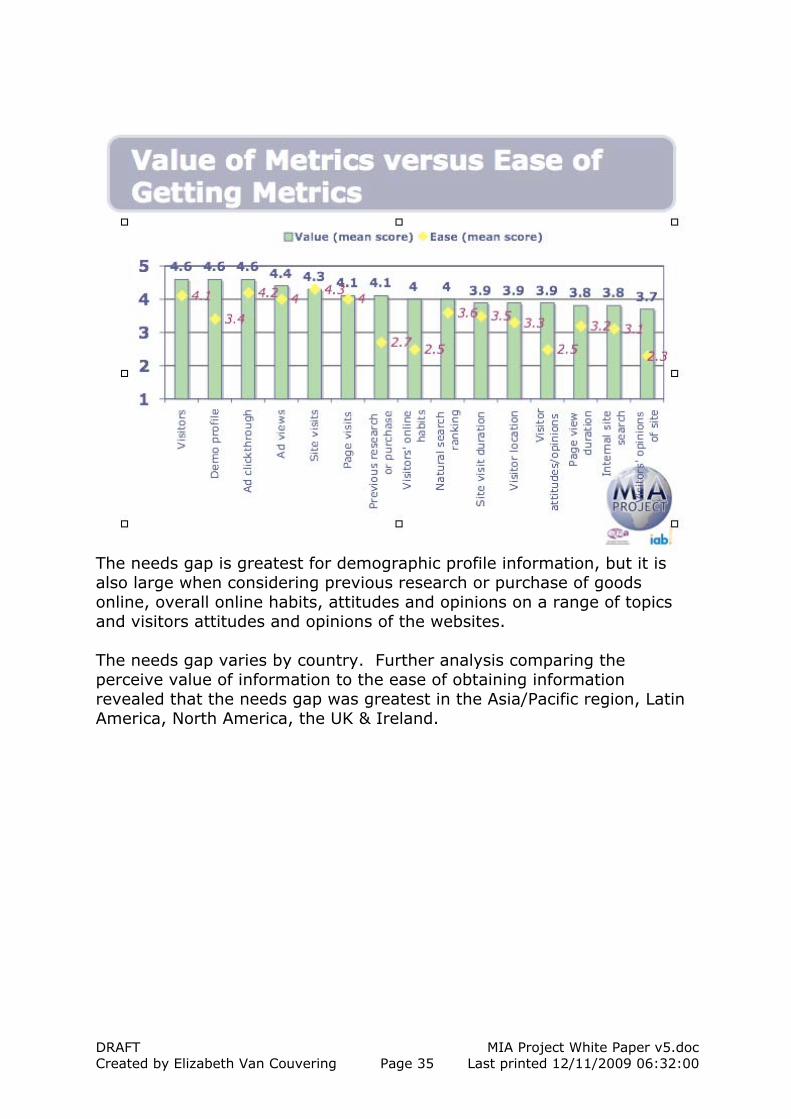
DRAFT MIA Project White Paper v5.doc Created by Elizabeth Van Couvering Page 35 Last printed 12/11/2009 06:32:00
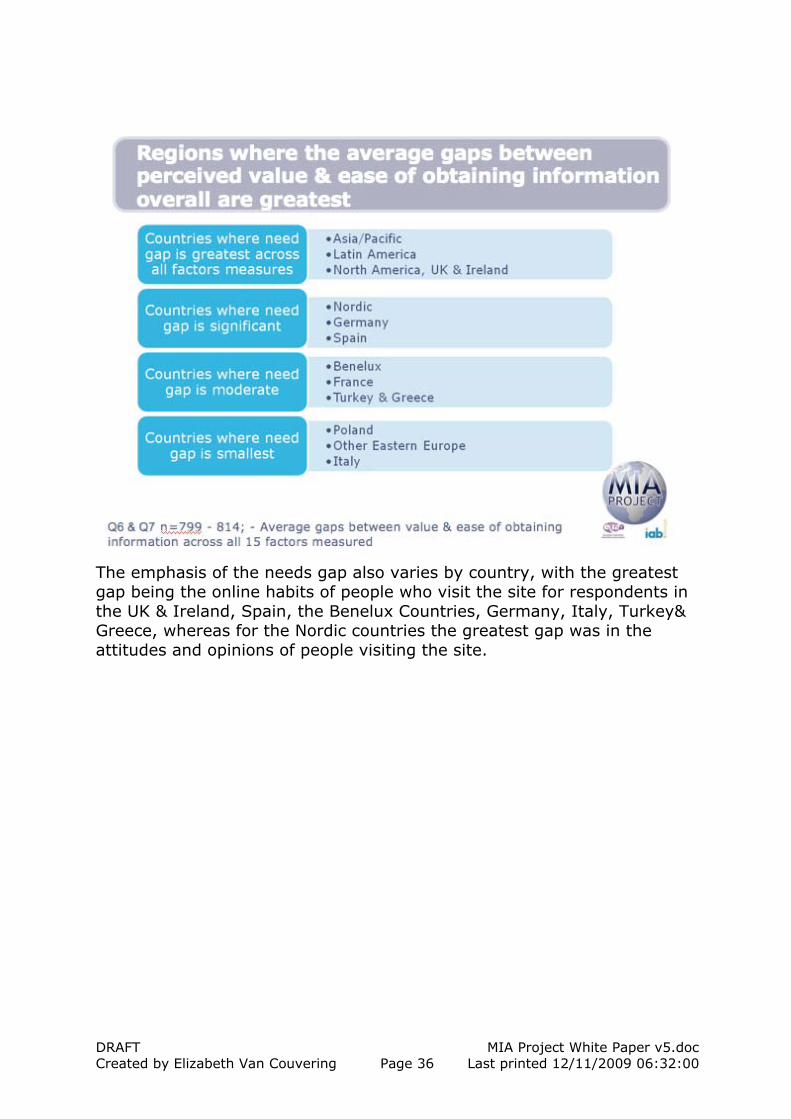
The needs gap is greatest for demographic profile information, but it is also large when considering previous research or purchase of goods online, overall online habits, attitudes and opinions on a range of topics and visitors attitudes and opinions of the websites. The needs gap varies by country. Further analysis comparing the perceive value of information to the ease of obtaining information revealed that the needs gap was greatest in the Asia/Pacific region, Latin America, North America, the UK & Ireland.
DRAFT MIA Project White Paper v5.doc Created by Elizabeth Van Couvering Page 36 Last printed 12/11/2009 06:32:00
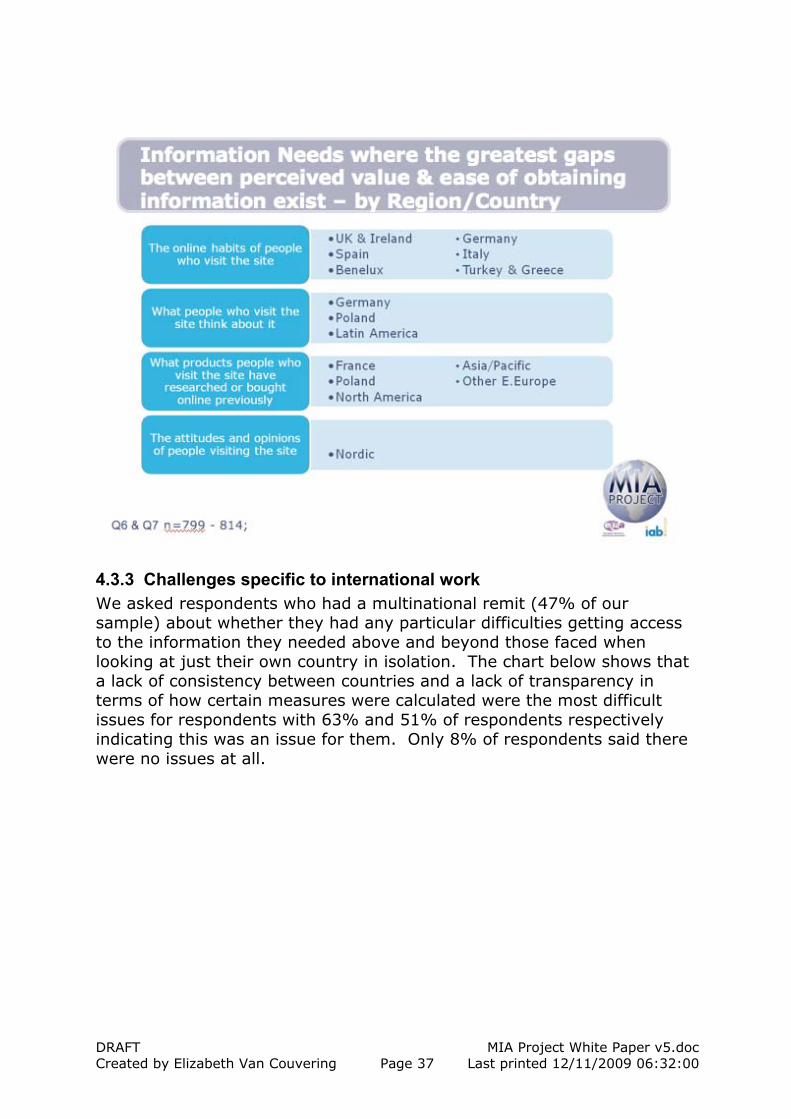
The emphasis of the needs gap also varies by country, with the greatest gap being the online habits of people who visit the site for respondents in the UK & Ireland, Spain, the Benelux Countries, Germany, Italy, Turkey& Greece, whereas for the Nordic countries the greatest gap was in the attitudes and opinions of people visiting the site.
DRAFT MIA Project White Paper v5.doc Created by Elizabeth Van Couvering Page 37 Last printed 12/11/2009 06:32:00
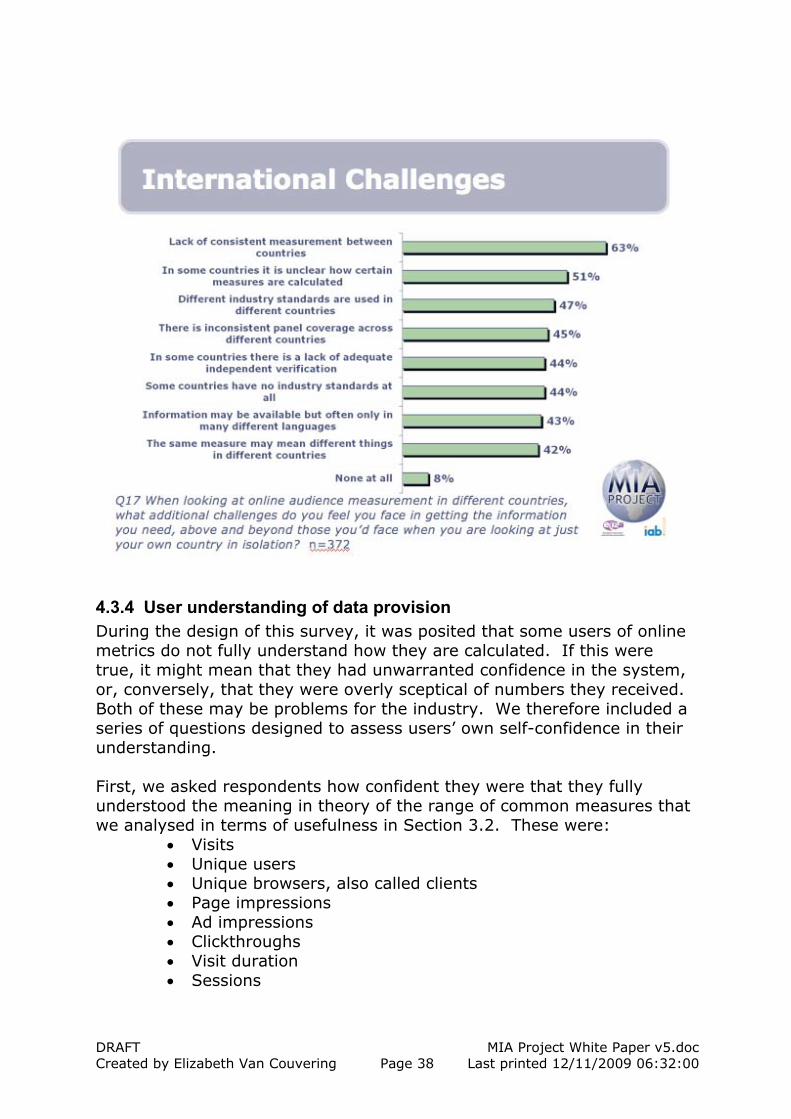
4.3.3 Challenges specific to international work We asked respondents who had a multinational remit (47% of our sample) about whether they had any particular difficulties getting access to the information they needed above and beyond those faced when looking at just their own country in isolation. The chart below shows that a lack of consistency between countries and a lack of transparency in terms of how certain measures were calculated were the most difficult issues for respondents with 63% and 51% of respondents respectively indicating this was an issue for them. Only 8% of respondents said there were no issues at all.
DRAFT MIA Project White Paper v5.doc Created by Elizabeth Van Couvering Page 38 Last printed 12/11/2009 06:32:00
4.3.4 User understanding of data provision During the design of this survey, it was posited that some users of online metrics do not fully understand how they are calculated. If this were true, it might mean that they had unwarranted confidence in the system, or, conversely, that they were overly sceptical of numbers they received. Both of these may be problems for the industry. We therefore included a series of questions designed to assess users’ own self-confidence in their understanding. First, we asked respondents how confident they were that they fully understood the meaning in theory of the range of common measures that we analysed in terms of usefulness in Section 3.2. These were:
• Visits • Unique users • Unique browsers, also called clients • Page impressions • Ad impressions • Clickthroughs • Visit duration • Sessions
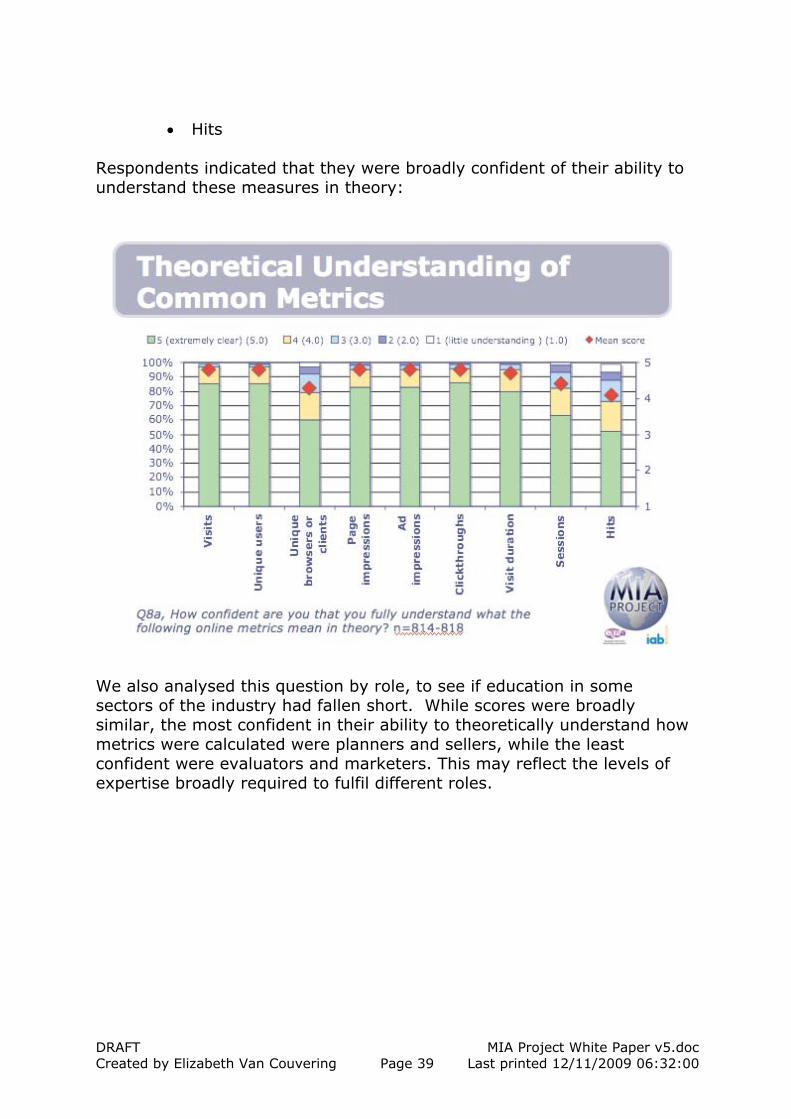
DRAFT MIA Project White Paper v5.doc Created by Elizabeth Van Couvering Page 39 Last printed 12/11/2009 06:32:00
• Hits Respondents indicated that they were broadly confident of their ability to understand these measures in theory:
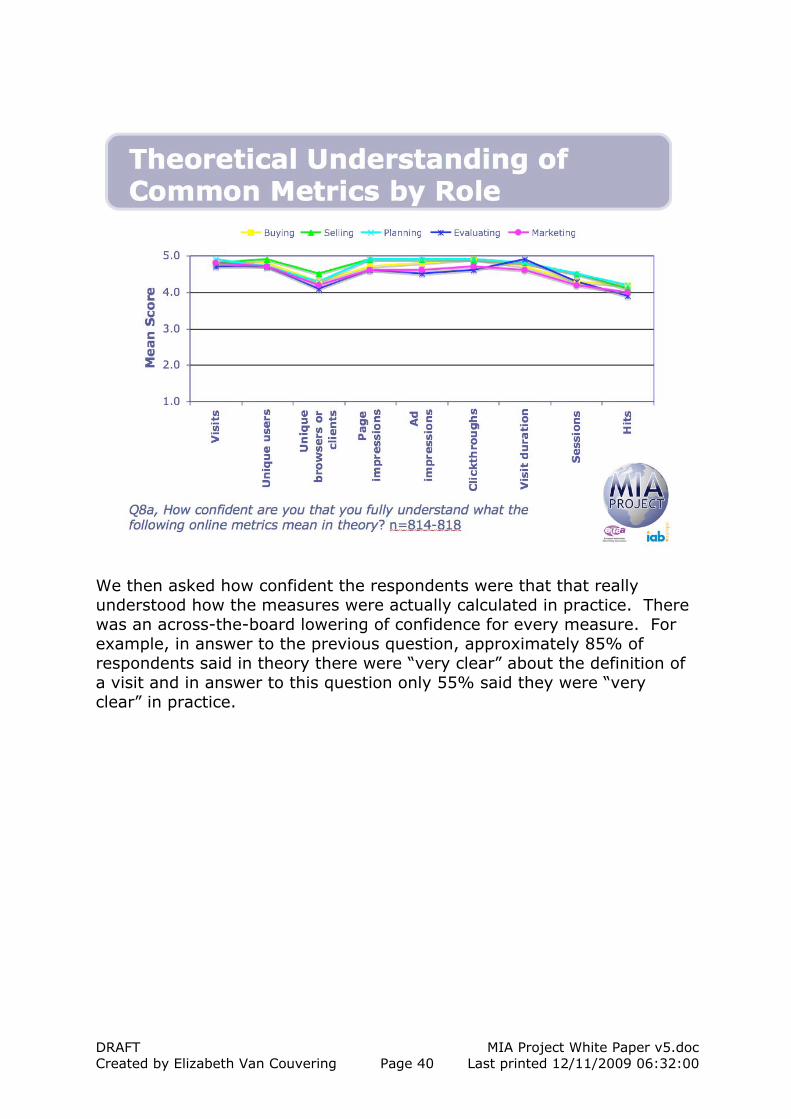
We also analysed this question by role, to see if education in some sectors of the industry had fallen short. While scores were broadly similar, the most confident in their ability to theoretically understand how metrics were calculated were planners and sellers, while the least confident were evaluators and marketers. This may reflect the levels of expertise broadly required to fulfil different roles.
DRAFT MIA Project White Paper v5.doc Created by Elizabeth Van Couvering Page 40 Last printed 12/11/2009 06:32:00
We then asked how confident the respondents were that that really understood how the measures were actually calculated in practice. There was an across-the-board lowering of confidence for every measure. For example, in answer to the previous question, approximately 85% of respondents said in theory there were “very clear” about the definition of a visit and in answer to this question only 55% said they were “very clear” in practice.
DRAFT MIA Project White Paper v5.doc Created by Elizabeth Van Couvering Page 41 Last printed 12/11/2009 06:32:00
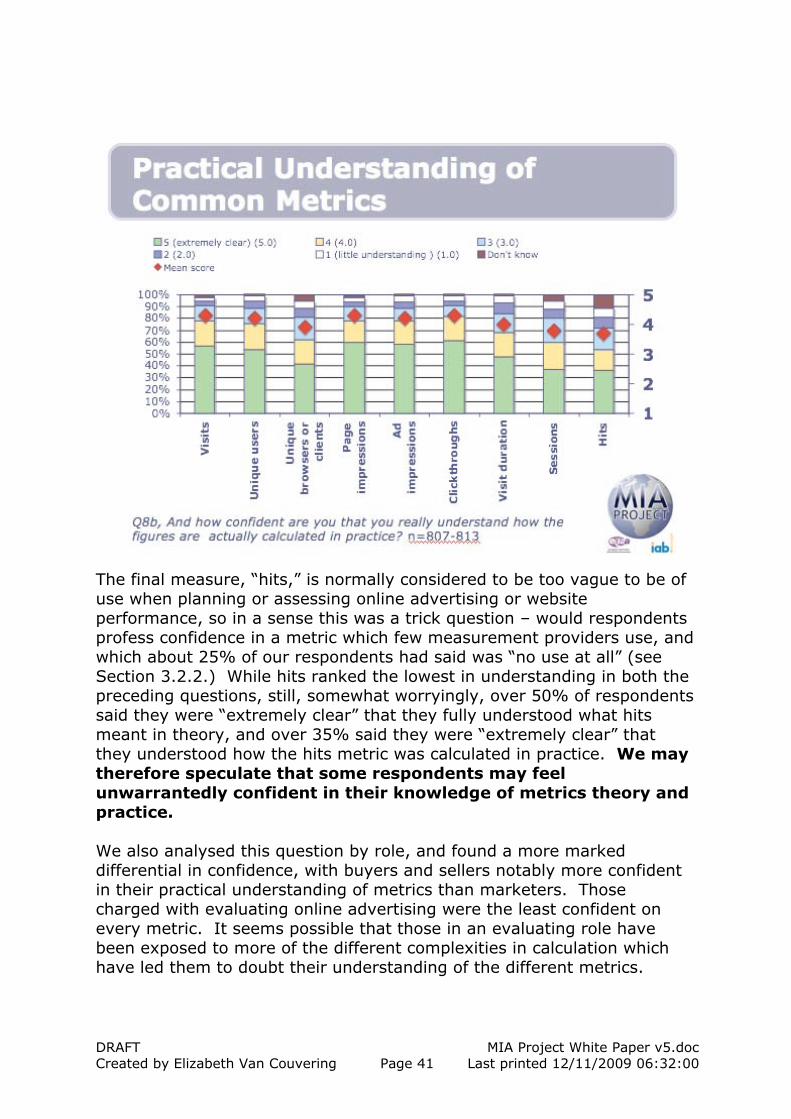
The final measure, “hits,” is normally considered to be too vague to be of use when planning or assessing online advertising or website performance, so in a sense this was a trick question – would respondents profess confidence in a metric which few measurement providers use, and which about 25% of our respondents had said was “no use at all” (see Section 3.2.2.) While hits ranked the lowest in understanding in both the preceding questions, still, somewhat worryingly, over 50% of respondents said they were “extremely clear” that they fully understood what hits meant in theory, and over 35% said they were “extremely clear” that they understood how the hits metric was calculated in practice. We may therefore speculate that some respondents may feel unwarrantedly confident in their knowledge of metrics theory and practice. We also analysed this question by role, and found a more marked differential in confidence, with buyers and sellers notably more confident in their practical understanding of metrics than marketers. Those charged with evaluating online advertising were the least confident on every metric. It seems possible that those in an evaluating role have been exposed to more of the different complexities in calculation which have led them to doubt their understanding of the different metrics.
DRAFT MIA Project White Paper v5.doc Created by Elizabeth Van Couvering Page 42 Last printed 12/11/2009 06:32:00
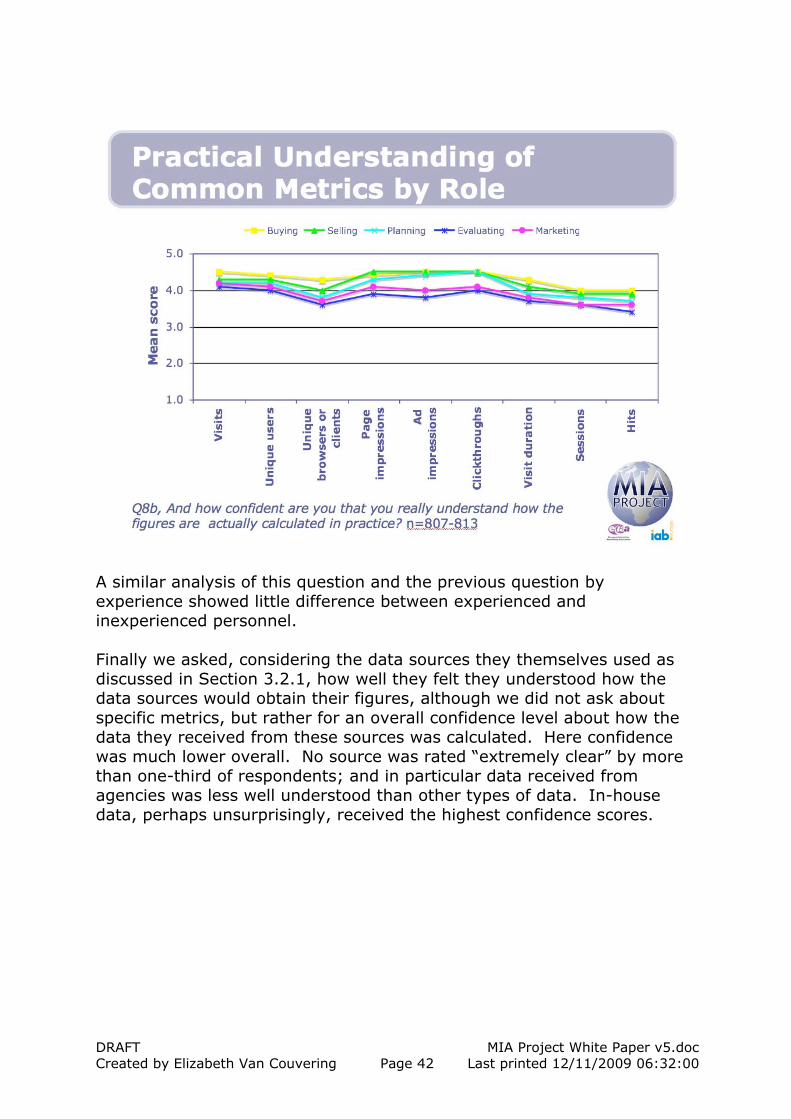
A similar analysis of this question and the previous question by experience showed little difference between experienced and inexperienced personnel. Finally we asked, considering the data sources they themselves used as discussed in Section 3.2.1, how well they felt they understood how the data sources would obtain their figures, although we did not ask about specific metrics, but rather for an overall confidence level about how the data they received from these sources was calculated. Here confidence was much lower overall. No source was rated “extremely clear” by more than one-third of respondents; and in particular data received from agencies was less well understood than other types of data. In-house data, perhaps unsurprisingly, received the highest confidence scores.
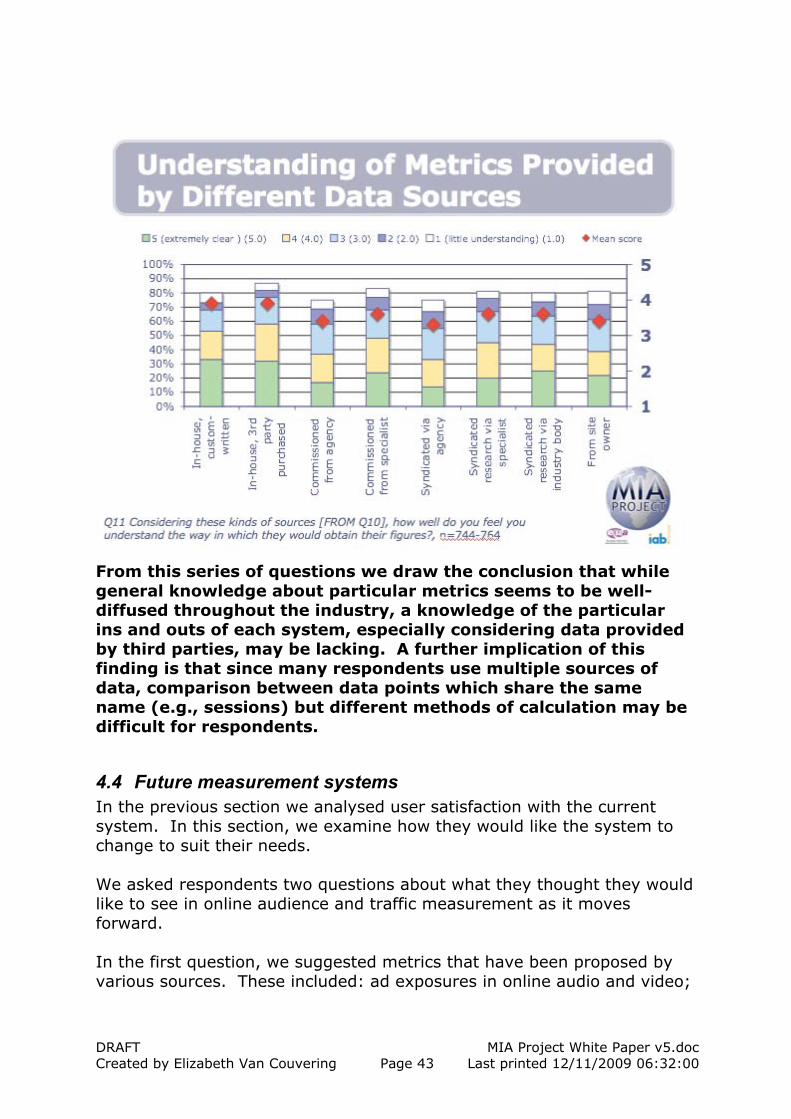
DRAFT MIA Project White Paper v5.doc Created by Elizabeth Van Couvering Page 43 Last printed 12/11/2009 06:32:00
From this series of questions we draw the conclusion that while general knowledge about particular metrics seems to be well-diffused throughout the industry, a knowledge of the particular ins and outs of each system, especially considering data provided by third parties, may be lacking. A further implication of this finding is that since many respondents use multiple sources of data, comparison between data points which share the same name (e.g., sessions) but different methods of calculation may be difficult for respondents.
4.4 Future measurement systems In the previous section we analysed user satisfaction with the current system. In this section, we examine how they would like the system to change to suit their needs. We asked respondents two questions about what they thought they would like to see in online audience and traffic measurement as it moves forward. In the first question, we suggested metrics that have been proposed by various sources. These included: ad exposures in online audio and video;
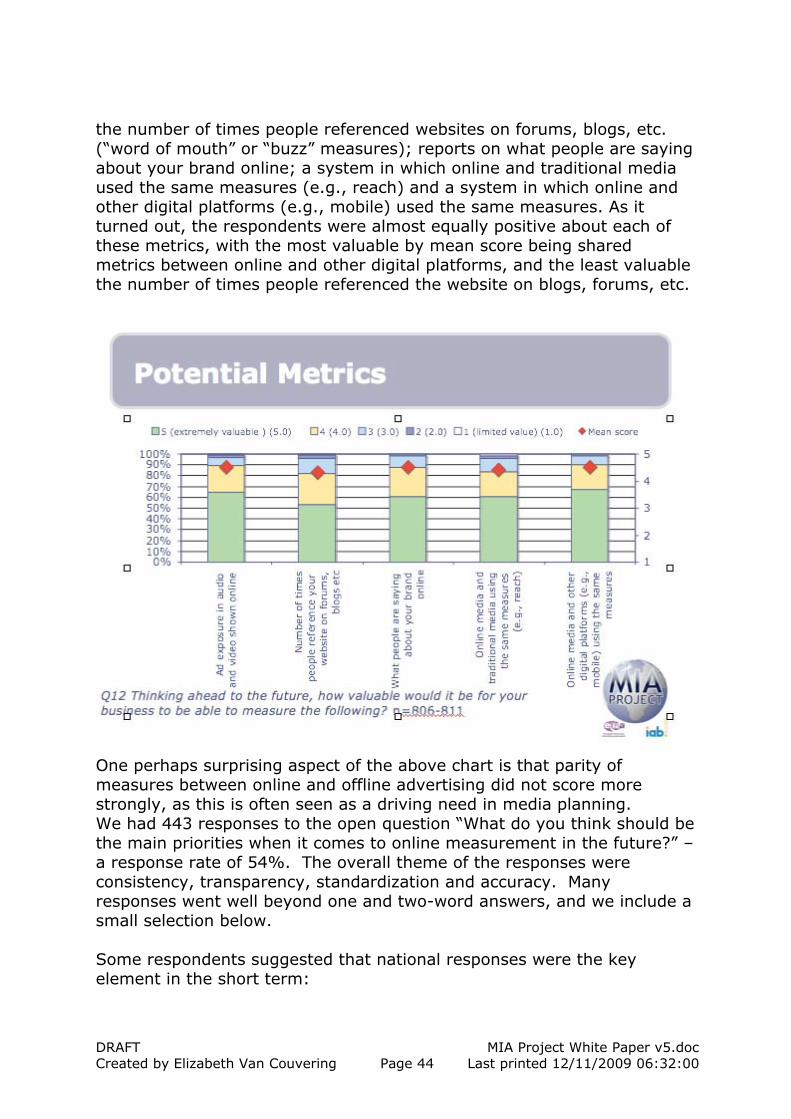
DRAFT MIA Project White Paper v5.doc Created by Elizabeth Van Couvering Page 44 Last printed 12/11/2009 06:32:00
the number of times people referenced websites on forums, blogs, etc. (“word of mouth” or “buzz” measures); reports on what people are saying about your brand online; a system in which online and traditional media used the same measures (e.g., reach) and a system in which online and other digital platforms (e.g., mobile) used the same measures. As it turned out, the respondents were almost equally positive about each of these metrics, with the most valuable by mean score being shared metrics between online and other digital platforms, and the least valuable the number of times people referenced the website on blogs, forums, etc.
One perhaps surprising aspect of the above chart is that parity of measures between online and offline advertising did not score more strongly, as this is often seen as a driving need in media planning. We had 443 responses to the open question “What do you think should be the main priorities when it comes to online measurement in the future?” – a response rate of 54%. The overall theme of the responses were consistency, transparency, standardization and accuracy. Many responses went well beyond one and two-word answers, and we include a small selection below. Some respondents suggested that national responses were the key element in the short term:
DRAFT MIA Project White Paper v5.doc Created by Elizabeth Van Couvering Page 45 Last printed 12/11/2009 06:32:00
“Let's get a common currency in the UK first before thinking about a global approach.” (UK) “Firstly a platform for common measurement should be secured in Turkish Market.” (Turkey) “More consistency in the data available in each country. Need to have deeper insights in audience measurement (lifestyle, product usage, media usage, etc.) Ability to measure all media and see the interactivity of multiple media (ex. Watching T.V. and using the web at the same time, etc.) Need a more sophisticated approach for all media measurement.” (Canada) Others were clear that an international response was needed: “Consistent practice in audience measurement that satisfies basic social science survey rules. Transparency in methods/practices so we know how comparable data are across countries. If we know the differences we can adjust for them.” (US) “To obtain the relative position of online media to other media channels. Realizing a consistent measure whereby results can be varified across platforms, preferably across countries, so that international comparisons of effects in different channels across different territories can be evaluated. Making it possible to assess the relative value per window (online, mobile, television, digital out of home, radio online radio etc) in any given concept. Measures should be assessed by independent parties and preferably be controlled by some means of accountancy on their ability to meet the standards.” (Netherlands) Some thought online media should improve its own metrics: “Broadening standardized metrics to various subtopics: mobile measurement, video measurement, social media metrics, application metrics, intranet metrics. At the moment standard approaches are quite strongly limited to regular web analytics.” (Finland) “Focus on contextual advertising rather than demographics - play to the strengths of the medium, rather than trying to match the (often inaccurate) metrics and selling methods of off-line advertisers. Don't be obsessed by different vendors' differing methodologies – the differences … are less an issue than the quality and method of implementation.” (Australia)

DRAFT MIA Project White Paper v5.doc Created by Elizabeth Van Couvering Page 46 Last printed 12/11/2009 06:32:00
“There needs to be an understanding that a ''One size fits all'' approach to web measurement is not only unhelpful but unrealistic. Media companies have very different needs to say online banking or retail. Media needs it's OWN data.” (Canada) “A simple common currency will be a real driver of acceptance of this medium.” (UK) Many others were clear that a cross-media approach was needed: “Common currency between online and offline, enabling advertisers and planners to structure campaigns in a properly balanced way, getting what they need from each of the media alternatives.” (China) “Common measurement token between online & offline media, should be the main priority. This will help traditional planners & marketeers grasp and therefore use online media more safely.” (Greece) “Firstly, getting digital on the same basic level as traditional media; reach and frequency and demographic metrics, so that online display advertising can get its place on a media plan. Done in a transparent way that planners and buyers can trust.” (UK) “Online needs to be easy to buy for people who have not bought it previosuly. To do this we need to be clear, consistent and confident in the way we measure online media, and we must do so in a way which makes sense to people outside our industry. We also need to prove the value of online media in influencing offline activities, and be able to accurately measure the impact of online media in campaigns spanning multiple channels.” (Australia) Some also had views about the process that should be undertaken: “Independent audit organization that can normalize the wide variety of measurements.” (US) “Proper development of a rigorous methodology by industry recognized steering committee including representatives from advertisers, digital agencies, media buyers and independent research bodies e.g. the Market Research Society, ESOMAR etc, i.e. not driven by self interest. Include academics as well. This should not be developed as a proprietary product, but as a methodology agreed to and applied by all.” (UK) “Serious and detailed scrutiny before jumping to conclusions regarding choice of methods, suppliers, presentation structure etc” (Sweden)
DRAFT MIA Project White Paper v5.doc Created by Elizabeth Van Couvering Page 47 Last printed 12/11/2009 06:32:00
“Each country should develop a standard Joint Industry Measurement System - funded predominantly by media owners but with agency contribution. Marketing budgets are general set at local level so no need for a European/Global measurements system in the short to medium term.” (UK) “We can’t find ways to actually simplify online media metrics for marketers who don’t want to understand them. We are stuck in a world of multiple metrics, vendors, and methodologies. But we have to find ways to make them SEEM simpler so those marketers can avoid the complexity they don’t want to see.” (Australia) These are just a sampling of the comments that we received. More comments can be viewed at http://www.miaproject.org
4.5 The importance of measurement issues In the previous sections we examined user satisfaction with the current system and what they would like to see from any future system. However, we also wanted to address how important they felt these issues were to their business.
4.5.1 Quality in online advertising and traffic measures We asked survey respondents about how important they thought it was that data providers deliver a high quality of metrics. Nearly 100% of our sample said that producing metrics that were clearly and transparently calculated and that were also consistent was either “extremely important” or “very important”. Conforming to industry standards and being externally validated were also important to our respondents.
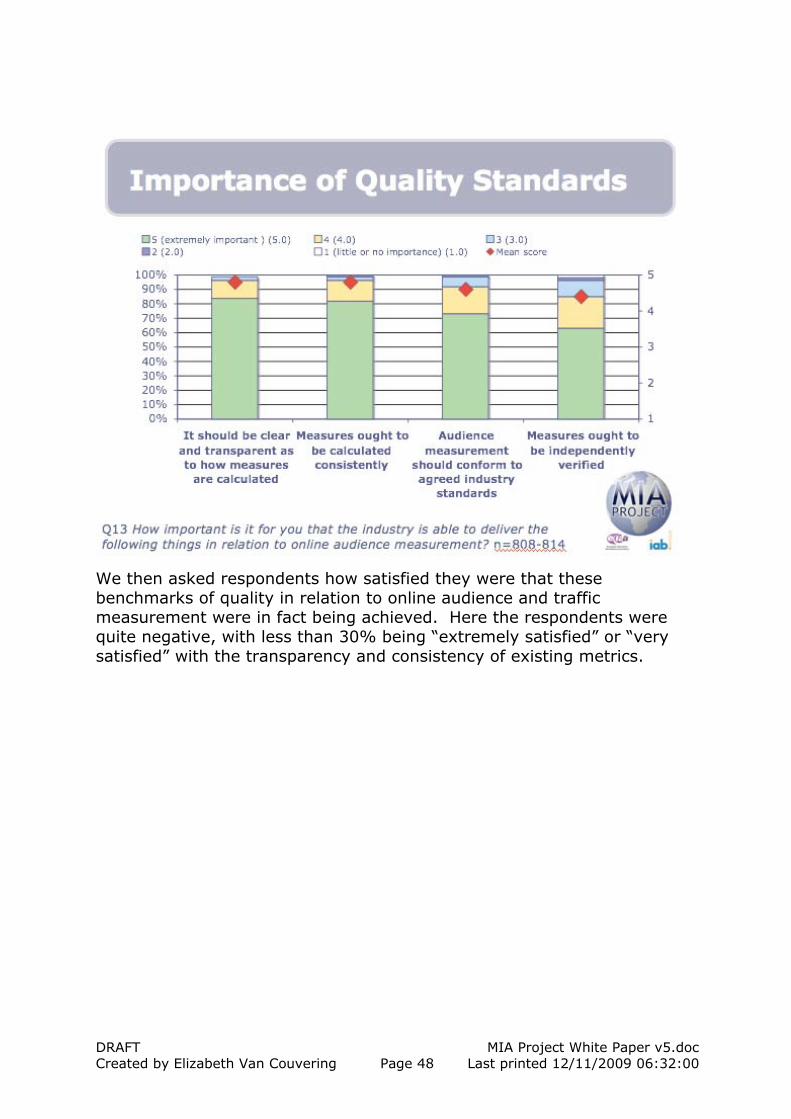
DRAFT MIA Project White Paper v5.doc Created by Elizabeth Van Couvering Page 48 Last printed 12/11/2009 06:32:00
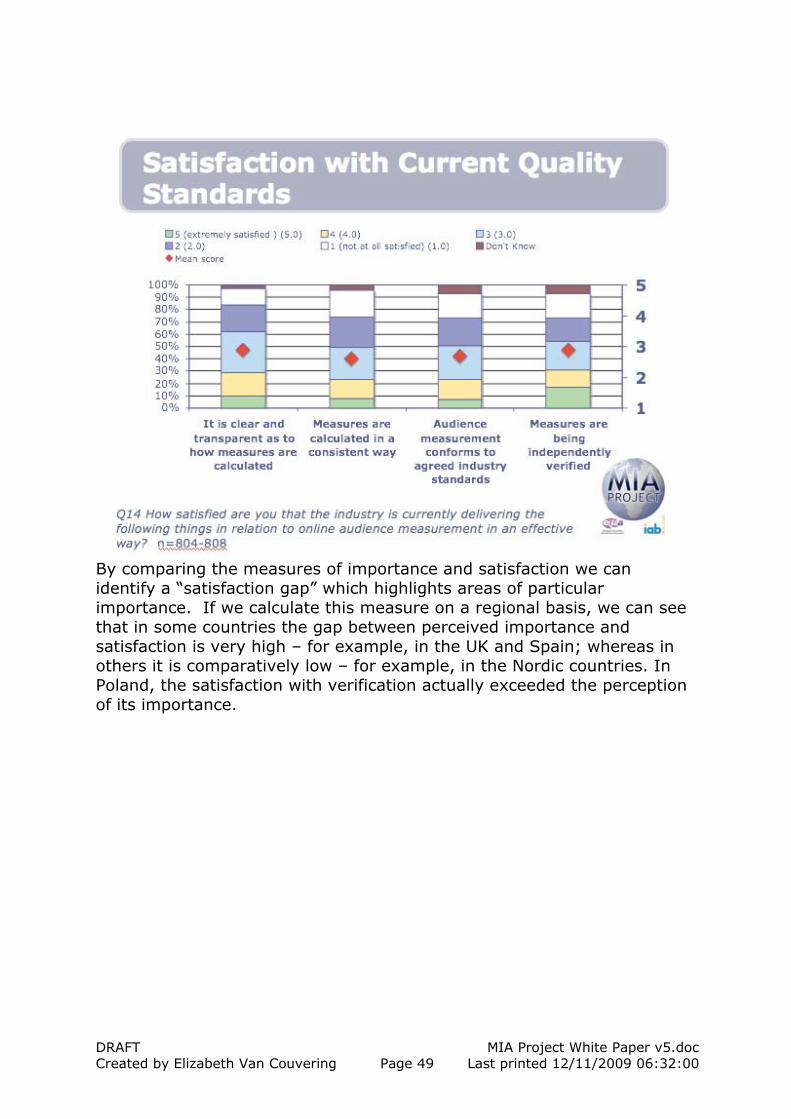
We then asked respondents how satisfied they were that these benchmarks of quality in relation to online audience and traffic measurement were in fact being achieved. Here the respondents were quite negative, with less than 30% being “extremely satisfied” or “very satisfied” with the transparency and consistency of existing metrics.
DRAFT MIA Project White Paper v5.doc Created by Elizabeth Van Couvering Page 49 Last printed 12/11/2009 06:32:00
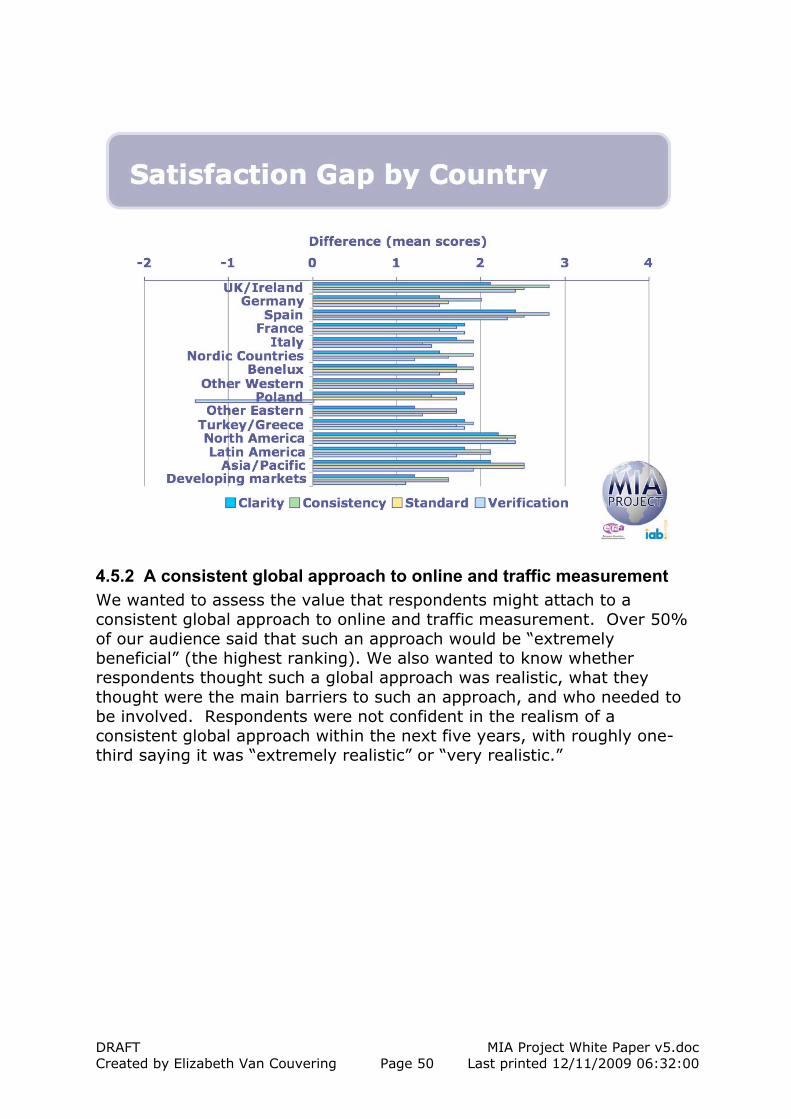
By comparing the measures of importance and satisfaction we can identify a “satisfaction gap” which highlights areas of particular importance. If we calculate this measure on a regional basis, we can see that in some countries the gap between perceived importance and satisfaction is very high – for example, in the UK and Spain; whereas in others it is comparatively low – for example, in the Nordic countries. In Poland, the satisfaction with verification actually exceeded the perception of its importance.
DRAFT MIA Project White Paper v5.doc Created by Elizabeth Van Couvering Page 50 Last printed 12/11/2009 06:32:00
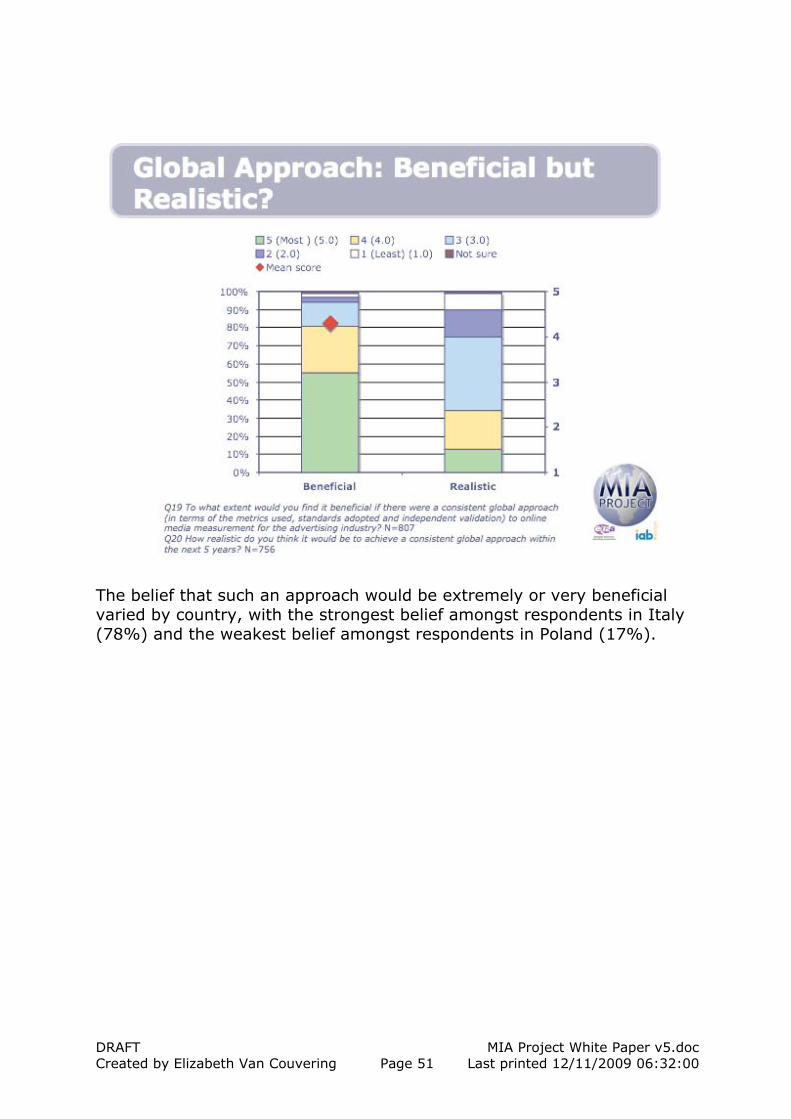
4.5.2 A consistent global approach to online and traffic measurement We wanted to assess the value that respondents might attach to a consistent global approach to online and traffic measurement. Over 50% of our audience said that such an approach would be “extremely beneficial” (the highest ranking). We also wanted to know whether respondents thought such a global approach was realistic, what they thought were the main barriers to such an approach, and who needed to be involved. Respondents were not confident in the realism of a consistent global approach within the next five years, with roughly one-third saying it was “extremely realistic” or “very realistic.”
DRAFT MIA Project White Paper v5.doc Created by Elizabeth Van Couvering Page 51 Last printed 12/11/2009 06:32:00
The belief that such an approach would be extremely or very beneficial varied by country, with the strongest belief amongst respondents in Italy (78%) and the weakest belief amongst respondents in Poland (17%).
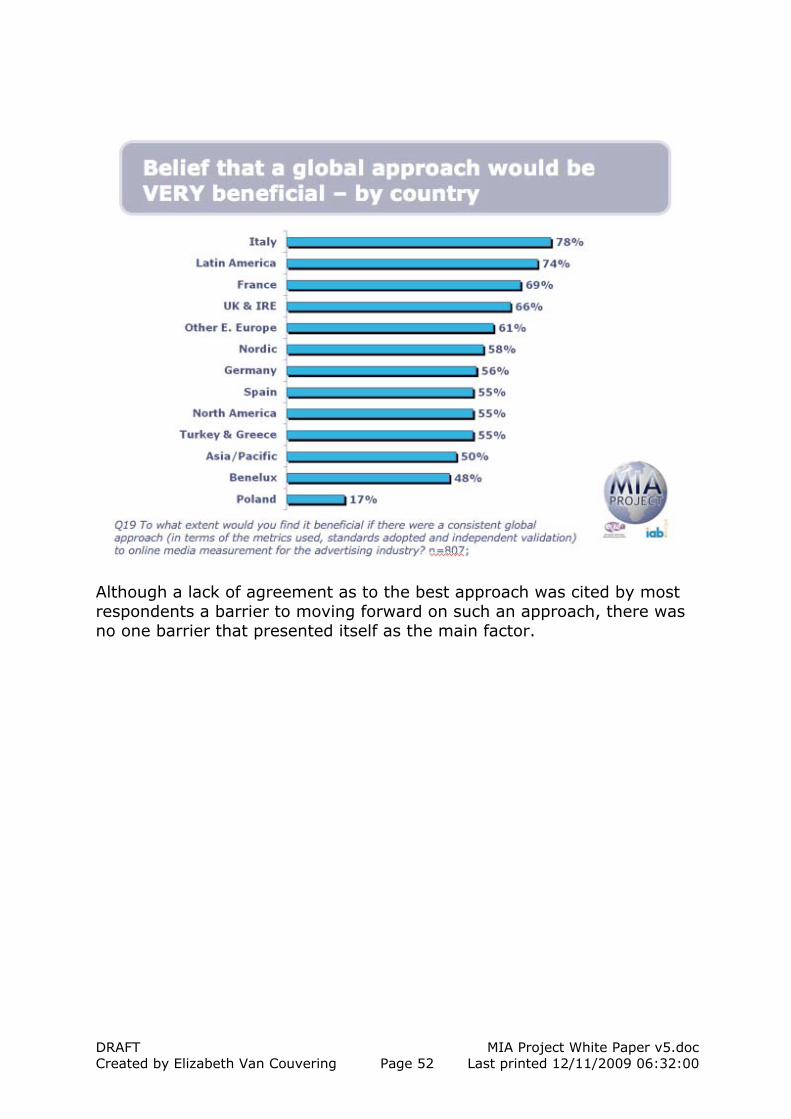
DRAFT MIA Project White Paper v5.doc Created by Elizabeth Van Couvering Page 52 Last printed 12/11/2009 06:32:00
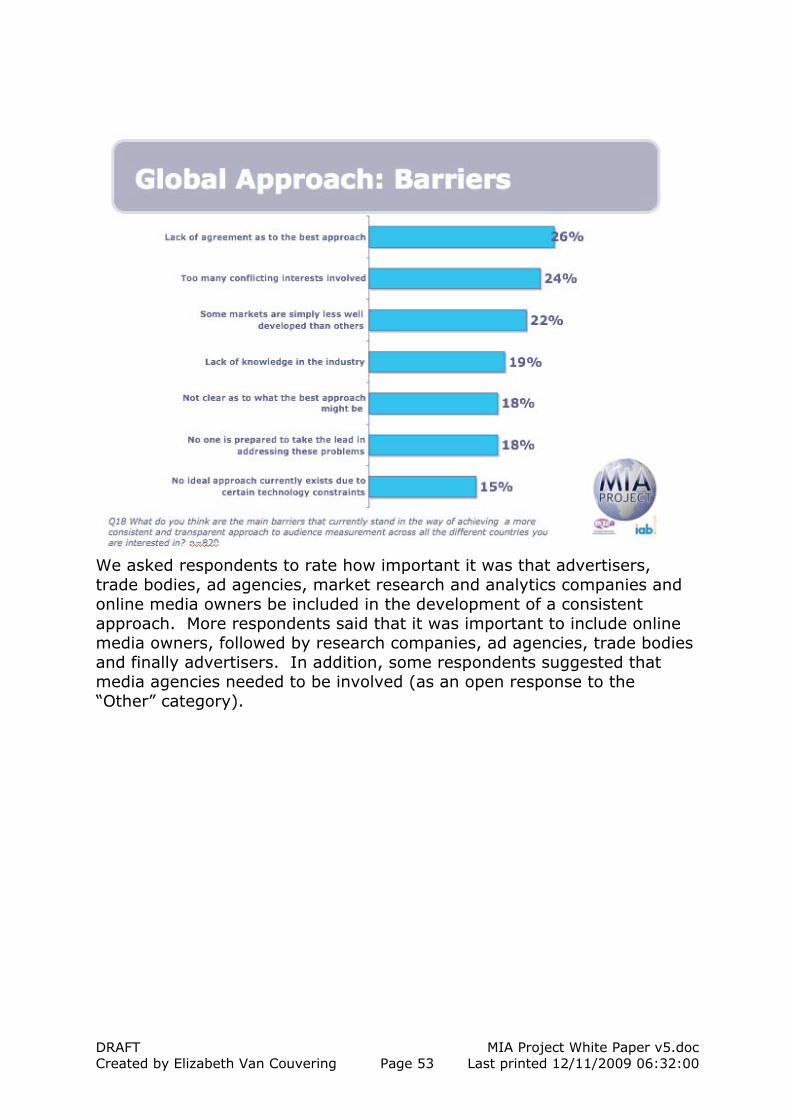
Although a lack of agreement as to the best approach was cited by most respondents a barrier to moving forward on such an approach, there was no one barrier that presented itself as the main factor.
DRAFT MIA Project White Paper v5.doc Created by Elizabeth Van Couvering Page 53 Last printed 12/11/2009 06:32:00
We asked respondents to rate how important it was that advertisers, trade bodies, ad agencies, market research and analytics companies and online media owners be included in the development of a consistent approach. More respondents said that it was important to include online media owners, followed by research companies, ad agencies, trade bodies and finally advertisers. In addition, some respondents suggested that media agencies needed to be involved (as an open response to the “Other” category).

DRAFT MIA Project White Paper v5.doc Created by Elizabeth Van Couvering Page 54 Last printed 12/11/2009 06:32:00
4.6 Cluster analysis Our final analysis is a cluster analysis which relates the responses given to all questions to each other, and separates them into distinct clusters. In our case, a three-cluster solution was the best solution. The clusters identified were named “optimistic leaders,” “constructive sceptics” and “peripheral players”. Optimistic leaders (47%) are characterised by their confidence in their own abilities to understand and use online metrics, which they perceive as more valuable than the other two clusters. They see quality measures as very important, but they are more satisfied than the other two groups with the current status quo. They are more likely to have an international remit, but they believe that their difficulties in accessing information stem more from language issues rather than from issues with the data itself. Respondents in this cluster are more likely to see a global approach as beneficial, and they are also more likely to believe that such an approach is realistic, as they are less likely to see barriers than the constructive sceptics. Respondents in this cluster are more likely to be Polish and less likely to be Dutch, Spanish, or German.
DRAFT MIA Project White Paper v5.doc Created by Elizabeth Van Couvering Page 55 Last printed 12/11/2009 06:32:00
Constructive sceptics (32%) are characterised by their lack of faith in the information they receive. While fairly likely to say they understand the theory of the metrics they use, they are the least confident in their practical understanding. In particular they do not trust their understanding of how data from website owners or in-house tools is calculated. Perhaps for this reason they find the numbers less useful than optimistic leaders, particularly page impressions, ad impressions and hits. They are dissatisfied with the current quality standards, which they perceive to be very important. They are more concerned about barriers to a global approach than the other two clusters, and those with an international remit find it very challenging to derive information, especially with regard to a perceived lack of consistency between different countries. Respondents in this cluster are slightly more likely to come from agencies and slightly less likely to come from publishers/media owners than respondents to the survey as a whole. They are also more likely to come from Spain and the UK, and less likely to come from Poland or Belgium. Peripheral players (21%) are not as convinced of the value of online metrics as the other two clusters, and that applies to both present and potential future measures. They feel they have a reasonable understanding of how metrics are calculated both in theory and in practice, but to a notably lesser degree than optimistic leaders. They are also much less clear about how their sources of data calculate their numbers, especially numbers they receive from agencies. They think the quality of online metrics is fairly important but they are more satisfied with the numbers they receive than the constructive sceptics. If they have an international remit, they are less likely to identify particular challenges. They are the least likely to see a global approach as either realistic or beneficial, although the are less likely to identify specific problems or challenges. When they do identify challenges, they are more likely to see lack of knowledge as one of the main barriers rather than lack of agreement which is mentioned more frequently in the other two clusters. Respondents in this group tend to be more likely to be Hungarian and Italian, and less likely to be Canadian, American, or Mexican.

DRAFT MIA Project White Paper v5.doc Created by Elizabeth Van Couvering Page 56 Last printed 12/11/2009 06:32:00

DRAFT MIA Project White Paper v5.doc Created by Elizabeth Van Couvering Page 57 Last printed 12/11/2009 06:32:00
5 Appendix – Questionnaire Text
This questionnaire is designed to collect the views and opinions of the online media industry on the subject of online audience measurement systems currently used to analyse online usage to support the online advertising business. We are interested to hear the views and opinions of anyone involved with the industry and would be most grateful if you can spare us the time to fill out our online survey. The survey results will be used to help inform a current debate in the industry about the current demands and challenges online media faces and the way in which it should develop in the future. The survey should only take around 10‐15 minutes of your time to complete and all your answers will be treated in the strictest confidence. Q1 Can we just confirm that you are personally involved in online advertising or marketing
either in terms of buying, placing or planning online advertising or in terms of selling or marketing online media to potential advertisers?
Yes continue No ‐ We’d be very grateful if you could pass this link to a colleague who is personally involved in
planning, buying, or selling advertising online ‐ close Q2 Which of the following best describes your role? [tick one only] All Media (including digital) Solely Digital Buying Selling Planning Evaluating Marketing Other (please State) Q3 Which of the following best describes your organisation [tick one only] Publisher Ad Network Agency Online Media Owner Other (specify) Q4 How long have you personally been working with online advertising? Less than a year 1‐3 years 4‐5 years

DRAFT MIA Project White Paper v5.doc Created by Elizabeth Van Couvering Page 58 Last printed 12/11/2009 06:32:00
6 years + Q5 In which country are you based? [tick one only] Australia Brazil Canada China France Germany Italy India Japan Korea Mexico Netherlands Poland Russia Spain Sweden Turkey United Kingdom United States Other (state) Q6 When you are looking at a particular website, how valuable is it for your
business to be able to measure the audience for advertising placed on the site in each of the following ways? For each of the following, please provide a marks out of 5, where 5 out of 5 would be extremely valuable and 1 out of 5 is of very limited value.
WEBSITE METRICS How many times a page is visited How many times a site is visited How many people have visited the site How long people spend looking at a particular page How long people spend on the site as a whole AUDIENCE METRICS The demographic profile of people visiting the site The location of people who visit the site The attitudes and opinions of people visiting the site The online habits of people who visit the site What people who visit the site think about it SEARCH, ADVERTISING AND SALES METRICS How high up the main (natural) rankings a site comes in an internet keyword search If the site has a search facility, being able to tell what people search for How many times an ad has been viewed How many times people have clicked through an ad

DRAFT MIA Project White Paper v5.doc Created by Elizabeth Van Couvering Page 59 Last printed 12/11/2009 06:32:00
What products people who visit the site have researched or bought online previously Q7 For which of these types of information do you currently find it easiest to get accurate and
reliable information? Please provide a marks out of 5, where 5 out of 5 is very easy and 1 out of 5 is very hard.
How many times a page is visited How many times a site is visited How many people have visited the site How long people spend looking at a particular page How long people spend on the site as a whole The demographic profile of people visiting the site The location of people who visit the site The attitudes and opinions of people visiting the site The online habits of people who visit the site What people who visit the site think about it How high up the main (natural) rankings a site comes in an internet keyword search If the site has a search facility, being able to tell what people search for How many times an ad has been viewed How many times people have clicked through an ad What products people who visit the site have researched or bought online previously Q8a How confident are you that you fully understand what the following online metrics mean in
theory?
Please provide a marks out of 5, where 5 out of 5 is an extremely clear understanding and 1 out of 5 is little or no understanding at all .
Q8b And how confident are you that you realy understand how the figures are actually calculated
in practice?
Please provide a marks out of 5, where 5 out of 5 is an extremely clear understanding and 1 out of 5 is little or no understanding at all or “Don’t know”.
Visits Unique users Unique browsers or clients Page impressions Ad impressions Clickthroughs Visit duration Sessions Hits Q9 How useful do you find the following metrics as a means of measuring
online advertising?
Please provide a marks out of 5, where 5 out of 5 is an extremely important method and 1 out of 5 is of little or no importance at all or “don’t know”
DRAFT MIA Project White Paper v5.doc Created by Elizabeth Van Couvering Page 60 Last printed 12/11/2009 06:32:00
Visits Unique users Unique browsers or clients Page impressions Ad impressions Clickthroughs Visit duration Sessions Hits Q10 From what sources would you usually obtain figures relating to online advertising
measurement such as number of visits, page impressions, unique users etc? (tick any that represent major sources for you)
In‐house via custom‐written software In‐house via 3rd party purchased software Research commissioned specially from an ad, marketing, or PR agency Research commissioned specially from a specialist measurement or analytics company Syndicated research available via an ad, marketing, or PR agency Syndicated research purchased from a specialist measurement or analytics company Syndicated research from an industry body Externally from the organisations that own the website(s) concerned Other (please state) Q11 Considering these kinds of sources, how well do you feel you understand the way in which
they would obtain their figures?
Please provide a marks out of 5, where 5 out of 5 is an extremely clear understanding and 1 out of 5 is little or no understanding at all or Not Relevant.
In‐house via custom‐written software In‐house via 3rd party purchased software Research commissioned specially from an ad, marketing, or PR agency Research commissioned specially from a specialist measurement or analytics company Syndicated research available via an ad, marketing, or PR agency Syndicated research purchased from a specialist measurement or analytics company Syndicated research from an industry body Externally from the organisations that own the website(s) concerned Q12 Thinking ahead to the future, how valuable would it be for your
business to be able to measure the following? For each of the following, please provide a marks out of 5, where 5 out of 5 would be extremely valuable and 1 out of 5 is of very limited value.
Ad exposure in audio and video shown online Number of times people reference your website on forums, blogs etc What people are saying about your brand online Online media and traditional media using the same measures (e.g., reach)

DRAFT MIA Project White Paper v5.doc Created by Elizabeth Van Couvering Page 61 Last printed 12/11/2009 06:32:00
Online media and other digital platforms (e.g., mobile) using the same measures Q13 How important is it for you that the industry is able to deliver the following things in relation
to online audience measurement? Please answer on a scale from 5 down to 1, where 5 = very important and 1 is of little or no
importance.... It should be clear and transparent as to how measures are calculated Measures ought to be calculated consistently Audience measurement should conform to agreed industry standards Measures ought to be independently verified Q14 How satisfied are you that the industry is currently delivering the following things in relation
to online audience measurement in an effective way? Please answer on a scale from 5 down to 1, where 5 = very satisfied and 1 is not at all
satisfied, or “Don’t know”.... It is clear and transparent as to how measures are calculated Measures are calculated in a consistent way Audience measurement conforms to agreed industry standards Measures are being independently verified Q15 Does your remit also cover online media in countries outside your own? Yes continue No go to Q19 Q16 Which countries? Would it be other countries in…[tick any that apply] Western Europe Eastern Europe Middle East Africa China and Central Asia Indian sub‐continent Southeast Asia Pacific region and Australasia North America Central America South America Q17 When looking at online audience measurement in different countries, what
additional challenges do you feel you face in getting the information you need, above and beyond those you’d face when you are looking at just your own country in isolation? [tick any that apply]
Information may be available but often only in many different languages Lack of consistent measurement between countries In some countries there is a lack of adequate independent verification
DRAFT MIA Project White Paper v5.doc Created by Elizabeth Van Couvering Page 62 Last printed 12/11/2009 06:32:00
In some countries it is unclear how certain measures are calculated The same measure may mean different things in different countries Different industry standards are used in different countries Some countries have no industry standards at all There is inconsistent panel coverage across different countries Other (please state) None at all Q18 What do you think are the main barriers that currently stand in the way of achieving
a more consistent and transparent approach to audience measurement across all the different countries you are interested in? [tick any that apply]
Lack of knowledge in the industry Too many conflicting interests involved Lack of agreement as to the best approach Not clear as to what the best approach might be No one is prepared to take the lead in addressing these problems No ideal approach currently exists due to certain technology constraints Some markets are simply less well developed than others Other (please state) Q19 To what extent would you find it beneficial if there were a consistent global approach (in
terms of the metrics used, standards adopted and independent validation) to online media measurement for the advertising industry?
Very beneficial Fairly beneficial Of some benefit Fairly limited benefit Very limited benefit Not sure Q20 How realistic do you think it would be to achieve a consistent global approach within the
next 5 years? Very realistic Fairly realistic It’s a possibility Fairly unrealistic Very unrealistic Not sure Q21 What do you think should be the main priorities when it comes to online media
measurement in future? [please write your opinions below]
DRAFT MIA Project White Paper v5.doc Created by Elizabeth Van Couvering Page 63 Last printed 12/11/2009 06:32:00
Q22 How important do you think it is for the following organisations/companies to be actively involved with developing a consistent global approach to online media measurement, in order provide a realistic chance of success? Please answer on a scale from 5 down to 1, where 5 = very important and 1 is of little or no importance.... Advertisers Trade bodies Ad agencies Market research and analytics companies Online media owners Are there any other organisations/companies which need to be actively involved with this process in order provide a realistic chance of success?
Thank you very much for your time. All the information you have provided will be treated in the strictest confidence. We can offer people who have completed this survey a free copy of the final report (in English) in a pdf format, would you be interested in receiving a copy? Yes continue No go to Thanks/close screen Please provide details of your email address below so that we can send you an electronic copy of the report when it is ready:
Please re‐enter to verify:
Note: We shall only use email addresses collected here to administer the distribution of reports to survey participants. This information will not be used subsequently for any other reason, nor will it be used to link your identity with the answers you provided in the survey. All your answers will remain strictly confidential and will only presented as part of an overall statistical analysis in which the identities of all individual respondents remains anonymous in accordance with the UK Market Research Society code of practice. THANKS VERY MUCH FOR YOUR TIME If you know of anyone else involved with the industry whose opinions on these issues are likely to be important, we would very much appreciate it if you could forward a link to them so that they can complete an online survey as well.