Embed Size (px)
Citation preview

44
Transportation Research Record: Journal of the Transportation Research Board, No. 2272, Transportation Research Board of the National Academies, Washington, D.C., 2012, pp. 44–55.DOI: 10.3141/2272-06
Department of Civil and Environmental Engineering, Rutgers University, 623 Bowser Road, Piscataway, NJ 08854. Current affiliation for B. Bartin: Department of Civil Engineering, Istanbul Kemerburgaz University, Mahmutbey Dilmenler Avenue, Number 26, Bagcilar, Istanbul. Corresponding author: B. Bartin, [email protected].
Each of these available tools has its strengths and weaknesses. Schnell et al. studied the accuracy of HCS, Synchro, CORSIM, NetSim, and QueWZ92 for the Ohio DOT (2). They collected field data from four work zones in that state. Queue lengths observed from the field data were compared with the outputs of each tool. They found that the simulation tools Synchro and CORSIM showed inaccuracies in their predictions of queue lengths. The Ohio DOT spreadsheet produced the most realistic estimates of queue lengths compared with the results from other tools.
A survey of 19 state DOTs conducted by Edara and Cottrell revealed that tools based on the Highway Capacity Manual and spreadsheets were the most popular among DOTs for the estimation of traffic impacts of work zone lane closures (3). The advantage of sketch-planning tools is their ease of use, low data requirement, and capability to obtain results quickly.
Accuracy in the estimation of the impact of a work zone lane closure depends on various factors, including three essential input data: (a) hourly traffic volume, (b) roadway capacity under normal conditions, and (c) roadway capacity during lane closure.
Much work has been done on the estimation of roadway capac-ity in work zones (4–11). The results of these studies showed that capacity values observed at work zones varied considerably across and within states. The survey conducted by Edara and Cottrell also revealed that the most common tool used to determine the capacity at work zone bottlenecks appeared to be the experience of DOT staff (3).
Often, however, it is a challenge for traffic engineers to determine traffic volume levels, because they vary considerably from one day to another, especially on weekdays and holidays. Many traffic engineers at state DOTs still resort to estimations of hourly traffic volumes and use outdated average annual daily traffic estimates, and seasonal and hourly demand factors.
Today, many of the major highways in the United States are moni-tored by loop detectors, global positioning system readers, automatic vehicle identification readers, and Bluetooth readers. Although traf-fic data are more abundant than ever, they are not often organized and accessed efficiently. The demand for efficient work zone planning can be met with advanced computing technology, high-level map-ping and visualization tools, and the capability to store vast amounts of data on personal computers. In addition to traffic volumes, various data sources such as historical accident data, weather data, and travel times can be integrated to aid traffic engineers as they make critical operational decisions.
This paper describes the development of an interactive computer tool to plan lane closures for work zones. This user-friendly tool aims to provide traffic engineers with a computerized and easy-to-use lane closure application, along with other useful features, as described in the following sections.
Interactive Lane Closure and Traffic Information Tool Based on a Geographic Information System
Bekir Bartin, Kaan Ozbay, and Sandeep Mudigonda
This paper describes the development of the Rutgers Interactive Lane Closure Application (RILCA), an interactive computer tool to plan lane closures for work zones. This tool provides traffic engineers with a computerized and easy-to-use lane closure application, along with other useful features. RILCA was developed with the ArcView geographic information system (GIS) software package as the main development environment. ArcView displays the interactive GIS map of the New Jer-sey Turnpike, Garden State Parkway, and other major freeways in New Jersey and its surrounding network. RILCA provides various analysis and visualization options to plan lane closures interactively, obtain traffic volume information, and conduct accident queries. RILCA was tested successfully, and New Jersey Department of Transportation (DOT) and New Jersey Turnpike Authority engineers now use it with all of the fea-tures presented in this paper. RILCA received an annual implementation award from the New Jersey DOT in 2009. The award recognized RILCA’s usefulness and potential to improve the efficiency of traffic operations as a practical decision-support tool for lane closure decisions.
Traffic engineers at state departments of transportation (DOTs) and other highway agencies often are confronted with the need to conduct traffic impact analyses of short-term work zone projects promptly. These engineers are required to determine times to close one or more lanes to traffic that will cause minimal delays in a given work zone. When longer delays are unavoidable, however, the crucial tasks become to determine the maximum queue length, estimate the time of clearance, and inform motorists.
Various tools are available to planners and engineers to analyze the mobility impacts of work zones. These tools vary from simple to complex in terms of input data requirements, ease of use, and accu-racy of estimates. FHWA (1) presents the available tools in terms of their complexity (Figure 1).
FHWA lists five factors to consider in the selection of a specific work zone analysis tool: functionality, level of detail, development time, training, and cost. Some tools listed in Figure 1 were designed specifically for work zone applications. Other traffic analysis tools can be used, such as Corsim and Synchro, although not designed specifically for work zones.

Bartin, Ozbay, and Mudigonda 45
The Rutgers Interactive Lane Closure Application (RILCA) was first developed for the New Jersey Turnpike Authority (NJTA). NJTA is responsible for the operation and maintenance of two major tolled roads in New Jersey, namely the New Jersey Turnpike (NJTPK) and the Garden State Parkway (GSP).
RILCA was later adopted by the New Jersey DOT to plan its free-way lane closure for work zones, and its use was extended to 18 state freeways as requested by New Jersey DOT traffic engineers.
RILCA was developed with the ArcView geographic informa-tion system (GIS) software package as the main development environment. ArcView displays an interactive GIS map of NJTPK, GSP, and other major freeways in New Jersey and its surrounding network. Various analysis and visualization options are provided in RILCA for interactive planning of lane closures. RILCA includes geometric details of NJTPK, GSP, and surrounding highways and local streets. It provides users with the following applications:
• Hourly volume information on selected links in a given time period on any given date;
• Link characteristics (such as number of lanes, annual average daily traffic, milepost, link length);
• A function that generates a lane closure schedule for selected links on the basis of hourly volume data;
• A simple visualization function that shows the extent of expected delays as a result of lane closure and possibility of spillback onto the upstream links all in the form of link colors;
• Allowable lane closure hours for a day, week, or month; • Delay and queue length estimation for incidents; • Travel time information between interchanges in a given time
period on any given date (NJTPK only); • Historical accident information; and • Historical weather information.
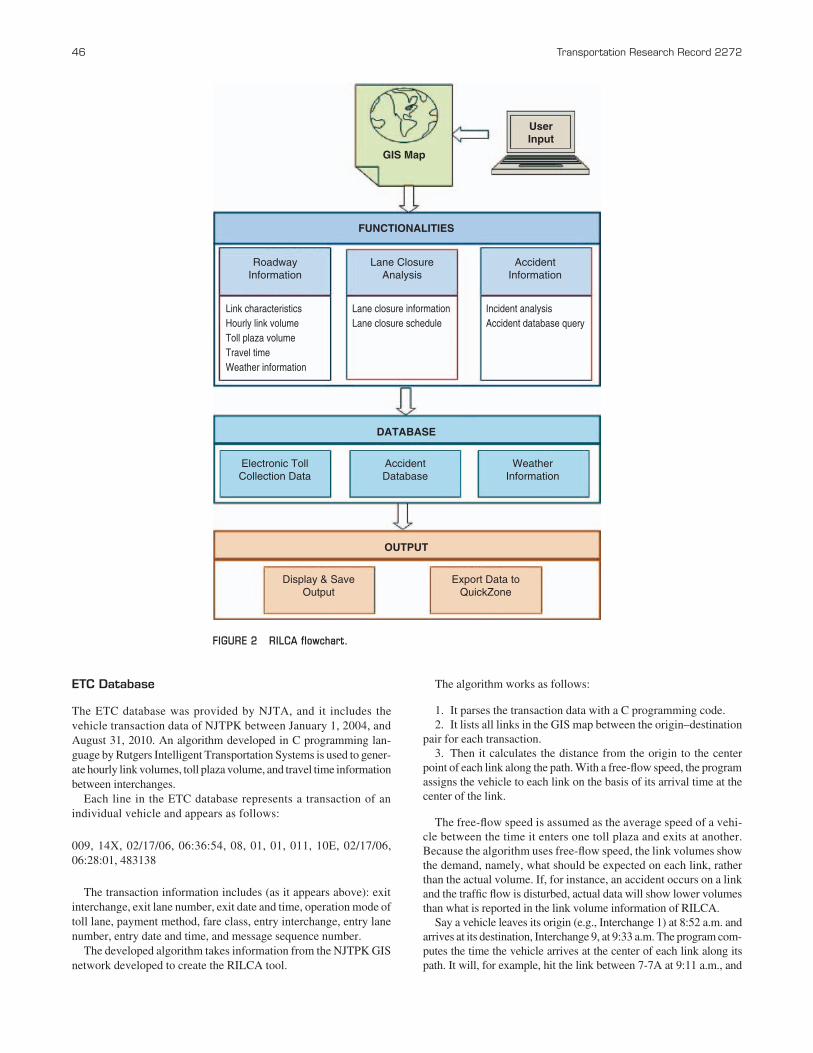
The flowchart of RILCA is shown in Figure 2.A novel feature of RILCA is its ability to export hourly volume
data and geometric characteristics of a selected highway link to QuickZone. One drawback of QuickZone is that users need to input highly detailed traffic data to analyze the impacts of long-term lane closures (12). RILCA gives users the flexibility to either (a) conduct short-term lane closure analysis in RILCA, or (b) export the corre-sponding traffic volume from RILCA data to QuickZone, if a detailed long-term lane closure analysis is required.
RILCA is a generic tool: all threshold values and use of historic data can be customized for any state or freeway. As mentioned above, a different version of RILCA was developed for New Jersey DOT.
The intent of this study was to demonstrate that a GIS-based plat-form and a methodology easily modified for any roadway can be used as long as data and expert information are available. The use of a GIS-based tool obviates the need for hardcoded look-up tables. This GIS tool makes it easier to store, process, and extract related traffic and other data in a highly visual manner. Because traffic, link, weather, and accident data are all spatially referenced, a system operator can focus on specific locations without the need to worry about the explicit combination of related data sets.
Data SourceS
NJTPK is a 148-mi toll facility with 26 operational interchanges. Average daily traffic on it exceeds 500,000 vehicles. One of the state’s principal north–south highway corridors, NJTPK offers a direct connection between Delaware Memorial Bridge in the south and George Washington Bridge, and Lincoln Tunnel, and Holland Tunnel in the north.
Vehicles enter NJTPK through a toll plaza with two payment options: cash receipts and electronic toll collection (ETC), namely E-ZPass. Cash users get a ticket at the entry toll plaza, and E-ZPass users drive through the dedicated toll booths with no need to stop. At the exit toll plazas, cash users must make a full stop and pay the toll on the basis of their entry toll plaza; E-ZPass users drive through dedicated toll booths with no need to stop to pay. Entry and exit toll plazas on NJTPK are not located en route but at separate areas at each intersection where users enter or exit the freeway. This type of toll plaza configuration does not impede the traffic flow on the freeway.
GIS Map
The GIS map of NJTPK was extracted from the ESRI database of the New Jersey highways shape file. Number of lanes information for each link was entered into the database manually. The GIS network is a to-scale representation of NJTPK. It includes mainline links, ramp links, and toll plaza links. Each link is defined with an identification, length, start and end mileposts, and number of lanes (Figure 3).
FIGURE 1 Work zone modeling spectrum (1).
46 Transportation Research Record 2272
etc Database
The ETC database was provided by NJTA, and it includes the vehicle transaction data of NJTPK between January 1, 2004, and August 31, 2010. An algorithm developed in C programming lan-guage by Rutgers Intelligent Transportation Systems is used to gener-ate hourly link volumes, toll plaza volume, and travel time information between interchanges.
Each line in the ETC database represents a transaction of an individual vehicle and appears as follows:
009, 14X, 02/17/06, 06:36:54, 08, 01, 01, 011, 10E, 02/17/06, 06:28:01, 483138
The transaction information includes (as it appears above): exit interchange, exit lane number, exit date and time, operation mode of toll lane, payment method, fare class, entry interchange, entry lane number, entry date and time, and message sequence number.
The developed algorithm takes information from the NJTPK GIS network developed to create the RILCA tool.
The algorithm works as follows:
1. It parses the transaction data with a C programming code.2. It lists all links in the GIS map between the origin–destination
pair for each transaction.3. Then it calculates the distance from the origin to the center
point of each link along the path. With a free-flow speed, the program assigns the vehicle to each link on the basis of its arrival time at the center of the link.
The free-flow speed is assumed as the average speed of a vehi-cle between the time it enters one toll plaza and exits at another. Because the algorithm uses free-flow speed, the link volumes show the demand, namely, what should be expected on each link, rather than the actual volume. If, for instance, an accident occurs on a link and the traffic flow is disturbed, actual data will show lower volumes than what is reported in the link volume information of RILCA.
Say a vehicle leaves its origin (e.g., Interchange 1) at 8:52 a.m. and arrives at its destination, Interchange 9, at 9:33 a.m. The program com-putes the time the vehicle arrives at the center of each link along its path. It will, for example, hit the link between 7-7A at 9:11 a.m., and
DATABASE
FUNCTIONALITIES
GIS Map
User Input
OUTPUT
Export Data to QuickZone
Display & Save Output
Weather Information
Electronic Toll Collection Data
Link characteristics Hourly link volume Toll plaza volume Travel time Weather information
Lane closure information Lane closure schedule
Incident analysis Accident database query
Accident Database
Accident Information
Roadway Information
Lane Closure Analysis
FIGURE 2 RILCA flowchart.

Bartin, Ozbay, and Mudigonda 47
the volume of that link for 9 to 10 a.m. then is increased by one vehicle. Figure 3 shows the location of various interchanges on NJTPK.
In addition to total hourly link volumes, the algorithm can break down the volume on the basis of vehicle type (e.g., passenger car, truck, bus).
The algorithm also processes (a) travel times between each interchange within every hour and (b) hourly toll plaza volumes by tollbooth with the available ETC database.
accident Database
The NJTPK accident database includes vehicle crash records between January 1, 1995, and May 31, 2009. These records are based on reports filled out by police officers at the accident scene. Each record involves accident-specific information (e.g., time, day, and location of the accident, number of vehicles involved, types of vehicles involved, degree of severity, crash type).
FIGURE 3 RILCA main window.

48 Transportation Research Record 2272
Weather Database
Hourly weather information was obtained from five airports in New Jersey: Teterboro; Newark Liberty International; McGuire Air Force Base; South Jersey Regional; and Atlantic City International. The database is available at the National Climatic Data Center Website. The weather database for each station gives historical hourly weather information (e.g., clear, rain, snow).
FunctIonalItIeS oF rIlca
Figure 3 shows the main window of RILCA, and the Main Menu lists its functionalities. These functionalities can be consolidated into three main areas:
1. Roadway information, providing information about link char-acteristics, hourly link volume, toll plaza volume, travel time, and historical weather conditions;
2. Lane closure analysis, including lane closure information for a specific link between selected time periods and a lane closure schedule for a given day, week, or month; and
3. Accident information, including incident analysis, such as estimation of travel delays and queue lengths for a specific incident on a selected link, and accident database.
The following sections describe these three main functionalities of RILCA in detail.
roadway Information
Link Characteristics
For all options in the Main Menu, a link must be selected. A desired link in the network can be selected through a click on the link with the mouse. The selected link is highlighted when selected. The Link Characteristics button in the Main Menu window displays the start-ing milepost, number of lanes, and length of the selected link in a tabular form on the screen.
Volume Information
The volume information of a selected link can be obtained for a selected day, month, year, and time period with the Volume Info button in the Main Menu window. Hourly volumes within the selected period by car, truck, and bus are displayed on the screen. Volume information for the previous year is shown in a separate tab (Figure 4).
Toll Plaza Volume Information
The toll plaza volume information can be obtained for a particular toll plaza from the list of toll plazas for a selected day, month, year, and time period with the Toll Plaza Volume Info button in the Main Menu window. Total hourly volumes for the time period selected, including the breakdown of cash, E-Z pass vehicles, and car, truck, and bus volumes, are displayed in a tabular form on the screen (Figure 5).
Travel Time Information
Travel time between consecutive interchanges can be obtained for each hour for the selected day, month, and year with the Travel time Info button in the Main Menu. Average travel time, free-flow travel time, and maximum and minimum travel time, are displayed in a tabular form on the screen.
lane closure analysis
Lane Closure Information
The Lane Closure Info option can be used to generate the delays and queues that result from a particular lane closure scenario. The delay and queue that result from a lane closure are estimated on the basis of a simple deterministic queuing theory.
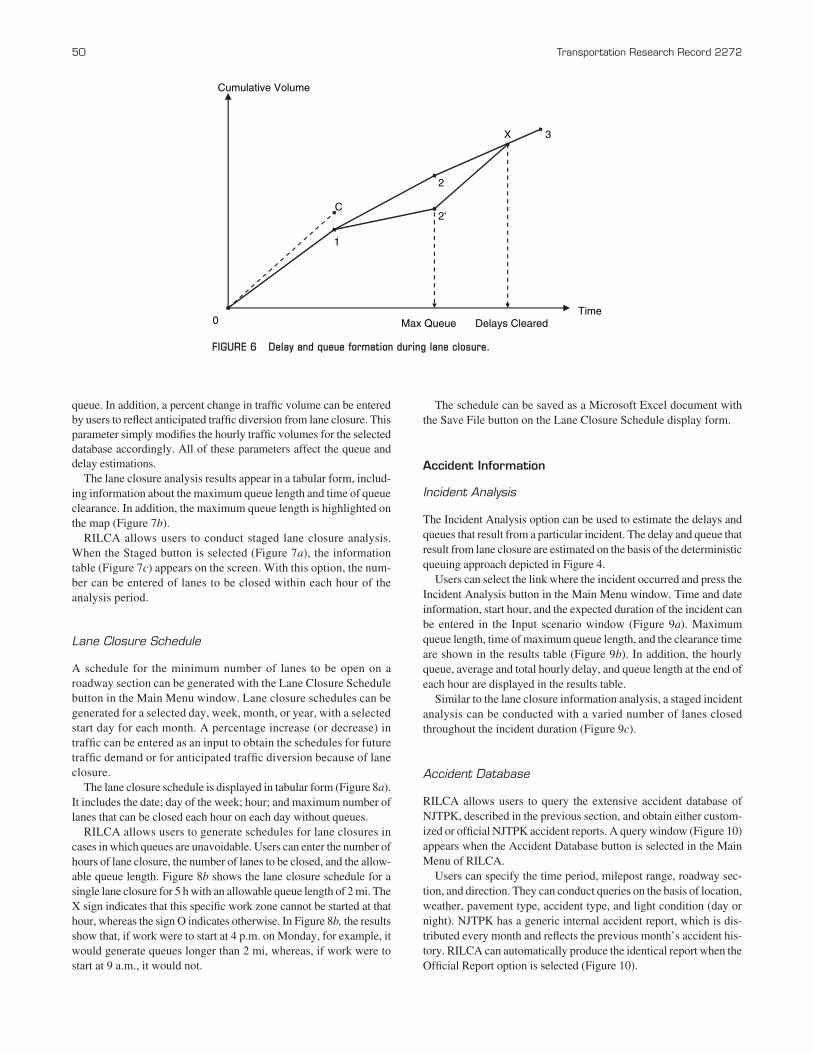
Figure 6 depicts the change in the traffic flow as a result of a hypothetical lane closure between 1 and 2 p.m. This diagram reflects deterministic queuing theory. The horizontal axis represents time, and the vertical axis represents the cumulative volume of traffic that
FIGURE 4 Volume information table.

Bartin, Ozbay, and Mudigonda 49
arrives at the roadway link where the work zone takes place. The slopes of Lines 0-1, 1-2, and 2-3 are the traffic flow rates between, say, noon and 1 p.m., 1 and 2 p.m., and 2 and 3 p.m., respectively. Because of lane closure, the actual flow rate is reduced, to the level of 2′, as a result of the reduction in the capacity of the roadway. The slope of Line 1-2′ represents the flow rate past the work zone. When the work zone is removed, the flow rate increases until it becomes equal to the maximum flow rate, the slope of 2-X, which is equal to the slope of 0-C (see the explanation that follows). When all the delayed traffic passes the work zone location after lane closure is removed, the traffic flow returns to its normal rate.
[In the absence of congestion, all arriving cars are served because Line 0-C, which represents the cumulative capacity (maximum
departure rate), has a steeper slope than the arrival rate of traffic. At 2′, when all lanes are cleared, traffic starts to depart at capacity. Thus the cumulative departure rate becomes equal to the maximum cumulative departure rate until the queue is cleared (Point X).]
Once the link that corresponds to the work zone location is selected on the map, the Lane Closure Info button is activated through the Main Menu. From the dropdown list, the input window is selected that contains information on start and end hours; date, month, and year of the lane closure; and the number of lanes closed (Figure 7a).
RILCA allows users to input parameters that traffic engineers would see as a best fit for the selected roadway, such as roadway capacity under normal and work zone conditions (vehicles/hour/lane), average vehicle length, and average gap between vehicles in
FIGURE 5 Toll plaza volume information table.
50 Transportation Research Record 2272
queue. In addition, a percent change in traffic volume can be entered by users to reflect anticipated traffic diversion from lane closure. This parameter simply modifies the hourly traffic volumes for the selected database accordingly. All of these parameters affect the queue and delay estimations.
The lane closure analysis results appear in a tabular form, includ-ing information about the maximum queue length and time of queue clearance. In addition, the maximum queue length is highlighted on the map (Figure 7b).
RILCA allows users to conduct staged lane closure analysis. When the Staged button is selected (Figure 7a), the information table (Figure 7c) appears on the screen. With this option, the num-ber can be entered of lanes to be closed within each hour of the analysis period.
Lane Closure Schedule
A schedule for the minimum number of lanes to be open on a roadway section can be generated with the Lane Closure Schedule button in the Main Menu window. Lane closure schedules can be generated for a selected day, week, month, or year, with a selected start day for each month. A percentage increase (or decrease) in traffic can be entered as an input to obtain the schedules for future traffic demand or for anticipated traffic diversion because of lane closure.
The lane closure schedule is displayed in tabular form (Figure 8a). It includes the date; day of the week; hour; and maximum number of lanes that can be closed each hour on each day without queues.
RILCA allows users to generate schedules for lane closures in cases in which queues are unavoidable. Users can enter the number of hours of lane closure, the number of lanes to be closed, and the allow-able queue length. Figure 8b shows the lane closure schedule for a single lane closure for 5 h with an allowable queue length of 2 mi. The X sign indicates that this specific work zone cannot be started at that hour, whereas the sign O indicates otherwise. In Figure 8b, the results show that, if work were to start at 4 p.m. on Monday, for example, it would generate queues longer than 2 mi, whereas, if work were to start at 9 a.m., it would not.
The schedule can be saved as a Microsoft Excel document with the Save File button on the Lane Closure Schedule display form.
accident Information
Incident Analysis
The Incident Analysis option can be used to estimate the delays and queues that result from a particular incident. The delay and queue that result from lane closure are estimated on the basis of the deterministic queuing approach depicted in Figure 4.
Users can select the link where the incident occurred and press the Incident Analysis button in the Main Menu window. Time and date information, start hour, and the expected duration of the incident can be entered in the Input scenario window (Figure 9a). Maximum queue length, time of maximum queue length, and the clearance time are shown in the results table (Figure 9b). In addition, the hourly queue, average and total hourly delay, and queue length at the end of each hour are displayed in the results table.
Similar to the lane closure information analysis, a staged incident analysis can be conducted with a varied number of lanes closed throughout the incident duration (Figure 9c).
Accident Database
RILCA allows users to query the extensive accident database of NJTPK, described in the previous section, and obtain either custom-ized or official NJTPK accident reports. A query window (Figure 10) appears when the Accident Database button is selected in the Main Menu of RILCA.
Users can specify the time period, milepost range, roadway sec-tion, and direction. They can conduct queries on the basis of location, weather, pavement type, accident type, and light condition (day or night). NJTPK has a generic internal accident report, which is dis-tributed every month and reflects the previous month’s accident his-tory. RILCA can automatically produce the identical report when the Official Report option is selected (Figure 10).
Time
Cumulative Volume
0
1
2
3
2'
X
C
Max Queue Delays Cleared
FIGURE 6 Delay and queue formation during lane closure.

Bartin, Ozbay, and Mudigonda 51
(a)
(b)
(c)
FIGURE 7 Lane closure information: (a) input scenario, (b) results table, and (c) staged lane closure.

52 Transportation Research Record 2272
(a)
(b)
FIGURE 8 Lane closure schedule: (a) no queue allowed and (b) 2-mi queue allowed.

Bartin, Ozbay, and Mudigonda 53
(a) (b)
(c)
FIGURE 9 Incident analysis: (a) input scenario, (b) results table, and (c) staged lane closure.

54 Transportation Research Record 2272
An example of the official NJTPK monthly accident query is shown in Figure 11. The presented accident statistics are generated for January 2006.
user Feedback and response
Before development of RILCA began, a series of meetings was held with the NJTA staff to decide on the data sources to be used and the functionalities that operations engineers would like to use day-to-day. Interaction with the staff also occurred to assess the vari-ous functionalities and the workflow of the tool during the course of its development.
One year after the test of RILCA began, a user survey was con-ducted among NJTA staff to obtain feedback and improve the program on the basis of staff recommendations.
On the basis of this survey, NJTA engineers seemed to agree that the accuracy of results obtained from RILCA varied from good to excellent. During short-term work zone lane closures, the NJTA Operations Department monitors traffic backup, either with surveil-lance cameras or through field observations conducted by mainte-nance crew. Any queue formation is reported in the dispatchers’ traffic logs. NJTA engineers noted that the queue estimates obtained from RILCA corresponded in general with the actual queue lengths observed on the roadway. They recommended, however, that sys-tematic field tests be conducted at various work zones to improve the validity of the queuing analysis in RILCA.
NJTA engineers also agreed that their productivity had improved with the use of RILCA, because they no longer had to obtain correct hourly traffic volumes and conduct queuing analyses for various lane closure scenarios. They considered RILCA a useful tool for quick analysis of short-term lane closures, such as those requested at the last minute for maintenance. They suggested the use of satel-lite imagery as overlays in RILCA to find out the actual roadway geometry within the program.
concluSIonS
This paper describes the development of RILCA, an interactive GIS-based computer tool to plan lane closures for work zones. This user-friendly tool is intended to increase the productivity of traffic engineers and provide them with a computerized, easy-to-use lane closure application, along with other useful features.
RILCA was developed with the ArcView GIS software package as the main development environment. The interactive GIS map is displayed with ArcView of the NJTPK, GSP, and other major high-ways in New Jersey and its surrounding network. Various analysis and visualization options are provided for interactive planning of lane closures. The tool includes the geometric details of NJTPK, GSP, and the surrounding highways and local streets and other major freeways in New Jersey. It provides users with the following functionalities:
• Volume information on selected links at a given time period on any given date;
• Link characteristics; • Lane closure schedules; • Visualization of expected delays as a result of lane closure and
the possibility of spillback onto the upstream links, all in the form of link colors;
• Allowable lane closure hours for a day, a week, or a month; • Delay and queue length estimation for incidents; • Travel time information between interchanges in a given time
period on any given date; • Historical accident information; and • Historical weather information.
The novelty of RILCA is its ability to process rich travel time and volume information obtained from the ETC database, along with historical accident and weather database with ArcGIS’s visual display options.
RILCA can also export hourly volume data and geometric charac-teristics of a selected highway link to QuickZone. QuickZone is used to estimate traffic impacts of long-term lane closures, and requires detailed traffic volume information (12). RILCA helps users to extract data required for QuickZone with little effort and save time for users.
RILCA is modified easily for any roadway, as long as data and expert information are available. It was tested successfully and is cur-rently used by New Jersey DOT and NJTA engineers with all features described in this paper. RILCA received the annual implementation award from New Jersey DOT in 2009 in recognition of its useful-ness and potential to improve the efficiency of traffic operations as a practical decision-support tool for lane closure decisions.
acknoWleDGMentS
NJTA and the New Jersey DOT funded development of this tool. Their support is acknowledged and appreciated.
FIGURE 10 Accident database query window.

Bartin, Ozbay, and Mudigonda 55
reFerenceS
1. FHWA. Traffic Analysis Toolbox Volume VIII: Work Zone Modeling and Simulation—A Guide for Decision-Makers. FHWA-HOP-08-029. U.S. Department of Transportation, Washington, D.C., 2008.
2. Schnell, T., J. S. Mohror, and F. Aktan. Evaluation of Traffic Flow Anal-ysis Tools Applied to Work Zones Based on Flow Data Collected in the Field. In Transportation Research Record: Journal of the Transporta-tion Research Board, No. 1811, Transportation Research Board of the National Academies, Washington, D.C., 2002, pp. 57–66.
3. Edara, P. K., and B. H. Cottrell, Jr. Estimation of Traffic Mobility Impacts at Work Zones: State of the Practice. Presented at 86th Annual Meeting of the Transportation Research Board, Washington, D.C., 2007.
4. Krammes, R. A., and G. O. Lopez. Updated Capacity Values for Short-Term Freeway Work Zone Lane Closures. In Transportation Research Record 1442, TRB, National Research Council, Washington, D.C., 1994, pp. 49–56.
5. Dixon, K. K., J. E. Hummer, and A. R. Lorscheider. Capacity for North Carolina Freeway Work Zones. In Transportation Research Record 1529, TRB, National Research Council, Washington, D.C., 1996, pp. 27–34.
6. Jiang, Y. Traffic Capacity, Speed, and Queue-Discharge Rate of Indi-ana’s Four-Lane Freeway Work Zones. In Transportation Research Record: Journal of the Transportation Research Board, No. 1657, TRB, National Research Council, Washington, D.C., 1999, pp. 10–17.
7. Kim, T., D. J. Lovell, and J. Paracha. New Methodology to Estimate Capacity for Freeway Work Zones. Presented at 80th Annual Meeting of the Transportation Research Board, Washington, D.C., 2001.
8. Sarasua, W. A., W. J. Davis, D. B. Clarke, J. Kottapally, and P. Mulukutla. Evaluation of Interstate Highway Capacity for Short-Term Work Zone Lane Closures. In Transportation Research Record: Journal of the Trans-portation Research Board, No. 1877, Transportation Research Board of the National Academies, Washington, D.C., 2004, pp. 85–94.
9. Benekohal, R. F., A. Z. Kaja-Mohideen, and M. V. Chitturi. Methodology for Estimating Operating Speed and Capacity in Work Zones. In Trans-portation Research Record: Journal of the Transportation Research Board, No. 1833, Transportation Research Board of the National Acad-emies, Washington, D.C., 2004, pp. 103–111.
10. Lee, C., D. A. Noyce, and X. Qin. Development of Traffic Delay Assess-ment Tool for Short-Term Closures on Urban Freeways. In Transporta-tion Research Record: Journal of the Transportation Research Board, No. 2055, Transportation Research Board of the National Academies, Washington, D.C., 2008, pp. 39–48.
11. Heaslip, K., C. Louisell, and J. Collura. Driver Population Adjustment Factors for the Highway Capacity Manual’s Work Zone Capacity Equa-tion. Presented at 87th Annual Meeting of the Transportation Research Board, Washington, D.C., 2008.
12. FHWA. QuickZone Delay Estimation Program, Version 2.0. User Guide. Prepared by Mitretek Systems. U.S. Department of Transportation, 2005.
The Work Zone Traffic Control Committee peer-reviewed this paper.
FIGURE 11 Example result of accident query in RILCA.