Embed Size (px)
Citation preview
2/20/2013
1
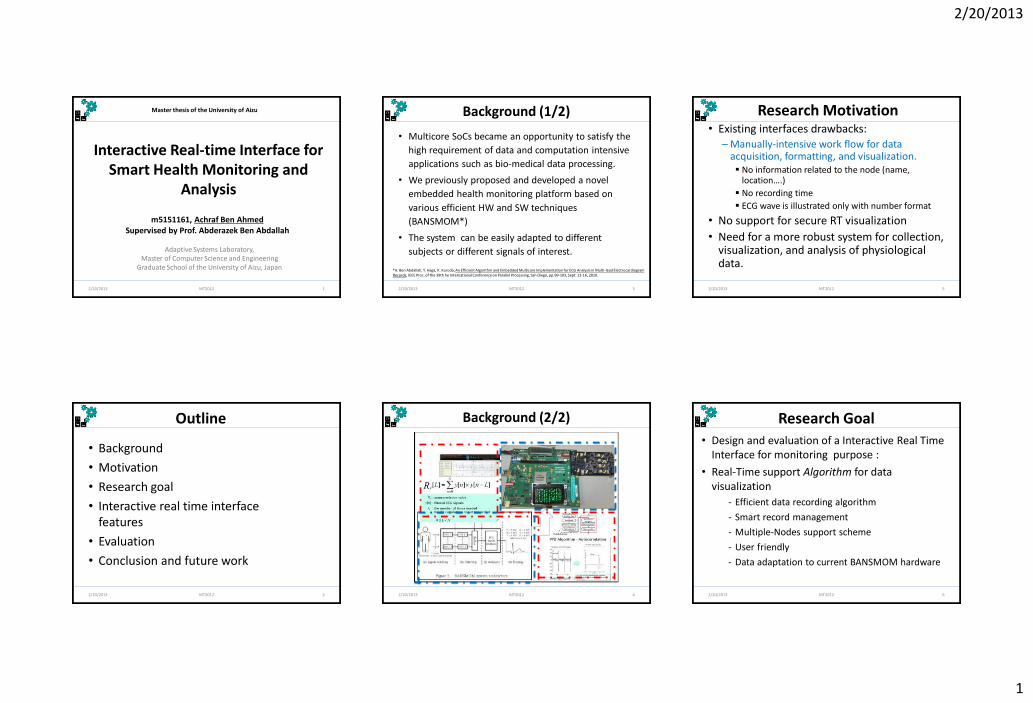
Interactive Real-time Interface for Smart Health Monitoring and
Analysis
MT2012 2/20/2013 1
Master thesis of the University of Aizu
m5151161, Achraf Ben Ahmed Supervised by Prof. Abderazek Ben Abdallah
Adaptive Systems Laboratory, Master of Computer Science and Engineering
Graduate School of the University of Aizu, Japan
MT2012
• Background
• Motivation
• Research goal
• Interactive real time interface features
• Evaluation
• Conclusion and future work
Outline
2/20/2013 2
Background (1/2)
• Multicore SoCs became an opportunity to satisfy the
high requirement of data and computation intensive
applications such as bio-medical data processing.
• We previously proposed and developed a novel
embedded health monitoring platform based on
various efficient HW and SW techniques
(BANSMOM*)
• The system can be easily adapted to different
subjects or different signals of interest.
*A. Ben Abdallah, Y. Haga, K. Kuroda, An Efficient Algorithm and Embedded Multicore Implementation for ECG Analysis in Multi-lead Electrocardiogram Records, IEEE Proc. of the 39th he International Conference on Parallel Processing, San Diego, pp.99-103, Sept. 13-16, 2010.
MT2012 2/20/2013 3
2/20/2013 MT2012 4
Background (2/2)
Research Motivation • Existing interfaces drawbacks:
– Manually-intensive work flow for data acquisition, formatting, and visualization. No information related to the node (name, location….)
No recording time
ECG wave is illustrated only with number format
• No support for secure RT visualization
• Need for a more robust system for collection, visualization, and analysis of physiological data.
MT2012 2/20/2013 5
Research Goal
• Design and evaluation of a Interactive Real Time Interface for monitoring purpose :
• Real-Time support Algorithm for data visualization
- Efficient data recording algorithm
- Smart record management
- Multiple-Nodes support scheme
- User friendly
- Data adaptation to current BANSMOM hardware
MT2012 2/20/2013 6
2/20/2013
2
IRIT General Structure
MT2012 2/20/2013 7
Remote server
SUP 1
SUP 2
SUP n
Node 1
Node 2
Node n
BANSMOM Platform Interactive Real Time Interface
PHP
MySQL
IRTI Workflow
MT2012 2/20/2013 8
index.php
application
• The IRTI was developed following the MVC pattern: Model, View , Controller
• All requests are independent since they are managed separately by the creation of an application instance
Multiple Nodes can be managed in parallel without a negative impact on the overall performance.
Controller
Filters
action
View
layout
model
User request
1 2
3
4
5
6 7
8
9
IRI Development Phases
MT2012 2/20/2013 9
Peaks Visualization Receive Data
Node Selection
Data Retrieval
ECG Data Capturing and Storing Phase
Data Visualization
Phase
-Data Captured from different nodes -Data classified by recording time and lead number
-Supervisor interface access -Node selection -Display node information
-Visualization mode selection - Old request data - Live request data
MT2012
BANSMOM ECG Processing Distribution
2/20/2013 10
𝑇𝐸𝑇 :Total execution time (10 seconds sample data)
R𝑇 :Lead reading time
𝑃𝑃𝐷𝑇 :PPD processing time
𝑆𝑇 : Storing Time
𝑇𝐸𝑇 = 𝑅𝑇 + 𝑃𝑃𝐷𝑇 + 𝑆𝑇 Sample No 16265 , 10 seconds, 14 periods, 84 peaks
𝑇𝐸𝑇 = 3.608 + 2.144 + 0.001 = 5.753𝑠 𝑇𝐸𝑇𝑝 = 0.06𝑠
MT2012
RT Support with Buffer Insertion in DB
2/20/2013 11
• We assume for 1 peak - Insertion frequency 𝐼𝑓 - BANSMOM processing time 𝑇𝐸𝑇𝑝 = 0.06 second/peak - Database update DBup = 0.07 second/peak - Reading frequency 𝑅𝑓 (by Ajax call)
𝑅𝑓 = 𝐼𝑓 = 𝑇𝐸𝑇𝑝 + Dbup
• A buffering mechanism approach is used in the DB level to cover any additional delay
ECG Data Capturing and Storing Phase
MT2012 2/20/2013 12
if DB empty?
Yes
Capture data[day, i ,j]
Store data
No Check DB[day-3]
abnormality
Node i assignment to supervisor K
Go to data process phase
If data is normal
Yes
Delete DB[day-3]
No
day=day-3
2/20/2013
3
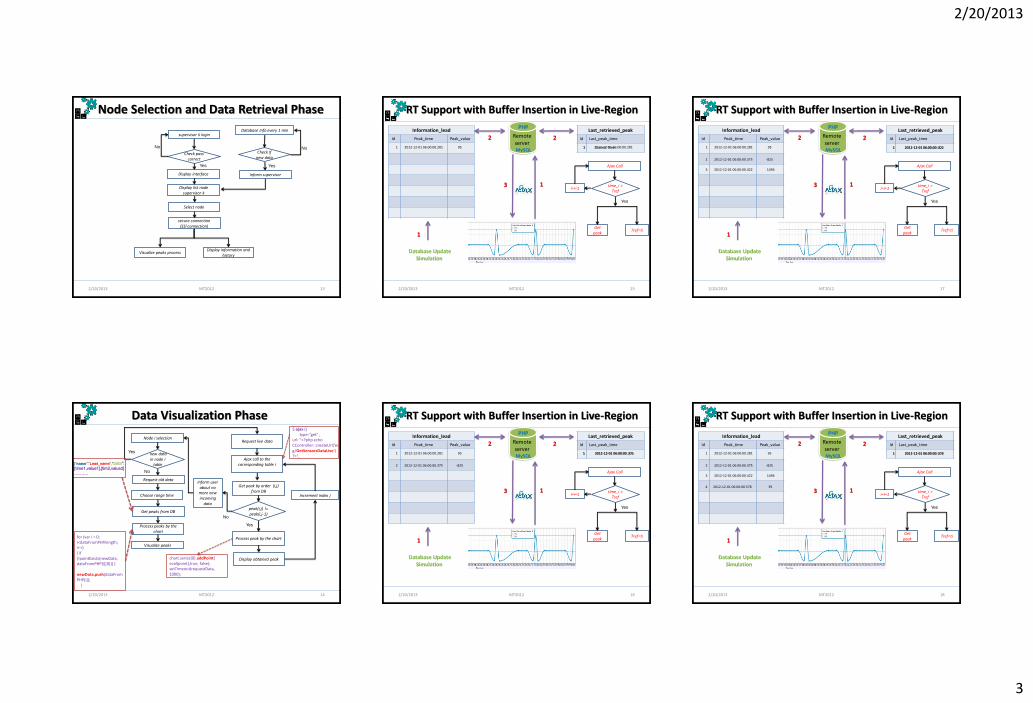
Node Selection and Data Retrieval Phase
MT2012 2/20/2013 13
Yes
Check If new data
No
Inform supervisor
Check pass correct
No
Yes
supervisor k login
Select node
secure connection (SSl connection)
Display interface
Display list node supervisor k
Display information and history
Visualize peaks process
Database Info every 1 min
Data Visualization Phase
MT2012 2/20/2013 14
Visualize peaks
Node i selection
Choose range time
Get peaks from DB
Request old data
Request live data
Process peaks by the chart
Ajax call to the corresponding table i
$.ajax ({ type:"get" , url: "<?php echo CController::createUrl('ecg/GetSensorsDataLive') ?>",
Get peak by order (i,j) from DB
Process peak by the chart for (var i = 0; i<dataFromPHP.length; i++) { if (!pointExists(newData, dataFromPHP[i][0])) { newData.push(dataFromPHP[i]); }
chart.series[0].addPoint( eval(point),true, false); setTimeout(requestData, 1000);
Display obtained peak
new data in node i
table
Yes
Increment index j
No
peak(i,j) != peak(i,j-1)
Yes
Inform user about no more new incoming
data
No
[{"name":“Lead_name","data":[[time1,value1],[tim2,value2]
………..
MT2012 2/20/2013 15
RT Support with Buffer Insertion in Live-Region
Information_lead
Id Peak_time Peak_value
Last_retrieved_peak
Id Last_peak_time
1 Current Time
Remote server
PHP
MySQL 1 2012-12-01 06:00:00.281 95
Database Update Simulation
1 2012-12-01 06:00:00.281
1
1
2 2
3
Ajax Call
time_i > Tref
Yes
i=i=1
Tref=ti Get
peak
MT2012 2/20/2013 16
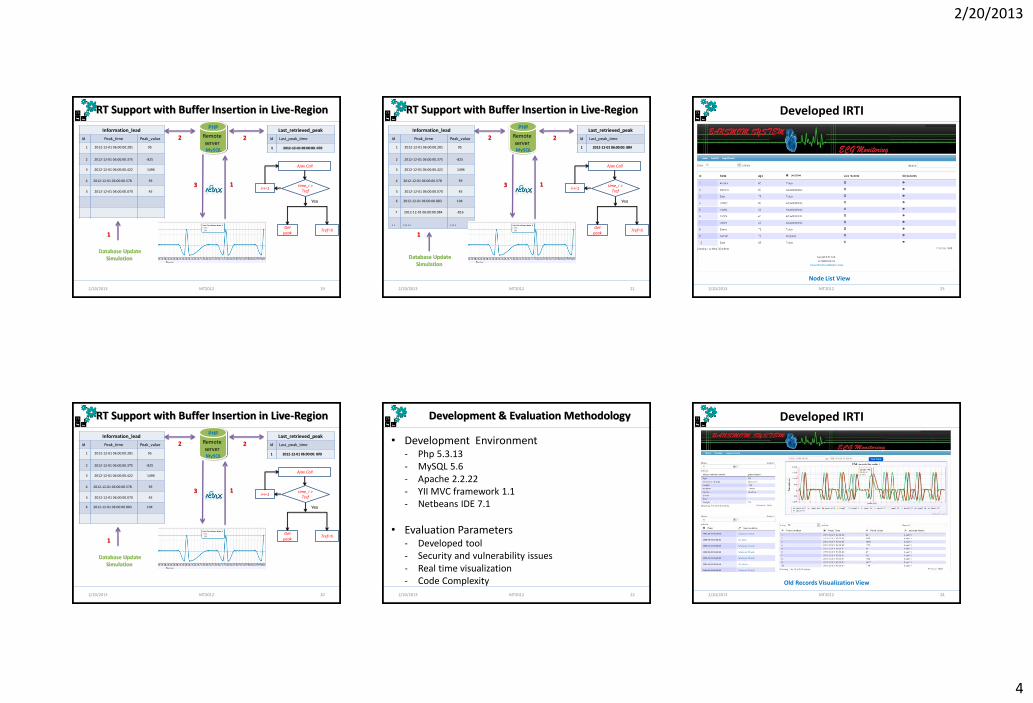
RT Support with Buffer Insertion in Live-Region
Information_lead
Id Peak_time Peak_value
Last_retrieved_peak
Id Last_peak_time
1 2012-12-01 06:00:00.001
Remote server
PHP
MySQL 1 2012-12-01 06:00:00.281 95
2 2012-12-01 06:00:00.375 -825
1 2012-12-01 06:00:00. 375
Database Update Simulation
1
1
2 2
3
Ajax Call
time_i > Tref
Yes
i=i=1
Tref=ti Get
peak
MT2012 2/20/2013 17
RT Support with Buffer Insertion in Live-Region
Information_lead
Id Peak_time Peak_value
Last_retrieved_peak
Id Last_peak_time
1 2012-12-01 06:00:00.001
Remote server
PHP
MySQL 1 2012-12-01 06:00:00.281 95
2 2012-12-01 06:00:00.375 -825
3 2012-12-01 06:00:00.422 1496
1 2012-12-01 06:00:00. 422
Database Update Simulation
1
1
2 2
3
Ajax Call
time_i > Tref
Yes
i=i=1
Tref=ti Get
peak
MT2012 2/20/2013 18
RT Support with Buffer Insertion in Live-Region
Information_lead
Id Peak_time Peak_value
Last_retrieved_peak
Id Last_peak_time
1 2012-12-01 06:00:00.001
Remote server
PHP
MySQL 1 2012-12-01 06:00:00.281 95
2 2012-12-01 06:00:00.375 -825
3 2012-12-01 06:00:00.422 1496
4 2012-12-01 06:00:00.578 39
1 2012-12-01 06:00:00. 578
Database Update Simulation
1
1
2 2
3
Ajax Call
time_i > Tref
Yes
i=i=1
Tref=ti Get
peak
2/20/2013
4
MT2012 2/20/2013 19
RT Support with Buffer Insertion in Live-Region
Information_lead
Id Peak_time Peak_value
Last_retrieved_peak
Id Last_peak_time Remote server
PHP
MySQL 1 2012-12-01 06:00:00.281 95
2 2012-12-01 06:00:00.375 -825
3 2012-12-01 06:00:00.422 1496
4 2012-12-01 06:00:00.578 39
5 2012-12-01 06:00:00.070 45
1 2012-12-01 06:00:00. 422 1 2012-12-01 06:00:00. 070
Database Update Simulation
1
1
2 2
3
Ajax Call
time_i > Tref
Yes
i=i=1
Tref=ti Get
peak
MT2012 2/20/2013 20
RT Support with Buffer Insertion in Live-Region
Information_lead
Id Peak_time Peak_value
Last_retrieved_peak
Id Last_peak_time Remote server
PHP
MySQL 1 2012-12-01 06:00:00.281 95
2 2012-12-01 06:00:00.375 -825
3 2012-12-01 06:00:00.422 1496
4 2012-12-01 06:00:00.578 39
5 2012-12-01 06:00:00.070 45
6 2012-12-01 06:00:00.883 104
1 2012-12-01 06:00:00. 070 1 2012-12-01 06:00:00. 883
Database Update Simulation
1
1
2 2
3
Ajax Call
time_i > Tref
Yes
i=i=1
Tref=ti Get
peak
MT2012 2/20/2013 21
RT Support with Buffer Insertion in Live-Region
Information_lead
Id Peak_time Peak_value
.. ….. ….
Last_retrieved_peak
Id Last_peak_time
1 2012-12-01 06:00:00. 883
Remote server
PHP
MySQL 1 2012-12-01 06:00:00.281 95
2 2012-12-01 06:00:00.375 -825
3 2012-12-01 06:00:00.422 1496
4 2012-12-01 06:00:00.578 39
5 2012-12-01 06:00:00.070 45
6 2012-12-01 06:00:00.883 104
7 2012-12-01 06:00:00.984 -816
1 2012-12-01 06:00:00. 984
Database Update Simulation
1
1
2 2
3
Ajax Call
time_i > Tref
Yes
i=i=1
Tref=ti Get
peak
MT2012
Development & Evaluation Methodology
2/20/2013 22
• Development Environment - Php 5.3.13 - MySQL 5.6 - Apache 2.2.22 - YII MVC framework 1.1 - Netbeans IDE 7.1
• Evaluation Parameters - Developed tool - Security and vulnerability issues - Real time visualization - Code Complexity
MT2012
Developed IRTI
2/20/2013 23
Node List View
MT2012
Developed IRTI
2/20/2013 24
Old Records Visualization View
2/20/2013
5
MT2012
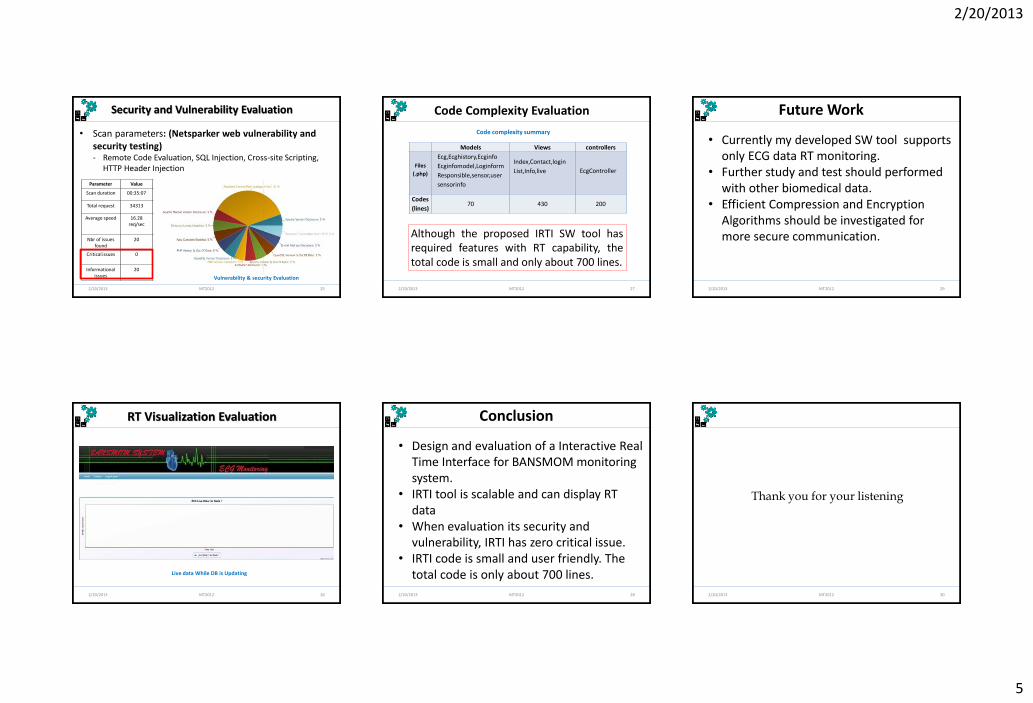
Security and Vulnerability Evaluation
2/20/2013 25
• Scan parameters: (Netsparker web vulnerability and security testing) - Remote Code Evaluation, SQL Injection, Cross-site Scripting,
HTTP Header Injection
Vulnerability & security Evaluation
Parameter Value
Scan duration 00:35:07
Total request 34313
Average speed 16.28 req/sec
Nbr of issues found
20
Critical issues 0
Informational issues
20
MT2012
RT Visualization Evaluation
2/20/2013 26
Live data While DB is Updating
MT2012
Code Complexity Evaluation
2/20/2013 27
Models Views controllers
Files
(.php)
Codes
(lines) 70 430 200
Code complexity summary
Ecg,Ecghistory,Ecginfo
Ecginfomodel,Loginform
Responsible,sensor,user
sensorinfo
Index,Contact,login
List,Info,live
EcgController
Although the proposed IRTI SW tool has required features with RT capability, the total code is small and only about 700 lines.
MT2012 2/20/2013 28
Conclusion
• Design and evaluation of a Interactive Real Time Interface for BANSMOM monitoring system.
• IRTI tool is scalable and can display RT data
• When evaluation its security and vulnerability, IRTI has zero critical issue.
• IRTI code is small and user friendly. The total code is only about 700 lines.
MT2012 2/20/2013 29
Future Work
• Currently my developed SW tool supports only ECG data RT monitoring.
• Further study and test should performed with other biomedical data.
• Efficient Compression and Encryption Algorithms should be investigated for more secure communication.
MT2012 2/20/2013 30
Thank you for your listening
2/20/2013
6
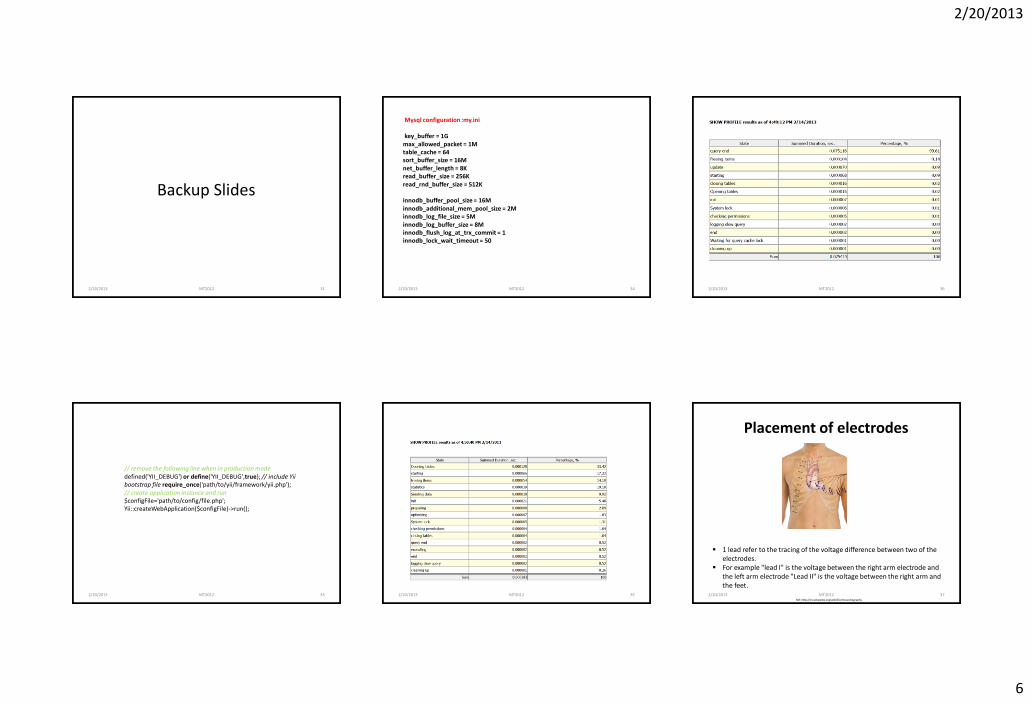
Backup Slides
2/20/2013 MT2012 31
2/20/2013 MT2012 33
// remove the following line when in production mode defined('YII_DEBUG') or define('YII_DEBUG',true); // include Yii bootstrap file require_once('path/to/yii/framework/yii.php'); // create application instance and run $configFile='path/to/config/file.php'; Yii::createWebApplication($configFile)->run();
2/20/2013 MT2012 34
Mysql configuration :my.ini key_buffer = 1G max_allowed_packet = 1M table_cache = 64 sort_buffer_size = 16M net_buffer_length = 8K read_buffer_size = 256K read_rnd_buffer_size = 512K innodb_buffer_pool_size = 16M innodb_additional_mem_pool_size = 2M innodb_log_file_size = 5M innodb_log_buffer_size = 8M innodb_flush_log_at_trx_commit = 1 innodb_lock_wait_timeout = 50
2/20/2013 MT2012 35
2/20/2013 MT2012 36
Placement of electrodes
2/20/2013 37
1 lead refer to the tracing of the voltage difference between two of the electrodes.
For example "lead I" is the voltage between the right arm electrode and the left arm electrode "Lead II" is the voltage between the right arm and the feet.
Ref: http://en.wikipedia.org/wiki/Electrocardiography
MT2012