Embed Size (px)
Citation preview

Interception on trees, impermeable surfacesInfiltration into soilInterflow downslope along B horizonOverland flow during heavy rainRecharge reaches the water tableGroundwater flow from recharge area to streamWater table rises Evaporation removes intercepted waterEvapotranspiration (ET) from plants removes water from soilBaseflow to streams depletes water in aquifer
Hydrologic Cycle
Baseflow and ET continue until next rainfallRainfall
Aquifer
Vadose zoneSoil B horizon
Streamwater table
Rain stopsOverland + Interflow = Stormflow. Stream level rises

Hydrogeologic Regions
Geologic controls on – Porosity and hydraulic conductivity
– Layering, structure, and aquifer type
– Water chemistry
– Well yield

Hydro-geology of
the Southeast
Floridan
Floridan
Lim
estone
Lim
estone
Appal
achi
an
Sed
imen
tary
Rock
Lim
esto
nePied
mont C
rysta
lline
rock
Coasta
l Plai
n
San
d + cl
ay
Ground Water Atlas
http://capp.water.usgs.gov/gwa/gwa.html


Fractured crystalline rock

Transition
Fractured metamorphic and igneous rock
K: 10-11-10-3 m/s
T: 1-100 m2/day
S: 10-3 -10-4
Saprolite: K: 10-6-10-5 m/s
S: 0.1-0.4

Hydrogeologic Conceptual Model
R: 0.2 m/yr
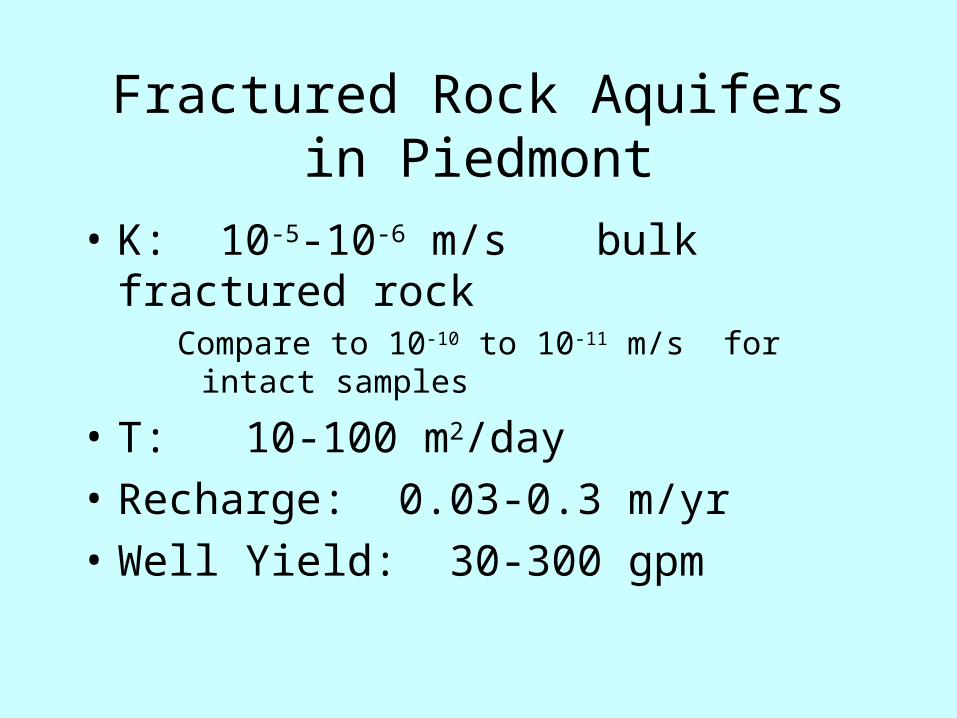
Fractured Rock Aquifers in Piedmont
• K: 10-5-10-6 m/s bulk fractured rockCompare to 10-10 to 10-11 m/s for intact samples
• T: 10-100 m2/day
• Recharge: 0.03-0.3 m/yr
• Well Yield: 30-300 gpm

Atlantic Coastal Plain

Coastal Plain
Santee River Delta

Sand and clay

clay
Sand
Columbia Myrtle Beach
Atlantic Coastal Plain

Flowing wells
Edwards Aquifer, San Antonio, Texas Roswell Basin, NM, 3600 gpm

Coastal Plain Clastic Aquifers
• T: 500-10,000 m2/day
• Recharge: 0.05-0.5 m/yr
• Well Yield: 100-5000 gpm

Floridan Aquifer
Floridan
Floridan
Lim
estone
Lim
estone
Appal
achi
an
Sed
imen
tary
Rock
Lim
esto
nePied
mont C
rysta
lline
rock
Coasta
l Plai
n
San
d + cl
ay
Ground Water Atlas
http://capp.water.usgs.gov/gwa/gwa.html

Floridan Limestone Aquifer

Limestone aquifer

Floridan Aquifer
• T: 1000-100,000 m2/day
• Recharge: 0.03-0.5 m/yr
• Well Yield: 1000-20,000 gpm

Comparison of SE Regions
Region T (m2/day) Recharge (m/yr) Qwell (gpm)
Piedmont 1-100 0.03-0.3 10-100
Coastal Plain Clastic 500-10,000 0.05-0.5 100-5000
Floridan Limestone 1,000-100,000 0.03-0.5 1000-20,000