Embed Size (px)
Citation preview
lable at ScienceDirect
Quaternary International 380-381 (2015) 133e142
Contents lists avai
Quaternary International
journal homepage: www.elsevier .com/locate/quaint
Interference of natural and anthropogenic forcings on variations incontinental freshwater discharge from the Red River (Vietnam) to sea
Jinjuan Gao, Zhijun Dai*, Xuefei Mei, Zhenpeng Ge, Wen Wei, Hualiang Xie, Shushi LiState Key Lab of Estuarine & Coastal Research, East China Normal University, Shanghai 200062, China
a r t i c l e i n f o
Article history:Available online 31 January 2015
Keywords:Continental freshwater dischargeExtreme conditionRed RiverAnthropogenic activities
* Corresponding author.E-mail address: [email protected] (Z. Dai).
http://dx.doi.org/10.1016/j.quaint.2015.01.0071040-6182/© 2015 Elsevier Ltd and INQUA. All rights
a b s t r a c t
Continental freshwater discharge is vital to global human development. Intensive studies have beenconducted on changes of river discharge around the world (Dai et al., 2009; Milliman and Farnsworth,2011). However, little work has been carried out on the daily continental freshwater discharge of the RedRiver in response to influence of the natural and anthropogenic forcings. This paper presents results ofchange analysis of daily continental freshwater discharge over the period 1956e2009 in the Red River.The wavelet analysis results showed observable periodicities in the continental freshwater dischargeseries with 4e6 months, 8e12 months, 1.5e2 years, and 4e7 years (48e80 months), respectively. Theresults fromManneKendall test indicated insignificant trends in annual continental freshwater dischargeduring the study period, but there is clearly decrease in annual suspended particulate matter of the RedRiver. It is shown that the continental freshwater discharge from the Red River was dominated byprecipitation over the catchments. Moreover, changes in the continental freshwater discharge are closelyrelated to SASM (the South Asia Summer Monsoon) and ENSO (EI Ni~no Southern Oscillation). Variationsin daily discharge are lagged behind SASM 13e29 days. It revealed that El Ni~no and La Ni~na events arelikely to induce extreme low and extreme high continental freshwater discharge from the Red River intothe Tokin Gulf, respectively. Meanwhile, continental freshwater discharge from the Red River into theTonkin Gulf experienced abrupt changes with present characteristics as ‘no flood in the flood season, nodrought in the drought season’ due to water regulation induced by dam.
© 2015 Elsevier Ltd and INQUA. All rights reserved.
1. Introduction
Continental freshwater discharge, occurs mainly at the mouthsof the world's major rivers, is of vital importance to estuaryecosystem and adjacent areas. The continental freshwaterdischarge provides primary link in land and sea, hydrological cycleand thermodynamic stability of the oceans, and biogeochemicalprocesses (Dai et al., 2009; Milliman and Farnsworth, 2011;Restrepo et al., 2014). In addition, continental runoff represents amajor portion of freshwater resources available to terrestrial in-habitants (Dai et al., 2009). However, the continental freshwaterdischarge has been subjected to significant changes in recent de-cades due to climate change and anthropogenic activities (Nilssonet al., 2005; Dai et al., 2011; Milliman and Farnsworth, 2011).Therefore, Understanding of changes in continental freshwaterdischarge is central to assessing the impact of climate and
reserved.
interferences of anthropogenic activities on water resources(V€or€osmarty et al., 2000).
It is indicated that therewas 4% increase in global runoff per 1 �Cglobal surface warming, although continental runoff had largedecadal to multidecadal variations (Labat et al., 2004). Differentareas present different variation tendency in water discharge. Forinstance, the water discharge present upward trend in the UnitedStates over latter half of the twentieth century because of precipi-tation increase, and decreases in 64 Canadian rivers from 1964 to2003 in response to rainfall decrease (Groisman et al., 2001; D�eryand Wood, 2005).
Moreover, river discharge around the world has been regu-lated by extensively anthropogenic activities, such as impound-ments and diversions (Nilsson et al., 2005). Annual discharge ofChangjiang (Yangtze River) showed a decreasing trend over theIndustrial Period as a result of human impacts, in particular,reservoir construction and water consumption (Dai et al., 2008a;Yang et al., 2010). Dam regulation in upper Mekong River pro-duced declining trend in downstream flows during dry season(Lu and Siew, 2006).
J. Gao et al. / Quaternary International 380-381 (2015) 133e142134
It is clearly that river discharges around the world exhibitvarious characteristics correspond to a series of complicate factors.Milliman et al. (2008) indicated that the continental freshwaterdischarge had decreased more than that implied by changes inprecipitation only over rivers with low water, such as the Indus,Yellow, and TigriseEuphrates. Dai et al. (2009) suggested that ef-fects of human activities on yearly continental freshwater dischargeof the many of the world's large rivers are likely small comparedwith those of climate variations during 1948e2004.
By far, most studies onwater discharge were based on annual ormonthly mean data, which fails to provide accurate analysis onhydrological processes. It is important to obtain daily informationto understand how the river hydrology and extreme events changesin response to climate change and human activities, especially tothose large river basins with dense populations.
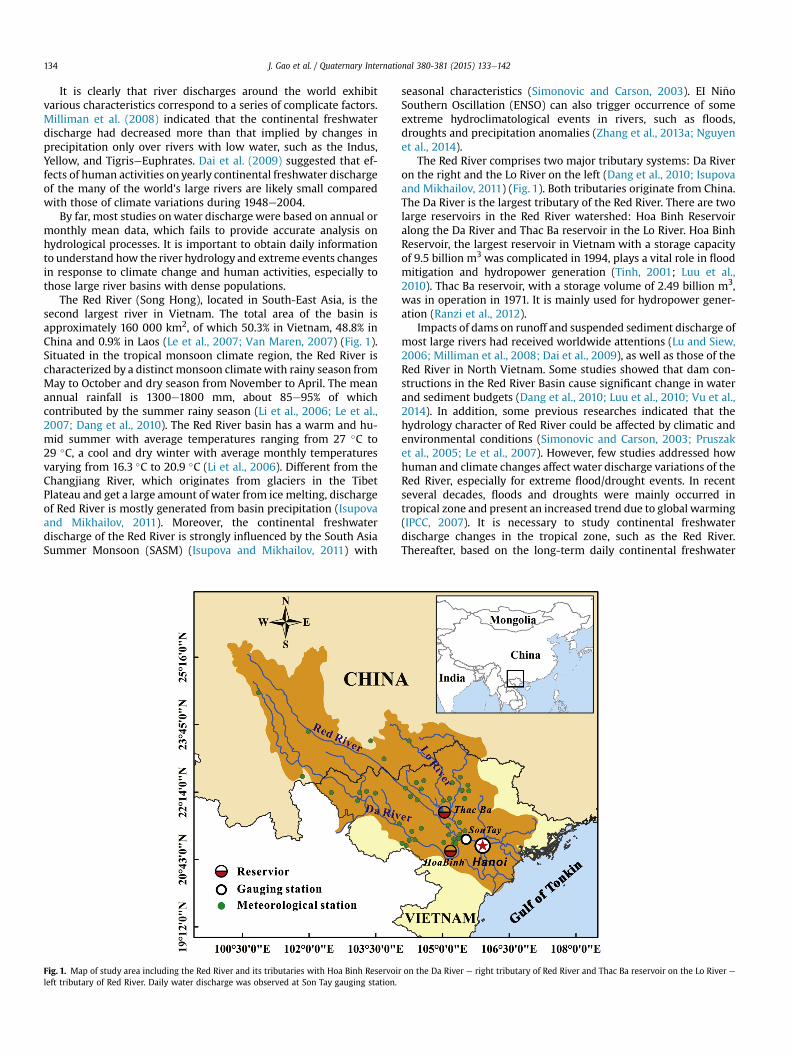
The Red River (Song Hong), located in South-East Asia, is thesecond largest river in Vietnam. The total area of the basin isapproximately 160 000 km2, of which 50.3% in Vietnam, 48.8% inChina and 0.9% in Laos (Le et al., 2007; Van Maren, 2007) (Fig. 1).Situated in the tropical monsoon climate region, the Red River ischaracterized by a distinct monsoon climatewith rainy season fromMay to October and dry season from November to April. The meanannual rainfall is 1300e1800 mm, about 85e95% of whichcontributed by the summer rainy season (Li et al., 2006; Le et al.,2007; Dang et al., 2010). The Red River basin has a warm and hu-mid summer with average temperatures ranging from 27 �C to29 �C, a cool and dry winter with average monthly temperaturesvarying from 16.3 �C to 20.9 �C (Li et al., 2006). Different from theChangjiang River, which originates from glaciers in the TibetPlateau and get a large amount of water from ice melting, dischargeof Red River is mostly generated from basin precipitation (Isupovaand Mikhailov, 2011). Moreover, the continental freshwaterdischarge of the Red River is strongly influenced by the South AsiaSummer Monsoon (SASM) (Isupova and Mikhailov, 2011) with
Fig. 1. Map of study area including the Red River and its tributaries with Hoa Binh Reservoileft tributary of Red River. Daily water discharge was observed at Son Tay gauging station.
seasonal characteristics (Simonovic and Carson, 2003). EI Ni~noSouthern Oscillation (ENSO) can also trigger occurrence of someextreme hydroclimatological events in rivers, such as floods,droughts and precipitation anomalies (Zhang et al., 2013a; Nguyenet al., 2014).
The Red River comprises two major tributary systems: Da Riveron the right and the Lo River on the left (Dang et al., 2010; Isupovaand Mikhailov, 2011) (Fig. 1). Both tributaries originate from China.The Da River is the largest tributary of the Red River. There are twolarge reservoirs in the Red River watershed: Hoa Binh Reservoiralong the Da River and Thac Ba reservoir in the Lo River. Hoa BinhReservoir, the largest reservoir in Vietnam with a storage capacityof 9.5 billion m3 was complicated in 1994, plays a vital role in floodmitigation and hydropower generation (Tinh, 2001; Luu et al.,2010). Thac Ba reservoir, with a storage volume of 2.49 billion m3,was in operation in 1971. It is mainly used for hydropower gener-ation (Ranzi et al., 2012).
Impacts of dams on runoff and suspended sediment discharge ofmost large rivers had received worldwide attentions (Lu and Siew,2006; Milliman et al., 2008; Dai et al., 2009), as well as those of theRed River in North Vietnam. Some studies showed that dam con-structions in the Red River Basin cause significant change in waterand sediment budgets (Dang et al., 2010; Luu et al., 2010; Vu et al.,2014). In addition, some previous researches indicated that thehydrology character of Red River could be affected by climatic andenvironmental conditions (Simonovic and Carson, 2003; Pruszaket al., 2005; Le et al., 2007). However, few studies addressed howhuman and climate changes affect water discharge variations of theRed River, especially for extreme flood/drought events. In recentseveral decades, floods and droughts were mainly occurred intropical zone and present an increased trend due to global warming(IPCC, 2007). It is necessary to study continental freshwaterdischarge changes in the tropical zone, such as the Red River.Thereafter, based on the long-term daily continental freshwater
r on the Da River e right tributary of Red River and Thac Ba reservoir on the Lo River e
J. Gao et al. / Quaternary International 380-381 (2015) 133e142 135
discharge over 1956e2009 at Son Tay station, this paper aims to (1)detect the trends in discharge series of the Red River; (2) identifythe factors that affect the discharge variations and (3) evaluate theoccurrences of extreme events in recent decades.
2. Materials and methods
2.1. Materials
In this study, daily freshwater discharge data during 1956e2009and yearly suspended particulate matters (SPM) during 1959e2006at Son Tay gauging station (Fig. 1) were collected from the VietnamInstitute of Meteorology, Hydrology and Environment (IMHE)(http://www.imh.ac.vn/). In order to reconstruct the occasionallymissing data in 1959 and 2006, linear regression function wasproposed. Precipitation data during 1975e2006 at 42 meteoro-logical stations were obtained from China Meteorological Admin-istration National Meteorological Information Center (http://cdc.cma.gov.cn/) and Vietnam's HydroMeteorological Data Center(http://www.hymetdata.gov.vn/). And then the mean annual pre-cipitation of Red River Basinwas calculated by the Thiessen polygonmethod (Unwin and Unwin, 1998).
Meanwhile, the SASM index and ENSO index were alsoconsidered for statistical analysis. SASM is defined as an area-averaged seasonally (June to September) dynamical normalizedseasonality (DNS) at 850 hPa within the South Asia domain(5�e22.5�N, 35�e97.5�E) (Li and Zeng, 2002, 2003, 2005; availableat: http://ljp.lasg.ac.cn/dct/page). ENSO index is described by seasurface temperature (SST) over the tropical Pacific (4�Se4�N,150�We90�W). If the SST values are at or above 0.5 �C for 6consecutive months (including OctobereDecember (OND)), theENSO year of October through the following September is catego-rized as El Ni~no (warm events). When the index values are equal orbelow �0.5 �C for 6 consecutive months, the ENSO year is catego-rized as La Ni~na (cold events). Consequently, the El Ni~no and LaNi~na events during 1959e2006 were obtained. The index is a 5-month running mean SST anomaly for the region, and is availablefrom ftp://www.coaps.fsu.edu/pub/JMA_SST_Index/.
Here, the extreme drought and flood events in the Red Riverwere assessed using percentile-based indices, as described byBonsal et al. (2001). According to the IPCC Fourth AssessmentReport, the extreme climate is usually defined as the occurrence ofa value of a weather or climate variable above (or below) a fixedthreshold (IPCC, 2007). Here, we selected the 10th and 90thpercentile of the daily freshwater discharge as the threshold. 10thpercentile presents extreme low discharge, while 90th percentileindicates extreme high discharge. Five statistical indicators,including coefficient of variation (Cv), maximum/minimummonthly mean discharge, and mean wet/dry season discharge ofeach year were calculated by the Moment method (Greenwoodet al., 1979). Lag correlation analysis was carried out to examinewhen the southwest monsoon suggests most significant impact onthe daily water discharge (Zhang et al., 2013b). Moreover, simplefrequency analysis was applied to detect difference between preand post-dam water discharge before and after dam construction.
2.2. Methodology
Three techniques have been used in this study:Wavelet analysis,ManneKendall test, Sequential ManneKendall test. Details of thesetechniques are list in following sections.
2.2.1. Wavelet analysisWavelet analysis (also known as wavelet theory) is a common
tool for providing accurate localized temporal and frequency
information, which decompose a complicated time series into afinite number of components (Torrence and Compo, 1998).Compared with other signal analysis methods, wavelet analysismethod can explore a signal, or a field, in terms of time and scale,and possibly directions (Farge, 1992). It has been widely applied inhydrological research (Sang et al., 2013). Here, Morlet waveletanalysis and associated global wavelet spectrum of Red Noise test(at a significant level of 0.1) is performed on the long-term datasetto obtain the periodic variation.
The long-term continental freshwater discharge dataset in theRed River suggests fluctuation in various time scales. Therefore, theMorlet wavelet analysis is firstly applied to the normalizedmonthlyfreshwater discharge to extract the short-term fluctuation, such asdominant seasonal characteristics. And then, the Morlet waveletanalysis is applied to the reconstructed normalized monthlyfreshwater discharge to obtain long-term variations.
2.2.2. ManneKendall testTwo types of trend tests, including linear regressionmethod and
nonparametric ManneKendall test are presented in this studyrespectively, to determine whether the time series changes overtime. The ManneKendall test states a monotonic trend when Zvalues exceed the critical values ±1.96 (a ¼ 0.05). A positive Z valueindicates an increasing trend, while a negative Z value suggests adecreasing trend (Mann, 1945; Kendall, 1975).
2.2.3. Sequential ManneKendall testThe Sequential version of ManneKendall test is suggested to
detect the abrupt change in the discharge series, following theprocedures described by Gerstengarbe and Werner (1999) andMiao et al. (2010). The test is composed of two series: a progressivestatistic variable UFk and a backward one UBk. If the UFk and UBkcurves cross each other and the intersection of the two series lo-cates beyond the specific threshold value ±1.96 (significant level of0.05), an abrupt change at that point can be inferred (Miao et al.,2010).
In attention, lag-correlation analysis was used to examine therelation between SASM index and continental freshwater dischargeof the Red River. To evaluate the influence of ENSO events on waterdischarge of Red River, correlation analysis was conducted betweenENSO index and monthly mean discharge anomalies during the LaNi~na phase and El Ni~no phase, respectively.
3. Results
3.1. Periodicities of continental freshwater discharge
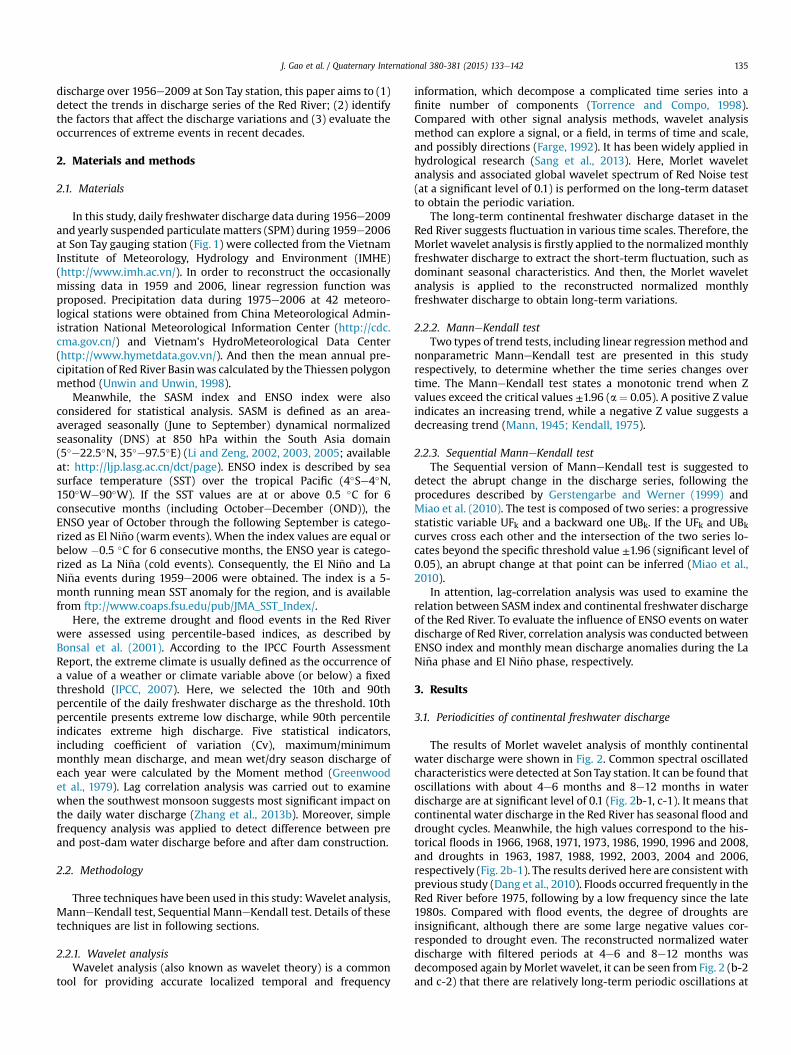
The results of Morlet wavelet analysis of monthly continentalwater discharge were shown in Fig. 2. Common spectral oscillatedcharacteristics were detected at Son Tay station. It can be found thatoscillations with about 4e6 months and 8e12 months in waterdischarge are at significant level of 0.1 (Fig. 2b-1, c-1). It means thatcontinental water discharge in the Red River has seasonal flood anddrought cycles. Meanwhile, the high values correspond to the his-torical floods in 1966, 1968, 1971, 1973, 1986, 1990, 1996 and 2008,and droughts in 1963, 1987, 1988, 1992, 2003, 2004 and 2006,respectively (Fig. 2b-1). The results derived here are consistent withprevious study (Dang et al., 2010). Floods occurred frequently in theRed River before 1975, following by a low frequency since the late1980s. Compared with flood events, the degree of droughts areinsignificant, although there are some large negative values cor-responded to drought even. The reconstructed normalized waterdischarge with filtered periods at 4e6 and 8e12 months wasdecomposed again byMorlet wavelet, it can be seen from Fig. 2 (b-2and c-2) that there are relatively long-term periodic oscillations at
Fig. 2. Plots of wavelet power spectrum of water discharge time series at Son Tay station by Morlet wavelet: (a-1) The normalized time series of monthly discharge used for thewavelet analysis. (b-1) The wavelet local power spectrum of (a-1). (c-1) the global wavelet power spectrum of (a-1). (a-2) The normalized time series of monthly discharge filtratedshort-term oscillations of4e20 months. (b-2) The wavelet local power spectrum of (a-2). (c-2) The global wavelet power spectrum of (a-1). In Fig. b-1 and b-2, The black contourencloses regions of greater than 90% confidence for a red-noise process as shown in b-1 and b-2. The end of the large curve indicates the “cone of influence”. In Fig. c-1 and c-2, thedashed line indicate the red noise power spectrum.
J. Gao et al. / Quaternary International 380-381 (2015) 133e142136
the significant level of 0.1, with 18e32 months (1.5e2 years) andapproximately 48e80 months (4e7 years) periodicities.
3.2. Trends of continental freshwater discharge
Linear regression analysis and ManneKendall test were appliedto detect trends in the discharge series. The results of the twotechniques were approximately similar.
Outputs of linear regression analysis for mean annual discharge,mean seasonal discharge, and maximum and minimum monthlydischarge were shown in Fig. 3. It was observed that mean annualwater discharge was dominated by decreasing trend, but failed topass the significant level of 0.05 (Fig. 3a). Over the period of1956e2009, the mean water discharge in wet season andmaximum mean discharge present significant decreasing trend(Fig. 3b, d). On the other hand, significant increasing trends formean discharge in dry season and minimum monthly dischargewere detected (Fig. 3c, e).
The results of ManneKendall test for discharge and precipita-tion series are illustrated in Table 1. Significant increasing trend indry season and decreasing trend in wet season were detectedduring the period 1956e2009. The ratios of maximum to minimummonth discharge present remarkable reductions during the studyperiods of 1956e2009 and 1975e2006. However, no significanttrends were detected in the precipitation during 1975e2006.ManneKendall test was applied to analysis the abrupt change inthe annual discharge series (Fig. 4). The test identified curve junc-tion in 1986, 1989, 1991 and 1993.
3.3. Extreme values of continental freshwater discharge
It is important to understand the changes in extreme events,because they are closely related to flood and drought events, andmay cause serious damage to agriculture and energy sectors (Cruzet al., 2013). In this section, we address trend analysis of extremewater discharge, refers to 10th (a) and 90th (b) percentiles ofannual daily discharge, and the number of annual extreme events(discharge below 10th and over 90th percentiles), variation coef-ficient of daily discharge and the ratio between annual maximumdischarge and minimum discharge (Fig. 5).
It is indicated that the annual 10th and 90th percentiles presentdifferent trend over the period of 1956e2009: the annual 10thpercentile showed increasing trends while the annual 90thpercentile revealed opposite tendencies (Fig. 5 (aeb)). By investi-gating the number of annual extreme events, this study suggestedthat both extreme low and extreme high discharges presentnegative trends (Fig. 5 (ced)). The analysis of variation coefficientand maximum discharge/minimum discharge ratio indicated sig-nificant decreasing trend at the significance level of 0.001 and 0.05,respectively (Fig. 6). Taken altogether, it can be concluded fromthose results that the deviation between extreme low and extremehigh discharge was diminishing. This phenomenon can bedescribed as ‘no flood in the flood season, no drought in thedrought season’, which is similar to those occurred in the Chang-jiang River (Dai et al., 2008b).
3.4. Changes of SPM
Unlike the river discharge, annual SPM diacharge of Red Rivershowed dramatic variations with a wide range of 24e201 (106 t/yr)and a mean value of 88.57 (106 t/yr) from 1960 to 2008 (Fig. 7).Linear fitting analysis showed that SPM discharge showed aremarkable reduction during the whole observed period of1960e2008 (Fig. 7). Furtherly, it can be found that SPM hadincreased significantly during the period of 1960e1973 and rapidlydecreased during 1990e2008 (Fig. 7).
4. Impacts on the continental freshwater discharge
4.1. Impacts of climate factors
The influence of climatic factors, including the precipitation,SASM and ENSO events on the Red River dischargewill be discussedin this part.
The Relationship between basin precipitation and waterdischarge of the Red River was detected by linear regression anal-ysis. Results showed that there is a strong positive correlation be-tween the precipitation and discharge (Fig. 8), indicating thatprecipitation is the main replenishment of the river discharge. Thehigh dependence of discharge on precipitation was similar withthat of Mekong River (Xue et al., 2011). While no significant change
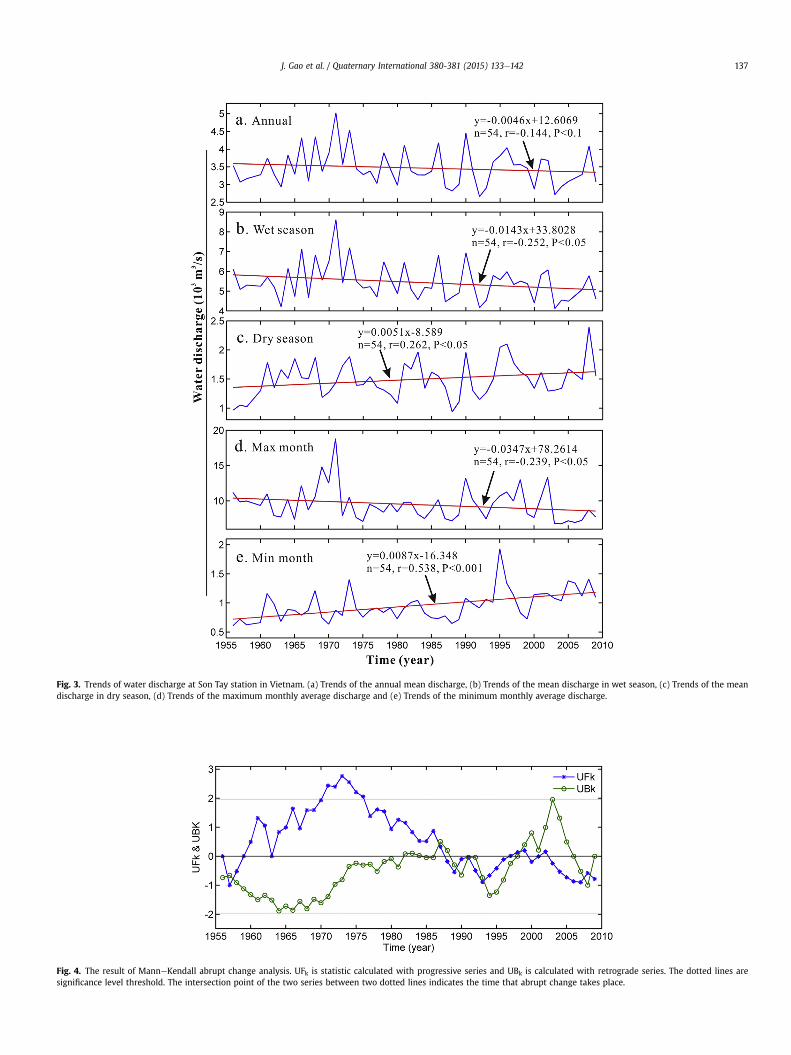
Fig. 3. Trends of water discharge at Son Tay station in Vietnam. (a) Trends of the annual mean discharge, (b) Trends of the mean discharge in wet season, (c) Trends of the meandischarge in dry season, (d) Trends of the maximum monthly average discharge and (e) Trends of the minimum monthly average discharge.
Fig. 4. The result of ManneKendall abrupt change analysis. UFk is statistic calculated with progressive series and UBk is calculated with retrograde series. The dotted lines aresignificance level threshold. The intersection point of the two series between two dotted lines indicates the time that abrupt change takes place.
J. Gao et al. / Quaternary International 380-381 (2015) 133e142 137
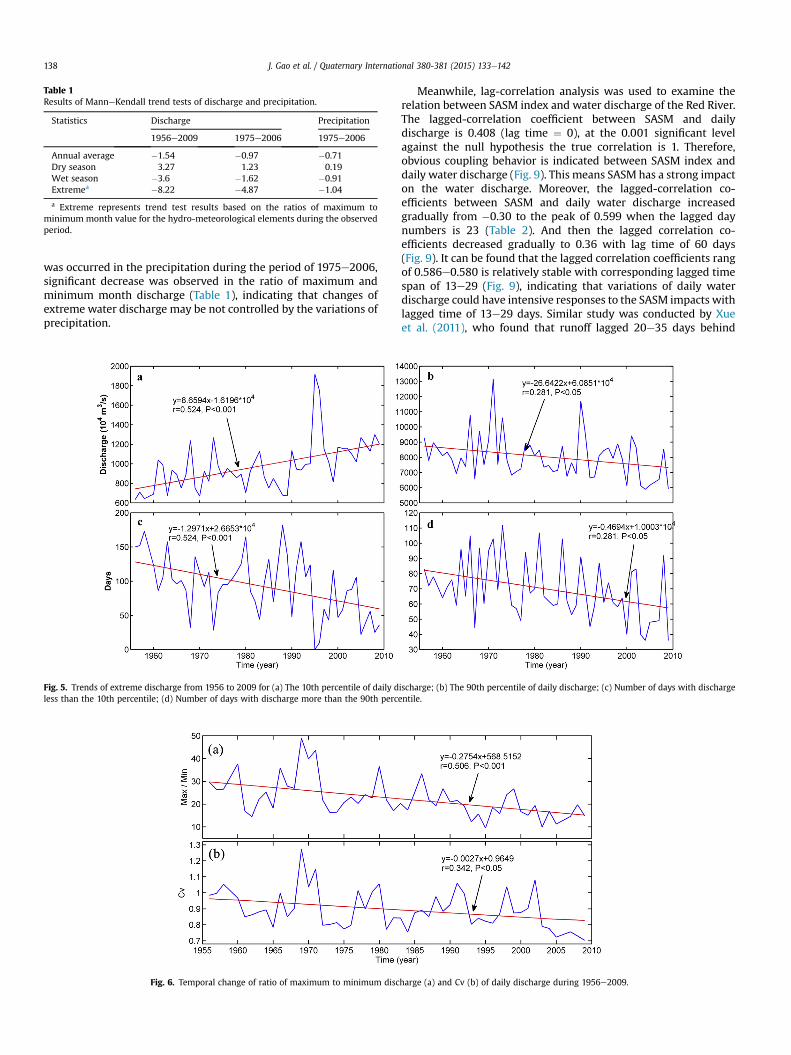
Table 1Results of ManneKendall trend tests of discharge and precipitation.
Statistics Discharge Precipitation
1956e2009 1975e2006 1975e2006
Annual average �1.54 �0.97 �0.71Dry season 3.27 1.23 0.19Wet season �3.6 �1.62 �0.91Extremea �8.22 �4.87 �1.04
a Extreme represents trend test results based on the ratios of maximum tominimum month value for the hydro-meteorological elements during the observedperiod.
J. Gao et al. / Quaternary International 380-381 (2015) 133e142138
was occurred in the precipitation during the period of 1975e2006,significant decrease was observed in the ratio of maximum andminimum month discharge (Table 1), indicating that changes ofextreme water discharge may be not controlled by the variations ofprecipitation.
Fig. 5. Trends of extreme discharge from 1956 to 2009 for (a) The 10th percentile of daily dless than the 10th percentile; (d) Number of days with discharge more than the 90th perc
Fig. 6. Temporal change of ratio of maximum to minimum disc
Meanwhile, lag-correlation analysis was used to examine therelation between SASM index and water discharge of the Red River.The lagged-correlation coefficient between SASM and dailydischarge is 0.408 (lag time ¼ 0), at the 0.001 significant levelagainst the null hypothesis the true correlation is 1. Therefore,obvious coupling behavior is indicated between SASM index anddaily water discharge (Fig. 9). This means SASM has a strong impacton the water discharge. Moreover, the lagged-correlation co-efficients between SASM and daily water discharge increasedgradually from �0.30 to the peak of 0.599 when the lagged daynumbers is 23 (Table 2). And then the lagged correlation co-efficients decreased gradually to 0.36 with lag time of 60 days(Fig. 9). It can be found that the lagged correlation coefficients rangof 0.586e0.580 is relatively stable with corresponding lagged timespan of 13e29 (Fig. 9), indicating that variations of daily waterdischarge could have intensive responses to the SASM impacts withlagged time of 13e29 days. Similar study was conducted by Xueet al. (2011), who found that runoff lagged 20e35 days behind
ischarge; (b) The 90th percentile of daily discharge; (c) Number of days with dischargeentile.
harge (a) and Cv (b) of daily discharge during 1956e2009.
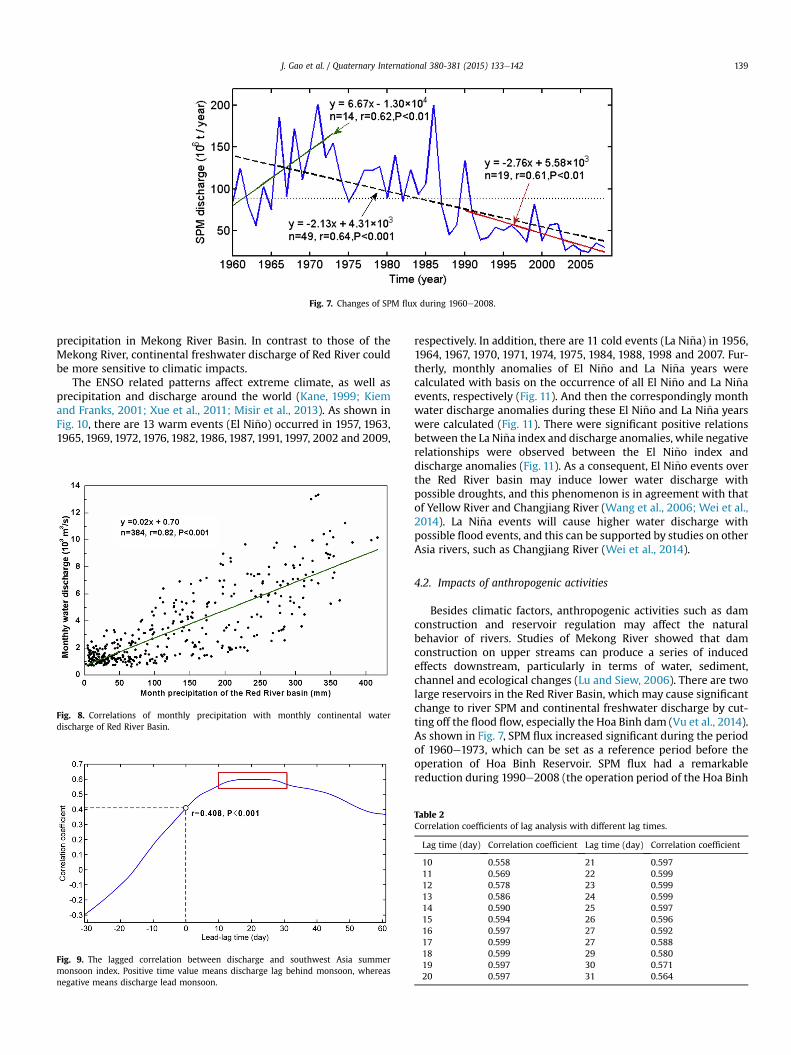
Fig. 7. Changes of SPM flux during 1960e2008.
J. Gao et al. / Quaternary International 380-381 (2015) 133e142 139
precipitation in Mekong River Basin. In contrast to those of theMekong River, continental freshwater discharge of Red River couldbe more sensitive to climatic impacts.
The ENSO related patterns affect extreme climate, as well asprecipitation and discharge around the world (Kane, 1999; Kiemand Franks, 2001; Xue et al., 2011; Misir et al., 2013). As shown inFig. 10, there are 13 warm events (El Ni~no) occurred in 1957, 1963,1965, 1969, 1972, 1976, 1982, 1986, 1987, 1991, 1997, 2002 and 2009,
Fig. 8. Correlations of monthly precipitation with monthly continental waterdischarge of Red River Basin.
Fig. 9. The lagged correlation between discharge and southwest Asia summermonsoon index. Positive time value means discharge lag behind monsoon, whereasnegative means discharge lead monsoon.
respectively. In addition, there are 11 cold events (La Ni~na) in 1956,1964, 1967, 1970, 1971, 1974, 1975, 1984, 1988, 1998 and 2007. Fur-therly, monthly anomalies of El Ni~no and La Ni~na years werecalculated with basis on the occurrence of all El Ni~no and La Ni~naevents, respectively (Fig. 11). And then the correspondingly monthwater discharge anomalies during these El Ni~no and La Ni~na yearswere calculated (Fig. 11). There were significant positive relationsbetween the La Ni~na index and discharge anomalies, while negativerelationships were observed between the El Ni~no index anddischarge anomalies (Fig. 11). As a consequent, El Ni~no events overthe Red River basin may induce lower water discharge withpossible droughts, and this phenomenon is in agreement with thatof Yellow River and Changjiang River (Wang et al., 2006; Wei et al.,2014). La Ni~na events will cause higher water discharge withpossible flood events, and this can be supported by studies on otherAsia rivers, such as Changjiang River (Wei et al., 2014).
4.2. Impacts of anthropogenic activities
Besides climatic factors, anthropogenic activities such as damconstruction and reservoir regulation may affect the naturalbehavior of rivers. Studies of Mekong River showed that damconstruction on upper streams can produce a series of inducedeffects downstream, particularly in terms of water, sediment,channel and ecological changes (Lu and Siew, 2006). There are twolarge reservoirs in the Red River Basin, which may cause significantchange to river SPM and continental freshwater discharge by cut-ting off the flood flow, especially the Hoa Binh dam (Vu et al., 2014).As shown in Fig. 7, SPM flux increased significant during the periodof 1960e1973, which can be set as a reference period before theoperation of Hoa Binh Reservoir. SPM flux had a remarkablereduction during 1990e2008 (the operation period of the Hoa Binh
Table 2Correlation coefficients of lag analysis with different lag times.
Lag time (day) Correlation coefficient Lag time (day) Correlation coefficient
10 0.558 21 0.59711 0.569 22 0.59912 0.578 23 0.59913 0.586 24 0.59914 0.590 25 0.59715 0.594 26 0.59616 0.597 27 0.59217 0.599 27 0.58818 0.599 29 0.58019 0.597 30 0.57120 0.597 31 0.564
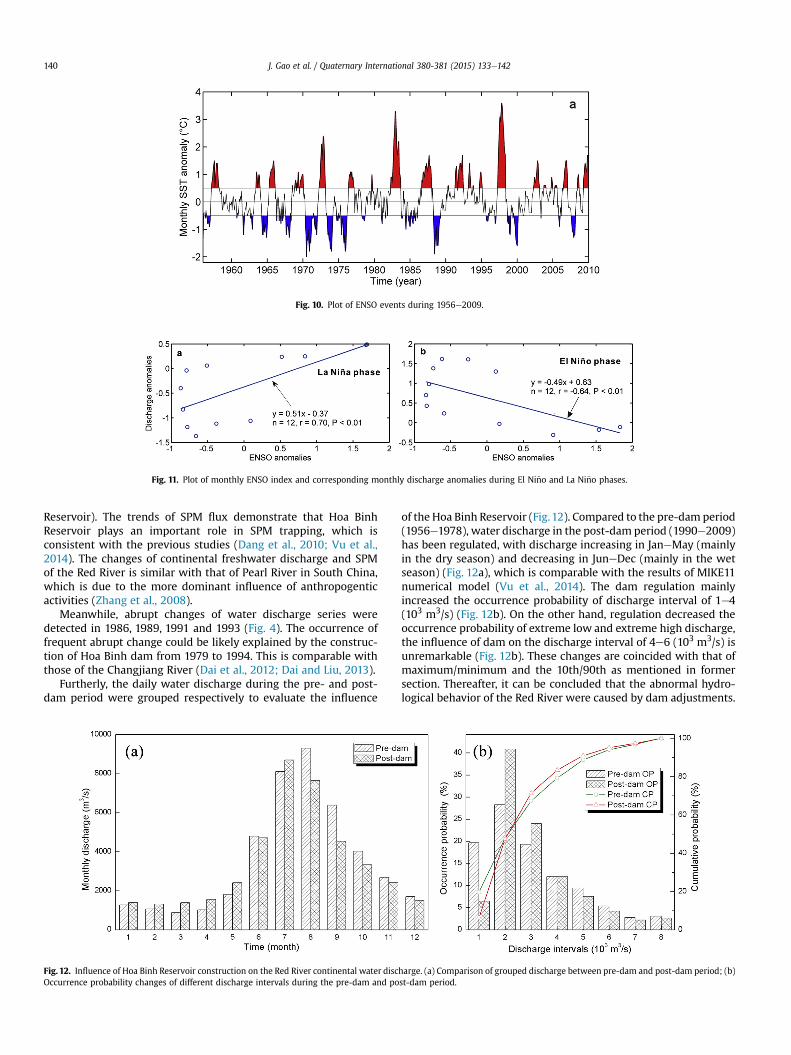
Fig. 10. Plot of ENSO events during 1956e2009.
Fig. 11. Plot of monthly ENSO index and corresponding monthly discharge anomalies during El Ni~no and La Ni~no phases.
J. Gao et al. / Quaternary International 380-381 (2015) 133e142140
Reservoir). The trends of SPM flux demonstrate that Hoa BinhReservoir plays an important role in SPM trapping, which isconsistent with the previous studies (Dang et al., 2010; Vu et al.,2014). The changes of continental freshwater discharge and SPMof the Red River is similar with that of Pearl River in South China,which is due to the more dominant influence of anthropogenticactivities (Zhang et al., 2008).
Meanwhile, abrupt changes of water discharge series weredetected in 1986, 1989, 1991 and 1993 (Fig. 4). The occurrence offrequent abrupt change could be likely explained by the construc-tion of Hoa Binh dam from 1979 to 1994. This is comparable withthose of the Changjiang River (Dai et al., 2012; Dai and Liu, 2013).
Furtherly, the daily water discharge during the pre- and post-dam period were grouped respectively to evaluate the influence
Fig. 12. Influence of Hoa Binh Reservoir construction on the Red River continental water discOccurrence probability changes of different discharge intervals during the pre-dam and po
of the Hoa Binh Reservoir (Fig.12). Compared to the pre-dam period(1956e1978), water discharge in the post-dam period (1990e2009)has been regulated, with discharge increasing in JaneMay (mainlyin the dry season) and decreasing in JuneDec (mainly in the wetseason) (Fig. 12a), which is comparable with the results of MIKE11numerical model (Vu et al., 2014). The dam regulation mainlyincreased the occurrence probability of discharge interval of 1e4(103 m3/s) (Fig. 12b). On the other hand, regulation decreased theoccurrence probability of extreme low and extreme high discharge,the influence of dam on the discharge interval of 4e6 (103 m3/s) isunremarkable (Fig. 12b). These changes are coincided with that ofmaximum/minimum and the 10th/90th as mentioned in formersection. Thereafter, it can be concluded that the abnormal hydro-logical behavior of the Red River were caused by dam adjustments.
harge. (a) Comparison of grouped discharge between pre-dam and post-dam period; (b)st-dam period.
J. Gao et al. / Quaternary International 380-381 (2015) 133e142 141
When compared to those rivers with extreme frequently floodand drought in the tropical zone (IPCC, 2007), the Red River con-tinental freshwater discharge exhibited trends of decreasing yearlymaximum discharge, increasing yearly minimum discharge, anddecreasing deviation degree of Cv (Fig. 6). Due to dam operations,most of the larger rivers around the world had been regulated(Nilsson et al., 2005). It is firstly found in this paper that the dailycontinental freshwater discharge had been regulated as ‘no flood inthe flood season, no drought in the drought season’, while theprevious studies only indicated continental freshwater dischargedecrease following dam operations (Milliman and Farnsworth,2011).
With the rapid development of Vietnam, the requirement ofenergy and water may lead to the construction of more large damsin large rivers (Ranzi et al., 2012). For instance, the new TuyenQuang Reservoir in the Lo River started to operation in 2005 (Ranziet al., 2012). As a consequent, the continental freshwater dischargewill suffer intensive change in future. It can be expected that thecontinental freshwater discharge in the Red River to the sea mightbe regulated with more water in the drought period and less waterin the flood period.
5. Conclusions
The continental freshwater discharge from the Red River to thesea had experienced serious challenges from climate change andintensive anthropogenic activities. This paper studied the period-icities, secular trends, and extreme hydrological events of therunoff from Red River into the Tonkin Gulf based on the dailycontinental freshwater discharge. Conclusions can be summarizedas follows:
(1) The continental freshwater discharge series of the Red Riversuggested four major periodicities: 4e6 months for seasonalchange, 8e12 months for approximately annual cycle, 1.5e2years (18e32 months) and 4e7 years (48e80 months) forinter-annual fluctuation cycles.
(2) Although there is clearly decrease in the mean annual SPMduring 1960e2008, the mean annual discharge showsinsignificant trends over the period of 1956e2009. However,discharge in wet season and the maximum monthlydischarge suggested observable downward trend, while theminimummonthly discharge and discharge in dry season areincreasing. Moreover, the extreme events demonstratedifferent tendency characters: extreme high daily dischargeshow decreasing trend, whereas the extreme low dischargeindicate increasing trend. This phenomenon can bedescribed as ‘no flood in the flood season, no drought in thedrought season’.
(3) Continental freshwater discharge from the Red River wasmainly affected by the precipitation, SASM and ENSO. Vari-ations in daily continental freshwater discharge had adelayed response to SASM, with 13e29 days. Moreover, LaNi~na events are likely to cause floods while the El Ni~noevents are likely to lead to drought events.
(4) Dam constructions with water regulation along the Red Riversince 1970s had significant influence to the continentalfreshwater discharge, as well as the SPM flux.
Acknowledgments
This study was supported by the Natural Science Foundation inChina (41376097, 41076034), New Century Excellent Talents inUniversities of China (NCET-12-0182), and Opening Fund of KeyLaboratory of Environment Change and Resources Use in Beibu
Gulf, Ministry of Education (NO. 2014BGERLKF04). We are also verygrateful for two anonymous reviewers for their constructive sug-gestions to improve previous manuscript.
References
Bonsal, B.R., Zhang, X., Vincent, L.A., Hogg, W.D., 2001. Characteristics of daily andextreme temperatures over Canada. Journal of Climate 14 (9), 1959e1976.
Cruz, F.T., Narisma, G.T., Villafuerte, I.I.M.Q., Cheng Chua, K.U., Olaguera, L.M., 2013.A climatological analysis of the southwest monsoon rainfall in the Philippines.Atmospheric Research 122, 609e616.
Dai, A.G., Qian, T.T., Trenberth, K.E., Milliman, J.D., 2009. Changes in continentalfreshwater discharge from 1948 to 2004. Journal of Climate 22, 2773e2792.
Dai, S.B., Lu, X.X., Yang, S.L., Cai, A.M., 2008a. A preliminary estimate of human andnatural contributions to the decline in sediment flux from the Yangtze River tothe East China Sea. Quaternary International 186, 43e54.
Dai, Z.J., Chu, A., Stive, M.J.F., Yao, H.Y., 2012. Impact of the Three Gorges Damoverruled by an extreme climate hazard. Natural Hazards Review 13, 310e316.
Dai, Z.J., Du, J.Z., Li, J.F., Li, W.H., Chen, J.Y., 2008b. Runoff characteristics of theChangjiang River during 2006: effect of extreme drought and the impoundingof the Three Gorges Dam. Geophysical Research Letters 35, L07406.
Dai, Z.J., Du, J.Z., Zhang, X.L., Su, N., Li, J.F., 2011. Variation of riverine martial loadsand environmental consequences on the Changjiang estuary in recent decades.Environmental Science and Technology 45, 223e227.
Dai, Z.J., Liu, J.T., 2013. Impacts of large dams on downstream fluvial sedimentation:an example of the Three Gorges Dam (TGD) on the Changjiang (Yangtze River).Journal of Hydrology 480, 10e18.
Dang, T.H., Coynel, A., Orange, D., Blanc, G., Etcheber, H., Le, L.A., 2010. Long-termmonitoring (1960e2008) of the river-sediment transport in the Red RiverWatershed (Vietnam): temporal variability and dam-reservoir impact. Scienceof the Total Environment 408 (20), 4654e4664.
D�ery, S.J., Wood, E.F., 2005. Decreasing river discharge in northern Canada.Geophysical Research Letters 32 (10), L10401.
Farge, M., 1992. Wavelet transforms and their applications to turbulence. AnnualReview of Fluid Mechanics 24, 395e457.
Gerstengarbe, F.W., Werner, P.C., 1999. Estimation of the beginning and end ofrecurrent events within a climate regime. Climate Research 11, 97e107.
Greenwood, J.A., Landwehr, J.M., Matalas, N.C., Wallis, J.R., 1979. Probabilityweighted mements: definition and relation to parameters of distributionexpressible in inverse form. Water Resources Research 15 (5), 1049e1054.
Groisman, P.Ya., Knight, R.W., Karl, T.R., 2001. Heavy precipitation and highstreamflow in the contiguous United States: trends in the twentieth century.Bulletin of American Meteor Society 82, 219e246.
Intergovernmental Panel on Climate Change (IPCC), 2007. In: Solomon, S., et al.(Eds.), Climate Change 2007: the Physical Science BasisdContribution ofWorking Group I to the Fourth Assessment Report of the IntergovernmentalPanel on Climate Change. Cambridge Univ. Press, Cambridge, U. K, pp. 663e745.
Isupova, M.V., Mikhailov, V.N., 2011. Hydrological processes in the mouth area of theHong Ha (Red River). Water Resources 38 (5), 557e570.
Kane, R.P., 1999. Rainfall extremes in some selected parts of Central and SouthAmerica: ENSO and other relationships reexamined. International Journal ofClimatology 19 (4), 423e455.
Kendall, M.G., 1975. Rank Correlation Methods, fourth ed. Charles Griffin, London.Kiem, A.S., Franks, S.W., 2001. On the identification of ENSO-induced rainfall and
discharge variability: a comparison of methods and indices. Hydrological Sci-ences Journal 46 (5), 715e727.
Labat, D., Godd�eris, Y., Probst, J.L., Guyot, J.L., 2004. Evidence for global runoff in-crease related to climate warming. Advance of Water Resources 27, 631e642.
Le, T.P.Q., Garnier, J., Gilles, B., Sylvain, T., Minh, C.V., 2007. The changing flow regimeand sediment load of the Red River, Viet Nam. Journal of Hydrology 334 (1),199e214.
Li, J., Zeng, Q., 2002. A unified monsoon index. Geophysical Research Letters 29 (8),115-1e115-4.
Li, J., Zeng, Q., 2003. A new monsoon index and the geographical distribution of theglobal monsoons. Advance of Atmospheric Science 20, 299e302.
Li, J., Zeng, Q., 2005. A new monsoon index, its interannual variability and relationwith monsoon precipitation. Climatic and Environmental Research 10 (3),351e365.
Li, Z., Saito, Y., Matsumoto, E., Wang, Y.J., Tanabe, S., Vu, Q.L., 2006. Climate changeand human impact on the Song Hong (Red River) Delta, Vietnam, during theHolocene. Quaternary International 144 (1), 4e28.
Lu, X.X., Siew, R.Y., 2006. Water discharge and sediment flux changes over the pastdecades in the lower Mekong River: possible impacts of the Chinese dams.Hydrology & Earth System Sciences 10 (2), 181e195.
Luu, T.N.M., Garnier, J., Billen, G., Orange, D., N�emery, J., Le, T.P.Q., Tran, H.T., Le, L.A.,2010. Hydrological regime and water budget of the Red River Delta (NorthernVietnam). Journal of Asian Earth Sciences 37, 219e228.
Mann, H.B., 1945. Nonparametric tests against trend. Econometrica 13, 245e259.Miao, C., Ni, J., Borthwick, A.G.L., 2010. Recent changes of water discharge and
sediment load in the Yellow River basin, China. Progress in Physical Geography34 (4), 541e561.
Milliman, J.D., Farnsworth, K.L., 2011. River discharge to the coastal ocean: a globalsynthesis. Oceanography 24 (4), 143e144.
J. Gao et al. / Quaternary International 380-381 (2015) 133e142142
Milliman, J.D., Farnsworth, K.L., Jones, P.D., Xu, K.H., Smith, L.C., 2008. Climatic andanthropogenic factors affecting river discharge to the global ocean, 1951-2000.Global Planet and Change 62, 187e194.
Misir, V., Arya, D.S., Murumkar, A.R., 2013. Impact of ENSO on river flows in Guyana.Water Resource Management 27, 4611e4621.
Nguyen, K.C., Katzfey, J.J., McGregor, J.L., 2014. Downscaling over Vietnam using thestretched-grid CCAM: verification of the mean and interannual variability ofrainfall. Climate Dynamics 43, 861e879.
Nilsson, C., Reidy, C.A., Dynesius, M., Revenga, C., 2005. Fragmentation and flowregulation of the world's large river systems. Science 308, 405e408.
Pruszak, Z., Ninh, P.V., Szmytkiewicz, M., Hung, N.M., Ostrowsk, R., 2005. Hydrologyand morphology of two river mouth regions (temperate Vistula delta andsubtropical Red River Delta). Oceanologia 47 (3), 365e385.
Ranzi, R., Le, T.H., Rulli, M.C., 2012. A RUSLE approach to model suspended sedimentload in the Lo river (Vietnam): effects of reservoirs and land use changes.Journal of Hydrology 422, 17e29.
Restrepo, J.C., Ortíz, J.C., Pierini, J., Schrottke, K., Mazaa, M., Oteroa, L., Aguirree, J.,2014. Freshwater discharge into the Caribbean Sea from the rivers of North-western South America (Colombia): magnitude, variability and recent changes.Journal of Hydrology 509, 266e281.
Sang, Y.F., Wang, D., Wu, J.C., Zhu, Q.P., Wang, L., 2013. Improved continuous waveletanalysis of variation in the dominant period of hydrological time series. Hy-drological Sciences Journal 58 (1), 118e132.
Simonovic, S.P., Carson, R.W., 2003. Flooding in the Red River Basin-lessons frompost flood activities. Natural Hazards 28, 345e365.
Tinh, D.Q., 2001. Participatory Planning and Management for Flood Mitigation andPreparedness and Trends in the Red River Basin, Vietnam. Available at the web-site: http://www.unescap.org/esd/water/disaster/2001/vietnam.doc. June 2005.
Torrence, C., Compo, G.P., 1998. A practical guide to wavelet analysis. Bulletin of theAmerican Meteorological Society 79 (1), 61e78.
Unwin, A., Unwin, D., 1998. Exploratory spatial data analysis with local statistics.Journal of the Royal Statistical Society: Series D. The Statistician 47 (3), 415e421.
Van Maren, D.S., 2007. Water and sediment dynamics in the Red River mouth andadjacent coastal zone. Journal of Asian Earth Sciences 29 (4), 508e522.
V€or€osmarty, C.J., Fekete, B.M., Meybeck, M., Lammers, R.B., 2000. Global system ofrivers: its role in organizing continental land mass and defining land-to-oceanlinkage. Global Biogeochemical Cycles 14, 599e621.
Vu, D.V., Ouillon, S., Tran, D.T., La, V.C., 2014. Impact of the Hoa Binh Dam (Vietnam)on water and sediment budgets in the Red River basin and delta. Hydrology andEarth System Sciences 11, 333e370.
Wang, H.J., Yan, Z.S., Saito, Y., Liu, J.P., Sun, X.X., 2006. Interannual and seasonalvariation of the Huanghe (Yellow River) water discharge over the past 50 years:connections to impacts from ENSO events and dams. Global and PlanetaryChange 50, 212e225.
Wei, W., Chang, Y.P., Dai, Z.J., 2014. Streamflow changes of the Changjiang (Yangtze)River in the recent 60 years: impacts of the East Asian summer monsoon, ENSO,and human activities. Quaternary International 336, 98e107.
Xue, Z., Liu, J.P., Ge, Q., 2011. Changes in hydrology and sediment delivery of theMekong River in the last 50 years: connection to damming, monsoon, andENSO. Earth Surface Processes and Landforms 36, 296e308.
Yang, S.L., Liu, Z., Dai, S.B., Gao, Z.X., Zhang, J., Wang, H.J., Luo, X.X., Wu, C.S.,Zhang, Z., 2010. Temporal variations in water resources in the Yangtze River(Changjiang) over the Industrial Period based on reconstruction of missingmonthly discharges. Water Resources Research 46, W10516.
Zhang, Q., Li, J.F., Singh, V.P., Xu, C.Y., Deng, J.Y., 2013a. Influence of ENSO on pre-cipitation in the East River basin, south China. Journal of Geophysical Research:Atmospheres 118, 2207e2219.
Zhang, S.R., Lu, X.X., Higgitt, D.L., Chen, C.A., Han, J.T., Sun, H.G., 2008. Recentchanges of water discharge and sediment load in the Zhujiang (Pearl River)Basin, China. Global and Planetary Change 60, 365e380.
Zhang, Z.C., Chen, X., Chen, X.H., Shi, P., 2013b. Quantifying time lag of epikarst-spring hydrograph response to rainfall using correlation and spectral ana-lyses. Hydrogeology Journal 21, 1619e1631.