Embed Size (px)
Citation preview

Wirtek A/S Niels Jernes Vej 10 DK- 9220 Aalborg Denmark
Phone: +45 7214 6660 E-mail: [email protected] Web: www.wirtek.com
CVR / VAT: DK26042232
INTERIM FINANCIAL REPORT
Q3 2020 1 January – 30 September 2020
18 November 2020

2
Continued growth - revenue up 18% during Q3 2020
første
“We are currently experiencing a strong momentum. We have recently received a new project order from one of our American clients. This order affects both the top and bottom line positively this year. In addition, we see a reduced risk of negative impact from COVID-19 to our business during the remaining part of 2020. As a result, we expect a continuing strong level of activity as well as close to optimal utilization of the capacity in our development and testing centres in Romania.
After raising our 2020 expectations in September for the second time during Q3, we can reconfirm our expectations with revenue growth of 16% - 21% and a growth in pre-tax profit (EBT) of 79% - 101% this year.
After a strong performance during Q3, we are well-positioned to continue growing profitably during these uncertain times.”
Michael Aaen, CEO
Wirtek in brief Wirtek is a Danish IT outsourcing company. Since 2001, we have been teaming up with companies to help them create great software solutions and electronic equipment products.
Several clients have been with us for 10+ years, so we can confidently say that in outsourcing, the quality of the relationship matters just as much as the quality of the delivered software. Our clients get state-of-the-art technical solutions and a committed team that works with them as if it were their own.
Wirtek has offices in Denmark (HQ + sales) and three development and test centres in Romania, and we are 100+ colleagues. Wirtek was listed at Nasdaq First North Growth Market Denmark in 2006.
Ticker code: WIRTEK (DK0060040913)

3
Q3 2020 Highlights The Board of Directors for Wirtek A/S has approved the interim financial statements for third quarter of 2020 for the Wirtek Group today.
Financial highlights for the period January 1 – September 30, 2020
TDKK Q3 2020 Q3 2019 Change Q1-Q3 2020 Q1-Q3 2019 Change
Revenue 6.921 5.889 18% 20.577 16.666 23% EBITDA 787 124 535% 2.441 832 193% EBITDA-margin (%) 11,4% 2,1% 440% 11,9% 5,0% 138% Pre-tax profits 764 56 1264% 2.316 693 234% Cash holdings 4.117 1.296 218% 4.117 1.296 218%
Strong performance continues during Q3 2020
Despite the global COVID-19 pandemic, which has negatively impacted some of our clients, we can present solid growth in both revenue and profits during Q3. The level of activity for our clients is back on track after the postponement of a couple of client projects during Q2.
• Revenue grew by 18% to TDKK 6.921 during Q3 2020 compared to Q3 2019 and was up 23% to TDKK 20.577 for the period Q1 – Q3 2020 compared to Q1 – Q3 2019.
• EBITDA was TDKK 787 in Q3 2020 compared to TDKK 124 for the same period last year. During Q1 – Q3 2020 EBITDA grew by 193% to TDKK 2.441 compared to Q1 – Q3 2019.
• An EBITDA-margin of 11,9% for Q1 – Q3 2020, compared to only 5,0% during same period 2019, attests to our strong performance this far during 2020.
• Pre-tax profit (EBT) grew to TDKK 764 in Q3 2020 compared to TDKK 56 during Q3 2019 and was up by 234% to TDKK 2.316 during Q1 – Q3 2020 compared to same period last year.
• Cash holdings are very solid, at TDKK 4.117 end of Q3 2020, up 218% from Q3 2019.
Outlook 2020 - expectations raised in September (see announcement no. 123 dated 14-Sep-20)
• Revenue expectations for 2020 narrowed to MDKK 27–28, a growth of 16%–21% compared to 2019.
• Pre-tax profit expectations for 2020 raised to MDKK 2,4–2,7 (up from previously raised expectations of MDKK 1,9–2,2), a growth of 79%–101% compared to 2019.
• Main reasons for raised expectations:
- COVID-19 did not impact Wirtek negatively during Q3 and is not expected to do so during the remaining part of 2020.
- A new order from one of our US clients during September has positive impact on both revenue and profit in 2020.
- Close-to-optimal capacity utilisation in our Romanian subsidiary.
Further Information
• Michael Aaen, CEO, Wirtek A/S, Phone: +45 2529 7575, E-mail: [email protected]
• Kent Mousten Sørensen, Chairman, Wirtek A/S, Phone: +45 2125 9001
• Per Vestergaard, Certified Advisor, CDI Global, Phone: +45 2176 4317
4
Continued growth despite COVID-19
Our Q3 results mark another quarter with solid growth. Revenue in Q3 was up 18% compared to Q3 2019 and up by 23% during Q1 – Q3. Pre-tax profit growth was 234% for Q1 – Q3.
COVID-19 has not had a significant negative affect on our business until now. We continue servicing our clients at the distance, with most of our colleagues working from home.
Many of our clients see us as a strategic partner, and we provide services that are critical to our clients’ business success. Although some of our clients do feel a negative impact from COVID-19, they are hesitant to cut back on services delivered by Wirtek in order not to hurt their own product development.
2020 expectations raised twice during Q3
On August 5, 2020 Wirtek raised expectations for pre-tax profit from MDKK 1,55–1,75 to 1,9–2,2. The revenue expectations were kept unchanged at MDKK 26–28. See company announcement no. 119.
The start-up of two client projects that were suspended at the beginning of Q2, as well as continuing high demand for our services from all our clients, are contributing to the raised expectations. In addition, a focus on operational efficiency is a significant profitability driver.
On September 14, 2020 Wirtek raised expecta-tions a second time this year. Revenue expectations were narrowed to MDKK 27–28 (+16%–21%) and pre-tax profit expectations were increased to MDKK 2,4–2,7 (+79%–101%). See company announcement no. 123.
Main reasons for raising expectations a second time were a new order from one of our US clients as well as a near-optimal utilisation of the capacity in our Romanian development and testing centres.
Double-digit revenue growth in Q3 2020
Wirtek posted Q3 revenue of TDKK 6.921, a growth of 18% compared to Q3 2019.
1 https://www.grandviewresearch.com/industry-analysis/it-services-outsourcing-market
For Q1 – Q3 revenue grew by 23% to TDKK 20.577.
A combination of new client orders and a continuing high demand for our services is driving the revenue growth.
Wirtek acts in a growing outsourcing market for IT services
We are competing in a fast-growing IT services outsourcing market driven by trends like digitalization, automation, cloud computing and IoT (Internet of Things).
The global IT services outsourcing market is predicted to grow 7,7% (CAGR) annually and reach a value of USD 938 billion by 20271.
The IT services outsourcing market in Denmark is expected to have a value of USD 2,6 billion in 20212 (less than 0,5% of the total global market value).
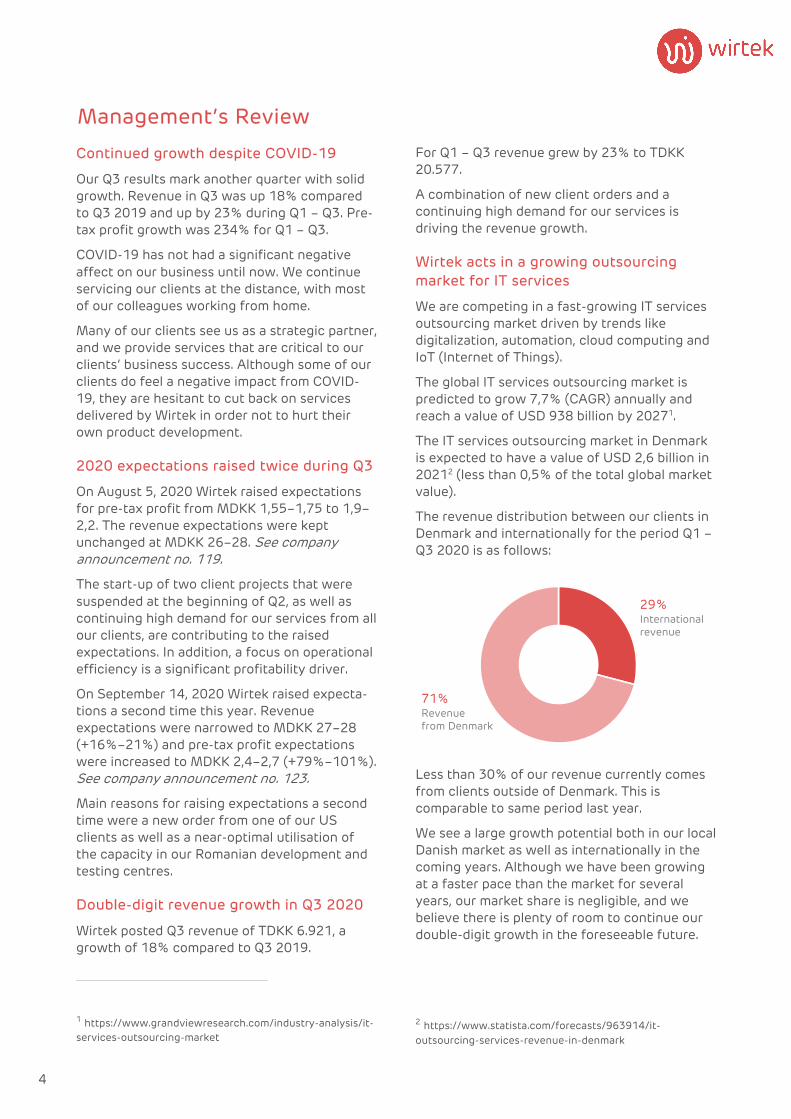
The revenue distribution between our clients in Denmark and internationally for the period Q1 – Q3 2020 is as follows:
Less than 30% of our revenue currently comes from clients outside of Denmark. This is comparable to same period last year.
We see a large growth potential both in our local Danish market as well as internationally in the coming years. Although we have been growing at a faster pace than the market for several years, our market share is negligible, and we believe there is plenty of room to continue our double-digit growth in the foreseeable future.
2 https://www.statista.com/forecasts/963914/it-outsourcing-services-revenue-in-denmark
29% International revenue
71% Revenuefrom Denmark
Revenue distribution for H1 2020
Management’s Review

5
Our Core services explained
Wirtek teams up with our clients and help them create great software solutions and electronic equipment products.
We deliver our services through two business units:
Software Engineering Services
Engineering end-to-end software solutions to match the needs of our clients.
Guided by agile principles, we provide services such as product engineering, system architecture & design, software assurance and product re-engineering.
Electronic Equipment Services
Providing a complete set of services on our client’s existing electronic equipment.
Services include embedded and integration software development as well as quality assurance and conformance testing of the final product.
The distribution of revenue between the two business units during Q1 – Q3 2020 is as follows:
Customer loyalty a key success factor
We establish valuable client partnerships as we believe the quality of the relationship matters just as much as the quality of the delivered software.
Our clients trust us, and their loyalty is very high. Almost 50% of our customers are with Wirtek more than 5 years, even though we grow on average 20% per year and constantly add new clients.
More than 85% of our new clients during the past 5 years are still with us today. And the average annual revenue from our clients has increased by more than 100% since 2016.
Effective and efficient service delivery organisation
A key to our client success is our ability to deliver consistent, high quality services that meet or exceed their expectations.
We can seamlessly adapt to our clients’ way of working. We act as a partner, not just a vendor with nameless resources.
Our collaboration model is very flexible and allows us to build dedicated teams for our clients with the needed technical expertise that complements our clients’ own development organisations.
Wirtek’s EU-based development- and test centres in Romania ensure cultural affinity, easy GDPR compliance and reduced macro-economic risk.
Our focus on operational efficiency allows us to increase our service delivery capacity without increasing overhead at the same rate, as exemplified in the diagram below:
Wirtek went from 94 colleagues end of 2019 to 101 colleagues end of Q3 2020, adding 7 new colleagues. During the same period, the percentage of non-billable colleagues (overhead) was reduced from 17% to 15%, significantly improving operational efficiency.
We can increase our service delivery without increasing operational overhead at the same rate. This enables us to improve our profitability as we grow.
Business unit revenue distribution – H1 2020
74%Software Engineering Services
26% Electronic Equipment Services
90
95
100
105
2019 2020
17% non-billable
94 colleagues
101 colleagues
15% non-billable
85% billable
83% billable
Operational efficiency
6
Significant EBITDA growth
EBITDA for Q3 2020 was TDKK 787, a growth of 535% compared Q3 2019.
The EBITDA-margin during Q3 was 11,4%, up from 2,1% during Q3 2019.
EBITDA for Q1 – Q3 2020 was TDKK 2.441, an increase of 193% compared to same period 2019.
Operational efficiency and a near optimal utilisation of the capacity in our Romanian subsidiary are the main reasons for this very significant improvement in EBITDA.
Pre-tax profitability sharply up
Wirtek achieved pre-tax profits (EBT) of TDKK 764 during Q3 2020 compared to TDKK 56 during Q3 2019.
For the period Q1 – Q3 2020, EBT was TDKK 2.316, up 234% compared to same period in 2019.
Wirtek only had depreciation of TDKK 28 during Q3. Most purchases of IT equipment and fixtures is expensed immediately, leading to a very low level of depreciation.
Financial costs/income during Q3 was positive by TDKK 5. Although we pay negative interest on our significant cash holdings in Denmark, we also have a positive return on our cash holdings in our Romanian subsidiary. We have no interest-carrying debt in Wirtek.
Low levels of depreciation and financial costs/income leads to a very small difference of only TDKK 23 between our EBITDA and our EBT.
Strong cash position
End of Q3 2020 we had a cash position of TDKK 4.117, up 218% from last year.
Since end of 2019 we have had a positive cash flow of TDKK 1.759, despite a dividend payment of TDKK 1.104 during April 2020. Until now this year, operating activities have contributed with TDKK 3.038.
Robust capital structure
End of Q3 this year, the equity in Wirtek is TDKK 4.821, up 68% compared to same time last year.
The equity ratio is 51% compared to 43% last year.
Additional remarks to the financial reporting for Q3 2020
The Wirtek Group consists of Wirtek A/S and the fully owned Romanian subsidiary Wirtek SRL.
Since the end of Q3 2020, Wirtek has not engaged in any activities that significantly changes the financial position of the company.
The Q3 financial report has not been audited or reviewed by our auditor.
Financial Calendar
Annual Report 2020: March 4, 2021
Q1 2021: May 11, 2021
Q2 2021: August 10, 2021
Q3 2021: November 10, 2021
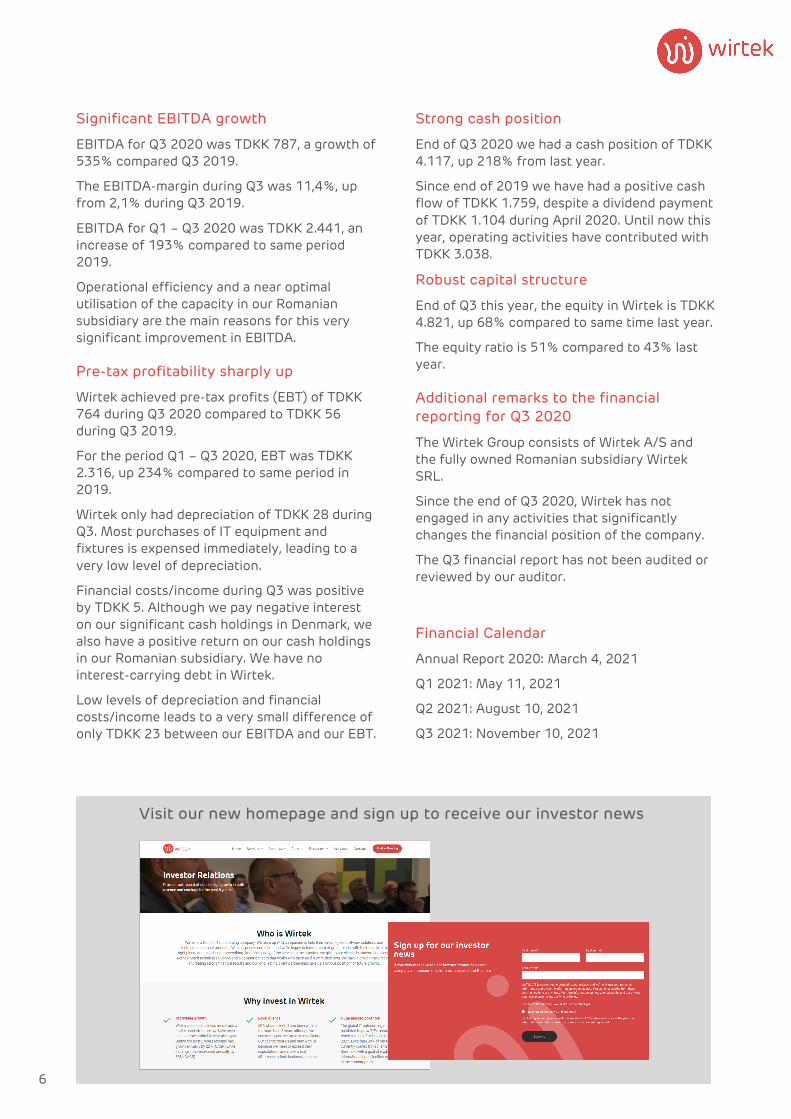
Visit our new homepage and sign up to receive our investor news

7
Profit & loss statement for the period January 1 – September 30, 2020
TDKK Q3 2020 Q3 2019 Q1-Q3 2020 Q1-Q3 2019
Revenue 6.921 5.889 20.577 16.666
Oher external costs 1.103 925 3.026 2.512 Gross profit 5.818 4.964 17.551 14.154
Personnel costs 5.031 4.840 15.110 13.322 EBITDA 787 124 2.441 832
Depreciation 28 23 74 57 Operating profit (EBIT) 759 101 2.367 775
Financial costs (5) 45 51 82 Pre-tax Profit (EBT) 764 56 2.316 693
Taxes 40 (48) 111 41 Net profit 724 104 2.205 652
Cash flow statement for the period January 1 – September 30, 2020
TDKK Q3 2020 Q3 2019 Q1-Q3 2020 Q1-Q3 2019
EBITDA 787 124 2.441 831 Financial costs 5 (45) (51) (82) Exchange rate adjustments etc. 15 (2) 20 (33) Change in trade receivables (87) (24) (83) (263) Change in work in progress - - 78 - Change in other receivables 715 (173) 500 (142) Change in short term debt (1.805) 272 132 (51) Cash flow from operating activities (370) 153 3.038 260
Purchase of fixed assets (17) 11 (214) (260) Other investments - - 150 - Cash flow from investing activities (17) 11 (64) (260) Sale of own shares - - - - Payment of tax (40) 48 (111) (12) Dividend paid - - (1.104) (759) Cash flow from financing activities (40) 48 (1.215) (771) Total cash flow (427) 212 1.759 (771) Cash holdings, beginning of period 4.544 1.084 2.358 2.067 Cash holdings, end of period 4.117 1.296 4.117 1.296

8
Balance sheet as of September 30, 2020
TDKK 30.09.2020 30.09.2019 31.12.2019
ASSETS Intangible assets Goodwill 341 452 200 Software 3 1 1
Property, plants and equipment Fixtures and fittings, tools and equipment 171 329 178
Investments Securities and deposits 127 131 130 Total fixed assets 642 913 509
Receivables Trade receivables 3.365 3.244 3.282 Work in progress - - 78 Other receivables 430 588 881 Advances for inventories 124 136 173 Deferred tax 800 500 800
Cash holdings 4.117 1.295 2.358 Total current assets 8.836 5.763 7.572 TOTAL ASSETS 9.478 6.676 8.081
LIABILITIES Share capital 1.035 1.035 1.035 Currency exchange provision 14 (1.139) - Retained earnings 3.772 2.970 2.671 Total equity 4.821 2.866 3.706
Long term liabilities Payables, Group - - - Other long-term payables - - -
Short term liabilities Trade payables 1.112 914 765 Other payables 3.545 2.896 3.610 Total liabilities other than provisions 4.657 3.810 4.375 TOTAL LIABILITIES 9.478 6.676 8.081

9
Equity explanation for the period January 1 – September 30, 2020
TDKK 30.09.2020 30.09.2019
Equity, beginning of year 3.706 2.979 Dividend distribution (1.104) (759) Exchange rate adjustments 14 (6) Sale of own shares - - Profit/Loss for Q1 - Q3 2.205 652
EQUITY - SEPTEMBER 30 4.821 2.866
Key figures and ratios for the period January 1 – September 30, 2020
Q1 - Q3 2020 Q1 - Q3 2019
EBITDA-margin 11,9% 5,0% Operating profit margin (EBIT) 11,5% 4,7% Liquidity ratio 190% 151% Equity ratio 51% 43% Return on equity (ROE) 46% 23% Number of shares 6.902.412 6.902.412 Earnings per share (EPS) 0,32 DKK 0,09 DKK Cash flow per share 0,25 DKK -0,14 DKK Share price, end of period 8,70 DKK 7,90 DKK
The key figures and financial ratios above have been calculated in accordance with Danish Finance Society’s “Recommendation & Financial Ratios”.
Management and Board shareholdings in Wirtek A/S as of November 18, 2020
• Michael Aaen, CEO: 2.705.164 shares
• Kent M. Sørensen, Chairman: 982.398 shares
• Jens Uggerhøj, Board member: 412.739 shares
Certified Advisor and associates’ shareholdings in Wirtek A/S as of November 18, 2020
• Per Vestergaard, CDI Global ApS, 1.650 shares
Auditor
BDO Statsautoriseret revisionsaktieselskab, Visionsvej 51, 9200 Aalborg, Denmark
Disclaimer
Forward-looking statements, especially such relating to future sales and operating profit, are subject to risks and uncertainties. Various factors, many of which are outside Wirtek’s control, may cause the actual development of the company to differ materially from the expectations contained in this financial report.