Embed Size (px)
Citation preview
1 Jan - 30 Sep 2019(Company announcement no. 11) WE DISCOVER POTENTIAL
INTERIMREPORT Q3 2019
FLSmidth & Co. A/SVigerslev Allé 77DK-2500 ValbyCVR No. 58180912
ROCE
Up from 10.7%
11.2%
EBITA margin
Down from 8.1%
8.0%
CFFO (DKKm)
Down from DKK 357
244
Order intake (DKKm)
Down from DKK 7,164
4,571

2 Interim report Q3 2019
MANAGEMENT REVIEW
Quarterly highlights 3
Financial key figures 5
Quarterly financial performance 6
Segment performance 13
Sustainability 17
Quarterly key figures 18
CONSOLIDATED CONDENSED INTERIM FINANCIAL STATEMENTS
Comments to growth & profit 21
Income statement 23
Statement of comprehensive income 23
Comments to cash flow 24
Cash flow statement 25
Comments to financial position 26
Balance sheet 27
Comments to equity & value 28
Equity statement 29
Statement by Management 42
NOTES
1. Key accounting estimates and judgements 31
2. Income statement by function 31
3. Segment information 32
4. Revenue 34
5. Provisions 34
6. Contingent liabilities 35
7. Business acquisitions 35
8. Discontinued activities 36
9. Net working capital 37
10. Work in progress 38
11. Earnings per share (EPS) 38
12. Fair value measurement 39
13. Events after the balance sheet date 39
14. Accounting policies 40
CONTENTS
HOW TO NAVIGATE THE REPORT
Management review
Financial statements

FINANCIAL HIGHLIGHTS
3 Interim report Q3 2019
MANAGEMENT REVIEW FINANCIAL STATEMENTS
Financial highlights
QUARTERLY HIGHLIGHTS
Order intake (DKKm)
Revenue (DKKm)
EBITA margin
Net working capital ratio
ROCE
4,571
Down from 7,164
4,736
Up from 4,335
8.0%
Down from 8.1%
13.1%
Up from 9.9%
11.2%
Up from 10.7%
Safety (TRIFR)¹⁾
Quality (DIFOT)²⁾
1.7
Down from 3.0
87%
Unchanged
1) TRIFR = Total recordable injury frequency rate
2) DIFOT = Delivery in full on time
Safety and Quality are measured YTD against full year 2018
All other development highlights are year-on-year figures
Mining 60% Cement 40%
Revenue split by Mining and Cement
EBITA margin 5.8%EBITA margin 9.2%Capital 43%
Service57%
Revenue split by Service and
Capital business

FINANCIAL HIGHLIGHTS
4 Interim report Q3 2019
MANAGEMENT REVIEW FINANCIAL STATEMENTS
Q3 Highlights Record high Service order intake, attributable to both Mining and Cement. Group order intake nevertheless declined 36% compared to a strong Q3 2018 which included two large cement plant orders. The service business showed good momentum, but an overall weaker business environment has caused some customers to postpone decisions on larger capital investments. In addition, a few mine projects, that were anticipated to get a green light this year, have been deferred due to challenges regarding license to operate. Revenue developed according to the expected phasing for the year and increased 9%, driven by Mining. EBITA increased 8% because of lower SG&A costs, but the EBITA margin declined to an unsatisfactory 8.0%, due to weaker profitability in Mining. Cement profitability improved as expected. Despite a modest net working capital increase compared to Q2 2019, Q3 saw a positive free cash flow and reduction in net debt.
Management focus
We have seen an unfavourable development in business mix over the year, and post-ponement of capital orders have disrupted workflow and caused under absorption. In addition, some mining projects have delivered lower profit than anticipated. We have reassessed the profitability on the project portfolio and concluded that we, going forward, will factor in a lower level of profit for Mining projects. We will also strengthen the mining project organisation by consolidating project execution in fewer centres. In the context of recent market developments and financial performance, we will accelerate ongoing business improvement initiatives. The expected financial impact is an annual EBITA improvement of DKK 100m with a full run-rate from end of 2020 and implementation costs around DKK 150m. See page 8 for further information. While executing on the above, focus in the remainder of 2019 will be on backlog conversion, solid execution and reduction of net working capital.
GUIDANCE On 11 October, FLSmidth adjusted its full-year guidance (Company announcement no. 10-2019). The revised EBITA margin guidance from the initial mid-point of 9.5% to around 8% was based on the following estimated EBITA effects*: ■ Service/capital mix (H1): ~DKK 100m ■ Mining project cost overruns (Q3): ~DKK 70m ■ Market related postponement of Mining capital orders
and resulting under absorption (H2): ~DKK 25m ■ Reassessment of profitability and mix (Q4): ~DKK 30m ■ Business improvement costs (Q4): ~DKK 75m
*) Assuming DKK 20bn revenue equal to the mid-point of
the initial revenue guidance
QUARTERLY HIGHLIGHTS
GUIDANCE FOR 2019 (REVISED ON 11 OCT)
DKK
Realised
9M 2019
Guidance
2019
Initial
guidance
Realised
2018
Revenue (bn) 14.6 20-21 19-21 18.8
EBITA margin 8.0% ~8% 9-10%* 8.5%
ROCE 11.2% 10-12% 12-14% 11.0%
*) Specified to be at the lower end at the half-year results

FINANCIAL HIGHLIGHTS
5 Interim report Q3 2019
MANAGEMENT REVIEW FINANCIAL STATEMENTS
DKKm Q3 2019 Q3 2018 9M 2019 9M 2018 Year
2018
INCOME STATEMENT
Revenue 4,736 4,335 14,624 13,300 18,750
Gross profit 1,126 1,126 3,522 3,381 4,693
EBITDA before special non-recurring items 459 408 1,428 1,244 1,826
EBITA 377 350 1,176 1,074 1,585
EBIT 294 254 893 801 1,220
Financial items, net (12) (17) (47) (68) (161)
EBT 284 237 848 733 1,059
Profit for the period, continuing activities 190 171 569 506 811
Loss for the period, discontinued activities 0 (9) (20) (40) (176)
Profit for the period 190 162 549 466 635
ORDERS
Order intake (gross), continuing activities 4,571 7,164 15,165 17,238 21,741
Order backlog, continuing activities 16,088 17,228 16,218
EARNING RATIOS
Gross margin 23.8% 26.0% 24.1% 25.4% 25.0%
EBITDA margin before special non-recurring items
9.7% 9.4% 9.8% 9.4% 9.7%
EBITA margin 8.0% 8.1% 8.0% 8.1% 8.5%
EBIT margin 6.2% 5.9% 6.1% 6.0% 6.5%
EBT margin 6.0% 5.5% 5.8% 5.5% 5.6%
CASH FLOW
Cash flow from operating activities (CFFO) 244 357 621 288 385
Acquisitions of property, plant and equipment (64) (52) (124) (244) (288)
Cash flow from investing activities (CFFI) (111) (109) (569) (234) (285)
Free cash flow 133 248 52 54 100
Free cash flow adjusted for acquisitions and disposals of enterprises and activities
139 213 357 (61) (15)
DKKm Q3 2019 Q3 2018 9M 2019 9M 2018 Year
2018
BALANCE SHEET
Net working capital 2,624 1,809 2,200
Net interest-bearing debt (NIBD) 2,693 1,942 1,922
Total assets 23,148 21,652 21,743
Equity 8,704 8,048 8,266
Dividend to shareholders, paid 450 397 397
FINANCIAL RATIOS
CFFO / Revenue 5.2% 8.2% 4.2% 2.2% 2.1%
Book-to-bill 96.5% 165.3% 103.7% 129.6% 116.0%
Order backlog / Revenue 80.1% 94.4% 86.5%
Return on equity 8.6% 7.7% 7.8%
Equity ratio 37.6% 37.2% 38.0%
ROCE, average 11.2% 10.7% 11.0%
Net working capital ratio, end 13.1% 9.9% 11.7%
NIBD / EBITDA 1.3 1.1 1.1
Capital employed, average 15,014 14,387 14,338
Number of employees 11,859 11,491 11,368
SHARE RATIOS
Cash flow per share (CFPS), (diluted) 4.9 7.1 12.4 5.8 7.7
Earnings per share (EPS), (diluted) 3.8 3.2 11.0 9.3 12.8
Share price 298.2 399.7 293.1
Number of shares (1,000), end 51,250 51,250 51,250
Market capitalisation, end 15,283 20,485 15,021
The financial ratios have been computed in accordance with the guidelines of the Danish Finance Society and financial definitions
according to note 7.8 in the Annual Report 2018.
IFRS 16, Leases, was adopted 1 January 2019. No figures prior to 1 January 2019, throughout the report, have been restated. Refer
to note 14 for IFRS 16 implementation effects.
FINANCIAL KEY FIGURES

QUARTERLY FINANCIAL PERFORMANCE
6 Interim report Q3 2019
MANAGEMENT REVIEW FINANCIAL STATEMENTS
GROWTH Order intake declined 36% compared to a very strong Q3
2018 which included two large Cement orders. Service
order intake was a record high. Revenue increased 9%,
attributable to Mining.
Order intake
Order intake decreased 36% to DKK 4,571m (Q3 2018:
DKK 7,164m). Mining order intake declined 3%, due to
lower capital order intake and despite a contract of
approximately DKK 200m for a copper mine in Serbia.
The decline in mining capital order intake was largely
offset by a 19% increase in service order intake.
Cement order intake declined 63% due to the absence of
large project orders. The comparative quarter contained
two large cement plant orders with a combined value of
approximately DKK 1.9bn. Cement service order intake
increased 4% compared to Q3 2018.
Growth in order intake Q3 2019
(vs. Q3 2018) Mining Cement Group
Organic -5% -64% -38%
Acquisition 1% 0% 1%
Currency 1% 1% 1%
Total growth -3% -63% -36%
Acquisitions and currency effects each had a 1% positive
impact on order intake in Q3.
Quarterly financial performance
QUARTERLY FINANCIAL PERFORMANCE
ORDER INTAKE
0
1,000
2,000
3,000
4,000
5,000
6,000
7,000
8,000
Q32017
Q4 Q12018
Q2 Q3 Q4 Q12019
Q2 Q3
DKKm
Mining Cement
GROUP (Continuing activities) (DKKm) Q3 2019 Q3 2018 Change (%) 9M 2019 9M 2018 Change (%)
Order intake (gross) 4,571 7,164 -36% 15,165 17,238 -12%
- Hereof service order intake 2,928 2,569 14% 8,360 8,227 2%
- Hereof capital order intake 1,643 4,595 -64% 6,805 9,011 -24%
Order backlog 16,088 17,228 -7% 16,088 17,228 -7%
Revenue 4,736 4,335 9% 14,624 13,300 10%
- Hereof service revenue 2,703 2,489 9% 7,911 7,595 4%
- Hereof capital revenue 2,033 1,846 10% 6,713 5,705 18%
Gross profit 1,126 1,126 0% 3,522 3,381 4%
Gross profit margin 23.8% 26.0% 24.1% 25.4%
SG&A cost (667) (718) -7% (2,094) (2,137) -2%
SG&A ratio 14.1% 16.6% 14.3% 16.1%
EBITDA before special non-recurring items 459 408 13% 1,428 1,244 15%
EBITDA margin before special non-recurring items 9.7% 9.4% 9.8% 9.4%
EBITA 377 350 8% 1,176 1,074 9%
EBITA margin 8.0% 8.1% 8.0% 8.1%
EBIT 294 254 16% 893 801 11%
EBIT margin 6.2% 5.9% 6.1% 6.0%
Number of employees 11,856 11,377 4% 11,856 11,377 4%

QUARTERLY FINANCIAL PERFORMANCE
7 Interim report Q3 2019
MANAGEMENT REVIEW FINANCIAL STATEMENTS
Order backlog
Order backlog for the Group decreased to DKK 16,088m
(end of Q2 2019: DKK 16,762m). The decrease of DKK
0.7bn was explained by lower order intake than the level
of revenue recognised of DKK -0.2bn and order
terminations of DKK -0.5bn. The latter related to an Asian
fertilizer project and a steel project in North America. The
terminations will not affect the expected revenue and
profit for 2019 and next year.
Revenue
Revenue increased 9% to DKK 4,736m in Q3 2019 (Q3
2018: DKK 4,335m), explained by a 26% growth in Mining,
partly offset by a 7% decline in Cement. Organic growth
for the Group was 7%.
Service revenue in Mining accounted for 68% of the total
Mining revenue (Q3 2018: 73%). Mining saw a 53% growth
in capital revenue and a 17% growth in service revenue.
Growth in revenue Q3 2019
(vs. Q3 2018) Mining Cement Group
Organic 23% -9% 7%
Acquisition 1% 0% 0%
Currency 2% 2% 2%
Total growth 26% -7% 9%
Service revenue in Cement accounted for 41% of the total
Cement revenue (Q3 2018: 42%).
ORDER INTAKE
BACKLOG
REVENUE
0
1,000
2,000
3,000
4,000
5,000
6,000
7,000
8,000
Q32017
Q4 Q12018
Q2 Q3 Q4 Q12019
Q2 Q3
DKKm
Service Order intake Capital Order intake
0
3,000
6,000
9,000
12,000
15,000
18,000
21,000
24,000
Q32017
Q4 Q12018
Q2 Q3 Q4 Q12019
Q2 Q3
DKKm
Mining Cement
0
1,000
2,000
3,000
4,000
5,000
6,000
7,000
8,000
Q32017
Q4 Q12018
Q2 Q3 Q4 Q12019
Q2 Q3
DKKm
Service Revenue Capital Revenue

QUARTERLY FINANCIAL PERFORMANCE
8 Interim report Q3 2019
MANAGEMENT REVIEW FINANCIAL STATEMENTS
PROFIT EBITA increased 8% due to lower SG&A costs. The EBITA
margin decreased slightly to 8.0%.
Business improvement initiatives
More than a year into the changed organisational
structure, we see potential for further efficiencies. In the
context of recent market developments and financial
performance, we will accelerate ongoing business
improvement initiatives.
Mining project execution will be consolidated into fewer
centres. This will strengthen competencies in the main
centres and ensure better absorption of resources in line
with fluctuating capital order intake.
Our footprint will be optimised in other parts of the
business as well. In procurement, for example, the more
simplified industry and region setup now allows for
optimisation of our warehouse infrastructure and better
utilisation at manufacturing and assembly sites.
The initiatives are expected to generate a combined
annual EBITA improvement of DKK 100m with a full run-
rate from end of 2020. The implementation costs are
anticipated to be around DKK 150m.
Expected financial impact
Savings, DKKm Total
Run-rate
end 2019
Run-rate
end 2020
EBITA improvement 100 25 100
Costs, DKKm Total Q4 2019 2020
Implementation costs (150) (75) (75)
Gross profit and margin
Gross profit was stable at DKK 1,126m (Q3 2018: DKK
1,126m). The effect of IFRS 16 on gross profit was a DKK
11m improvement vs. Q3 2018 (refer to note 14). The gross
margin fell to 23.8% (Q3 2018: 26.0%), attributable to
Mining, which saw a sharp 6.5 percentage points decline
compared to an exceptionally strong Q3 2018.
Irrespective of the strong comparison quarter, the Mining
gross margin in Q3 2019 fell below recent years' run-
rates. The decline was primarily a result of project cost
overruns of around DKK 70m, but also a consequence of
a weaker business environment which has delayed
customer decisions.
Some mining projects have delivered lower profit than
anticipated. We have reassessed the profitability on the
project portfolio and concluded that we need to factor in
a lower level profit for Mining projects going forward. We
will also strengthen the mining project organisation as
part of our business improvement initiatives. Together,
this is expected to re-establish a better match between
planned and executed margin.
Additionally, we have seen a different development in the
business mix. Recent project awards have included a
relatively higher share of minerals material handling and
a lower share of minerals processing. Minerals
processing projects have, by nature, a higher margin than
material handling projects.
Whilst the project cost overruns are seen as specific for
the third quarter of 2019, the change in mix and the
reassessment of profitability on Mining projects are
anticipated to impact the Mining capital business
negatively by around DKK 30m per quarter in both Q4
and next year, compared to the run-rate before Q3 2019.
We were also affected by delayed customer decisions in
the third quarter. Rather than awarding complete
projects, customers are increasingly awarding contracts
with defined milestones where the customer needs to
make a stop-or-go decision before the next phase of the
project is released. Because of increased market
uncertainty, we have recently experienced more delays
in these releases, which causes disruption to the
GROSS PROFIT
AND GROSS MARGIN
REVENUE AND EBITA MARGIN
20%
21%
22%
23%
24%
25%
26%
27%
0
200
400
600
800
1,000
1,200
1,400
Q32017
Q4 Q12018
Q2 Q3 Q4 Q12019
Q2 Q3
MarginDKKm
Mining Cement Gross profit margin
0%
2%
4%
6%
8%
10%
12%
0
1,000
2,000
3,000
4,000
5,000
6,000
Q32017
Q4 Q12018
Q2 Q3 Q4 Q12019
Q2 Q3
EBITA %DKKm
Revenue EBITA margin

QUARTERLY FINANCIAL PERFORMANCE
9 Interim report Q3 2019
MANAGEMENT REVIEW FINANCIAL STATEMENTS
workflow and impacts absorption of key resources.
We anticipate that the trend of breaking projects into
several milestones will continue. Hence, we are adjusting
the way we work and how we manage resources in the
Mining capital business.
In Cement, the gross margin increased by 1.6 percentage
points due to the execution of higher-margin projects and
efficiency measures implemented in the autumn of last
year.
In Q3 2019, total research and development costs (R&D)
amounted to DKK 71m (Q3 2018: DKK 88m), representing
1.5% of revenue (Q3 2018: 2.0%), of which DKK 21m was
capitalised (Q3 2018: DKK 58m) and the balance of DKK
50m expensed as production costs (Q3 2018: DKK 30m).
R&D costs in Q3 related to several projects, including
digitalization, standardisation, dry stack tailings, new
sustainable cement technologies and Rapid Oxidative
Leaching.
SG&A costs
Sales, general and administrative costs (SG&A) and other
operating items declined 7% to DKK 667m in Q3 2019.
The decline related to revised expectations for short term
incentive pay and affected both Mining and Cement. The
cost percentage was down to 14.1% of revenue, from
16.6% in Q3 2018. The effect of IFRS 16 on SG&A was a
cost reduction of DKK 22m (refer to note 14). Without IFRS
16 the cost ratio would have been 14.5%. Excluding both
the effect of IFRS 16 and the effect of the revised expec-
tations for incentive pay, SG&A would have increased
slightly on Q3 last year.
Depreciation increased to DKK 82m (Q3 2018: DKK 58m),
all of which was explained by IFRS 16 effects which led to
a DKK 28m increase (refer to note 14).
EBITA and margin
EBITA increased 8% to DKK 377m (Q3 2018: DKK 350m),
as a result of the lower SG&A costs, as explained above.
The EBITA margin decreased to 8.0% (Q3 2018: 8.1%).
Amortisation of intangible assets decreased to DKK 83m
(Q3 2018: DKK 96m), largely explained by the difference
in purchase price allocations which amounted to DKK
32m (Q3 2018: DKK 40m).
Earnings before interest and tax (EBIT) increased 16% to
DKK 294m (Q3 2018: 254m).
EBITA
ORDER INTAKE BY COMMODITY (Q3 2019)
0
100
200
300
400
500
600
Q32017
Q4 Q12018
Q2 Q3 Q4 Q12019
Q2 Q3
DKKm
Mining Cement
31%
20%8%
9%
5%
5%
22%
Cement Copper Gold Coal Iron ore Fertilizer Other

QUARTERLY FINANCIAL PERFORMANCE
10 Interim report Q3 2019
MANAGEMENT REVIEW FINANCIAL STATEMENTS
Financial items
Net financial items amounted to DKK -12m (Q3 2018: DKK
-17m), of which foreign exchange and fair value
adjustments amounted to DKK -1m (Q3 2018: DKK -21m)
and net interest amounted to DKK -11m (Q3 2018: DKK
4m).
Tax
Tax for the period was DKK -94m (Q3 2018: DKK -66m),
corresponding to an effective tax rate of 33% (Q3 2018:
28%).
Profit for the period
Profit for the period increased to DKK 190m (Q3 2018:
DKK 162m) as a result of the higher operating income.
Profit from continuing activities increased to DKK 190m
(Q3 2018: DKK 171m).
Discontinued activities had no impact on profit and loss in
Q3 2019 (Q3 2018: DKK -9m). As disclosed in the annual
report 2018, FLSmidth retains the responsibility to finalise
legacy projects, which are expected to be finalised
during 2019-2020. See note 8 for further information
about discontinued activities.
Earnings per share
Earnings per share increased to DKK 3.8 per share
(diluted) (Q3 2018: DKK 3.2).
Employees
The number of employees was 11,859 at the end of Q3
2019 (end of Q2 2019: 11,855).
Regional revenue development
In Q3 2019, South America represented an 8% higher
share of group revenue than the same quarter last year,
whereas the share of revenue in North America and
Europe contracted.
Acquisitions
Following the successful closing of the IMP acquisition,
FLSmidth is working on realising the synergies between
the digital initiatives of FLSmidth and IMP’s automated
solutions to further enhance processing optimisation and
provide greater value to customers.
FLSmidth would be open to other bolt-on acquisitions
which compliments the existing business.
REVENUE SPLIT BY REGIONS (Q3 2019)
REVENUE SPLIT BY REGIONS (Q3 2018)
19%
25%
17%
11%
8%
13%
7%
North AmericaSouth AmericaEurope, North Africa, RussiaSub-Saharan Africa and Middle EastAsiaSubcontinental IndiaAustralia
22%
17%
21%
13%
7%
12%
8%
North AmericaSouth AmericaEurope, North Africa, RussiaSub-Saharan Africa and Middle EastAsiaSubcontinental IndiaAustralia

QUARTERLY FINANCIAL PERFORMANCE
11 Interim report Q3 2019
MANAGEMENT REVIEW FINANCIAL STATEMENTS
CAPITAL ROCE increased to 11.2% due to higher EBITA over the
past 12 months, partly offset by higher capital employed.
Positive free cash flow resulted in a DKK 109m reduction
in net debt.
Capital employed
Average capital employed increased to DKK 15.0bn in Q3
2019 (Q2 2019: DKK 14.9bn). The increase was related to
working capital.
Net working capital
Net working capital increased to DKK 2,624m at the end
of Q3 2019 (end of Q2 2019: DKK 2,519m), and the
corresponding net working capital ratio was 13.1% of 12-
months trailing revenue (end of Q2 2019: 12.8% of
revenue). The increase was attributable to Mining,
discontinued activities and currency, and resulted from a
combination of lower trade payables and higher
receivables. The increase was partly offset by a higher
level of advanced payments.
Supply chain financing led to a slight increase in trade
payables in Q3.
The ambition is to end the year with a significantly lower
net working capital. Delayed Mining projects and
absence of large orders, however, make it more
challenging to reach the desired level of 10% of revenue
this year.
Return on capital employed
ROCE increased to 11.2% in Q3 2019 (Q3 2018: 10.7%) as a
result of a higher EBITA over the past 12 months, partly
offset by higher capital employed. 12-months trailing
EBITA increased to DKK 1,687m (Q3 2018: DKK 1,539m).
Average capital employed increased DKK 0.6bn on Q3
last year, related to working capital and the acquisition of
IMP Automation Group.
Equity ratio
Equity at the end of Q3 2019 increased to DKK 8,704m
(end of Q2 2019: DKK 8,313m), explained by the profit for
the period and currency translation effects. The equity
ratio was 37.6% (end of Q2 2019: 36.0%), well above the
long-term target of minimum 30%.
Net interest-bearing debt
Due to a positive free cash flow, net interest-bearing debt
(NIBD) decreased to DKK 2,693m (end of Q2 2019: DKK
2,802m). Consequently, the Group’s financial gearing
was 1.3 (end of Q2 2019: 1.4), well below the long term
maximum threshold of two times NIBD to EBITDA.
CASH FLOW FROM OPERATING ACTIVITIES
NET INTEREST-BEARING DEBT
NET WORKING CAPITAL
(600)
(400)
(200)
0
200
400
600
Q32017
Q4 Q12018
Q2 Q3 Q4 Q12019
Q2 Q3
DKKm
Cash flow from operating activities
0
500
1,000
1,500
2,000
2,500
3,000
Q32017
Q4 Q12018
Q2 Q3 Q4 Q12019
Q2 Q3
DKKm
Net interest bearing debt (NIBD)
0
500
1,000
1,500
2,000
2,500
3,000
Q32017
Q4 Q12018
Q2 Q3 Q4 Q12019
Q2 Q3
DKKm
Net working capital
QUARTERLY FINANCIAL PERFORMANCE
12 Interim report Q3 2019
MANAGEMENT REVIEW FINANCIAL STATEMENTS
Cash flow
Cash flow from operating activities decreased to DKK
244m in Q3 2019 (Q3 2018: DKK 357m), of which
discontinued activities amounted to DKK -41m (Q3 2018:
DKK -162m). Discontinued activities are expected to
generate a net cash outflow of roughly DKK 30m in the
remainder of 2019-2020.
Change in net working capital had a DKK 78m negative
impact in Q3 2019 (Q3 2018: DKK 27m positive impact), of
which discontinued activities accounted for a DKK 43m
negative impact (Q3 2018: DKK 148m negative impact).
Change in provisions had a DKK 86m negative impact in
Q3 2019 (Q3 2018: DKK 48m negative impact). The
change related mainly to used provisions in continuing
activities. Provision changes related to discontinued
activities had a DKK 7m negative impact in Q3 2019.
Cash flow from investing activities amounted to DKK -111m
in Q3 2019 (Q3 2018: DKK -109m).
Free cash flow adjusted for IFRS 16 effects as well as
acquisition and disposal of enterprises and activities
amounted to DKK 109m (Q3 2018: DKK 213m).

SEGMENT PERFORMANCE
13 Interim report Q3 2019
MANAGEMENT REVIEW FINANCIAL STATEMENTS
MARKET DEVELOPMENTS Good aftermarket, more cautious on CAPEX
In the third quarter, demand for replacement and
brownfield projects remained solid across regions and
we maintained a good momentum in service order intake.
We continue to see more demand for our digitalized
solutions as our customers are focused on improving
productivity, increasing capacity and driving down
production costs.
However, greenfield activity and other larger capital
investments are limited and miners remain cautious on
new investments, also in the context of a deteriorating
macroeconomic outlook. Headwinds to Chinese demand
for base metals are growing and the contraction across
global manufacturing indices signals a continued
deterioration in global industrial production.
The copper price has fallen to its lowest level since 2017,
impacted by the escalation of trade tensions and a
stronger US dollar.
At the same time, environmental approvals and
community issues continue to be the main reason for
stalled new mining projects, and a number of our
customers are experiencing increasing difficulties to
obtain licenses for new projects. The Americas in
particular noted a slowdown in activity as customers have
adopted a more conservative approach and are currently
only moving forward with opportunities with a low-risk
profile. As a result, several mining projects have been
delayed and some of the capital opportunities expected
in 2019 are now being postponed.
In the short term this is discouraging, but new regulations
and pressure from local governments are forcing mining
companies to innovate production processes, which
create opportunities for premium suppliers in the medium
to longer term. As seen in Brazil at the beginning of the
year, consequences of dam failures and overflows are
disastrous, and it is crucial both from an environmental
and economic standpoint to mitigate this risk. On the
back of this, we increasingly receive strong interest in our
sustainable technologies and tailings management,
which can help mining companies maximize safety and
attain a social license to operate.
As technological advancement and the global trend of
decarbonisation accelerates, there will also be a growing
demand for base metals. In the longer run, we expect a
significant market demand leading to a strengthening in
copper prices.
Segment performance
MINING
MINING ORDER INTAKE SPLIT BETWEEN
SERVICE AND CAPITAL BUSINESS (Q3)
MINING ORDER INTAKE BY COMMODITY (Q3)
COPPER PRICE USD/MT, LME
64%
36%
Service
Capital
29%
12%
13%7%
7%
32%
Copper Gold Coal Fertilizer Iron ore Other
4000
4500
5000
5500
6000
6500
7000
7500
Q32017
Q4 Q12018
Q2 Q3 Q4 Q12019
Q2 Q3
USD/mt

SEGMENT PERFORMANCE
14 Interim report Q3 2019
MANAGEMENT REVIEW FINANCIAL STATEMENTS
FINANCIAL PERFORMANCE IN Q3 2019 Good momentum in service order intake Order intake in Q3 2019 decreased by 3% to DKK 3,148m
(Q3 2018: DKK 3,250m), but increased by 2% compared
to previous quarter. The decrease on Q3 last year was
due to lower capital order intake, and despite a contract
of approximately DKK 200m for a copper mine in Serbia.
An overall more cautious business environment has
caused some customers to postpone decisions on larger
capital investments, and a few mine projects have been
deferred due to lack of permitting.
We maintain a good momentum in mining service order
intake, which increased 19% to DKK 2,024m compared to
the third quarter in 2018 (Q3 2018: DKK 1,702). Currency
effects had a 1% positive impact on order intake
compared to the same quarter last year.
Increase in revenue
Revenue increased by 26% to DKK 2,832m (Q3 2018:
DKK 2,242m). This increase was driven by a strong
backlog and a lift in both capital and service revenue,
which increased by 53% and 17% year-on-year,
respectively. Currency effects had a 2% positive impact
on revenue in the quarter.
Weaker profitability
Gross profit, before allocation of shared costs, was stable
at DKK 713m (Q3 2018: DKK 711m). The gross margin,
however, decreased to 25.2% (Q3 2018: 31.7%).
Irrespective of the strong comparison quarter, the gross
margin in Q3 2019 fell below recent years' run-rates. See
page 8 for further information.
EBITA decreased 13% year-on-year to DKK 261m (Q3
2018: DKK 299m). The corresponding EBITA margin
decreased to 9.2% (Q3 2018: 13.3%).
FINANCIAL PERFORMANCE IN Q1-Q3 2019
Order intake in Q1-Q3 2019 decreased by 7% to DKK
9,231m (Q1-Q3 2018: DKK 9,886m). The decrease related
to capital business, whereas service order intake was
stable.
Mining revenue increased by 16% to DKK 8,632m in the
first nine months of 2019 (Q1-Q3 2018: DKK 7,440m),
especially driven by a higher capital revenue in the third
quarter.
EBITA increased by 5% to DKK 843m (Q1-Q3 2018: DKK
802m), while the corresponding EBITA margin decreased
to 9.8% from 10.8% in Q1-Q3 2018.
REVENUE AND EBITA MARGIN
0%
2%
4%
6%
8%
10%
12%
14%
0
500
1,000
1,500
2,000
2,500
3,000
3,500
Q32017
Q4 Q12018
Q2 Q3 Q4 Q12019
Q2 Q3
EBITA %DKKm
Service revenue Capital revenue EBITA margin
MINING (DKKm) Q3 2019 Q3 2018 Change (%) 9M 2019 9M 2018 Change (%)
Order intake (gross) 3,148 3,250 -3% 9,231 9,886 -7%
- Hereof service order intake 2,024 1,702 19% 5,727 5,734 0%
- Hereof capital order intake 1,124 1,548 -27% 3,504 4,152 -16%
Order backlog 8,544 8,579 0% 8,544 8,579 0%
Revenue 2,832 2,242 26% 8,632 7,440 16%
- Hereof service revenue 1,916 1,644 17% 5,446 5,177 5%
- Hereof capital revenue 916 598 53% 3,186 2,263 41%
Gross profit before allocation of shared cost 713 711 0% 2,242 2,103 7%
Gross profit margin before allocation of shared cost 25.2% 31.7% 26.0% 28.3%
EBITA before allocation of shared cost 463 456 2% 1,446 1,383 5%
EBITA margin before allocation of shared cost 16.3% 20.3% 16.8% 18.6%
EBITA 261 299 -13% 843 802 5%
EBITA margin 9.2% 13.3% 9.8% 10.8%
EBIT 195 228 -14% 649 614 6%
EBIT margin 6.9% 10.2% 7.5% 8.3%
Number of employees 5,250 4,828 9% 5,250 4,828 9%
SEGMENT PERFORMANCE
15 Interim report Q3 2019
MANAGEMENT REVIEW FINANCIAL STATEMENTS
MARKET DEVELOPMENTS Stable level of market activity
The market for Cement remained robust during the third
quarter, with stable underlying activity across most
regions.
We are experiencing increased interest in solutions
supporting a lower environmental impact and higher
operation efficiency. We have ongoing initiatives across
regions to drive aftermarket opportunities, with a healthy
pipeline of small to mid-sized opportunities within
upgrades and retrofits.
We continue to have a pipeline of regional opportunities
for large capital orders, although none materialised
during Q3.
The market for new cement capacity remains subdued on
a global scale. Global growth, a key driver for cement
demand, continues to be weakened by rising trade
barriers and increasing geopolitical tensions. The
International Monetary Fund (IMF) now expects 2019 GDP
growth at 3.0%, its slowest pace since the 2008-2009
financial crisis.
However, the local nature of the cement market ensures
regional opportunities for new capacity and a steady
development in aftermarket as our customers are making
efforts to improve efficiency and reduce the
environmental impact of existing plants.
The growing intensity of the sustainability agenda is
becoming increasingly important for securing financing
for cement projects. Research shows that based upon
current practices and other industries achieving their
promised reductions, cement production could be
responsible for a 26% share of the global CO2 emissions
by 2050. The threat of such a scenario clearly illustrates
the urgency to act. As the world becomes increasingly
connected, various national and international policies
incentivising low carbon business operations are in
effect. At the same time, investors are now putting more
pressure on the world’s largest cement companies to
come up with credible plans and take actions to
significantly reduce CO2 and other emissions.
As a result of the increasing pressures from both
governments and investors, sustainability is gaining
traction and customers show more interest for our
alternative fuel systems to reduce their environmental
footprint. Their awareness around emissions compliance
is increasing and we can clearly see an increased interest
in pyro upgrades, including our Low-NOx calciner
technology, our HOTDISC® systems, our cooler
technology and chloride bypass systems. To stay
competitive in this complex market, all aspects of cement
production that impact the environment need to be
optimised.
CEMENT
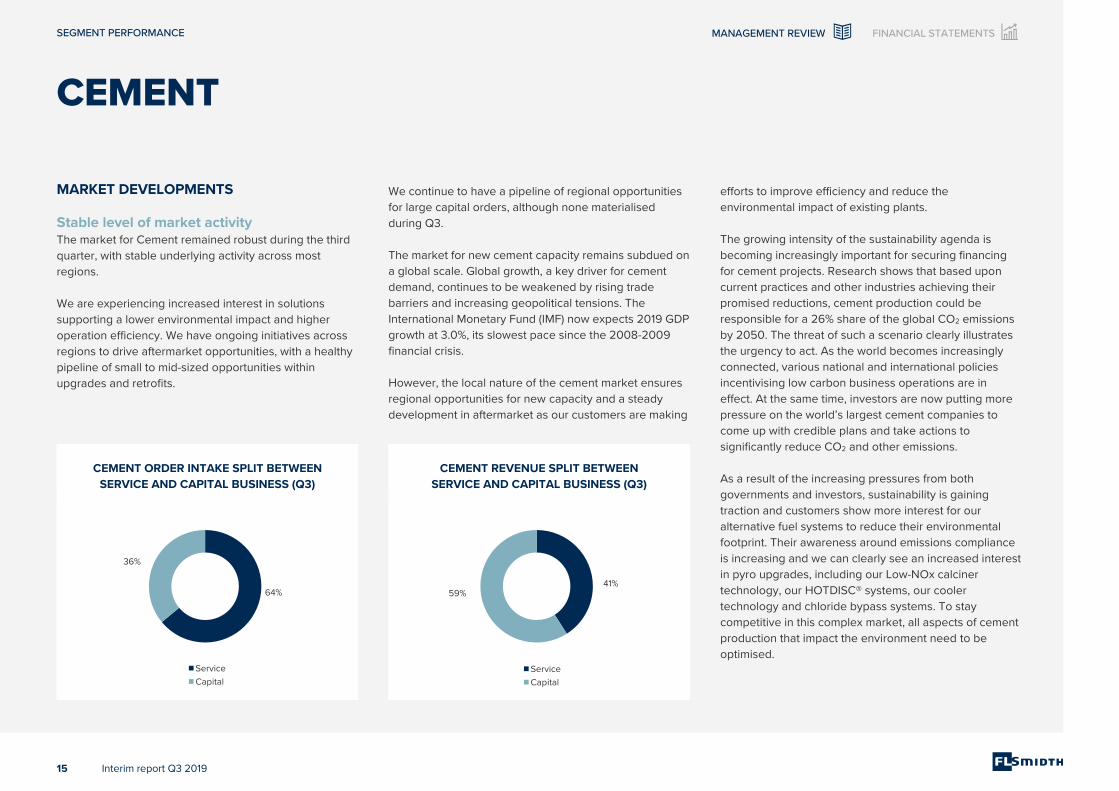
CEMENT ORDER INTAKE SPLIT BETWEEN
SERVICE AND CAPITAL BUSINESS (Q3)
CEMENT REVENUE SPLIT BETWEEN
SERVICE AND CAPITAL BUSINESS (Q3)
64%
36%
Service
Capital
41%59%
Service
Capital
SEGMENT PERFORMANCE
16 Interim report Q3 2019
MANAGEMENT REVIEW FINANCIAL STATEMENTS
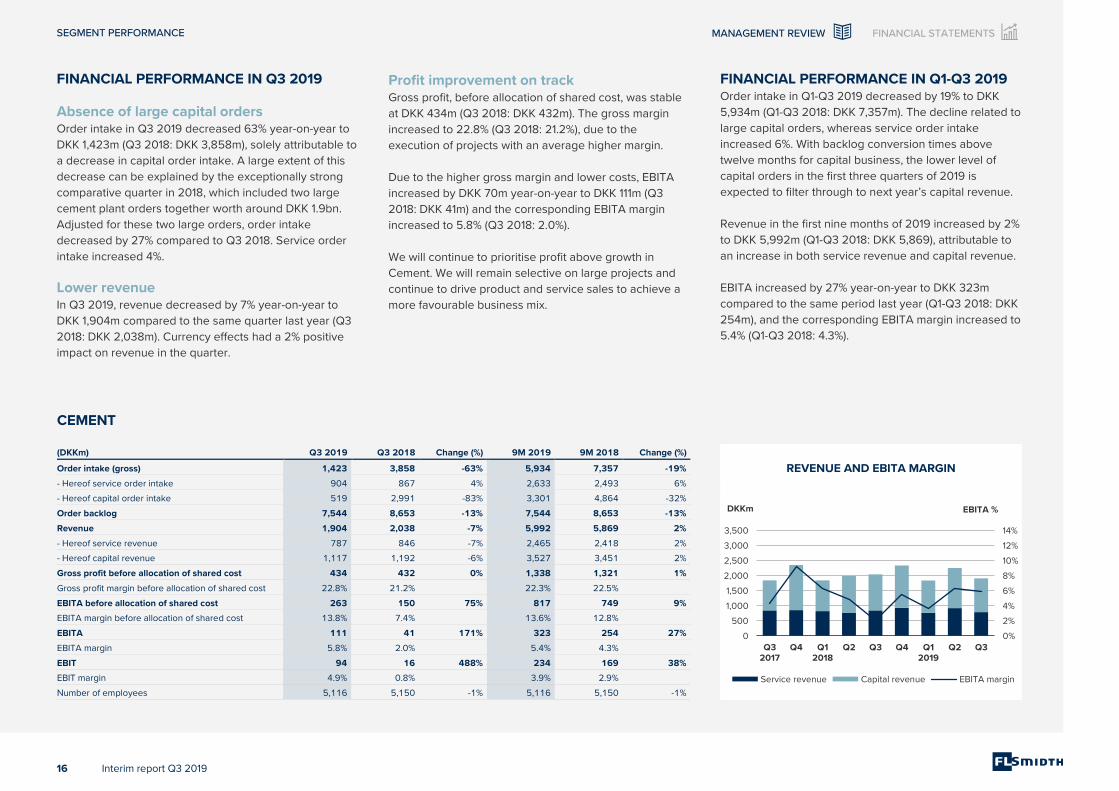
FINANCIAL PERFORMANCE IN Q3 2019
Absence of large capital orders
Order intake in Q3 2019 decreased 63% year-on-year to
DKK 1,423m (Q3 2018: DKK 3,858m), solely attributable to
a decrease in capital order intake. A large extent of this
decrease can be explained by the exceptionally strong
comparative quarter in 2018, which included two large
cement plant orders together worth around DKK 1.9bn.
Adjusted for these two large orders, order intake
decreased by 27% compared to Q3 2018. Service order
intake increased 4%.
Lower revenue
In Q3 2019, revenue decreased by 7% year-on-year to
DKK 1,904m compared to the same quarter last year (Q3
2018: DKK 2,038m). Currency effects had a 2% positive
impact on revenue in the quarter.
Profit improvement on track
Gross profit, before allocation of shared cost, was stable
at DKK 434m (Q3 2018: DKK 432m). The gross margin
increased to 22.8% (Q3 2018: 21.2%), due to the
execution of projects with an average higher margin.
Due to the higher gross margin and lower costs, EBITA
increased by DKK 70m year-on-year to DKK 111m (Q3
2018: DKK 41m) and the corresponding EBITA margin
increased to 5.8% (Q3 2018: 2.0%).
We will continue to prioritise profit above growth in
Cement. We will remain selective on large projects and
continue to drive product and service sales to achieve a
more favourable business mix.
FINANCIAL PERFORMANCE IN Q1-Q3 2019 Order intake in Q1-Q3 2019 decreased by 19% to DKK
5,934m (Q1-Q3 2018: DKK 7,357m). The decline related to
large capital orders, whereas service order intake
increased 6%. With backlog conversion times above
twelve months for capital business, the lower level of
capital orders in the first three quarters of 2019 is
expected to filter through to next year’s capital revenue.
Revenue in the first nine months of 2019 increased by 2%
to DKK 5,992m (Q1-Q3 2018: DKK 5,869), attributable to
an increase in both service revenue and capital revenue.
EBITA increased by 27% year-on-year to DKK 323m
compared to the same period last year (Q1-Q3 2018: DKK
254m), and the corresponding EBITA margin increased to
5.4% (Q1-Q3 2018: 4.3%).
REVENUE AND EBITA MARGIN
0%
2%
4%
6%
8%
10%
12%
14%
0
500
1,000
1,500
2,000
2,500
3,000
3,500
Q32017
Q4 Q12018
Q2 Q3 Q4 Q12019
Q2 Q3
EBITA %DKKm
Service revenue Capital revenue EBITA margin
CEMENT (DKKm) Q3 2019 Q3 2018 Change (%) 9M 2019 9M 2018 Change (%)
Order intake (gross) 1,423 3,858 -63% 5,934 7,357 -19%
- Hereof service order intake 904 867 4% 2,633 2,493 6%
- Hereof capital order intake 519 2,991 -83% 3,301 4,864 -32%
Order backlog 7,544 8,653 -13% 7,544 8,653 -13%
Revenue 1,904 2,038 -7% 5,992 5,869 2%
- Hereof service revenue 787 846 -7% 2,465 2,418 2%
- Hereof capital revenue 1,117 1,192 -6% 3,527 3,451 2%
Gross profit before allocation of shared cost 434 432 0% 1,338 1,321 1%
Gross profit margin before allocation of shared cost 22.8% 21.2% 22.3% 22.5%
EBITA before allocation of shared cost 263 150 75% 817 749 9%
EBITA margin before allocation of shared cost 13.8% 7.4% 13.6% 12.8%
EBITA 111 41 171% 323 254 27%
EBITA margin 5.8% 2.0% 5.4% 4.3%
EBIT 94 16 488% 234 169 38%
EBIT margin 4.9% 0.8% 3.9% 2.9%
Number of employees 5,116 5,150 -1% 5,116 5,150 -1%

SUSTAINABILITY
17 Interim report Q3 2019
MANAGEMENT REVIEW FINANCIAL STATEMENTS
SAFETY Year-to-date our Total Recordable Injury Frequency Rate
was 1.7 against a 2019 target of ≤ 2.7. The safety of our
employees and contractors is our top priority and we
believe that all accidents are preventable. Despite our
efforts, a sub-contractor fatality tragically occurred on a
site during this quarter. We are determined to achieve
zero harm and we are strengthening our focus on our
incident reduction programs that will help us increase
awareness on preventing risk and eliminate incidents in
the future.
COMPLIANCE This year we introduced semi-automated due diligence
screening tools, which have helped us to achieve a
higher number of screenings than originally anticipated.
From 2017 to Q3 2019, we have conducted 938 due
diligence reports, which is above our target of 750.
PEOPLE By the end of Q3 2019, 11.4% of our manager roles were
filled by women, surpassing our 2019 target of 11%. We
are seeing the results of our diversity initiatives, for
example, women account for 65% of the participants in
our Graduate Engineer Program in India. We have
invested more than 3,000 person-hours in sales
methodology training and 3,500 hours of leadership
training.
ENVIRONMENT In Q3, our efforts to reduce our carbon footprint, such as
purchases of renewable energy and energy efficiency
initiatives in our facilities, resulted in a significant
improvement in our carbon intensity; now at 2.4
tonnes/DKKbn revenue, well below the 2018 result of 3.2.
SUPPLY CHAIN We have sustainability-screened 441 high-risk suppliers in
2019, surpassing our target of 300. Beyond screening,
we have collaborated with more than 100 suppliers to
improve their safety, environmental and human/labour
rights performance.
HUMAN RIGHTS Year-to-date, we have completed eight on-site and 52
off-site human rights audits, with a full year target of 15
and 50, respectively. We have chosen to focus on off-site
audits and implementing the learnings gained.
All data will be externally assured by year end 2019.
SUSTAINABILITY
TOTAL RECORDABLE
INJURY FREQUENCY RATE
CO2 EMISSIONS
(SCOPE 1 & 2)
SUPPLIERS ASSESSED FOR SUSTAINABILITY
Sustainability
0.0
1.5
3.0
4.5
2018 9M 2019
No.
Total Recorded Injury Frequency Rate
0
30,000
60,000
90,000
2018 9M 2019
Tonnes
CO2 Emissions (Scope 1 & 2)
0
200
400
600
2018 9M 2019
No.
Suppliers assessed for sustainability
QUARTERLY KEY FIGURES
18 Interim report Q3 2019
MANAGEMENT REVIEW FINANCIAL STATEMENTS
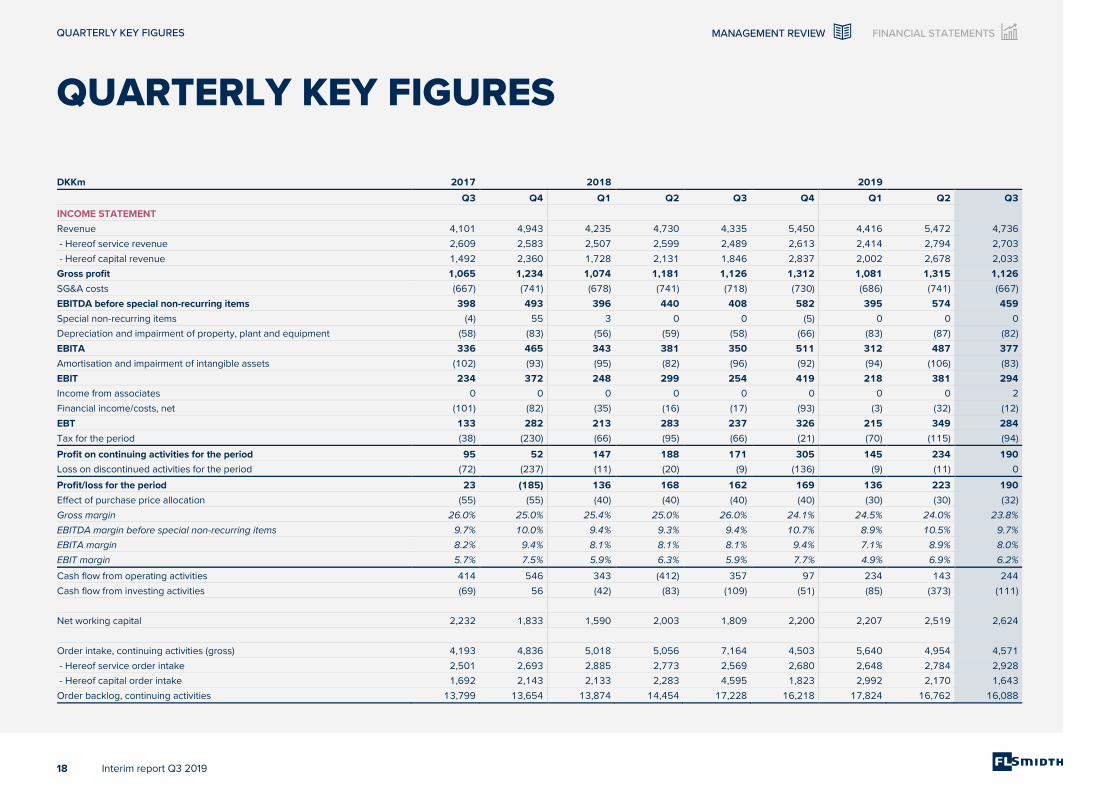
QUARTERLY KEY FIGURES
Quarterly key figures
DKKm 2017 2018 2019
Q3 Q4 Q1 Q2 Q3 Q4 Q1 Q2 Q3
INCOME STATEMENT
Revenue 4,101 4,943 4,235 4,730 4,335 5,450 4,416 5,472 4,736
- Hereof service revenue 2,609 2,583 2,507 2,599 2,489 2,613 2,414 2,794 2,703
- Hereof capital revenue 1,492 2,360 1,728 2,131 1,846 2,837 2,002 2,678 2,033
Gross profit 1,065 1,234 1,074 1,181 1,126 1,312 1,081 1,315 1,126
SG&A costs (667) (741) (678) (741) (718) (730) (686) (741) (667)
EBITDA before special non-recurring items 398 493 396 440 408 582 395 574 459
Special non-recurring items (4) 55 3 0 0 (5) 0 0 0
Depreciation and impairment of property, plant and equipment (58) (83) (56) (59) (58) (66) (83) (87) (82)
EBITA 336 465 343 381 350 511 312 487 377
Amortisation and impairment of intangible assets (102) (93) (95) (82) (96) (92) (94) (106) (83)
EBIT 234 372 248 299 254 419 218 381 294
Income from associates 0 0 0 0 0 0 0 0 2
Financial income/costs, net (101) (82) (35) (16) (17) (93) (3) (32) (12)
EBT 133 282 213 283 237 326 215 349 284
Tax for the period (38) (230) (66) (95) (66) (21) (70) (115) (94)
Profit on continuing activities for the period 95 52 147 188 171 305 145 234 190
Loss on discontinued activities for the period (72) (237) (11) (20) (9) (136) (9) (11) 0
Profit/loss for the period 23 (185) 136 168 162 169 136 223 190
Effect of purchase price allocation (55) (55) (40) (40) (40) (40) (30) (30) (32)
Gross margin 26.0% 25.0% 25.4% 25.0% 26.0% 24.1% 24.5% 24.0% 23.8%
EBITDA margin before special non-recurring items 9.7% 10.0% 9.4% 9.3% 9.4% 10.7% 8.9% 10.5% 9.7%
EBITA margin 8.2% 9.4% 8.1% 8.1% 8.1% 9.4% 7.1% 8.9% 8.0%
EBIT margin 5.7% 7.5% 5.9% 6.3% 5.9% 7.7% 4.9% 6.9% 6.2%
Cash flow from operating activities 414 546 343 (412) 357 97 234 143 244
Cash flow from investing activities (69) 56 (42) (83) (109) (51) (85) (373) (111)
Net working capital 2,232 1,833 1,590 2,003 1,809 2,200 2,207 2,519 2,624
Order intake, continuing activities (gross) 4,193 4,836 5,018 5,056 7,164 4,503 5,640 4,954 4,571
- Hereof service order intake 2,501 2,693 2,885 2,773 2,569 2,680 2,648 2,784 2,928
- Hereof capital order intake 1,692 2,143 2,133 2,283 4,595 1,823 2,992 2,170 1,643
Order backlog, continuing activities 13,799 13,654 13,874 14,454 17,228 16,218 17,824 16,762 16,088

QUARTERLY KEY FIGURES
19 Interim report Q3 2019
MANAGEMENT REVIEW FINANCIAL STATEMENTS
DKKm 2017 2018 2019
Q3 Q4 Q1 Q2 Q3 Q4 Q1 Q2 Q3
SEGMENT REPORTING
Mining
Revenue 2,310 2,653 2,418 2,780 2,242 3,117 2,579 3,221 2,832
- Hereof service revenue 1,761 1,729 1,689 1,844 1,644 1,681 1,654 1,876 1,916
- Hereof capital revenue 549 924 729 936 598 1,436 925 1,345 916
Gross profit before allocation of shared costs 672 695 653 739 711 853 689 840 713
EBITA before allocation of shared costs 463 488 435 492 456 589 442 541 463
EBITA 263 238 226 277 299 387 246 336 261
EBIT 198 175 165 221 228 323 180 274 195
Gross margin before allocation of shared costs 29.1% 26.2% 27.0% 26.6% 31.7% 27.4% 26.7% 26.1% 25.2%
EBITA margin before allocation of shared costs 20.0% 18.4% 18.0% 17.8% 20.3% 18.9% 17.1% 16.8% 16.3%
EBITA margin 11.4% 9.0% 9.4% 9.9% 13.3% 12.4% 9.5% 10.4% 9.2%
EBIT margin 8.6% 6.6% 6.8% 7.9% 10.2% 10.4% 7.0% 8.5% 6.9%
Order intake (gross) 2,737 2,589 3,339 3,297 3,250 2,980 3,008 3,075 3,148
- Hereof service order intake 1,609 1,714 2,084 1,948 1,702 1,707 1,802 1,901 2,024
- Hereof capital order intake 1,128 875 1,255 1,349 1,548 1,273 1,206 1,174 1,124
Order backlog 6,230 6,261 6,900 7,526 8,579 8,350 9,171 8,757 8,544
Cement
Revenue 1,843 2,352 1,841 1,990 2,038 2,335 1,837 2,251 1,904
- Hereof service revenue 848 853 818 754 846 932 760 918 787
- Hereof capital revenue 995 1,499 1,023 1,236 1,192 1,403 1,077 1,333 1,117
Gross profit before allocation of shared costs 367 573 433 456 432 475 408 496 434
EBITA before allocation of shared costs 250 427 304 295 150 321 235 319 263
EBITA 79 216 116 97 41 127 69 143 111
EBIT 42 186 82 71 16 99 41 99 94
Gross margin before allocation of shared costs 19.9% 24.4% 23.5% 22.9% 21.2% 20.4% 22.2% 22.0% 22.8%
EBITA margin before allocation of shared costs 13.6% 18.2% 16.5% 14.8% 7.4% 13.7% 12.8% 14.1% 13.8%
EBITA margin 4.3% 9.2% 6.3% 4.9% 2.0% 5.4% 3.7% 6.3% 5.8%
EBIT margin 2.3% 7.9% 4.5% 3.6% 0.8% 4.2% 2.2% 4.4% 4.9%
Order intake (gross) 1,489 2,277 1,707 1,792 3,858 1,524 2,632 1,879 1,423
- Hereof service order intake 891 979 801 825 867 973 846 883 904
- Hereof capital order intake 598 1,298 906 967 2,991 551 1,786 996 519
Order backlog 7,697 7,473 7,057 7,003 8,653 7,872 8,653 8,005 7,544

CONSOLIDATED CONDENSED INTERIM FINANCIAL STATEMENTS
20 Interim report Q3 2019
MANAGEMENT REVIEW FINANCIAL STATEMENTS
Consolidated condensed interim financial statements
INTERIM FINANCIAL STATEMENTS AND 9M 2019 COMMENTS
MANAGEMENT’S REVIEW
FINANCIAL STATEMENTS
CONSOLIDATED CONDENSED INTERIM FINANCIAL STATEMENTS

CONSOLIDATED CONDENSED INTERIM FINANCIAL STATEMENTS
21 Interim report Q3 2019
MANAGEMENT REVIEW FINANCIAL STATEMENTS
Order intake
In the first three quarters of 2019, order intake decreased
12% to DKK 15,165m compared to the same period last
year (9M 2018: DKK 17,238m). The decrease was
attributable to both segments. Mining decreased 7%,
whereas Cement decreased 19%.
Order backlog
Order backlog decreased 7% to DKK 16,088m by the end
of Q3 2019 (end of Q3 2018: DKK 17,228m). The decrease
was fully attributable to Cement which saw a 13% decline.
Growth in order intake 9M 2019
(vs. 9M 2018) Mining Cement Group
Organic -8% -20% -14%
Acquisition 1% 0% 1%
Currency 0% 1% 1%
Total growth -7% -19% -12%
Order backlog maturity
Based on the order backlog maturity profile, 32% of the
backlog is expected to be converted to revenue in the
remainder of 2019, 51% in 2020, and 17% in 2021 and
beyond.
Revenue
Revenue increased 10% to DKK 14,624m (9M 2018: DKK
13,300m), driven by the 16% growth in Mining. Cement
revenue increased by 2%.
Revenue related to service business increased 4%. The
increase was related to both segments.
Revenue related to capital business increased 18% as a
result of high project execution in Mining.
GROWTH
ORDER INTAKE AND BOOK-TO-BILL
ORDER INTAKE
BY COMMODITY
BACKLOG MATURITY
0%
30%
60%
90%
120%
150%
0
4,000
8,000
12,000
16,000
20,000
9M 2018 9M 2019
Book-to-bill %DKKm
Order intake Book-to-bill
39%
19%
7%
8%
8%
3%
16%
Cement Copper Gold Coal Iron ore Fertilizer Other
0
3,000
6,000
9,000
12,000
15,000
18,000
9M 2018 9M 2019
DKKm
Within current year Within next year Later than next year

CONSOLIDATED CONDENSED INTERIM FINANCIAL STATEMENTS
22 Interim report Q3 2019
MANAGEMENT REVIEW FINANCIAL STATEMENTS
Gross profit and margin
The gross profit in the first three quarters of 2019
increased 4% to DKK 3,522m (9M 2018: DKK 3,381m). The
gross margin went down 1.3 percentage points to 24.1%.
The gross margin declined mainly due to a higher share
of lower-margin capital business.
In the first three quarters of 2019, research and
development costs were DKK 209m, of which DKK 82m
were capitalised.
In the first three quarters of 2019, the amortisation of
intangible assets increased, due to a higher level of
completed R&D projects.
EBITA and margin
EBITA increased 9% to DKK 1,176m (9M 2018: DKK
1,074m). The increase in EBITA reflected the increase in
revenue for the first three quarters of 2019. The EBITA
margin decreased slightly to 8.0% (9M 2018: 8.1%).
The effect of IFRS 16 on SG&A was a cost reduction of
DKK 57m (refer to note 14). Without IFRS 16 the cost ratio
would have been 14.7%.
Profit for the period
Profit for the period from continued business increased to
DKK 569m, up by 12% (9M 2018: DKK 506m). Profit for
the period increased 18% to DKK 549m (9M 2018: DKK
466m), mainly due to higher operating profit in continuing
activities.
Earnings per share
Earnings per share increased to DKK 11.0 (9M 2018: DKK
9.3).
PROFIT
GROSS PROFIT
AND GROSS MARGIN
SG&A COST
AND SG&A RATIO
EBITA SPLIT BY
MINING AND CEMENT
0%
10%
20%
30%
40%
50%
0
1,000
2,000
3,000
4,000
5,000
9M 2018 9M 2019
Gross margin %DKKm
Gross profit Gross margin
0%
5%
10%
15%
20%
25%
0
1,000
2,000
3,000
4,000
5,000
9M 2018 9M 2019
SG&A %DKKm
SG&A cost SG&A ratio
0
300
600
900
1,200
1,500
9M 2018 9M 2019
DKKm
Mining Cement

CONSOLIDATED CONDENSED INTERIM FINANCIAL STATEMENTS
23 Interim report Q3 2019
MANAGEMENT REVIEW FINANCIAL STATEMENTS
Notes DKKm Q3 2019 Q3 2018 9M 2019 9M 2018
3, 4 Revenue 4,736 4,335 14,624 13,300
Production costs (3,610) (3,209) (11,102) (9,919)
Gross profit 1,126 1,126 3,522 3,381
Sales costs (369) (354) (1,091) (1,096)
Administrative costs (309) (369) (1,035) (1,067)
Other operating items 11 5 32 26
EBITDA before special non-recurring items 459 408 1,428 1,244
Special non-recurring items 0 0 0 3
Depreciation and impairment of property, plant and equipment
(82) (58) (252) (173)
EBITA 377 350 1,176 1,074
Amortisation and impairment of intangible assets
(83) (96) (283) (273)
EBIT 294 254 893 801
Income from associates 2 0 2 0
Financial income 200 235 732 686
Financial costs (212) (252) (779) (754)
EBT 284 237 848 733
Tax for the period (94) (66) (279) (227)
Profit for the period, continuing activities 190 171 569 506
3, 8 Loss for the period, discontinued activities 0 (9) (20) (40)
Profit for the period 190 162 549 466
Attributable to:
Shareholders in FLSmidth & Co. A/S 191 160 551 463
Minority interests (1) 2 (2) 3
190 162 549 466
11 Earnings per share (EPS):
Continuing and discontinued activities per share
3.8 3.2 11.0 9.3
Continuing and discontinued activities per share, diluted
3.8 3.2 11.0 9.3
Continuing activities per share 3.8 3.4 11.4 10.1
Continuing activities per share, diluted 3.8 3.4 11.4 10.1
Notes DKKm Q3 2019 Q3 2018 9M 2019 9M 2018
Profit for the period 190 162 549 466
Items that will not be reclassified to profit or loss:
Actuarial gains/(losses) on defined benefit plans
0 0 (1) (1)
Tax hereof, including reversal of impairment of tax assets
0 0 0 0
Items that are or may be reclassified subsequently to profit or loss:
Currency adjustments regarding translation of entities
208 (42) 309 (147)
Cash flow hedging:
- Value adjustments for the period (34) (13) (21) (22)
- Value adjustments transferred to work in progress
3 0 2 0
Tax hereof 1 (5) (6) 14
Other comprehensive income for the period after tax
178 (60) 283 (156)
Comprehensive income for the period 368 102 832 310
Attributable to:
Shareholders in FLSmidth & Co. A/S 369 99 834 308
Minority interests (1) 3 (2) 2
368 102 832 310
INCOME STATEMENT STATEMENT OF COMPREHENSIVE INCOME

CONSOLIDATED CONDENSED INTERIM FINANCIAL STATEMENTS
24 Interim report Q3 2019
MANAGEMENT REVIEW FINANCIAL STATEMENTS
Cash flow from operating activities
Cash flow from operating activities amounted to DKK
621m (9M 2018: DKK 288m). The primary drivers were
improved earnings and a positive development in the
change in provisions as Q1-Q3 2018 included a
settlement of legacy projects in discontinued activities.
Cash flow from investing activities
Cash flow used for investments increased significantly to
DKK -569m (9M 2018: DKK -234m), driven by the
business acquisition of IMP Automation Group for DKK
305m. In the comparative period the acquisition of
Sandvik Mining Systems contributed positively by DKK
105m.
Free cash flow
Free cash flow adjusted for business acquisitions and
disposals was DKK 357m (9M 2018: DKK -61m).
Cash flow from financing activities
The dividend approved at the Annual General Meeting
was paid out in Q2 2019, with a net payout of DKK 450m,
impacting the change in net interest-bearing debt.
Cash position
At the end of Q3 2019, the Group’s capital resources
consisted of committed credit facilities of DKK 6.5bn
(including mortgage) with a weighted average time to
maturity of 2.6 years.
CASH FLOW
CASH FLOW FROM
OPERATING ACTIVITIES
CASH FLOW FROM
INVESTING ACTIVITIES
FREE CASH FLOW
0
100
200
300
400
500
600
700
9M 2018 9M 2019
DKKm
Cash flow from operating activities
-700
-600
-500
-400
-300
-200
-100
0
9M 2018 9M 2019
DKKm
Cash flow from investing activities
-200
-100
0
100
200
300
400
500
9M 2018 9M 2019
DKKm
Free cash flowFree cash flow adjusted for business acquisitons and disposals

CONSOLIDATED CONDENSED INTERIM FINANCIAL STATEMENTS
25 Interim report Q3 2019
MANAGEMENT REVIEW FINANCIAL STATEMENTS
DKKm Q3 2019 Q3 2018 9M 2019 9M 2018
EBITDA before special non-recurring items, continuing activities
459 408 1,428 1,244
EBITDA before special non-recurring items, discontinued activities
(1) (4) (16) (60)
EBITDA 458 404 1,412 1,184
Adjustment for gain on sale of property, plant and equipment, intangible assets etc.
16 11 36 27
Adjusted EBITDA 474 415 1,448 1,211
Change in provisions (86) (48) (285) (436)
Change in net working capital (78) 27 (310) (248)
Cash flow from operating activities before financial items and tax
310 394 853 527
Financial items received and paid (9) 18 (34) (8)
Taxes paid (57) (55) (198) (231)
Cash flow from operating activities 244 357 621 288
7 Acquisition of enterprises and activities (6) 35 (305) 105
Acquisition of intangible assets (42) (92) (149) (151)
Acquisition of property, plant and equipment (64) (52) (124) (244)
Acquisition of financial assets 0 0 0 (19)
Disposal of enterprises and activities 0 0 0 10
Disposal of property, plant and equipment 1 0 1 18
Disposal of financial assets 0 0 2 47
Dividend from associates 0 0 6 0
Cash flow from investing activities (111) (109) (569) (234)
Free cash flow 133 248 52 54
Free cash flow, adjusted for acquisitions and disposals of enterprises and activities 139 213 357 (61)
Free cash flow, adjusted for acquisitions and disposals of enterprises and activities and IFRS 16, Leases
109 279
DKKm Q3 2019 Q3 2018 9M 2019 9M 2018
Dividend 0 (24) (450) (421)
Addition of minority interests 0 0 7 0
Acquisition of treasury shares 0 0 0 (42)
Exercise of share options 8 28 16 124
Repayment of lease liabilities (30) 0 (78) 0
Change in net interest-bearing debt (93) (220) 342 95
Cash flow from financing activities (115) (216) (163) (244)
Change in cash and cash equivalents 18 32 (111) (190)
Cash and cash equivalents at beginning of period
755 1,146 875 1,425
Foreign exchange adjustment, cash and cash equivalents
8 (43) 17 (100)
Cash and cash equivalents at 30 September 781 1,135 781 1,135
Hereof cash and cash equivalents included in assets held for sale
0 9 0 9
CASH FLOW STATEMENT

CONSOLIDATED CONDENSED INTERIM FINANCIAL STATEMENTS
26 Interim report Q3 2019
MANAGEMENT REVIEW FINANCIAL STATEMENTS
Capital Balance sheet
Total assets increased to DKK 23,148m (2018: DKK
21,743m) at the end of Q3 2019, driven by business
acquisition effects of DKK 391m, IFRS 16 effects of DKK
323m and increases in net working capital.
Net working capital
Net working capital increased to DKK 2,624m (end of
2018: DKK 2,200m), and the corresponding net working
capital ratio was 13.1% of 12-months trailing revenue,
compared to 11.7% end of 2018. The increase related to
net work in progress and inventories. The higher level of
net work in progress was caused by increased project
activity. The increase in inventories resulted from the
increased order activity as well as strategic inventory to
support product and parts sales. However partly
counterbalanced by a significant increase in trade
payables. Also, the acquisition of IMP Automation Group
contributed DKK 49m of the increase in net working
capital.
Net interest-bearing debt
Net interest-bearing debt (NIBD) by the end of Q3 2019
increased to DKK 2,693m (end of 2018: DKK 1,922m). The
Group’s financial gearing was 1.3 (end of 2018: 1.1). The
effect of IFRS 16 was an increase of DKK 324m. Without
IFRS 16, the net debt would have been DKK 2,369m.
FINANCIAL POSITION
RETURN ON CAPITAL EMPLOYED
NET WORKING CAPITAL
NET INTEREST BEARING DEBT
8%
9%
10%
11%
12%
0
5,000
10,000
15,000
20,000
9M 2018 9M 2019
PercentageDKKm
Capital employed, average ROCE
3%
6%
9%
12%
15%
0
1,000
2,000
3,000
4,000
9M 2018 9M 2019
PercentageDKKm
Net working capital NWC as % of revenue
0
1,000
2,000
3,000
4,000
9M 2018 9M 2019
DKKm
Net interest-bearing debt

CONSOLIDATED CONDENSED INTERIM FINANCIAL STATEMENTS
27 Interim report Q3 2019
MANAGEMENT REVIEW FINANCIAL STATEMENTS
Notes DKKm 30/09 2019 31/12 2018 30/09 2018
ASSETS
Goodwill 4,398 4,238 4,235
Patents and rights 992 1,026 1,050
Customer relations 649 686 716
Other intangible assets 110 59 40
Completed development projects 196 249 239
Intangible assets under development 302 260 254
Intangible assets 6,647 6,518 6,534
Land and buildings 1,637 1,598 1,625
Plant and machinery 448 474 465
Operating equipment, fixtures and fittings 96 98 114
Tangible assets in course of construction 80 65 76
Property, plant and equipment 2,261 2,235 2,280
14 Lease assets 323 0 0
Deferred tax assets 1,198 1,174 1,101
Investments in associates 169 0 0
12 Other securities and investments 40 42 42
Other non-current assets 1,407 1,216 1,143
Non-current assets 10,638 9,969 9,957
Inventories 2,910 2,685 2,621
Trade receivables 4,586 4,586 3,869
10 Work in progress 2,674 2,252 2,074
Prepayments to subcontractors 446 318 230
Income tax receivables 240 233 608
Other receivables 873 825 762
Cash and cash equivalents 781 875 1,126
Current assets 12,510 11,774 11,290
Assets classified as held for sale 0 0 405
Total assets 23,148 21,743 21,652
Notes DKKm 30/09 2019 31/12 2018 30/09 2018
EQUITY AND LIABILITIES
Share capital 1,025 1,025 1,025
Foreign exchange adjustments (145) (454) (468)
Cash flow hedging (72) (53) (55)
Retained earnings 7,881 7,277 7,530
Proposed dividend 0 461 0
Shareholders in FLSmidth & Co. A/S 8,689 8,256 8,032
Minority interests 15 10 16
Equity 8,704 8,266 8,048
Deferred tax liabilities 327 313 370
Pension obligations 274 270 273
5 Provisions 471 499 286
14 Lease liabilities 208 0 0
Bank loans and mortgage debt 3,121 2,627 1,819
Prepayments from customers 252 207 213
Other liabilities 99 41 37
Non-current liabilities 4,752 3,957 2,998
Pension obligations 8 12 6
5 Provisions 541 780 702
14 Lease liabilities 116 0 0
Bank loans and mortgage debt 16 175 1,247
Prepayments from customers 1,606 1,595 1,509
10 Work in progress 1,643 1,453 1,808
Trade payables 3,819 3,322 2,695
Income tax liabilities 358 259 624
Other liabilities 1,585 1,924 1,577
Current liabilities 9,692 9,520 10,168
Liabilities associated with assets classified as held for sale
0 0 438
Total liabilities 14,444 13,477 13,604
Total equity and liabilities 23,148 21,743 21,652
BALANCE SHEET

CONSOLIDATED CONDENSED INTERIM FINANCIAL STATEMENTS
28 Interim report Q3 2019
MANAGEMENT REVIEW FINANCIAL STATEMENTS
Equity
Equity at the end of Q3 2019 increased to DKK 8,704m
(end of 2018: DKK 8,266m), impacted primarily by the
result for the period, dividend pay-out and currency
adjustments regarding foreign entities. Currency
adjustments derive mainly from developments in USD,
CAD, and INR.
Treasury shares
The holding of treasury shares was 1,207,586 shares at
the end of Q3 2019 (2018: 1,383,638 shares),
representing 2.4% of the total share capital (2018: 2.7%).
Treasury shares are used to hedge our share-based
incentive programmes.
Dividend
During Q2 2019 the dividend approved at the Annual
General Meeting was paid out with a net payout of DKK
450m.
EQUITY & VALUE
EQUITY DEVELOPMENT
EQUITY RATIO AND TARGET
DIVIDEND
0
2,500
5,000
7,500
10,000
9M 2018 9M 2019
DKKm
Equity
0%
25%
50%
75%
100%
9M 2018 9M 2019
Percentage
Equity ratio Target
2
4
6
8
10
0
250
500
750
1,000
9M 2018 9M 2019
DKKDKKm
Dividend paid to shareholders, continued activities
Proposed dividend per share

CONSOLIDATED CONDENSED INTERIM FINANCIAL STATEMENTS
29 Interim report Q3 2019
MANAGEMENT REVIEW FINANCIAL STATEMENTS
DKKm Share
capital
Currency adjust-ments
Cash flow hedging
Retained earnings
Proposed dividend
Share-holders in FLSmidth & Co A/S
Minority interests Total
Equity at 1 January 2019 1,025 (454) (53) 7,277 461 8,256 10 8,266
Comprehensive income for the period
Profit for the period 551 551 (2) 549
Other comprehensive income
Actuarial gains/(losses) on defined benefit plans (1) (1) (1)
Currency adjustments regarding translation of entities
309 309 309
Cash flow hedging:
- Value adjustments for the period (21) (21) (21)
- Value adjustments transferred to work in progress 2 2 2
Tax on other comprehensive income (6) (6) (6)
Other comprehensive income total 0 309 (19) (7) 0 283 0 283
Comprehensive income for the period 0 309 (19) 544 0 834 (2) 832
Dividend paid 11 (461) (450) (450)
Share-based payment 33 33 33
Exercise of share options 16 16 16
Addition of minority interests 0 7 7
Equity at 30 September 2019 1,025 (145) (72) 7,881 0 8,689 15 8,704
EQUITY STATEMENT

CONSOLIDATED CONDENSED INTERIM FINANCIAL STATEMENTS
30 Interim report Q3 2019
MANAGEMENT REVIEW FINANCIAL STATEMENTS
DKKm Share
capital
Currency adjust-ments
Cash flow hedging
Retained earnings
Proposed dividend
Share-holders in FLSmidth & Co A/S
Minority interests Total
Equity at 1 January 2018 1,025 (322) (33) 6,920 410 8,000 38 8,038
Changes in accounting policies, IFRS 15 9 9 9
Tax on changes in accounting policies, IFRS 15 (1) (1) (1)
Equity at 1 January 2018 (restated) 1,025 (322) (33) 6,928 410 8,008 38 8,046
Comprehensive income for the period
Profit for the period 463 463 3 466
Other comprehensive income
Actuarial gains/(losses) on defined benefit plans (1) (1) (1)
Currency adjustments regarding translation of entities
(146) (146) (1) (147)
Cash flow hedging:
- Value adjustments for the period (22) (22) (22)
- Value adjustments transferred to work in progress 0 0
Tax on other comprehensive income 14 14 14
Other comprehensive income total 0 (146) (22) 13 0 (155) (1) (156)
Comprehensive income for the period 0 (146) (22) 476 0 308 2 310
Dividend paid 13 (410) (397) (24) (421)
Share-based payment 31 31 31
Exercise of share options 124 124 124
Acquisition of treasury shares (42) (42) (42)
Equity at 30 September 2018 1,025 (468) (55) 7,530 0 8,032 16 8,048
EQUITY STATEMENT - continued
CONSOLIDATED CONDENSED INTERIM FINANCIAL STATEMENTS
31 Interim report Q3 2019
MANAGEMENT REVIEW FINANCIAL STATEMENTS
1. KEY ACCOUNTING ESTIMATES AND JUDGEMENTS
When preparing the financial statements we are required
to make several estimates and judgements. The
estimates and judgements that can have a significant
impact on the financial statements are categorised as key
accounting estimates and judgements. Key accounting
estimates and judgements are regularly assessed to
adapt to the market conditions and changes in political
and economic factors.
All key accounting estimates and judgements may have a
significant impact to the financial statements. For further
details, reference is made to The Annual Report 2018,
Key accounting estimates and judgements, page 75 and
to specific notes.
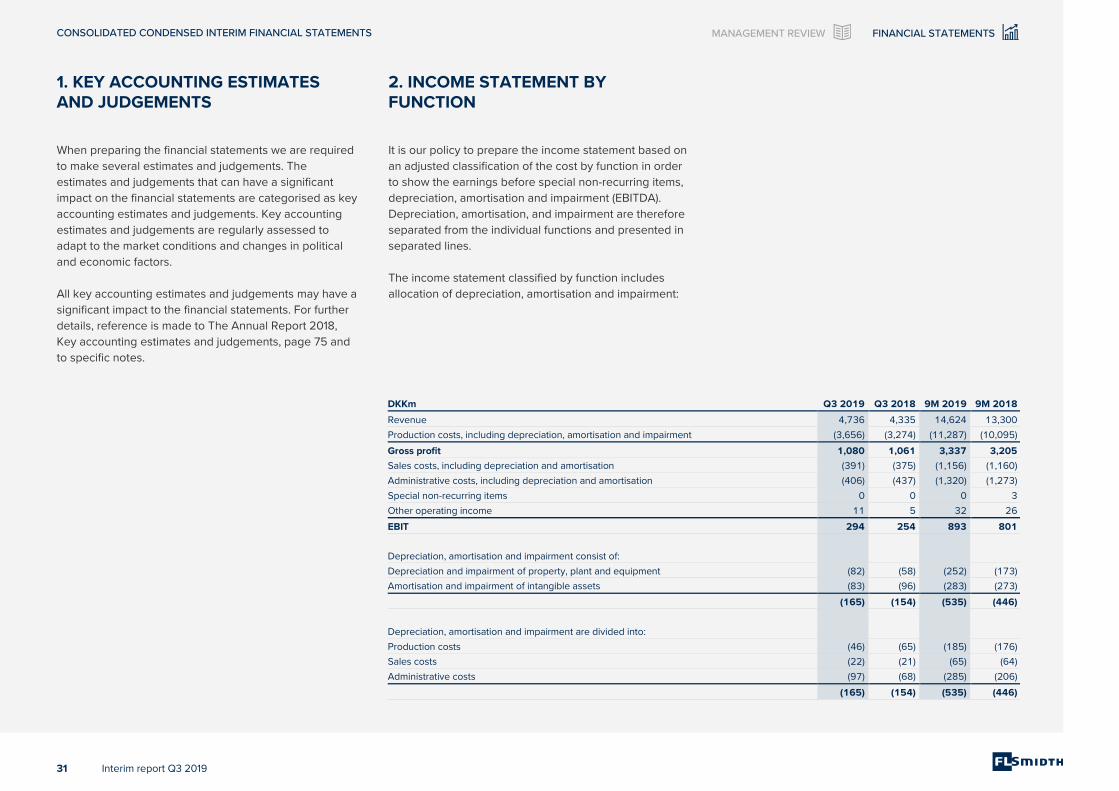
2. INCOME STATEMENT BY FUNCTION
It is our policy to prepare the income statement based on
an adjusted classification of the cost by function in order
to show the earnings before special non-recurring items,
depreciation, amortisation and impairment (EBITDA).
Depreciation, amortisation, and impairment are therefore
separated from the individual functions and presented in
separated lines.
The income statement classified by function includes
allocation of depreciation, amortisation and impairment:
DKKm Q3 2019 Q3 2018 9M 2019 9M 2018
Revenue 4,736 4,335 14,624 13,300
Production costs, including depreciation, amortisation and impairment (3,656) (3,274) (11,287) (10,095)
Gross profit 1,080 1,061 3,337 3,205
Sales costs, including depreciation and amortisation (391) (375) (1,156) (1,160)
Administrative costs, including depreciation and amortisation (406) (437) (1,320) (1,273)
Special non-recurring items 0 0 0 3
Other operating income 11 5 32 26
EBIT 294 254 893 801
Depreciation, amortisation and impairment consist of:
Depreciation and impairment of property, plant and equipment (82) (58) (252) (173)
Amortisation and impairment of intangible assets (83) (96) (283) (273)
(165) (154) (535) (446)
Depreciation, amortisation and impairment are divided into:
Production costs (46) (65) (185) (176)
Sales costs (22) (21) (65) (64)
Administrative costs (97) (68) (285) (206)
(165) (154) (535) (446)

NOTES TO THE INTERIM REPORT
32 Interim report Q3 2019
MANAGEMENT REVIEW FINANCIAL STATEMENTS
3. SEGMENT INFORMATION FOR 9M 2019
DKKm Mining Cement Shared costs¹⁾
Other compa-
nies ²⁾
Con-tinuing
activities
Discon-tinued
activities³⁾ FLSmidth
Group
External revenue 8,632 5,992 - - 14,624 0 14,624
Internal revenue 0 0 - 0 0 0 0
Revenue 8,632 5,992 - 0 14,624 0 14,624
Production costs (6,390) (4,654) (58) 0 (11,102) (4) (11,106)
Gross profit 2,242 1,338 (58) 0 3,522 (4) 3,518
SG&A costs (668) (472) (964) 10 (2,094) (12) (2,106)
EBITDA before special non-recurring items 1,574 866 (1,022) 10 1,428 (16) 1,412
Special non-recurring items 0 0 - 0 0 - 0
Depreciation and impairment of property, plant and equipment (128) (49) (75) 0 (252) - (252)
EBITA before allocation of shared costs 1,446 817 (1,097) 10 1,176 (16) 1,160
Allocation of shared costs (603) (494) 1,097 0 0 - 0
EBITA 843 323 0 10 1,176 (16) 1,160
Amortisation and impairment of intangible assets (194) (89) - - (283) - (283)
EBIT 649 234 - 10 893 (16) 877
Order intake (gross) 9,231 5,934 0 15,165 0 15,165
Order backlog 8,544 7,544 0 16,088 110 16,198
Gross margin 26.0% 22.3% N/A 24.1% N/A 24.1%
EBITDA margin before special non-recurring items 18.2% 14.5% N/A 9.8% N/A 9.7%
EBITA margin before allocation of shared costs 16.8% 13.6% N/A - N/A -
EBITA margin 9.8% 5.4% N/A 8.0% N/A 7.9%
EBIT margin 7.5% 3.9% N/A 6.1% N/A 6.0%
Number of employees at 30 September 2019 5,250 5,116 1,490 11,856 3 11,859
Reconciliation of profit/(loss) for the period
EBIT 893 (16) 877
Income from associates 2 0 2
Financial income 732 3 735
Financial costs (779) (10) (789)
EBT 848 (23) 825
1) Shared costs consists of costs that are managed on Region or Group level and subsequently allocated to the divisions.
2) Other companies consist of companies with no activity, real estate companies, eliminations and the parent company.
3) Discontinued activities mainly consist of bulk material handling.
Notes to the Interim report
NOTES TO THE INTERIM REPORT
33 Interim report Q3 2019
MANAGEMENT REVIEW FINANCIAL STATEMENTS
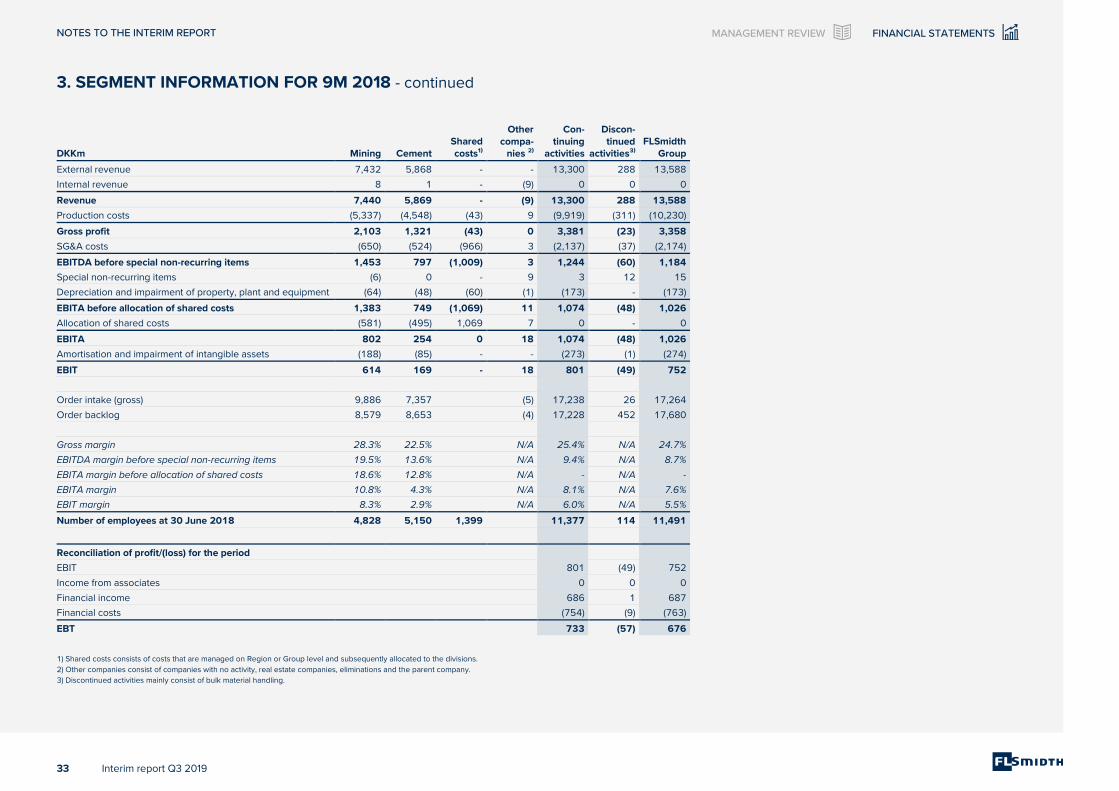
3. SEGMENT INFORMATION FOR 9M 2018 - continued
DKKm Mining Cement Shared costs¹⁾
Other compa-
nies ²⁾
Con-tinuing
activities
Discon-tinued
activities³⁾ FLSmidth
Group
External revenue 7,432 5,868 - - 13,300 288 13,588
Internal revenue 8 1 - (9) 0 0 0
Revenue 7,440 5,869 - (9) 13,300 288 13,588
Production costs (5,337) (4,548) (43) 9 (9,919) (311) (10,230)
Gross profit 2,103 1,321 (43) 0 3,381 (23) 3,358
SG&A costs (650) (524) (966) 3 (2,137) (37) (2,174)
EBITDA before special non-recurring items 1,453 797 (1,009) 3 1,244 (60) 1,184
Special non-recurring items (6) 0 - 9 3 12 15
Depreciation and impairment of property, plant and equipment (64) (48) (60) (1) (173) - (173)
EBITA before allocation of shared costs 1,383 749 (1,069) 11 1,074 (48) 1,026
Allocation of shared costs (581) (495) 1,069 7 0 - 0
EBITA 802 254 0 18 1,074 (48) 1,026
Amortisation and impairment of intangible assets (188) (85) - - (273) (1) (274)
EBIT 614 169 - 18 801 (49) 752
Order intake (gross) 9,886 7,357 (5) 17,238 26 17,264
Order backlog 8,579 8,653 (4) 17,228 452 17,680
Gross margin 28.3% 22.5% N/A 25.4% N/A 24.7%
EBITDA margin before special non-recurring items 19.5% 13.6% N/A 9.4% N/A 8.7%
EBITA margin before allocation of shared costs 18.6% 12.8% N/A - N/A -
EBITA margin 10.8% 4.3% N/A 8.1% N/A 7.6%
EBIT margin 8.3% 2.9% N/A 6.0% N/A 5.5%
Number of employees at 30 June 2018 4,828 5,150 1,399 11,377 114 11,491
Reconciliation of profit/(loss) for the period
EBIT 801 (49) 752
Income from associates 0 0 0
Financial income 686 1 687
Financial costs (754) (9) (763)
EBT 733 (57) 676
1) Shared costs consists of costs that are managed on Region or Group level and subsequently allocated to the divisions.
2) Other companies consist of companies with no activity, real estate companies, eliminations and the parent company.
3) Discontinued activities mainly consist of bulk material handling.

NOTES TO THE INTERIM REPORT
34 Interim report Q3 2019
MANAGEMENT REVIEW FINANCIAL STATEMENTS
4. REVENUE
Revenue arises from sale of life-cycle offerings to our
customers. We sell a broad range of goods and services
within the Mining and Cement Industries split into the
main categories projects, products and services.
DKKm 9M 2019 9M 2018
Point in time 6,454 7,239
Percentage of completion 8,112 6,061
Cash 58 0
Total revenue 14,624 13,300
Seven Regions support the sales within the Mining and
Cement Industries. Below, revenue is presented in the
Regions in which delivery takes place.
9M 2019
DKKm Mining Cement Group
Projects 2,301 2,472 4,773
Products 885 1,055 1,940
Capital business 3,186 3,527 6,713
Service business 5,446 2,465 7,911
Total revenue 8,632 5,992 14,624
9M 2018
DKKm Mining Cement Group
Projects 1,579 2,528 4,107
Products 676 922 1,598
Capital business 2,255 3,450 5,705
Service business 5,177 2,418 7,595
Total revenue 7,432 5,868 13,300
5. PROVISIONS
DKKm 30/09 2019
31/12 2018
30/09 2018
Provisions at 1 January 1,279 1,430 1,430
Foreign exchange adjustments 22 4 (3)
Disposal of Group enterprises 0 (2) (2)
Additions 247 684 319
Used (406) (560) (468)
Reversals (130) (486) (234)
Reclassification to/from other liabilities
0 (109) (54)
Transfer from assets held for sale 0 318 0
Provisions 1,012 1,279 988
The split of provisions is as follows:
Warranties 573 628 719
Restructuring 29 59 39
Other provisions 410 592 230
1,012 1,279 988
The maturity of provisions is specified as follows:
Current liabilities 541 780 702
Non-current liabilities 471 499 286
1,012 1,279 988
Used provisions amounted to DKK 406m in 9M 2019, a
decrease of DKK 62m from 9M 2018. Provisions used in
9M 2019 related to discontinued activities amounted to
DKK 79m (9M 2018: DKK 251m). Refer to note 8 for a
further description. The remainder of the used provisions
were mainly to cover our warranty obligations, loss-
making projects and settlement of a tax claim.
REVENUE SPLIT BY REGIONS (9M 2019)
REVENUE SPLIT BY REGIONS (9M 2018)
21%
22%
19%
11%
7%
13%
7%
North AmericaSouth AmericaEurope, North Africa, RussiaSub-Saharan Africa and Middle EastAsiaSubcontinental IndiaAustralia
22%
18%
21%
15%
7%
10%
7%
North AmericaSouth AmericaEurope, North Africa, RussiaSub-Saharan Africa and Middle EastAsiaSubcontinental IndiaAustralia

NOTES TO THE INTERIM REPORT
35 Interim report Q3 2019
MANAGEMENT REVIEW FINANCIAL STATEMENTS
5. PROVISIONS –
continued
Continued activities’ share of Group provisions is shown
below. The provisions from continued and discontinued
activities add up to our total provisions. As provisions
associated with assets classified as held for sale are
reported as liabilities associated with assets classified as
held for sale in 9M 2018, provisions from continued and
discontinued activities do not add up to the provisions
presented in the balance sheet and thereby the
provisions specified on prior page.
Continued activities’ share of Group provisions:
DKKm 30/09 2019
31/12 2018
30/09 2018
Provisions at 1 January 961 1,163 1,163
Foreign exchange adjustments 22 0 (4)
Additions 247 685 319
Used (327) (315) (224)
Reversals (130) (463) (234)
Reclassification to/from other liabilities
0 (109) (54)
Provisions 773 961 966
6. CONTINGENT LIABILITIES
Contingent liabilities at 30 September 2019 amounted to
DKK 2.9bn (31 December 2018: DKK 2.8bn), which
primarily include performance bonds, payment
guarantees and bid bonds at DKK 2.6bn (31 December
2018: DKK 2.5bn) issued to cover project-related risks.
See note 2.7 in the Annual Report 2018 for a description
of the nature of the Group's contingent liabilities.
7. BUSINESS ACQUISITIONS
In February 2019, FLSmidth reached an agreement to
acquire IMP Automation Group, subject to certain
conditions. The acquisition closed at 31 May 2019. IMP
Automation Group (IMP) is the established global leader
in automated laboratory solutions for the mining industry.
The acquisition enables FLSmidth to support the
expanding market for automated laboratories, and
supports the increased focus on productivity, automation
and digitalisation. The acquisition strongly complements
the products FLSmidth offers for quality control and
optimisation of the mining process.
Following the closing of the IMP acquisition, FLSmidth is
working on realising the synergies between the digital
initiatives of FLSmidth and IMP’s automated solutions to
further enhance processing optimisation and ultimately
provide greater value to customers.
In March 2019, FLSmidth reached an agreement to
acquire the hydrometallurgical and mineral processing
capabilities of AuTec Innovative Extractive Solutions Ltd.
(AuTec). This allows FLSmidth to become a world leader
in providing comprehensive refractory gold testwork,
strengthening the ability to be close to key gold clients
globally on projects from scoping stages through to
offering plant support and optimisation.

NOTES TO THE INTERIM REPORT
36 Interim report Q3 2019
MANAGEMENT REVIEW FINANCIAL STATEMENTS
7. BUSINESS ACQUISITIONS –
continued
Name of activity acquired
Primary activity
Date of acqui-sition/
consoli-dated from
Owner-ship
interest Voting share
IMP Automation Group
Mining 01-Jun 100% 100%
AuTec Mining 01-Mar Asset deal Asset deal
The IMP business has been integrated into the Mining
segment and is included in the consolidated financial
statement from 1 June – 30 September 2019:
DKKm 9M 2019
Revenue 45
Profit for the period 0
Headcount 136
Acquisition related costs amounted to DKK 1m and are
recognised in the income statement as administrative
cost.
Had the acquired activities been included in the
consolidated financial statements from 1 January 2019,
the revenue and net profit would have been positively
impacted by DKK 92m and 12m, respectively.
Consolidated Group revenue and net profit for the first
nine months of 2019 would have been DKK 14,716m and
DKK 561m.
The assets and liabilities in the opening balance are
measured using the information available at the date for
issuing the interim report. The purchase price allocations
have not been finalised. If new information becomes
available this could affect the calculated values.
DKKm
IMP Auto-mation Group AuTec 9M 2019
Property, plant and equipment 8 5 13
Patens and rights acquired 34 0 34
Customer relations 33 0 33
Other intangible assets 7 0 7
Investment in associate 173 0 173
Inventories 31 0 31
Trade receivables 34 0 34
Prepayments to subcontractors 23 0 23
Other accounts receivables 4 0 4
Cash and cash equivalents 39 0 39
Trade payables (5) 0 (5)
Prepayments from customers (25) 0 (25)
Other liabilities (17) 0 (17)
Carrying amount of net assets acquired
339 5 344
Goodwill 33 1 34
Transaction price, cash effect 372 6 378
Cash and cash equivalents acquired
(39) 0 (39)
Deferred payment, payable (34) 0 (34)
Net cash effect 299 6 305
8. DISCONTINUED ACTIVITIES
On 9 January 2019, FLSmidth announced an agreement
to sell its non-mining bulk material handling business.
The transaction was subject to various conditions that
have subsequently been met. As a consequence the
agreement closed and became effective 31 January 2019.
As mentioned in the Annual Report 2018 the transaction
included transfer of employees, brand, IPR (Intellectual
Property Rights) and order pipeline to Rainbow Heavy
Machineries. All employee obligations were settled
before closing date. Transferred brands and IPR were
included at 31 December 2018 in assets held for sale at
zero value due to write downs in 2015. The sales value
was DKK 0m, meaning there was no gain or loss from the
sale.
Under the sales agreement we retain the responsibility to
finalise legacy projects. The projects were from revenue
perspective completed at year end 2018. Based on
subsequent handling of claims and collection activities
projects are however expected to be finalised during
2019-2020. The future cash outflow from discontinued
activities is expected to be around DKK 30m from
payments related to provisions, settlement of net working
capital and moderate SG&A cost. The expectations are
based on a net working capital balance of DKK 232m,
provisions of DKK 239m and moderate SG&A cost. There
can be a timing difference between cash paid and cash
received.
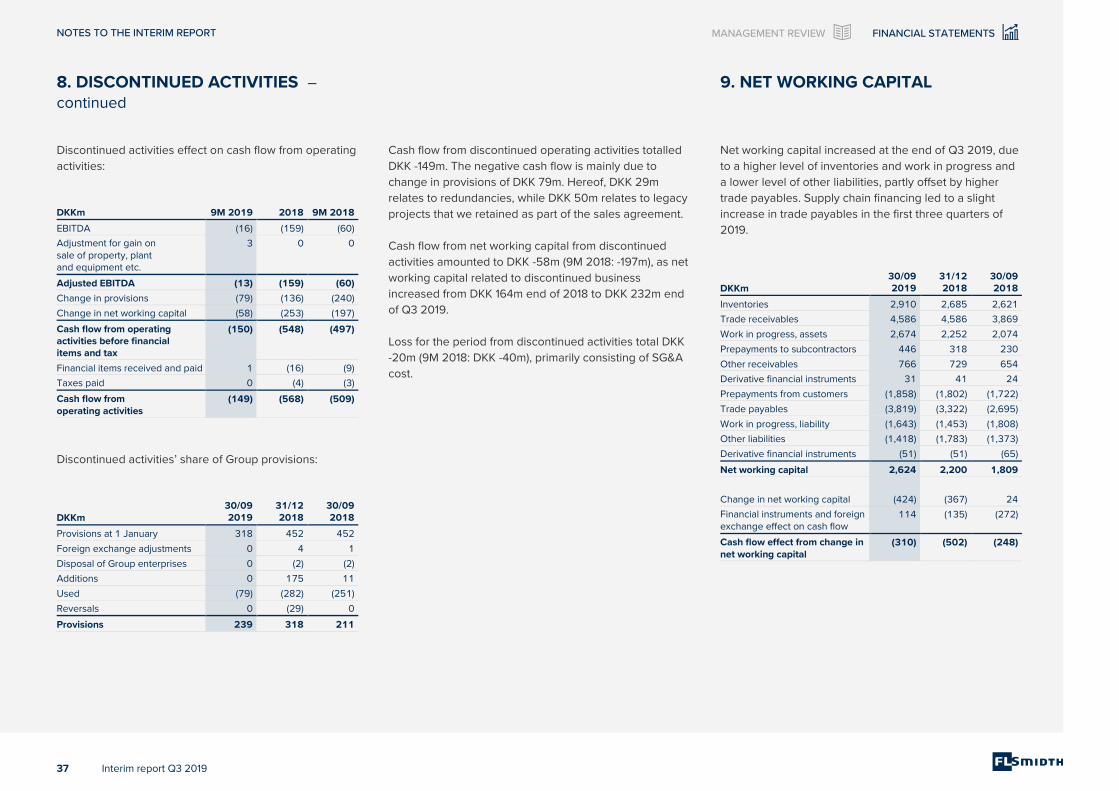
NOTES TO THE INTERIM REPORT
37 Interim report Q3 2019
MANAGEMENT REVIEW FINANCIAL STATEMENTS
8. DISCONTINUED ACTIVITIES –
continued
Discontinued activities effect on cash flow from operating
activities:
DKKm 9M 2019 2018 9M 2018
EBITDA (16) (159) (60)
Adjustment for gain on sale of property, plant and equipment etc.
3 0 0
Adjusted EBITDA (13) (159) (60)
Change in provisions (79) (136) (240)
Change in net working capital (58) (253) (197)
Cash flow from operating activities before financial items and tax
(150) (548) (497)
Financial items received and paid 1 (16) (9)
Taxes paid 0 (4) (3)
Cash flow from operating activities
(149) (568) (509)
Discontinued activities’ share of Group provisions:
DKKm 30/09 2019
31/12 2018
30/09 2018
Provisions at 1 January 318 452 452
Foreign exchange adjustments 0 4 1
Disposal of Group enterprises 0 (2) (2)
Additions 0 175 11
Used (79) (282) (251)
Reversals 0 (29) 0
Provisions 239 318 211
Cash flow from discontinued operating activities totalled
DKK -149m. The negative cash flow is mainly due to
change in provisions of DKK 79m. Hereof, DKK 29m
relates to redundancies, while DKK 50m relates to legacy
projects that we retained as part of the sales agreement.
Cash flow from net working capital from discontinued
activities amounted to DKK -58m (9M 2018: -197m), as net
working capital related to discontinued business
increased from DKK 164m end of 2018 to DKK 232m end
of Q3 2019.
Loss for the period from discontinued activities total DKK
-20m (9M 2018: DKK -40m), primarily consisting of SG&A
cost.
9. NET WORKING CAPITAL
Net working capital increased at the end of Q3 2019, due
to a higher level of inventories and work in progress and
a lower level of other liabilities, partly offset by higher
trade payables. Supply chain financing led to a slight
increase in trade payables in the first three quarters of
2019.
DKKm 30/09 2019
31/12 2018
30/09 2018
Inventories 2,910 2,685 2,621
Trade receivables 4,586 4,586 3,869
Work in progress, assets 2,674 2,252 2,074
Prepayments to subcontractors 446 318 230
Other receivables 766 729 654
Derivative financial instruments 31 41 24
Prepayments from customers (1,858) (1,802) (1,722)
Trade payables (3,819) (3,322) (2,695)
Work in progress, liability (1,643) (1,453) (1,808)
Other liabilities (1,418) (1,783) (1,373)
Derivative financial instruments (51) (51) (65)
Net working capital 2,624 2,200 1,809
Change in net working capital (424) (367) 24
Financial instruments and foreign exchange effect on cash flow
114 (135) (272)
Cash flow effect from change in net working capital
(310) (502) (248)

NOTES TO THE INTERIM REPORT
38 Interim report Q3 2019
MANAGEMENT REVIEW FINANCIAL STATEMENTS
10. WORK IN PROGRESS
DKKm 30/09 2019
31/12 2018
30/09 2018
Total costs incurred 28,269 24,690 19,469
Profit recognised as income, net 2,429 2,145 2,729
Work in progress 30,698 26,835 22,198
Invoicing on account to customers
(29,667) (26,036) (21,932)
Net work in progress 1,031 799 266
Of which is recognised as work in progress:
Under assets 2,674 2,252 2,074
Under liabilities (1,643) (1,453) (1,808)
Net work in progress 1,031 799 266
11. EARNINGS PER SHARE (EPS)
DKKm Q3 2019 Q3 2018 9M 2019 9M 2018
Profit for the year, continuing activities 190 171 569 506
Minority interests 1 (2) 2 (3)
FLSmidth's share of profit, continuing activities 191 169 571 503
Loss for the year, discontinued activities 0 (9) (20) (40)
FLSmidth's share of loss, discontinuing activities 0 (9) (20) (40)
FLSmidth's share of profit 191 160 551 463
Number of shares (1,000) Q3 2019 Q3 2018 9M 2019 9M 2018
Average number of outstanding shares 50,027 49,824 49,942 49,638
Dilutive effect of share options in the money 128 360 128 360
Average diluted number of outstanding shares 50,155 50,184 50,070 49,998
DKK Q3 2019 Q3 2018 9M 2019 9M 2018
Earnings per share from continuing activities 3.8 3.4 11.4 10.1
Earnings per share from discontinued activities 0.0 (0.2) (0.4) (0.8)
Earnings per share from continuing and discontinued activities 3.8 3.2 11.0 9.3
DKK Q3 2019 Q3 2018 9M 2019 9M 2018
Diluted earnings per share from continuing activities 3.8 3.4 11.4 10.1
Diluted earnings per share from discontinued activities 0.0 (0.2) (0.4) (0.8)
Diluted earnings per share from continuing and discontinued activities 3.8 3.2 11.0 9.3

NOTES TO THE INTERIM REPORT
39 Interim report Q3 2019
MANAGEMENT REVIEW FINANCIAL STATEMENTS
12. FAIR VALUE MEASUREMENT
9M 2019
DKKm Level 1 Level 2 Level 3 Total
Securities and investments
5 35 40
Hedging instruments asset
31 31
Hedging instruments liability
(51) (51)
5 (20) 35 20
9M 2018
DKKm Level 1 Level 2 Level 3 Total
Securities and investments
9 33 42
Hedging instruments asset
24 24
Hedging instruments liability
(64) (64)
9 (40) 33 2
Financial instruments measured at fair value are
measured on a recurring basis and categorised into
the following levels of the fair value hierarchy:
■ Level 1: Observable market prices for identical
instruments ■ Level 2: Valuation techniques primarily based on
observable prices or traded prices for comparable
instruments ■ Level 3: Valuation techniques primarily based on
unobservable prices
Securities and investments measured at fair value
through profit/loss are either measured at quoted prices
in an active market for the same type of instrument
(level 1) or at fair value based on available data (level 3).
Hedging instruments are not traded on an active market
based on quoted prices. Measured instead using a
valuation technique, where all significant inputs are
based on observable market data; such as exchange
rates, interest rates, credit risk and volatilities (level 2).
There have been no significant transfers between the
levels in 9M 2019 and 9M 2018.
13. EVENTS AFTER THE BALANCE SHEET DATE
We are not aware of any subsequent matters that could
be of material importance to the Group’s financial
position.

NOTES TO THE INTERIM REPORT
40 Interim report Q3 2019
MANAGEMENT REVIEW FINANCIAL STATEMENTS
14. ACCOUNTING POLICIES
The condensed interim report of the Group for the first
three quarters of 2019 is presented in accordance with
IAS 34, Interim Financial Reporting, as approved by the
EU and additional Danish disclosure requirements
regarding interim reporting by listed companies.
Apart from the below mentioned changes, the accounting
policies are unchanged from those applied in the 2018
Annual Report. Reference is made to note 7.5,
Accounting policies, note 7.6, Impact from new IFRS, note
7.7, New IFRS not yet adopted and to specific notes in
the 2018 Annual Report for further details.
CHANGES IN ACCOUNTING POLICIES As of 30 September 2019, the FLSmidth Group has
implemented all new or amended accounting standards
and interpretations as adopted by the EU and applicable
for the 2019 financial year, including the following
accounting standards, which are the most relevant for
FLSmidth:
■ IFRS 16, Leases (issued 2016) ■ IFRIC 23, Uncertainty over income tax treatment (issued
2017)
Effect from implementing IFRS 16, Leases
IFRS 16 has replaced IAS 17, Leases and IFRS 16 has
introduced a changed accounting model for a lessee.
Previously, lease contracts for a lessee were classified as
either operating or finance leases. IFRS 16 requires the
majority of operating leases to be recognised as lease
assets with a related lease liability, similar to the previous
accounting of finance leases. The lease payments,
previously accounted for as operating expenses, have
been split into an interest cost and a repayment of the
lease liability. The lease assets are depreciated over the
term of the lease contract.
We have implemented IFRS 16 using the modified
retrospective application, with a lease asset value equal
to the lease liability value upon transition. Consequently,
2018 comparative figures are reported according to IAS
17 and have not be restated to reflect the numbers
according to IFRS 16. This applies to all numbers prior to 1
January 2019 in text and tables, throughout the entire
report.
Upon implementation, we have applied the following
exemptions:
■ Exclusion of low value assets and lease contracts with a
contract term of 12 months or less. ■ No reassessment of whether a contract is or contains a
lease. ■ A single discount rate has been applied to a portfolio of
leases with reasonable similar characteristics. ■ Initial direct costs have been excluded from the
measurement of the right-of-use asset. ■ Use of hindsight, to determine the lease term, if a
contract contains options to extend or terminate the
contract.
When assessing the future lease payments, we have
included the payments, which are fixed or variable,
dependent on an index or a rate. Service components
are excluded from the lease liability.
When assessing the lease term, any extension or
termination options have been included in the
assessment to determine the lease term. The options are
included in determining the lease term, if exercise is
reasonably certain.
When determining the discount rates used to calculate
the net present value of future lease payments, we have
used an incremental country specific borrowing rate,
based on a government bond plus the Group’s credit
margin.
Upon implementation 1 January 2019, we have
recognised a right of use asset of DKK 317m and a lease
liability of DKK 317m. The implementation has no effect
on equity. The right of use assets relate primarily to land
and buildings with depreciation periods ranging from 1 to
9 years with a weighted average lease term of 5 years.
The weighted average discount rate applied for land and
buildings is 3.66%.

NOTES TO THE INTERIM REPORT
41 Interim report Q3 2019
MANAGEMENT REVIEW FINANCIAL STATEMENTS
14. ACCOUNTING POLICIES - continued
DKKm Opening balance
Rent and lease obligations not recognised as liabilities 31 December 2018 (IAS 17)
315
Discounting effect with alternative borrowing rate 1 January 2019
(26)
Applied implementation options:
Short term and low value leases (7)
Included lease option terms with a highly probable extension
35
Lease liabilities recognised 1 January 2019 (IFRS 16)
317
Had the Group applied the previous accounting policy for
leases according to IAS 17 in the first three quarters of
2019, the earnings before tax (EBT) for the period would
have been DKK 849m, an increase of DKK 1m compared
to the actual numbers for the first three quarters of 2019.
Implementation of IFRS 16 has no effect on the
underlying cash flows. However, due to the lease
payments being split into interest costs and a repayment
of the lease liability, the presentation in the cash flow
statement has changed. The change has improved the
cash flow from operating activities as well as free cash
flow by DKK 78m whereas the cash outflow from
financing activities has been negatively impacted by DKK
78m.
Lessor accounting under IFRS 16 is mostly unchanged
from previous accounting under IAS 17, where lessors
continue to classify all leases as either operating or
finance leases. We have no material lessor contracts and
have therefore seen no material effect.
DKKm 9M 2019
IFRS 16 IFRS 16
Effect 9M 2019
IAS 17
Gross profit 3,522 29 3,493
SG&A (2,094) 57 (2,151)
EBITDA 1,428 86 1,342
Depreciation and impairment of property, plant and equipment
(252) (79) (173)
EBITA 1,176 7 1,169
EBIT 893 7 886
EBT 848 (1) 849
CFFO 621 78 543
Free cash flow 52 78 (26)
CFFF (163) (78) (85)
Total assets 23,148 323 22,825
Total liabilities (14,444) (324) (14,120)
NIBD 2,693 324 2,369
DKKm Q3 2019
IFRS 16 IFRS 16
Effect Q3 2019
IAS 17
Gross profit 1,126 11 1,115
SG&A (667) 22 (689)
EBITDA 459 33 426
Depreciation and impairment of property, plant and equipment
(82) (28) (54)
EBITA 377 5 372
EBIT 294 5 289
EBT 284 2 282
CFFO 244 30 214
Free cash flow 133 30 103
CFFF (115) (30) (85)
Effect from implementing IFRIC 23, Uncertainty over
income tax treatment
The interpretation addresses the accounting for income
taxes when tax treatments involve uncertainty that affects
the application of IAS 12. It does not apply to taxes or
levies outside the scope of IAS 12, nor does it specifically
include requirements relating to interest and penalties
associated with uncertain tax treatments.
We have established the necessary processes and
procedures to obtain information that is required to apply
the interpretation.
The implementation has had no significant impact on the
financial statements.

STATEMENT BY MANAGEMENT
42 Interim report Q3 2019
MANAGEMENT REVIEW FINANCIAL STATEMENTS
The Board of Directors and Executive Management have
today considered and approved the consolidated
condensed interim financial statements for the period 1
January – 30 September 2019.
The consolidated condensed interim financial statements
are presented in accordance with IAS 34, Interim
Financial Reporting, as adopted by the EU and Danish
disclosure requirements for interim reports of listed
companies. The consolidated condensed interim financial
statements have not been audited or reviewed by the
Group´s independent auditors.
In our opinion, the consolidated condensed interim
financial statements give a true and fair view of the
Group’s financial position at 30 September 2019 as well
as of the results of its operations and cash flows for the
period 1 January – 30 September 2019.
In our opinion, the management review gives a fair
review of the development in the Group’s activity and
financial matters, results of operations, cash flows and
financial position as well as a description of the principal
risks and uncertainties that the Group faces.
Valby, 29 October 2019
EXECUTIVE MANAGEMENT
Thomas Schulz
Group CEO
Lars Vestergaard
Group Executive Vice President and CFO
BOARD OF DIRECTORS
Vagn Sørensen
Chairman
Tom Knutzen
Vice Chairman
Gillian Dawn Winckler
Thrasyvoulos Moraitis
Richard Robinson Smith
Anne Louise Eberhard
Mette Dobel
Søren Dickow Quistgaard
Claus Østergaard
STATEMENT BY MANAGEMENT
Statement by Management
STATEMENT BY MANAGEMENT
43 Interim report Q3 2019
MANAGEMENT REVIEW FINANCIAL STATEMENTS
FORWARD-LOOKING STATEMENTS FLSmidth & Co. A/S’ financial reports, whether in the form
of annual reports or interim reports, filed with the Danish
Business Authority and/or announced via the company’s
website and/or NASDAQ Copenhagen, as well as any
presentations based on such financial reports, and any
other written information released, or oral statements
made, to the public based on this report or in the future
on behalf of FLSmidth & Co. A/S, may contain forward
looking statements.
Words such as ‘believe’, ‘expect’, ‘may’, ‘will’, ‘plan’,
‘strategy’, ‘prospect’, ‘foresee’, ‘estimate’, ‘project’,
‘anticipate’, ‘can’, ‘intend’, ‘target’ and other words and
terms of similar meaning in connection with any
discussion of future operating or financial performance
identify forward-looking statements. Examples of such
forward-looking statements include, but are not limited
to:
■ Statements of plans, objectives or goals for future
operations, including those related to FLSmidth & Co.
A/S’ markets, products, product research and product
development. ■ Statements containing projections of or targets for
revenues, profit (or loss), capital expenditures,
dividends, capital structure or other net financial items. ■ Statements regarding future economic performance,
future actions and outcome of contingencies such as
legal proceedings and statements regarding the
underlying assumptions or relating to such statements. ■ Statements regarding potential merger & acquisition
activities.
These forward-looking statements are based on current
plans, estimates and projections. By their very nature,
forward-looking statements involve inherent risks and
uncertainties, both general and specific, which may be
outside FLSmidth & Co. A/S’ influence, and which could
materially affect such forward-looking statements.
FLSmidth & Co. A/S cautions that a number of important
factors, including those described in this report, could
cause actual results to differ materially from those
contemplated in any forward-looking statements.
Factors that may affect future results include, but are not
limited to, global as well as local political and economic
conditions, including interest rate and exchange rate
fluctuations, delays or faults in project execution,
fluctuations in raw material prices, delays in research
and/or development of new products or service
concepts, interruptions of supplies and production,
unexpected breach or termination of contracts, market-
driven price reductions for FLSmidth & Co. A/S’ products
and/or services, introduction of competing products,
reliance on information technology, FLSmidth & Co. A/S’
ability to successfully market current and new products,
exposure to product liability and legal proceedings and
investigations, changes in legislation or regulation and
interpretation thereof, intellectual property protection,
perceived or actual failure to adhere to ethical marketing
practices, investments in and divestitures of domestic
and foreign enterprises, unexpected growth in costs and
expenses, failure to recruit and retain the right
employees and failure to maintain a culture of
compliance. Unless required by law FLSmidth & Co. A/S
is under no duty and undertakes no obligation to update
or revise any forward-looking statement after the
distribution of this report.

FLSmidth & Co. A/SVigerslev Allé 77DK-2500 ValbyDenmarkTel.: +45 36 18 18 00Fax: +45 36 44 11 [email protected] No. 58180912
Interim Report1 January – 30 September