Embed Size (px)
Citation preview

Result before tax, Q2: SEK 44.0 (42.1) million 6 months: SEK 72.2 (52.3) million
EBITDA, Q2: SEK 99.5 (86.5) million 6 months: SEK 181.7 (138.2) million
Average income for product tankers (spot), Q2: USD 21,800 (10,700) per day 6 months: USD 20,900 (13,300) per day
INTERIM REPORT 1 January–30 June 2015
Q2 (Apr–Jun) 6 months (Jan–Jun) Full year
2015 2014 2015 2014 2014
Total income, SEK million 204.3 166.2 382.8 301.4 531.2EBITDA, SEK million 99.5 86.5 181.7 138.2 201.0EBITDA, USD million 11.8 13.2 21.7 21.2 29.3Operating result, SEK million 52.3 52.2 91.4 68.1 56.4Result after tax, SEK million 44.0 40.1 72.2 52.3 8.7Equity ratio, % 42 44 42 44 42Growth in equity, % –2 8 10 8 22Return on equity, % 2 2 2 2 1Available liquid funds, including unutilised credit facilities, SEK million 229.5 362.0 229.5 362.0 233.5Result per share after tax, SEK 0.92 0.84 1.51 1.10 0.18Equity per share, SEK 36.30 29.26 36.30 29.26 32.99
AFTER THE END OF THE REPORTING PERIOD At the end of July, the Company took delivery of
another chartered suezmax tanker. The charter period is for one year, with an option for another year. Concordia Maritime’s position in the vessel corresponds to a 50 percent share.
Key ratios

2
The seasonal decline that usually characterises the tanker market in the second quarter did not materialise this year and the market remained strong instead. Among the main drivers was the low price of oil, which continued to drive demand for oil and oil products. It is worth noting in this context that a large proportion of the oil appears to be being consumed more or less immediately, i.e. not everything is going to storage. This reduces the risk of a sudden and sharp rebound in demand, which might otherwise occur when the oil industry takes oil from storage rather than importing it.
Turning to our own operations, we have continued to arrange the fleet using the strategy we are now working from. Looking at the product tanker segment, over the last year we have put a lot of effort into analysing the market and then concentrating employment on trades and cargo systems where the P-MAX tankers’ unique properties come into their own – trades with specific requirements and condi-tions. This has been a successful process and it is very encouraging to note that we had essentially all the vessels in the P-MAX fleet employed in this type kind of “niche trade” during the quarter. Three of the six vessels carrying lighter oil products were employed for transportation to and from Australia and New Zealand, with the other three employed between Europe and West Africa. In both cases, the utilisation rate in terms of the vessels’ carrying capacity was high, at between 90 and 100 percent. In a market where small differences in the utilisation rate make a big difference in income, this is a positive factor.
At the beginning of the quarter, we took delivery of Stena Image, the first of two IMOIIMAX vessels on order. With them, we are
taking the next step in the evolution of our fleet. The vessels in the IMOIIMAX series represent the next generation of chemical and product tankers and set a new standard in terms of both bunker con-sumption and load efficiency. The maiden voyagewas from the Far East to Europe with vegetable oil in the tanks. Since delivery, the ves-sel has been very well received by the market and customers. She is being employed according to plan and has already started to deliver a profit. We are now very much looking forward to delivery of the sis-ter vessel Stena Important. The vessel, which will also be employed within Stena Weco’s pool, is scheduled for delivery in October.
After the end of the period, in late July, we expanded our fleet with another chartered suezmax tanker. The charter period is for one year, with an option for a further year. As with the existing chartered suez-max tanker, our position in the vessel corresponds to a 50 percent share. The transaction strengthens our presence in the interesting crude oil segment. The segment has performed strongly in the first half of 2015 and we expect the market to remain good in the period ahead.
Outlook for the second half of 2015For the remainder of 2015, we expect a continuing robust market. It is likely that there will be some dips, but we do not think they will be as deep and prolonged as in recent years. Our view of the future is therefore the same as before – with generally better markets, a higher proportion of niche trades and more vessels in the fleet, conditions for increased earning capacity are good.
Kim UllmanCEO
PRESIDENT’S OVERVIEW
Strong quarter, strong market, good positionsSuccessful fleet dispositions combined with a continuing strong market situation brought a stable second quarter for Concordia Maritime. Overall, we are able to report a profit before tax for the quarter of SEK 44.0 (42.1 – of which vessel sales generated 80) million. Operating cash flow (EBITDA) was SEK 99.5 (86.5 – of which vessel sales generated 80) million, corresponding to USD 11.8 (13.2, of which vessel sales generated 12.2) million.

3
Business activities
The product tanker fleetThe ten 65,200 dwt P-MAX tankers are the backbone of Concordia Maritime’s fleet. During the period, eight of the vessels were employed in the spot market through agreements with Stena Bulk, Stena Weco and ExxonMobil. Stena Perros and Stena President were employed on time charters with Stena Bulk during the quarter. The contract runs until the end of December 2015. At the beginning of the second quarter, the Company took delivery of the first of two IMOIIMAX vessels on order, Stena Image. She is now employed via the cooperation with Stena Weco and performed entirely according to plan during the period.
Average income for the entire product tanker fleet, spot and TC, during the second quarter was USD 20,700 (12,600) per day. For vessels employed on the spot market, average income for the quarter was USD 22,000 (9,100) for light products and USD 21,100 (12,300) for heavy products.
Looking at the first six months of 2015, the average income for the product tanker fleet was USD 19,900 (14,100) per day. For vessels employed on the spot market, average income for the period was USD 21,000 (11,800) for light products and USD 21,000 (14,800) for heavy products.
SuezmaxThe suezmax tanker Stena Supreme (158,000 dwt) is employed on the spot market via Stena Sonangol Suezmax Pool, controlled by Stena Bulk and the Angolan state oil company Sonangol. The pool is a long-time market leader in terms of suezmax tanker income.
The market remained strong during the second quarter. Average income for Stena Supreme was USD 39,500 (17,200) per day for the quarter and USD 41,800 (25,200) per day for the first six months of 2015. In addition to Stena Supreme, Concordia Maritime also has a position in Stena Bulk’s suezmax fleet corresponding to a 50 percent charter of one tanker. This vessel is also employed on the global open market through the Stena Sonangol Suezmax Pool. The contract runs until December 2015.
Newbuilding programConstruction of the second IMOIIMAX tanker, Stena Important, continued according to plan during the quarter. Delivery is sched-uled for the fourth quarter of 2015. The two IMOIIMAX vessels, which are part of a series being designed with Stena Bulk and Stena Weco, are being developed by Stena Teknik and Guangzhou Ship-yard International in China.
The orders, which were placed during a low and favourable price situation, are the first step in Concordia Maritime’s new investment in the future and an important part of the long-term process of expanding the fleet. The vessels are at the absolute forefront in both energy efficiency and cargo flexibility.
Repairs and drydockNo scheduled five-year drydock was carried out during the quarter. However, maintenance was carried out on Stena Performance’s tanks, which led to six days’ offhire.
The second quarter of the year was marked by a continuation of the strong demand for transportation of both crude oil and refined products. For Concordia Maritime, this meant good income for all vessels in the fleet.
4
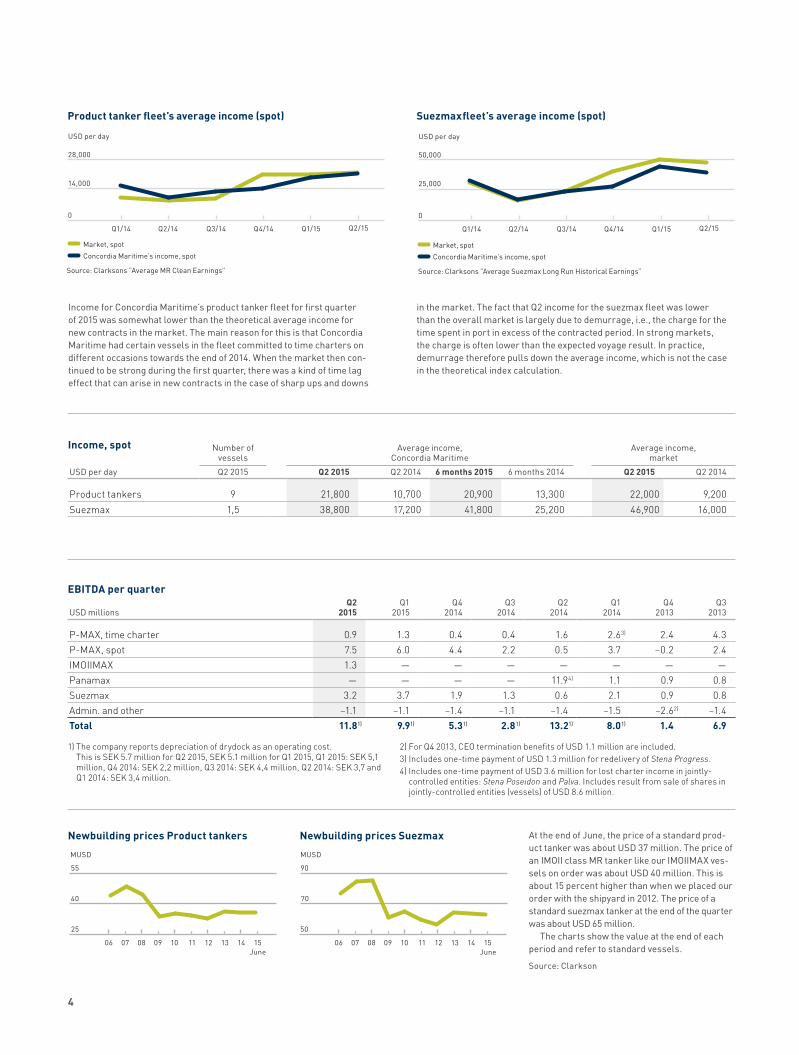
Product tanker fleet’s average income (spot) Suezmaxfleet’s average income (spot)
28,000
14,000
0
Q1/14 Q3/14 Q4/14 Q1/15 Q2/15
USD per day
Q2/14
Market, spotConcordia Maritime’s income, spot
Source: Clarksons ”Average MR Clean Earnings”
50,000
25,000
0
Q1/14 Q3/14 Q4/14 Q1/15 Q2/15
USD per day
Q2/14
Market, spotConcordia Maritime’s income, spot
Source: Clarksons ”Average Suezmax Long Run Historical Earnings”
Income for Concordia Maritime’s product tanker fleet for first quarter of 2015 was somewhat lower than the theoretical average income for new contracts in the market. The main reason for this is that Concordia Maritime had certain vessels in the fleet committed to time charters on different occasions towards the end of 2014. When the market then con-tinued to be strong during the first quarter, there was a kind of time lag effect that can arise in new contracts in the case of sharp ups and downs
in the market. The fact that Q2 income for the suezmax fleet was lower than the overall market is largely due to demurrage, i.e., the charge for the time spent in port in excess of the contracted period. In strong markets, the charge is often lower than the expected voyage result. In practice, demurrage therefore pulls down the average income, which is not the case in the theoretical index calculation.
Number of vessels
Average income, Concordia Maritime
Average income, market
USD per day Q2 2015 Q2 2015 Q2 2014 6 months 2015 6 months 2014 Q2 2015 Q2 2014
Product tankers 9 21,800 10,700 20,900 13,300 22,000 9,200Suezmax 1,5 38,800 17,200 41,800 25,200 46,900 16,000
Income, spot
EBITDA per quarter
USD millionsQ2
2015Q1
2015Q4
2014Q3
2014Q2
2014Q1
2014Q4
2013Q3
2013
P-MAX, time charter 0.9 1.3 0.4 0.4 1.6 2.63) 2.4 4.3P-MAX, spot 7.5 6.0 4.4 2.2 0.5 3.7 –0.2 2.4IMOIIMAX 1.3 — — — — — — —Panamax — — — — 11.94) 1.1 0.9 0.8Suezmax 3.2 3.7 1.9 1.3 0.6 2.1 0.9 0.8Admin. and other –1.1 –1.1 –1.4 –1.1 –1.4 –1.5 –2.62) –1.4Total 11.81) 9.91) 5.31) 2.81) 13.21) 8.01) 1.4 6.9
1) The company reports depreciation of drydock as an operating cost. This is SEK 5.7 million for Q2 2015, SEK 5.1 million for Q1 2015, Q1 2015: SEK 5,1 million, Q4 2014: SEK 2,2 million, Q3 2014: SEK 4,4 million, Q2 2014: SEK 3,7 and Q1 2014: SEK 3,4 million.
2) For Q4 2013, CEO termination benefits of USD 1.1 million are included.3) Includes one-time payment of USD 1.3 million for redelivery of Stena Progress. 4) Includes one-time payment of USD 3.6 million for lost charter income in jointly-
controlled entities: Stena Poseidon and Palva. Includes result from sale of shares in jointly-controlled entities (vessels) of USD 8.6 million.
Newbuilding prices Product tankers
55
40
25
MUSD
09 11 1306 07 08 10 1512 14June
Newbuilding prices Suezmax
90
70
50
MUSD
09 11 1306 07 08 10 1512 14
June
Source: Clarkson
At the end of June, the price of a standard prod-uct tanker was about USD 37 million. The price of an IMOII class MR tanker like our IMOIIMAX ves-sels on order was about USD 40 million. This is about 15 percent higher than when we placed our order with the shipyard in 2012. The price of a standard suezmax tanker at the end of the quarter was about USD 65 million.
The charts show the value at the end of each period and refer to standard vessels.

5
Financial summaryEquityEquity per share was SEK 36.30 (29.26).
Changes in translation and hedging reservesThe parent company’s functional currency is SEK, but the majority of the transactions in the Group are in USD. The Group’s result is generated in USD, which means the result in SEK is a direct function of the SEK/USD exchange rate trend. The accumulated exchange differences, which are recognised in equity, amounted to SEK 373.7 (76.9) million. The changes are recognised in equity through OCI.
InvestmentsInvestments during the quarter amounted to SEK 211.9 (31.1) mil-lion. The investments are mainly related to payments for the two IMOIIMAX vessels.
Valuation of the fleetThe Group’s fleet is assessed on a six-monthly basis to determine whether there is any indication of impairment. The fleet is defined as a cash-generating unit, and an impairment loss is recognised when the carrying amount of an asset or cash-generating unit exceeds its recoverable amount. The recoverable amount is the higher of fair value (external valuations) and value in use (future discounted cash flows). Impairment testing of asset values at 30 June 2015 did not indicate any impairment.
Seasonal variationsAt the end of the quarter, two vessels from our fleet of 12.5 vessels (plus one vessels under construction and one position corresponding to 50 percent of a suezmax tanker activated in Q3) were chartered out on fixed contracts and 10.5 were employed on the open market.
This arrangement of the fleet means that income is affected by the seasonal variations that occur in tanker shipping.
Employees The number of employees in the Group at 30 June 2015 was 6 (6). The Group employed 450 (394) temporary seagoing employees through Stena Sphere’s manning company.
Financial investmentsThe bond portfolio was divested on 31 March 2014 and generated a positive earnings impact of SEK 3.8 million.
Parent companyThe parent company’s total income for the second quarter amounted to SEK 3.3 (0.4) million. Intragroup invoicing represented SEK 0.0 (0.3) million of this amount. The parent company’s result before tax for the period January to June was SEK –21.4 (–26.4) million. The parent company’s available liquid funds amounted to SEK 1,564.7 (1,378.0) million, which includes receivables from Group companies in the cash pool and unutilised credit facilities.
Demand for damagesIn July 2013, the vessel owner received an application for arbitration for the damage the customer believes the company has caused them in connection with Stena Primorsk’s grounding in the Hudson River in December 2012 and the Company’s decision to stop operating the vessel in this shipping channel. In July 2013, the customer requested that the matter be settled by arbitration in the United States. The ves-sel owner strongly rejects the claim of approx. USD 21 million and is preparing for arbitration. The case is currently in a discovery phase, which means that both parties’ standpoints and demands are being

6
The Group’s total income and earnings
Quarter 2 6 months
SEK millions 2015 2014 2015 2014
Total income 204.3 166.2 382.8 301.4Operating result 52.3 52.2 91.4 68.1Result after financial items 44.0 42.1 72.2 52.3Result per share after tax, SEK 0.92 0.84 1.51 1.10
Liquidity and financial position
SEK millions30 June
201530 June
2014
Available liquid funds1) 229.5 362.0Interest-bearing liabilities 2,260.8 1,669.0Equity 1,734.5 1,396.5Equity ratio, % 42 44
1) Includes unutilised available credit facilities.
Exchange differences (reported in other comprehensive income)
300
150
0
–150
–300
12
9
6
3
0
06 07 08 09 1110
Exchange differences Exchange rate SEK/USD
SEK Millions SEK
12 13 14 15Q2
As a result of the SEK/USD exchange rate, the company’s profit in SEK has changed, while profit in USD remains unchanged.
examined carefully. This phase will be completed during the third quarter of 2015. A possible conciliation procedure may be implemented between the fourth quarter of 2015 and the first quarter of 2016. If the conciliation procedure is not implemented, the process will be handled through arbitration, probably not before the second half of 2016. The Company’s fees for legal and similar assistance regarding this matter are charged to the Company’s earnings as incurred.
Sale of investments in jointly-controlled entitiesIn the first quarter of 2014, a process was initiated for the sale of Stena Poseidon and Palva, owned with Neste in jointly-controlled entities. Sales contracts were signed in March 2014 and the two ves-sels were delivered at the end of April and the beginning of May. Investments in joint ventures were previously accounted for using proportionate consolidation. The result of the sale is classified as “Result from sale of investments in jointly-controlled entities” in the consolidated income statement and cash flow statement.
Other informationRelated party transactions Concordia Maritime has a small internal organisation, and pur-chases services from related-party companies in Stena Sphere, which include Stena Bulk. The latter company conducts tanker business that competes with Concordia Maritime in some respects. Accordingly, there is an agreement, entered into many years ago, which regulates the relationship between the two com-panies with respect to new business. Under the terms of this agreement, Concordia Maritime has the right to opt for 0, 50 or 100 percent participation in each new transaction.
Stena WecoAt the beginning of April 2011, Stena Bulk and the Danish company Weco started a 50-50 joint venture which resulted in a newly established company, Stena Weco, Stena Weco special-ises mainly in the transportation of vegetable oils. Under a new agreement with Stena Bulk, Concordia Maritime is enti-tled to the financial result arising from vessels that may from time to time be chartered in by Stena Weco for a period of more than one year, should Concordia Maritime decide to participate in such charters. Other business generated by Stena Weco is not available to Concordia Maritime.
Cont’d financial summary
Vessel charter Payment is based on a commission of 1.25 percent on freight rates.
Commission on the purchase and sale of vessels Payment is based on a commission of 1 percent.
Operation and manning of the Group’s vessels, also referred to as ship management Payment is based on a fixed price per year and vessel.
Purchases of bunker oil Payment is based on a fixed commission per ton purchased.
Commercial operation, administration, marketing, insurance, technical monitoring and development of Concordia Maritime’s fleet Payment is based on a fixed price per month and vessel. With regard to technical consulting services for newbuild projects, an hourly rate is applied on a cost-plus basis, which is then charged to the project.
Office rent and office services A fixed annual price is charged.
All related party transactions are conducted on commercial terms and at market-related prices.
Concordia Maritime purchases services on a regular basis from the Stena Sphere in the following areas

7
GROUP
Income statement, other comprehensive income and per-share data
SEK millions Quarter 2 2015 Quarter 2 2014 6 months 2015 6 months 2014 Full year 2014
Consolidated income statementAverage exchange rate SEK/USD 8.42 6.60 8.38 6.53 6.86Time charter income 24.2 47.5 51.5 90.2 119.4Spot charter income 180.0 62.5 331.2 155.0 351.2Result from sale of investments in jointly-controlled entities 0.0 56.1 0.0 56.1 57.4Other external income 0.0 0.1 0.0 0.1 3.2Total income 204.3 166.2 382.8 301.4 531.2
Operating costs, ships –42.7 –34.7 –82.0 –71.0 –137.0Personnel costs, seagoing –46.5 –33.1 –86.7 –65.5 –138.0Other external costs –11.1 –8.2 –21.4 –17.7 –38.0Personnel costs, land-based –4.6 –3.7 –11.0 –9.0 –17.0Depreciation –47.1 –34.3 –90.3 –70.1 –144.7Total operating costs –152 –114.0 –291.4 –233.3 –474.8Operating result 52.2 68.1 56.4
Interest and similar income 0.0 0.1 0.0 5.3 5.6Interest and similar expense –8.3 –10.2 –19.2 –21.1 –45.4Financial net –8.3 –10.1 –19.2 –15.8 –39.8Result before tax 44.0 42.1 72.2 52.3 16.5
Tax 0.0 –2.0 0.0 0.0 –7.8Result after tax 44.0 40.1 72.2 52.3 8.7
Other comprehensive incomeItems that have been/can be transferred to result for the periodTranslation differences –77.2 48.2 84.4 47.5 259.8Equity hedges 0.0 0.0 0.0 0.0 0.0Available-for-sale financial assets 0.0 0.0 3.2 –3.2 –3.2Cash flow hedges, currency-related 0.0 0.0 0.0 0.0 0.0Cash flow hedges, interest-related 0.0 3.9 0.0 7.6 17.1Tax attributable to items that have been, or can be, transferred to result for the period 0.0 –0.1 0.0 0.0 0.0Comprehensive income for the period –33.2 92.1 159.8 104.2 282.4
Per-share data, SEKNumber of shares 47,729,798 47,729,798 47,729,798 47,729,798 47,729,798Result per share, before/after dilution 0.92 0.84 1.51 1.10 0.18Equity per share, SEK 36.34 29.26 36.34 29.26 32.99

8
GROUP
Condensed balance sheet
SEK millions 30 Jun 2015 30 Jun 2014 31 Dec 2014
Closing exchange rate SEK/USD 8.24 6.74 7.81
AssetsShips and equipment 3,527.9 2,769.6 3,129.7Ships under construction 124.2 130.8 205.8Financial assets 0.1 8.5 0.8Total non-current assets 3,652.2 2,908.9 3,336.3
Current receivables 315.9 173.7 242.9Short-term investments 0.0 0.0 0.0Cash and bank balances 137.2 94.2 136.6Total current assets 453.1 267.9 379.5Total assets 4,105.3 3,176.8 3,715.8
Equity and liabilitiesEquity 1,734.5 1,396.5 1,574.7Non-current liabilities 2,021.5 1,647.4 2,013.9Current liabilities 349.3 132.9 127.2Total equity and liabilities 4,105.3 3,176.8 3,715.8
Changes in equity
SEK millionsShare
capitalOther paid-in
capitalTranslation
reserveHedgingreserve
Fair value reserve
Retainedearnings Total
Changes Jan–Jun 2015Opening balance 01.01.2015 381.8 61.9 289.3 –3.2 0.0 844.9 1,574.7Comprehensive income for the period 84.4 3.2 0.0 72.2 159.8Closing balance 30.06.2015 381.8 61.9 373.7 0.0 0.0 917.1 1,734.5
Changes Jan–Jun 2014Opening balance 01.01.2014 381.8 61.9 29.4 –20.3 3.2 836.3 1,292.3Comprehensive income for the period 47.5 7.6 –3.2 52.3 104.2Closing balance 30.06.2014 381.8 61.9 76.9 –12.7 0.0 888.6 1,396.5

9
GROUP
Condensed cash flow statement
SEK millions Quarter 2 2015 Quarter 2 2014 6 months 2015 6 months 2014 Full year 2014
Operating activitiesResult before tax 44.0 42.1 72.2 52.3 16.5Adjustments:
Depreciation 52.8 38.0 101.2 77.2 150.5Result from sale of securities 0.0 –0.1 0.0 –3.9 –4.0Result from sale of investments in jointly-controlled entities 0.0 –56.1 0.0 –56.1 –58.9Other items –35.9 –2.0 –25.3 –5.5 17.7
Cash flow from operating activities before changes in working capital
60.8 21.9 148.0 64.0 121.8
Changes in working capital –5.6 16.4 –16.1 25.3 –36.2Cash flow from operating activities 55.2 38.3 131.9 89.3 85.6
Investing activities
Investment in non-current assets –211.9 –26.0 –237.8 –31.1 –87.9Investment in financial assets 0.0 0.0 0.0 0.0 0.0Sale of financial assets 0.0 85.3 0.0 85.9 90.2Sale of investments in jointly-controlled entities 0.0 226.2 0.0 226.2 237.6Cash flow from investing activities –211.9 285.5 –237.8 281.0 239.9
Financing activitiesNew loans 217.8 0.0 217.8 12.9 117.2Amortisation of loans –104 –362.5 –104 –398.3 –434.9Dividend to shareholders 0.0 0.0 0.0 0.0 0.0Cash flow from financing activities 113.8 –362.5 113.8 –385.4 –317.7
Cash flow for the period –42.9 –38.7 7.9 –15.1 7.8Balance at beginning of period (Note 1) 201.4 129.6 136.6 106.0 106.0Exchange differences (Note 2) –21.5 3.3 –7.5 3.3 22.8Balance at end of period (Note 1) 137.2 94.2 137.2 94.2 136.6
Note 1. Consists of cash, bank balances and credit facilityNote 2. Exchange differences attributable to: –21.5 3.3 –7.5 3.3 22.8
Cash and cash equivalents at beginning of year 0.0 0.0 0.0 0.0 0.0Cash flow for the period –21.5 3.3 –7.5 3.3 22.8
–21.5 3.3 –7.5 3.3 22.8

10
Quarterly overviewSEK millions Q2 2015 Q1 2015 Q4 2014 Q3 2014 Q2 2014 Q1 2014 Q4 2013 Q3 2013
Profit/loss itemsTotal income 204.3 178.4 125.7 104.0 166.2 135.2 95.7 125.4Operating costs excluding impairment –152.0 –139.4 –123.6 –117.9 –114.0 –119.3 –122.7 –116.2Operating result (EBIT) 52.3 39.0 2.2 –13.9 52.2 15.9 –27.0 9.2 of which result from
sale of investments in jointly-controlled entities (vessels) — — — — 56.1 — — —
Financial net –8.3 –10.9 –14.9 –9.2 –10.1 –5.7 –8.0 –10.3Result after financial net 44.0 28.1 –12.7 –23.1 42.1 10.2 –35.0 –1.1Result after tax 44.0 28.1 –16.6 –27.0 40.1 12.2 –30.8 0.6Cash flow from operating activities 55.2 87.0 34.0 23.8 21.9 42.1 13.2 28.3EBITDA 99.5 82.2 40.5 22.3 86.5 51.7 9.2 45.5
Balance-sheet itemsShips (number) 3,527.9 (12) 3,415.1 (11) 3,129.7 (11) 2,944.9 (11) 2,769.6 (11) 2,708.6 (12) 2,915.6 (12) 2,905.4 (12) Ships under construction (number) 124.2 (1) 243.4 (2) 205.8 (2) 142.0 (2) 130.8 (2) 102.0 (2) 100.5 (2) 75.1 (2) Liquid funds incl. investments 137.1 201.4 136.6 71.4 94.2 211.8 187.7 215.0Other assets 315 267.5 243.7 261.6 182.2 364.6 202.7 185.6Interest-bearing liabilities 2,260.8 2,250.7 2,038.9 1,792.2 1,669.0 1,970.6 1,994.0 1,959.9Other liabilities and provisions 109.3 109.2 102.2 152.7 111.3 112.0 120.2 120.9Equity 1,734.5 1,767.6 1,574.7 1,474.9 1,396.5 1,304.4 1,292.3 1,300.3Total assets 4,105.3 4,127.5 3,715.8 3,419.8 3,176.8 3,387.0 3,406.5 3,381.1
Key ratios, %Equity ratio 42 43 42 43 44 39 38 38Return on total capital 2 2 2 1 0 2 –3 1Return on capital employed 2 2 2 1 0 2 –3 1Return on equity 2 2 1 0 0 1 –9 1Operating margin 25 22 2 –13 31 12 –28 7
Share dataTotal income 4.28 3.71 2.63 2.18 3.48 2.83 2.00 2.63Operating costs excluding impairment 3.18 –2.92 –2.59 –2.47 –2.39 –2.50 –2.57 –2.43Operating result before impairment 1.10 0.82 0.05 –0.29 1.09 0.33 –0.57 0.19Financial net –0.17 –0.23 –0.31 –0.19 –0.21 –0.12 –0.17 –0.22Result after tax 0.92 0.59 –0.48 –0.57 0.84 0.26 –0.64 0.01
Cash flow 1.16 1.82 –5.76 0.50 0.46 0.88 0.28 0.59EBITDA 2.08 1.72 0.85 0.47 1.81 1.08 0.19 0.95Equity 36.34 37.03 32.99 30.90 29.26 27.33 27.07 27.24
Please note that there has been no dilution effect since 2002. Definitions: see page 12

11
SEK millions 30/06/2015 30/06/2014
AssetsShips and equipment 0.1 0.1Financial assets 36.0 34.3Investments in Group companies 745.8 745.8Total non-current assets 781.8 780.2
Current receivables 11.1 2.5Receivables from Group companies 1,375.2 1,168.7Cash and bank balances 112.8 50.4Total current assets 1,499.5 1,221.6Total assets 2,281.3 2,001.8
Equity and liabilitiesEquity 515.3 577.4Non-current liabilities 1,759.3 1,416.0Current liabilities 6.7 8.4Total equity and liabilities 2,281.3 2,001.8
Pledged assets 82.4 67.4Contingent liabilities1) 316.4 280.4
1) The parent company has provided a guarantee for a subsidiary, which relates to vessel financing.
SEK millions 6 months 2015 6 months 2014
Net sales 8.2 0.4Other external costs –7.5 –8.1Personnel expenses –8.5 –7.1Operating result –7.7 –14.8
Result from subsidiaries
Other interest and similar income 7.6 6.3Interest and similar expense –21.2 –17.9Result before tax –21.4 –26.4
Tax 0 0.0Result for the period –21.4 –26.4
PARENT COMPANY
Condensed income statement and balance sheet
The Concordia Maritime Group applies International Financial Reporting Standards (IFRS) as adopted by the EU. The Group applies the same accounting policies and calculation methods in the quarterly reports as in the annual report for 2013, in addition to those described in this report.
The Group’s interim report has been prepared in accordance with IAS 34 and the Swedish Annual Accounts Act.
The report for the parent company has been prepared in accord-ance with the Swedish Annual Accounts Act. The Board of Directors and CEO confirm that the six-monthly report provides a true and fair overview of the operations, financial position and performance of the parent company and Group, and describes material risks and uncertainties faced by the parent company and Group companies.
Gothenburg, 13 August 2015
Carl-Johan Hagman Stefan Brocker Daniel Holmgren Mats Jansson Helena Levander Mahmoud Sifaf Chairman Deputy Chairman
Jörgen Lorén Michael G:son Löw Morten Chr. Mo Dan Sten Olsson Kim Ullman CEO

Concordia Maritime405 19 Gothenburg, SwedenTel +46 31 85 50 00Corp. ID 556068-5819www.concordiamaritime.com
CalendarQ3 Interim report 11 November 2015Year-end 28 January 2016
RisksFor a description of risks and uncer-tainties, see Concordia Maritime’s 2014 Annual Report or visit www.concordiamaritime.com
Kim Ullman, CEO +46 31 85 50 03 or +46 704 85 50 [email protected]
Ola Helgesson, CFO+46 31 85 50 09or +46 704 85 50 [email protected]
Contact Fleet at 30/06/2015Employment Partner/customer
P-MAX Stena Premium Spot (light) Stena WecoStena Polaris Spot (light) Stena WecoStena Performance Spot (light) Stena WecoStena Provence Spot (light) Stena WecoStena Progress Spot (light) Stena WecoStena Paris Spot (light) Stena WecoStena Primorsk Spot (heavy) Concordia Maritime/Stena Bulk PoolStena Penguin Spot (heavy) Concordia Maritime/Stena Bulk PoolStena Perros Time charter to
Jan 2016 (heavy) Concordia Maritime/Stena Bulk PoolStena President Time charter to
Jan 2016 (heavy) Concordia Maritime/Stena Bulk Pool
Suezmax Stena Supreme Spot Stena Sonangol Suezmax PoolUnnamed vessel1) Spot Stena Sonangol Suezmax PoolUnnamed vessel2) Spot
Delivery 21 JulyStena Sonangol Suezmax Pool
IMOIIMAX Stena Image Spot (light) Stena WecoStena Important Delivery Oct 2015 Stena Weco
Accounting policiesThis interim financial report in summary for the Group has been prepared in accordance with IAS 34 Interim Financial Reporting and relevant pro-visions of the Swedish Annual Accounts Act. The interim report for the parent company has been
prepared in accordance with chapter 9 of the Swedish Annual Accounts Act. For the Group and parent company, the same accounting principles and computation methods have been applied as in the most recent annual report.3) The report has not been reviewed by the Company’s auditors.
DefinitionsCash flow from operating activities Result after financial net plus depreciation minus tax paid (cash flow before change in working capital and invest-ments and before effect of ship sales).
Return on equity Result after taxas an average of the last twelve months expressed as a percentage of average equity on a 12-month rolling basis.
Return on total capital Result after financial net plus finance costs as an average of the last twelve months expressed as a percentage of average total assets on a 12-month rolling basis.
Return on capital employed Result after financial net plus finance costs as an average of the last twelve months expressed as a percentage of aver-age capital employed on a 12-month rolling basis. Capital employed refers to total assets minus non-interest-bearing liabilities, including deferred tax liability.
Equity ratio Equity as a percentage of total assets.
Spot charter (open market) Hiring of vessels on a voyage-by-voyage basis.
Time charter Hiring of vessels for a specified period at a fixed rate.
The information in this report is informa-tion that Concordia Maritime is required to disclose in accordance with the Swedish Securities Market Act and/or the Swedish Financial Instruments Trading Act. The information was made public on 13 August 2015, at approx. 2.30 p.m.
ww
w.solberg.se
1) 50% charter December 2014–December 2015.2) 50% charter July 2015–June 2016.3) No new or revised IFRS recommendations or IFRIC interpretations have had any material
effect on the Group’s or parent company’s financial position, results or disclosures.
Distribution Our quarterly reports are no longer being printed for environmental reasons, but are only published digitally. Concordia Maritime’s interim reports as well as additional financial information about the Company can be read or downloaded at our website www.concordiamaritime.com/en/ investor-relations