Embed Size (px)
Citation preview

Interim Report2017January – March
1 U PDATED I N FORMATION 8 I NTERIM M ANAGEMENT REPORT
23 BRAN DS AN D BUSI N ESS FI ELDS
27 I NTERIM CONSOLI DATED FI NANCIAL STATEMENTS (CON DENSED)
1 Key Facts
2 Key Events 8 Volkswagen Shares
9 Business Development 17 Result of Operations, Finan- cial Position and Net Assets 22 Outlook
27 Income Statement 28 Statement of Comprehensive Income 29 Balance Sheet 30 Statement of Changes in Equity 32 Cash Flow Statement 33 Notes to the Interim Consolidated Financial Statements 52 Review Report
All figures shown in the Report are rounded, so minor discrepancies may arise from addition of these amounts. The figures from the previous fiscal year are shown in parentheses directly after the figures for the current reporting period.
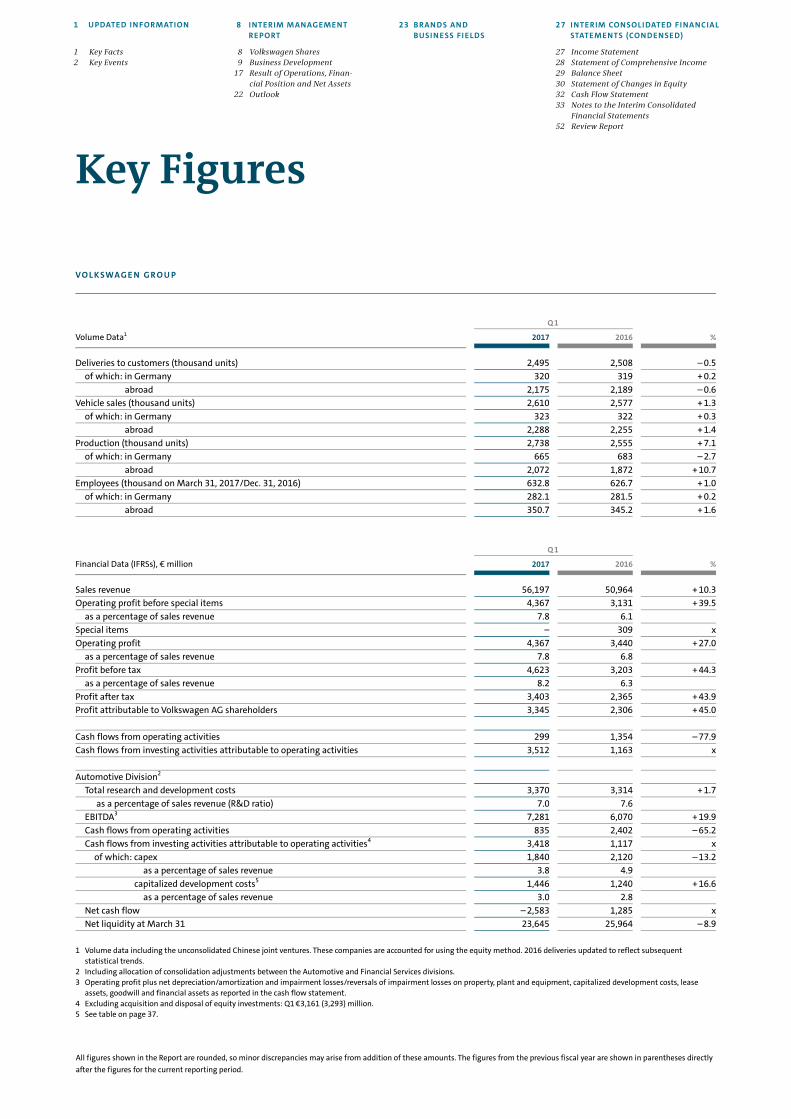
VO L K SWA G E N G R O U P
Q 1
Volume Data1 2017 2016 %
Deliveries to customers (thousand units) 2,495 2,508 – 0.5of which: in Germany 320 319 + 0.2
abroad 2,175 2,189 – 0.6Vehicle sales (thousand units) 2,610 2,577 + 1.3
of which: in Germany 323 322 + 0.3abroad 2,288 2,255 + 1.4
Production (thousand units) 2,738 2,555 + 7.1of which: in Germany 665 683 – 2.7
abroad 2,072 1,872 + 10.7Employees (thousand on March 31, 2017/Dec. 31, 2016) 632.8 626.7 + 1.0
of which: in Germany 282.1 281.5 + 0.2abroad 350.7 345.2 + 1.6
Q 1
Financial Data (IFRSs), € million 2017 2016 %
Sales revenue 56,197 50,964 + 10.3Operating profit before special items 4,367 3,131 + 39.5
as a percentage of sales revenue 7.8 6.1 Special items – 309 xOperating profit 4,367 3,440 + 27.0
as a percentage of sales revenue 7.8 6.8 Profit before tax 4,623 3,203 + 44.3
as a percentage of sales revenue 8.2 6.3 Profit after tax 3,403 2,365 + 43.9Profit attributable to Volkswagen AG shareholders 3,345 2,306 + 45.0 Cash flows from operating activities 299 1,354 – 77.9Cash flows from investing activities attributable to operating activities 3,512 1,163 x Automotive Division2
Total research and development costs 3,370 3,314 + 1.7 as a percentage of sales revenue (R&D ratio) 7.0 7.6
EBITDA3 7,281 6,070 + 19.9Cash flows from operating activities 835 2,402 – 65.2Cash flows from investing activities attributable to operating activities4 3,418 1,117 x
of which: capex 1,840 2,120 – 13.2as a percentage of sales revenue 3.8 4.9
capitalized development costs5 1,446 1,240 + 16.6as a percentage of sales revenue 3.0 2.8
Net cash flow – 2,583 1,285 xNet liquidity at March 31 23,645 25,964 – 8.9
1 Volume data including the unconsolidated Chinese joint ventures. These companies are accounted for using the equity method. 2016 deliveries updated to reflect subsequent statistical trends.
2 Including allocation of consolidation adjustments between the Automotive and Financial Services divisions. 3 Operating profit plus net depreciation/amortization and impairment losses/reversals of impairment losses on property, plant and equipment, capitalized development costs, lease
assets, goodwill and financial assets as reported in the cash flow statement. 4 Excluding acquisition and disposal of equity investments: Q1 €3,161 (3,293) million. 5 See table on page 37.
Key Figures

Updated Information 1Key Facts
> Volkswagen Group starts fiscal year 2017 on a strong footing
> Volkswagen Group deliveries to customers on a level with the previous year at 2.5 (2.5) million vehicles; growth in Europe as well as in North and South America
> Group sales revenue of €56.2 billion exceeds prior-year figure by 10.3%; positive volume and mix effects
> Operating profit climbs €0.9 billion to €4.4 billion; improvement of €1.2 billion compared with prior-year result before special items
> Profit before tax increases by €1.4 billion to €4.6 billion
> As expected, the Automotive Division’s net cash flow was negative at €–2.6 (1.3) billion after cash outflows attributable to the diesel issue; capex ratio of 3.8 (4.9)%
> Net liquidity in the Automotive Division of €23.6 billion at a robust level
> Customers enthusiastic about new Group vehicles:
- Volkswagen Passenger Cars celebrates the world premiere of the new Arteon and adds the Atlas and Tiguan Allspace to its SUV portfolio
- Audi presents the SQ5 TFSI – the sportiest model in its new Q5 series - High demand for the ŠKODA Kodiaq; new versions presented - SEAT debuts the fifth generation of its popular Ibiza - Porsche enters a new segment with the Panamera Sport Turismo - Lamborghini thrills customers with the powerful Huracán Performante - Volkswagen Commercial Vehicles celebrates the anniversary of its best-selling Multivan
with its “70 years of the Bulli” special edition
Key Facts

Key Events 2 Updated Information
M OTO R S H O W S A N D E V E N T S
The Volkswagen Group presented a wealth of new models and technologies at motor shows and events in the first quarter of 2017. North American International Auto Show in Detroit The Volkswagen Passenger Cars brand presented the Atlas in Detroit. Tailored to the needs of American customers, the Atlas is the brand's first model in the high-volume, mid-size SUV category and is manufactured in Chattanooga, Tennessee for the North American market. The Atlas impresses with innovative technologies, excellent driving dynamics, a large choice of driver assistance systems and generous space for up to seven people. With the long version of the Tiguan the brand extends its SUV product range. The long version is distinguished from the more compact version not only by its extended wheelbase and external length, but also by an individually designed rear silhouette, modified front end and far more standard features. The newly designed top version with up to seven seats is being gradually introduced to markets in North America, China and Europe. In Europe, its name will carry the “Allspace” suffix. Volkswagen’s I.D. BUZZ demonstrated the versatility of tomorrow’s electromobility. The concept MPV is equipped with electric motors on the front and rear axles, a fully automated driving mode (I.D. Pilot) and the latest generation of display and control functions. With room for eight people in a multivariable seating layout, the I.D. BUZZ makes better use of space than any other electric vehicle. Based on the new Modular Electric Toolkit (MEB), it can cover up to 600 km (NEDC) in pure elec-tric mode.
Audi celebrated the world premiere of the SQ5 TFSI – the sportiest version of the new Q5 series – at the Detroit show. The turbocharged 3.0 l V6 engine delivers 260 kW (354 PS) of power and can sprint from 0 to 100 km/h in 5.4 seconds. The quattro permanent all-wheel drive combined with the fast-shifting, eight-speed tiptronic transmission assists the dynamic handling. Audi drive select allows the driver to put the SUV in several different modes, changing its driving characteristics. Both inside and out, the Audi SQ5 TFSI sets itself apart from the basic model with numerous S-specific design features and more equipment as standard. Following the Coupé and Sportback, Audi showed off the new A5 Cabriolet and the new S5 Cabriolet in Detroit for the first time. The design is based on the sleek lines of the Coupé. The classic soft top offers outstanding aeroacoustics and a new
convenient open-close function. The fully automatic opening and closing mechanism can be deployed at speeds of up to 50 km/h. The latest connectivity and driver assistance system functions are available on board. New engines ranging from 140 kW (190 PS) to 260 kW (354 PS) make for powerful propul-sion. The Q8 concept car gives an insight into Audi’s future design language and into a serial model that the brand will launch on the market in 2018. The show car combines the typical spaciousness of an SUV with the emotive lines of a coupé. The vehicle will enable Audi to reach a new premium-class segment. Despite its flat roof line, the Q8 concept provides plenty of space for four people and copious luggage. The new control interface is based on large touchscreens, complemented by an expanded version of the Audi virtual cockpit and a head-up display. The car's powerful, yet highly efficient plug-in hybrid drive offers 330 kW of system output. Geneva International Motor Show The Volkswagen Passenger Cars brand celebrated the debut of its new Arteon at the Geneva International Motor Show. The elegant and dynamic five-door vehicle with the proportions of a Gran Turismo and coupé lines impresses with its spa-ciousness and comfort. The wide-opening tailgate offers easy access to a 563-liter boot – the best in class. At 2,841 mm, the long wheelbase offers unusually generous interior archi-tecture for a vehicle with this body shape. The Arteon has a spacious feel with extensive head- and legroom in all five seats, and new-generation driver assistance systems also celebrate their premiere. Three TSI petrol engines and three TDI diesel engines, all turbocharged with power output ranging from 110 kW (150 PS) to 206 kW (280 PS), are avail-able. The new Tiguan Allspace was on show for the first time in Europe at the Geneva show. With a larger wheelbase and added exterior length, it offers greater flexibility and room for passengers and luggage. The I.D. BUZZ also celebrated its European debut in Geneva. The concept electric MPV is the second model in the I.D. series and offers an insight into the future. The BUZZ also demonstrates that the MEB is suitable for larger vehicles, too.
The Q8 sport concept debuted on Audi’s stand at the motor show. A sporty, dynamic and luxurious statement, it ensured that the brand made a big impression in the premium-class segment. The Q8 concept’s extremely efficient powertrain is especially future-oriented. A world first, it combines a 3.0 TFSI six-cylinder engine with a mild hybrid system and electric-powered compressor. The result: the Q8
Key Events

Updated Information 3Key Events
sport concept has a power output of 350 kW (476 PS) and sprints from 0 to 100 km/h in just 4.7 seconds. The top speed is 275 km/h. Geneva also saw the world premiere of the RS 5 Coupé – the Gran Turismo variant of the RS models. The vehicle combines elegant aesthetics with high everyday practicality. Its 2.9 TFSI V6 twin-turbo has been newly devel-oped from scratch. With a power output of 331 kW (450 PS), it takes the vehicle from 0 to 100 km/h in just 3.9 seconds. The broad and flat single-frame radiator grill and massive air intakes make a strong impression at the front end. Oval tailpipes and widened wheel arches complete the RS 5 Coupé’s dynamic look. The brand’s sporty presence was also boosted by the European premiere of the Audi SQ5 TFSI and the presentation of the Audi RS 3 Sportback. The latter impresses with its 2.5 TFSI five-cylinder engine, generating 294 kW (400 PS) of power, and with its high-tech suspension, which offers the driver a choice among the modes comfort, auto or dynamic. With the A5 Sportback g-tron, Audi also presented one of its sustainable powertrain concepts. The natural gas-powered vehicle combines dynamic driving performance, everyday practicality and elegant design with low CO2 emis-sions at the same time.
The highlight on SEAT’s stand at the motor show was the new Ibiza, on show to the public for the first time. The fifth generation of the top-seller is a decisive step into the future for SEAT, as it is the first to be based on the Modular Trans-verse Toolkit. The compact car from the Spanish brand is equipped with the latest technology, offers a fresh and sporty design, spectacular dynamics and considerably more space. It impresses with its practicality, intelligent technology and connectivity. The available driver assistance systems include Front Assist and Adaptive Cruise Control (ACC). The SEAT Leon CUPRA also caused a stir. The 2.0 TSI engine delivers 221 kW (300 PS) and accelerates the CUPRA from 0 to 100 km/h in 4.9 seconds. The maximum speed is 250 km/h. This makes it the most powerful SEAT ever. In the ST estate version, the SEAT Leon CUPRA is now available for the first time with 4Drive all-wheel drive and a dual-clutch gearbox. A wealth of safety, connectivity and multimedia technologies round off the model.
ŠKODA presented four world premieres in Geneva, including the most powerful Octavia in the company’s history. The new Octavia RS 245 generates 180 kW (245 PS) – 11 kW (15 PS) more than its most powerful predecessor in the RS range. The sporty vehicle’s special qualities include the powerful engine and innovative chassis technology. The boot and interior offer the usual spaciousness. The facelifted Octavia Scout was another star of the show. It comes with a choice of three engines and state-of-the-art all-wheel-drive technology. Thanks to its increased ground clearance, the compact five-door vehicle effortlessly masters off-road terrain. The ŠKODA Kodiaq Scout is even more robust. Above all, it impresses with its off-road appearance, all-wheel drive and a rough road package designed to protect the engine and undercarriage from damage. The ŠKODA Kodiaq Sportline emphasizes the sporty side of the new range.
Among others Bentley showed off the coupé and convertible models of the Continental Supersports. With a top speed of 336 km/h and acceleration from 0 to 100 km/h in 3.5 seconds, the Continental Supersports is the fastest four-seater luxury car in the world. The brand also revealed the Bentley EXP 12 Speed 6e show car in Geneva, presenting its vision of a luxury car in the age of electromobility. It offers Bentley’s familiar craftsmanship combined with electric performance and grand touring qualities as well as rapid inductive charging and integrated online services.
Porsche brought no fewer than three world premieres to Geneva. The sports car manufacturer presented the Sport Turismo, a new bodywork variant of the Panamera. This takes Porsche into a new segment while maintaining all the brand’s traditional values and attributes. The Sport Turismo uses all the technical and conceptual innovations featured in the Panamera series, which was completely updated just last year. With a large tailgate, low loading sill, increased luggage space and a new seating arrangement, the new four-door vehicle meets high standards for everyday practicality and variability. Another highlight was the new Panamera Turbo S E-Hybrid with 500 kW (680 PS) of power. The second hybrid version of the Panamera is the first plug-in hybrid to be positioned as a top-of-the-range model at Porsche. Motorsport-style perfor-mance, systematic lightweight construction and pure driving experience: this is the short formula for the new generation of the 911 GT3. At the heart of the enhanced vehicle is the new four-liter flat engine, which produces 368 kW (500 PS) of power and is almost identical to that used in the 911 GT3 Cup racing car. The revised chassis and lightweight construction are designed to convert the engine output into outstanding driving dynamics.
Lamborghini presented the super sports car Huracán Performante, which brings together lightweight construction technologies, active aerodynamics, a newly harmonized combi-nation of chassis and all-wheel drive as well as an enhanced powertrain. The aspirated 5.2 l V10 engine delivers 471 kW (640 PS) and catapults the vehicle from 0 to 100 km/h in just 2.9 seconds. The top speed is 325 km/h. A few months ago, the car set a new lap record for production vehicles on the Nordschleife at the Nürburgring
Volkswagen Commercial Vehicles celebrated the 70th birth-day of the best-selling VW camper van, known in Germany as the “Bulli”, with a special Multivan model “70 Jahre Bulli”. The anniversary model combines the charm of the traditional retro styling with the technology and quality of today. “Bulli” badges and an anniversary sticker on the rear window, steps with the “Bulli” logo and stainless steel inlays are all reminders of the cult classic and are guaranteed to turn heads.
Together with project partner Airbus, our design and development team Italdesign presented the Pop.Up in Geneva, an impressive solution to the growing traffic problems in large cities. The fully electric two-seater can move autonomously through the city using artificial intelligence and can be coupled with ground and air modules

Key Events 4 Updated Information
while passengers remain inside the vehicle. Another high-light was the world premiere of the ZeroUno. The ultra-light-weight sports car can reach a maximum speed of 330 km/h. The aspirated 5.2 l V10 engine accelerates the open carbon-fiber chassis from 0 to 100 km/h in just 3.2 seconds.
The self-driving concept car Sedric made the Volkswagen Group the first car manufacturer to present an integrated mobility concept for road transport of the future. Sedric (self-driving car) enables an innovative form of mobility that everyone can use and yet that is centered on people’s indi-vidual needs and wishes: available at the touch of a button, simple, sustainable, convenient, and safe. The vehicle incor-porates ideas from different brands and underscores the importance of fully automated driving in the Volkswagen Group’s strategy.
AWA R D S
The British magazine What Car? awarded accolades to a total of ten models by Volkswagen Group brands in early 2017. The Audi brand impressed the jury with its Audi TT, Q7, A4 and A3 Sportback models in the Coupé of the Year, Luxury SUV of the Year, Executive Car of the Year and Best Family Car cate-gories. ŠKODA won awards in the Best Small Car, Best Large SUV and Best Estate Car categories with the Fabia, Kodiaq and Superb Combi. SEAT’s Ateca was chosen as the Best Small SUV. The Volkswagen Passenger Cars brand won an award for the Touran in the Best MPV category, and Porsche’s 718 Cayman was voted Best Sports Car.
In early January, the expert jury at the North American International Auto Show in Detroit gave their “Eyes on Design Award” in the Best Concept Truck category to the visionary concept vehicle, I.D. BUZZ.
In January, auto motor und sport magazine chose eight Volkswagen Group models as “Best Cars 2017”. The Volks-wagen Passenger Cars brand impressed in the minicars cate-gory with the up!, while the Tiguan took the award in the compact SUV/off-road category. The Multivan from Volks-wagen Commercial Vehicles was chosen in the vans category. Audi received awards for its A1 and A3 models in the subcom-pact and compact categories respectively. Porsche impressed with its Panamera, 911 and 911 Cabriolet/Targa in the luxury, sports car and convertible categories.
In February 2017, the Audi Q2 took gold in the “German Design Award”. The compact SUV secured victory in the Excel-lent Product Design – Transportation category, particularly thanks to its distinct, polygonal design. The “German Design Award” is presented by the German Design Council and is one of the most prominent competitions in the design industry.
At the end of February 2017, the renowned American consumer magazine Consumer Reports chose Audi in its
comprehensive study for the second successive year as the best car brand, closely followed by Porsche in second place. The study rates vehicles in the road test, reliability, customer satisfaction and safety categories.
In early March 2017, the new Audi Q5 received the top five-star rating for occupant protection, child safety and pedestrian protection in the Euro NCAP crash test. Several European transport ministries, automotive clubs, insurance companies and consumer protection groups work together in the Euro NCAP tests and have been comparing the crash safety of new car models since 1997.
In March 2017, readers of the Auto Bild Allrad all-wheel-drive motoring magazine chose the Tiguan as their car of the year in the off-road and SUV category for vehicles up to €30,000. The second generation of the popular SUV, which was launched last year, will soon be complemented by the Tiguan Allspace with extended wheelbase.
Also in March 2017, the market research company YouGov surveyed 700,000 consumers in Germany on the brands offering the best value for money. ŠKODA was chosen as the winner in the automotive category for the third time in a row.
In January, a study by FOCUS Business in collaboration with the Statista Institute in Hamburg and the social network kununu named Audi as Germany’s best employer in 2017 in the automotive and suppliers category. Employees from 2,000 companies gave their individual scores, and the data was used to find the top employers in Germany. More than 100,000 individual scores were submitted.
A N N I V E R S A R I E S
On February 2, 2017, the Volkswagen plant in Zwickau cele-brated the three millionth Golf to be manufactured there since production started 26 years ago. The anniversary vehicle was a Golf R Variant 4MOTION BlueMotion Technology. In total, Volkswagen has produced more than five million units of the Polo, Golf, Golf Estate and Passat models in Zwickau until now.
On February 24, 2017, Volkswagen’s main plant in Wolfs-burg completed the 44 millionth vehicle since production began some 72 years ago: a Golf GTE. Some 18 million Golfs have rolled off the production line in Wolfsburg, making it the plant’s most produced model, followed by the Beetle, of which almost 12 million were produced until 1975.
At the beginning of March 2017, Volkswagen’s site in Bra-tislava completed the one millionth model in the New Small Family segment. The anniversary model was a cross up!.
VO L K SWA G E N T R U C K & B U S I N V E ST S I N N AV I STA R
By the end of February 2017, the responsible authorities had granted approvals for Volkswagen Truck & Bus GmbH to purchase a stake in US commercial vehicle manufacturer

Updated Information 5Key Events
Navistar International Cooperation (Navistar). Volkswagen Truck & Bus acquired 16.6% of the shares in Navistar through a capital increase. The alliance includes framework agree-ments for a strategic technology and supply cooperation and for the joint venture Global Truck & Bus Procurement LLC, based in Lisle (Illinois), which will pursue joint global sourcing opportunities. Navistar is a holding company whose subsid-iaries produce trucks, coaches, commercial and school buses, diesel engines and service parts. The partnership will focus on developing common powertrain systems, but may also entail collaboration in other areas of commercial vehicle development and purchasing. Opportunities to cooperate in the fields of autonomous driving, alternative fuel technol-ogies, and connectivity will also be examined. The aim is to jointly create new synergies and to achieve greater indepen-dence from the cycles in the industry.
I N V E STO R S A CQ U I R E S H A R E S I N H E R E
The American computer chip manufacturer Intel and a Chinese consortium consisting of NavInfo, Tencent and GIC purchased a total stake of 25% in HERE in the first quarter of 2017. The transfer of shares to Intel was completed during the first quarter. It is expected that the transaction with the Chinese consortium will be completed once regulatory approval has been obtained in the second quarter of 2017. The remaining shares will continue to be owned by There Holding B.V., in which AUDI AG, BMW AG and Daimler AG hold equal stakes. HERE develops and sells high-precision digital maps with real-time information. The aim of HERE is also to create a shared open platform enabling business models based on location data and services for cars and other business areas. S A L E O F T H I R D - PA RT Y - B R A N D D E A L E R S H I P S
As part of the strategic development of its dealer network Porsche Holding Salzburg plans to sell the dealerships of PGA Group SAS, which distribute mainly third-party-brand vehicles, to the Emil Frey Group (Switzerland). A briefing and consultation process with the employee representatives and the consent of individual manufacturers of third-party brands marketed in the retail enterprises must take place before the transaction can go ahead. In a second step, the Group’s own dealerships in France will be combined in the newly founded company Volkswagen Group Retail France. PA RT N E R S H I P S
On February 10, 2017, Volkswagen Passenger Cars brand and Mobileye signed an agreement to create a new navigation standard for automated driving from 2018 as part of the strategic partnership they entered into in 2016. Future Volks-wagen models will use Mobileye’s camera-based mapping and localization technology “Road Experience Management”
(REM). The companies will work together to gather naviga-tional data that can be used for a new generation of highly intelligent maps. The Israeli company Mobileye is one of the world’s leading producers of technologies for accident pre-vention and automated driving.
The Volkswagen Group has signed a memorandum of understanding (MoU) with Tata Motors Ltd. For Volkswagen, this marks another decisive step in the TOGETHER – Strategy 2025 program. With the MoU, the Volkswagen Group and Tata Motors are examining the opportunities for a strategic partner-ship in India, with the aim of combining the two manufac-turers’ expertise from the development of common vehicle components through to possible vehicle concepts. Tata Motors is the largest Indian automotive company and has subsidiaries and partners in the United Kingdom, South Korea, Thailand, South Africa and Indonesia.
D I E S E L I S S U E
Independent monitor appointed Larry D. Thompson has been appointed to serve as Indepen-dent Compliance Monitor at Volkswagen. The appointment is an important aspect of our plea agreement with the U.S. Department of Justice, which was announced on January 11, 2017. The plea agreement was approved by a U.S. federal court on April 21, 2017. Furthermore, Mr. Thompson will also act as an Independent Compliance Auditor under the terms of Volkswagen’s separate consent decree with the U.S. Environ-mental Protection Agency (EPA). Mr. Thompson will assess and oversee Volkswagen’s compliance with the terms of the plea agreement and consent decree for a period of three years, which include taking measures to further strengthen the company’s compliance, reporting and monitoring mecha-nisms and the implementation of an enhanced compliance and ethics program. German Federal Motor Transport Authority approves technical solutions During the first quarter of 2017, the Kraftfahrt-Bundesamt (KBA – German Federal Motor Transport Authority) issued the outstanding official approvals needed for technical modifi-cation of 14 thousand Volkswagen Group vehicles fitted with four-cylinder diesel engines. In doing so, the technical solu-tions for all vehicles were approved without exception.
The KBA ascertained for all approved clusters (groups of vehicles) that implementation of the technical solutions would not bring about any unfavorable changes in fuel con-sumption, engine power, torque or noise emissions. Once the modifications have been made, these vehicles will thus comply with all legal requirements and the emission standards applicable in each case.

Key Events 6 Updated Information
Change in the Group Board of Management Ms. Hiltrud D. Werner has been the Group Board of Manage-ment member responsible for “Integrity and Legal Matters” since February 1, 2017. She has succeeded Dr. Christine Hohmann-Dennhardt, who left the Board of Management of Volkswagen Aktiengesellschaft on January 31, 2017. New system for Board of Management remuneration The Supervisory Board of Volkswagen Aktiengesellschaft has resolved to adjust the remuneration system of the Board of Management with effect from January 1, 2017. The adjust-ment, in which the Supervisory Board was assisted by renowned, independent external remuneration and legal con-sultants, results in an alignment with the new Group strategy TOGETHER 2025 and fully implements the requirements of the Aktiengesetz (AktG – German Stock Corporation Act) and the recommendations of the German Corporate Governance Code.
The Supervisory Board and Board of Management have resolved to propose the approval of the new remuneration system for Board of Management members to the Annual General Meeting on May 10, 2017.
Overview
The new remuneration system for the Board of Management consists of a fixed and two variable components, comprising an annual bonus with a one-year assessment period and a long-term incentive (“LTI”) in the form of a so-called perfor-mance share plan with a three-year term extending into the future.
If 100% of the respectively agreed targets are achieved, the annual target remuneration for each member of the Board of
Management shall amount to a total of €4,500,000 (corre-sponding to a basic remuneration of €1,350,000, a target amount for the annual bonus of €1,350,000 and a target amount for the performance share plan of €1,800,000) and to a total of €9,000,000 for the Chairman of the Board of Manage-ment (basic remuneration of €2,125,000, a target amount for the annual bonus of €3,045,000, and a target amount for the performance share plan of €3,830,000). Annual bonus
The annual bonus is based upon the result for the respective fiscal year. The target amount for the annual bonus shall depend, in each case for 50%, on the operating profit achieved by the Volkswagen Group plus the proportionate operating profit of the Volkswagen Group in China, as well as on the operating return on sales achieved by the Volkswagen Group. The portion of the annual bonus shall only be payable if certain respective thresholds are exceeded. For the calculation of the bonus amount, both components are taken into account by 50% each.
The calculated payment amount may be individually increased or reduced by up to 20% by the Supervisory Board, taking into account the degree of achievement of individual targets agreed between the Supervisory Board and the respective member of the Board of Management, as well as the success of the entire Board of Management in achieving the transformation of the Volkswagen Group’s staff into new areas of activity.
The payment amount for the annual bonus shall be capped at 180% of the target amount for the annual bonus.

Updated Information 7Key Events
Performance share plan
In the future, the LTI shall be granted to the Board of Manage-ment in the form of a so-called performance share plan. Each performance period of the performance share plan shall have a term of three years. At the time the LTI is granted, the annual target amount under the LTI shall be converted, on the basis of the initial price of the Volkswagen preference share, into phantom preference shares of Volkswagen Aktien-gesellschaft, which shall be allocated to the respective member of the Board of Management as a pure calculation position. The final determination of the number of phantom Volks-wagen preference shares occurs for one-third at the end of each year of the three-year performance period, in accor-dance with the degree of target achievement for the annual earnings per Volkswagen preference share.
After the end of the three-year term of the performance share plan, a cash settlement shall take place. The payment amount corresponds to the final number of determined phantom Volkswagen preference shares, multiplied by the amount resulting from the closing price at the end of the three-year period plus the dividend equivalent for the rele-vant term.
The payment amount under the performance share plan shall be limited to 200% of the target amount.
Total remuneration cap
Beyond the cap for the individual variable components of the remuneration for the members of the Board of Management, the annual benefits received according to the Code, con- sisting of the basic remuneration and the variable remuner-ation components (i.e. annual bonus and performance share plan) for one fiscal year, shall not exceed an amount of
€10,000,000 for the Chairman of the Board of Management and of €5,500,000 for each member of the Board of Manage-ment. Further remuneration regulations With regard to the existing defined contribution pension schemes for the current members of the Board of Manage-ment of Volkswagen Aktiengesellschaft, the basis to determine the pension contributions shall in each case be increased by the difference between the previous basic remuneration and the newly determined basic remuneration (at an unchanged contribution rate of 50% of the basic remuneration).
The increase of the basic remuneration shall not be taken into account for the currently incumbent members of the Board of Management of Volkswagen Aktiengesellschaft with an existing occupational pension based on the final remuner-ation.
With regard to new members of the Board of Manage-ment appointed in the future with a defined contribution pension scheme, a contribution rate of 40% of the basic remuneration will be credited to the pension account.
Regular review and adjustment
The Supervisory Board shall regularly review and, if neces-sary, increase or adjust the level of the total remuneration cap and the individual targets.

Volkswagen Shares 8 Interim Management Report
In the period from January to March 2017, prices on the international equity markets rose amid volatile trading.
The DAX also recorded an increase compared with the end of 2016. Positive sentiment was generated by the promising economic performance of important industri-alized nations, strong corporate results, the US Federal Reserve’s more moderate than expected raising of interest rates and the outcome of the elections in the Netherlands. At times, however, uncertainty as regards the economic policy of the new US government and the outcome of the elections in the Netherlands and France weighed on share prices.
In the first quarter of 2017, Volkswagen AG’s preferred and ordinary shares trailed behind the rising market trend amid high volatility. After settlement agreements in the United States in connection with the diesel issue were well received by the market, uncertainty about further legal risks in this context prevailed.
Information and explanations on earnings per share can be found in the notes to the interim consolidated financial
statements. Additional Volkswagen share data, plus corporate news, reports and presentations can be downloaded from our website at www.volkswagenag.com/ir.
VO L K SWA G E N K E Y S H A R E F I G U R E S A N D M A R K E T I N D I C E S F R O M
J A N UA RY 1 TO M A R C H 3 1 , 2 0 1 7
P R I C E D E V E L O P M E N T F R O M D E C E M B E R 2 0 1 6 T O M A R C H 2 0 1 7Index based on month-end prices: December 31, 2016 = 100
90
100
110
120
D J F M A M J J A S O N D
90
100
110
120
Volkswagen ordinary shares +2.1%Volkswagen preferred shares +2.4%
DAX +7.2%EURO STOXX Automobiles & Parts +4.3%
Volkswagen Shares
High Low Closing
Ordinary share Price (€) 156.40 137.90 139.65
Date Jan. 25 Mar. 21 Mar. 31
Preferred share Price (€) 153.90 134.40 136.60
Date Jan. 25 Mar. 21 Mar. 31
DAX Price 12,313 11,510 12,313
Date Mar. 31 Feb. 6 Mar. 31
ESTX Auto & Parts Price 547.88 519.37 543.97
Date Mar. 29 Feb. 8 Mar. 31

Interim Management Report 9Business Development
G E N E R A L E CO N O M I C D E V E LO P M E N T
The global economy saw moderate growth in the first three months of 2017. The average expansion rate of gross domes-tic product (GDP) was up year-on-year in both the industri-alized countries and the emerging market economies. Energy and commodity prices, which have increased again in recent months, gave a boost to the economies of individual exporting countries that depend on them.
The economy of Western Europe recorded stable growth on the whole in the first quarter of 2017, though the rates of change were mixed in both Northern European and Southern European countries.
In Germany, the continuing optimism among consumers and the strong labor market situation allowed the economy to maintain its solid growth course.
The economy in Central Europe performed positively in the reporting period. Eastern Europe’s economic situation improved on the back of the slight rise in energy prices. Following a prolonged recessionary period in Russia’s eco-nomy, the turnaround that began at the end of 2016 continued in the first quarter of 2017. The ongoing conflict between Russia and Ukraine continued to weigh on the economy.
In South Africa, structural deficits and political upheaval subdued the GDP growth rate on the whole.
The US economy continued its growth trajectory in the reporting period, with significant stimulus being provided by private consumer spending. Based on the stable situation in the labor market and the inflation trend, the US Federal Reserve decided to raise its key interest rate again slightly. While the GDP growth rate in Canada was higher than in the first quarter of the previous year, growth in Mexico was weaker year-on-year.
Brazil’s economy remained in recession between January and March 2017, though economic output decreased at a somewhat slower pace than in preceding quarters. Weak domestic demand and political uncertainty weighed on per-formance. With sustained high inflation, Argentina also continued to experience economic decline.
The Chinese economy maintained its high growth momen-tum in the reporting period. India’s economy continued its positive growth trend and expanded at almost the same pace as in the prior-year quarter. Japan registered comparatively solid GDP growth.
E X C H A N G E R A T E M O V E M E N T S F R O M D E C E M B E R 2 0 1 6 T O M A R C H 2 0 1 7Index based on month-end prices: as of December 31, 2016 = 100
D J F M A M J J A S O N D
90
95
100
105
110
90
95
100
105
110
EUR to GBPEUR to USDEUR to CNY
EUR to JPY
Business Development

Business Development 10 Interim Management Report
T R E N D S I N T H E PA S S E N G E R C A R M A R K E T S
Global new passenger car registrations were up 3.3% in the first quarter of 2017 compared with the prior-year period. However, trends varied from region to region. While the markets as a whole in the regions of Western Europe, Central and Eastern Europe, Asia-Pacific and South America registered increases, and demand in North America stagnated, sales in the Middle East and Africa remained below the prior-year level.
The Western European passenger car market expanded further in the reporting period as a result of the stable eco-nomic situation, and continued its recovery in spite of rising political uncertainty. In Italy and Spain, persistently high demand for replacement vehicles and a sharp increase in new registrations for business customers led to above-average growth rates. By comparison, the pace of growth in France was slower. In the United Kingdom, the record level of the prior-year period was exceeded once again.
New passenger car registrations in Germany in the first three months of 2017 exceeded the figure for the same quarter of the previous year for the fourth year in a row. This positive result was helped in particular by the favorable overall economic environment and greater demand from private customers.
The passenger car market volume in Central and Eastern Europe saw a marked increase year-on-year in the first quarter of 2017. The EU markets in Central Europe mostly recorded high growth rates, and the market volume in Eastern Europe also expanded. Passenger car sales in Russia likewise rose slightly, starting from a very low level.
New passenger car registrations in South Africa edged up slightly again in the reporting period, with unit sales to rental companies having a stabilizing effect.
In the North America region, sales of passenger cars and light commercial vehicles in the period from January to March 2017 were virtually at the prior-year level. Demand for passenger cars and light commercial vehicles (up to 6.35 tonnes) in the USA was boosted in particular by a further increase in consumer confidence, a favorable labor market situation and attractive incentive programs from manu-facturers, but fell slightly below the high figure recorded in the previous year. The trend towards rising sales of vehicles in the SUV and pickup segments with a decrease in traditional passenger car models at the same time continued in the reporting period. The automotive markets in Canada and Mexico recorded an increase, exceeding their respective records from the prior-year quarter.
The South American markets for passenger cars and light commercial vehicles performed well on the whole in the first three months of 2017. While Brazil continued to see its market volume decline, the negative rate of change was only in the low single-digit range based on an already very low prior-year level. Brazilian car manufacturing benefited in particular from a strong increase in exports, especially to Argentina, where new registrations of passenger cars and
light commercial vehicles rose very sharply from a low prior-year figure mainly due to high manufacturer discounts.
The Asia-Pacific region recorded the highest absolute increase in new passenger car registrations in the first three months of 2017, despite the fact that the Chinese market provided only little stimulus for growth. One major reason was the bringing forward of purchases at the end of 2016 in anticipation that the tax break for vehicles with engine sizes of up to 1.6 l, which was introduced on October 1, 2015, would be revoked. The raising of the tax rate on purchases from 5.0% to 7.5% (prior to October 1, 2015: 10.0%) at the beginning of 2017 put a damper on demand. In India, pas-senger car sales rapidly recovered from the consequences of the cash reform in November 2016 and saw a return to growth in the first quarter of 2017. The Japanese passenger car market also turned in a positive performance in the reporting period on the strength of state incentives for fuel-efficient and low-emission vehicles and of the successful introduction of new models.
T R E N D S I N T H E M A R K E T S F O R C O M M E R C I A L V E H I C L E S
Global demand for light commercial vehicles was up slightly on the previous year’s level in the period from January to March 2017.
New registrations in Western Europe stabilized at the prior-year level on the back of the sustained positive eco-nomic performance. Demand in Germany in the reporting period likewise matched the level seen in the 2016 compar-ative period.
Registrations of light commercial vehicles in Central and Eastern Europe recorded a moderate increase compared with the previous year. The market trend in Russia benefited from the recovery of the ruble and falling inflation, which led to a sharp rise in registrations year-on-year in the months from January to March 2017.
In North and South America, the light vehicle market is reported as part of the passenger car market, which includes both passenger cars and light commercial vehicles.
In the Asia-Pacific region, demand for light commercial vehicles was slightly higher than in the previous year. Regis-tration volumes in China, the region’s dominant market, were also up slightly year-on-year. The number of new vehicle registrations in India saw a significant increase compared with the previous year, while Japan recorded a considerable decrease.
In the markets that are relevant for the Volkswagen Group, demand for mid-sized and heavy trucks with a gross weight of more than six tonnes was at the prior-year level in the period from January to March 2017.
Demand in Western Europe remained at the 2016 level. New registrations in Germany, Western Europe’s largest market, decreased slightly year-on-year in the first quarter of 2017. Demand in Italy developed positively, with programs to promote investment and demand for replacement vehicles pushing up demand significantly.

Interim Management Report 11Business Development
In Central and Eastern Europe, the positive economic per-formance led to far higher registration volumes than in the previous year. Demand in Russia saw a substantial improve-ment, buoyed by the incipient recovery of the economy along with declining inflation rates.
Registration volumes in South America were significantly lower than in 2016. In Brazil, the region’s largest market, demand for trucks was down substantially on the prior-year period as a result of the persistently weak economic climate. Political reforms in Argentina resulted in a very sharp increase in registration volumes between January and March 2017.
Registration volumes for mid-sized and heavy trucks in the US market in the first three months of 2017 were noticeably lower than the previous year’s level. Demand for buses in the markets that are relevant for the Volkswagen Group was at the level of the previous year in the period from January to March 2017. T R E N D S I N T H E M A R K E T S F O R P O W E R E N G I N E E R I N G
The markets for power engineering are subject to differing regional and economic factors. Consequently, their business growth trends are generally independent of each other.
In the first quarter of 2017, the marine market saw a continuation of the noticeably muted order activity but remained stable at a low level compared with the prior-year period. Due to the growing excess capacity in the transport sector, which pushed down freight rates, there was little sign of recovery in the affected container ships, tankers and bulk carrier market segments. Demand for cruise ships, passenger ferries, dredgers and government vessels was steady. Notwith-standing a slight recovery in oil prices compared with the previous year, the existing excess capacity in the offshore sector curbed investment in offshore oil production. On account of reduced market volumes, all market segments are continuing to see considerably higher competitive pressure and a sharp drop in prices as a result.
The market for power generation showed a slight recovery compared with the same period in 2016. Slightly higher demand was registered in all areas of application. Demand for energy solutions remained high, with a strong trend towards greater flexibility and decentralized availability. The shift away from oil-fired power plants towards dual-fuel and gas-fired power plants continued. Particularly on larger projects, order placement is being delayed, in some cases significantly, due to sustained muted economic growth in key emerging and developing countries and persistently difficult financing conditions for customers. In addition, increasing pressure from competition and pricing is discernable, and is having a negative impact on the earnings quality of orders.
The market for turbomachinery was stable at a low level compared with the prior-year period. Activity in the con-struction of turbomachinery is mainly dominated by global investment projects in the oil, gas and processing industry and in power generation. Project volumes in the oil and gas industry remained at a low level despite the slight recovery in the oil price. Demand for products in the processing industry and in power generation has also been weak on the whole in 2017 to date. Pressure from competition and pricing increased again.
The marine and power plant after-sales business for diesel engines performed positively overall and benefited from a continued increase in interest in long-term maintenance contracts. The after-sales market for turbomachinery was relatively stable.
D E M A N D F O R F I N A N C I A L S E R V I C E S
Demand for automotive financial services remained high in the first three months of 2017, with the year-on-year expan-sion of the overall market for passenger cars and the low key interest rates in several currency areas having a positive effect.
Higher vehicle sales particularly in Western and Central Europe again provided impetus for growth in the European market for automotive financial services. Financing and leasing continued to be the options preferred by customers, especially for purchases of new vehicles. Demand for after-sales products such as inspection contracts, maintenance and spare parts agreements and automotive-related insurance was also higher in the first quarter of 2017 than in the same period of the previous year.
In Germany, the share of loan-financed or leased new vehicles was at a high level in the reporting period. The positive demand trend both in the after-sales area and for integrated mobility solutions continued in the business customer segment in particular.
Demand for automotive financing and insurance prod-ucts in South Africa was stable in the first three months of 2017.
In the US market and in Mexico, demand for automotive financial services was also high in the first quarter of this year.
The macroeconomic and political situation in Brazil remained tense in the reporting period and had a negative impact on the consumer credit business for new vehicles as well as on sales of the country-specific financial services prod-uct Consorcio, a lottery-style savings plan.
Demand for automotive financial services across the Asia-Pacific region was again mixed. In China, the proportion of loan-financed vehicle purchases rose further compared with the prior-year period. Despite increasing restrictions on registrations in metropolitan areas, there is considerable

Business Development 12 Interim Management Report
potential to acquire new customers for automotive-related financial services, particularly in the interior of the country. Demand for financial services products stagnated in the South Korean and Japanese markets. By contrast, the Australian market was stable at a high level.
Demand for financial services in the commercial vehicles business area also varied from region to region. Whereas the growth trend from 2016 continued in the first quarter of 2017 in China and particularly in Western Europe, the truck and bus business and the related financial services market in Brazil continued to come under pressure from the tense economic situation.
VO L K SWA G E N G R O U P D E L I V E R I E S
In the first quarter of 2017, the Volkswagen Group delivered 2,495,053 vehicles to customers, a decrease of 13,026 units or 0.5% on the prior-year period. The chart on page 14 shows the changes in deliveries worldwide by month compared with the previous year. Separate details of deliveries of passenger cars and commercial vehicles are provided in the following. VO L K SWA G E N G R O U P D E L I V E R I E S
F R O M J A N UA RY 1 TO M A R C H 3 1 1
2017 2016 %
Passenger Cars 2,327,336 2,353,381 – 1.1
Commercial Vehicles 167,717 154,698 + 8.4
Total 2,495,053 2,508,079 – 0.5
1 Deliveries for 2016 have been updated to reflect subsequent statistical trends. The figures include the Chinese joint ventures.
PA S S E N G E R C A R D E L I V E R I E S WO R L D W I D E
The Volkswagen Group handed over 2,327,336 passenger cars to customers worldwide from January to March 2017, 1.1% fewer than in the prior-year period. The market as a whole grew by 3.3% in the same period. The ŠKODA (+2.5%), SEAT (+14.0%), Bentley (+53.0%), Lamborghini (+6.4%) and Porsche (+6.6%) brands reported encouraging growth rates. The Volks-wagen Passenger Cars (–1.3%) and Audi (–7.3%) brands were unable to keep pace with the previous year’s volume. Whereas demand for Volkswagen Group passenger cars was higher than in the previous year in the Western Europe, Central and Eastern Europe, and North and South America regions, deliveries in the Asia-Pacific region fell below the previous year’s level.
The table on the next page provides an overview of passenger car deliveries to customers by market in the reporting period.
Sales trends in the individual markets are as follows.
Deliveries in Europe/Other markets In Western Europe, demand for Volkswagen Group vehicles in the reporting period grew by 2.2% to 818,562 units, and thus less rapidly than the market as a whole (+ 7.4%). This trend was partly the result of the Golf model change, but was also due to the fact that customer confidence has not yet been fully restored following the diesel issue. However, the number of Group models sold was up year-on-year in most of the markets in this region. The Tiguan, Audi Q2, Audi A5 and ŠKODA Fabia models saw the highest growth rates. The new ŠKODA Kodiaq was also very well received by the market. In addition, the SEAT Ateca and Porsche Macan were very popular. In Western Europe, the Volkswagen Group’s share of the passenger car market was 20.7 (21.8)%.
From January to March 2017, sales of Volkswagen Group passenger cars in Germany were down 1.0% on the prior-year figure. The market as a whole grew by 6.7% in the same period. The Tiguan, Audi Q2, Audi Q5 and ŠKODA Fabia models saw the greatest growth in demand. Moreover, the new ŠKODA Kodiaq and new SEAT Ateca were very popular. Six Group models led the Kraftfahrt-Bundesamt (KBA – German Federal Motor Transport Authority) registration statistics in their respective segments: the up!, Polo, Golf, Tiguan, Touran and Porsche 911. In the first three months of 2017, the Golf was again the number one passenger car in Germany in terms of registrations.
The Volkswagen Group delivered 12.6% more vehicles to customers in the expanding passenger car markets in the Central and Eastern Europe region in the first quarter of this year than in the same period in 2016. We saw strong growth in the Czech Republic and Poland, and sales figures topped the previous year’s level in Russia as well. Demand for the Polo, Tiguan, ŠKODA Fabia and ŠKODA Octavia models was very encouraging. In addition, the new ŠKODA Kodiaq and SEAT Ateca models were in great demand. The Volkswagen Group’s share of the market in this region rose to 22.9 (22.1)%.
In South Africa, we handed over 1.8% more vehicles to customers in the first three months of this year than in 2016. During the same period, the growth of the market as a whole was slightly weaker. The most popular Group model in South Africa was the Polo.
Deliveries in North America From January to March 2017, deliveries to customers of the Volkswagen Group in North America rose 5.5% compared with the previous year, with the overall passenger car and light commercial vehicle market nearly stagnant. The Group’s share of the market amounted to 4.4 (4.1)%. The Jetta was the Group’s best-selling model in North America.

Interim Management Report 13Business Development
In the United States, demand for Volkswagen Group vehicles recovered in the first three months of 2017, rising 9.2% year-on-year. The market as a whole declined slightly in the same period. Models in the SUV and pickup segments remained in particularly high demand. The Golf, Passat, Audi A4, Audi Q5 and Porsche Macan models enjoyed an encouraging rise in demand.
In the growing Canadian market, we handed over 2.6% fewer vehicles to customers in the reporting period than in 2016, which was mainly due to the diesel issue. Demand for the Audi A4, Audi Q5 and Porsche Macan models developed positively.
In Mexico, the strong momentum of the market as whole continued in the first quarter of 2017. The Volkswagen Group delivered 0.2% more vehicles there than in the previous year. The Gol, Vento and SEAT Ibiza models were particularly popular. Deliveries in South America The South American markets for passenger cars and light commercial vehicles performed positively on the whole in the first three months of 2017. During this period, the Volks-wagen Group delivered 10.9% more vehicles to customers there than in the previous year. The Volkswagen Group’s share of the passenger car market in South America was 12.2 (12.0)%.
PA S S E N G E R C A R D E L I V E R I E S TO C U STO M E R S B Y M A R K E T F R O M J A N UA RY 1 TO M A R C H 3 1 1
D E LI V E R I E S ( UN I T S) C H A N G E
2017 2016 (%) Europe/Other markets 1,047,618 1,020,866 + 2.6
Western Europe 818,562 800,813 + 2.2
of which: Germany 281,074 283,788 – 1.0
United Kingdom 147,762 143,580 + 2.9
Italy 73,248 63,390 + 15.6
Spain 71,645 65,799 + 8.9France 62,794 66,804 – 6.0
Central and Eastern Europe 153,736 136,557 + 12.6
of which: Poland 37,822 31,366 + 20.6
Czech Republic 36,863 32,368 + 13.9
Russia 35,023 34,429 + 1.7
Other markets 75,320 83,496 – 9.8
of which: Turkey 25,745 30,702 – 16.1
South Africa 22,528 22,126 + 1.8
North America 210,269 199,251 + 5.5
of which: USA 135,436 124,027 + 9.2
Mexico 56,140 56,034 + 0.2
Canada 18,693 19,190 – 2.6South America 105,693 95,334 + 10.9
of which: Brazil 61,650 63,699 – 3.2
Argentina 32,718 23,531 + 39.0
Asia-Pacific 963,756 1,037,930 – 7.1
of which: China 889,608 954,346 – 6.8
Japan 23,163 22,008 + 5.2India 19,369 16,444 + 17.8
Worldwide 2,327,336 2,353,381 – 1.1
Volkswagen Passenger Cars 1,440,924 1,459,517 – 1.3
Audi 422,603 455,869 – 7.3
ŠKODA 283,482 276,625 + 2.5
SEAT 117,272 102,914 + 14.0Bentley 2,377 1,554 + 53.0
Lamborghini 987 928 + 6.4
Porsche 59,689 55,974 + 6.6
Bugatti 2 0 x
1 Deliveries for 2016 have been updated to reflect subsequent statistical trends. The figures include the Chinese joint ventures.

Business Development 14 Interim Management Report
Brazil saw the decline in market volume slow considerably in the reporting period. At – 3.2%, demand for Volkswagen Group vehicles also decreased less sharply than in the pre-vious year. Deliveries of the Gol model were up.
Group sales between January and March 2017 were up 39.0% year-on-year in Argentina. The market as a whole grew at a similar rate during the same period. The Gol and Amarok models saw particularly encouraging performance.
Deliveries in the Asia-Pacific region In the Asia-Pacific region, the number of Volkswagen Group passenger cars sold in the first quarter of 2017 fell 7.1% below the high prior-year figure although the market as a whole grew. This was primarily due to an exceptional situation at Audi due to the strategic reorientation of the brand’s business in China. As a result, the Group’s share of the market in this region declined to 10.9 (12.2)%.
The passenger car market in China lost momentum during the reporting period. Demand for Group models in China decreased by 6.8% compared with the previous year. The Tiguan, Passat, Magotan and ŠKODA Superb models saw positive performance.
In the growing passenger car market in India, we delivered 17.8% more vehicles to customers in the first three months of this year than in 2016. In addition to the new Ameo, the ŠKODA Rapid was very popular with customers.
Volkswagen Group passenger car sales in Japan rose by 5.2% in the first quarter of 2017, topping the weak prior-year figure. The market as a whole also performed well during the same period. The Polo, Tiguan, Audi A3, Audi A4 and Porsche Macan models all registered encouraging levels of demand.
500
600
700
800
900
1,000
J F M A M J J A S O N D
500
600
700
800
900
1,000
2017201620172016
V O L K S W A G E N G R O U P D E L I V E R I E S B Y M O N T HVehicles in thousands
Interim Management Report 15Business Development
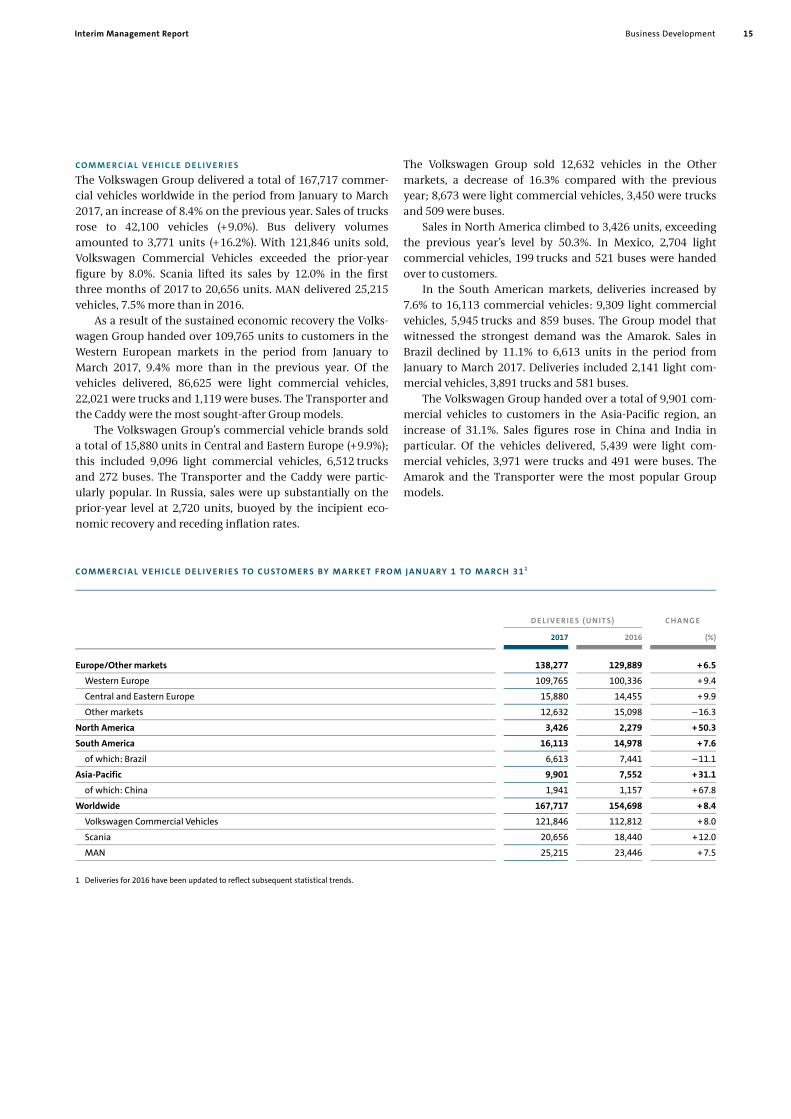
CO M M E R C I A L V E H I C L E D E L I V E R I E S
The Volkswagen Group delivered a total of 167,717 commer-cial vehicles worldwide in the period from January to March 2017, an increase of 8.4% on the previous year. Sales of trucks rose to 42,100 vehicles (+ 9.0%). Bus delivery volumes amounted to 3,771 units (+ 16.2%). With 121,846 units sold, Volkswagen Commercial Vehicles exceeded the prior-year figure by 8.0%. Scania lifted its sales by 12.0% in the first three months of 2017 to 20,656 units. MAN delivered 25,215 vehicles, 7.5% more than in 2016.
As a result of the sustained economic recovery the Volks-wagen Group handed over 109,765 units to customers in the Western European markets in the period from January to March 2017, 9.4% more than in the previous year. Of the vehicles delivered, 86,625 were light commercial vehicles, 22,021 were trucks and 1,119 were buses. The Transporter and the Caddy were the most sought-after Group models.
The Volkswagen Group’s commercial vehicle brands sold a total of 15,880 units in Central and Eastern Europe (+ 9.9%); this included 9,096 light commercial vehicles, 6,512 trucks and 272 buses. The Transporter and the Caddy were partic-ularly popular. In Russia, sales were up substantially on the prior-year level at 2,720 units, buoyed by the incipient eco-nomic recovery and receding inflation rates.
The Volkswagen Group sold 12,632 vehicles in the Other markets, a decrease of 16.3% compared with the previous year; 8,673 were light commercial vehicles, 3,450 were trucks and 509 were buses.
Sales in North America climbed to 3,426 units, exceeding the previous year’s level by 50.3%. In Mexico, 2,704 light commercial vehicles, 199 trucks and 521 buses were handed over to customers.
In the South American markets, deliveries increased by 7.6% to 16,113 commercial vehicles: 9,309 light commercial vehicles, 5,945 trucks and 859 buses. The Group model that witnessed the strongest demand was the Amarok. Sales in Brazil declined by 11.1% to 6,613 units in the period from January to March 2017. Deliveries included 2,141 light com-mercial vehicles, 3,891 trucks and 581 buses.
The Volkswagen Group handed over a total of 9,901 com-mercial vehicles to customers in the Asia-Pacific region, an increase of 31.1%. Sales figures rose in China and India in particular. Of the vehicles delivered, 5,439 were light com-mercial vehicles, 3,971 were trucks and 491 were buses. The Amarok and the Transporter were the most popular Group models.
CO M M E R C I A L V E H I C L E D E L I V E R I E S TO C U STO M E R S B Y M A R K E T F R O M J A N UA RY 1 TO M A R C H 3 1 1
D E LI V E R I E S ( UN I T S) C H A N G E
2017 2016 (%)
Europe/Other markets 138,277 129,889 + 6.5
Western Europe 109,765 100,336 + 9.4
Central and Eastern Europe 15,880 14,455 + 9.9
Other markets 12,632 15,098 – 16.3
North America 3,426 2,279 + 50.3
South America 16,113 14,978 + 7.6
of which: Brazil 6,613 7,441 – 11.1
Asia-Pacific 9,901 7,552 + 31.1
of which: China 1,941 1,157 + 67.8
Worldwide 167,717 154,698 + 8.4
Volkswagen Commercial Vehicles 121,846 112,812 + 8.0
Scania 20,656 18,440 + 12.0
MAN 25,215 23,446 + 7.5
1 Deliveries for 2016 have been updated to reflect subsequent statistical trends.

Business Development 16 Interim Management Report
D E L I V E R I E S I N T H E P O W E R E N G I N E E R I N G S E G M E N T
Orders in the Power Engineering segment are usually part of major investment projects. Lead times typically range from just under one year to several years, and partial deliveries as construction progresses are common. Accordingly, there is a time lag between incoming orders and sales revenue from the new construction business.
In the period from January to March 2017, sales revenue in the Power Engineering segment was largely driven by Engines & Marine Systems and Turbomachinery, which together generated nearly three-quarters of overall sales revenue.
G R O U P F I N A N C I A L S E R V I C E S
The Financial Services Division combines the Volkswagen Group’s dealer and customer financing, leasing, banking and insurance activities, fleet management and mobility offerings. The division comprises Volkswagen Financial Services and the financial services activities of Scania, Porsche and Porsche Holding Salzburg.
Demand for the Financial Services Division’s products and services remained strong in the first quarter of 2017. At 1.7 (1.7) million, the number of new financing, leasing, service and insurance contracts signed worldwide was on the previous year’s level. At 17.5 million the total number of contracts as of March 31, 2017 was 0.6% higher than the 2016 year-end figure. The ratio of leased or financed vehicles to Group deliveries (penetration rate) in the Financial Services Division’s markets rose to 32.7 (31.9)% in the reporting period.
In the Europe/Other markets region, the number of new contracts signed in the period from January to March 2017 increased by 1.8% to 1.3 million. As of March 31, 2017, the total number of contracts was 12.7 million, up 2.1% as against the end of December 2016. The Customer Financing/Leasing area accounted for 6.2 million contracts (+ 4.8%).
The number of contracts in North America amounted to 2.7 million at the end of the reporting period, down 4.1% on the figure as of December 31, 2016. The Customer Finan-cing/Leasing area recorded 1.7 million contracts (– 5.2%). The number of new contracts signed amounted to 192 thousand, a decrease of 13.6% versus the prior-year period.
In South America, 46 thousand new contracts were signed in the first quarter of 2017, whereas 54 thousand were signed in the same period of the previous year. The total number of contracts amounted to 601 thousand at the end of the
reporting period, 7.1% fewer than at the end of last year. The contracts mainly related to the Customer Financing/Leasing area.
The number of new contracts signed in the Asia-Pacific region rose by 6.4% to 174 thousand. The total number of contracts amounted to 1.6 million on March 31, 2017, up 0.5% as against year-end 2016; the Customer Financing/ Leasing area accounted for 1.2 million contracts (+ 2.1%).
S A L E S TO T H E D E A L E R O R G A N I Z AT I O N
In the first quarter of 2017, the Volkswagen Group’s unit sales to the dealer organization (including the Chinese joint ven-tures) amounted to 2,610,425 vehicles. This represents an increase of 1.3% on the prior-year period, attributable to higher demand in Europe. Unit sales outside Germany rose by 1.4% in the reporting period, while in the German market they were on a level with the previous year. Vehicles sold in Germany as a proportion of overall sales stood at 12.4 (12.5)%. P R O D U C T I O N
The Volkswagen Group produced a total of 2,737,577 vehicles in the period from January to March 2017, an increase of 7.1% year-on-year. Production in Germany declined by 2.7% to 665,191 units. The proportion of vehicles produced in Ger-many decreased to 24.3 (26.7)%. I N V E N TO R I E S
Global inventories at Group companies and in the dealer organization were higher on March 31, 2017 than at year-end 2016 and also up on the March 31, 2016 level. E M P L OY E E S
The Volkswagen Group had 609,138 active employees on March 31, 2017. A further 6,222 employees were in the passive phase of their partial retirement. An additional 17,431 young people were in vocational traineeships. At the end of the first quarter of 2017, the Volkswagen Group had a total of 632,791 employees worldwide, up 1.0% on the number at Decem- ber 31, 2016. Alongside the production-related expansion, significant factors for the increase were the recruitment of specialists inside and outside Germany and the expansion of the workforce in the new plants in Mexico, China and Poland. At 282,059, the number of employees in Germany was up 0.2% on year-end 2016. The proportion of employees in Germany was down slightly on December 31, 2016 at 44.6 (44.9)%.

Interim Management Report 17Results of Operations, Financial Position and Net Assets
S A L E O F T H I R D - PA RT Y - B R A N D D E A L E R S H I P S O F
P O R S C H E H O L D I N G S A L Z B U R G
In the first quarter of 2017, an agreement in principle was reached on the disposal of part of PGA Group SAS to the Emil Frey Group. The sale is planned in connection with the strategic development of Porsche Holding Salzburg’s dealer network and the corresponding focus on dealerships belonging to the Volkswagen Group brands. A briefing and consultation process with the employee representatives and the consent of individual manufacturers of third-party brands marketed in the retail enterprises must take place before the transaction can go ahead. The sale is expected to be completed in the second quarter of 2017.
The assets and liabilities of the dealerships affected by the sale are reported in the balance sheet under “assets held for sale” and “liabilities held for sale”.
R E S U LT S O F O P E R AT I O N S O F T H E G R O U P
The Volkswagen Group’s sales revenue amounted to €56.2 bil-lion in the period from January to March 2017, an increase of 10.3% compared with the previous year. This increase was mainly due to improvements in volumes and in the mix. The Volkswagen Group generated 80.0 (78.8)% of its sales revenue outside Germany.
At €11.2 (10.3) billion, gross profit was up year-on-year. The gross margin amounted to 19.9% as against 20.2% (20.5% excluding special items) in the previous year.
At €4.4 billion, the Volkswagen Group’s operating profit in the first quarter of 2017 was up €0.9 billion year-on-year due to volume-, mix- and margin-related factors, positive exchange rate effects and product cost optimization. The operating return on sales improved to 7.8 (6.8)%. In the prior-year period, this item had included positive special items totaling €+0.3 billion. In the previous year, the operating profit before special items had amounted to €3.1 billion, while the operating return on sales before special items was 6.1%.
The financial result rose by €0.5 billion to €0.3 billion; lower expenses from the measurement of derivative financial instruments on the reporting date as well as lower finance
costs due to remeasurement effects had a positive impact. The share of profits and losses of equity-accounted invest-ments was down on the prior-year figure. The income from the remeasurement of the shares in HERE following investment by further investors was offset by the share of profits and losses of equity-accounted investments in the Chinese joint ventures, which was down on the previous year. Moreover, the figure for the previous year had been favorably influenced by the income from the sale of the shares in LeasePlan.
Earnings before tax rose by €1.4 billion year-on-year to €4.6 billion. Earnings after tax amounted to €3.4 billion, an increase of €1.0 billion compared with the previous year.
R E S U LT S O F O P E R AT I O N S I N T H E PA S S E N G E R C A R S , CO M M E R C I A L
V E H I C L E S A N D P O W E R E N G I N E E R I N G B U S I N E S S A R E A S
F R O M J A N UA RY 1 TO M A R C H 3 1
€ million 2017 2016
Passenger Cars
Sales revenue 38,640 35,219
Gross profit 8,092 7,384
Operating result 3,299 2,603
Operating return on sales (%) 8.5 7.4
Commercial Vehicles
Sales revenue 8,402 7,478
Gross profit 1,394 1,249
Operating result 499 256
Operating return on sales (%) 5.9 3.4
Power Engineering
Sales revenue 783 832
Gross profit 143 172
Operating result – 30 – 9
Operating return on sales (%) – 3.8 – 1.1
Results of Operations, Financial Position and Net Assets

Results of Operations, Financial Position and Net Assets 18 Interim Management Report
1 Before special items.
Results of operations in the Automotive Division In the first three months of 2017, the Automotive Division generated sales revenue of €47.8 (43.5) billion. Increased vehicle unit sales and improvements in the mix had a positive effect. Sales revenue in the Passenger Cars and Commercial Vehicles Business Areas in the first quarter of 2017 was up significantly on the previous year, whereas the Power Engineering Business Area recorded a decline. As our Chinese joint ventures are accounted for using the equity method, the Group’s business performance in the Chinese passenger car market is reflected in consolidated sales revenue primarily by deliveries of vehicles and vehicle parts.
The volume-induced increase and higher depreciation and amortization charges from the large volume of capital expenditure had a negative effect on the cost of sales, while improvements in product costs and lower research and development costs recognized in profit or loss had a positive impact. This item had included negative special items in the previous year.
The gross profit of the Automotive Division improved to €9.6 (8.8) billion.
Distribution expenses rose partly as a result of exchange rate effects, although the ratio of distribution expenses to sales revenue declined in the reporting period. Adminis-trative expenses increased in the first quarter of 2017. However, the ratio of administrative expenses to sales revenue was virtually unchanged. Net other operating income amounted to €0.8 billion; due in part to exchange rate effects, this was €0.6 billion higher than in the previous year, in which special items had had a positive effect.
At €3.8 billion, the operating profit of the Automotive Division exceeded the prior-year figure by €0.9 billion, due to improvements in volumes, the mix and margins as well as positive exchange rate effects and product cost optimization.
The operating return on sales rose to 7.9 (6.5)%. In the prior-year period, this item had included positive special items totaling €+0.3 billion. In the prior-year quarter, the operating profit before special items amounted to €2.5 billion and the operating return on sales before special items was 5.8%. Operating profit benefited from the business performance of our Chinese joint ventures primarily in the form of deliveries of automobiles and automotive components, as the joint ventures are accounted for using the equity method and therefore included in the financial result. Results of operations in the Financial Services Division In the reporting period, the Financial Services Division recorded sales revenue of €8.4 billion; the year-on-year increase of 12.6% was largely attributable to higher business volumes.
At €1.6 (1.5) billion, gross profit was up only slightly on the previous year due to higher depreciation and amorti-zation charges.
Distribution and administrative expenses increased from January to March 2017, although the ratios of both to sales revenue declined slightly.
At €0.6 (0.6) billion, operating profit was on a level with the previous year. The operating return on sales decreased to 7.2 (7.9)%.
F I N A N C I A L P O S I T I O N O F T H E G R O U P
In the first quarter of 2017, the Volkswagen Group generated a gross cash flow of €9.8 billion, up €3.6 billion on the previous year. The change in working capital increased by €4.6 billion to €– 9.5 billion compared with the prior-year quarter. As a result, cash flows from operating activities, which amounted to €0.3 (1.4) billion, were down on the first quarter of 2016.
The Volkswagen Group’s investing activities attributable to operating activities rose by €2.3 billion to €3.5 billion in
Q1 Q2 Q3 Q4
0
1,000
2,000
3,000
4,000
20171
20161
0
1,000
2,000
3,000
4,000
20171
20161
O P E R A T I N G P R O F I T B Y Q U A R T E RVolkswagen Group in € million

Interim Management Report 19Results of Operations, Financial Position and Net Assets
the period from January to March 2017. Within this item, investments in property, plant and equipment, investment property and intangible assets, excluding capitalized develop-ment costs (capex) declined, while capitalized development costs increased. The “Acquisition and disposal of equity investments” item includes the acquisition of shares in Navistar in the period under review, while the previous year had primarily been influenced by the cash inflow from the sale of the shares in LeasePlan. F I N A N C I A L P O S I T I O N I N T H E PA S S E N G E R C A R S , CO M M E R C I A L
V E H I C L E S A N D P O W E R E N G I N E E R I N G B U S I N E S S A R E A S F R O M
J A N UA RY 1 TO M A R C H 3 1
€ million 2017 2016
Passenger Cars
Gross cash flow 6,319 2,944
Change in working capital – 6,211 – 1,691
Cash flows from operating activities 108 1,253
Cash flows from investing activities attributable to operating activities – 2,804 – 663
Net cash flow – 2,696 590
Commercial Vehicles
Gross cash flow 952 746
Change in working capital – 272 357
Cash flows from operating activities 680 1,103
Cash flows from investing activities attributable to operating activities – 582 – 409
Net cash flow 98 694
Power Engineering
Gross cash flow 42 80
Change in working capital 5 – 34
Cash flows from operating activities 47 46
Cash flows from investing activities attributable to operating activities – 32 – 45
Net cash flow 16 1
Cash outflows from financing activities were at €9.7 (11.4) bil-lion.
The Volkswagen Group’s cash and cash equivalents reported in the cash flow statement amounted to €27.3 (33.4) billion.
At the end of March 2017, the Group’s net liquidity was €– 111.4 billion, compared with €– 107.9 billion at the end of 2016.
Financial position in the Automotive Division At €7.3 billion, gross cash flow in the Automotive Division in the first three months of 2017 was up €3.5 billion on the previous year. The improved earnings had a significant
positive effect. In addition, a dividend receivable from the Chinese joint venture FAW-Volkswagen, which was already recognized in the first quarter, had a positive effect on gross cash flow compared to the previous year but also increased funds tied up in working capital by the same amount. The diesel issue resulted in cash outflows in the reporting period primarily as a result of vehicle recalls. At €– 6.5 (– 1.4) billion, the change in working capital was significantly negative. Consequently, cash flows from operating activities decreased by €1.6 billion to €0.8 billion.
Investing activities attributable to operating activities resulted in total cash outflows of €3.4 (1.1) billion in the reporting period. Capex decreased year-on-year. In addition, the ratio of capex to sales revenue declined to 3.8 (4.9)% as a result of the increased sales revenue. We invested primarily in our production facilities and in models to be launched in 2017 and 2018, as well as in the ecological focus of the model range, drivetrain electrification and modular toolkits. Capi-talized development costs rose compared with the previous year. Investing activities in the period under review include the acquisition of the shares in Navistar. In the previous year, this item reflected the sale of the LeasePlan shares.
At €– 2.6 billion, net cash flow in the Automotive Division was down €3.9 billion year-on-year.
In the Automotive Division’s financing activities, a capital increase carried out by Volkswagen AG at Volkswagen Finan-cial Services AG at the beginning of 2017 in order to finance the growth in business volumes and comply with regulatory capital requirements resulted in outflows of €1.0 billion. In addition, the Automotive Division’s financing activities included the issuance and redemption of bonds and other financial liabilities and amounted to €8.0 (7.8) billion.
On March 31, 2017, the Automotive Division recorded a net liquidity of € 23.6 billion, €3.5 billion less than at the end of 2016.
Financial position in the Financial Services Division In the first quarter of 2017, gross cash flow in the Financial Services Division was €2.5 (2.5) billion and thus on a level with the previous year. The increase in business volumes led to funds tied up in working capital of €3.0 (3.5) billion. Cash flows from operating activities amounted to €– 0.5 (– 1.0) bil-lion.
Investing activities attributable to operating activities were up on the previous year at €0.1 (0.0) billion.
The Financial Services Division recorded a cash inflow of €1.0 billion in its financing activities in the reporting period as a result of a capital increase implemented by Volks-wagen AG to finance expected business growth and to comply with stricter regulatory capital requirements. Total cash inflows from financing activities amounted to €1.7 (3.6) bil-lion.
The Financial Services Division’s negative net liquidity, which is common in the industry, stood at €– 135.1 billion at the end of March 2017 and was thus unchanged from the end of the previous year.

Results of Operations, Financial Position and Net Assets 20 Interim Management Report
CO N S O L I DAT E D B A L A N C E S H E E T ST R U C T U R E
At €425.6 billion on March 31, 2017, the Volkswagen Group’s total assets were up 3.9% on the end of 2016. The Volkswagen Group’s equity amounted to €97.0 (92.9) billion, 4.5% higher than on December 31, 2016. The equity ratio was 22.8 (22.7)%.
Due to the planned sale of Porsche Holding Salzburg’s third-party-brand dealerships, the assets and liabilities of the dealerships concerned, which belong to PGA Group SAS, are reported separately under “assets held for sale” (€2.5 billion) and “liabilities held for sale” (€1.8 billion).
Balance sheet structure in the Automotive Division Property, plant and equipment in the Automotive Division decreased slightly at the end of the first three months of 2017 compared with the end of 2016, while intangible assets remained virtually unchanged. The dividend for 2016 already resolved for the Chinese joint venture FAW-Volkswagen reduced the equity-accounted investments. The positive business results of the Chinese joint ventures, the purchase of the shares in Navistar and the remeasurement of the shares in HERE could not offset this effect. Consequently, the equity-accounted investments at the end of the first quarter of 2017 were down on December 31, 2016. Overall, non-current assets as of March 31, 2017 came close to the figure for the end of 2016. Current assets rose by 17.5%; the inventories included in this figure increased for production-related reasons and as a consequence of vehicle recalls in connection with the diesel issue. Trade receivables were higher than at the end of 2016. At €21.5 (14.5) billion, cash and cash equivalents in the Automotive Division were considerably higher than on the last reporting date.
The Automotive Division’s equity stood at € 71.7 billion at the end of the first quarter of 2017, thus exceeding the figure for December 31, 2016 by 3.7%. Healthy earnings growth, lower actuarial losses from the measurement of pension provisions, the positive effects of the measurement of deriva-tives recognized outside profit or loss and currency trans-lation effects had a positive effect on equity. The non-controlling interests are mainly attributable to RENK AG and AUDI AG. As these were lower overall than the noncontrolling interests attributable to the Financial Services Division, the figure for the Automotive Division, where the deduction was recognized, was negative.
Noncurrent liabilities were on a level with December 31, 2016. The noncurrent financial liabilities included in this item increased, while there was a decline in pension pro-visions due to an increase in the interest rate and in non-current other liabilities as a result of the positive effects from derivatives measurement.
Current liabilities rose by a total of 10.9% as of March 31, 2017. The current financial liabilities included in this item
B A L A N C E S H E E T ST R U C T U R E I N T H E PA S S E N G E R C A R S ,
CO M M E R C I A L V E H I C L E S A N D P O W E R E N G I N E E R I N G B U S I N E S S
A R E A S
€ million Mar. 31, 2017 Dec. 31, 2016
Passenger Cars
Noncurrent assets 108,293 109,918
Current assets 74,503 61,600
Total assets 182,796 171,518
Equity 56,661 54,789
Noncurrent liabilities 56,474 56,703
Current liabilities 69,661 60,026
Commercial Vehicles
Noncurrent assets 26,225 26,206
Current assets 17,581 16,197
Total assets 43,807 42,403
Equity 11,890 11,185
Noncurrent liabilities 13,932 12,531
Current liabilities 17,984 18,687
Power Engineering
Noncurrent assets 2,818 2,879
Current assets 3,153 3,285
Total assets 5,971 6,165
Equity 3,136 3,157
Noncurrent liabilities 699 748
Current liabilities 2,136 2,260
increased to €5.9 (– 1.0) due to, among other factors, the reclassifications from noncurrent to current liabilities as a result of shorter remaining maturities. The figures for the Automotive Division also contain the elimination of intragroup transactions between the Automotive and Financial Services divisions. As the current financial liabilities for the primary Automotive Division were lower than the loans granted to the Financial Services Division in the previous year, a negative amount was disclosed for the prior-year period. The item “Put options and compensation rights granted to noncontrolling interest shareholders” primarily comprises the liability for the obligation to acquire the shares held by the remaining free float shareholders of MAN.
At €232.6 billion at the end of the first quarter of 2017, the Automotive Division’s total assets were 5.7% higher than on December 31, 2016.

Interim Management Report 21Results of Operations, Financial Position and Net Assets
Financial Services Division balance sheet structure The Financial Services Division had total assets of €193.0 bil-lion on March 31, 2017, an increase of 1.8% compared with the last reporting date.
Overall, noncurrent assets were up slightly as compared to December 31, 2016. The lease assets and noncurrent financial services receivables included in this item rose for volume-related reasons.
Current assets increased by 2.3%. This was primarily due to the higher cash and cash equivalents as well as an increase in receivables caused by business growth.
Approximately 45.3 (46.3)% of the Volkswagen Group’s assets were attributable to the Financial Services Division at the end of the first three months of 2017.
At €25.4 billion, the Financial Services Division’s equity at the end of the reporting period was 6.6% higher than at the end of the previous fiscal year. The capital increase imple-mented by Volkswagen AG at the beginning of the year to finance the growth in business and to meet regulatory capital requirements, as well as the good earnings growth, had a positive effect on equity. The equity ratio was 13.1 (12.5)%.
At €78.9 billion, noncurrent liabilities were up 13.8% on December 31, 2016. This increase was attributable to the funding of volume growth.
Current liabilities declined by 8.1%, while the current financial liabilities contained in this item were significantly lower.
Deposits from direct banking business amounted to €32.9 billion, compared with €33.8 billion at the end of 2016.
R E P O RT O N E X P E C T E D D E V E LO P M E N T, R I S K S A N D
O P P O RT U N I T I E S
On March 10, 2017, Volkswagen AG, Volkswagen Group of America, Inc. and certain affiliates entered into a settlement agreement resolving the environmental claims of ten states – Connecticut, Delaware, Maine, Massachusetts, New York, Oregon, Pennsylvania, Rhode Island, Vermont and Washington – for an amount of USD 157 million.
On March 24, 2017, the United States filed a motion for entry of the second partial consent decree, which had been
agreed to between Volkswagen and the Department of Justice (DOJ), the US Environmental Protection Agency (EPA), the US environmental authority of California – the California Air Resources Board (CARB) – and the California Attorney General on December 20, 2016 that resolved claims for injunc-tive relief under the US Clean Air Act and California environmental, consumer protection and false advertising laws related to the 3.0 l TDI vehicles. A hearing on the motion has been scheduled for May 11, 2017.
On April 13, 2017, the federal court in the multidistrict litigation in California entered judgment on the third partial consent decree, which Volkswagen had agreed to with the DOJ and EPA on January 11, 2017 that resolved claims for civil penalties and injunctive relief under the Clean Air Act related to the 2.0 l and 3.0 l TDI vehicles.
On April 21, 2017, the federal court in Michigan accepted Volkswagen AG’s agreement to plead guilty on January 11, 2017 and to pay a USD 2.8 billion criminal penalty, and imposed a sentence of three years’ probation.
Also on April 21, 2017, the Canadian court approved the settlement agreement entered into between consumers and Volkswagen AG and other Canadian and U.S. Volkswagen Group companies relating to 2.0 l diesel vehicles.
The public prosecutor’s office in Munich initiated a criminal investigation against persons unknown in connection with 3.0 l TDI vehicles distributed in the United States. The criminal investigation is still at an early stage and further progress remains to be seen.
Beyond this, there were no significant changes in the reporting period compared with the disclosures on the Volks-wagen Group’s expected development in fiscal year 2017 in the “Report on Expected Developments” and “Report on Risks and Opportunities” chapters – including the “Risks from the diesel issue” and “Litigation/Diesel issue” sections and the underlying description of the issues in the chapter entitled “Diesel Issue” – of the combined management report in the 2016 Annual Report or in publications released by the reporting date, as well as the investigations and interviews in connection with the diesel issue.
This report contains forward-looking statements on the business development of theVolkswagen Group. These statements are based on assumptions relating to thedevelopment of the economic and legal environment in individual countries andeconomic regions, and in particular for the automotive industry, which we have made onthe basis of the information available to us and which we consider to be realistic at thetime of going to press. The estimates given entail a degree of risk, and actualdevelopments may differ from those forecast. Any changes in significant parameters
relating to our key sales markets, or any significant shifts in exchange rates relevant to the Volkswagen Group, will have a corresponding effect on the development of our business. In addition, expected business development may vary if the assessments of the factors influencing sustainable value enhancement, as well as risks and opportunities presented in the 2016 Annual Report develop in a way other than we are currently expecting, or additional risks and opportunities or other factors emerge that affect the development of our business.
Outlook 22 Interim Management Report
The Volkswagen Group’s Board of Management expects the global economy to record slightly higher growth in 2017 than in the previous year. We believe risks will arise from protec-tionist tendencies, turbulence in the financial markets and structural deficits in individual countries. In addition, growth prospects will continue to be hurt by geopolitical tensions and conflicts. We expect the economic upturn to continue in the large majority of industrialized nations, with stable rates of expansion overall. Most emerging markets will probably see faster growth than in the previous year. We expect the strongest rates of expansion in Asia’s emerging economies.
We expect trends in the passenger car markets in the individual regions to be mixed in 2017. Overall, growth in global demand for new vehicles will probably be slowler than in 2016. We anticipate that sales volume in Western Europe and the German passenger car market will be on a level with the previous year. In the Central and Eastern European markets, demand for passenger cars should exceed the weak prior-year figure. We expect that the market volume for pas-senger cars and light commercial vehicles (up to 6.35 tonnes) in North America in 2017 will be a little lower than the prior-year figure. On the South American market for passenger cars and light commercial vehicles, overall demand is expected to rise slightly compared with the previous year. The passenger car markets in the Asia-Pacific region look set to continue their growth trajectory at a slightly weaker pace.
We expect trends in the markets for light commercial vehicles in the individual regions to be mixed again in 2017. Overall, we envisage a slight increase in demand.
In the markets for mid-sized and heavy trucks that are relevant for the Volkswagen Group, new registrations in 2017 are set to rise slightly above the prior-year level, while a moderate year-on-year increase is expected in new registra-tions of buses in the relevant markets.
We believe that automotive financial services will con-tinue to be very important for vehicle sales worldwide in 2017.
The Volkswagen Group is well positioned to deal with the mixed developments in automotive markets around the world. Our broad, selectively expanded product range fea-turing the latest generation of engines and a variety of alternative drives puts us in a good position globally com-pared with our competitors. The Group’s further strengths include in particular its unique brand portfolio, its steadily growing presence in all major world markets and its wide selection of financial services. Our range of models covers almost all key segments, with offerings from small cars to super sports cars in the passenger car segment, and from pickups to heavy trucks and buses in the commercial vehicles segment, as well as motorcycles. The Volkswagen Group brands will further optimize their vehicle and drivetrain portfolio in 2017 to concentrate on the most attractive and fastest-growing market segments.
Our goal is to offer all customers the mobility and inno-vations they need, sustainably strengthening our competitive position in the process.
We expect that deliveries to customers of the Volkswagen Group in 2017 will moderately exceed the prior-year volume amid persistently challenging market conditions.
Challenges will arise particularly from the economic situation, intense competition in the market, exchange rate volatility and the diesel issue.
We expect the sales revenues of the Volkswagen Group and of the Passenger Car Business Area and Commercial Vehi-cles Business Area to grow by up to 4% year-on-year in 2017. In terms of the Group’s operating profit, we anticipate an operating return on sales of between 6.0% and 7.0% in 2017. In the Passenger Cars Business Area, we expect an operating return on sales in the range of 6.5 – 7.5%. For the Commercial Vehicles Business Area, we anticipate an operating return on sales of between 3.0 and 5.0%. In the Power Engineering Busi-ness Area, we expect a substantial year-on-year decline in sales revenue but also a lower operating loss. For the Finan-cial Services Division, we are forecasting sales revenue and operating profit at the prior-year level.
Outlook

Brands and Business Fields 23
S A L E S R E V E N U E A N D O P E R AT I N G P R O F I T B Y B R A N D A N D B U S I N E S S F I E L D
The Volkswagen Group generated sales revenue of €56.2 (51.0) billion in the first quarter of 2017. Operating profit before special items rose by €1.2 billion to €4.4 billion. In the previous year, special items totaling €+ 0.3 billion had to be accounted for.
When realigning our Group structures, we have reclassi-fied companies from the Volkswagen Passenger Cars brand to the Group starting in 2017. This will allow us to increase transparency and comparability. Along with cross-brand logistics and other services, importers that also distribute vehicles from other Group brands will be separated from the Volkswagen Passenger Cars brand. These will be disclosed in the line “Other” and will continue to be presented in the Passenger Cars Business Area. For the Volkswagen Passenger Cars brand, the reclassifications lead to reductions in unit sales, sales revenue and operating profit. The Volkswagen Passenger Cars brand sold 0.9 (1.1) million vehicles in the reporting period. This figure includes 754 (742) thousand Volkswagen models. The Golf, Golf Estate, Touran and Tiguan models were in high demand. At €19.0 billion, sales revenue was down 24.0% year-on-year as a result of companies being reclassified. Operating profit rose to €869 (73) million (previous year’s figure excludes special items). In addition to volume-, mix- and margin-related factors, exchange rate effects had a positive impact.
The Audi brand’s unit sales amounted to 375 (388) thou-sand vehicles worldwide in the period from January to March 2017. The Chinese joint venture FAW-Volkswagen sold a further 121 (138) thousand Audi vehicles. The Q2 and A5 were especially popular among customers. At €14.4 (14.5) billion,
sales revenue remained at the prior-year level. Operating profit decreased to €1.2 (1.3) billion due to volume-related factors (previous year’s figure excludes special items). The expansion of the international model and technology portfolio also led to higher depreciation and amortization charges. Exchange rate effects as well as improvements in margins and in the mix had a positive impact. The financial key performance indicators for the Audi brand also include the Lamborghini and Ducati brands. Ducati sold 14,130 (17,344) motorcycles in the first quarter of 2017.
The ŠKODA brand lifted its unit sales in the first three months of 2017 to 252 (207) thousand vehicles. The Fabia, Rapid and Superb models saw the highest growth rates. The new Kodiaq met with a very positive reception in the market and had a major part in boosting unit sales. Sales revenue improved by 28.3% to €4.3 billion. Operating profit, at €415 million, was 31.8% higher than in the previous year; alongside volume effects, the increase was attributable to margin-related, mix and exchange rate effects.
The SEAT brand’s unit sales, at 148 thousand vehicles, were up 16.6% year-on-year in the period from January to March 2017. This figure includes the Q3 manufactured for Audi. Demand remained high for the Ibiza and the Leon, while the new Ateca was also very popular. Sales revenue increased by 20.2% year-on-year to €2.5 billion. Operating profit exceeded the previous year’s level, at €56 (54) million. The higher volume, improved margins and positive mix effects compensated for negative exchange rate effects and cost increases.
Bentley sold 2,030 (2,033) vehicles in the first quarter of 2017. Sales revenue amounted to €361 (376) million. At €– 30 (– 54) million, the operating result was better than in
VO L K SWA G E N G R O U P
Division Automotive Financial Services
Brand/ Business Field
Volkswagen Passenger Cars
Audi ŠKODA SEAT Bentley Porsche Volkswagen Commercial Vehicles
Scania MAN Others Dealer and customer financing Leasing Direct bank Insurance Fleet management Mobility offerings
Brands and Business Fields
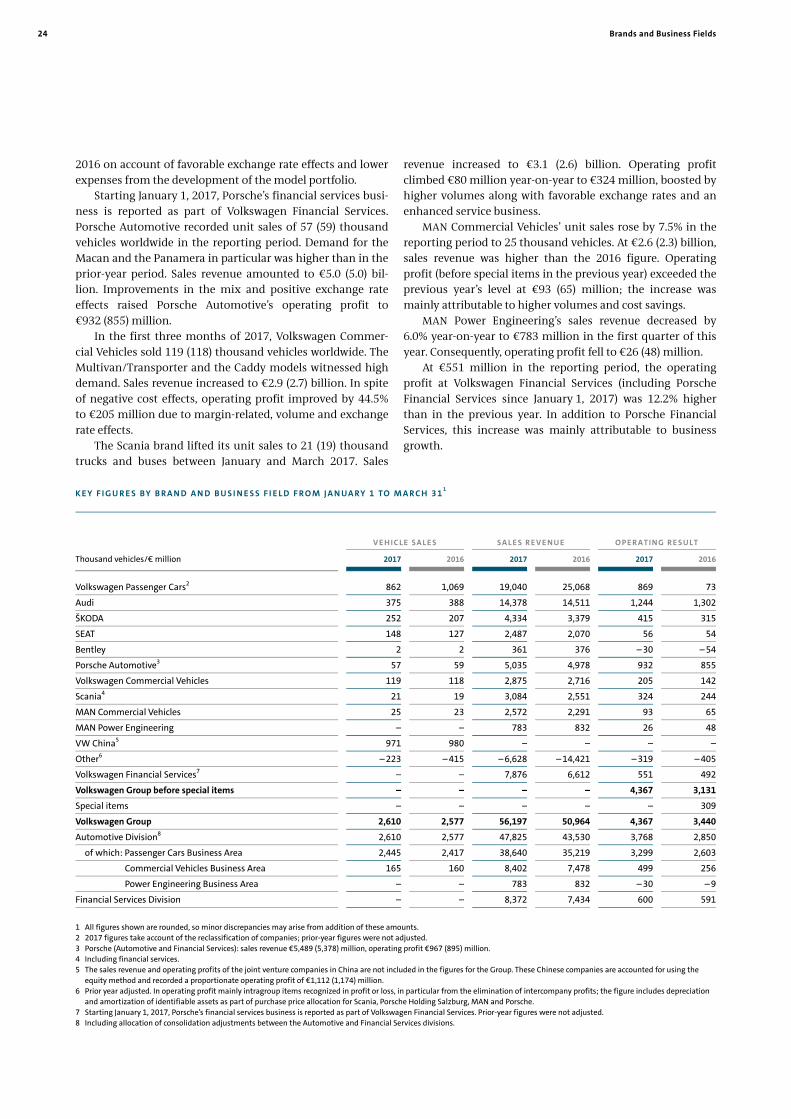
24 Brands and Business Fields
2016 on account of favorable exchange rate effects and lower expenses from the development of the model portfolio.
Starting January 1, 2017, Porsche’s financial services busi-ness is reported as part of Volkswagen Financial Services. Porsche Automotive recorded unit sales of 57 (59) thousand vehicles worldwide in the reporting period. Demand for the Macan and the Panamera in particular was higher than in the prior-year period. Sales revenue amounted to €5.0 (5.0) bil-lion. Improvements in the mix and positive exchange rate effects raised Porsche Automotive’s operating profit to €932 (855) million.
In the first three months of 2017, Volkswagen Commer-cial Vehicles sold 119 (118) thousand vehicles worldwide. The Multivan/Transporter and the Caddy models witnessed high demand. Sales revenue increased to €2.9 (2.7) billion. In spite of negative cost effects, operating profit improved by 44.5% to €205 million due to margin-related, volume and exchange rate effects.
The Scania brand lifted its unit sales to 21 (19) thousand trucks and buses between January and March 2017. Sales
revenue increased to €3.1 (2.6) billion. Operating profit climbed €80 million year-on-year to €324 million, boosted by higher volumes along with favorable exchange rates and an enhanced service business.
MAN Commercial Vehicles’ unit sales rose by 7.5% in the reporting period to 25 thousand vehicles. At €2.6 (2.3) billion, sales revenue was higher than the 2016 figure. Operating profit (before special items in the previous year) exceeded the previous year’s level at €93 (65) million; the increase was mainly attributable to higher volumes and cost savings.
MAN Power Engineering’s sales revenue decreased by 6.0% year-on-year to €783 million in the first quarter of this year. Consequently, operating profit fell to €26 (48) million.
At €551 million in the reporting period, the operating profit at Volkswagen Financial Services (including Porsche Financial Services since January 1, 2017) was 12.2% higher than in the previous year. In addition to Porsche Financial Services, this increase was mainly attributable to business growth.
K E Y F I G U R E S B Y B R A N D A N D B U S I N E S S F I E L D F R O M J A N UA RY 1 TO M A R C H 3 1 1
V E H I C LE SA LE S S A L E S R E V E N U E O P E R A T I N G R E S U LT
Thousand vehicles/€ million 2017 2016 2017 2016 2017 2016
Volkswagen Passenger Cars2 862 1,069 19,040 25,068 869 73
Audi 375 388 14,378 14,511 1,244 1,302
ŠKODA 252 207 4,334 3,379 415 315
SEAT 148 127 2,487 2,070 56 54
Bentley 2 2 361 376 – 30 – 54
Porsche Automotive3 57 59 5,035 4,978 932 855
Volkswagen Commercial Vehicles 119 118 2,875 2,716 205 142
Scania4 21 19 3,084 2,551 324 244
MAN Commercial Vehicles 25 23 2,572 2,291 93 65
MAN Power Engineering – – 783 832 26 48
VW China5 971 980 – – – –
Other6 – 223 – 415 – 6,628 – 14,421 – 319 – 405
Volkswagen Financial Services7 – – 7,876 6,612 551 492
Volkswagen Group before special items – – – – 4,367 3,131
Special items – – – – – 309
Volkswagen Group 2,610 2,577 56,197 50,964 4,367 3,440
Automotive Division8 2,610 2,577 47,825 43,530 3,768 2,850
of which: Passenger Cars Business Area 2,445 2,417 38,640 35,219 3,299 2,603
Commercial Vehicles Business Area 165 160 8,402 7,478 499 256
Power Engineering Business Area – – 783 832 – 30 – 9
Financial Services Division – – 8,372 7,434 600 591
1 All figures shown are rounded, so minor discrepancies may arise from addition of these amounts. 2 2017 figures take account of the reclassification of companies; prior-year figures were not adjusted. 3 Porsche (Automotive and Financial Services): sales revenue €5,489 (5,378) million, operating profit €967 (895) million. 4 Including financial services. 5 The sales revenue and operating profits of the joint venture companies in China are not included in the figures for the Group. These Chinese companies are accounted for using the
equity method and recorded a proportionate operating profit of €1,112 (1,174) million. 6 Prior year adjusted. In operating profit mainly intragroup items recognized in profit or loss, in particular from the elimination of intercompany profits; the figure includes depreciation
and amortization of identifiable assets as part of purchase price allocation for Scania, Porsche Holding Salzburg, MAN and Porsche. 7 Starting January 1, 2017, Porsche’s financial services business is reported as part of Volkswagen Financial Services. Prior-year figures were not adjusted. 8 Including allocation of consolidation adjustments between the Automotive and Financial Services divisions.

25Brands and Business Fields
U N I T S A L E S A N D S A L E S R E V E N U E B Y M A R K E T
At 1.2 (1.1) million vehicles in the first quarter of 2017, the Volkswagen Group’s unit sales in the Europe/Other markets region exceeded the previous year’s level. Due to higher volumes, sales revenue increased to €36.1 (33.0) billion.
The Volkswagen Group sold 214 thousand vehicles in the North American market in the reporting period, a decrease of 4.1%. Sales revenue rose by 4.4% to €8.4 billion because of exchange rate effects and other factors.
In the South American markets, the Volkswagen Group’s unit sales were on a level with the previous year at
117 (120) thousand vehicles. Due to exchange rate and mix effects, sales revenue increased to €2.4 (1.8) billion.
In the Asia-Pacific region, we sold a total of 1.1 (1.1) mil-lion vehicles between January and March 2017 – including the Chinese joint ventures. Higher volumes of imports and an improved components business at our consolidated companies lifted sales revenue by 15.2% to €9.3 billion. This does not include the sales revenue of our equity-accounted Chinese joint ventures.
K E Y F I G U R E S B Y M A R K E T F R O M J A N UA RY 1 TO M A R C H 3 1 1
V E H I C LE SA LE S S A L E S R E V E N U E
Thousand vehicles/€ million 2017 2016 2017 2016
Europe/Other markets 1,187 1,134 36,083 33,000
North America 214 223 8,450 8,092
South America 117 120 2,351 1,791
Asia-Pacific2 1,093 1,100 9,313 8,082
Volkswagen Group2 2,610 2,577 56,197 50,964
1 All figures shown are rounded, so minor discrepancies may arise from addition of these amounts. 2 The sales revenue of the joint venture companies in China is not included in the figures for the Group and the Asia-Pacific market.
26 Brands and Business Fields
VO L K SWA G E N F I N A N C I A L S E R V I C E S
Volkswagen Financial Services again supported the Volks-wagen Group’s unit sales in the first quarter of 2017 with its innovative products along the automotive value chain.
Starting January 1, 2017, Porsche’s financial services busi-ness is reported within Volkswagen Financial Services; prior-year figures were not adjusted.
With effect from January 1, 2017, Volkswagen Financial Services AG acquired around 51% of the shares in LogPay Transport Services GmbH, a subsidiary of DVB Bank SE, thereby increasing its involvement in the European fuel and service card business as well as the fuel trade. Through its majority stake, Volkswagen Financial Services will integrate the Europe-wide settlement of truck – and in the future also passenger car – tolling into its offering for commercial clients. In Germany, Volkswagen Financial Services already has over 300,000 fuel and service cards in its portfolio and sells more than 380 million liters of fuel in the passenger car segment each year; further growth is expected to take place in the truck segment.
CarMobility, a wholly owned subsidiary of Volkswagen Financial Services AG, augmented its portfolio of services through the addition of a telematics solution for vehicle fleets. The FleetConnected product provides customers with comprehensive features for state-of-the-art management and enhanced efficiency of their vehicle fleet – from diagnosis and damage management to the log book and reporting.
Volkswagen Financial Services will donate €1 million to Naturschutzbund Deutschland e.V. (NABU – German Nature and Biodiversity Conservation Union) by 2020 for the German Moor Conservation Fund, aimed at sustainable conservation and renaturalization of German wetlands. These enviroments are a key element of climate protection and biodiversity. In providing this financial assistance, Volkswagen Financial Services is underlining its commitment to nature conser-vation and will continue to support NABU in the long-term implementation of its wetland conservation projects in Germany, Poland and the Baltic countries.
The main refinancing sources for Volkswagen Financial Services are money and capital market instruments, asset-backed securities (ABS) transactions and customer deposits from the direct banking business. The sixth Japanese Auto ABS transaction was successfully placed in the first quarter of 2017. The Driver Japan six securitization transaction, backed by receivables due to Volkswagen Financial Services Japan Ltd., has a volume of around JPY 60 billion, corresponding to approximately €500 million.
In the reporting period, Volkswagen Financial Services AG also successfully issued a series of borrower’s note loans with a total volume of around €900 million. Within the scope of the transaction, maturities of three, five and seven years were placed in euros and U.S. dollars, with more than 500 million in US dollars.
The number of new financing, leasing, service and insur-ance contracts signed in the first quarter of 2017 was on a level with the previous year at 1.6 (1.6) million. At 16.5 million, the total number of contracts as of March 31, 2017 was 2.0% higher than the 2016 year-end figure. The number of contracts in the Customer Financing/Leasing area rose by 3.5% as against December 31, 2016 to 9.2 million contracts. At 7.2 (7.2) million, the number of contracts in the Service/ Insurance area was on the same level as the previous year. Based on unchanged credit eligibility criteria, the penetration rate, expressed as the ratio of leased or financed vehicles to relevant Group delivery volumes, increased to 32.4 (31.7)%.
At the end of the first quarter of 2017, Volkswagen Bank managed around 1.6 (1.5) million deposit accounts.
Volkswagen Financial Services had a total of 13,689 employees as of March 31, 2017, an increase of 2.1% on the 2016 year-end level.

Interim Consolidated Financial Statements (Condensed) 27Income Statement
Income Statement for the Period January 1 to March 31
V O L K S W A G E N G R OU P D I V I S I ON S
A U T OM O T I V E ¹ F I N A N C I A L SE R V I C E S
€ million 2017 2016 2017 2016 2017 2016
Sales revenue 56,197 50,964 47,825 43,530 8,372 7,434
Cost of sales – 45,006 – 40,666 – 38,196 – 34,724 – 6,810 – 5,942
Gross profit 11,191 10,298 9,629 8,806 1,562 1,492
Distribution expenses – 5,423 – 5,104 – 5,086 – 4,788 – 337 – 316
Administrative expenses – 1,995 – 1,780 – 1,556 – 1,376 – 440 – 405
Other operating income/expense 594 27 780 207 – 186 – 181
Operating profit 4,367 3,440 3,768 2,850 600 591
Share of profits and losses of equity-accounted investments 936 1,114 941 1,095 – 5 19
Finance costs and Other financial result – 680 – 1,351 – 676 – 1,278 – 4 – 73
Financial result 256 – 237 265 – 183 – 9 – 54
Profit before tax 4,623 3,203 4,033 2,666 590 537
Income tax expense – 1,221 – 838 – 1,093 – 578 – 128 – 260
Profit after tax 3,403 2,365 2,940 2,088 463 277
of which attributable to
Noncontrolling interests 2 3 – 9 – 44 12 47
Volkswagen AG hybrid capital investors 55 56 55 56 – –
Volkswagen AG shareholders 3,345 2,306 2,894 2,076 451 230
Basic earnings per ordinary share (€)² 6.65 4.58
Diluted earnings per ordinary share (€)² 6.65 4.58
Basic earnings per preferred share (€)² 6.71 4.64
Diluted earnings per preferred share (€)² 6.71 4.64
1 Including allocation of consolidation adjustments between the Automotive and Financial Services divisions. 2 Explanatory information on earnings per share is presented in the “Earnings per share” section.
Interim Consolidated Financial Statements (Condensed)
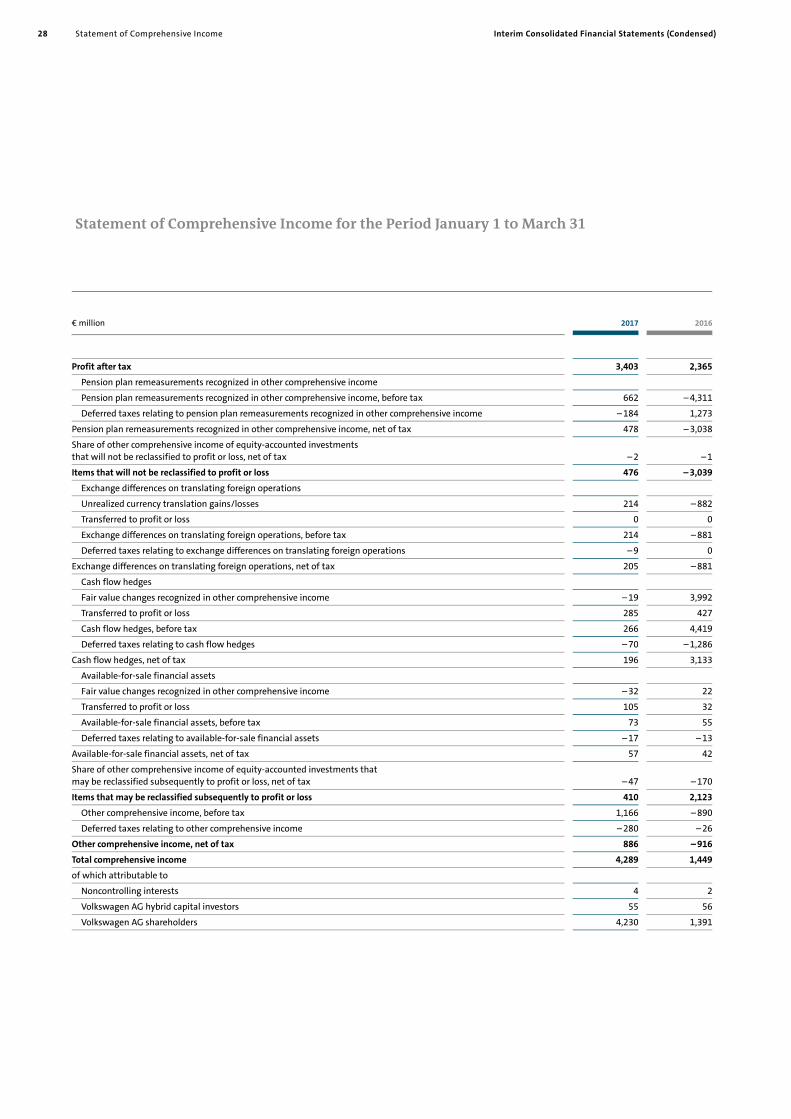
Statement of Comprehensive Income 28 Interim Consolidated Financial Statements (Condensed)
Statement of Comprehensive Income for the Period January 1 to March 31
€ million 2017 2016
Profit after tax 3,403 2,365
Pension plan remeasurements recognized in other comprehensive income
Pension plan remeasurements recognized in other comprehensive income, before tax 662 – 4,311
Deferred taxes relating to pension plan remeasurements recognized in other comprehensive income – 184 1,273
Pension plan remeasurements recognized in other comprehensive income, net of tax 478 – 3,038
Share of other comprehensive income of equity-accounted investments that will not be reclassified to profit or loss, net of tax – 2 – 1
Items that will not be reclassified to profit or loss 476 – 3,039
Exchange differences on translating foreign operations
Unrealized currency translation gains/losses 214 – 882
Transferred to profit or loss 0 0
Exchange differences on translating foreign operations, before tax 214 – 881
Deferred taxes relating to exchange differences on translating foreign operations – 9 0
Exchange differences on translating foreign operations, net of tax 205 – 881
Cash flow hedges
Fair value changes recognized in other comprehensive income – 19 3,992
Transferred to profit or loss 285 427
Cash flow hedges, before tax 266 4,419
Deferred taxes relating to cash flow hedges – 70 – 1,286
Cash flow hedges, net of tax 196 3,133
Available-for-sale financial assets
Fair value changes recognized in other comprehensive income – 32 22
Transferred to profit or loss 105 32
Available-for-sale financial assets, before tax 73 55
Deferred taxes relating to available-for-sale financial assets – 17 – 13
Available-for-sale financial assets, net of tax 57 42
Share of other comprehensive income of equity-accounted investments that may be reclassified subsequently to profit or loss, net of tax – 47 – 170
Items that may be reclassified subsequently to profit or loss 410 2,123
Other comprehensive income, before tax 1,166 – 890
Deferred taxes relating to other comprehensive income – 280 – 26
Other comprehensive income, net of tax 886 – 916
Total comprehensive income 4,289 1,449
of which attributable to
Noncontrolling interests 4 2
Volkswagen AG hybrid capital investors 55 56
Volkswagen AG shareholders 4,230 1,391

Interim Consolidated Financial Statements (Condensed) 29Balance Sheet
Balance Sheet as of March 31, 2017 and December 31, 2016
V O L K S W A G E N G R OU P D I V I S I ON S
A U T OM O T I V E 1 F I N A N C I A L SE R V I C E S
€ million 2017 2016 2017 2016 2017 2016
Assets
Noncurrent assets 253,949 254,010 137,336 139,003 116,613 115,007
Intangible assets 62,932 62,599 62,713 62,372 219 227
Property, plant and equipment 53,418 54,033 50,757 51,415 2,661 2,619
Lease assets 38,591 38,439 2,850 3,385 35,741 35,054
Financial services receivables 69,433 68,402 – 7 9 69,440 68,393
Investments, equity-accounted investments and other equity investments, other receivables and financial assets 29,575 30,537 21,024 21,822 8,552 8,715
Current assets 171,607 155,722 95,237 81,083 76,370 74,640
Inventories 42,222 38,978 38,310 34,947 3,912 4,031
Financial services receivables 50,096 49,673 – 637 – 660 50,733 50,333
Other receivables and financial assets 33,019 30,286 20,335 17,561 12,684 12,726
Marketable securities 16,084 17,520 13,290 14,703 2,794 2,817
Cash, cash equivalents and time deposits 27,704 19,265 21,506 14,532 6,198 4,733
Held for sale 2,482 – 2,433 – 49 –
Total assets 425,556 409,732 232,574 220,085 192,982 189,647
Equity and Liabilities
Equity 97,046 92,910 71,687 69,130 25,359 23,780
Equity attributable to Volkswagen AG shareholders 89,352 85,122 64,377 61,714 24,975 23,408
Equity attributable to Volkswagen AG hybrid capital investors 7,469 7,567 7,469 7,567 – –
Equity attributable to Volkswagen AG shareholders and hybrid capital investors 96,821 92,689 71,846 69,281 24,975 23,408
Noncontrolling interests 225 221 – 159 – 151 384 373
Noncurrent liabilities 149,983 139,306 71,105 69,982 78,878 69,324
Financial liabilities 77,783 66,358 7,827 5,876 69,956 60,483
Provisions for pensions 32,409 33,012 31,868 32,464 541 549
Other liabilities 39,791 39,936 31,410 31,643 8,381 8,293
Current liabilities 178,527 177,515 89,782 80,973 88,745 96,542
Put options and compensation rights granted to noncontrolling interest shareholders 3,873 3,849 3,873 3,849 – –
Financial liabilities 87,171 88,461 5,928 – 1,019 81,243 89,481
Trade payables 23,214 22,794 20,768 20,753 2,446 2,041
Other liabilities 62,432 62,411 57,414 57,391 5,018 5,021
Liabilities associated with assets held for sale 1,836 – 1,797 – 39 –
Total equity and liabilities 425,556 409,732 232,574 220,085 192,982 189,647
1 Including allocation of consolidation adjustments between the Automotive and Financial Services divisions, primarily intragroup loans.

Statement of Changes in Equity 30 Interim Consolidated Financial Statements (Condensed)
Statement of Changes in Equity
O T H E R R E S E R V E S
€ million Subscribed capital Capital reserves Retained earningsCurrency
translation reserve
Balance at Jan. 1, 2016 1,283 14,551 69,039 – 987
Profit after tax – – 2,306 –
Other comprehensive income, net of tax – – – 3,037 – 881
Total comprehensive income – – – 731 – 881
Capital increases – – – –
Dividends payment – – – –
Capital transactions involving a change in ownership interest – – – –
Other changes – – – 6 –
Balance at Mar. 31, 2016 1,283 14,551 68,302 – 1,869
Balance at Jan. 1, 2017 1,283 14,551 70,446 – 1,117
Profit after tax – – 3,345 –
Other comprehensive income, net of tax – – 477 204
Total comprehensive income – – 3,822 204
Capital increases – – – –
Dividends payment – – – –
Capital transactions involving a change in ownership interest – – – –
Other changes – – 0 –
Balance at Mar. 31, 2017 1,283 14,551 74,268 – 913

Interim Consolidated Financial Statements (Condensed) 31Statement of Changes in Equity
Cash flow hedgesAvailable-for-sale
financial assetsEquity-accounted
investments
Equity attributable to Volkswagen AG
hybrid capital investors
Equity attributable toVolkswagen AG
shareholders and hybridcapital investors
Noncontrolling interests Total equity
– 3,912 – 16 542 7,560 88,060 210 88,270
– – – 56 2,362 3 2,365
3,133 42 – 171 – – 915 – 1 – 916
3,133 42 – 171 56 1,447 2 1,449
– – – – – – –
– – – – 204 – 204 – – 204
– – – – – – –
– – 6 51 51 0 51
– 779 26 377 7,463 89,354 211 89,566
– 457 – 2 417 7,567 92,689 221 92,910
– – – 55 3,400 2 3,403
196 57 – 49 – 885 1 886
196 57 – 49 55 4,285 4 4,289
– – – – – – –
– – – – 204 – 204 – – 204
– – – – – – –
– – – 51 51 0 51
– 261 55 368 7,469 96,821 225 97,046

Cash flow statement 32 Interim Consolidated Financial Statements (Condensed)
Cash flow statement for the Period January 1 to March 31
V O L K S W A G E N G R OU P D I V I S I ON S
A U T OM O T I V E ¹ F I N A N C I A L SE R V I C E S
€ million 2017 2016 2017 2016 2017 2016
Cash and cash equivalents at beginning of period 18,833 20,462 14,125 15,294 4,709 5,168Profit before tax 4,623 3,203 4,033 2,666 590 537Income taxes paid – 821 – 1,023 – 969 – 1,465 148 442Depreciation and amortization expense² 5,281 4,762 3,513 3,220 1,768 1,541Change in pension provisions 55 17 53 17 3 1Other noncash income/expense and reclassifications³ 644 – 730 684 – 669 – 40 – 61Gross cash flow 9,783 6,229 7,314 3,770 2,469 2,460Change in working capital – 9,483 – 4,876 – 6,479 – 1,367 – 3,004 – 3,508
Change in inventories – 4,098 – 1,276 – 4,210 – 1,244 112 – 32Change in receivables – 3,723 – 3,274 – 3,364 – 3,050 – 359 – 224Change in liabilities 3,945 3,727 3,243 2,404 702 1,323Change in other provisions – 1,909 955 – 1,944 902 34 52Change in lease assets (excluding depreciation) – 2,749 – 2,854 – 174 – 360 – 2,575 – 2,494Change in financial services receivables – 949 – 2,153 – 31 – 19 – 918 – 2,134
Cash flows from operating activities 299 1,354 835 2,402 – 535 – 1,049Cash flows from investing activities attributable to operating activities – 3,512 – 1,163 – 3,418 – 1,117 – 94 – 45of which: Investments in intangible assets (excluding capitalized development costs), property, plant and equipment, and investment property – 1,903 – 2,169 – 1,840 – 2,120 – 63 – 49
capitalized development costs – 1,446 – 1,240 – 1,446 – 1,240 – –acquisition and disposal of equity investments – 297 2,175 – 257 2,176 – 40 0
Net cash flow4 – 3,213 191 – 2,583 1,285 – 630 – 1,094 Change in investments in securities, loans and time deposits 1,904 1,567 1,576 1,493 328 74
Cash flows from investing activities – 1,608 405 – 1,842 376 234 29Cash flows from financing activities 9,728 11,368 7,981 7,790 1,747 3,578
of which: capital contributions/capital redemptions – – – 1,015 – 1,015 –Effect of exchange rate changes on cash and cash equivalents 49 – 217 29 – 182 19 – 35Net change in cash and cash equivalents 8,468 12,910 7,004 10,387 1,465 2,523 Cash and cash equivalents at Mar. 315 27,302 33,372 21,128 25,681 6,173 7,691Securities, loans and time deposits 26,240 22,871 16,271 13,253 9,969 9,618Gross liquidity 53,541 56,243 37,400 38,934 16,142 17,309Total third-party borrowings – 164,954 – 154,524 – 13,755 – 12,971 – 151,199 – 141,553Net liquidity at Mar. 316 – 111,412 – 98,281 23,645 25,964 – 135,057 – 124,245
For information purposes: at Jan. 1 – 107,950 – 100,530 27,180 24,522 – 135,130 – 125,052
1 Including allocation of consolidation adjustments between the Automotive and Financial Services divisions. 2 Net of impairment reversals. 3 These relate mainly to the fair value measurement of financial instruments, application of the equity method and reclassification of gains/losses on disposal of noncurrent assets and
equity investments to investing activities. 4 Net cash flow: cash flows from operating activities, net of cash flows from investing activities attributable to operating activities (investing activities excluding change in investments
in securities, loans and time deposits). 5 Cash and cash equivalents comprise cash at banks, checks, cash-in-hand and call deposits. 6 The total of cash, cash equivalents, securities, loan receivables from related parties and time deposits net of third-party borrowings (noncurrent and current financial liabilities).
Explanatory notes on the cash flow statement are presented in the note relating to the cash flow statement.

Interim Consolideted Financial Statements (Condensed) 33Notes to the Interim Consolidated Financial Statements
Accounting in accordance with International Financial Reporting Standards (IFRSs)
In accordance with Regulation No. 1606/2002 of the European Parliament and of the Council, Volkswagen AG prepared its consolidated financial statements for 2016 in compliance with the International Financial Reporting Standards (IFRS), as adopted by the European Union. These interim consolidated financial statements for the period ended March 31, 2017 were therefore also prepared in accordance with IAS 34 and are condensed in scope compared with the consolidated financial statements.
All figures shown are rounded, so minor discrepancies may arise from addition of these amounts. In addition to the reportable segments, the Automotive and Financial Services divisions are presented in
the condensed interim group financial report for explanatory purposes alongside the income statement, balance sheet and cash flow statement for the Volkswagen Group. This supplemental presentation is not required by IFRSs. Eliminations of intragroup transactions between the Automotive and Financial Services divisions are allocated to the Automotive Division.
The accompanying interim consolidated financial statements were reviewed by auditors in accordance with section 37w of the Wertpapierhandelsgesetz (WpHG – German Securities Trading Act).
Accounting policies
Volkswagen AG has applied all accounting pronouncements adopted by the EU and effective for periods beginning on or after January 1, 2017.
From January 1, 2017, IAS 7 (Statement of Cash Flows) requires entities to make additional disclosures on changes arising from cash flows and noncash changes in financial liabilities arising from financing activities as reported in the statement of cash flows. These disclosures must be made for the first time in the notes to the 2017 annual financial statements.
Since January 1, 2017, the amendments to IAS 12 (Income Taxes) have clarified the recognition of deferred tax assets for unrealized losses in the case of assets carried at fair value.
The IASB amended IFRS 12 (Disclosures of Interests in Other Entities) as part of its 2016 annual improvements project, with effect from January 1, 2017. This clarifies that disclosures in accordance with IFRS 12 must also be made for the entity’s interests in subsidiaries, joint arrangements, associates and unconsolidated structured entities even if these are classified as held for sale or held for distribution to owners or as discontinued operations.
The amendments do not materially affect the Volkswagen Group’s net assets, financial position and results of operations. Transposition of the amendments outlined into European law has not yet taken place; this is expected for the second and/or third quarters of 2017.
A discount rate of 1.9% (December 31, 2016: 1.79%) was applied to German pension provisions in the accompanying interim consolidated financial statements. The increase in the discount rate reduced pension provisions and deferred taxes attributable to pension provisions and also reduced the actuarial losses for pension provisions that are recognized in retained earnings.
The income tax expense for the interim reporting period was calculated on the basis of the average annual tax rate that is expected for the entire fiscal year, in accordance with IAS 34, Interim Financial Reporting.
In other respects, the same accounting policies and consolidation methods that were used for the 2016 consolidated financial statements are generally applied to the preparation of the interim consolidated financial statements and the measurement of the prior-year comparatives. A detailed description of the policies
Notes to the Interim Consolidated Financial Statements

Notes to the Interim Consolidated Financial Statements 34 Interim Consolidated Financial Statements (Condensed)
and methods applied is published in the “Accounting policies” section of the notes to the 2016 consolidated financial statements. This can also be accessed on the Internet at www.volkswagenag.com/ir.
Key events
On September 18, 2015, the U.S. Environmental Protection Agency (EPA) publicly announced in a “Notice of Violation” that irregularities in relation to nitrogen oxide (NOX) emissions had been discovered in emissions tests on certain vehicles with Volkswagen Group diesel engines. This was followed by further reports on the scope of the diesel issue. Detailed information can be found in the “Key events” section of the 2016 consoli-dated financial statements.
Also, the publications released by the reporting date, as well as the investigations and interviews in connection with the diesel issue, did not provide the Group Board of Management with any new reliable findings or assessments regarding the underlying facts and the assessment of the associated risks (e.g. investor lawsuits) and did not reveal any material effects on the consolidated interim financial statements in the first quarter of fiscal year 2017.
Further information on the litigation in connection with the diesel issue can be found in the “Litigation” section.
Basis of consolidation
In addition to Volkswagen AG, which is domiciled in Wolfsburg and entered in the commercial register at the Braunschweig Local Court under No. HRB 100484, the consolidated financial statements comprise all significant German and non-German subsidiaries, including structured entities, that are controlled directly or indirectly by Volkswagen AG. This is the case if Volkswagen AG obtains power over the potential subsidiaries directly or indirectly from voting rights or similar rights, is exposed, or has rights to, positive or negative variable returns from its involvement with the subsidiaries, and is able to influence those returns. CO N S O L I DAT E D S U B S I D I A R I E S
In the first quarter of 2017, an agreement in principle was reached on the disposal of part of PGA Group SAS, Paris, France, by POFIN Financial Services Verwaltungs GmbH, Freilassing, to the Emil Frey Group. The planned sale is associated with the strategic development of Porsche Holding Salzburg’s dealer network and the related focus on dealerships of the Volkswagen Group brands.
The transaction would encompass dealerships in Poland, the Netherlands, Belgium and in some cases also in France. These dealerships generated revenue of around €4.6 billion in fiscal year 2016 and employ around nine thousand people. A briefing and consultation process with the employee representatives and the consent of individual manufacturers of third-party brands marketed in the retail enterprises must take place before the transaction can go ahead. The transaction is expected to be completed in the second quarter of 2017.
In accordance with IFRS 5, the assets and liabilities attributable to the dealerships involved in the trans-action are each presented in a separate line of the balance sheet. The total assets presented separately in the amount of €2.5 billion mainly consist of current leased assets (€598 million) and inventories (€997 million). The reclassified liabilities in the amount of €1.8 billion principally comprise noncurrent and current other liabilities (€802 million) and trade payables (€688 million).

Interim Consolideted Financial Statements (Condensed) 35Notes to the Interim Consolidated Financial Statements
I N V E STM E N T S I N A S S O C I AT E S
At the beginning of September 2016, Volkswagen Truck & Bus GmbH, a wholly owned subsidiary of Volks-wagen AG, and the US-based commercial vehicle manufacturer Navistar International Corporation, Lisle, USA (Navistar), announced that it had signed an agreement to forge a wide-ranging alliance. The cooperation primarily involves working together on technical components and in procurement. The transaction closed on February 28, 2017. Within the framework of a capital increase, Volkswagen Truck & Bus acquired 16.6% of the shares in Navistar, paying USD 15.76 per share. The purchase price came to €0.3 billion. Due to Volkswagen’s representation on the Board of Directors of Navistar and the agreed cooperation, the investment in Navistar is reported as an equity-accounted investment in the consolidated financial statements. The purchase price allocation has not yet been completed.
Audi, the BMW Group and Daimler AG each acquired a 33.3% interest in There Holding B.V., Rijswijk, the Netherlands, which was formed in 2015. In December 2016, There Holding B.V. signed contracts to sell shares in HERE International B.V. A 15% share was acquired by Intel Holdings B.V. and a 10% share by a Chinese consortium consisting of NavInfo Co. Ltd., Tencent Holdings Ltd. and GIC Private Ltd. The transaction with Intel was completed on January 31, 2017. This led to a loss of control within the meaning of IFRS 10 at the level of There Holding B.V. The deconsolidation gave rise to a proportionate effect on earnings of €183 million for Volkswagen that is presented in the share of profits and losses of equity-accounted investments. Since a significant influence continues to exist, Here International B.V. is included in the financial statements of There Holding B.V. as an associate using the equity method. It is expected that the transaction with the Chinese consortium will be completed once regulatory approval has been obtained in the second quarter of 2017. I N T E R E ST S I N J O I N T V E N T U R E S
Through its 50% interest in the joint venture Global Mobility Holding B.V., Amsterdam, the Netherlands (GMH), the Volkswagen Group held a 50% indirect stake in the joint venture’s subsidiary, LeasePlan Corporation N.V., Amsterdam, the Netherlands (LeasePlan). GMH’s business activity consisted of holding the interest in LeasePlan. LeasePlan is a Dutch financial services group whose core business is leasing and fleet management. GMH’s principal place of business is in Amsterdam, the Netherlands.
On July 23, 2015, GMH sold its 100% interest in LeasePlan to a consortium of international investors. The final approvals for the sale of LeasePlan to an international consortium of investors were issued by the competent authorities in January 2016. Legal transfer of the LeasePlan shares to the consortium was completed on March 21, 2016.
The total value of the transaction was approximately €3.7 billion plus interest in the amount of €31.5 million. In 2016, this had a positive effect of €2.2 billion on investing activities attributable to operating activities and net liquidity and, taking into account the disposal of equity-accounted investment in GMH, resulted in an income amount of €0.2 billion for the Volkswagen Group, which was reported in the financial result. On completion of the transaction, the existing credit line of €1.3 billion provided by the Volkswagen Group was canceled.

Notes to the Interim Consolidated Financial Statements 36 Interim Consolidated Financial Statements (Condensed)
Disclosures on the consolidated financial statements
1. Sales revenue
ST R U C T U R E O F G R O U P S A L E S R E V E N U E
Q1
€ million 2017 2016
Vehicles1 34,438 31,660
Genuine parts 3,914 3,649
Used vehicles and third-party products1 4,126 3,553
Engines, powertrains and parts deliveries 2,828 2,424
Power Engineering 782 832
Motorcycles 143 190
Leasing business 6,127 5,208
Interest and similar income 1,739 1,633
Other sales revenue 2,100 1,815
56,197 50,964
1 Prior-year figures adjusted.
For segment reporting purposes, the sales revenue of the Group is presented by segment and market. Other sales revenue comprises revenue from workshop services and license revenue, among other things. To ensure that sales revenue from company vehicles is presented consistently, sales revenue from vehicles
was reclassified to sales revenue from used vehicles and third-party products. Prior-year figures have been adjusted accordingly.
2. Cost of sales
Cost of sales includes interest expenses of €491 million (previous year: €466 million) attributable to the financial services business.
In addition to depreciation and amortization expenses, cost of sales also includes impairment losses on intangible assets, items of property, plant and equipment, and lease assets. The impairment losses identified on the basis of updated impairment tests amount to a total of €175 million (previous year: €100 million). The value in use of Volkswagen Group products is used as the basis for calculating impairment losses. The impairment losses in the current fiscal year and the previous year are primarily a result of the lower value in use of various products.

Interim Consolideted Financial Statements (Condensed) 37Notes to the Interim Consolidated Financial Statements
3. Research and development costs
Q 1
€ million 2017 2016 %
Total research and development costs 3,370 3,314 1.7
of which: capitalized development costs 1,446 1,240 16.6
Capitalization ratio in % 42.9 37.4
Amortization of capitalized development costs 851 808 5.2
Research and development costs recognized in profit or loss 2,774 2,882 – 3.7
4. Earnings per share
Basic earnings per share are calculated by dividing earnings attributable to Volkswagen AG shareholders by the weighted average number of ordinary and preferred shares outstanding during the reporting period.
Since the basic and diluted number of shares is identical, basic earnings per share also correspond to diluted earnings per share. In accordance with Article 27 of the Articles of Association of Volkswagen AG, preferred shares are entitled to a €0.06 higher dividend than ordinary shares.
Q 1
2017 2016
Weighted average number of shares outstanding Ordinary shares: basic million 295.1 295.1
diluted million 295.1 295.1Preferred shares: basic million 206.2 206.2
diluted million 206.2 206.2 Profit after tax € million 3,403 2,365Noncontrolling interests € million 2 3Profit attributable to Volkswagen AG hybrid capital investors € million 55 56Profit attributable to Volkswagen AG shareholders € million 3,345 2,306 Earnings per share Ordinary shares: basic € 6.65 4.58
diluted € 6.65 4.58Preferred shares: basic € 6.71 4.64
diluted € 6.71 4.64

Notes to the Interim Consolidated Financial Statements 38 Interim Consolidated Financial Statements (Condensed)
5. Noncurrent assets
C H A N G E S I N S E L E C T E D N O N C U R R E N T A S S E T S B E T W E E N J A N UA RY 1 A N D M A R C H 3 1 , 2 0 1 7
€ million Carrying amount
at Jan. 1, 2017
Additions/Changes in
consolidatedGroup
Disposals/Other changes
Depreciationand amortization
Carrying amountat Mar. 31, 2017
Intangible assets 62,599 1,428 18 1,078 62,932
Property, plant and equipment 54,033 1,600 – 89 2,305 53,418
Lease assets 38,439 4,549 2,484 1,913 38,591
6. Inventories
€ million Mar. 31, 2017 Dec. 31, 2016
Raw materials, consumables and supplies 5,044 4,396
Work in progress 4,411 4,408
Finished goods and purchased merchandise 27,827 25,719
Current lease assets 4,808 4,276
Prepayments 132 178
42,222 38,978
There was no requirement to recognize or reverse significant impairment losses on inventories in the reporting period.
7. Current other receivables and financial assets
€ million Mar. 31, 2017 Dec. 31, 2016
Trade receivables 13,696 12,187
Miscellaneous other receivables and financial assets 19,323 18,099
33,019 30,286
In the period January 1 to March 31, 2017, impairment losses and reversals of impairment losses on noncurrent and current financial assets reduced operating profit by €163 million (previous year: €119 million).

Interim Consolideted Financial Statements (Condensed) 39Notes to the Interim Consolidated Financial Statements
8. Equity
The subscribed capital is composed of 295,089,818 no-par value ordinary shares and 206,205,445 no-par-value preferred shares, and amounts to €1,283 million (December 2016: €1,283 million).
The noncontrolling interests are largely attributable to shareholders of RENK AG and AUDI AG.
9. Noncurrent financial liabilities
€ million Mar. 31, 2017 Dec. 31, 2016
Bonds, commercial paper and notes 59,155 51,195
Liabilities to banks 14,248 10,816
Deposit business 2,771 2,759
Other financial liabilities 1,608 1,588
77,783 66,358
10. Current financial liabilities
€ million Mar. 31, 2017 Dec. 31, 2016
Bonds, commercial paper and notes 41,553 42,004
Liabilities to banks 14,243 14,180
Deposit business 30,167 31,019
Other financial liabilities 1,208 1,257
87,171 88,461

Notes to the Interim Consolidated Financial Statements 40 Interim Consolidated Financial Statements (Condensed)
11. Fair value disclosures
The principles and techniques used for fair value measurement remained unchanged year-on-year. Detailed explanations of the measurement principles and techniques can be found in the “Accounting policies” section of the 2016 consolidated financial statements.
Fair value generally corresponds to the market or quoted market price. If no active market exists, fair value is determined using valuation techniques, such as by discounting the future cash flows at the market interest rate, or by using recognized option pricing models.
Assets and liabilities measured at fair value through profit or loss consist of derivatives or components of derivatives that are not included in hedge accounting. These relate primarily to the interest component of currency forwards used to hedge sales revenue, commodity futures and currency forwards relating to commodity futures.
Available-for-sale financial assets (debt instruments) are carried at fair value. Changes in fair value are recognized directly in equity, net of deferred taxes.
Other equity investments (shares representing an ownership interest of less than 20% as a rule) are also classified as available-for-sale financial assets. They are recognized at cost in the consolidated financial statements if there is no active market for those shares and fair values cannot be reliably ascertained without undue cost or effort. The lower present value of the estimated future cash flows is recognized if there are indications of impairment. There is currently no intention to sell these financial assets.
Uniform valuation techniques and inputs are used to measure fair value. The fair value of Level 2 and 3 financial instruments is measured in the individual divisions on the basis of Group-wide specifications. The fair value of put options and compensation rights granted to noncontrolling interest shareholders is calculated using a present value model based on the contractually agreed cash settlement, including cash compensation, as well as the minimum statutory interest rate and a risk-adjusted discount rate for a matching maturity.
Reconciliation of balance sheet items to classes of financial instruments The following table shows the reconciliation of the balance sheet items to the relevant classes of financial instruments, broken down by the carrying amount and fair value of the financial instruments.
The fair value of financial instruments measured at amortized cost, such as receivables and liabilities, is calculated by discounting using a market rate of interest for a similar risk and matching maturity. For reasons of materiality, the fair value of current balance sheet items is generally deemed to be their carrying amount. Financial instruments measured at fair value also include shares in partnerships and corporations. There is no active market for these instruments. Since the future cash flows cannot be reliably determined, fair value cannot be determined using measurement models. The shares in these companies are carried at cost. In the reconciliation presented in the following tables, equity instruments recognized at their carrying amount are allocated to Level 3 of the fair value hierarchy.
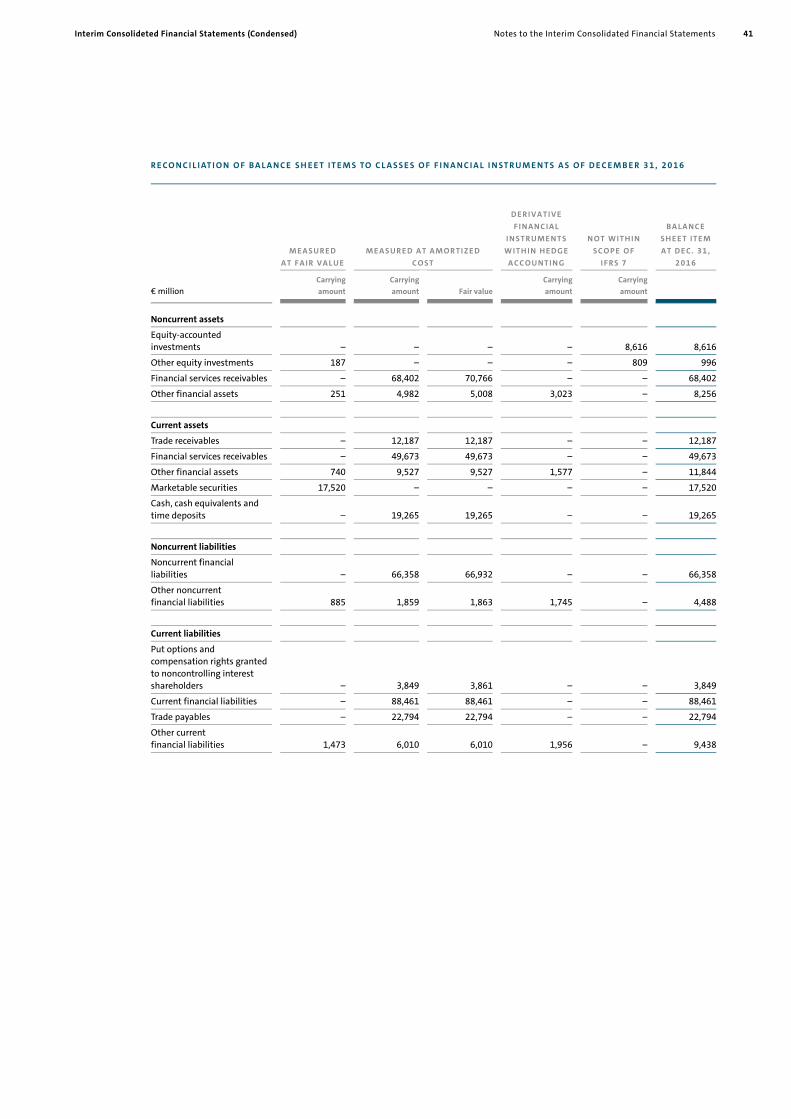
Interim Consolideted Financial Statements (Condensed) 41Notes to the Interim Consolidated Financial Statements
R E CO N C I L I AT I O N O F B A L A N C E S H E E T I T E M S TO C L A S S E S O F F I N A N C I A L I N ST R U M E N T S A S O F D E C E M B E R 3 1 , 2 0 1 6
M E A S UR E D A T F A I R V A L UE
M E A S UR E D A T A M O R T I Z E D
C O S T
D E R I V A T I V E F I N A N C I A L
I N S T R UM E N T S W I T H I N H E D G E
A C C O UN T I N G
N O T W I T H I N S C O P E O F
I F R S 7
B A LA N C E S H E E T I T E M A T D E C . 3 1 ,
2 0 1 6
€ million Carryingamount
Carryingamount Fair value
Carryingamount
Carryingamount
Noncurrent assets
Equity-accounted investments – – – – 8,616 8,616
Other equity investments 187 – – – 809 996
Financial services receivables – 68,402 70,766 – – 68,402
Other financial assets 251 4,982 5,008 3,023 – 8,256
Current assets
Trade receivables – 12,187 12,187 – – 12,187
Financial services receivables – 49,673 49,673 – – 49,673
Other financial assets 740 9,527 9,527 1,577 – 11,844
Marketable securities 17,520 – – – – 17,520
Cash, cash equivalents and time deposits – 19,265 19,265 – – 19,265
Noncurrent liabilities
Noncurrent financial liabilities – 66,358 66,932 – – 66,358
Other noncurrent financial liabilities 885 1,859 1,863 1,745 – 4,488
Current liabilities
Put options and compensation rights granted to noncontrolling interest shareholders – 3,849 3,861 – – 3,849
Current financial liabilities – 88,461 88,461 – – 88,461
Trade payables – 22,794 22,794 – – 22,794
Other current financial liabilities 1,473 6,010 6,010 1,956 – 9,438

Notes to the Interim Consolidated Financial Statements 42 Interim Consolidated Financial Statements (Condensed)
R E CO N C I L I AT I O N O F B A L A N C E S H E E T I T E M S TO C L A S S E S O F F I N A N C I A L I N ST R U M E N T S A S O F M A R C H 3 1 , 2 0 1 7
M E A S UR E D A T F A I R V A L UE
M E A S UR E D A T A M O R T I Z E D
C O S T
D E R I V A T I V E F I N A N C I A L
I N S T R UM E N T S W I T H I N H E D G E
A C C O UN T I N G
N O T W I T H I N S C O P E O F
I F R S 7
B A LA N C E S H E E T I T E M A T M A R . 3 1 , 2 0 1 7
€ million Carryingamount
Carryingamount Fair value
Carryingamount
Carryingamount
Noncurrent assets
Equity-accounted investments – – – – 8,235 8,235
Other equity investments 176 – – – 840 1,016
Financial services receivables – 69,433 71,544 – – 69,433
Other financial assets 326 4,868 4,892 2,574 – 7,767
Current assets
Trade receivables – 13,696 13,696 – – 13,696
Financial services receivables – 50,096 50,096 – – 50,096
Other financial assets 734 10,932 10,932 1,406 – 13,072
Marketable securities 16,084 – – – – 16,084
Cash, cash equivalents and time deposits – 27,704 27,704 – – 27,704
Assets held for sale 22 403 403 – 11 436
Noncurrent liabilities
Noncurrent financial liabilities – 77,783 78,501 – – 77,783
Other noncurrent financial liabilities 805 1,639 1,642 1,360 – 3,804
Current liabilities
Put options and compensation rights granted to noncontrolling interest shareholders – 3,873 3,882 – – 3,873
Current financial liabilities – 87,171 87,171 – – 87,171
Trade payables – 23,214 23,214 – – 23,214
Other current financial liabilities 1,582 6,337 6,337 1,600 – 9,519
Liabilities held for sale – 1,087 1,087 – – 1,087

Interim Consolideted Financial Statements (Condensed) 43Notes to the Interim Consolidated Financial Statements
The following tables contain an overview of the financial assets and liabilities measured at fair value:
F I N A N C I A L A S S E T S A N D L I A B I L I T I E S M E A S U R E D AT F A I R VA L U E B Y L E V E L
€ million Dec. 31, 2016 Level 1 Level 2 Level 3
Noncurrent assets
Other equity investments 187 76 – 111
Other financial assets 251 – 216 34
Current assets
Other financial assets 740 – 734 6
Marketable securities 17,520 17,520 – –
Noncurrent liabilities
Other noncurrent financial liabilities 885 – 722 163
Current liabilities
Other current financial liabilities 1,473 – 1,406 67
€ million Mar. 31, 2017 Level 1 Level 2 Level 3
Noncurrent assets
Other equity investments 176 87 – 89
Other financial assets 326 – 284 42
Current assets
Other financial assets 734 – 729 5
Marketable securities 16,084 16,084 – –
Assets held for sale 22 3 18
Noncurrent liabilities
Other noncurrent financial liabilities 805 – 627 178
Current liabilities
Other current financial liabilities 1,582 – 1,509 73

Notes to the Interim Consolidated Financial Statements 44 Interim Consolidated Financial Statements (Condensed)
D E R I VAT I V E F I N A N C I A L I N ST R U M E N T S W I T H I N H E D G E A CC O U N T I N G B Y L E V E L
€ million Dec. 31, 2016 Level 1 Level 2 Level 3
Noncurrent assets
Other financial assets 3,023 – 3,019 4
Current assets
Other financial assets 1,577 – 1,577 –
Noncurrent liabilities
Other noncurrent financial liabilities 1,745 – 1,745 0
Current liabilities
Other current financial liabilities 1,956 – 1,956 –
€ million Mar. 31, 2017 Level 1 Level 2 Level 3
Noncurrent assets
Other financial assets 2,574 – 2,574 –
Current assets
Other financial assets 1,406 – 1,406 –
Noncurrent liabilities
Other noncurrent financial liabilities 1,360 – 1,360 –
Current liabilities
Other current financial liabilities 1,600 – 1,600 –
The allocation of fair values to the three levels in the fair value hierarchy is based on the availability of observable market prices. Level 1 is used to report the fair value of financial instruments for which a price is directly available in an active market. Examples include marketable securities and other equity investments measured at fair value. Fair values in Level 2, for example of derivatives, are measured on the basis of market inputs using market-based valuation techniques. In particular, the inputs used include exchange rates, yield curves and commodity prices that are observable in the relevant markets and obtained through pricing services. Level 3 fair values are calculated using valuation techniques that incorporate inputs that are not directly observable in active markets. In the Volkswagen Group, long-term commodity futures are allocated to Level 3 because the prices available on the market must be extrapolated for measurement purposes. This is done on the basis of observable inputs obtained for the different commodities through pricing services. Options on equity instruments and residual value protection models are also reported in Level 3. Equity instruments are measured primarily using the relevant business plans and entity-specific discount rates. The significant inputs used to measure fair value for the residual value protection models include forecasts and estimates of used vehicle residual values for the appropriate models.

Interim Consolideted Financial Statements (Condensed) 45Notes to the Interim Consolidated Financial Statements
C H A N G E S I N B A L A N C E S H E E T I T E M S M E A S U R E D AT F A I R VA L U E B A S E D O N L E V E L 3
€ million Financial assets
measured at fair valueFinancial liabilities
measured at fair value
Balance at Jan. 1, 2016 119 251
Foreign exchange differences – 4 0
Total comprehensive income 2 – 6
recognized in profit or loss 1 – 7
recognized in other comprehensive income 1 1
Additions (purchases) – 2 –
Sales and settlements 0 – 14
Transfers into Level 2 – – 18
Balance at Mar. 31, 2016 115 212
Total gains or losses recognized in profit or loss 1 7
Net other operating expense/income – –
of which attributable to assets/liabilities held at the reporting date – –
Financial result 1 7
of which attributable to assets/liabilities held at the reporting date 1 22
€ million
Financial assetsmeasured at fair
value
Financial liabilities
measured at fair value
Assets held for sale
Balance at Jan. 1, 2017 152 230 –
Foreign exchange differences – 1 – –
Total comprehensive income 13 37 –
recognized in profit or loss 18 37 –
recognized in other comprehensive income – 4 0 –
Additions (purchases) 6 – 18
Sales and settlements – 10 – 14 –
Transfers into Level 2 – 7 – 2 –
Transfer into assets held for sale – 18 – –
Balance at Mar. 31, 2017 136 251 –
Total gains or losses recognized in profit or loss 18 – 37 –
Net other operating expense/income – – –
of which attributable to assets/liabilities held at the reporting date – – –
Financial result 18 – 37 –
of which attributable to assets/liabilities held at the reporting date – 2 – 36 –

Notes to the Interim Consolidated Financial Statements 46 Interim Consolidated Financial Statements (Condensed)
The transfers between the levels of the fair value hierarchy are reported at the respective reporting dates. The transfers out of Level 3 into Level 2 comprise commodity futures for which observable quoted prices are now available for measurement purposes due to the decline in their remaining maturities; consequently, no further extrapolation is required. There were no transfers between other levels of the fair value hierarchy.
Commodity prices are the key risk variable for the fair value of commodity futures. Sensitivity analyses are used to present the effect of changes in commodity prices on earnings after tax and equity.
If commodity prices for commodity futures classified as Level 3 had been 10% higher (lower) as of March 31, 2017, profit after tax would have been €7 million higher (lower) and equity would have been €– million higher (lower).
The key risk variable for measuring options on equity instruments held by the Company is the relevant enterprise value. Sensitivity analyses are used to present the effect of changes in risk variables on earnings after tax.
If the assumed enterprise values at March 31, 2017 had been 10% higher, earnings after tax would have been €1 million higher. If the assumed enterprise values at March 31, 2017 had been 10% lower, earnings after tax would have been €1 million lower.
Residual value risks result from hedging agreements with dealers under which earnings effects caused by market-related fluctuations in residual values that arise from buy-back obligations under leases are borne in part by the Volkswagen Group.
The key risk variable influencing the fair value of the options relating to residual value risks is used car prices. Sensitivity analyses are used to quantify the effects of changes in used car prices on earnings after tax.
If the prices for the used cars covered by the residual value protection model had been 10% higher as of March 31, 2017, earnings after tax would have been €252 million higher. If the prices for the used cars covered by the residual value protection model had been 10% lower as of March 31, 2017, earnings after tax would have been €252 million lower.
12. Cash flow statement
The cash flow statement presents the cash inflows and outflows in the Volkswagen Group and in the Auto-motive and Financial Services divisions. Cash and cash equivalents comprise cash at banks, checks, cash-in-hand and call deposits.
€ million Mar. 31, 2017 Mar. 31, 2016
Cash, cash equivalents and time deposits as reported in the balance sheet 27,704 33,779
Time deposits – 402 – 407
Cash and cash equivalents as reported in the cash flow statement 27,302 33,372

Interim Consolideted Financial Statements (Condensed) 47Notes to the Interim Consolidated Financial Statements
Cash inflows and outflows from financing activities are presented in the following table:
Q 1
€ million 2017 2016
Capital contributions – –
Dividends paid – 204 – 204
Capital transactions with noncontrolling interest shareholders – – 3
Other changes – 4
Proceeds from issuance of bonds 12,236 1,964
Repayments of bonds – 5,336 – 5,450
Changes in other financial liabilities 3,039 15,060
Lease payments – 7 – 2
9,728 11,368
13. Segment reporting
Segments are identified on the basis of the Volkswagen Group’s internal management and reporting. In line with the Group’s multibrand strategy, each of its brands (operating segments) is managed by its own board of management. The Group targets and requirements laid down by the Board of Management of Volkswagen AG must be complied with. Segment reporting comprises four reportable segments: Passenger Cars, Commercial Vehicles, Power Engineering and Financial Services.
The activities of the Passenger Cars segment cover the development of vehicles and engines, the production and sale of passenger cars, and the corresponding genuine parts business. Given the high degree of techno-logical and economic interlinking in the production network of the individual brands, the Passenger Cars reporting segment combines the Volkswagen Group’s individual car brands to a single reportable segment. Furthermore, there is collaboration within key areas such as procurement, research and development or treasury.
The Commercial Vehicles segment primarily comprises the development, production and sale of light commercial vehicles, trucks and buses, the corresponding genuine parts business and related services. Just as in the case of the car brands, there is collaboration within the areas procurement, development and sale. The aim is to achieve other forms of interlinking. The activities of the Power Engineering segment consist of the development and production of large-bore diesel engines, turbo compressors, industrial turbines and chemical reactor systems, as well as the production of gear units, propulsion components and testing systems. The activities of the Financial Services segment comprise dealer and customer financing, leasing, banking and insurance activities, fleet management and mobility services. In this segment, combinations occur especially while taking into account the comparability of the type of services as well as the regulatory situation permits.
Purchase price allocation for companies acquired is allocated directly to the corresponding segments. At Volkswagen, segment profit or loss is measured on the basis of the operating result. The reconciliation contains activities and other operations that by definition do not constitute
segments. It also includes the unallocated Group financing activities. Consolidation adjustments between the segments are also contained in the reconciliation.
As a matter of principle, business relationships between the companies within the segments of the Volks-wagen Group are transacted at arm’s length prices.

Notes to the Interim Consolidated Financial Statements 48 Interim Consolidated Financial Statements (Condensed)
R E P O RT I N G S E G M E N T S : Q 1 2 0 1 6
€ million Passenger CarsCommercial
VehiclesPower
Engineering FinancialServices
Totalsegments
Reconciliation
VolkswagenGroup
Sales revenue from external customers 37,535 5,837 832 6,728 50,932 32 50,964
Intersegment sales revenue 4,562 1,641 0 706 6,909 – 6,909 –
Total sales revenue 42,097 7,478 832 7,434 57,841 – 6,877 50,964
Segment profit or loss (operating profit or loss) 2,888 256 – 9 591 3,725 – 285 3,440
R E P O RT I N G S E G M E N T S : Q 1 2 0 1 7
€ million Passenger CarsCommercial
VehiclesPower
Engineering FinancialServices
Totalsegments
Reconciliation
VolkswagenGroup
Sales revenue from external customers 41,222 6,619 782 7,540 56,164 33 56,197
Intersegment sales revenue 4,628 1,782 1 832 7,243 – 7,243 –
Total sales revenue 45,850 8,402 783 8,372 63,407 – 7,210 56,197
Segment profit or loss (operating profit or loss) 3,839 499 – 30 600 4,907 – 540 4,367
R E CO N C I L I AT I O N
Q 1
€ million 2017 2016
Segment profit or loss (operating profit or loss) 4,907 3,725
Unallocated activities 26 19
Group financing 0 0
Consolidation – 565 – 305
Operating profit 4,367 3,440
Financial result 256 – 237
Consolidated profit before tax 4,623 3,203
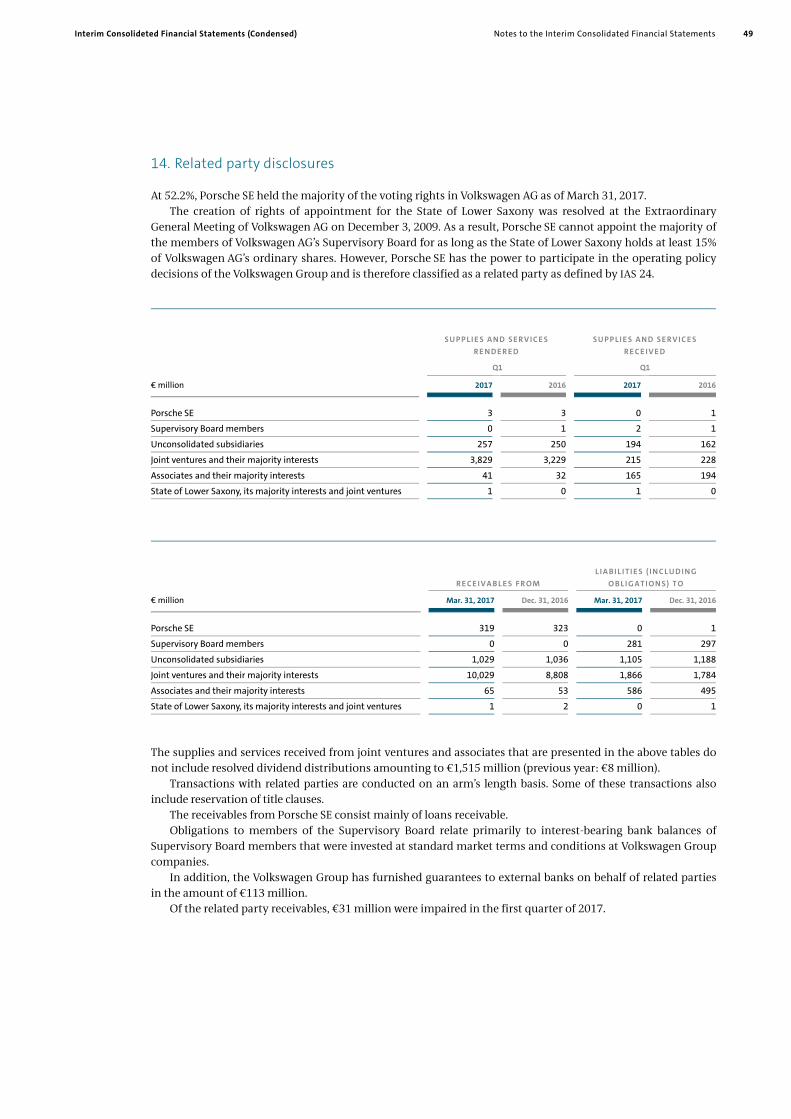
Interim Consolideted Financial Statements (Condensed) 49Notes to the Interim Consolidated Financial Statements
14. Related party disclosures
At 52.2%, Porsche SE held the majority of the voting rights in Volkswagen AG as of March 31, 2017. The creation of rights of appointment for the State of Lower Saxony was resolved at the Extraordinary
General Meeting of Volkswagen AG on December 3, 2009. As a result, Porsche SE cannot appoint the majority of the members of Volkswagen AG’s Supervisory Board for as long as the State of Lower Saxony holds at least 15% of Volkswagen AG’s ordinary shares. However, Porsche SE has the power to participate in the operating policy decisions of the Volkswagen Group and is therefore classified as a related party as defined by IAS 24.
S U P P L I E S A N D SE R V IC E S R E N D E R E D
S U P P L I E S A N D SE R V IC E S R E C E I V E D
Q1 Q1
€ million 2017 2016 2017 2016
Porsche SE 3 3 0 1
Supervisory Board members 0 1 2 1
Unconsolidated subsidiaries 257 250 194 162
Joint ventures and their majority interests 3,829 3,229 215 228
Associates and their majority interests 41 32 165 194
State of Lower Saxony, its majority interests and joint ventures 1 0 1 0
R E C E I V A B L E S F R O M
L I A BI L I T I E S ( I N C L UD I N G O B L I G A T I ON S ) T O
€ million Mar. 31, 2017 Dec. 31, 2016 Mar. 31, 2017 Dec. 31, 2016
Porsche SE 319 323 0 1
Supervisory Board members 0 0 281 297
Unconsolidated subsidiaries 1,029 1,036 1,105 1,188
Joint ventures and their majority interests 10,029 8,808 1,866 1,784
Associates and their majority interests 65 53 586 495
State of Lower Saxony, its majority interests and joint ventures 1 2 0 1
The supplies and services received from joint ventures and associates that are presented in the above tables do not include resolved dividend distributions amounting to €1,515 million (previous year: €8 million).
Transactions with related parties are conducted on an arm’s length basis. Some of these transactions also include reservation of title clauses.
The receivables from Porsche SE consist mainly of loans receivable. Obligations to members of the Supervisory Board relate primarily to interest-bearing bank balances of
Supervisory Board members that were invested at standard market terms and conditions at Volkswagen Group companies.
In addition, the Volkswagen Group has furnished guarantees to external banks on behalf of related parties in the amount of €113 million.
Of the related party receivables, €31 million were impaired in the first quarter of 2017.

Notes to the Interim Consolidated Financial Statements 50 Interim Consolidated Financial Statements (Condensed)
15. Litigation
On March 10, 2017, Volkswagen AG, Volkswagen Group of America, Inc. and certain affiliates entered into a settlement agreement resolving the environmental claims of ten states – Connecticut, Delaware, Maine, Massachusetts, New York, Oregon, Pennsylvania, Rhode Island, Vermont and Washington – for an amount of USD 157 million.
On March 24, 2017, the United States filed a motion for entry of the second partial consent decree, which had been agreed to between Volkswagen and the Department of Justice (DOJ), the US Environmental Protection Agency (EPA), the US environmental authority of California – the California Air Resources Board (CARB) and the California Attorney General on December 20, 2016 that resolved claims for injunctive relief under the US Clean Air Act and California environmental, consumer protection and false advertising laws related to the 3.0 l TDI vehicles. A hearing on the motion has been scheduled for May 11, 2017.
On April 13, 2017, the federal court in the multidistrict litigation in California entered judgment on the third partial consent decree, which Volkswagen had agreed to with the DOJ and EPA on January 11, 2017 that resolved claims for civil penalties and injunctive relief under the Clean Air Act related to the 2.0 l and 3.0 l TDI vehicles.
On April 21, 2017, the federal court in Michigan accepted Volkswagen AG’s agreement to plead guilty on January 11, 2017 and to pay a USD 2.8 billion criminal penalty, and imposed a sentence of three years’ pro-bation.
Also on April 21, 2017, the Canadian court approved the settlement agreement entered into between con-sumers and Volkswagen AG and other Canadian and U.S. Volkswagen Group companies relating to 2.0 l diesel vehicles.
The public prosecutor’s office in Munich initiated a criminal investigation against persons unknown in connection with 3.0 l TDI vehicles distributed in the United States. The criminal investigation is still at an early stage and further progress remains to be seen.
Beyond this, there were no significant changes in the reporting period compared with the disclosures on the Volkswagen Group’s expected development in fiscal year 2017 in the “Report on Expected Developments” and “Report on Risks and Opportunities” chapters – including the “Risks from the diesel issue” and “Litigation/Diesel issue” sections and the underlying description of the issues in the chapter entitled “Diesel Issue” – of the combined management report in the 2016 Annual Report or in publications released by the reporting date, as well as the investigations and interviews in connection with the diesel issue.
16. Contingent liabilities
On May 5, 2016, the U.S. National Highway Traffic Safety Administration (NHTSA) announced, jointly with the Takata company, a further extension of the recall for various models from different manufacturers containing certain airbags produced by the Takata company. Recalls were also ordered by the local authorities in Canada, Japan and South Korea. The recalls also included models manufactured by the Volkswagen Group. Appropriate provisions have been recognized. Currently, the possibility of further extensions to the recalls that could also affect Volkswagen Group models cannot be ruled out. It is not possible at the moment to provide further disclosures in accordance with IAS 37.86 in relation to this matter because the technical investigations and consultations with the authorities are still being carried out.
As of March 31, 2017, there were no major changes to the contingent liabilities compared with the disclosures in the 2016 annual report.
17. Other financial obligations
Other financial liabilities rose by €2.1 billion compared with the 2016 consolidated financial statements to reach €28.1 billion. The higher figure is mainly attributable to the increase in the purchase order commitment for property, plant and equipment as well as to obligations under irrevocable credit and leasing commitments.

Interim Consolideted Financial Statements (Condensed) 51Notes to the Interim Consolidated Financial Statements
German Corporate Governance Code
The current declarations in accordance with section 161 of the Aktiengesetz (AktG – German Stock Corporation Act) on the German Corporate Governance Code by the Board of Management and Supervisory Board of Volkswagen AG, AUDI AG, MAN SE and RENK AG are permanently available on the Internet at www.volkswagenag.com/ir, www.audi.com/cgk-declaration, www.corporate.man.eu/en and www.renk.biz/ corporated-governance.html respectively.
Significant events after the balance sheet date
There were no significant events after the end of the first three months of 2017. Wolfsburg, May 3, 2017 Volkswagen Aktiengesellschaft The Board of Management
Review Report 52 Interim Consolidated Financial Statements (Condensed)
To VOLKSWAGEN AKTIENGESELLSCHAFT,Wolfsburg
We have reviewed the condensed consolidated interim financial statements – comprising the condensed income statement and condensed statement of comprehensive income, condensed balance sheet, condensed statement of changes in equity, condensed statement of cash flows and selected explanatory notes – and the interim group management report of VOLKSWAGEN AKTIENGESELLSCHAFT, Wolfsburg, for the period from January 1 to March 31, 2017, which are part of the quarterly financial report pursuant to § (Article) 37w WpHG ("Wertpapierhandelsgesetz": German Securities Trading Act). The preparation of the condensed consolidated interim financial statements in accordance with the IFRS applicable to interim financial reporting as adopted by the EU and of the interim group management report in accordance with the provisions of the German Securities Trading Act applicable to interim group management reports is the responsibility of the parent Company's Board of Managing Directors. Our responsibility is to issue a review report on the condensed consolidated interim financial statements and on the interim group management report based on our review.
We conducted our review of the condensed consolidated interim financial statements and the interim group management report in accordance with German generally accepted standards for the review of financial statements promulgated by the Institut der Wirtschaftsprüfer (Institute of Public Auditors in Germany) (IDW). Those standards require that we plan and perform the review so that we can preclude through critical evaluation, with moderate assurance, that the condensed consolidated interim financial statements have not been prepared, in all material respects, in accordance with the IFRS applicable to interim financial reporting as adopted by the EU and that the interim group management report has not been prepared, in all material respects, in accordance with the provisions of the German Securities Trading Act applicable to interim group management reports. A review is limited primarily to inquiries of company personnel and analytical procedures and therefore does not provide the assurance attainable in a financial statement audit. Since, in accordance with our engagement, we have not performed a financial statement audit, we cannot express an audit opinion.
Based on our review, no matters have come to our attention that cause us to presume that the condensed consolidated interim financial statements have not been prepared, in all material respects, in accordance with the IFRS applicable to interim financial reporting as adopted by the EU nor that the interim group management report has not been prepared, in all material respects, in accordance with the provisions of the German Securities Trading Act applicable to interim group management reports.
Review Report

Interim Consolideted Financial Statements (Condensed) 53Review Report
Without qualifying our opinion, we draw attention to the updated information provided in section “Key events” of the notes to the condensed consolidated interim financial statements and in chapter “Report on Expected Developments, Risks and Opportunities” of the interim Group management report with regard to the Diesel Issue, which essentially refer to the information provided and statements made in the 2016 consolidated financial statements and in the combined management report as of December 31, 2016.
Based on the results of the various measures taken to investigate the issue presented so far, which underlie these financial statements, there is no validation that members of the board of management were aware of the deliberate manipulation of engine management software before summer 2015. Nevertheless, should as a result of the ongoing investigation new solid knowledge be obtained showing that members of the board of management were informed earlier, this could eventually have an impact on the annual and consolidated financial statements and on the combined management report for the fiscal year 2016 and prior years.
The provisions for warranties and legal risks recorded so far are based on the presented state of knowledge. Due to the inevitable uncertainties associated with the current and expected litigation it cannot be excluded that a future assessment of the risks may be different.
Hanover, May 3, 2017
PricewaterhouseCoopers GmbH Wirtschaftsprüfungsgesellschaft
Norbert Winkeljohann Frank Hübner Wirtschaftsprüfer Wirtschaftsprüfer
(German Public Auditor) (German Public Auditor)

P U B L I S H E D B Y
Volkswagen AG Financial Publications Letterbox 1848-2 38436 Wolfsburg Germany Phone + 49 (0) 5361 9-0 Fax + 49 (0) 5361 9-28282
I N V E STO R R E L AT I O N S
Volkswagen AG Investor Relations Letterbox 1849 38436 Wolfsburg Germany Phone + 49 (0) 5361 9-0 Fax + 49 (0) 5361 9-30411 E-Mail [email protected] Internet www.volkswagenag.com/ir
F I N A N C I A L C A L E N DA R
May 10, 2017 Volkswagen AG Annual General Meeting
July 27, 2017 Half-Yearly Financial Report 2017
October 27, 2017 Interim Report January – September 2017
This Interim Report is also available on the Internet, in German and English, at: www.volkswagenag.com/ir
This version of the Interim Report is a translation of the German original. The German takes precedence.
Printed in Germany 758.809.575.20
Contact Information