Embed Size (px)
Citation preview
Interim Report January - March 2017 Stockholm, April 28, 2017
Highlights of the first quarter of 2017
• Net sales amounted to SEK 28,883m (28,114). • Organic sales declined by 3%, while currency translation had a positive impact of 6% on net sales. • Operating income increased to SEK 1,536m (1,268), corresponding to a margin of 5.3% (4.5). • Improved results across all business areas. • Continued good profitability for Major Appliances EMEA,
Major Appliances North America, Major Appliances Asia/Pacific and Professional Products.• Operating income for Major Appliances Latin America and Home Care & SDA recovered. • Income for the period increased to SEK 1,083m (875), and earnings per share was SEK 3.77 (3.04).
Financial overviewSEKm Q1 2017 Q1 2016 Change, %
Net sales 28,883 28,114 2.7Organic growth, % -2.8 1.8Acquisitions, % 0.3 0.1Divestments, % -0.7 –Changes in exchange rates, % 5.9 -5.2Operating income 1,536 1,268 21.1Margin, % 5.3 4.5Income after financial items 1,434 1,163 23Income for the period 1,083 875 24Earnings per share, SEK1) 3.77 3.04Operating cash flow after investments -958 -580 365Return on net assets, % 29.8 22.8
1) Basic, based on an average of 287.4 (287.4) million shares for the first quarter of 2017, excluding shares held by Electrolux.
For definitions, see page 24.
About Electrolux
Electrolux is a global leader in household appliances and appliances for professional use, selling more than 60 million products to customers in more than 150 markets every year. The company makes thoughtfully designed, innovative solutions based on extensive consumer research, meeting the desires of today’s consumers and professionals. Electrolux products include refrigerators, dishwashers, washing machines, cookers, air-conditioners and small appliances such as vacuum cleaners, all sold under esteemed brands like Electrolux, AEG, Zanussi and Frigidaire. In 2016, Electrolux had sales of SEK 121 billion and about 55,000 employees. For more information, go to www.electroluxgroup.com
AB Electrolux (publ) 556009-4178
Market overview
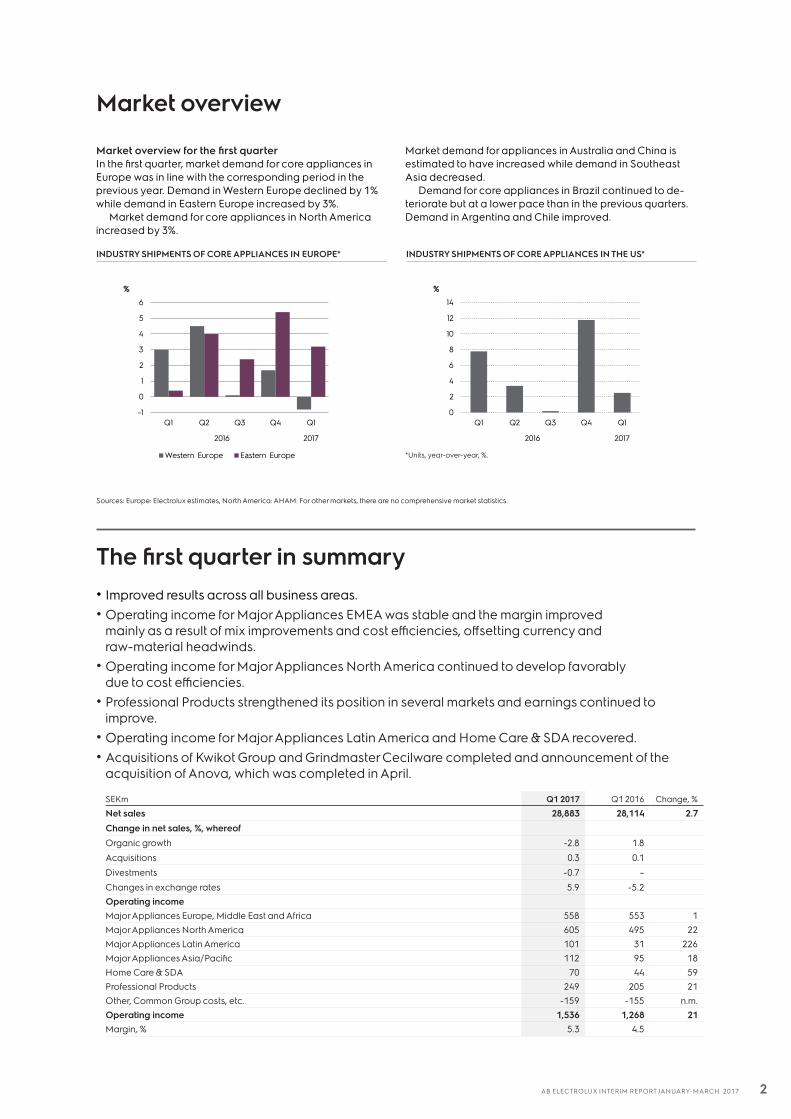
Market overview for the first quarterIn the first quarter, market demand for core appliances in Europe was in line with the corresponding period in the previous year. Demand in Western Europe declined by 1% while demand in Eastern Europe increased by 3%.
Market demand for core appliances in North America increased by 3%.
Market demand for appliances in Australia and China is estimated to have increased while demand in Southeast Asia decreased.
Demand for core appliances in Brazil continued to de-teriorate but at a lower pace than in the previous quarters. Demand in Argentina and Chile improved.
The first quarter in summary • Improved results across all business areas. • Operating income for Major Appliances EMEA was stable and the margin improved
mainly as a result of mix improvements and cost efficiencies, offsetting currency and raw-material headwinds.
• Operating income for Major Appliances North America continued to develop favorably due to cost efficiencies.
• Professional Products strengthened its position in several markets and earnings continued to improve.
• Operating income for Major Appliances Latin America and Home Care & SDA recovered.• Acquisitions of Kwikot Group and Grindmaster Cecilware completed and announcement of the
acquisition of Anova, which was completed in April.
SEKm Q1 2017 Q1 2016 Change, %
Net sales 28,883 28,114 2.7Change in net sales, %, whereof Organic growth -2.8 1.8Acquisitions 0.3 0.1Divestments -0.7 –Changes in exchange rates 5.9 -5.2Operating incomeMajor Appliances Europe, Middle East and Africa 558 553 1Major Appliances North America 605 495 22Major Appliances Latin America 101 31 226Major Appliances Asia/Pacific 112 95 18Home Care & SDA 70 44 59Professional Products 249 205 21Other, Common Group costs, etc. -159 -155 n.m.Operating income 1,536 1,268 21Margin, % 5.3 4.5
INDUSTRY SHIPMENTS OF CORE APPLIANCES IN EUROPE* INDUSTRY SHIPMENTS OF CORE APPLIANCES IN THE US*
*Units, year-over-year, %.
Sources: Europe: Electrolux estimates, North America: AHAM. For other markets, there are no comprehensive market statistics.
0
2
4
6
8
10
12
14
Q1 Q2 Q3 Q4 Q1
2016 2017
%
-1
0
1
2
3
4
5
6
Q1 Q2 Q3 Q4 Q1
2016 2017
%
Western Europe Eastern Europe
2AB ELECTROLUX INTERIM REPORT JANUARY-MARCH 2017
Net sales for the Electrolux Group were positively impacted by 5.9% due to currency translation effects, while organic sales declined by 2.8%. Acquisitions and divestments had a net negative impact of 0.4%. Major Appliances Asia/Pacific and Professional Products reported organic sales growth. Sales for Major Appliances EMEA declined due to lower sales volumes. Sales for Major Appliances North America were impacted by increased price pressure in the market and lower sales volumes of products under private labels. Continued weak markets impacted sales for Major Appliances Latin America. Sales for Home Care & SDA also declined, mainly as a result of actions to exit from unprofit-able product categories.
Operating income increased to SEK 1,536m (1,268), corresponding to a margin of 5.3% (4.5).
Operating income for Major Appliances EMEA was sta-ble. Higher cost efficiency and product-mix improvements offset the negative impact from currency and raw-material headwinds.
Operating income for Major Appliances North America improved year-over-year, mainly due to increased cost efficiency in operations.
Operating income for Major Appliances Latin Amer-ica and Home Care & SDA recovered following business restructuring.
Stable earnings development was reported for Major Appliances Asia/Pacific.
Professional Products continued to report a favorable sales and earnings trend.
Effects of changes in exchange rates Changes in exchange rates had a positive year-over-year impact of SEK 10m on operating income. The impact of transaction effects was SEK -11m. This was a net impact of currency headwinds in EMEA, related to a weaker British pound and Egyptian pound, and to currency tailwinds related to stronger currencies in Latin America. Translation effects in the quarter amounted to SEK 21m.
Financial netNet financial items for the first quarter amounted to SEK -102m (–105).
Income for the period Income for the period amounted to SEK 1,083m (875), corresponding to SEK 3.77 (3.04) in earnings per share.
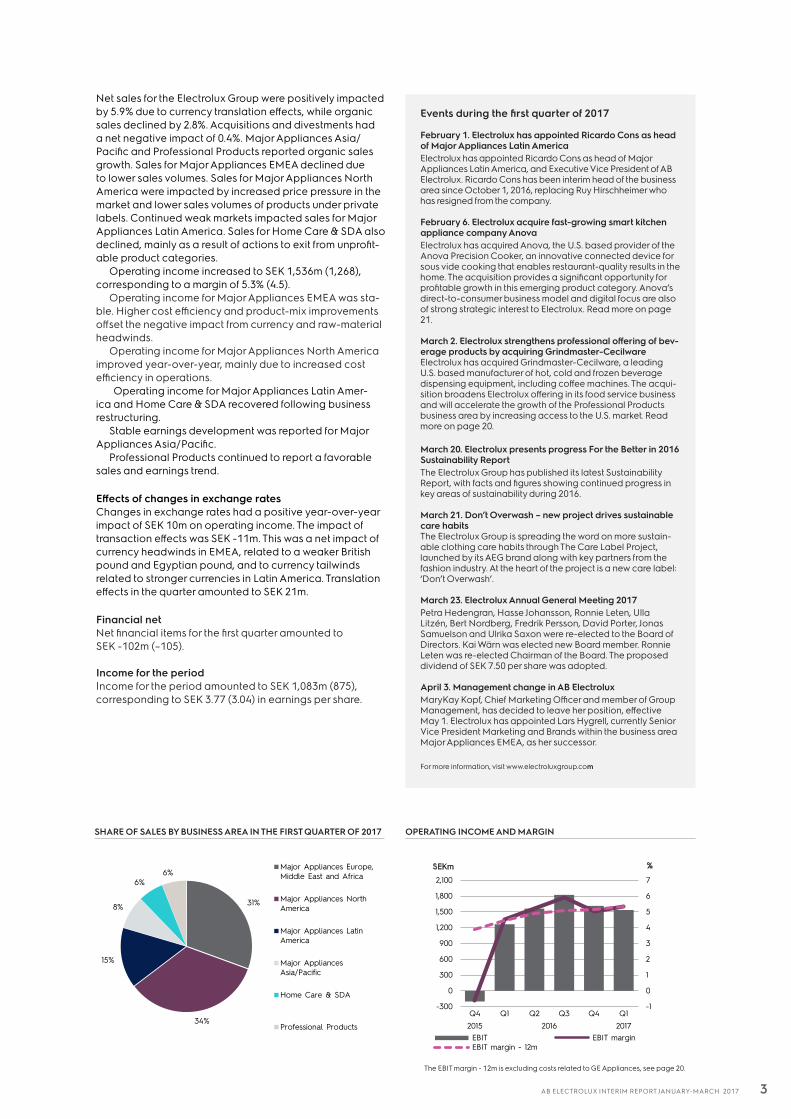
SHARE OF SALES BY BUSINESS AREA IN THE FIRST QUARTER OF 2017 OPERATING INCOME AND MARGIN
The EBIT margin - 12m is excluding costs related to GE Appliances, see page 20.
Events during the first quarter of 2017
February 1. Electrolux has appointed Ricardo Cons as head of Major Appliances Latin AmericaElectrolux has appointed Ricardo Cons as head of Major Appliances Latin America, and Executive Vice President of AB Electrolux. Ricardo Cons has been interim head of the business area since October 1, 2016, replacing Ruy Hirschheimer who has resigned from the company.
February 6. Electrolux acquire fast-growing smart kitchen appliance company Anova Electrolux has acquired Anova, the U.S. based provider of the Anova Precision Cooker, an innovative connected device for sous vide cooking that enables restaurant-quality results in the home. The acquisition provides a significant opportunity for profitable growth in this emerging product category. Anova’s direct-to-consumer business model and digital focus are also of strong strategic interest to Electrolux. Read more on page 21.
March 2. Electrolux strengthens professional offering of bev-erage products by acquiring Grindmaster-Cecilware Electrolux has acquired Grindmaster-Cecilware, a leading U.S. based manufacturer of hot, cold and frozen beverage dispensing equipment, including coffee machines. The acqui-sition broadens Electrolux offering in its food service business and will accelerate the growth of the Professional Products business area by increasing access to the U.S. market. Read more on page 20.
March 20. Electrolux presents progress For the Better in 2016 Sustainability Report The Electrolux Group has published its latest Sustainability Report, with facts and figures showing continued progress in key areas of sustainability during 2016.
March 21. Don’t Overwash – new project drives sustainable care habitsThe Electrolux Group is spreading the word on more sustain-able clothing care habits through The Care Label Project, launched by its AEG brand along with key partners from the fashion industry. At the heart of the project is a new care label: ‘Don’t Overwash’.
March 23. Electrolux Annual General Meeting 2017Petra Hedengran, Hasse Johansson, Ronnie Leten, Ulla Litzén, Bert Nordberg, Fredrik Persson, David Porter, Jonas Samuelson and Ulrika Saxon were re-elected to the Board of Directors. Kai Wärn was elected new Board member. Ronnie Leten was re-elected Chairman of the Board. The proposed dividend of SEK 7.50 per share was adopted.
April 3. Management change in AB ElectroluxMaryKay Kopf, Chief Marketing Officer and member of Group Management, has decided to leave her position, effective May 1. Electrolux has appointed Lars Hygrell, currently Senior Vice President Marketing and Brands within the business area Major Appliances EMEA, as her successor.
For more information, visit www.electroluxgroup.com
31%
34%
15%
8%
6%6%
Major Appliances Europe,Middle East and Africa
Major Appliances NorthAmerica
Major Appliances LatinAmerica
Major AppliancesAsia/Pacific
Home Care & SDA
Professional Products
-1
0
1
2
3
4
5
6
7
-300
0
300
600
900
1,200
1,500
1,800
2,100
Q4 Q1 Q2 Q3 Q4 Q12015 2016 2017
%SEKm
EBIT EBIT marginEBIT margin - 12m
3AB ELECTROLUX INTERIM REPORT JANUARY-MARCH 2017
Major Appliances Europe, Middle East and Africa
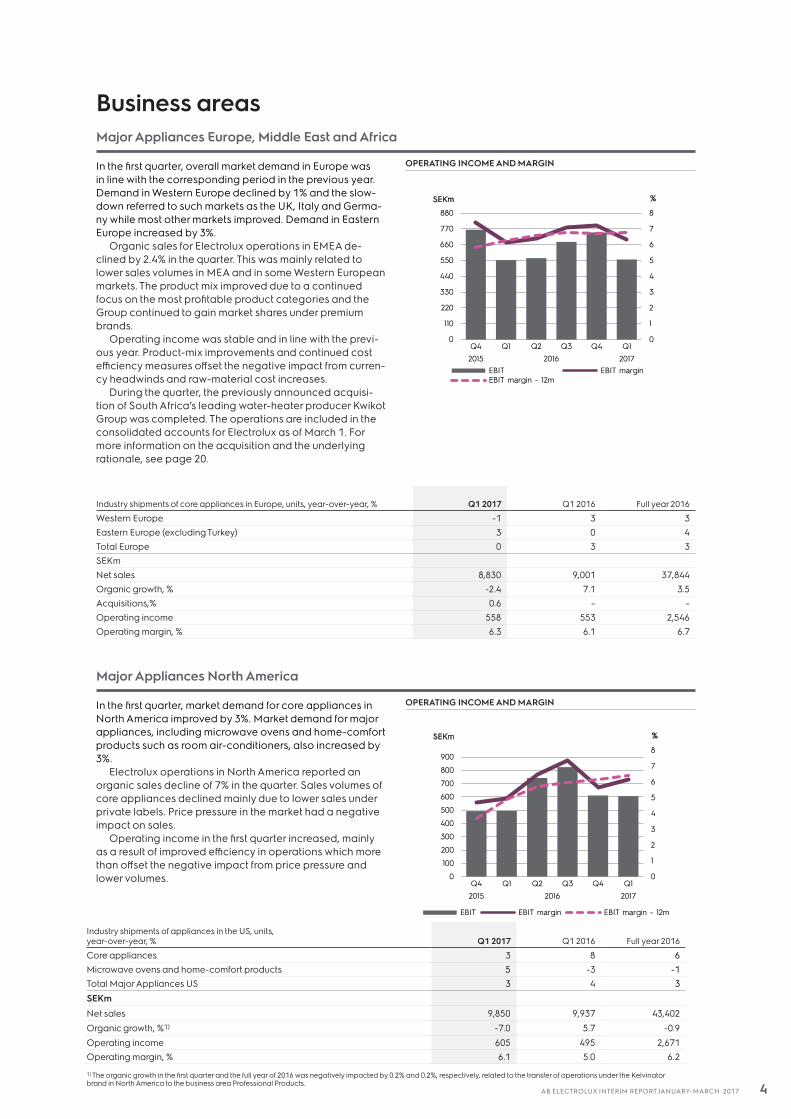
In the first quarter, overall market demand in Europe was in line with the corresponding period in the previous year. Demand in Western Europe declined by 1% and the slow-down referred to such markets as the UK, Italy and Germa-ny while most other markets improved. Demand in Eastern Europe increased by 3%.
Organic sales for Electrolux operations in EMEA de-clined by 2.4% in the quarter. This was mainly related to lower sales volumes in MEA and in some Western European markets. The product mix improved due to a continued focus on the most profitable product categories and the Group continued to gain market shares under premium brands.
Operating income was stable and in line with the previ-ous year. Product-mix improvements and continued cost efficiency measures offset the negative impact from curren-cy headwinds and raw-material cost increases.
During the quarter, the previously announced acquisi-tion of South Africa’s leading water-heater producer Kwikot Group was completed. The operations are included in the consolidated accounts for Electrolux as of March 1. For more information on the acquisition and the underlying rationale, see page 20.
OPERATING INCOME AND MARGIN
Business areas
Industry shipments of core appliances in Europe, units, year-over-year, % Q1 2017 Q1 2016
Full year 2016
Western Europe -1 3 3Eastern Europe (excluding Turkey) 3 0 4Total Europe 0 3 3SEKmNet sales 8,830 9,001 37,844Organic growth, % -2.4 7.1 3.5Acquisitions,% 0.6 – –Operating income 558 553 2,546Operating margin, % 6.3 6.1 6.7
Industry shipments of appliances in the US, units, year-over-year, % Q1 2017 Q1 2016
Full year 2016
Core appliances 3 8 6Microwave ovens and home-comfort products 5 -3 -1Total Major Appliances US 3 4 3SEKm
Net sales 9,850 9,937 43,402Organic growth, %1) -7.0 5.7 -0.9Operating income 605 495 2,671Operating margin, % 6.1 5.0 6.2
1) The organic growth in the first quarter and the full year of 2016 was negatively impacted by 0.2% and 0.2%, respectively, related to the transfer of operations under the Kelvinator brand in North America to the business area Professional Products.
Major Appliances North America
In the first quarter, market demand for core appliances in North America improved by 3%. Market demand for major appliances, including microwave ovens and home-comfort products such as room air-conditioners, also increased by 3%.
Electrolux operations in North America reported an organic sales decline of 7% in the quarter. Sales volumes of core appliances declined mainly due to lower sales under private labels. Price pressure in the market had a negative impact on sales.
Operating income in the first quarter increased, mainly as a result of improved efficiency in operations which more than offset the negative impact from price pressure and lower volumes.
OPERATING INCOME AND MARGIN
0
1
2
3
4
5
6
7
8
0
110
220
330
440
550
660
770
880
Q4 Q1 Q2 Q3 Q4 Q12015 2016 2017
%SEKm
EBIT EBIT marginEBIT margin - 12m
0
1
2
3
4
5
6
7
8
0
100
200
300
400
500
600
700
800
900
Q4 Q1 Q2 Q3 Q4 Q12015 2016 2017
%SEKm
EBIT EBIT margin EBIT margin - 12m
4AB ELECTROLUX INTERIM REPORT JANUARY-MARCH 2017
Major Appliances Latin America
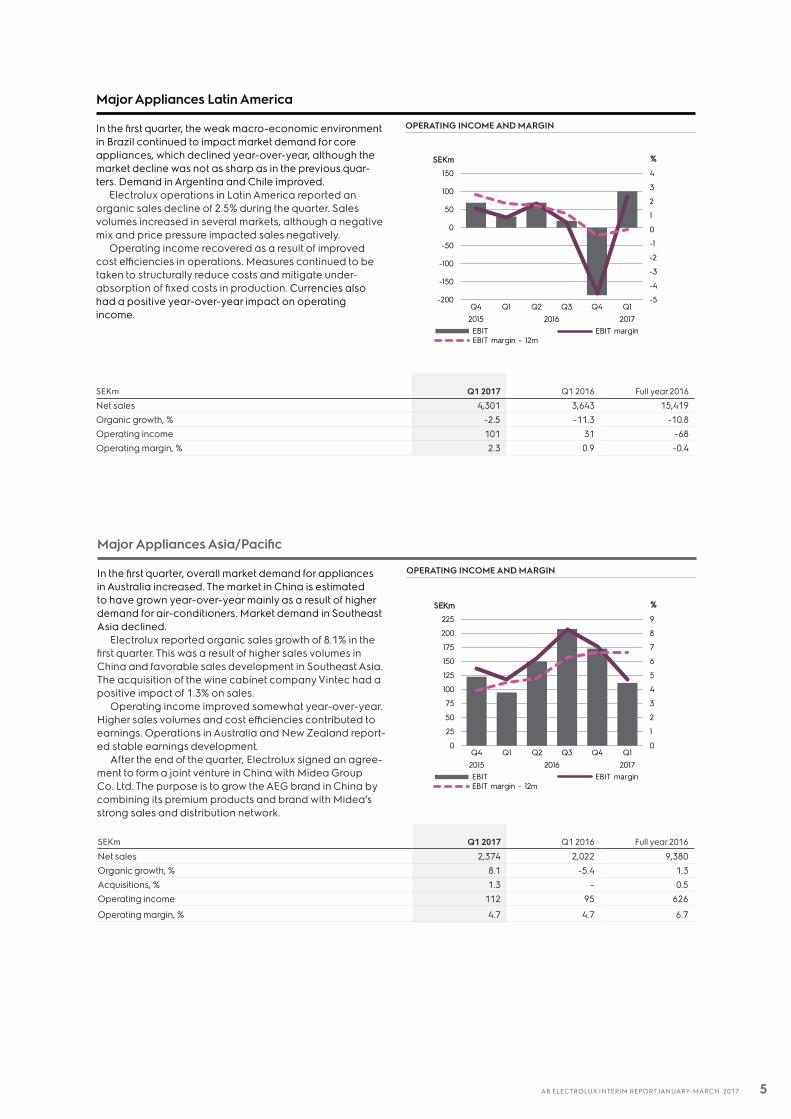
In the first quarter, the weak macro-economic environment in Brazil continued to impact market demand for core appliances, which declined year-over-year, although the market decline was not as sharp as in the previous quar-ters. Demand in Argentina and Chile improved.
Electrolux operations in Latin America reported an organic sales decline of 2.5% during the quarter. Sales volumes increased in several markets, although a negative mix and price pressure impacted sales negatively.
Operating income recovered as a result of improved cost efficiencies in operations. Measures continued to be taken to structurally reduce costs and mitigate under- absorption of fixed costs in production. Currencies also had a positive year-over-year impact on operating income.
OPERATING INCOME AND MARGIN
Major Appliances Asia/Pacific
In the first quarter, overall market demand for appliances in Australia increased. The market in China is estimated to have grown year-over-year mainly as a result of higher demand for air-conditioners. Market demand in Southeast Asia declined.
Electrolux reported organic sales growth of 8.1% in the first quarter. This was a result of higher sales volumes in China and favorable sales development in Southeast Asia. The acquisition of the wine cabinet company Vintec had a positive impact of 1.3% on sales.
Operating income improved somewhat year-over-year. Higher sales volumes and cost efficiencies contributed to earnings. Operations in Australia and New Zealand report-ed stable earnings development.
After the end of the quarter, Electrolux signed an agree-ment to form a joint venture in China with Midea Group Co. Ltd. The purpose is to grow the AEG brand in China by combining its premium products and brand with Midea’s strong sales and distribution network.
OPERATING INCOME AND MARGIN
SEKm Q1 2017 Q1 2016
Full year 2016
Net sales 4,301 3,643 15,419Organic growth, % -2.5 -11.3 -10.8Operating income 101 31 -68Operating margin, % 2.3 0.9 -0.4
SEKm Q1 2017 Q1 2016
Full year 2016
Net sales 2,374 2,022 9,380Organic growth, % 8.1 -5.4 1.3Acquisitions, % 1.3 – 0.5Operating income 112 95 626
Operating margin, % 4.7 4.7 6.7
0
1
2
3
4
5
6
7
8
9
0
25
50
75
100
125
150
175
200
225
Q4 Q1 Q2 Q3 Q4 Q12015 2016 2017
%SEKm
EBIT EBIT marginEBIT margin - 12m
-5
-4
-3
-2
-1
0
1
2
3
4
-200
-150
-100
-50
0
50
100
150
Q4 Q1 Q2 Q3 Q4 Q12015 2016 2017
%SEKm
EBIT EBIT marginEBIT margin - 12m
5AB ELECTROLUX INTERIM REPORT JANUARY-MARCH 2017
Home Care & Small Domestic Appliances
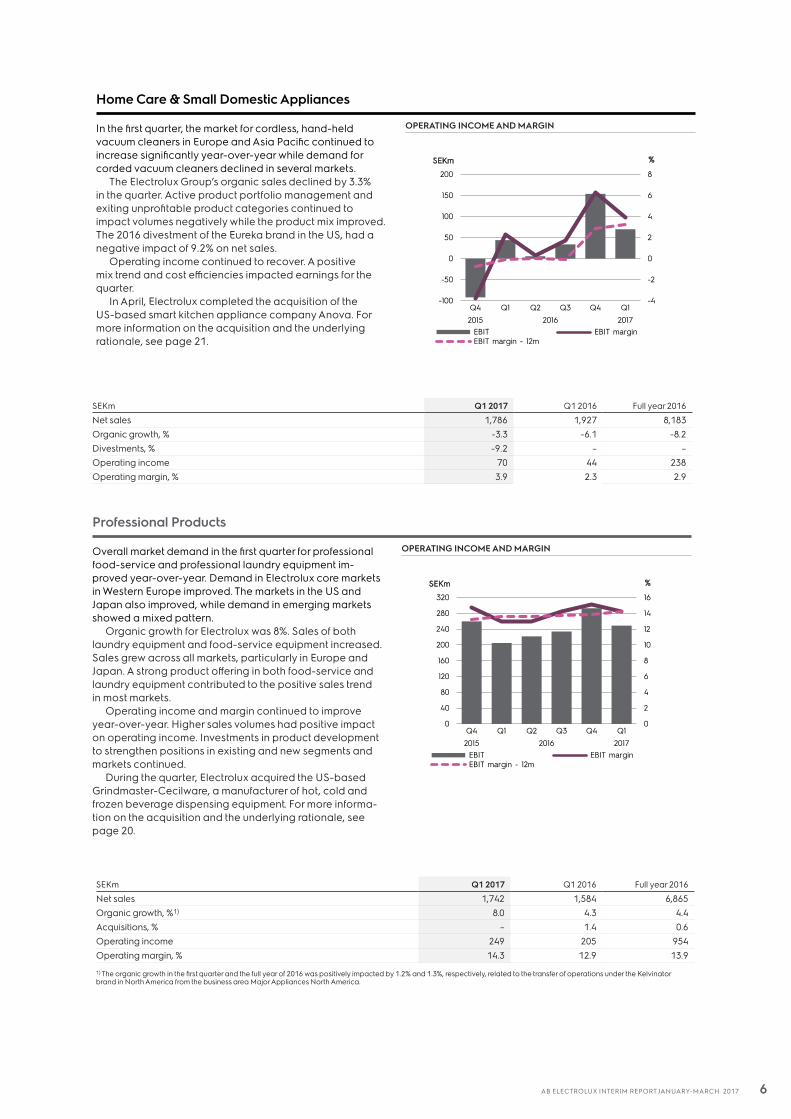
In the first quarter, the market for cordless, hand-held vacuum cleaners in Europe and Asia Pacific continued to increase significantly year-over-year while demand for corded vacuum cleaners declined in several markets.
The Electrolux Group’s organic sales declined by 3.3% in the quarter. Active product portfolio management and exiting unprofitable product categories continued to impact volumes negatively while the product mix improved. The 2016 divestment of the Eureka brand in the US, had a negative impact of 9.2% on net sales.
Operating income continued to recover. A positive mix trend and cost efficiencies impacted earnings for the quarter.
In April, Electrolux completed the acquisition of the US-based smart kitchen appliance company Anova. For more information on the acquisition and the underlying rationale, see page 21.
OPERATING INCOME AND MARGIN
Professional Products
Overall market demand in the first quarter for professional food-service and professional laundry equipment im-proved year-over-year. Demand in Electrolux core markets in Western Europe improved. The markets in the US and Japan also improved, while demand in emerging markets showed a mixed pattern.
Organic growth for Electrolux was 8%. Sales of both laundry equipment and food-service equipment increased. Sales grew across all markets, particularly in Europe and Japan. A strong product offering in both food-service and laundry equipment contributed to the positive sales trend in most markets.
Operating income and margin continued to improve year-over-year. Higher sales volumes had positive impact on operating income. Investments in product development to strengthen positions in existing and new segments and markets continued.
During the quarter, Electrolux acquired the US-based Grindmaster-Cecilware, a manufacturer of hot, cold and frozen beverage dispensing equipment. For more informa-tion on the acquisition and the underlying rationale, see page 20.
OPERATING INCOME AND MARGIN
SEKm Q1 2017 Q1 2016 Full year 2016
Net sales 1,786 1,927 8,183Organic growth, % -3.3 -6.1 -8.2Divestments, % -9.2 – –Operating income 70 44 238Operating margin, % 3.9 2.3 2.9
SEKm Q1 2017 Q1 2016 Full year 2016
Net sales 1,742 1,584 6,865Organic growth, %1) 8.0 4.3 4.4Acquisitions, % – 1.4 0.6Operating income 249 205 954Operating margin, % 14.3 12.9 13.9
1) The organic growth in the first quarter and the full year of 2016 was positively impacted by 1.2% and 1.3%, respectively, related to the transfer of operations under the Kelvinator brand in North America from the business area Major Appliances North America.
-4
-2
0
2
4
6
8
-100
-50
0
50
100
150
200
Q4 Q1 Q2 Q3 Q4 Q12015 2016 2017
%SEKm
EBIT EBIT marginEBIT margin - 12m
0
2
4
6
8
10
12
14
16
0
40
80
120
160
200
240
280
320
Q4 Q1 Q2 Q3 Q4 Q12015 2016 2017
%SEKm
EBIT EBIT marginEBIT margin - 12m
6AB ELECTROLUX INTERIM REPORT JANUARY-MARCH 2017
Cash flow
SEKm Q1 2017 Q1 2016 Full year 2016
Operating income adjusted for non-cash items1) 2,451 2,320 10,545Change in operating assets and liabilities -2,742 -2,371 1,328Operating cash flow -291 -51 11,873Investments in tangible and intangible assets -732 -636 -3,390Changes in other investments 65 107 657Operating cash flow after investments -958 -580 9,140Acquisitions and divestments of operations -2,399 -3 176Operating cash flow after structural changes -3,357 -583 9,316Financial items paid, net2) -79 -61 -514Taxes paid -243 -201 -1,194Cash flow from operations and investments -3,679 -845 7,608Dividend -1,078 – -1,868Share-based payments -492 -54 -57Total cash flow, excluding changes in loans and short–term investments -5,249 -899 5,683
1) Operating income adjusted for depreciation, amortization and other non-cash items. 2) For the period January 1 to March 31. Interests and similar items received SEK 3m (28), interests and similar items paid SEK -68m (–63) and other financial items paid SEK -14m (–26).
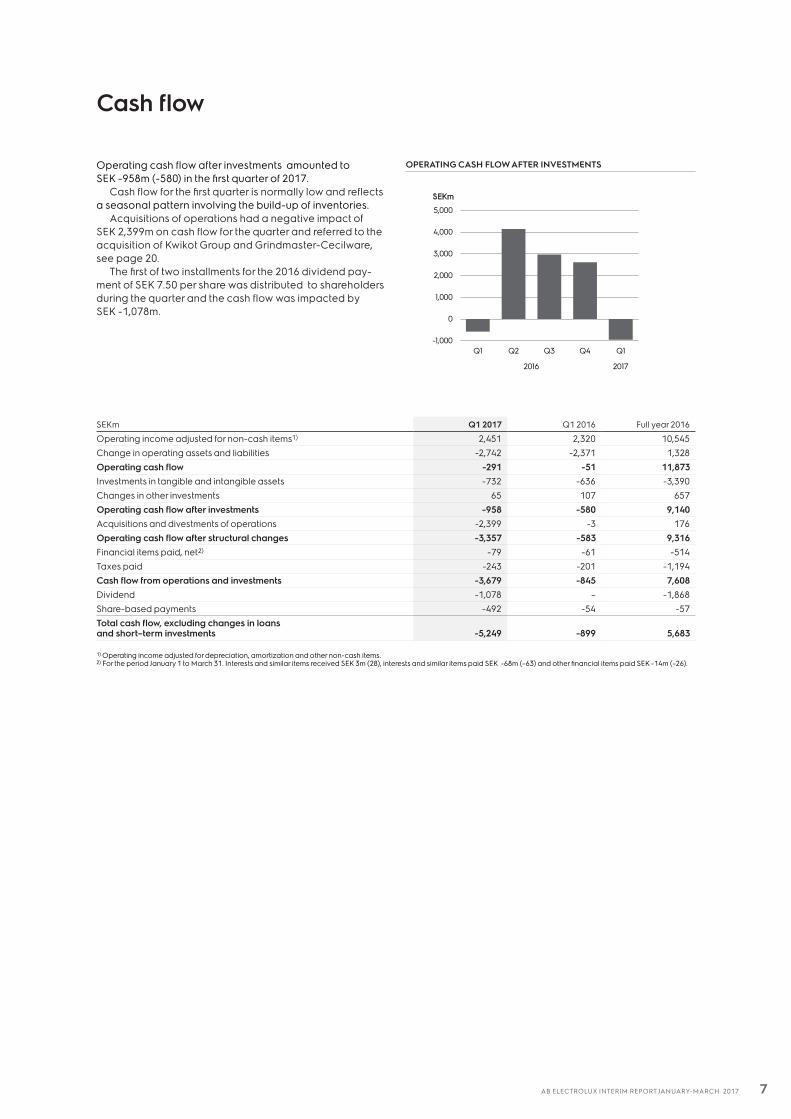
Operating cash flow after investments amounted to SEK -958m (-580) in the first quarter of 2017.
Cash flow for the first quarter is normally low and reflectsa seasonal pattern involving the build-up of inventories.
Acquisitions of operations had a negative impact of SEK 2,399m on cash flow for the quarter and referred to the acquisition of Kwikot Group and Grindmaster-Cecilware, see page 20.
The first of two installments for the 2016 dividend pay-ment of SEK 7.50 per share was distributed to shareholders during the quarter and the cash flow was impacted by SEK -1,078m.
OPERATING CASH FLOW AFTER INVESTMENTS
-1,000
0
1,000
2,000
3,000
4,000
5,000
Q1 Q2 Q3 Q4 Q1
2016 2017
SEKm
7AB ELECTROLUX INTERIM REPORT JANUARY-MARCH 2017
Financial position
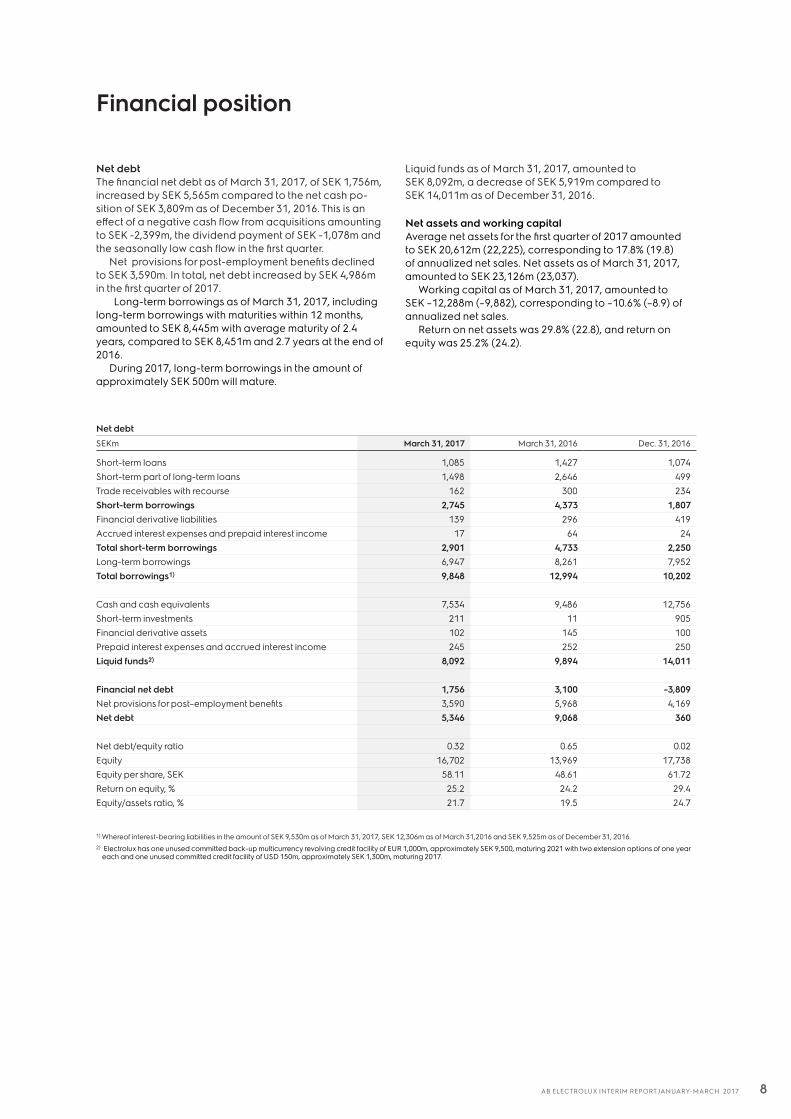
Net debt The financial net debt as of March 31, 2017, of SEK 1,756m, increased by SEK 5,565m compared to the net cash po-sition of SEK 3,809m as of December 31, 2016. This is an effect of a negative cash flow from acquisitions amounting to SEK -2,399m, the dividend payment of SEK -1,078m and the seasonally low cash flow in the first quarter.
Net provisions for post-employment benefits declined to SEK 3,590m. In total, net debt increased by SEK 4,986m in the first quarter of 2017.
Long-term borrowings as of March 31, 2017, including long-term borrowings with maturities within 12 months, amounted to SEK 8,445m with average maturity of 2.4 years, compared to SEK 8,451m and 2.7 years at the end of 2016.
During 2017, long-term borrowings in the amount of approximately SEK 500m will mature.
Liquid funds as of March 31, 2017, amounted to SEK 8,092m, a decrease of SEK 5,919m compared to SEK 14,011m as of December 31, 2016.
Net assets and working capital Average net assets for the first quarter of 2017 amounted to SEK 20,612m (22,225), corresponding to 17.8% (19.8) of annualized net sales. Net assets as of March 31, 2017, amounted to SEK 23,126m (23,037).
Working capital as of March 31, 2017, amounted to SEK –12,288m (–9,882), corresponding to –10.6% (–8.9) of annualized net sales.
Return on net assets was 29.8% (22.8), and return on equity was 25.2% (24.2).
Net debtSEKm March 31, 2017 March 31, 2016 Dec. 31, 2016
Short-term loans 1,085 1,427 1,074Short-term part of long-term loans 1,498 2,646 499 Trade receivables with recourse 162 300 234Short-term borrowings 2,745 4,373 1,807Financial derivative liabilities 139 296 419Accrued interest expenses and prepaid interest income 17 64 24Total short-term borrowings 2,901 4,733 2,250Long-term borrowings 6,947 8,261 7,952Total borrowings1) 9,848 12,994 10,202
Cash and cash equivalents 7,534 9,486 12,756Short-term investments 211 11 905Financial derivative assets 102 145 100Prepaid interest expenses and accrued interest income 245 252 250Liquid funds2) 8,092 9,894 14,011
Financial net debt 1,756 3,100 -3,809Net provisions for post– employment benefits 3,590 5,968 4,169Net debt 5,346 9,068 360
Net debt/equity ratio 0.32 0.65 0.02Equity 16,702 13,969 17,738Equity per share, SEK 58.11 48.61 61.72Return on equity, % 25.2 24.2 29.4Equity/assets ratio, % 21.7 19.5 24.7
1) Whereof interest-bearing liabilities in the amount of SEK 9,530m as of March 31, 2017, SEK 12,306m as of March 31,2016 and SEK 9,525m as of December 31, 2016.2) Electrolux has one unused committed back-up multicurrency revolving credit facility of EUR 1,000m, approximately SEK 9,500, maturing 2021 with two extension options of one year
each and one unused committed credit facility of USD 150m, approximately SEK 1,300m, maturing 2017.
8AB ELECTROLUX INTERIM REPORT JANUARY-MARCH 2017
Other items
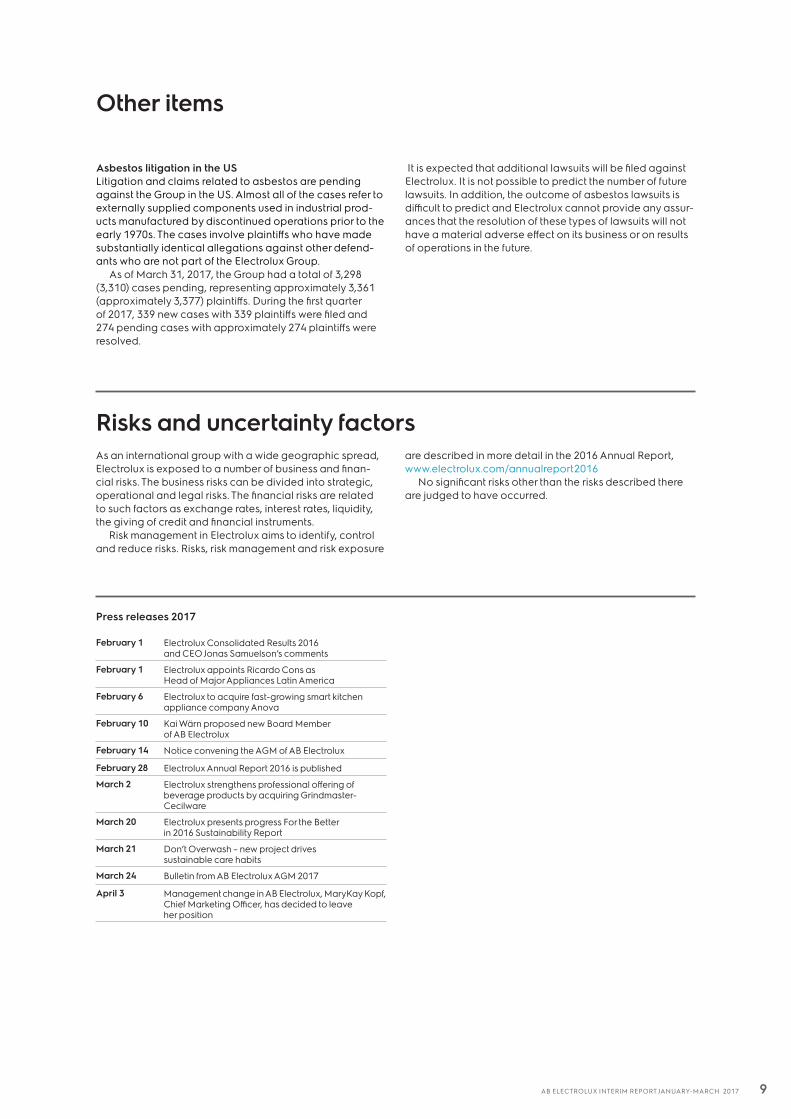
Press releases 2017
February 1 Electrolux Consolidated Results 2016 and CEO Jonas Samuelson’s comments
February 1 Electrolux appoints Ricardo Cons as Head of Major Appliances Latin America
February 6 Electrolux to acquire fast-growing smart kitchen appliance company Anova
February 10 Kai Wärn proposed new Board Member of AB Electrolux
February 14 Notice convening the AGM of AB Electrolux
February 28 Electrolux Annual Report 2016 is published
March 2 Electrolux strengthens professional offering of beverage products by acquiring Grindmaster- Cecilware
March 20 Electrolux presents progress For the Better in 2016 Sustainability Report
March 21 Don’t Overwash – new project drives sustainable care habits
March 24 Bulletin from AB Electrolux AGM 2017
April 3 Management change in AB Electrolux, MaryKay Kopf, Chief Marketing Officer, has decided to leave her position
Asbestos litigation in the US Litigation and claims related to asbestos are pending against the Group in the US. Almost all of the cases refer to externally supplied components used in industrial prod-ucts manufactured by discontinued operations prior to the early 1970s. The cases involve plaintiffs who have made substantially identical allegations against other defend-ants who are not part of the Electrolux Group.
As of March 31, 2017, the Group had a total of 3,298 (3,310) cases pending, representing approximately 3,361 (approximately 3,377) plaintiffs. During the first quarter of 2017, 339 new cases with 339 plaintiffs were filed and 274 pending cases with approximately 274 plaintiffs were resolved.
It is expected that additional lawsuits will be filed against Electrolux. It is not possible to predict the number of future lawsuits. In addition, the outcome of asbestos lawsuits is difficult to predict and Electrolux cannot provide any assur-ances that the resolution of these types of lawsuits will not have a material adverse effect on its business or on results of operations in the future.
Risks and uncertainty factorsAs an international group with a wide geographic spread, Electrolux is exposed to a number of business and finan-cial risks. The business risks can be divided into strategic, operational and legal risks. The financial risks are related to such factors as exchange rates, interest rates, liquidity, the giving of credit and financial instruments.
Risk management in Electrolux aims to identify, control and reduce risks. Risks, risk management and risk exposure
are described in more detail in the 2016 Annual Report, www.electrolux.com/annualreport2016
No significant risks other than the risks described there are judged to have occurred.
9AB ELECTROLUX INTERIM REPORT JANUARY-MARCH 2017
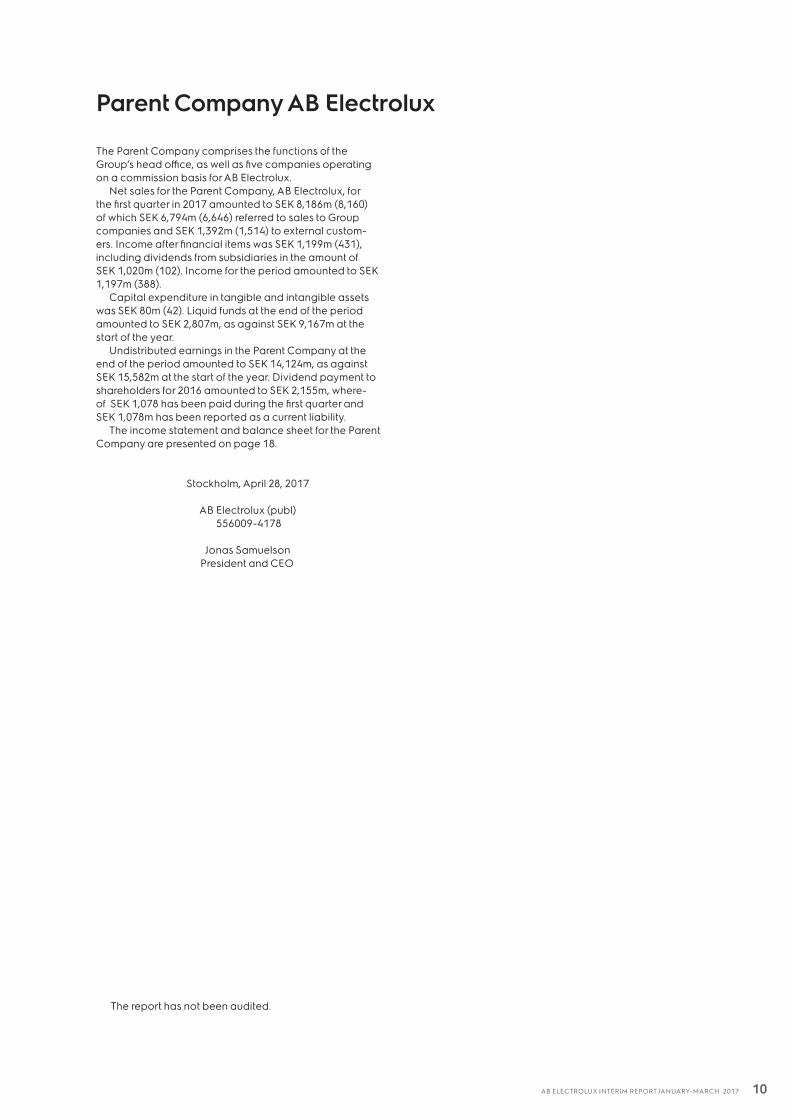
The Parent Company comprises the functions of the Group’s head office, as well as five companies operating on a commission basis for AB Electrolux.
Net sales for the Parent Company, AB Electrolux, for the first quarter in 2017 amounted to SEK 8,186m (8,160) of which SEK 6,794m (6,646) referred to sales to Group companies and SEK 1,392m (1,514) to external custom-ers. Income after financial items was SEK 1,199m (431), including dividends from subsidiaries in the amount of SEK 1,020m (102). Income for the period amounted to SEK 1,197m (388).
Capital expenditure in tangible and intangible assets was SEK 80m (42). Liquid funds at the end of the period amounted to SEK 2,807m, as against SEK 9,167m at the start of the year.
Undistributed earnings in the Parent Company at the end of the period amounted to SEK 14,124m, as against SEK 15,582m at the start of the year. Dividend payment to shareholders for 2016 amounted to SEK 2,155m, where-of SEK 1,078 has been paid during the first quarter and SEK 1,078m has been reported as a current liability.
The income statement and balance sheet for the Parent Company are presented on page 18.
Stockholm, April 28, 2017
AB Electrolux (publ) 556009-4178
Jonas Samuelson President and CEO
Parent Company AB Electrolux
The report has not been audited.
10AB ELECTROLUX INTERIM REPORT JANUARY-MARCH 2017
Consolidated income statement
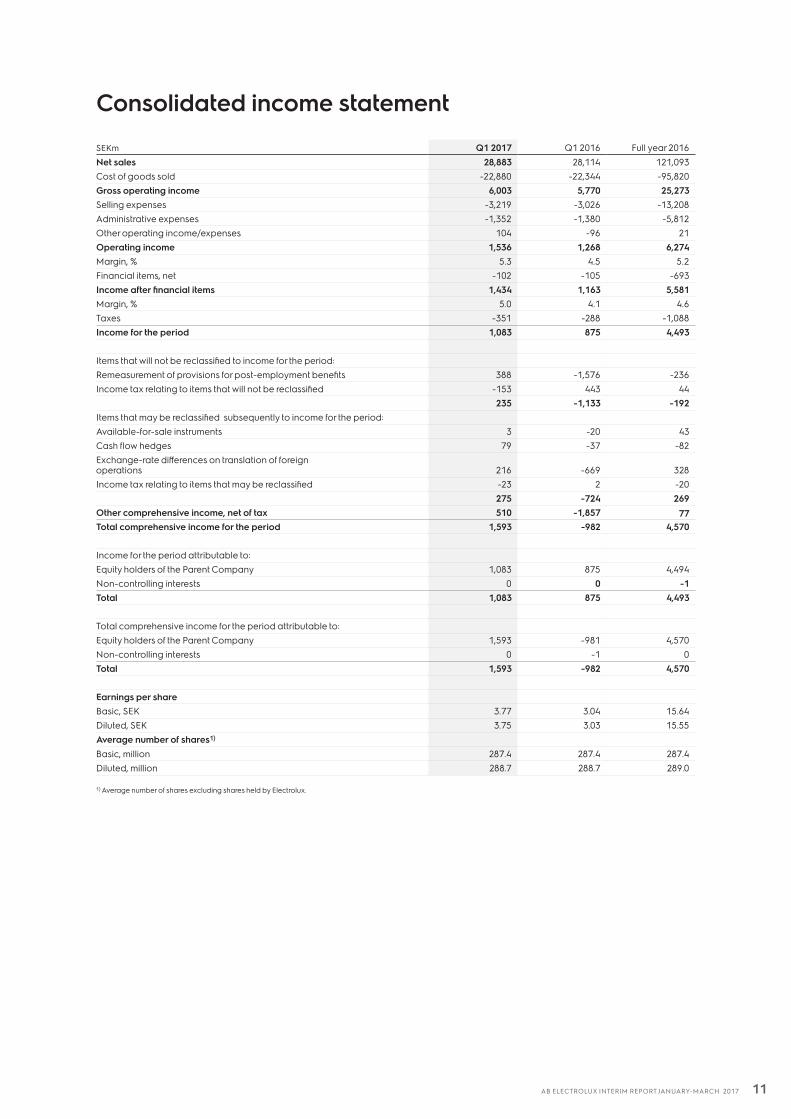
SEKm Q1 2017 Q1 2016 Full year 2016Net sales 28,883 28,114 121,093Cost of goods sold -22,880 -22,344 -95,820Gross operating income 6,003 5,770 25,273Selling expenses -3,219 -3,026 -13,208Administrative expenses -1,352 -1,380 -5,812Other operating income/expenses 104 -96 21Operating income 1,536 1,268 6,274Margin, % 5.3 4.5 5.2Financial items, net -102 -105 -693Income after financial items 1,434 1,163 5,581Margin, % 5.0 4.1 4.6Taxes -351 -288 -1,088Income for the period 1,083 875 4,493
Items that will not be reclassified to income for the period:Remeasurement of provisions for post-employment benefits 388 -1,576 -236Income tax relating to items that will not be reclassified -153 443 44
235 -1,133 -192Items that may be reclassified subsequently to income for the period:Available-for-sale instruments 3 -20 43Cash flow hedges 79 -37 -82Exchange-rate differences on translation of foreign operations 216 -669 328Income tax relating to items that may be reclassified -23 2 -20
275 -724 269Other comprehensive income, net of tax 510 -1,857 77Total comprehensive income for the period 1,593 -982 4,570
Income for the period attributable to:Equity holders of the Parent Company 1,083 875 4,494Non-controlling interests 0 0 -1Total 1,083 875 4,493
Total comprehensive income for the period attributable to:Equity holders of the Parent Company 1,593 -981 4,570Non-controlling interests 0 -1 0Total 1,593 -982 4,570
Earnings per shareBasic, SEK 3.77 3.04 15.64Diluted, SEK 3.75 3.03 15.55Average number of shares1)
Basic, million 287.4 287.4 287.4Diluted, million 288.7 288.7 289.0
1) Average number of shares excluding shares held by Electrolux.
11AB ELECTROLUX INTERIM REPORT JANUARY-MARCH 2017
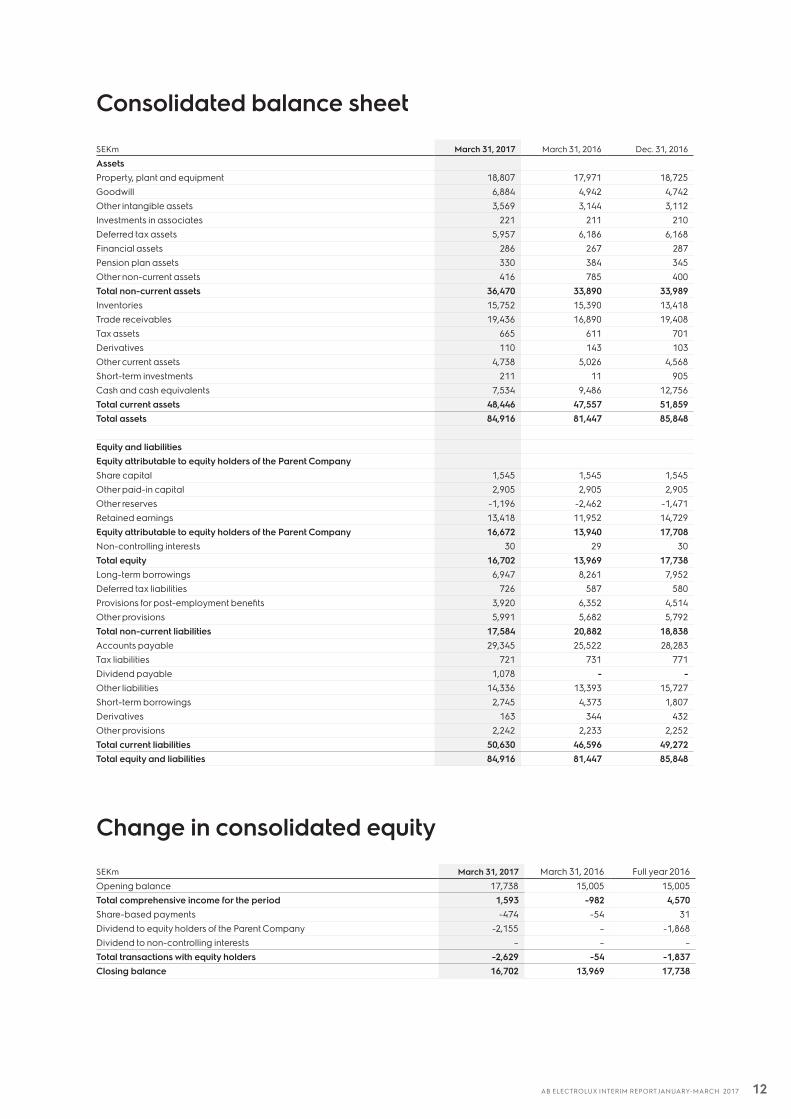
Consolidated balance sheet
SEKm March 31, 2017 March 31, 2016 Dec. 31, 2016
AssetsProperty, plant and equipment 18,807 17,971 18,725Goodwill 6,884 4,942 4,742Other intangible assets 3,569 3,144 3,112Investments in associates 221 211 210Deferred tax assets 5,957 6,186 6,168Financial assets 286 267 287Pension plan assets 330 384 345Other non-current assets 416 785 400Total non-current assets 36,470 33,890 33,989Inventories 15,752 15,390 13,418Trade receivables 19,436 16,890 19,408Tax assets 665 611 701Derivatives 110 143 103Other current assets 4,738 5,026 4,568Short-term investments 211 11 905Cash and cash equivalents 7,534 9,486 12,756Total current assets 48,446 47,557 51,859Total assets 84,916 81,447 85,848
Equity and liabilitiesEquity attributable to equity holders of the Parent CompanyShare capital 1,545 1,545 1,545Other paid-in capital 2,905 2,905 2,905Other reserves -1,196 -2,462 -1,471Retained earnings 13,418 11,952 14,729Equity attributable to equity holders of the Parent Company 16,672 13,940 17,708Non-controlling interests 30 29 30Total equity 16,702 13,969 17,738Long-term borrowings 6,947 8,261 7,952Deferred tax liabilities 726 587 580Provisions for post-employment benefits 3,920 6,352 4,514Other provisions 5,991 5,682 5,792Total non-current liabilities 17,584 20,882 18,838Accounts payable 29,345 25,522 28,283Tax liabilities 721 731 771Dividend payable 1,078 - -Other liabilities 14,336 13,393 15,727Short-term borrowings 2,745 4,373 1,807Derivatives 163 344 432Other provisions 2,242 2,233 2,252Total current liabilities 50,630 46,596 49,272Total equity and liabilities 84,916 81,447 85,848
Change in consolidated equity
SEKm March 31, 2017 March 31, 2016 Full year 2016Opening balance 17,738 15,005 15,005Total comprehensive income for the period 1,593 -982 4,570Share-based payments -474 -54 31Dividend to equity holders of the Parent Company -2,155 – -1,868Dividend to non-controlling interests – – –Total transactions with equity holders -2,629 -54 -1,837Closing balance 16,702 13,969 17,738
12AB ELECTROLUX INTERIM REPORT JANUARY-MARCH 2017
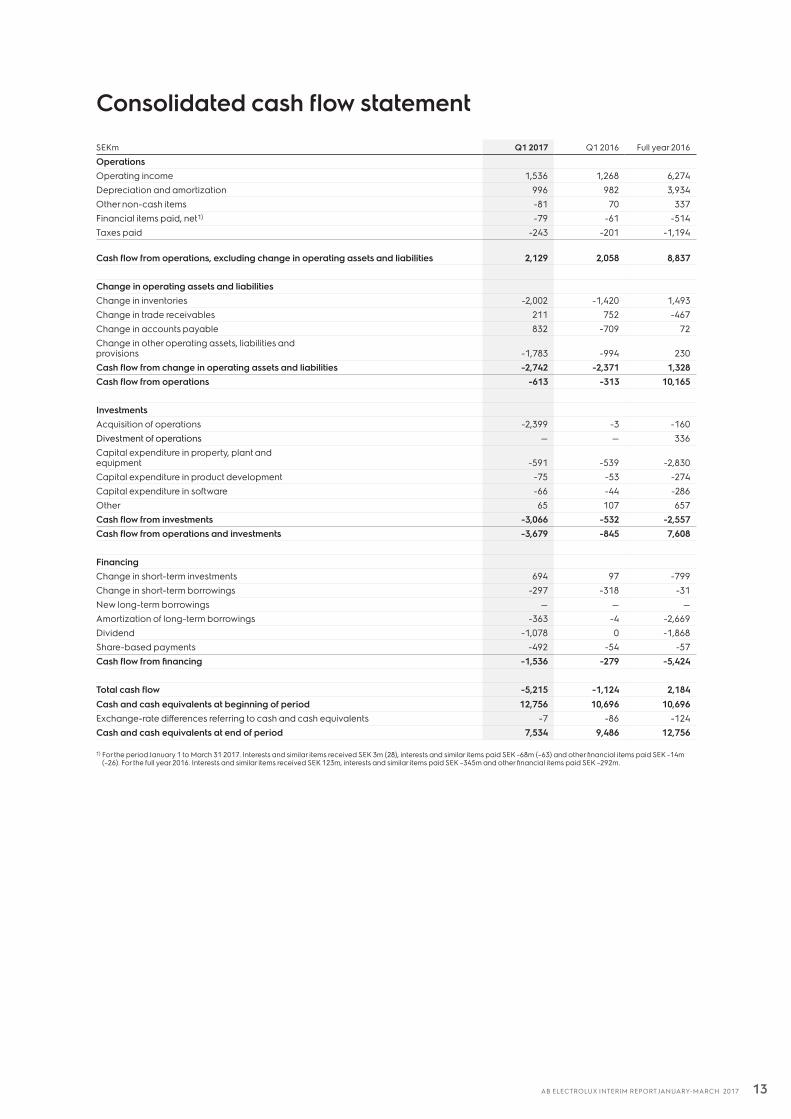
Consolidated cash flow statement
SEKm Q1 2017 Q1 2016 Full year 2016
OperationsOperating income 1,536 1,268 6,274Depreciation and amortization 996 982 3,934Other non-cash items -81 70 337Financial items paid, net1) -79 -61 -514Taxes paid -243 -201 -1,194
Cash flow from operations, excluding change in operating assets and liabilities 2,129 2,058 8,837
Change in operating assets and liabilitiesChange in inventories -2,002 -1,420 1,493Change in trade receivables 211 752 -467Change in accounts payable 832 -709 72Change in other operating assets, liabilities and provisions -1,783 -994 230Cash flow from change in operating assets and liabilities -2,742 -2,371 1,328Cash flow from operations -613 -313 10,165
InvestmentsAcquisition of operations -2,399 -3 -160Divestment of operations — — 336Capital expenditure in property, plant and equipment -591 -539 -2,830Capital expenditure in product development -75 -53 -274Capital expenditure in software -66 -44 -286Other 65 107 657Cash flow from investments -3,066 -532 -2,557Cash flow from operations and investments -3,679 -845 7,608
FinancingChange in short-term investments 694 97 -799Change in short-term borrowings -297 -318 -31New long-term borrowings — — —Amortization of long-term borrowings -363 -4 -2,669Dividend -1,078 0 -1,868Share-based payments -492 -54 -57Cash flow from financing -1,536 -279 -5,424
Total cash flow -5,215 -1,124 2,184Cash and cash equivalents at beginning of period 12,756 10,696 10,696Exchange-rate differences referring to cash and cash equivalents -7 -86 -124Cash and cash equivalents at end of period 7,534 9,486 12,756
1) For the period January 1 to March 31 2017. Interests and similar items received SEK 3m (28), interests and similar items paid SEK -68m (–63) and other financial items paid SEK -14m (–26). For the full year 2016. Interests and similar items received SEK 123m, interests and similar items paid SEK –345m and other financial items paid SEK –292m.
13AB ELECTROLUX INTERIM REPORT JANUARY-MARCH 2017
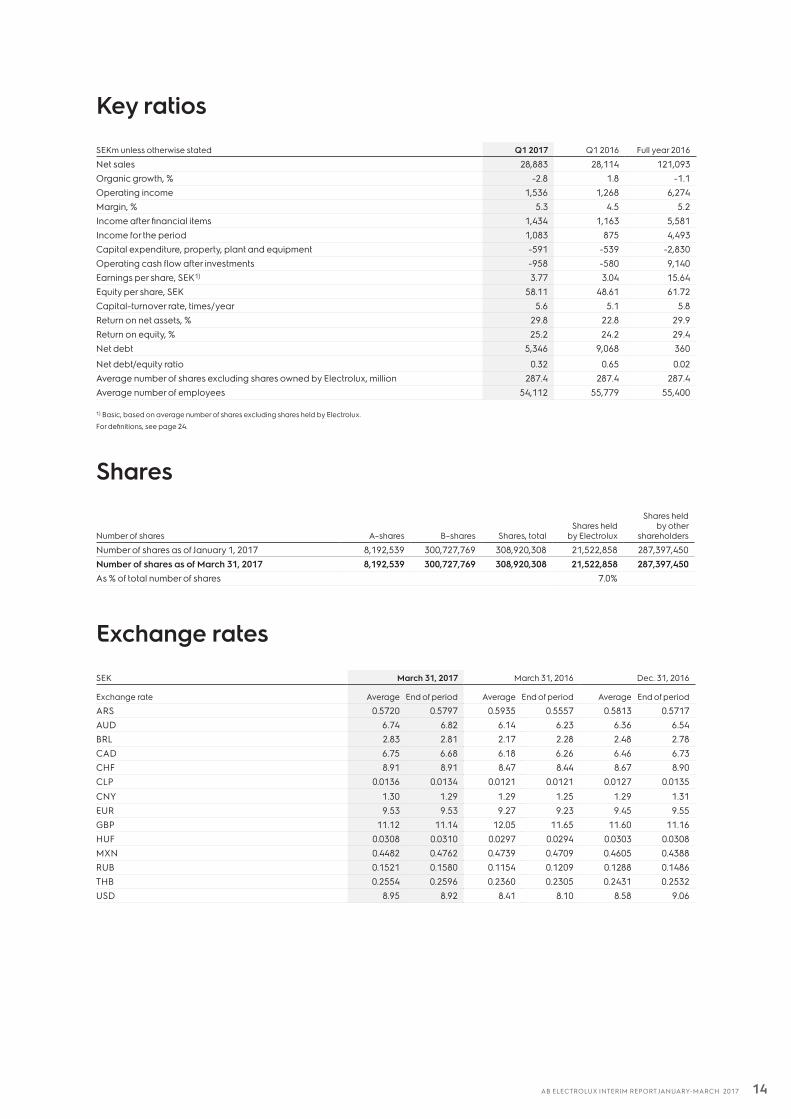
Key ratios
SEKm unless otherwise stated Q1 2017 Q1 2016 Full year 2016
Net sales 28,883 28,114 121,093Organic growth, % -2.8 1.8 -1.1Operating income 1,536 1,268 6,274Margin, % 5.3 4.5 5.2Income after financial items 1,434 1,163 5,581Income for the period 1,083 875 4,493Capital expenditure, property, plant and equipment -591 -539 -2,830Operating cash flow after investments -958 -580 9,140Earnings per share, SEK1) 3.77 3.04 15.64Equity per share, SEK 58.11 48.61 61.72Capital-turnover rate, times/year 5.6 5.1 5.8Return on net assets, % 29.8 22.8 29.9Return on equity, % 25.2 24.2 29.4Net debt 5,346 9,068 360
Net debt/equity ratio 0.32 0.65 0.02Average number of shares excluding shares owned by Electrolux, million 287.4 287.4 287.4Average number of employees 54,112 55,779 55,400
1) Basic, based on average number of shares excluding shares held by Electrolux.
For definitions, see page 24.
Shares
Number of shares
A–shares
B–shares Shares, totalShares held
by Electrolux
Shares held by other
shareholders
Number of shares as of January 1, 2017 8,192,539 300,727,769 308,920,308 21,522,858 287,397,450Number of shares as of March 31, 2017 8,192,539 300,727,769 308,920,308 21,522,858 287,397,450As % of total number of shares 7.0%
Exchange rates
SEK March 31, 2017 March 31, 2016 Dec. 31, 2016
Exchange rate Average End of period Average End of period Average End of period
ARS 0.5720 0.5797 0.5935 0.5557 0.5813 0.5717AUD 6.74 6.82 6.14 6.23 6.36 6.54BRL 2.83 2.81 2.17 2.28 2.48 2.78CAD 6.75 6.68 6.18 6.26 6.46 6.73CHF 8.91 8.91 8.47 8.44 8.67 8.90CLP 0.0136 0.0134 0.0121 0.0121 0.0127 0.0135CNY 1.30 1.29 1.29 1.25 1.29 1.31EUR 9.53 9.53 9.27 9.23 9.45 9.55GBP 11.12 11.14 12.05 11.65 11.60 11.16HUF 0.0308 0.0310 0.0297 0.0294 0.0303 0.0308MXN 0.4482 0.4762 0.4739 0.4709 0.4605 0.4388RUB 0.1521 0.1580 0.1154 0.1209 0.1288 0.1486THB 0.2554 0.2596 0.2360 0.2305 0.2431 0.2532USD 8.95 8.92 8.41 8.10 8.58 9.06
14AB ELECTROLUX INTERIM REPORT JANUARY-MARCH 2017
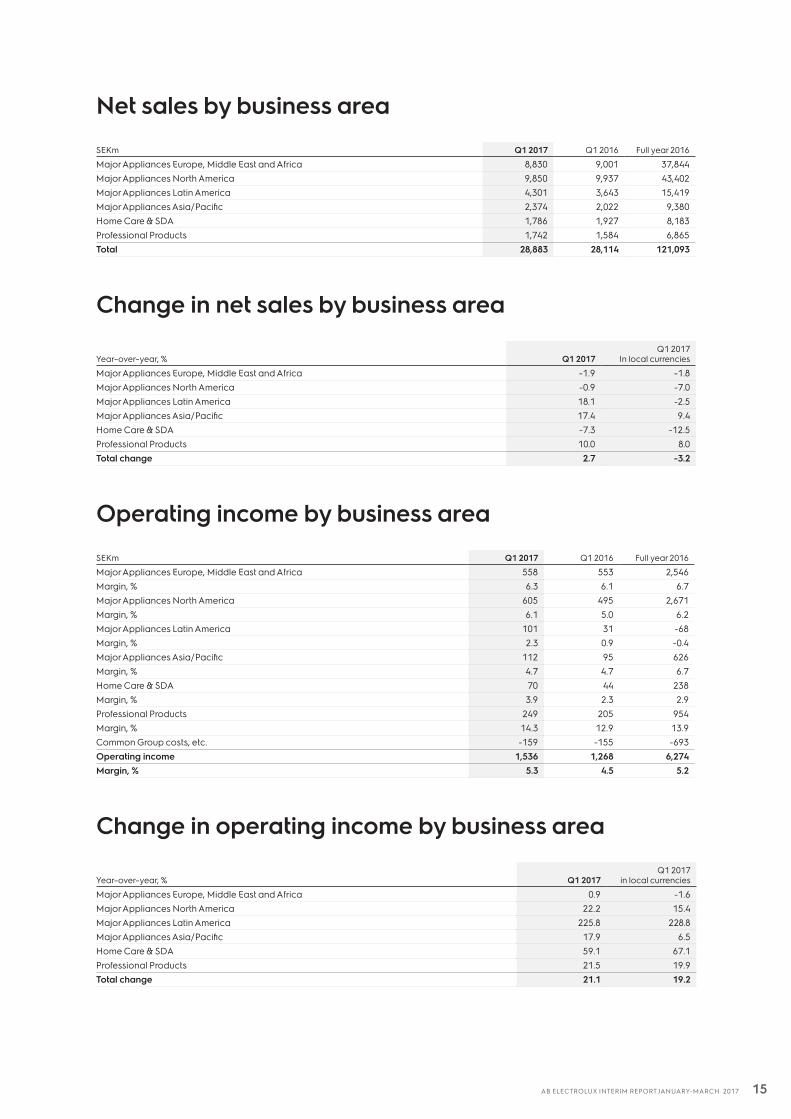
Net sales by business area
SEKm Q1 2017 Q1 2016 Full year 2016
Major Appliances Europe, Middle East and Africa 8,830 9,001 37,844Major Appliances North America 9,850 9,937 43,402Major Appliances Latin America 4,301 3,643 15,419Major Appliances Asia/Pacific 2,374 2,022 9,380Home Care & SDA 1,786 1,927 8,183Professional Products 1,742 1,584 6,865Total 28,883 28,114 121,093
Change in net sales by business area
Year–over–year, % Q1 2017Q1 2017
In local currencies
Major Appliances Europe, Middle East and Africa -1.9 -1.8Major Appliances North America -0.9 -7.0Major Appliances Latin America 18.1 -2.5Major Appliances Asia/Pacific 17.4 9.4Home Care & SDA -7.3 -12.5Professional Products 10.0 8.0Total change 2.7 -3.2
Operating income by business area
SEKm Q1 2017 Q1 2016 Full year 2016
Major Appliances Europe, Middle East and Africa 558 553 2,546Margin, % 6.3 6.1 6.7Major Appliances North America 605 495 2,671Margin, % 6.1 5.0 6.2Major Appliances Latin America 101 31 -68Margin, % 2.3 0.9 -0.4Major Appliances Asia/Pacific 112 95 626Margin, % 4.7 4.7 6.7Home Care & SDA 70 44 238Margin, % 3.9 2.3 2.9Professional Products 249 205 954Margin, % 14.3 12.9 13.9Common Group costs, etc. -159 -155 -693Operating income 1,536 1,268 6,274Margin, % 5.3 4.5 5.2
Change in operating income by business area
Year–over–year, % Q1 2017Q1 2017
in local currencies
Major Appliances Europe, Middle East and Africa 0.9 -1.6Major Appliances North America 22.2 15.4Major Appliances Latin America 225.8 228.8Major Appliances Asia/Pacific 17.9 6.5Home Care & SDA 59.1 67.1Professional Products 21.5 19.9Total change 21.1 19.2
15AB ELECTROLUX INTERIM REPORT JANUARY-MARCH 2017
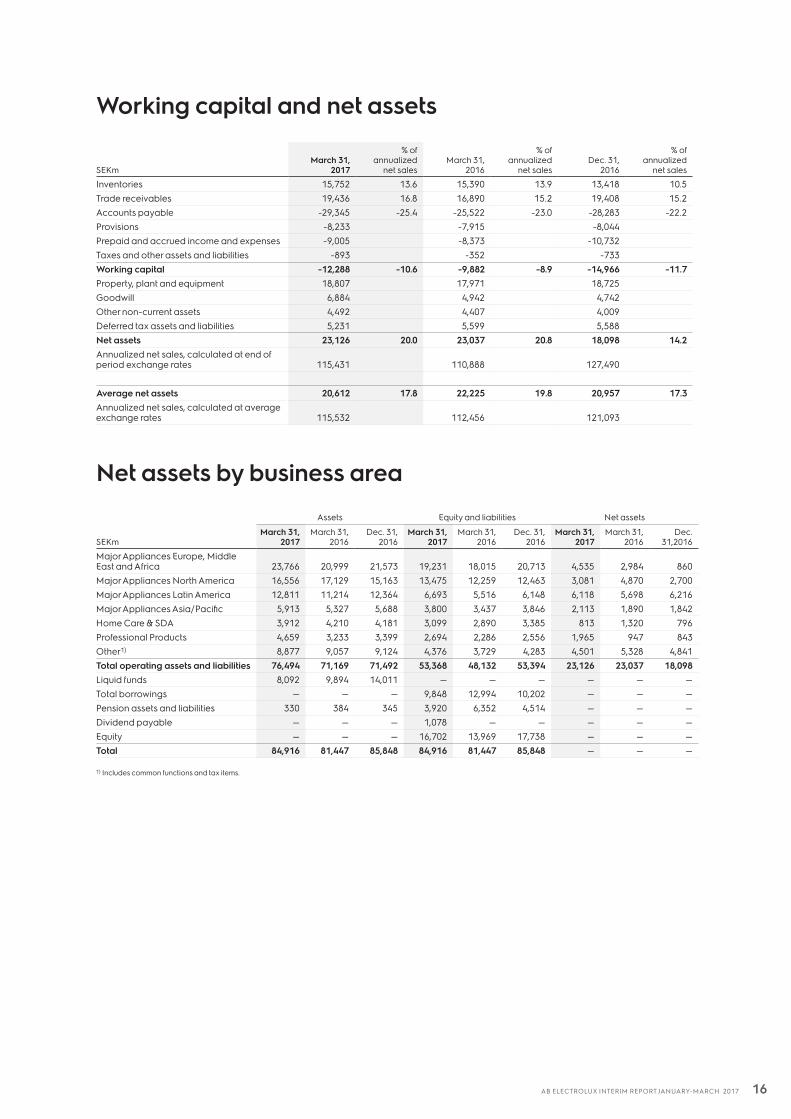
Working capital and net assets
SEKmMarch 31,
2017
% of annualized
net salesMarch 31,
2016
% of annualized
net salesDec. 31,
2016
% of annualized
net sales
Inventories 15,752 13.6 15,390 13.9 13,418 10.5Trade receivables 19,436 16.8 16,890 15.2 19,408 15.2Accounts payable -29,345 -25.4 -25,522 -23.0 -28,283 -22.2Provisions -8,233 -7,915 -8,044Prepaid and accrued income and expenses -9,005 -8,373 -10,732Taxes and other assets and liabilities -893 -352 -733Working capital -12,288 -10.6 -9,882 -8.9 -14,966 -11.7Property, plant and equipment 18,807 17,971 18,725Goodwill 6,884 4,942 4,742Other non-current assets 4,492 4,407 4,009Deferred tax assets and liabilities 5,231 5,599 5,588Net assets 23,126 20.0 23,037 20.8 18,098 14.2Annualized net sales, calculated at end of period exchange rates 115,431 110,888 127,490
Average net assets 20,612 17.8 22,225 19.8 20,957 17.3Annualized net sales, calculated at average exchange rates 115,532 112,456 121,093
Net assets by business area
Assets Equity and liabilities Net assets
SEKmMarch 31,
2017March 31,
2016Dec. 31,
2016March 31,
2017March 31,
2016Dec. 31,
2016March 31,
2017March 31,
2016Dec.
31,2016
Major Appliances Europe, Middle East and Africa 23,766 20,999 21,573 19,231 18,015 20,713 4,535 2,984 860Major Appliances North America 16,556 17,129 15,163 13,475 12,259 12,463 3,081 4,870 2,700Major Appliances Latin America 12,811 11,214 12,364 6,693 5,516 6,148 6,118 5,698 6,216Major Appliances Asia/Pacific 5,913 5,327 5,688 3,800 3,437 3,846 2,113 1,890 1,842Home Care & SDA 3,912 4,210 4,181 3,099 2,890 3,385 813 1,320 796Professional Products 4,659 3,233 3,399 2,694 2,286 2,556 1,965 947 843Other1) 8,877 9,057 9,124 4,376 3,729 4,283 4,501 5,328 4,841Total operating assets and liabilities 76,494 71,169 71,492 53,368 48,132 53,394 23,126 23,037 18,098Liquid funds 8,092 9,894 14,011 — — — — — —Total borrowings — — — 9,848 12,994 10,202 — — —Pension assets and liabilities 330 384 345 3,920 6,352 4,514 — — —Dividend payable — — — 1,078 — — — — —Equity — — — 16,702 13,969 17,738 — — —Total 84,916 81,447 85,848 84,916 81,447 85,848 — — —
1) Includes common functions and tax items.
16AB ELECTROLUX INTERIM REPORT JANUARY-MARCH 2017
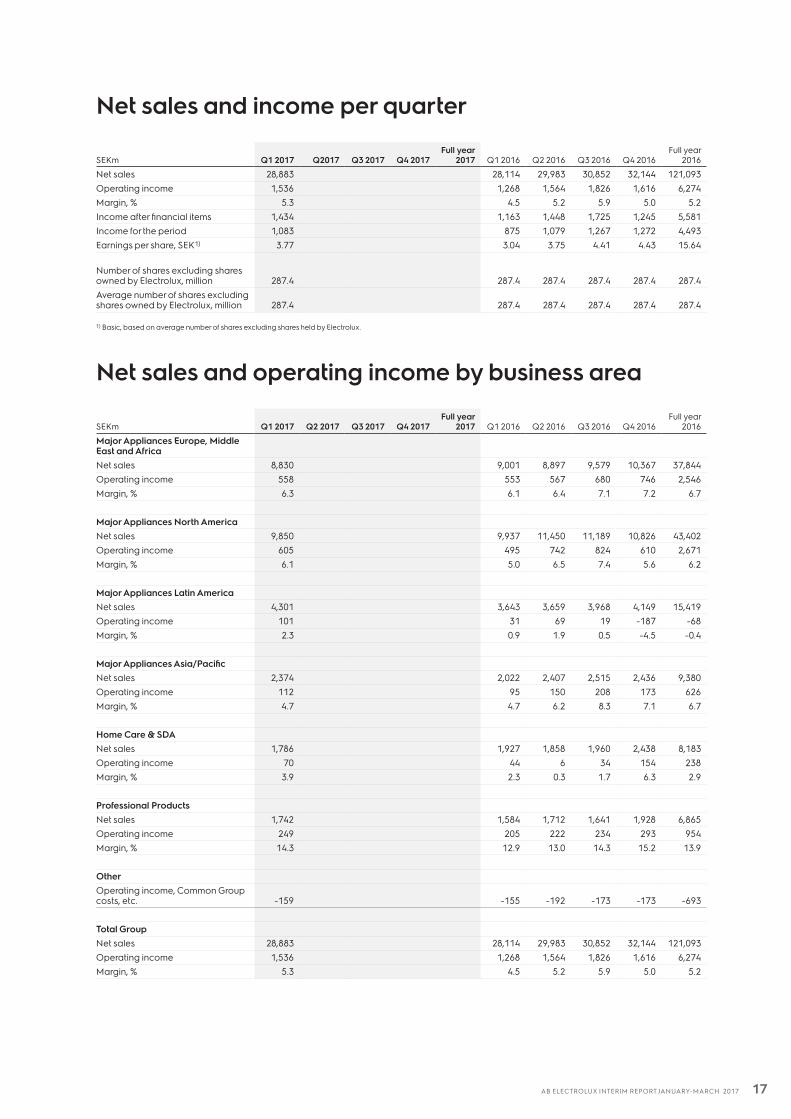
Net sales and income per quarter
SEKm Q1 2017 Q2017 Q3 2017 Q4 2017Full year
2017 Q1 2016 Q2 2016 Q3 2016 Q4 2016Full year
2016
Net sales 28,883 28,114 29,983 30,852 32,144 121,093Operating income 1,536 1,268 1,564 1,826 1,616 6,274Margin, % 5.3 4.5 5.2 5.9 5.0 5.2Income after financial items 1,434 1,163 1,448 1,725 1,245 5,581Income for the period 1,083 875 1,079 1,267 1,272 4,493Earnings per share, SEK1) 3.77 3.04 3.75 4.41 4.43 15.64
Number of shares excluding shares owned by Electrolux, million 287.4 287.4 287.4 287.4 287.4 287.4Average number of shares excluding shares owned by Electrolux, million 287.4 287.4 287.4 287.4 287.4 287.4
1) Basic, based on average number of shares excluding shares held by Electrolux.
Net sales and operating income by business area
SEKm Q1 2017 Q2 2017 Q3 2017 Q4 2017 Full year
2017 Q1 2016 Q2 2016 Q3 2016 Q4 2016Full year
2016
Major Appliances Europe, Middle East and AfricaNet sales 8,830 9,001 8,897 9,579 10,367 37,844Operating income 558 553 567 680 746 2,546Margin, % 6.3 6.1 6.4 7.1 7.2 6.7
Major Appliances North AmericaNet sales 9,850 9,937 11,450 11,189 10,826 43,402Operating income 605 495 742 824 610 2,671Margin, % 6.1 5.0 6.5 7.4 5.6 6.2
Major Appliances Latin AmericaNet sales 4,301 3,643 3,659 3,968 4,149 15,419Operating income 101 31 69 19 -187 -68Margin, % 2.3 0.9 1.9 0.5 -4.5 -0.4
Major Appliances Asia/PacificNet sales 2,374 2,022 2,407 2,515 2,436 9,380Operating income 112 95 150 208 173 626Margin, % 4.7 4.7 6.2 8.3 7.1 6.7
Home Care & SDANet sales 1,786 1,927 1,858 1,960 2,438 8,183Operating income 70 44 6 34 154 238Margin, % 3.9 2.3 0.3 1.7 6.3 2.9
Professional ProductsNet sales 1,742 1,584 1,712 1,641 1,928 6,865Operating income 249 205 222 234 293 954Margin, % 14.3 12.9 13.0 14.3 15.2 13.9
OtherOperating income, Common Group costs, etc. -159 -155 -192 -173 -173 -693
Total GroupNet sales 28,883 28,114 29,983 30,852 32,144 121,093Operating income 1,536 1,268 1,564 1,826 1,616 6,274Margin, % 5.3 4.5 5.2 5.9 5.0 5.2
17AB ELECTROLUX INTERIM REPORT JANUARY-MARCH 2017
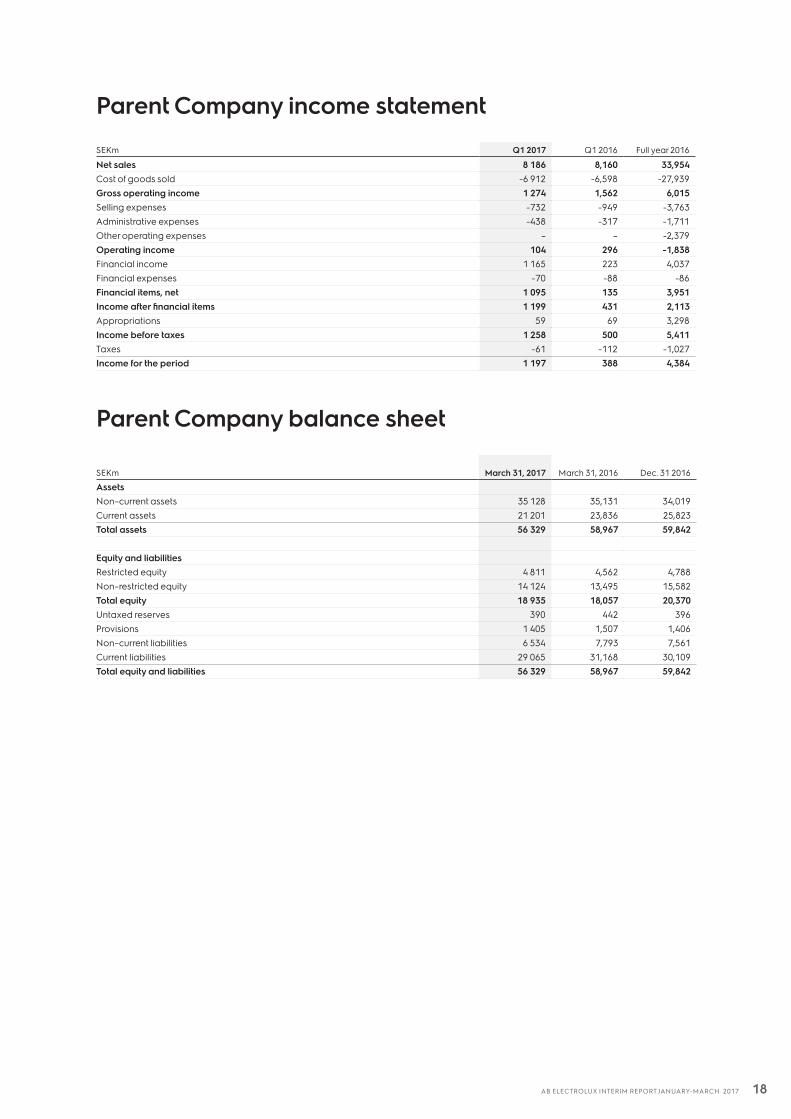
Parent Company income statement
SEKm Q1 2017 Q1 2016 Full year 2016
Net sales 8 186 8,160 33,954Cost of goods sold -6 912 -6,598 -27,939Gross operating income 1 274 1,562 6,015Selling expenses -732 -949 -3,763Administrative expenses -438 -317 -1,711Other operating expenses – – -2,379Operating income 104 296 -1,838Financial income 1 165 223 4,037Financial expenses -70 -88 -86Financial items, net 1 095 135 3,951Income after financial items 1 199 431 2,113Appropriations 59 69 3,298Income before taxes 1 258 500 5,411Taxes -61 -112 -1,027Income for the period 1 197 388 4,384
Parent Company balance sheet
SEKm March 31, 2017 March 31, 2016 Dec. 31 2016
AssetsNon–current assets 35 128 35,131 34,019Current assets 21 201 23,836 25,823Total assets 56 329 58,967 59,842
Equity and liabilitiesRestricted equity 4 811 4,562 4,788Non–restricted equity 14 124 13,495 15,582Total equity 18 935 18,057 20,370Untaxed reserves 390 442 396Provisions 1 405 1,507 1,406Non–current liabilities 6 534 7,793 7,561Current liabilities 29 065 31,168 30,109Total equity and liabilities 56 329 58,967 59,842
18AB ELECTROLUX INTERIM REPORT JANUARY-MARCH 2017
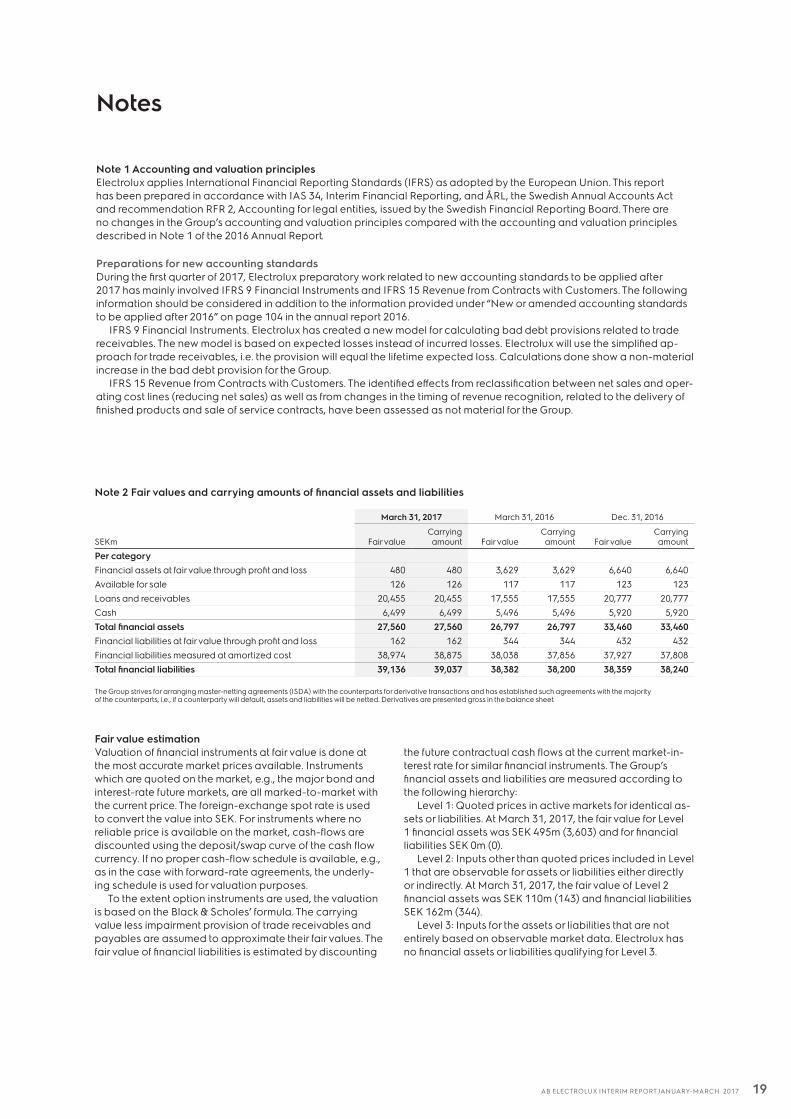
Note 1 Accounting and valuation principlesElectrolux applies International Financial Reporting Standards (IFRS) as adopted by the European Union. This report has been prepared in accordance with IAS 34, Interim Financial Reporting, and ÅRL, the Swedish Annual Accounts Act and recommendation RFR 2, Accounting for legal entities, issued by the Swedish Financial Reporting Board. There are no changes in the Group’s accounting and valuation principles compared with the accounting and valuation principles described in Note 1 of the 2016 Annual Report.
Preparations for new accounting standardsDuring the first quarter of 2017, Electrolux preparatory work related to new accounting standards to be applied after 2017 has mainly involved IFRS 9 Financial Instruments and IFRS 15 Revenue from Contracts with Customers. The following information should be considered in addition to the information provided under “New or amended accounting standards to be applied after 2016” on page 104 in the annual report 2016.
IFRS 9 Financial Instruments. Electrolux has created a new model for calculating bad debt provisions related to trade receivables. The new model is based on expected losses instead of incurred losses. Electrolux will use the simplified ap-proach for trade receivables, i.e. the provision will equal the lifetime expected loss. Calculations done show a non-material increase in the bad debt provision for the Group.
IFRS 15 Revenue from Contracts with Customers. The identified effects from reclassification between net sales and oper-ating cost lines (reducing net sales) as well as from changes in the timing of revenue recognition, related to the delivery of finished products and sale of service contracts, have been assessed as not material for the Group.
Fair value estimationValuation of financial instruments at fair value is done at the most accurate market prices available. Instruments which are quoted on the market, e.g., the major bond and interest-rate future markets, are all marked-to-market with the current price. The foreign-exchange spot rate is used to convert the value into SEK. For instruments where no reliable price is available on the market, cash-flows are discounted using the deposit/swap curve of the cash flow currency. If no proper cash-flow schedule is available, e.g., as in the case with forward-rate agreements, the underly-ing schedule is used for valuation purposes.
To the extent option instruments are used, the valuation is based on the Black & Scholes’ formula. The carrying value less impairment provision of trade receivables and payables are assumed to approximate their fair values. The fair value of financial liabilities is estimated by discounting
the future contractual cash flows at the current market-in-terest rate for similar financial instruments. The Group’s financial assets and liabilities are measured according to the following hierarchy:
Level 1: Quoted prices in active markets for identical as-sets or liabilities. At March 31, 2017, the fair value for Level 1 financial assets was SEK 495m (3,603) and for financial liabilities SEK 0m (0).
Level 2: Inputs other than quoted prices included in Level 1 that are observable for assets or liabilities either directly or indirectly. At March 31, 2017, the fair value of Level 2 financial assets was SEK 110m (143) and financial liabilities SEK 162m (344).
Level 3: Inputs for the assets or liabilities that are not entirely based on observable market data. Electrolux has no financial assets or liabilities qualifying for Level 3.
Notes
Note 2 Fair values and carrying amounts of financial assets and liabilities
March 31, 2017 March 31, 2016 Dec. 31, 2016
SEKm Fair valueCarrying amount Fair value
Carrying amount Fair value
Carrying amount
Per categoryFinancial assets at fair value through profit and loss 480 480 3,629 3,629 6,640 6,640Available for sale 126 126 117 117 123 123Loans and receivables 20,455 20,455 17,555 17,555 20,777 20,777Cash 6,499 6,499 5,496 5,496 5,920 5,920Total financial assets 27,560 27,560 26,797 26,797 33,460 33,460Financial liabilities at fair value through profit and loss 162 162 344 344 432 432Financial liabilities measured at amortized cost 38,974 38,875 38,038 37,856 37,927 37,808Total financial liabilities 39,136 39,037 38,382 38,200 38,359 38,240
The Group strives for arranging master-netting agreements (ISDA) with the counterparts for derivative transactions and has established such agreements with the majority of the counterparts, i.e., if a counterparty will default, assets and liabilities will be netted. Derivatives are presented gross in the balance sheet.
19AB ELECTROLUX INTERIM REPORT JANUARY-MARCH 2017
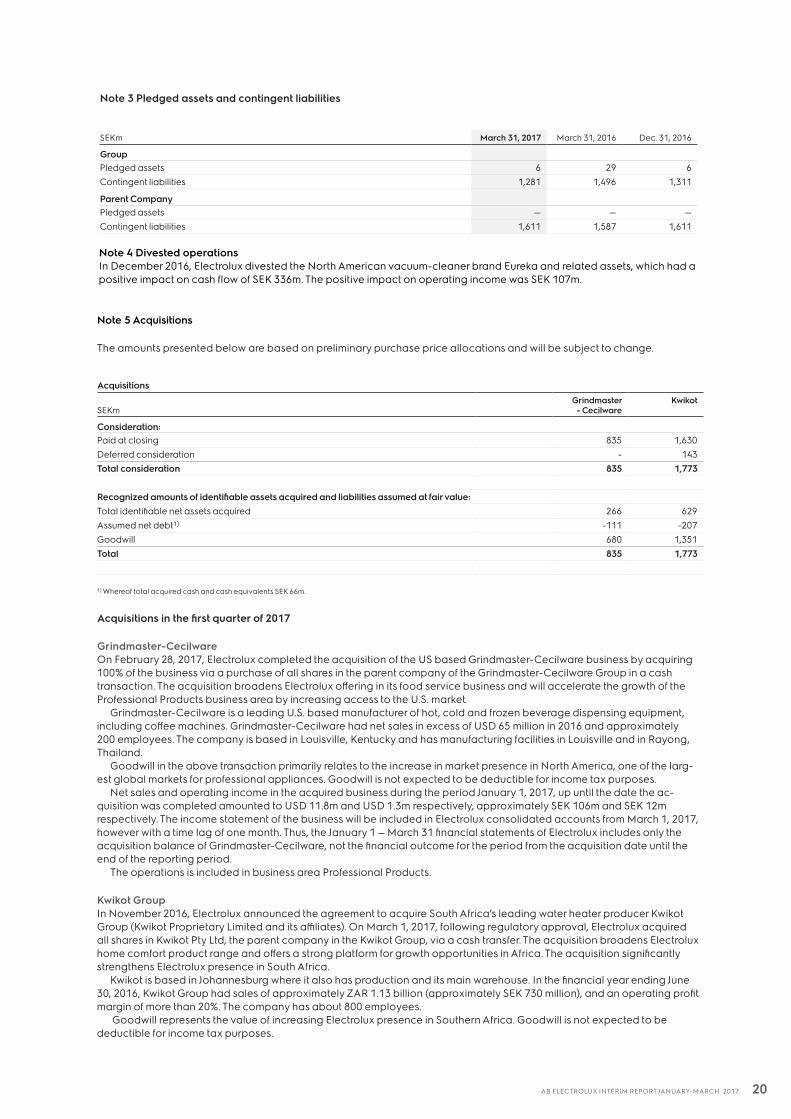
Acquisitions
SEKmGrindmaster- Cecilware
Kwikot
Consideration:Paid at closing 835 1,630Deferred consideration - 143Total consideration 835 1,773
Recognized amounts of identifiable assets acquired and liabilities assumed at fair value:Total identifiable net assets acquired 266 629Assumed net debt1) -111 -207Goodwill 680 1,351 Total 835 1,773
1) Whereof total acquired cash and cash equivalents SEK 66m.
Acquisitions in the first quarter of 2017
Grindmaster-CecilwareOn February 28, 2017, Electrolux completed the acquisition of the US based Grindmaster-Cecilware business by acquiring 100% of the business via a purchase of all shares in the parent company of the Grindmaster-Cecilware Group in a cash transaction. The acquisition broadens Electrolux offering in its food service business and will accelerate the growth of the Professional Products business area by increasing access to the U.S. market.
Grindmaster-Cecilware is a leading U.S. based manufacturer of hot, cold and frozen beverage dispensing equipment, including coffee machines. Grindmaster-Cecilware had net sales in excess of USD 65 million in 2016 and approximately 200 employees. The company is based in Louisville, Kentucky and has manufacturing facilities in Louisville and in Rayong, Thailand.
Goodwill in the above transaction primarily relates to the increase in market presence in North America, one of the larg-est global markets for professional appliances. Goodwill is not expected to be deductible for income tax purposes.
Net sales and operating income in the acquired business during the period January 1, 2017, up until the date the ac-quisition was completed amounted to USD 11.8m and USD 1.3m respectively, approximately SEK 106m and SEK 12m respectively. The income statement of the business will be included in Electrolux consolidated accounts from March 1, 2017, however with a time lag of one month. Thus, the January 1 — March 31 financial statements of Electrolux includes only the acquisition balance of Grindmaster-Cecilware, not the financial outcome for the period from the acquisition date until the end of the reporting period.
The operations is included in business area Professional Products.
Kwikot GroupIn November 2016, Electrolux announced the agreement to acquire South Africa’s leading water heater producer Kwikot Group (Kwikot Proprietary Limited and its affiliates). On March 1, 2017, following regulatory approval, Electrolux acquired all shares in Kwikot Pty Ltd, the parent company in the Kwikot Group, via a cash transfer. The acquisition broadens Electrolux home comfort product range and offers a strong platform for growth opportunities in Africa. The acquisition significantly strengthens Electrolux presence in South Africa.
Kwikot is based in Johannesburg where it also has production and its main warehouse. In the financial year ending June 30, 2016, Kwikot Group had sales of approximately ZAR 1.13 billion (approximately SEK 730 million), and an operating profit margin of more than 20%. The company has about 800 employees.
Goodwill represents the value of increasing Electrolux presence in Southern Africa. Goodwill is not expected to be deductible for income tax purposes.
Note 5 Acquisitions
The amounts presented below are based on preliminary purchase price allocations and will be subject to change.
Note 3 Pledged assets and contingent liabilities
SEKm March 31, 2017 March 31, 2016 Dec. 31, 2016
GroupPledged assets 6 29 6Contingent liabilities 1,281 1,496 1,311
Parent CompanyPledged assets — — —Contingent liabilities 1,611 1,587 1,611
Note 4 Divested operationsIn December 2016, Electrolux divested the North American vacuum-cleaner brand Eureka and related assets, which had a positive impact on cash flow of SEK 336m. The positive impact on operating income was SEK 107m.
20AB ELECTROLUX INTERIM REPORT JANUARY-MARCH 2017
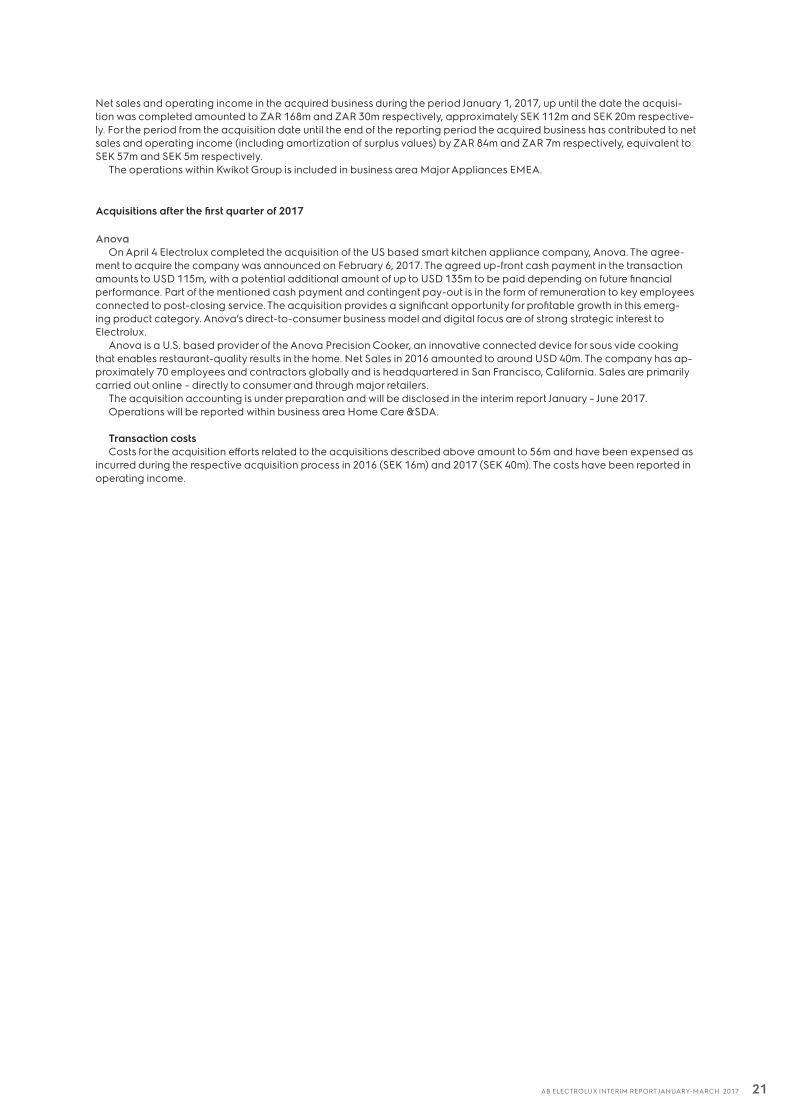
Net sales and operating income in the acquired business during the period January 1, 2017, up until the date the acquisi-tion was completed amounted to ZAR 168m and ZAR 30m respectively, approximately SEK 112m and SEK 20m respective-ly. For the period from the acquisition date until the end of the reporting period the acquired business has contributed to net sales and operating income (including amortization of surplus values) by ZAR 84m and ZAR 7m respectively, equivalent to SEK 57m and SEK 5m respectively.
The operations within Kwikot Group is included in business area Major Appliances EMEA.
Acquisitions after the first quarter of 2017
AnovaOn April 4 Electrolux completed the acquisition of the US based smart kitchen appliance company, Anova. The agree-
ment to acquire the company was announced on February 6, 2017. The agreed up-front cash payment in the transaction amounts to USD 115m, with a potential additional amount of up to USD 135m to be paid depending on future financial performance. Part of the mentioned cash payment and contingent pay-out is in the form of remuneration to key employees connected to post-closing service. The acquisition provides a significant opportunity for profitable growth in this emerg-ing product category. Anova’s direct-to-consumer business model and digital focus are of strong strategic interest to Electrolux.
Anova is a U.S. based provider of the Anova Precision Cooker, an innovative connected device for sous vide cooking that enables restaurant-quality results in the home. Net Sales in 2016 amounted to around USD 40m. The company has ap-proximately 70 employees and contractors globally and is headquartered in San Francisco, California. Sales are primarily carried out online – directly to consumer and through major retailers.
The acquisition accounting is under preparation and will be disclosed in the interim report January – June 2017. Operations will be reported within business area Home Care &SDA.
Transaction costsCosts for the acquisition efforts related to the acquisitions described above amount to 56m and have been expensed as
incurred during the respective acquisition process in 2016 (SEK 16m) and 2017 (SEK 40m). The costs have been reported in operating income.
21AB ELECTROLUX INTERIM REPORT JANUARY-MARCH 2017
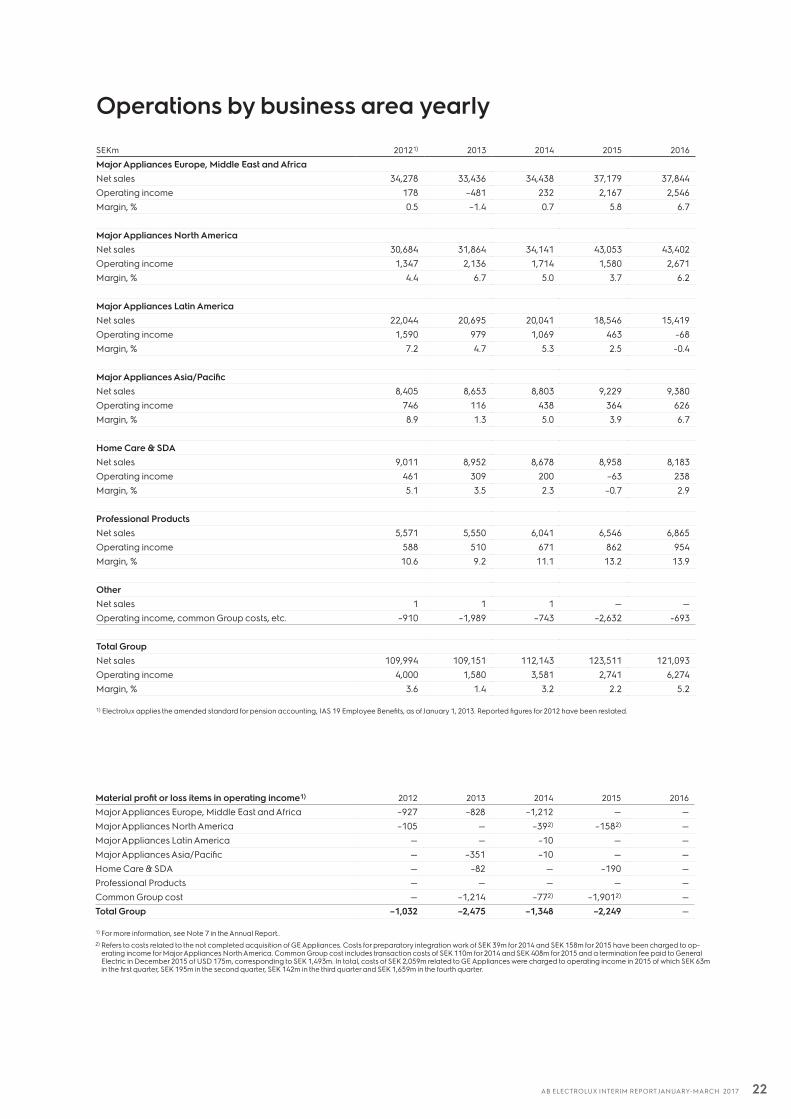
Operations by business area yearly
SEKm 20121) 2013 2014 2015 2016
Major Appliances Europe, Middle East and AfricaNet sales 34,278 33,436 34,438 37,179 37,844Operating income 178 –481 232 2,167 2,546Margin, % 0.5 –1.4 0.7 5.8 6.7
Major Appliances North AmericaNet sales 30,684 31,864 34,141 43,053 43,402Operating income 1,347 2,136 1,714 1,580 2,671Margin, % 4.4 6.7 5.0 3.7 6.2
Major Appliances Latin AmericaNet sales 22,044 20,695 20,041 18,546 15,419Operating income 1,590 979 1,069 463 -68Margin, % 7.2 4.7 5.3 2.5 -0.4
Major Appliances Asia/PacificNet sales 8,405 8,653 8,803 9,229 9,380Operating income 746 116 438 364 626Margin, % 8.9 1.3 5.0 3.9 6.7
Home Care & SDANet sales 9,011 8,952 8,678 8,958 8,183Operating income 461 309 200 –63 238Margin, % 5.1 3.5 2.3 –0.7 2.9
Professional ProductsNet sales 5,571 5,550 6,041 6,546 6,865Operating income 588 510 671 862 954Margin, % 10.6 9.2 11.1 13.2 13.9
OtherNet sales 1 1 1 — —Operating income, common Group costs, etc. –910 –1,989 –743 –2,632 -693
Total GroupNet sales 109,994 109,151 112,143 123,511 121,093Operating income 4,000 1,580 3,581 2,741 6,274Margin, % 3.6 1.4 3.2 2.2 5.2
1) Electrolux applies the amended standard for pension accounting, IAS 19 Employee Benefits, as of January 1, 2013. Reported figures for 2012 have been restated.
Material profit or loss items in operating income1) 2012 2013 2014 2015 2016
Major Appliances Europe, Middle East and Africa –927 –828 –1,212 — —Major Appliances North America –105 — –392) –1582) —Major Appliances Latin America — — –10 — —Major Appliances Asia/Pacific — –351 –10 — —Home Care & SDA — –82 — –190 —Professional Products — — — — —Common Group cost — –1,214 –772) –1,9012) —Total Group –1,032 –2,475 –1,348 –2,249 —
1) For more information, see Note 7 in the Annual Report..2) Refers to costs related to the not completed acquisition of GE Appliances. Costs for preparatory integration work of SEK 39m for 2014 and SEK 158m for 2015 have been charged to op-
erating income for Major Appliances North America. Common Group cost includes transaction costs of SEK 110m for 2014 and SEK 408m for 2015 and a termination fee paid to General Electric in December 2015 of USD 175m, corresponding to SEK 1,493m. In total, costs of SEK 2,059m related to GE Appliances were charged to operating income in 2015 of which SEK 63m in the first quarter, SEK 195m in the second quarter, SEK 142m in the third quarter and SEK 1,659m in the fourth quarter.
22AB ELECTROLUX INTERIM REPORT JANUARY-MARCH 2017
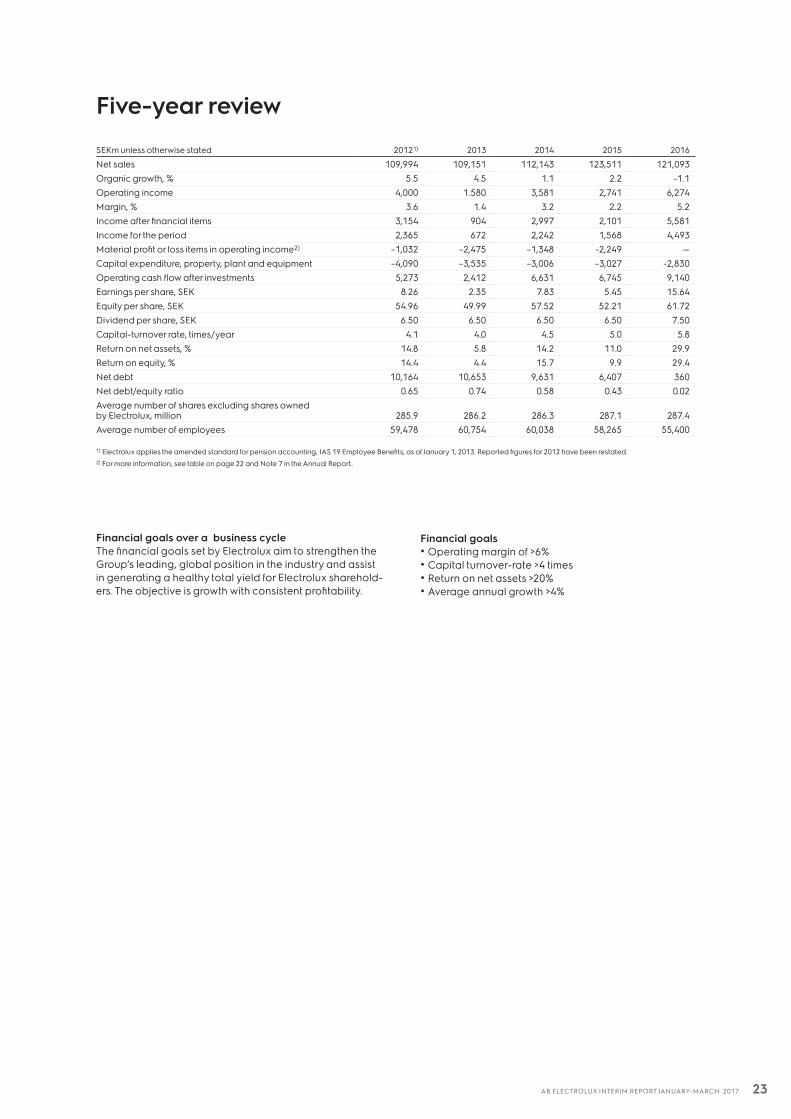
Financial goals over a business cycleThe financial goals set by Electrolux aim to strengthen the Group’s leading, global position in the industry and assist in generating a healthy total yield for Electrolux sharehold-ers. The objective is growth with consistent profitability.
Five-year review
SEKm unless otherwise stated 20121) 2013 2014 2015 2016
Net sales 109,994 109,151 112,143 123,511 121,093Organic growth, % 5.5 4.5 1.1 2.2 -1.1Operating income 4,000 1.580 3,581 2,741 6,274Margin, % 3.6 1.4 3.2 2.2 5.2Income after financial items 3,154 904 2,997 2,101 5,581Income for the period 2,365 672 2,242 1,568 4,493Material profit or loss items in operating income2) –1,032 –2,475 –1,348 -2,249 —Capital expenditure, property, plant and equipment –4,090 –3,535 –3,006 –3,027 -2,830Operating cash flow after investments 5,273 2,412 6,631 6,745 9,140Earnings per share, SEK 8.26 2.35 7.83 5.45 15.64Equity per share, SEK 54.96 49.99 57.52 52.21 61.72Dividend per share, SEK 6.50 6.50 6.50 6.50 7.50Capital-turnover rate, times/year 4.1 4.0 4.5 5.0 5.8Return on net assets, % 14.8 5.8 14.2 11.0 29.9Return on equity, % 14.4 4.4 15.7 9.9 29.4Net debt 10,164 10,653 9,631 6,407 360Net debt/equity ratio 0.65 0.74 0.58 0.43 0.02Average number of shares excluding shares owned by Electrolux, million 285.9 286.2 286.3 287.1 287.4Average number of employees 59,478 60,754 60,038 58,265 55,400
1) Electrolux applies the amended standard for pension accounting, IAS 19 Employee Benefits, as of January 1, 2013. Reported figures for 2012 have been restated. 2) For more information, see table on page 22 and Note 7 in the Annual Report..
Financial goals• Operating margin of >6% • Capital turnover-rate >4 times• Return on net assets >20% • Average annual growth >4%
23AB ELECTROLUX INTERIM REPORT JANUARY-MARCH 2017
DefinitionsThis report includes financial measures as required by the financial reporting framework applicable to Electrolux, which is based on IFRS. In addition, there are other measures and indicators that are used to follow-up, analyze and manage the business and to provide Electrolux stakeholders with useful financial information on the Group’s financial position, perfor-mance and development in a consistent way. Below is a list of definitions of all measures and indicators used, referred to and presented in this report.
Computation of average amounts and annualized income statement measuresIn computation of key ratios where averages of capital balances are related to income statement measures, the average capital balances are based on the opening balance and all quarter-end closing balances included in the reporting period, and the income statement measures are annualized, translated at average rates for the period. In computation of key ratios where end-of-period capital balances are related to income statement measures, the latter are annualized, translated at end of-period exchange rates. Adjustments are made for acquired and divested operations
Growth measures
Change in net salesCurrent year net sales for the period less previous year net sales for the period as a percentage of previous year net sales for the period.
Organic growthChange in net sales, adjusted for acquisitions, divestments and changes in exchange rates.
AcquisitionsChange in net sales, adjusted for organic growth, changes in exchange rates and divestments. The impact from acqui-sitions relates to net sales reported by acquired operations within 12 months after the acquisition date.
DivestmentsChange in net sales, adjusted for organic growth, chang-es in exchange rates and acquisitions. The impact from divestments relates to net sales reported by the divested operations within 12 months before the divestment date.
Profitability measures
Operating margin (EBIT margin)Operating income (EBIT) expressed as a percentage of net sales.
Return on net assetsOperating income (annualized) expressed as a percent-age of average net assets.
Return on equityIncome for the period (annualized) expressed as a per-centage of average total equity.
Capital measures
Net debt/equity ratioNet debt in relation to total equity.
Equity/assets ratioTotal equity as a percentage of total assets less liquid funds.
Capital turnover-rateNet sales (annualized) divided by average net assets.
Share-based measures
Earnings per shareIncome for the period attributable to equity holders of the Parent Company divided by the average number of shares excluding shares held by Electrolux.
Equity per shareTotal equity divided by total number of shares excluding shares held by Electrolux.
Capital indicators
Liquid fundsCash and cash equivalents, short-term investments, finan-cial derivative assets1) and prepaid interest expenses and accrued interest income1).
Working capitalTotal current assets exclusive of liquid funds, less non-cur-rent other provisions and total current liabilities exclusive of total short-term borrowings.
Net assetsTotal assets exclusive of liquid funds and pension plan assets, less deferred tax liabilities, non-current other provisions and total current liabilities exclusive of total short-term borrowings.
Total borrowingsLong-term borrowings and short-term borrowings, finan-cial derivative liabilities1), accrued interest expenses and prepaid interest income1).
Total short-term borrowingsShort-term borrowings, financial derivative liabilities1), accrued interest expenses and prepaid interest income1).
Interest-bearing liabilitiesLong-term borrowings and short-term borrowings ex-clusive of liabilities related to trade receivables with recourse1).
Financial net debtTotal borrowings less liquid funds.
Net provision for post-employment benefitsProvisions for post-employment benefits less pension plan assets.
Net debtFinancial net debt and net provision for post-employment benefits.
Other measures
Operating cash flow after investmentsCash flow from operations and investments adjusted for financial items paid, taxes paid and acquisitions/divest-ments of operations.
1) See table Net debt on page 8.
24AB ELECTROLUX INTERIM REPORT JANUARY-MARCH 2017
President and CEO Jonas Samuelson’s comments on the first quarter results 2017Today’s press release is available on the Electrolux website www.electroluxgroup.com/ir
Telephone conference 09.00 CET A telephone conference is held at 09.00 CET today, April 28. The conference will be chaired by Jonas Samuelson, President and CEO of Electrolux. Mr. Samuelson will be accompanied by Anna Ohlsson-Leijon, CFO.
Details for participation by telephone are as follows:Participants in Sweden should call +46 8 505 564 74Participants in UK/Europe should call +44 203 364 5374Participants in US should call +1 855 753 2230
Slide presentation for download: www.electroluxgroup.com/ir
Link to webcast: www.electroluxgroup.com/q1-2017
For further information, please contact:Catarina Ihre, Vice President Investor Relations at +46 8 738 60 87
Merton Kaplan, Analyst Investor Relations at+46 8 738 70 06
Website: www.electroluxgroup.com
AB Electrolux (publ) 556009-4178Postal address SE-105 45 Stockholm, Sweden Visiting address S:t Göransgatan 143, StockholmTelephone: +46 (0)8 738 60 00
Shareholders’ information
Calendar 2017
Interim report January - June July 19Interim report January - September October 27
25AB ELECTROLUX INTERIM REPORT JANUARY-MARCH 2017