Embed Size (px)
Citation preview
Traction is an investment company the operations of which are based on its own methodology for
developing and refining the companies in which Traction is an owner. Traction’s role as owner is
based on an active and long-term engagement, together with an entrepreneur or corporate
management and other joint owners. At present, Traction is involved in some 20 companies,
several of which are publicly traded. In addition, Traction is engaged in investment activities for
the purpose of obtaining a good yield on the Company’s capital. Traction’s share is traded on the
NASDAQ OMX Nordic Exchange in Stockholm (the Small Cap list). Read more about Traction at
www.traction.se
Interim Report January - March 2013 Period January - March
Profit after taxes attributable to the Parent Company’s shareholders amounted to MSEK 101 (219).
Earnings per share amounted to SEK 6.55 (14.07).
Consolidated net revenue amounted to MSEK 150 (129).
Operating profit amounted to MSEK 100 (216), of which: o Change in value of securities was MSEK 82 (201; o Dividend income was MSEK 5 (8); and o Operating profit of operating companies amounted to MSEK 11
(8).
The return on equity was 6 (15) percent.
Equity per share, attributable to the Parent Company’s shareholders, amounted to SEK 108 (101).
Estimated net asset value, with the operating subsidiaries valued at market, amounted to MSEK 1,810, equivalent to SEK 118 per share.
Events during the quarter
Purchase of shares in BE Group for MSEK 49, whereby ownership was increased to 21.7 percent of capital and votes.
Purchase of shares in Catella for MSEK 17 whereby ownership was increased to 11.6 percent of capital and 11.9 percent of votes.
Events after the end of the period under review
The change in value of listed securities, including dividend income, since 31 March until 6 May amounts to MSEK 4.
Half of the holding in SCA was sold for just short of MSEK 85.
Ankarsrum Die Casting has filed for corporate reconstruction, which has been communicated in a press release dated 22 April.

2 (13) President’s statement Traction’s profit for the first quarter amounts to just over MSEK 100, which is explained by positive changes in value on several of our listed holdings. The largest contributors to earnings were SCA with MSEK +28 and Hifab with MSEK +22. In terms of return on investment, the holdings in Hifab, Nordic Camping & Resort, SCA, Softronic and Swedbank grew in value by close to 20 percent. These price increases are obviously gratifying, even though such rate of growth is not sustainable in the long term. Events after the end of the period under review In April, the holding in SCA was halved in favour of new investments after a significant revaluation during the past year. The proceeds of the sale were about MSEK 85, which is twice the cost we paid for the shares a couple of years ago. We have also earned dividend income during that period. Ankarsrum Die Casting filed for corporate reconstruction, which was communicated in a press release dated 22 April. The background is that the company’s largest customer, which accounts for about half of its sales of just over MSEK 70, has cut back substantially its volume of purchases. After negotiations with that customer about price changes for the lower volume failed to produce acceptable terms, the customer also asserted that it intends to pursue a claim relating to prior deliveries made in 2009. Most recently, during 2011 Ankarsrum Die Casting has disputed claim as legally unfounded and since the customer has not taken further action, instead continuing to place orders for these products. The intention is to continue negotiations with the customer during the period of reconstruction with a view to creating prerequisites for continued operations, or alternatively, continue operations on a smaller scale with the remaining customers as a base. The crisis in Ankarsrum Die Casting is not expected to have anything but a very marginal effect on the Traction Group.
GROUP FINANCES
PERIOD JANUARY - MARCH
Summary
Net revenue amounted to MSEK 150 (129). The operating profit amounted to MSEK 100 (216), which includes changes in value in the amount of MSEK 82 (201), dividend income of MSEK 5 (8), and the result for operating subsidiaries in the amount of MSEK 11 (8). Net finance items amounted to MSEK 3 (4).
Operating subsidiaries
Net revenue amounted to MSEK 146 (128), of which Ankarsrumbolagen contributed with MSEK 71 (62) and Nilörngruppen with MSEK 75 (66). The operating profit was MSEK 11 (8), of which Ankarsrumbolagen contributed MSEK 6 (6) and Nilörngruppen MSEK 5 (2). Additional shares in Nilörngruppen were acquired for just short of MSEK 8, whereupon Traction’s ownership stands at 68 percent of capital and a little more than 59 of votes.
Listed holdings
The change in value of listed securities amounted to MSEK 78 (201), of which active holdings (ownership exceeding 10 percent) accounted for MSEK 59 (139). The change in value of other listed holdings amounted to MSEK 19 (62). Dividend income was earned in the amount of MSEK 5 (8).
Unlisted holdings
The change in value of unlisted, minority-owned holdings was MSEK 4 (–).

3 (13)
Capital expenditures and disposals
Investments in shares in listed companies amounted to MSEK 84 (38). In BE Group, ownership increased to 21.7 percent after purchases for just short of MSEK 49. Additional shares were acquired in Catella for MSEK 17, after which Traction’s stake has increased to 11.6 percent of capital and 11.9 percent of votes. Shares in listed companies were sold for MSEK 15 (91). Corporate bonds and other financial assets were purchased for MSEK 32, net (net sales of MSEK 27). During the first quarter, Traction participated in underwriting of rights issues in Nordic Mines and PA Resources. The issue on Nordic Mines was fully subscribed. The issue in PA Resources was not fully subscribed, which as far as Traction is concerned resulted in subscription for approximately MSEK 16. Traction also participated in an underwriting consortium for Dannemora Mineral, where the issue, which was completed in April, was not fully subscribed and Traction subscribed for just short of MSEK 10, after deduction of underwriting fees.
Liquidity and cash flow
The Group’s cash and cash equivalents as of 31 March amounted to MSEK 152 (254), MSEK 112 of which in central Traction. MSEK 464 of Traction’s current assets consisted of financial investments in the form of shares and interest-bearing investments. The Group’s interest-bearing liabilities amounted to MSEK 18 (7) and are attributable to the operating companies. Traction’s goal is that the operating subsidiaries should be able to finance their operations on their own merits. Traction is expected to receive approximately MSEK 43 in dividend income during the second quarter of 2013 from the active holdings, including Nilörngruppen. In addition hereto, Traction’s liquid position will be strengthened by dividends from the other listed holdings. A dividend to Traction’s shareholders of SEK 3.10 (2.35) per share has been proposed, equivalent to MSEK 47.6.
Equity
Equity amounted to MSEK 1,683 as of 31 March (1,585), of which MSEK 1,655 (1,559) is attributable to the Parent Company’s equity holders, equivalent to SEK 108 (101) per share. The number of shares outstanding as of 31 March was 16,400,000, of which 1,800,000 are Class A shares. Not including shares held in treasury, the number of shares outstanding is 15,364,000, of which 1,800,000 are Class A shares.
Parent Company
AB Traction’s profit mounted to MSEK 80 (179). Cash and cash equivalents amounted to
MSEK 98 as of 31 March (201). The Parent Company’s equity ratio as of 31 March was
100 (100) percent. The Parent Company has no external loans.
4 (13)
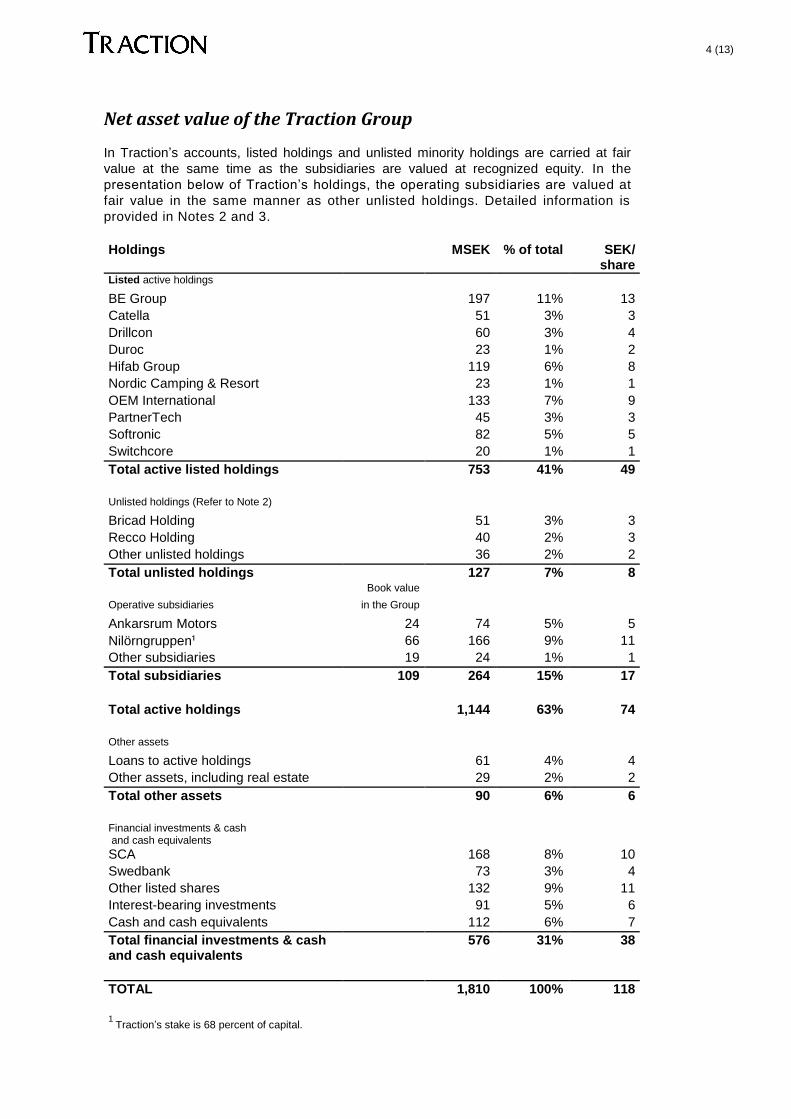
Net asset value of the Traction Group
In Traction’s accounts, listed holdings and unlisted minority holdings are carried at fair
value at the same time as the subsidiaries are valued at recognized equity. In the
presentation below of Traction’s holdings, the operating subsidiaries are valued at
fair value in the same manner as other unlisted holdings. Detailed information is
provided in Notes 2 and 3.
Holdings MSEK % of total SEK/
share Listed active holdings
BE Group 197 11% 13
Catella 51 3% 3
Drillcon 60 3% 4
Duroc 23 1% 2
Hifab Group 119 6% 8
Nordic Camping & Resort 23 1% 1
OEM International 133 7% 9
PartnerTech 45 3% 3
Softronic 82 5% 5
Switchcore 20 1% 1
Total active listed holdings 753 41% 49
Unlisted holdings (Refer to Note 2)
Bricad Holding 51 3% 3
Recco Holding 40 2% 3
Other unlisted holdings 36 2% 2
Total unlisted holdings 127 7% 8
Book value Operative subsidiaries in the Group
Ankarsrum Motors 24 74 5% 5
Nilörngruppen¹ 66 166 9% 11
Other subsidiaries 19 24 1% 1
Total subsidiaries 109 264 15% 17
Total active holdings 1,144 63% 74
Other assets
Loans to active holdings 61 4% 4
Other assets, including real estate 29 2% 2
Total other assets 90 6% 6
Financial investments & cash and cash equivalents
SCA 168 8% 10
Swedbank 73 3% 4
Other listed shares 132 9% 11
Interest-bearing investments 91 5% 6
Cash and cash equivalents 112 6% 7
Total financial investments & cash and cash equivalents
576 31% 38
TOTAL 1,810 100% 118
1 Traction’s stake is 68 percent of capital.
5 (13)
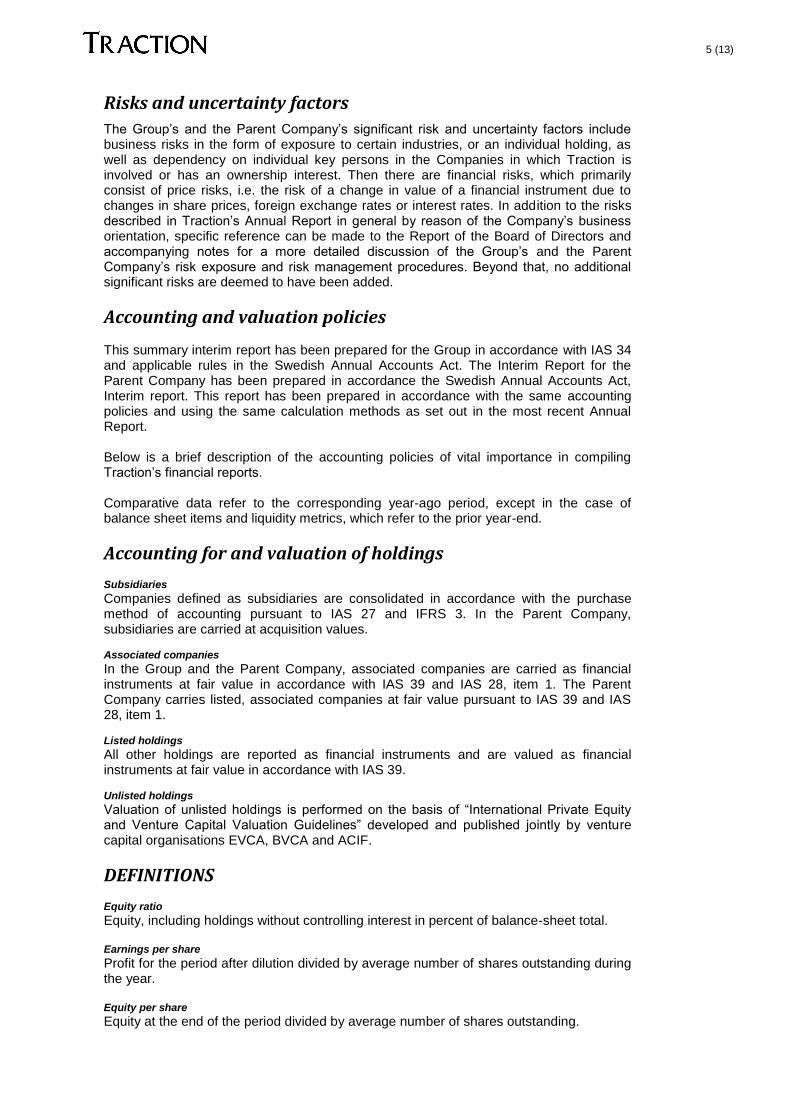
Risks and uncertainty factors
The Group’s and the Parent Company’s significant risk and uncertainty factors include business risks in the form of exposure to certain industries, or an individual holding, as well as dependency on individual key persons in the Companies in which Traction is involved or has an ownership interest. Then there are financial risks, which primarily consist of price risks, i.e. the risk of a change in value of a financial instrument due to changes in share prices, foreign exchange rates or interest rates. In addition to the risks described in Traction’s Annual Report in general by reason of the Company’s business orientation, specific reference can be made to the Report of the Board of Directors and accompanying notes for a more detailed discussion of the Group’s and the Parent Company’s risk exposure and risk management procedures. Beyond that, no additional significant risks are deemed to have been added.
Accounting and valuation policies
This summary interim report has been prepared for the Group in accordance with IAS 34 and applicable rules in the Swedish Annual Accounts Act. The Interim Report for the Parent Company has been prepared in accordance the Swedish Annual Accounts Act, Interim report. This report has been prepared in accordance with the same accounting policies and using the same calculation methods as set out in the most recent Annual Report. Below is a brief description of the accounting policies of vital importance in compiling Traction’s financial reports. Comparative data refer to the corresponding year-ago period, except in the case of balance sheet items and liquidity metrics, which refer to the prior year-end.
Accounting for and valuation of holdings
Subsidiaries
Companies defined as subsidiaries are consolidated in accordance with the purchase method of accounting pursuant to IAS 27 and IFRS 3. In the Parent Company, subsidiaries are carried at acquisition values. Associated companies
In the Group and the Parent Company, associated companies are carried as financial instruments at fair value in accordance with IAS 39 and IAS 28, item 1. The Parent Company carries listed, associated companies at fair value pursuant to IAS 39 and IAS 28, item 1. Listed holdings
All other holdings are reported as financial instruments and are valued as financial instruments at fair value in accordance with IAS 39. Unlisted holdings
Valuation of unlisted holdings is performed on the basis of “International Private Equity and Venture Capital Valuation Guidelines” developed and published jointly by venture capital organisations EVCA, BVCA and ACIF.
DEFINITIONS
Equity ratio Equity, including holdings without controlling interest in percent of balance-sheet total. Earnings per share Profit for the period after dilution divided by average number of shares outstanding during the year. Equity per share Equity at the end of the period divided by average number of shares outstanding.
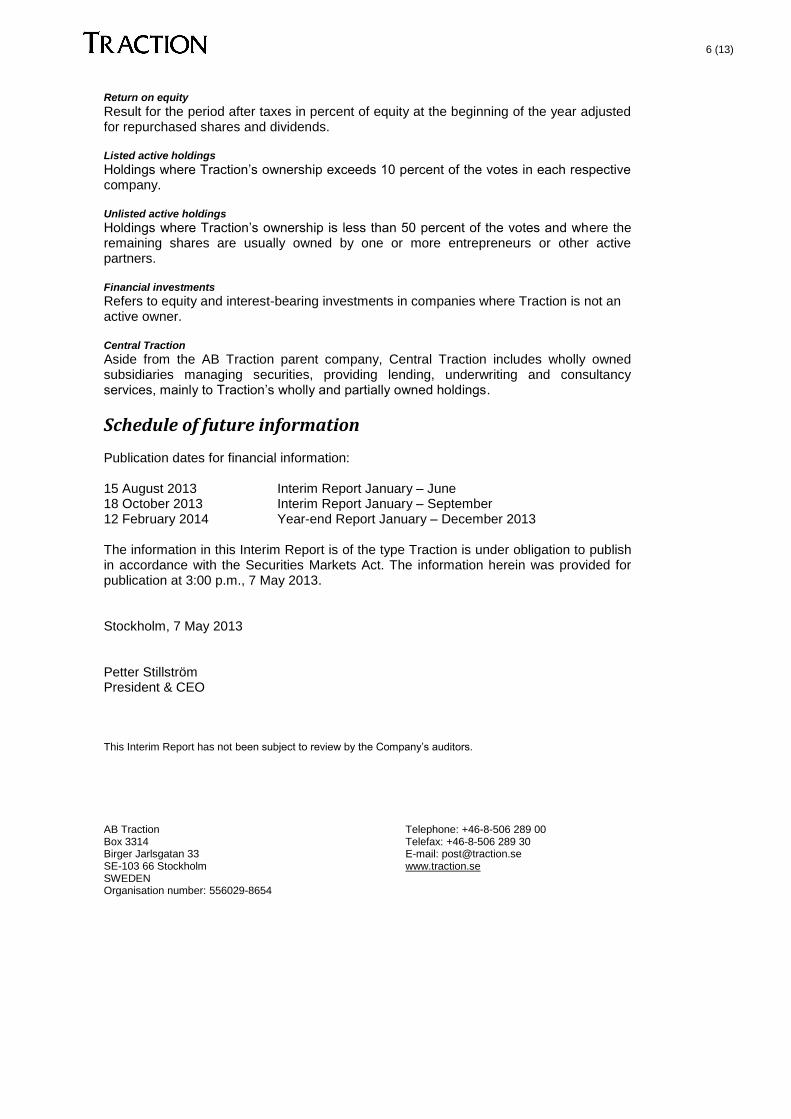
6 (13) Return on equity Result for the period after taxes in percent of equity at the beginning of the year adjusted for repurchased shares and dividends. Listed active holdings
Holdings where Traction’s ownership exceeds 10 percent of the votes in each respective company. Unlisted active holdings
Holdings where Traction’s ownership is less than 50 percent of the votes and where the remaining shares are usually owned by one or more entrepreneurs or other active partners. Financial investments
Refers to equity and interest-bearing investments in companies where Traction is not an active owner. Central Traction
Aside from the AB Traction parent company, Central Traction includes wholly owned subsidiaries managing securities, providing lending, underwriting and consultancy services, mainly to Traction’s wholly and partially owned holdings.
Schedule of future information
Publication dates for financial information: 15 August 2013 Interim Report January – June 18 October 2013 Interim Report January – September 12 February 2014 Year-end Report January – December 2013 The information in this Interim Report is of the type Traction is under obligation to publish in accordance with the Securities Markets Act. The information herein was provided for publication at 3:00 p.m., 7 May 2013. Stockholm, 7 May 2013 Petter Stillström President & CEO This Interim Report has not been subject to review by the Company’s auditors.
AB Traction Telephone: +46-8-506 289 00 Box 3314 Telefax: +46-8-506 289 30 Birger Jarlsgatan 33 E-mail: [email protected] SE-103 66 Stockholm www.traction.se SWEDEN Organisation number: 556029-8654
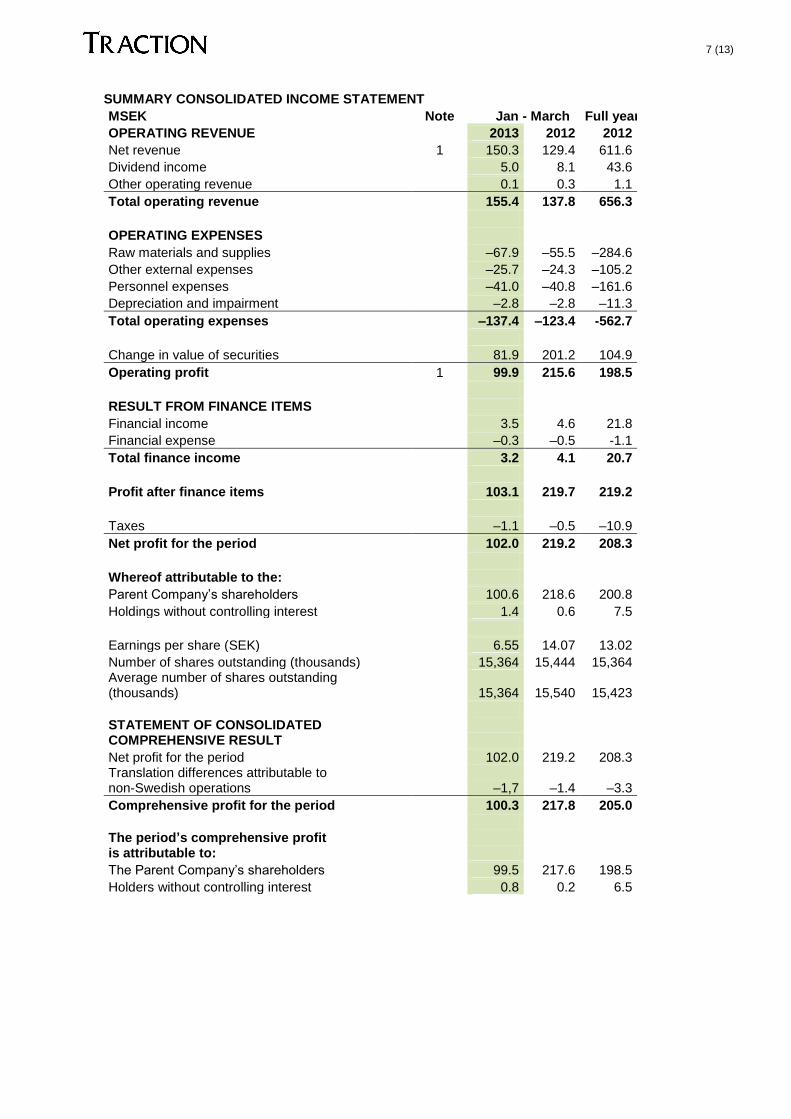
7 (13) SUMMARY CONSOLIDATED INCOME STATEMENT
MSEK Note Jan - March Full year
OPERATING REVENUE
2013 2012 2012
Net revenue 1 150.3 129.4 611.6
Dividend income
5.0 8.1 43.6
Other operating revenue 0.1 0.3 1.1
Total operating revenue
155.4 137.8 656.3
OPERATING EXPENSES
Raw materials and supplies
–67.9 –55.5 –284.6
Other external expenses
–25.7 –24.3 –105.2
Personnel expenses
–41.0 –40.8 –161.6
Depreciation and impairment –2.8 –2.8 –11.3
Total operating expenses
–137.4 –123.4 -562.7
Change in value of securities 81.9 201.2 104.9
Operating profit 1 99.9 215.6 198.5
RESULT FROM FINANCE ITEMS
Financial income
3.5 4.6 21.8
Financial expense –0.3 –0.5 -1.1
Total finance income
3.2 4.1 20.7
Profit after finance items
103.1 219.7 219.2
Taxes –1.1 –0.5 –10.9
Net profit for the period
102.0 219.2 208.3
Whereof attributable to the:
Parent Company’s shareholders
100.6 218.6 200.8
Holdings without controlling interest
1.4 0.6 7.5
Earnings per share (SEK)
6.55 14.07 13.02
Number of shares outstanding (thousands)
15,364 15,444 15,364 Average number of shares outstanding (thousands)
15,364 15,540 15,423
STATEMENT OF CONSOLIDATED COMPREHENSIVE RESULT
Net profit for the period
102.0 219.2 208.3 Translation differences attributable to non-Swedish operations –1,7 –1.4 –3.3
Comprehensive profit for the period
100.3 217.8 205.0
The period’s comprehensive profit is attributable to:
The Parent Company’s shareholders
99.5 217.6 198.5
Holders without controlling interest
0.8 0.2 6.5

8 (13)
SUMMARY CONSOLIDATED BALANCE SHEET MSEK Note 2013 2012
ASSETS
31/3 31/3 31/12
Intangible non-current assets
5.6 1.1 0.7
Tangible non-current assets
61.1 59.0 60.2
Equities 2 880.3 775.0 716.4
Long-term liabilities
1.3 1.5 1.2
Deferred tax asset 24.1 28.3 24.0
Total non-current assets
972.4 864.9 802.5
Inventories
94.5 86.1 85.3
Other current assets
111.6 103.7 109.7
Financial investments under active management 3 464.0 467.1 445.6
Loan receivables
25.9 34.0 27.8
Cash and cash equivalents 152.3 212.0 253.8
Total current assets
848.3 902.9 922.2
TOTAL ASSETS
1,820.7 1,767.8 1,724.7
EQUITY AND LIABILITIES Equity Attributable to the Parent Company’s shareholders
1,654.6 1,620.7 1,559.4
Attributable to holders without controlling interest 28,6 29.8 26.0
Total equity
1,683.2 1,650.5 1,585.4
Long-term liabilities1
21.4 5.2 20.7
Current liabilities1 116.1 112.1 118.6
Total liabilities
164.5 117.3 139.3
Total liabilities and equity
1,820.7 1,767.8 1,724.7
1 Of which interest-bearing liabilities
18.0 6.6 17.9
SUMMARY REPORT OF CHANGES IN CONSOLIDATED EQUITY
2013 2012
MSEK
31/3 31/3 31/12
OPENING BALANCE
1,585.4 1,445.2 1,445.2
Change in holdings without controlling interest –2.5 - -
Dividend to shareholders
- - –36.3
Dividend attributable to shareholders without controlling influence
- - –10.3
New issue attributable to minority
- - 0.2
Repurchase of own shares
- –12.5 –18.4
Comprehensive result for the period 100.3 217.8 205.0
Closing balance
1,683.2 1,650.5 1,585.4

9 (13)
SUMMARY CONSOLIDATED CASH FLOW STATEMENT
Jan - March Full year
MSEK 2013 2012 2012
Operating activities Consolidated profit before taxes 103.1 219.7 219.2
Adjustment for items not included in cash flow –79.1 –198.4 –93.6
Paid taxes –0.9 –2.2 –10.6
Cash flow from operating activities Before changes in working capital 23.1 19.1 115.0
Changes in working capital –15.3 –5.5 –3.7
Cash flow from operating activities 7.8 13.6 111.3
Cash flow from investment activities Purchase of share in unlisted companies –0.4 –0.7 –0.7
Sale of shares in unlisted companies 0.3 - -
Purchase of shares in listed companies –84.1 –38.1 –125.2
Sale of shares in listed companies 15.0 91.1 167.5
Purchases/sales of tangible non-current assets –3.7 –4.0 –13.3
Change in other financial assets –28.6 27.3 33.3
Cash flow from investment activities –101.5 75.6 61.6
Financing activities Change in loan liabilities 0.1 -1.2 10.0
Acquisition of holdings without controlling interest –7.8 - -
Minority interest in new issue - - 0.2
Dividend paid - - -36.3
Dividend paid to holders without controlling interest - - -10.3
Repurchase of own shares - -12.5 -18.5
Cash flow from financing activities –7.7 –13.7 –54.9
Cash flow for the period –101.4 75.5 118.0
Cash and cash equivalents at beginning of period 253.8 136.9 136.9
Translation difference in cash and cash equivalents –0.1 –0.4 –1.1
Cash and cash equivalents at end of period 152.3 212.0 253.8
Jan - March Full year
KEY FINANCIAL INDICATORS 2013 2012 2012
Return on equity for the period, % 6 15 15
Equity per share, SEK 108 105 101
Market price at end of period, SEK 98 80 85
Market price/equity, % 91 76 83
Equity ratio, % 91 93 92

10 (13) (Note 1)
Group 2013 Listed Unlisted Central Consolidation
Period January - March holdings holdings Subsidiaries Traction adjustments Total
Net revenue 145.8 4.7 –0.2 150.3
Dividend income 5.0 5.0
Other operating income 0.1 0.1
Operating expenses –135.1 –2.5 0.2 –137.4
Changes in value 77.7 4.2 81.9
Operating profit 82.7 4.2 10.8 2.2 0.0 99.9
Group 2012 Listed Unlisted Central Consolidation
Period January - March holdings holdings Subsidiaries Traction adjustments Total
Net revenue 128.3 1.3 -0.2 129.4
Dividend income 8.1 8.1
Other operating income 0.3 0.3
Operating expenses –121.1 –2.5 0.2 –123.4
Changes in value 201.2 201.2
Operating profit 209.3 - 7.5 –1.2 0.0 215.6
(Note 2)
Equities
Number
Market Market
of shares Market price value, MSEK price trend Stake in Stake in
Company (thousands) 31/3 2013 31/3 2013 2013, %1
company, % votes, %
Listed active holdings
BE Group 10 839 18,2 197 7 22 22
Catella 9 489 5,4 51 -3 12 12
Drillcon 13 377 4,5 60 10 30 30
Duroc 2 000 11,5 23 0 27 30
Hifab Group 14 547 8,20 119 22 48 41
Nordic Camping & Resort 2 442 9,3 23 20 32 32
OEM International 1 888 70,5 133 5 8 12
PartnerTech 2 361 19,1 45 -8 19 19
Softronic 11 529 7,1 82 20 22 20
Switchcore 10 372 1,86 19 -7 28 22
Total active holdings
753 1
Price trend refers to the entire year and is not adjusted for purchases during the year.
Market
value, MSEKK Revaluation, Stake in Stake in
Unlisted holdings 31/3 2013 2013, MSEK company, % votes, %
Bricad Holding
51
47 47
Recco Holding
40
50 50
Other unlisted holdings 36 4
Total unlisted holdings 127 4
Total equities
880

11 (13)
(Note 3)
Financial investments
Number
Market
of shares Market price value, MSEK
Company (thousands) 31/3 2013 31/3 2013
SCA 1,000 168.0 168
Swedbank 500 145.7 73
Other equity investments 132
Total equity investments
373
Interest-bearing investments 91
Total financial investments 464

12 (13) (Note 4) Financial investments From the first quarter of 2013, IFRS requires the following disclosures in interim reports. Figures are based on the same accounting policies and valuation principles that were used in preparing the most recent Annual Report. The table below provide information about how fair value is determined for the financial instruments that are carried at fair value in the balance sheet. The breakdown of how fair value is determined is based on the following three levels:
Level 1: Based on prices quoted on an active market for the same instruments. Level 2: Based on directly or indirectly observable market data not included in level 1.
Level 3: Based on input data not observable in the marketplace.
Group 2013 Level 1 Level 2 Level 3 Total
Financial assets Shares in unlisted companies
127.3 127.3
Shares in listed active holdings 753.0
753.0
Financial investments 464.0 464.0
Summa 1 217.0
127.3 1 344.3
Group 2012 Level 1 Level 2 Level 3 Summa
Financial assets Shares in unlisted companies
123.0 123.0
Shares in listed active holdings 593.4
593.4
Financial investments 445.6 445.6
Total 1,039.0
123.0 1,162.0
Transfers between levels Transfers between different levels effected during a period under review should be presented with the value at the end of the reporting period. The holding in Catella was reclassified during the first quarter to active holding, as the holding exceeded 10 percent of the votes. Valuation of financial instruments at level 3 Valuation of unlisted holdings is made on the basis of “International Private Equity and Venture Capital Valuation Guidelines”, as developed and published jointly by risk capital organisations EVCA, BVCA and AFIC. For directly owned investments, an overall assessment is made to determine which valuation method is appropriate for individual holdings. Taken into account will be whether any financing or transaction ”at arms-length instance” has been made, and an valuation is also made by applying relevant multiples to the company’s key financial indicators from a selected group of comparable companies, less an adjustment for, for instance, difference in size between the company in question and the group of comparable companies. In cases where there are other methods that better reflect the fair value of an individual holding, such methods are used, which means that individual holdings can be valued by other than the methods described here.
Change in financial assets and liabilities in level 3
Group 31/3 2013 Opening book value 123.0 Purchases/shareholder contributions 0.4 Sales/redemption –0.3 Reclassification - Change in value 4.2 Total 127.3

13 (13)
SUMMARY PARENT COMPANY INCOME STATEMENT
MSEK
Jan - March
2013 2012
Dividend income
5.0 8.1
Other operating revenue - -
Total operating revenue
5.0 8.1
Other external expenses
–0.3 –0.2
Personnel expenses - -
Total operating expenses
–0.3 –0.2
Change in value of securities 65.1 168.5
Operating profit
69.8 176.4
Shares in Group companies
-
Financial income/expense 1.1 2.8
Profit before taxes
70.9 179.2
Taxes - -
Net profit for the period
70.9 179.2
SUMMARY PARENT COMPANY STATEMENT
OF COMPREHENSIVE RESULT
Net profit for period
70.9 179.2
Other comprehensive result for the period - -
Comprehensive result for the period
70.9 179.2
SUMMARY PARENT COMPANY BALANCE SHEET
MSEK
2013 2012
31/3 31/12
ASSETS
Equities 809.9 668.5
Total non-current assets
809.9 570.7
Due from Group companies
82.6 63.4
Other receivables
0.9 0.2
Financial investments
372.5 357.9
Cash and cash equivalents 98.2 201.2
Total current assets 554.2 720.5
TOTAL ASSETS
1,364.1 1,291.2
EQUITY AND LIABILITIES
Equity 1,361.9 1,291.0
Current liabilities 2.2 0.2
Total current liabilities 2.2 0.2
TOTAL LIABILITIES AND EQUITY
1,364.1 1,291.2
Pledged assets
- -
Contingent liabilities
- -