Embed Size (px)
Citation preview

Interim Report of the Nordex GroupJanuary–September 2010

2
3 Key figures
4 Preface
5 The stock
Consolidated interim 7 Economic conditions
management report 8 Business performance
as of September 30, 2010 8 Results of operations and earnings
9 Financial condition and net assets
9 Capital spending
9 Research and development
10 Employees
10 Risks and opportunities
10 Outlook
11 Events after the conclusion of the period under review
Consolidated interim 12 Consolidated balance sheet
financial statements 13 Consolidated income statement
as of September 30, 2010 13 Consolidated statement of comprehensive income
14 Consolidated cash flow statement
15 Consolidated statement of changes in equity
16 Notes on the interim consolidated financial statements
20 Statement of changes in property,
plant and equipment and intangible assets
22 Group segment report
23 Supervisory Board/Management Board
24 Calendar of events/statutory disclosures/disclaimer
Contents

3
Key financials
01/01/2010
-09/30/2010
01/01/2009
-09/30/2009
07/01/2010
-09/30/2010
07/01/2009
-09/30/2009
Sales EUR mn 614.2 814.0 264.4 301.5
Total revenues EUR mn 634.4 802.7 255.4 281.5
EBITDA EUR mn 32.1 35.7 15.7 16.4
EBIT EUR mn 17.3 21.9 10.2 12.4
Cash flows1 EUR mn -43.6 28.1 4.9 33.1
Capital spending EUR mn 53.9 37.5 20.5 16.1
Consolidated profit EUR mn 8.5 9.9 5.6 7.6
Earnings per share2 EUR 0.13 0.16 0.08 0.12
EBIT margin Percent 2.7 2.7 4.0 4.4
Return on sales Percent 2.8 2.7 3.9 4.1
1change in cash and cash equivalents2unchanged on the basis of the weighted average of 66.845 million shares (2009: 66.845 million shares)
Employees
01/01/2010
-09/30/2010
01/01/2009
-09/30/2009
Employees Average 2,425 2,223
Personnel costs EUR mn 87.0 78.9
Sales per employee EUR 000 253.3 366.2
Staff cost ratio Percent 13.7 9.8
Performance indicators
01/01/2010
-09/30/2010
01/01/2009
-09/30/2009
Order receipts EUR mn 530.2 638.0
Foreign business Percent 93.0 97.0
Balance sheet
09/30/2010 12/31/2009
Total assets EUR mn 936.0 840.4
Equity capital EUR mn 356.8 347.8
Equity ratio Percent 38.1 41.4
Working capital ratio Percent 23.8* 18.4
*based on forecast annual sales
Key figures

4
Over the past few years, our market has undergone massive change. The enormous growth potential
offered by renewable energies has encouraged new competitors to enter the market. At the same time,
today’s customers are highly professional, frequently international groups making greater technical
demands of the wind power systems which we produce.
With the economic recovery still faltering in some of our core markets such as the United States and
Southern Europe, international volumes of wind turbines sold this year will probably be up only slightly.
This is leading to considerable surplus capacity, as a result of which many invitations for bids are hotly
contested. The intensity of the competition increased in the course of the year. In most cases, we have
been able to react well to the situation by submitting flexible bids, thus obtaining contracts for major
projects on a profitable basis. In individual cases, however, we had to reject some projects as high capa-
city utilization of our structures is only viable economically if the contracts promise to make a positive
contribution to our margins.
Although we expect to see strong business in the final quarter of the year, all told this will not be suffici-
ent to propel us to our original sales target of around EUR 1.2 billion. Accordingly, we have scaled back
our forecasts for this year and are now looking for a business volume of around one billion euros. Des-
pite the lower capacity utilization, however, we still expect to operate more profitably than in the previ-
ous year thanks to a number of different factors. First of all, we were able to achieve a broader gross
margin in the first half of the year thanks to favorable sourcing conditions. Moreover, in the current
quarter, we expect to be able to harness the initial positive effects of our earnings-enhancement
program.
We are responding to what we assume will be the sustained pressure on prices in our industry by initia-
ting a multi-year cost-cutting program that also includes product construction innovations. At the same
time, Nordex is working on the technical optimization of its products to additionally heighten the effici-
ency of the wind power systems. These modifications are being incorporated in existing series as well
as new products. We are systematically continuing on the course which we adopted a few years ago to
install a new industrial production system and have now launched the next phase in the modernization
of our Company: stepped-up product innovation allowing us to reinforce our position in the market.
Beyond this, however, we also want to enter new market segments, one example being the offshore
market.
Dear shareholders and business associates, our Company has grown very intensively at times over the
past five years. Given the new challenges arising in the market, 2010 is set to be a year in which we do
not achieve this growth. However, I am optimistic with respect to 2011 and see renewed opportunities
for expansion. I would like to invite you to accompany us as our long-term partners.
Yours sincerely,
Thomas Richterich
CEO

5
The stock
In the first three quarters of 2010, the global eco-
nomy recovered from the effects of the financial
and euro crisis a good deal more quickly than
expected, underpinned in particular by the fast-
growing Asian economies and flanked by a reco-
very in the developed industrialized nations.
Against this backdrop, the global benchmark indi-
ces performed disparately. Temporary lending res-
traint by banks to the corporate sector as well as
concerns at the rapid growth in sovereign debt on
the part of individual countries in the euro zone
took their toll on the confidence of capital market
participants, fueling volatility in the equities mar-
kets. On September 30, 2010, the DAX, the Ger-
man blue chip benchmark index, closed at 6,229
points, i.e. up 4.5 percent on the final day of tra-
ding in 2009. The TecDax, Deutsche Börse’s tech-
nology stock index, shook off some of the losses
which it had sustained in the year to date,
reaching 781 points at the end of the first nine
months, down around 4.4 percent on the end
of 2009. The RENIXX, a global index tracking the
stocks of companies engaged in renewable
energies, closed the period under review at 580
points, equivalent to a decline of some 22.7 per-
cent. This performance materially reflects the
revised short to medium-term growth forecasts
by various market experts.
Nordex SE stock also took its cues from its peer
group in the period under review, retreating by
35.6 percent. The prices of other listed wind power
system producers declined by up to 60 percent in
the same period. Nordex stock reached a high for
the first three quarters of 2010 of EUR 11.28 on
January 6, 2010 and a low of EUR 6.73 on Septem-
ber 29, 2010. It closed at EUR 6.75 on September
30, 2010. Average daily trading volumes on the
Xetra electronic trading platform came to around
474,858 shares.
The Company attended various capital market
conferences attracting international audiences
during the period under review. In addition, it out-
lined its recent performance at its own press and
analyst conference on May 12, 2010.
Extensive and ongoing coverage by some 20
research institutes ensures that Nordex SE’s
business performance remains transparent at all
times. Information on Nordex stock as well as
news, reports and presentations on the Company
are available from the Investor Relations section
of the Nordex Group’s website at
www.nordex-online.com/de/investor-relations.
The share held by CJ Holding ApS, which is
owned by founding family Pedersen, dropped
below the reporting threshold of three percent in
the period under review. On the other hand,
SKion/momentum increased its share by 2.9 per-
cent to 24.7 percent. The free float stood at 75.3
percent at the end of the period under review.
Shareholder structure as of October 27, 2010
SKion/momentumcapital24.7 %
Freefloat75.3 %

6
110
105
100
95
90
85
80
75
70
65
60
%
12/31/2009 03/31/2010 06/30/2010 09/30/2010
Performance of Nordex stock relative to the TecDax and the RENIXX for the period from January 1,
2010 through September 30, 2010
Nordex TecDAX RENIXX

7
Consolidated interim management report
Economic conditions
According to the International Monetary Fund
(IMF), the global economy continued to stabilize
in the period under review, with the developed
industrialized nations recovering at a slower rate.
Although gross domestic product in the United
States grew by 2 percent in the third quarter of
2010, this still fell short of the pace recorded in
2007. Trends within Europe were disparate:
Whereas some countries of the European Union
are only gradually shaking off the effects of the
global economic crisis and face a sharp rise in
sovereign debt, Germany is benefiting from the
ongoing boom in the emerging markets thanks
to its export strength. According to the German
Federal Bureau of Statistics, exports in August
2010 were up just on 27 percent on the previous
year, with industrial production widening by 16.5
percent year on year. Emerging Asian economic
powers such as China and India as well as Brazil
are again growing at swift rates.
The German mechanical engineering industry
has been expanding in the current year. According
to the German Federal Mechanical Engineering
Association (VDMA), order receipts were up
34 percent on the previous year in the period
under review. Whereas domestic business grew
by 29 percent, foreign demand was up 37 percent
year on year.
The international financial markets performed
disparately in the period under review. Investor
uncertainty at the solvency of individual European
countries caused the euro to depreciate by up to
18 percent against the US dollar, although it reco-
vered substantially towards the end of the period
under review.
According to MAKE-Consulting, wind power sys-
tem producers reported a 22 percent increase in
order receipts in the first three quarters of 2010,
primarily from the United States and Asia. In the
United States, the government’s economic stimu-
lus program together with the stabilization of the
financial markets had a favorable effect in the first
half of the year, while Chinese business benefited
in particular from the award of government con-
cession projects. Growth in Europe, by contrast,
was muted and primarily fueled by off-shore busi-
ness. The continuing fall-out from the financial
crisis, declining energy prices and the current
difficulties in raising project finance in Southern
Europe placed a damper on the rate of growth in
this region.
The positive trend in the award of new contracts
was accompanied by generally muted growth in
new installed capacity in the first nine months of
2010, particularly as a result of the limited availa-
bility of short-term projects. Whereas new installed
capacity contracted by around 70 percent in the
United States in the third quarter of 2010 alone,
with this figure expected to be down by half for
the year as a whole, experts assume that new
installed capacity in Europe will remain more or
less stable.
Bloomberg New Energy Finance reports that
finance volumes for renewable energy assets
came to around USD 37.9 billion in the third
quarter of 2010, i.e. 12 percent up on the second
quarter. The current decline in finance in Europe
was more than made up for by continued growth
in China and the recovery in the United States.
Given extensions to capacity and the only margi-
nal increase in demand, surplus manufacturing
capacity arose in the wind turbine industry,
exerting pressure on prices. After hitting a high in
2009, specific wind turbine prices were oscillating
around 2008 levels towards the end of the period
under review.
Whereas financial experts consider the availability
of debt capital to be essentially unproblematic,
market participants are still noting a certain short-
fall in the provision of equity. Thus, equity require-
ments in Europe have generally increased to 25
percent, posing an obstacle to smaller companies’
growth. In the United States, by contrast, there is
growing interest on the part of tax-equity inves-
tors, who help to raise the necessary equity
finance as co-investors.
8
Business performance
In the period under review, the Nordex Group
recorded order receipts of EUR 530.2 million. This
figure again fell short of the previous year (EUR
638.0 million) due to the pressure on prices, which
in some cases led to the deliberate decision to ref-
rain from bidding for projects which did not make
a sufficient contribution to margins or would have
been loss-makers. 70 percent of new business
came from Europe (previous year: 97 percent),
18 percent from Asia (previous year: 3 percent)
and 12 percent from North America.
Reflecting the muted order intake, consolidated
sales contracted to EUR 614.2 million in the period
under review (previous year EUR 814.0 million).
However, at EUR 264.4 million, sales in the third
quarter were up on the previous two quarters of
2010 (EUR 150.5 million and EUR 199.3 million,
respectively).
The main sales driver was Europe with a share of
82 percent. Whereas business in Asia remained
stable at 7 percent, the share of US business con-
tracted in the period under review. Service business
accounted for around 9 percent of sales. This
relative growth is due to firm long-term service
contracts and new after-sales service products.
Turbine engineering sales
by region
1–9/2010
%
1–9/2009
%
Europe 82 76
Asia 7 7
America 11 17
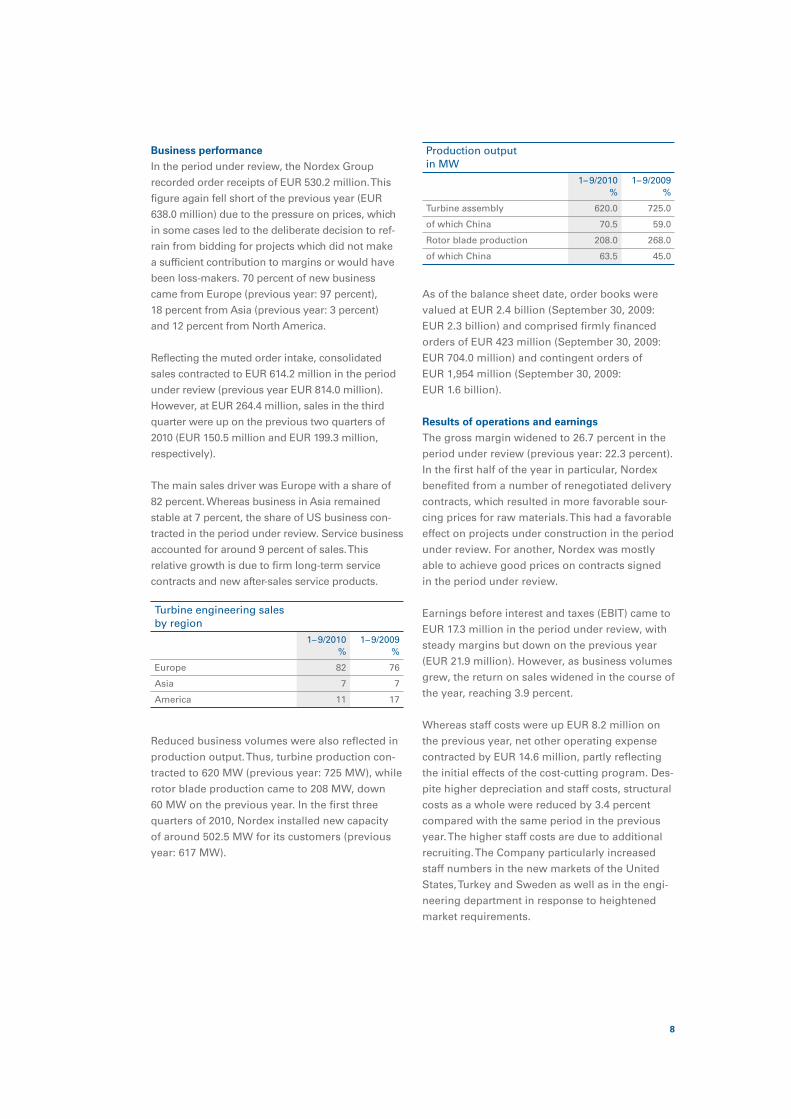
Reduced business volumes were also reflected in
production output. Thus, turbine production con-
tracted to 620 MW (previous year: 725 MW), while
rotor blade production came to 208 MW, down
60 MW on the previous year. In the first three
quarters of 2010, Nordex installed new capacity
of around 502.5 MW for its customers (previous
year: 617 MW).
Production output
in MW
1–9/2010
%
1–9/2009
%
Turbine assembly 620.0 725.0
of which China 70.5 59.0
Rotor blade production 208.0 268.0
of which China 63.5 45.0
As of the balance sheet date, order books were
valued at EUR 2.4 billion (September 30, 2009:
EUR 2.3 billion) and comprised firmly financed
orders of EUR 423 million (September 30, 2009:
EUR 704.0 million) and contingent orders of
EUR 1,954 million (September 30, 2009:
EUR 1.6 billion).
Results of operations and earnings
The gross margin widened to 26.7 percent in the
period under review (previous year: 22.3 percent).
In the first half of the year in particular, Nordex
benefited from a number of renegotiated delivery
contracts, which resulted in more favorable sour-
cing prices for raw materials. This had a favorable
effect on projects under construction in the period
under review. For another, Nordex was mostly
able to achieve good prices on contracts signed
in the period under review.
Earnings before interest and taxes (EBIT) came to
EUR 17.3 million in the period under review, with
steady margins but down on the previous year
(EUR 21.9 million). However, as business volumes
grew, the return on sales widened in the course of
the year, reaching 3.9 percent.
Whereas staff costs were up EUR 8.2 million on
the previous year, net other operating expense
contracted by EUR 14.6 million, partly reflecting
the initial effects of the cost-cutting program. Des-
pite higher depreciation and staff costs, structural
costs as a whole were reduced by 3.4 percent
compared with the same period in the previous
year. The higher staff costs are due to additional
recruiting. The Company particularly increased
staff numbers in the new markets of the United
States, Turkey and Sweden as well as in the engi-
neering department in response to heightened
market requirements.

9
At EUR 5.2 billion, net finance expense was
unchanged over the previous year. In this
connection, the increase in borrowing costs
over the year-ago period was largely offset by
income from the sale of project companies.
Nordex generated net profit for the period of
EUR 8.5 million (previous year: EUR 9.9 million).
Financial condition and net assets
As of September 30, 2010, the Nordex Group had
an equity ratio of 38.1 percent (December 31,
2009: 41.4 percent). Total assets rose from EUR
840.4 million to EUR 936.0 million. Cash and cash
equivalents were valued at EUR 121.2 million
(December 31, 2009: EUR 159.9 million). The chan-
ges in this item relate chiefly to investments of
EUR 53.9 million as well as an increase of EUR
26.9 million in working capital. Inventories rose
by EUR 27.5 million to EUR 274.9 million in the
period under review in preparation of expected
short-term projects. Trade receivables and future
receivables from construction contracts climbed
by EUR 67.6 million to EUR 254.8 million, while
trade payables increased by EUR 63.6 million to
EUR 149.4 million. Property, plant and equipment
rose by 29.5 percent to EUR 126.2 million.
The working capital ratio came to 23.8 percent
(December 31, 2009: 18.4 percent). In the period
under review, the Group sustained a net cash out-
flow from operating activities of EUR 0.8 million
(previous year: net cash inflow of EUR 6.7
million).
Capital spending
Capital spending on property, plant and equipment
and intangible assets came to EUR 53.9 million in
the period under review (previous year: EUR 37.5
million). At EUR 36.6 million, the main focus of
capital spending was on property, plant and
equipment, primarily the US production facility in
Jonesboro, Arkansas, which went into operation
as planned at the beginning of October 2010. In
addition, Nordex spent a considerable amount on
extensions to and the modernization of its rotor
blade production facility, the implementation of
assembly line production and on a new rotor
blade testing center at it Rostock facility.
A further sum of around EUR 17.3 million was
spent on intangible assets, of which EUR 14.5
million was accounted for by capitalized develop-
ment expense (2009: EUR 10.1 million).
Research and development
In the period under review, Nordex completed
development work on the new “GAMMA” genera-
tion of its 2.5 MW series and readied it for the
commencement of series production. At the same
time, work continued on engineering this model
for use in cold-climate regions as well. Among
other things, this included the development of
new de-icing systems for the rotor blades parti-
cularly in connection with a major project in
Sweden. In addition, development of the cold-
climate version of the platform was completed.
Looking ahead over the next few months, Nordex
will be systematically proceeding in two direc-
tions in further enhancements for this platform.
For one thing, it will be launching a new weak-
wind turbine with a rotor diameter of over 100
meters. Initial engineering work has already been
completed. For another, engineering activities
will be included in the Group-wide cost-cutting
program, with the aim of implementing design
modifications to harness optimization potential.
In addition, Nordex has developed a new platform
for its 1.5 MW series to additionally enhance its
competitiveness in Asia. As well as this, site-
optimized versions of the turbine have been laun-
ched. Nordex now offers two new turbines for
weak wind conditions with a rotor sweep which is
13 percent (N82/1500) and 30 percent (N88/1500)
greater and capable of generating between one
and two-digit gains in yields at corresponding
locations. Nordex managed to achieve an increa-
sed wind classification for the N77/1,500, which
had originally been positioned in this segment.
Test models have been assembled in Germany
and China.
In addition, engineering of a new 6 MW multi-
megawatt system to be used for offshore purpo-
ses was commenced. One of the main tasks is to
develop a suitable drive system for this market.
Nordex acquired shares in a project company
which will be developing the “Arcadis Ost1” off-
shore wind farm, construction of which is to com-
mence in 2014. There are plans for turbines with a
higher output.
Work on developing new core components is con-
centrating on the certification of a 140-meter hy-
brid tower for the 2.5 MW series. Two of these
towers have been under construction since mid
July 2010. In addition, Nordex largely completed

10
work on the development of the NR50 rotor blade
for the N100/2500, with dynamic vibration testing
at the Nordex rotor blade testing center ongoing
since the beginning of June 2010. The new large
blades are to go into series production in early
2011.
A further key activity entailed the development of
systems for implementing adjustments to meet
the new grid connection requirements in Poland
and Italy as well as final measurements for the
technical solution to ensure that Nordex systems
are eligible for the German system service bonus.
Employees
As of the balance sheet date, the Nordex Group
had 2,425 employees, an increase of around nine
percent over the previous year (September 30,
2009: 2,223). This was materially due to the new
regional company Nordex USA, which more than
doubled its head count to 143 in preparation of
the imminent opening of the new production
facility as well as substantially greater business
volumes in the medium term. There was further
recruiting at the new national companies in Turkey
and Sweden as well as the engineering division,
the last named in connection with intensified
work on developing new products.
Risks and opportunities
In the period under review, there were no mate-
rial changes in the risks to the Group’s expected
performance described in detail in the Nordex SE
annual report for 2009. At the end of the period
under review, the relevant risks included the pres-
sure on the prices of wind turbines in key mar-
kets. At the same time, Nordex has stepped up its
product development activities to prepare more
effectively for future market requirements. In this
respect, there is a risk that scarce personnel
resources or the non-availability of testing facili-
ties may mean that the tight development sche-
dule cannot be maintained. In its operating busi-
ness, the Nordex Group is exposed to liability
risks arising from possible claims under guaran-
tees or the recovery of damages under contracts
for the supply of goods and services as well as in
other legal areas.
There are no risks to the Group’s going-concern
status. Nor are any discernible at the moment.
Outlook
The leading economic research institutes expect
the global economy to pick up in 2010. Thus, the
International Monetary Fund (IMF) forecasts an
increase in global economic output of 4.8 percent.
However, the upswing is unfolding at different
speeds in the emerging markets and industria-
lized nations. Whereas, for example, the IMF
scaled back its forecast for the United States at
the beginning of October 2010, emerging Asian
economic powers such as China and India as well
as Brazil continue to be the main growth drivers.
The euro zone is increasingly benefiting from the
weakness which has been afflicting this currency
over the past few months. However, economic
performance varies greatly from region to region:
On the one hand, Germany is increasingly figu-
ring as the main force behind European recovery,
while, on the other, Spain, Ireland and Greece
face the prospect of slight economic contraction
in 2010. Experts consider severe lending restraint
on the part of banks to be the main factor preven-
ting a sustained recovery in the euro zone
economy.
The German Federal Mechanical Engineering
Association (VDMA) is now optimistic again about
the future. Thus, in the first eight months of 2010,
order intake climbed by around 35 percent in tan-
dem with steady capacity utilization. According to
VDMA, the German mechanical and plant engi-
neering industry should expand by six percent in
2010.
The Danish consulting and research company
MAKE Consulting expects the wind power indus-
try to remain stable in 2010, with significant mar-
ket growth seen in Asia (+21 percent). By contrast,
flat onshore business must be expected in Europe
and a substantial decline in new installations in
America as a result of the muted economic reco-
very and low gas prices in 2010. Demand in Asia
will continue to be driven by strong economic
growth and favorable political conditions. In
Europe, the wind power industry has benefited
from the stable regulatory framework and the
implementation of large-scale off-shore wind
power projects. According to MAKE, the wind
power market will return to double-digit growth
in 2011.

11
With sales volumes virtually flat, the substantial
additions to production capacity in the mechani-
cal and plant engineering industry have unleas-
hed heightened price-based competition in the
wind power industry. Nordex has been able to
respond flexibly to this in some market and pro-
duct segments, although it has also withdrawn
from bidding processes in the case of particularly
contested projects. For this reason, order intake
will fall short of the Company’s original targets for
the year as a whole. Accordingly, Management is
no longer expecting full-year business volumes of
EUR 1,200 million for 2010 but has scaled back
this target to around EUR 1,000 million.
At the same time, however, Nordex is still on track
to achieving its EBIT margin target of 4.0 percent
despite the reduced capacity utilization on the
strength of the expected initial favorable effects
from the comprehensive cost-cutting program tar-
geted at the production and assembly costs of
Nordex wind farms. These effects largely stem
from the new sourcing strategy which has been
implemented. The cost-cutting program is to be
implemented from 2010 to 2012. At the same time,
Nordex has adopted a technical efficiency-boos-
ting program to heighten yields in response to the
pressure which customers are exerting on prices.
The first efficiency package will already be availa-
ble in summer 2011 and, depending on the loca-
tion, generate additional yields of up to 20
percent.
Turning to the fourth quarter, the Management
Board projects rising sales and order intake, with
new business expanding at a greater rate than
business volumes. In the United States in particu-
lar, the Company expects to secure several new
contracts due to the immanent expiry of the
government subsidization program at the end of
the year. Accordingly, order books should rise at
the end of 2010/beginning of 2011. As of the
balance sheet date, firm and confident orders
were valued at around EUR 2.4 billion. Accordin-
gly, the outlook for 2011 is mildly positive, with
the Management Board confident that slight
growth will be possible.
Events after the conclusion of the period under
review
As Nordex founder Carsten Pedersen has moved
from Nordex SE’s Management Board to its
Supervisory Board, Lars Bondo Krogsgaard was
appointed chief sales officer with additional res-
ponsibility for the Group’s project management
effective October 1, 2010.
After a construction period of around one year,
the Nordex Group’s US production facility went
into operation on October 4, 2010. Looking for-
ward, American demand for Nordex wind power
systems is to be served entirely from the new
facility in Jonesboro, Arkansas.
On October 26, 2010, Nordex reported the award
of a new contract for the turn-key assembly of a
wind farm in Turkey. 18 N90/2500 turbines are to
be supplied for the “Akres” project initiated by
Karesi Enerji. In addition, wind farm operator Dost
Enerji has placed an order for six N90/2500 turbi-
nes to extend the “Yuntdag” wind farm.

12
Consolidated balance sheetas of September 30, 2010
Assets 09/30/2010
EUR 000s
12/31/2009
EUR 000s
Cash and cash equivalents 121,207 159,886
Trade receivables and future receivables from
construction contracts 254,826 187,236
Inventories 274,872 247,356
Income tax refund claims 1,836 0
Other current financial assets 13,542 13,067
Other current assets 35,098 43,874
Current assets 701,381 651,419
Property, plant and equipment 126,235 97,474
Goodwill 9,960 9,960
Capitalized development costs 43,942 34,604
Other intangible assets 7,167 6,406
Non-current financial assets 11,306 5,852
Other non-current financial assets 0 68
Other non-current assets 0 137
Deferred income tax assets 35,990 34,462
Non-current assets 234,600 188,963
Assets 935,981 840,382
Equity and liabilities 09/30/2010
EUR 000s
12/31/2009
EUR 000s
Current bank borrowings 34,738 22,441
Trade payables 149,350 85,739
Income tax liabilities 3,281 5,312
Other current provisions 52,968 59,877
Other current financial liabilities 13,232 8,792
Other current liabilities 209,646 205,033
Current liabilities 463,215 387,194
Pensions and similar obligations 711 550
Other non-current provisions 19,182 15,272
Non-current bank borrowings 82,260 77,948
Other non-current financial liabilities 69 0
Deferred income tax liabilities 13,706 11,589
Non-current liabilities 115,928 105,359
Subscribed capital 66,845 66,845
Share premium 158,249 158,687
Other retained earnings 30,997 31,136
Cash flow hedge (interest swap) -654 -287
Other equity components -10,530 -10,530
Foreign-currency equalization item 2,728 1,494
Consolidated profit carried forward 97,974 103,034
Consolidated net profit 8,692 -5,060
Share in equity
attributable to equity holders of parent company 354,301 345,319
Minority shareholders 2,537 2,510
Equity capital 356,838 347,829
Total equity and liabilities 935,981 840,382

13
Consolidated income statement
01/01/2010
-09/30/2010
EUR 000s
01/01/2009
-09/30/2009
EUR 000s
07/01/2010
-09/30/2010
EUR 000s
07/01/2009
-09/30/2009
EUR 000s
Sales 614,187 814,033 264,373 301,522
Changes in inventories and other
own work capitalized 20,176 -11,333 -8,984 -20,012
Total revenues 634,363 802,700 255,389 281,510
Other operating income 13,025 10,719 2,640 2,367
Cost of materials -464,982 -623,359 -193,913 -213,920
Staff costs -87,036 -78,851 -27,813 -26,223
Depreciation/amortization -14,810 -13,789 -5,427 -4,017
Other operating expenses -63,228 -75,552 -20,634 -27,331
Earnings before interest and taxes (EBIT) 17,332 21,868 10,242 12,386
Income from investments 2,154 0 0 0
Other interest and similar income 500 1,484 141 233
Interest and similar expenses -7,824 -6,711 -2,437 -2,151
Net finance expense -5,170 -5,227 -2,296 -1,918
Profit from ordinary activity 12,162 16,641 7,946 10,468
Income taxes -3,648 -6,707 -2,382 -2,865
Consolidated profit 8,514 9,934 5,564 7,603
Of which attributable to:
Parent company‘s equityholders 8,692 10,573 5,352 7,762
Minority shareholders -178 -639 212 -159
Earnings per share (EUR)
Basic* 0.13 0.16 0.08 0.12
Diluted** 0.13 0.16 0.08 0.12
*on the basis of the weighted average of 66,845 million shares (previous year: 66,845 million shares)
**on the basis of the weighted average of 66,845 million shares (previous year: 66,845 million shares)
01/01/2010
-09/30/2010
EUR 000s
01/01/2009
-09/30/2009
EUR 000s
Consolidated profit 8,514 9,934
Other comprehensive income:
Foreign currency translation differences 1,300 -386
Mark-to-market measurement of interest swaps -524 0
Deferred income taxes 157 0
Consolidated comprehensive income 9,447 9,548
Of which attributable to:
Parent company‘s equityholders 9,420 10,187
Non-controlling interests 27 -639
Consolidated statement of comprehensive incomefor the period from January 1, 2010 to September 30, 2010

14
Consolidated cash flow statementfor the period from January 1, 2010 to September 30, 2010
01/01/2010
-09/30/2010
EUR 000s
01/01/2009
-09/30/2009
EUR 000s
Operating activities:
Consolidated profit 8,514 9,934
+ Depreciation on non-current assets 14,810 13,789
= Consolidated profit plus depreciation/amortisation 23,324 23,723
–/+ Increase/decrease in inventories -27,516 15,121
– Increase in trade receivables/POC -67,591 -13,623
+/– Increase/decrease in trade payables 63,611 -58,337
+ Increase in prepayments received - liabilities - 4,577 37,242
= Payments made from changes in working capital -26,919 -19,597
+ Decrease in other assets not allocated to investing or
financing activities 8,774 17,726
+/– Increase/decrease in pension provisions 161 -28
– Decrease in other provisions -2,999 155
+/– Increase/decrease in other liabilities not allocated to investing or
financing activities
-2,497
-21,691
+ Losses from the disposal of non-current assets 1,458 2,336
– Other interest and similar income -500 -1,484
+ Interest received 253 1,063
+ Interest and similar expenses 7,824 6,711
– Interest paid -7,019 -5,171
+ Income taxes 3,648 6,707
– Taxes paid -1,012 -1,573
–/+ Other non-cash income/expenses -5,306 -2,188
= Payments received from remaining current business activity 2,785 2,563
= Cash flow from operating activities -810 6,689
Investing activities:
+ Payments received from the disposal of property, plant and
equipment/intangible assets 0 328
– Payments made for investments in property, plant and equipment/
intangible assets -53,931 -37,520
+ Payments received from the disposal of financial assets 213 0
– Payments made for investments in financial assets -5,632 -349
+ Receipt of government grants 0
= Cash flow from investing activities -59,350 -37,541
Financing activities:
+ Bank loans raised 19,609 58,993
– Bank loans repaid -3,000
= Cash flow from financing activities 16,609 58,993
Cash change in cash and cash equivalents -43,551 28,141
+ Cash and cash equivalents at the beginning of the period 159,886 111,711
+/– Exchange rate-induced change in cash and cash equivalents 4,872 -1,552
= Cash and cash equivalents at the end of the period (Cash and cash
equivalents carried on the face of the consolidated balance sheet) 121,207 138,300

15
Consolidated statement of changes in equitySubscribed
capital
EUR 000s
Share
premium
EUR 000s
Other
retained
earnings
EUR 000s
Cash flow
hedge
(interest
swap)
EUR 000s
Other equity
components
EUR 000s
Foreign
currency
equalization
item
EUR 000s
Amount on January 1, 2009 66,845 156,650 1,731 0 -10,530 3,454
Consolidated profit for fiscal
2008 allocated to consolidated
profit carried forward 0 0 0 0 0 0
Purchase of minority interests 0 0 -224 0 0 0
Reclassifications 0 0 0 0 0 -137
Accounting for employee
option program 0 1,332 0 0 0 0
Mark-to-market measurement
of financial instruments 0 -425 0 0 0 0
Consolidated comprehensive
income0 0 0 0 0 -386
Balance on September 30, 2009 66,845 157,557 1,507 0 -10,530 2,931
Consolidated
net profit/loss
carried forward
EUR 000s
Consolidated
net profit/
loss
EUR 000s
Equity attributable
to the parent
company‘s
equity holders
EUR 000s
Minority
shareholders
EUR 000s
Total equity
EUR 000s
Amount on January 1, 2009 62,446 40,498 321,094 3,347 324,441
Consolidated profit for fiscal
2008 allocated to consolidated
profit carried forward 40,498 -40,498 0 0 0
Purchase of minority interests 0 0 -224 -620 -844
Reclassifications 90 0 -47 47 0
Accounting for employee
option program 0 0 1,332 0 1,332
Mark-to-market measurement
of financial instruments 0 0 -425 0 -425
Consolidated comprehensive
income0 10,573 10,187 -639 -9,548
Balance on September 30, 2009 103,034 10,573 331,917 2,135 334,052
Subscribed
capital
EUR 000s
Share
premium
EUR 000s
Other
retained
earnings
EUR 000s
Cash flow
hedge
(interest swap)
EUR 000s
Other equity
components
EUR 000s
Foreign
currency
equalization
item
EUR 000s
Amount on January 1, 2010 66,845 158,687 31,136 -287 -10,530 1,494
Consolidated profit for 2009
allocated to Consolidated
profit carried forward 0 0 0 0 0 0
Reclassifications 0 0 -139 0 0 139
Accounting for employee
option program 0 -438 0 0 0 0
Consolidated comprehensive
income0 0 0 -367 0 1,095
Balance on September 30, 2010 66,845 158,249 30,997 -654 -10,530 2,728
Consolidated
net profit/loss
carried forward
EUR 000s
Consolidated
net profit/loss
EUR 000s
Equity attributable
to the parent company‘s
equity holders
EUR 000s
Minority
shareholders
EUR 000s
Total equity
EUR 000s
Balance on January 1, 2010 103,034 -5,060 345,319 2,510 347,829
Consolidated profit for fiscal
2009 allocated to consolidated
profit carried forward -5,060 5,060 0 0 0
Reclassifications 0 0 0 0 0
Accounting for employee
option program 0 0 -438 0 -438
Consolidated
comprehensive income0 8,692 9,420 27 9,447
Balance on September 30, 2010 97,974 8,692 354,301 2,537 356,838

16
Notes on the interim consolidated financial statements (IFRS) as of September 30, 2010
I. General
The interim consolidated financial statements of
Nordex SE and its subsidiaries for the first nine
months as of September 30, 2010, which have not
been audited or reviewed by a statutory auditor,
were prepared in accordance with the Internatio-
nal Financial Reporting Standards (IFRS) issued
by the International Accounting Standards Board
(IASB) as endorsed by the EU. In this connection,
all International Financial Reporting Standards
and interpretations of the International Financial
Reporting Interpretations Committee binding as
of September 30, 2010 were observed. In
accordance with the amendments to IAS 27 “Con-
solidated and Separate Financial Statements” and
the resultant changes to IAS 1 “Presentation of
Financial Statements”, the elements of other com-
prehensive income are now shown individually
in the statement of comprehensive income. There
were no other changes with any impact on the
consolidated interim financial statements. The
guidance provided by IAS 34 Interim Financial
Reporting was additionally observed.
These interim financial statements must be read
in conjunction with the consolidated financial
statements for 2009. Further information on the
accounting principles applied can be found in the
notes to the consolidated financial statements.
The consolidated financial statements for 2009
are available on the Internet at www.nordex-
online.com in the Investor Relations section.
Unless otherwise stated, the comments made
in the consolidated financial statements as of
December 31, 2009 also apply to the interim
financial statements for 2010.
The income statement has again been prepared in
accordance with the cost-of-production method.
The business results for the first nine months as
of September 30, 2010 are not necessarily an indi-
cation of expected results for the year as a whole.
Any irregular expenses occurring in the year are
only included or deferred in the interim financial
report to the extent that such inclusion or deferral
would also be reasonable at the end of the year.
Reference should be made to the interim report
for details of material events occurring after the
balance sheet date.
The interim report was prepared in the Group
currency euro.

17
Notes on the interim consolidated financial statements (IFRS) as of September 30, 2010
II. Notes on the balance sheet
Current assets
Trade receivables stood at EUR 96.7 million as of
September 30, 2010 (December 31, 2009: EUR
101.8 million). The trade receivables reported as of
September 30, 2010 include value adjustments of
EUR 3.4 million (December 31, 2009: 6.4 million).
Of the future gross receivables from construction
contracts of EUR 912.0 million, prepayments
received of EUR 753.9 million were capitalized. In
addition, prepayments received of EUR 142.8 mil-
lion were reported within other current liabilities.
Inventories increased by EUR 27.5 million to EUR
274.9 million as of September 30, 2010.
Non-current assets
Changes in non-current assets are set out in the
statement of changes in property, plant and
equipment and intangible assets. As of Septem-
ber 30, 2010, capital spending was valued at EUR
53.9 million, while depreciation/amortization
expense came to EUR 14.8 million. Of the addi-
tions, a sum of EUR 25.6 million particularly rela-
tes to prepayments made and assets under const-
ruction and a sum of EUR 14.5 million to
capitalized development expenses. Prepayments
made and assets under construction of EUR 8.6
million were reclassified as technical equipment
and machinery as a result of the completion of the
coating plant in Rostock.
Deferred tax assets primarily comprise unused
tax losses which the Company expects to be able
to utilize against domestic corporate and trade
tax.
Current liabilities
Current bank borrowings increased from EUR 22.4
million to EUR 34.7 million. They chiefly comprise
cash credit facilities of EUR 23.1 million utilized by
subsidiaries in China, the syndicated loan of EUR
5.9 million taken out in November 2009 to finance
the rotor blade production plant in Rostock and
the amount of EUR 5.0 million due for repayment
in 2011 towards a promissory note loan raised in
May 2009.
Non-current liabilities
Of the non-current liabilities, a sum of EUR 47.0
million relates to the non-current part of the pro-
missory note loan. The interest risks arising from
the promissory note loan are hedged in full by
means of interest swaps. Further non-current
liabilities of EUR 35.3 million relate to the syndi-
cated loan.
Equity
Reference should be made to the Nordex Group’s
statement of changes in equity for a breakdown of
changes in equity.

18
Notes on the interim consolidated financial statements (IFRS) as of September 30, 2010
III. Notes on the income statement
Revenues
Sales break down by region as follows:
01/01/2010
-09/30/2010
EUR mn
01/01/2009
-09/30/2009
EUR mn
Europe 503.7 620.2
Asia 40.0 58.7
America 70.5 135.1
Total 614.2 814.0
Changes in inventories and other own work
capitalized
Changes in inventories and other own work capi-
talized totaled EUR 20.2 million in the first nine
months of 2010. In addition to an increase of EUR
3.7 million in inventories, own work of EUR 16.5
million including development expense of EUR
14.5 million was capitalized.
Other operating income
Other operating income comprises reimburse-
ments received from customers and a technology
advance, among other things.
Cost of materials
The cost of materials stands at EUR 465.0 million
(previous year: EUR 623.4 million) and comprises
the cost of raw materials and supplies and the
cost of services bought.
The cost of raw materials and supplies chiefly
includes the cost of components and energy.
The cost of services bought includes external
freight, order provisions, commission and
externally sourced order-handling services.
Staff costs
Staff costs came to EUR 87.0 million, up from EUR
78.9 million in the previous year. Personnel num-
bers rose by 202 over the same period in the pre-
vious year from 2,223 to 2,425 as of June 30, 2010.
Other operating expenses
Other operating expenses break down into legal,
auditing and consulting costs, travel expenses,
rental expenses and externally sourced personnel
services, among other things.
Contingent liabilities under Group guarantees
granted by Nordex SE
As of September 30, 2010, Nordex SE has contin-
gent liabilities of EUR 3,860 million arising from
Group guarantees in favor of third parties issued
for consolidated and non-consolidated affiliated
companies. The contingent liabilities were valued
at EUR 3,289 million as of December 31, 2009
(December 31, 2008: EUR 3,128 million).

19
Report on material transactions with related parties
Related
parties
Company Transaction Open items
Liability (-)/
receivable (+)
09/30/2010
EUR 000s
Open items
Liability (-)/
receivable (+)
09/30/2009
EUR 000s
Sales in
accordance
with IFRS
01/01/2010
-09/30/2010
EUR 000s
Sales in
accordance
with IFRS
01/01/2009
-09/30/2009
EUR 000s
Carsten
Pedersen*
Skykon Give
A/S (formerly
Welcon A/S)
Supplier of
towers 6,779 10,108 38,079 52,498
Martin Rey** Affiliated
companies of
Babcock &
Brown GmbH
Sale of
wind power
systems incl.
project
companies
0 1,175 0 21,146
Jan Klatten*** Asturia
Automotive
Systems AG
Development
of dampening
system
0 0 553 0
*Co-owner of Skykon Give A/S
**Executive Director, Babcock & Brown Ltd.
***Chairman of the supervisory board of Asturia Automotive Systems AG

20
Statements of changes in property, plant and equipment and intangible assets
Historical costs
Commen-
cing
balance
01/01/2010
EUR 000s
Additions
EUR 000s
Disposals
EUR 000s
Reclassi-
fication
EUR 000s
Foreign
currency
EUR 000s
Closing
balance
09/30/2010
EUR 000s
Property, plant and equipment
Properties and buildings 54,608 3,568 300 166 518 58,560
Technical equipment and
machinery 33,486 1,884 4,046
9,543 631 41,498
Other equipment, operating
and business equipment 30,767 5,517 5,490 601 270 31,665
Advance payments made and
assets under construction 27,515 25,622 0 -10,310 78 42,905
Total property, plant and
equipment 146,376 36,591 9,836 0 1,497 174,628
Intangible assets
Goodwill 14,461 0 0 0 0 14,461
Capitalized development costs 60,102 14,537 1,131 0 0 73,508
Other intangible assets 19,741 2,803 244 0 310 22,610
Total intangible assets 94,304 17,340 1,375 0 310 110,579
Depreciation/amortization Carrying amount
Commen-
cing
balance
01/01/2010
EUR 000s
Additions
EUR 000s
Disposals
EUR 000s
Foreign
currency
EUR 000s
Closing
balance
09/30/2010
EUR 000s
09/30/2010
EUR 000s
12/31/2009
EUR 000s
Property, plant and
equipment
Properties and buildings 8,019 1,606 290 68 9,403 49,157 46,589
Technical equipment and
machinery 22,354 2,880 3,882 315 21,667 19,831 11,132
Other equipment, operating
and business equipment 18,270 3,856 5,282 71 16,915 14,750 12,497
Advance payments made and
assets under construction 259 141 0 8 408 42,497 27,256
Total property, plant and
equipment 48,902 8,483 9,454 462 48,393 126,235 97,474
Intangible assets
Goodwill 4,501 0 0 0 4,501 9,960 9,960
Capitalized development
costs 25,498 4,071 3 0 29,566 43,942 34,604
Other intangible assets 13,335 2,256 238 90 15,443 7,167 6,406
Total intangible assets 43,334 6,327 241 90 49,510 61,069 50,970

21
Segment reporting
The Nordex Group is engaged in the development, production, servicing and marketing of wind power
systems. In addition to development and production, it provides preliminary project development
services to support marketing, acquires rights and creates the infrastructure required to construct
wind power systems at suitable locations. The Nordex Group is essentially a single-product company.
Segment reporting follows the internal reports submitted to the main decision makers. The Nordex SE’s
Management Board has been identified as the main decision maker. Three reportable segments which
are based on the geographic markets and managed separately have been designated. Nordex SE
operates solely as a holding company and can therefore not be allocated to any of the three segments.
Internal reporting is based on the accounting policies applied to the consolidated financial statements.
Segment sales comprise sales with third parties (external sales) as well as internal sales between the
individual segments (internal sales). The prices of deliveries between the individual segments are deter-
mined on an arm’s length basis. External sales are assigned in accordance with the sales destination.
Segment earnings are consolidated on the basis of external sales. The following table reconciles seg-
ment earnings with earnings before interest and taxes (EBIT) and segment assets with consolidated
assets.

22
Group segment report
Europe Asia America
Q1-Q3/2010
EUR 000s
Q1-Q3/2009
EUR 000s
Q1-Q3/2010
EUR 000s
Q1-Q3/2009
EUR 000s
Q1-Q3/2010
EUR 000s
Q1-Q3/2009
EUR 000s
Sales 557,947 699,820 39,963 58,660 70,508 137,104
Depreciation/amortization -10,429 -9,606 -1,344 -1,500 -249 -147
Interest income 157 1,705 86 288 8 6
Interest expenses -716 -2,432 -790 -1,071 -44 -530
Income taxes -4,589 -5,850 636 -371 1,262 126
Earnings before interest
and taxes (EBIT);
Segment net profit/loss 20,533 42,998 -2,786 4,884 -3,486 4,520
Capital spending on
property, plant and
equipment and
intangible assets33,064 32,895 2,369 1,642 15,335 1,815
Cash and cash
equivalents17,607 26,587 7,820 6,199 14,654 17,315
Central units Consolidation Group total
Q1-Q3/2010
EUR 000s
Q1-Q3/2009
EUR 000s
Q1-Q3/2010
EUR 000s
Q1-Q3/2009
EUR 000s
Q1-Q3/2010
EUR 000s
Q1-Q3/2009
EUR 000s
Sales 0 0 -54,231 -81,551 614,187 814,033
Depreciation/amortization -2,788 -2,536 0 0 -14,810 -13,789
Interest income 887 542 -638 -1,057 500 1,484
Interest expenses -6,912 -3,735 638 1,057 -7,824 -6,711
Income taxes -957 -612 0 0 -3,648 -6,707
Earnings before interest
and taxes (EBIT);
Segment net profit/loss 3,053 -30,371 18 -163 17,332 21,868
Capital spending on
property, plant and
equipment and
intangible assets3,163 1,168 0 0 53,931 37,520
Cash and cash
equivalents81,126 109,785 0 0 121,207 159,886

23
Supervisory Board / Management Boardas of September 30 2010
Position Shares
Carsten Pedersen Member of the
Supervisory Board
30,463 shares plus a further 1,643,511 shares held
via a 50% holding in CJ Holding ApS*
Thomas Richterich CEO 535,734 shares held directly
Dr. Eberhard Voß CTO 1,000 shares held directly
Jan Klatten Deputy chairman of the
Supervisory Board
16,433,623 shares held directly via a share in
momentum capital Vermögensverwaltungsgesellschaft
mbH and Ventus Venture Fund GmbH &
Co. Beteiligungs KG.
Dr. Dieter Maier Member of the
Supervisory Board
10,000 shares held directly
*Parent company of Nordvest A/S

24
Calendar of events
April 19, 2010 Press and analyst conference for 2009
May 12, 2010 Interim Report for the first quarter of 2010
Telephone conference
June 8, 2010 Annual General Meeting in Rostock
August 5, 2010 Interim Report for the first half of 2010
Telephone conference
November 11, 2010 Interim Report for the third quarter of 2010
Telephone conference
Statutory disclosures
Statutory disclosures Design
Nordex SE Heuer Werbeagentur GmbH & Co. KG, Hamburg
Bornbarch 2 Lithography
22848 Norderstedt LITHOKONTOR WENIG GmbH, Hamburg
Phone: +49 40 30030 1000
Telefax: +49 40 30030 1333
DisclaimerThis report contains, among other things, certain forward-looking statements and information on future developments based on the
beliefs of the Management Board of Nordex SE as well as assumptions and information currently available to Nordex SE. Many factors
may contribute to the actual results achieved by the Nordex Group differing from the forecasts contained in such forward-looking
statements. Accordingly, Nordex SE assumes no liability towards the general public to update or correct any forward-looking statements.
All forward-looking statements are subject to certain risks and uncertainties which may cause actual results to differ from expectations.