Embed Size (px)
Citation preview
Q2
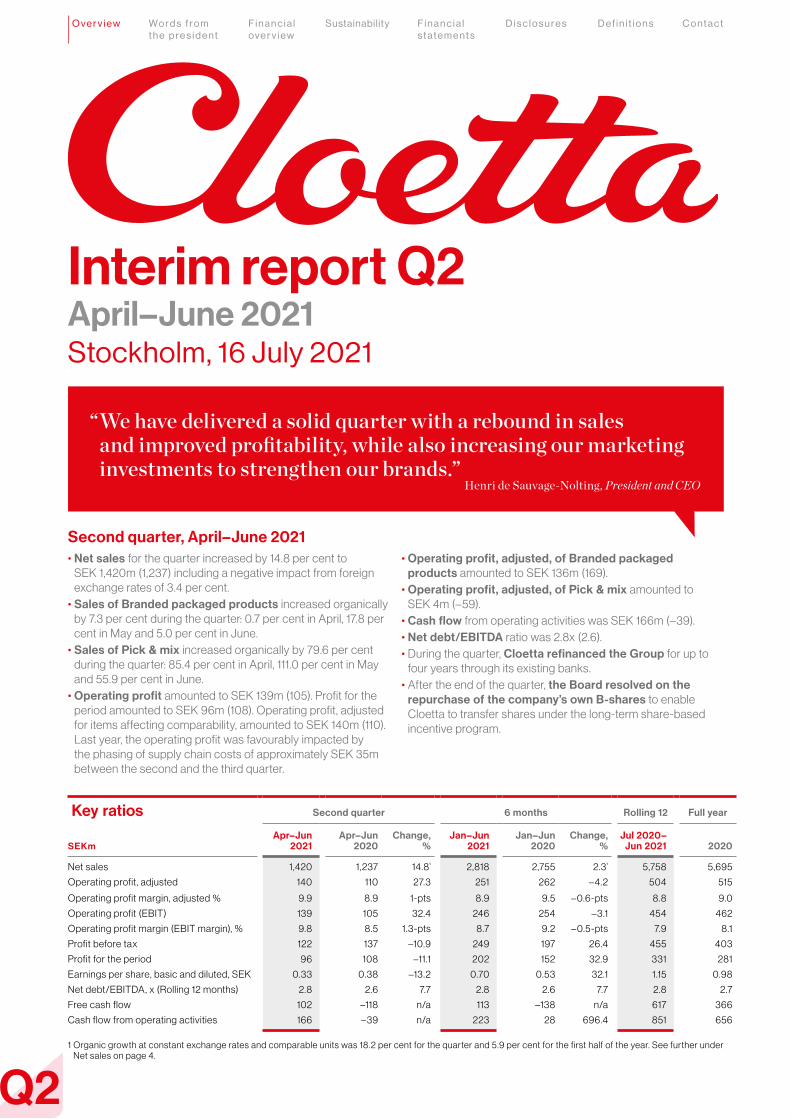
Interim report Q2April–June 2021Stockholm, 16 July 2021
“ We have delivered a solid quarter with a rebound in sales and improved profitability, while also increasing our marketing investments to strengthen our brands.”
Henri de Sauvage-Nolting, President and CEO
Second quarter, April–June 2021• Operating profit, adjusted, of Branded packaged
products amounted to SEK 136m (169).• Operating profit, adjusted, of Pick & mix amounted to
SEK 4m (–59).• Cash flow from operating activities was SEK 166m (–39).• Net debt/EBITDA ratio was 2.8x (2.6).• During the quarter, Cloetta refinanced the Group for up to
four years through its existing banks. • After the end of the quarter, the Board resolved on the
repurchase of the company’s own B-shares to enable Cloetta to transfer shares under the long-term share-based incentive program.
• Net sales for the quarter increased by 14.8 per cent to SEK 1,420m (1,237) including a negative impact from foreign exchange rates of 3.4 per cent.
• Sales of Branded packaged products increased organically by 7.3 per cent during the quarter: 0.7 per cent in April, 17.8 per cent in May and 5.0 per cent in June.
• Sales of Pick & mix increased organically by 79.6 per cent during the quarter: 85.4 per cent in April, 111.0 per cent in May and 55.9 per cent in June.
• Operating profit amounted to SEK 139m (105). Profit for the period amounted to SEK 96m (108). Operating profit, adjusted for items affecting comparability, amounted to SEK 140m (110). Last year, the operating profit was favourably impacted by the phasing of supply chain costs of approximately SEK 35m between the second and the third quarter.
Key ratios Second quarter 6 months Rolling 12 Full year
SEKmApr–Jun
2021Apr–Jun
2020Change,
%Jan–Jun
2021Jan–Jun
2020Change,
%Jul 2020–
Jun 2021 2020
Net sales 1,420 1,237 14.8¹ 2,818 2,755 2.3¹ 5,758 5,695
Operating profit, adjusted 140 110 27.3 251 262 – 4.2 504 515
Operating profit margin, adjusted % 9.9 8.9 1-pts 8.9 9.5 – 0.6-pts 8.8 9.0
Operating profit (EBIT) 139 105 32.4 246 254 –3.1 454 462
Operating profit margin (EBIT margin), % 9.8 8.5 1.3-pts 8.7 9.2 – 0.5-pts 7.9 8.1
Profit before tax 122 137 –10.9 249 197 26.4 455 403
Profit for the period 96 108 –11.1 202 152 32.9 331 281
Earnings per share, basic and diluted, SEK 0.33 0.38 –13.2 0.70 0.53 32.1 1.15 0.98
Net debt/EBITDA, x (Rolling 12 months) 2.8 2.6 7.7 2.8 2.6 7.7 2.8 2.7
Free cash flow 102 –118 n/a 113 –138 n/a 617 366
Cash flow from operating activities 166 –39 n/a 223 28 696.4 851 656
1 Organic growth at constant exchange rates and comparable units was 18.2 per cent for the quarter and 5.9 per cent for the first half of the year. See further under Net sales on page 4.
O v e r v i e w W o r d s f r o m t h e p r e s i d e n t
F i n a n c i a l o v e r v i e w
Sustain ability F i n a n c i a l s t a t e m e n t s
D i s c l o s u r e s D e f i n i t i o n s C o n t a c t
Q2
2
Cloetta Interim Report Q2 2021
W o r d s f r o m t h e p r e s i d e n t
F i n a n c i a l o v e r v i e w
Sustain ability F i n a n c i a l s t a t e m e n t s
D i s c l o s u r e s D e f i n i t i o n s C o n t a c tO v e r v i e w
CANDY
CHEWING GUM
CHOCOLATE
7
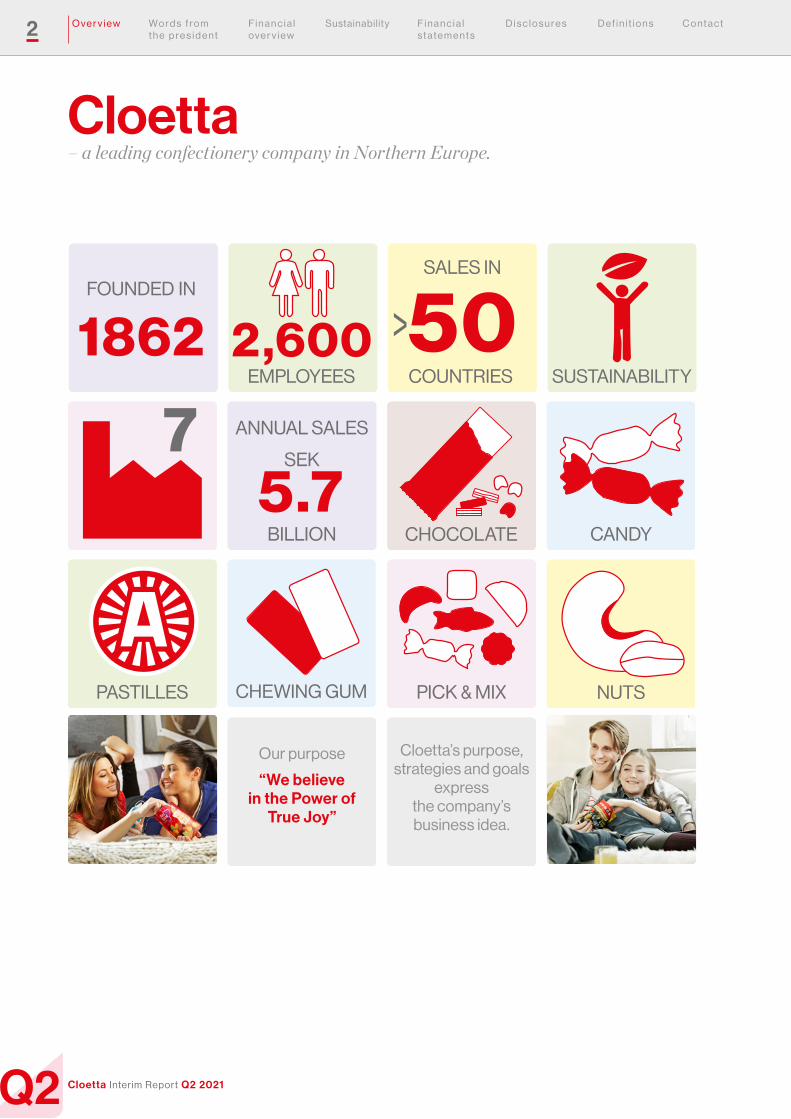
FOUNDED IN
1862SUSTAINABILITY
NUTSPASTILLES PICK & MIX
COUNTRIES
50SALES IN
Cloetta – a leading confectionery company in Northern Europe.
EMPLOYEES2,600
ANNUAL SALES
5.7BILLION
SEK
Our purpose
“We believe in the Power of
True Joy”
Cloetta’s purpose, strategies and goals
express the company’s business idea.
Q2 W O r D S F r O m t h e P r e S i D e n t
3
Cloetta Interim Report Q2 2021
O v e r v i e w F i n a n c i a l o v e r v i e w
Sustain ability F i n a n c i a l s t a t e m e n t s
D i s c l o s u r e s D e f i n i t i o n s C o n t a c tW o r d s f r o m t h e p r e s i d e n t
Even though the Covid-19 pandemic is still ongoing, the world is gradually opening up as an increasing number of people have been vaccinated and restrictions are being eased. The impact of the pandemic on consumer behaviour and our sales channels is neverthe-less still being felt to some extent.
However, our focus on marketing and in-novation enabled us to deliver strong growth for Branded packaged products in the quarter, bringing sales back up to 2019 levels. Demand for chocolate and candy bags was high while sales of pastilles and chewing gum remained suppressed compared to 2019 levels. Pick & mix sales grew by 80 per cent, although still being below pre-pandemic levels. We stepped -up our marketing investments whilst contin-uing to improve our profitability, including bringing Pick & mix back to break-even.
We are pleased to see the continued increase of shoppers in our sales channels. At the same time, we see greater uncertainty due to the recent rises in input costs, such as raw material and freight costs. We will continue to pursue our strategy whilst taking the necessary actions to successfully navigate this market environment.
Second quarter developmentSales for the quarter increased by 14.8 per cent, of which organic growth accounted for 18.2 per cent and exchange rate differences for –3.4 per cent. Sales of Branded packaged products increased organically by 7.3 per cent, driven by successful marketing and innovation, as well as increased traffic in most channels. Sales of Pick & mix increased organically by 79.6 per cent during the quarter, driven by the re-opening of pick & mix shelves, more consumer activations and growing consumer confidence.
The increase in the adjusted operating profit is attributable to higher sales volumes and continued margin-enhancing initiatives, partly offset by significantly higher market-ing investments. Last year, the operating profit was favourably impacted by the phas-
ing of supply chain costs of approximately SEK 35m between the second and the third quarter.
Well positioned to deliver on long-term targetsMaintaining a sharp focus on innovation to improve consumer experiences is a key driver for profitable growth. During the quarter we increased our marketing investments with around SEK 30m compared to last year to support the rebound in sales and our strong new product innovations such as fruit-based candy and Kexchoklad Vegan. Currently, approximately 15 per cent of Cloetta’s sales are from vegan products.
We also continued our efforts to re-build volumes and made good progress on our jour-ney to create sustainable profitability within Pick & mix. During the quarter, the new premium CandyKing concept was successful-ly piloted or launched in multiple countries. Most grocery and high street stores in the United Kingdom, as well as in the other markets, are now back to normal operations, although leisure parks and cinemas are not expected to open until the third quarter.
During the quarter, we shared our sustainability agenda externally, and we con-tinued to increase the focus on this priority internally, for instance through the launch of a competence development program called the Sustainability Academy. We have also progressed in setting our targets in line with the Science Based Targets initiative, with each market and department being heavily involved.
I am pleased to see that our efficiency programs continue to deliver according to plan, with progress made in both the Perfect Factory and VIP+ cost Program during the quarter. We are now live with our new main-tenance system in the first factory. This will improve our preventive maintenance leading to increased reliability and lower costs for the supply network. The system will be imple-mented across all plants by the end of 2022.
We are also preparing pricing and looking at other measures to mitigate the recent rises in input costs.
With respect to cash, in the quarter we delivered a healthy free cash flow and also successfully finalised the refinancing started during the second half of 2020.
In conclusion, we have delivered a solid quarter with a rebound in sales and improved profitability, while also increasing our mar-keting investments to strengthen our brands. Looking ahead, I am confident that pursuing our strategy will ensure we remain well posi-tioned to deliver on our long-term targets.
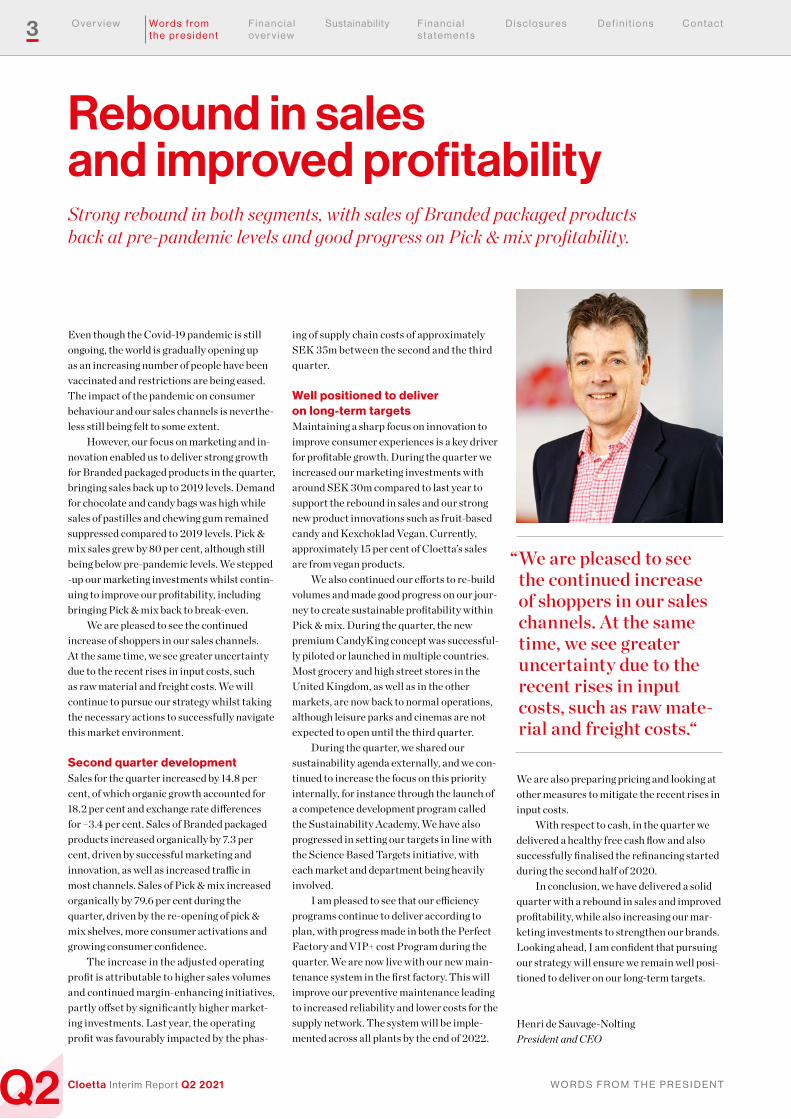
Henri de Sauvage-NoltingPresident and CEO
Rebound in sales and improved profitability
“ We are pleased to see the continued increase of shoppers in our sales channels. At the same time, we see greater uncertainty due to the recent rises in input costs, such as raw mate-rial and freight costs.“
Strong rebound in both segments, with sales of Branded packaged products back at pre-pandemic levels and good progress on Pick & mix profitability.
4 F i n a n c i a l o v e r v i e w
Q2 F i n a n C i a l O v e r v i e WCloetta Interim Report Q2 2021
W o r d s f r o m t h e p r e s i d e n t
O v e r v i e w Sustain ability F i n a n c i a l s t a t e m e n t s
D i s c l o s u r e s D e f i n i t i o n s C o n t a c t
Financial overview
Second quarter developmentCovid-19At Cloetta, various measures have been taken to mitigate the short-term and long-term impact of Covid-19. We are monitoring the situation closely and when needed adapt our actions according to local government advice and regulations, whilst at the same time striving to mitigate any disruptions to our business.
Compared to the annual and sustainability report which was is-sued on 15 March 2021, the risk-profile of Cloetta has not significantly changed although the ongoing Covid-19-pandemic continues to affect the business performance of Cloetta.
For more information on measures taken by Cloetta in relation to Covid-19, please visit www.cloetta.com.
Net sales Net sales for the second quarter increased by SEK 183m to SEK 1,420m (1,237) compared to the same period of last year. Organic growth was 18.2 per cent and the impact of changes in exchange rates was –3.4 per cent.
Changes in net sales, %Apr–Jun
2021Jan–Jun
2021
Organic growth 18.2 5.9
Changes in exchange rates –3.4 –3.6
Total 14.8 2.3
Monthly organic sales growth, %
April 2021
May 2021
June 2021
Total 11.7 30.8 14.0
Branded packaged products 0.7 17.8 5.0
Pick & mix 85.4 111.0 55.9
Gross profit Gross profit amounted to SEK 527m (460), which equates to a gross margin of 37.1 per cent (37.2). The gross profit increase was driven by higher sales volumes and continued margin-enhancing initiatives. Last year, the gross profit was favourably impacted by the phasing of supply chain costs of approximately SEK 35m between the second and the third quarter.
Operating profit Operating profit amounted to SEK 139m (105). Operating profit, ad-justed for items affecting comparability, amounted to SEK 140m (110). The operating profit increase was driven by higher gross profit, partly offset by around SEK 30m in higher marketing investments.
Items affecting comparability Operating profit for the second quarter includes items affecting com-parability of SEK –1m (–5) that are related to costs for restructuring.
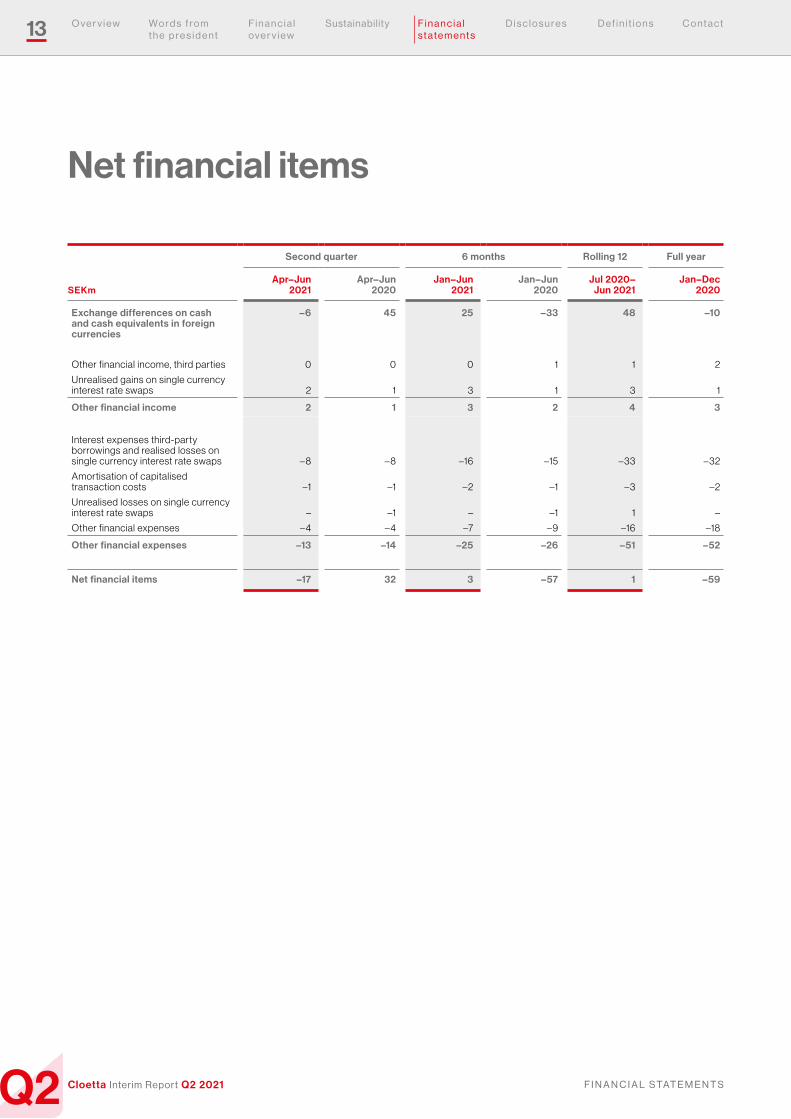
Net financial itemsNet financial items for the quarter amounted to SEK –17m (32). Interest expenses related to external borrowings were SEK –8m (–8), exchange differences on cash and cash equivalents were SEK–6m (45) which mainly related to the development of the Swedish and Norwe-gian krona and the Great Britain pound against the euro during the quarter. Other financial items amounted to SEK –3m (–5). Of the total net financial items SEK 25m (39) is non-cash in nature.
Profit for the periodProfit for the period was SEK 96m (108), which equates to basic and diluted earnings per share of SEK 0.33 (0.38). Income tax for the period was SEK –26m (–29).
The effective tax rate for the quarter was 21.3 per cent (21.2).
Free cash flowThe free cash flow was SEK 102m (–118). Cash flow from operating activities before changes in working capital was SEK 160m (122). The improvement compared to last year is mainly due to the higher operating profit. The cash flow from changes in working capital was SEK 6m (–161).
The cash flow from investments in property, plant and equipment and intangible assets was SEK –64m (–79).
Cash flow from changes in working capitalCash flow from changes in working capital was SEK 6m (–161). The cash flow from changes in working capital was positively impacted by the decrease in inventories for an amount of SEK 5m (–72) and an increase in payables of SEK 6m (–276) partly offset by an increase in receivables amounting to SEK –5m (187).
Cash flow from other investing activities Cash flow from other investing activities was SEK 1m (0).
Cash flow from financing activitiesCash flow from financing activities was SEK –242m (–389). The cash flow from financing activities was related to the dividend distribution of SEK –215m (0), payments of lease liabilities of SEK –18m (–18) and net proceeds and repayments of loans from credit institutions and commercial papers including transaction costs of SEK –8m (–355). Other cash flows from financing activities amounted to SEK–1m (–16).
5 F i n a n c i a l o v e r v i e w
Q2 F i n a n C i a l O v e r v i e WCloetta Interim Report Q2 2021
W o r d s f r o m t h e p r e s i d e n t
O v e r v i e w Sustain ability F i n a n c i a l s t a t e m e n t s
D i s c l o s u r e s D e f i n i t i o n s C o n t a c t
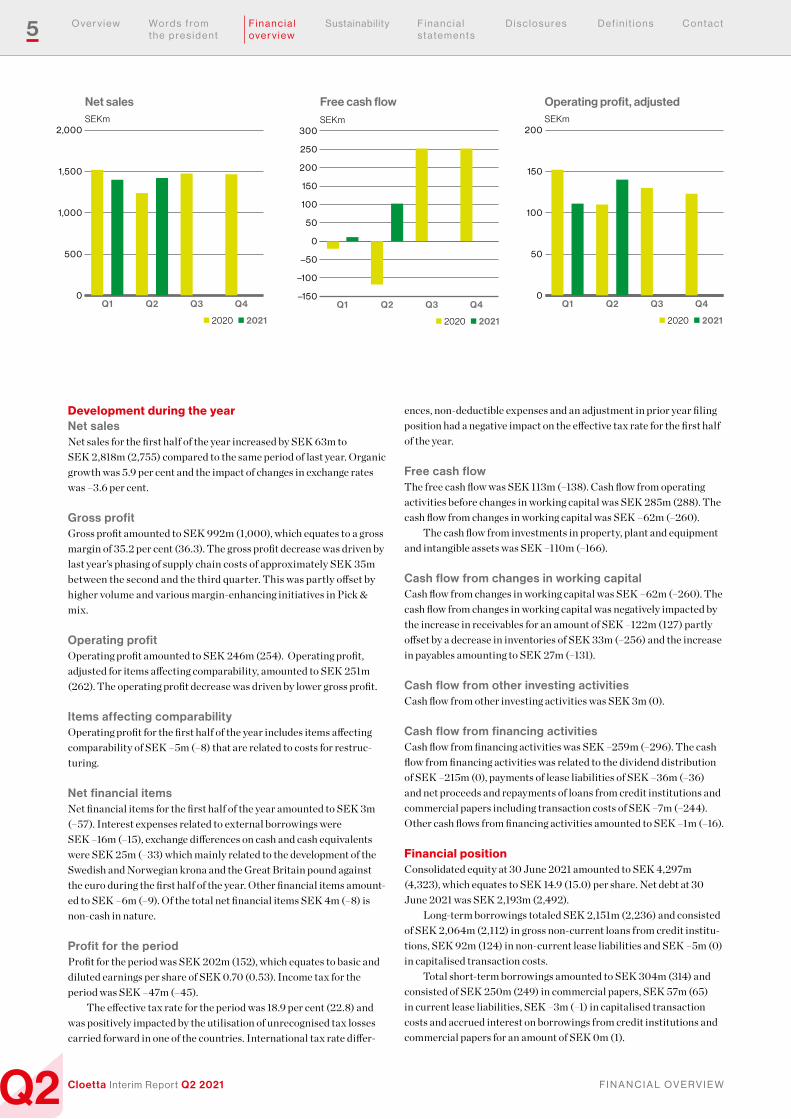
Development during the yearNet sales Net sales for the first half of the year increased by SEK 63m to SEK 2,818m (2,755) compared to the same period of last year. Organic growth was 5.9 per cent and the impact of changes in exchange rates was –3.6 per cent.
Gross profit Gross profit amounted to SEK 992m (1,000), which equates to a gross margin of 35.2 per cent (36.3). The gross profit decrease was driven by last year’s phasing of supply chain costs of approximately SEK 35m between the second and the third quarter. This was partly offset by higher volume and various margin-enhancing initiatives in Pick & mix.
Operating profit Operating profit amounted to SEK 246m (254). Operating profit, adjusted for items affecting comparability, amounted to SEK 251m (262). The operating profit decrease was driven by lower gross profit.
Items affecting comparability Operating profit for the first half of the year includes items affecting comparability of SEK –5m (–8) that are related to costs for restruc-turing.
Net financial itemsNet financial items for the first half of the year amounted to SEK 3m (–57). Interest expenses related to external borrowings were SEK –16m (–15), exchange differences on cash and cash equivalents were SEK 25m (–33) which mainly related to the development of the Swedish and Norwegian krona and the Great Britain pound against the euro during the first half of the year. Other financial items amount-ed to SEK –6m (–9). Of the total net financial items SEK 4m (–8) is non-cash in nature.
Profit for the periodProfit for the period was SEK 202m (152), which equates to basic and diluted earnings per share of SEK 0.70 (0.53). Income tax for the period was SEK –47m (–45).
The effective tax rate for the period was 18.9 per cent (22.8) and was positively impacted by the utilisation of unrecognised tax losses carried forward in one of the countries. International tax rate differ-
ences, non-deductible expenses and an adjustment in prior year filing position had a negative impact on the effective tax rate for the first half of the year.
Free cash flowThe free cash flow was SEK 113m (–138). Cash flow from operating activities before changes in working capital was SEK 285m (288). The cash flow from changes in working capital was SEK –62m (–260).
The cash flow from investments in property, plant and equipment and intangible assets was SEK –110m (–166).
Cash flow from changes in working capitalCash flow from changes in working capital was SEK –62m (–260). The cash flow from changes in working capital was negatively impacted by the increase in receivables for an amount of SEK –122m (127) partly offset by a decrease in inventories of SEK 33m (–256) and the increase in payables amounting to SEK 27m (–131).
Cash flow from other investing activities Cash flow from other investing activities was SEK 3m (0).
Cash flow from financing activitiesCash flow from financing activities was SEK –259m (–296). The cash flow from financing activities was related to the dividend distribution of SEK –215m (0), payments of lease liabilities of SEK –36m (–36) and net proceeds and repayments of loans from credit institutions and commercial papers including transaction costs of SEK –7m (–244). Other cash flows from financing activities amounted to SEK –1m (–16).
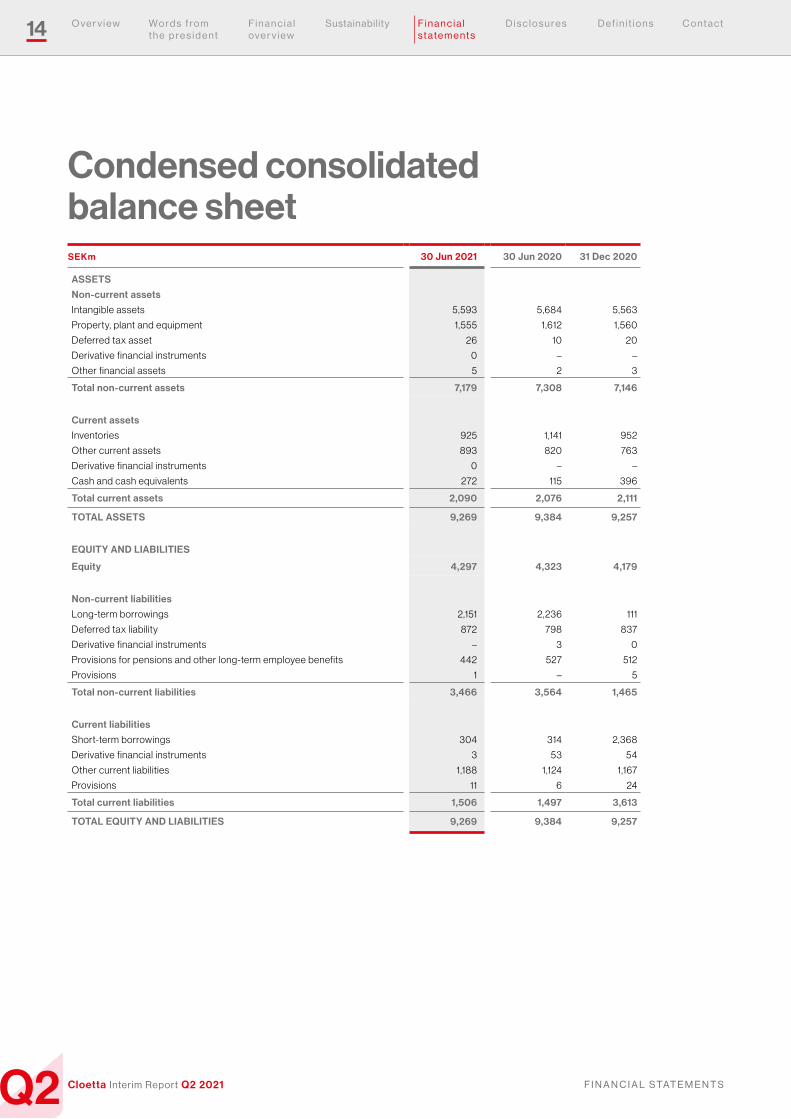
Financial positionConsolidated equity at 30 June 2021 amounted to SEK 4,297m (4,323), which equates to SEK 14.9 (15.0) per share. Net debt at 30 June 2021 was SEK 2,193m (2,492).
Long-term borrowings totaled SEK 2,151m (2,236) and consisted of SEK 2,064m (2,112) in gross non-current loans from credit institu-tions, SEK 92m (124) in non-current lease liabilities and SEK –5m (0) in capitalised transaction costs.
Total short-term borrowings amounted to SEK 304m (314) and consisted of SEK 250m (249) in commercial papers, SEK 57m (65) in current lease liabilities, SEK –3m (–1) in capitalised transaction costs and accrued interest on borrowings from credit institutions and commercial papers for an amount of SEK 0m (1).
SEKm
–150
–100
–50
0
50
100
150
200
250
300
Q4Q3Q2Q1
n 2020 n 2021
Free cash flowNet salesSEKm
0
500
1,000
1,500
2,000
Q4Q3Q2Q1
n 2020 n 2021
Operating profit, adjusted SEKm
0
50
100
150
200
Q4Q3Q2Q1
n 2020 n 2021
6 F i n a n c i a l o v e r v i e w
Q2 F i n a n C i a l O v e r v i e WCloetta Interim Report Q2 2021
W o r d s f r o m t h e p r e s i d e n t
O v e r v i e w Sustain ability F i n a n c i a l s t a t e m e n t s
D i s c l o s u r e s D e f i n i t i o n s C o n t a c t
SEKm30 Jun
202130 Jun
202031 Dec
2020
Gross non-current loans from credit institutions
2,064 2,112 –
Gross current loans from credit institutions
– – 2,054
Commercial papers 250 249 250
Lease liabilities 149 189 176
Derivative financial instruments (non- current and current)
2 56 54
Interest payable – 1 1
Gross debt 2,465 2,607 2,535
Cash and cash equivalents
–272 –115 –396
Net debt 2,193 2,492 2,139
Cash and cash equivalents at 30 June 2021 amounted to SEK 272m (115). At 30 June 2021 Cloetta had an unutilised credit facility of SEK 607m (1,259) and the possibility to issue additional commercial papers for an amount of SEK 750m (750).
Performance by business segmentCloetta has identified the “Branded packaged products” business and the “Pick & mix” business as its operating segments.
The chief operating decision-maker (CODM), which is the CEO and President of the Group, primarily uses external net sales and operating profit, adjusted for items affecting comparability, to assess the performance of its operating segments. Net financial items and in-come tax are not allocated to segments, as these types of activities are driven by the central treasury department and central tax department respectively.
No segment information is provided to or assessed by the CODM on assets and liabilities and therefore these are not separately dis-closed.
Information related to each reportable segment (business seg-ment) is set out below. For more information regarding the determina-tion of reportable segments reference is made to page 24.
Business segmentsThe Cloetta Group comprises two segments: “Branded packaged prod-ucts” and “Pick & mix”. The Pick & mix net sales and adjusted operat-ing profit relate to Cloetta’s complete offering in pick & mix including products, displays and accompanying store and logistic services. All other activities within the Cloetta Group are reflected in the “Branded packaged products” segment.
Apr– Jun 2021SEKm
Branded packaged
products Pick & mix TotalJan – Jun 2021SEKm
Branded packaged
products Pick & mix Total
Net sales 1,097 323 1,420 Net sales 2,198 620 2,818
Operating profit, adjusted
136 4 140 Operating profit, adjusted
271 –20 251
Items affecting comparability
–1 Items affecting comparability
– 5
Operating profit 139 Operating profit 246
Net financial items –17 Net financial items 3
Profit before tax 122 Profit before tax 249
Income tax –26 Income tax – 47
Profit for the period 96 Profit for the period 202
Apr– Jun 2020SEKm
Branded packaged
products Pick & mix TotalJan – Jun 2020SEKm
Branded packaged
products Pick & mix Total
Net sales 1,052 185 1,237 Net sales 2,170 585 2,755
Operating profit, adjusted
169 – 59 110 Operating profit, adjusted
344 – 82 262
Items affecting comparability
– 5 Items affecting comparability
– 8
Operating profit 105 Operating profit 254
Net financial items 32 Net financial items – 57
Profit before tax 137 Profit before tax 197
Income tax –29 Income tax – 45
Profit for the period 108 Profit for the period 152
7 F i n a n c i a l o v e r v i e w
Q2 F i n a n C i a l O v e r v i e WCloetta Interim Report Q2 2021
W o r d s f r o m t h e p r e s i d e n t
O v e r v i e w Sustain ability F i n a n c i a l s t a t e m e n t s
D i s c l o s u r e s D e f i n i t i o n s C o n t a c t
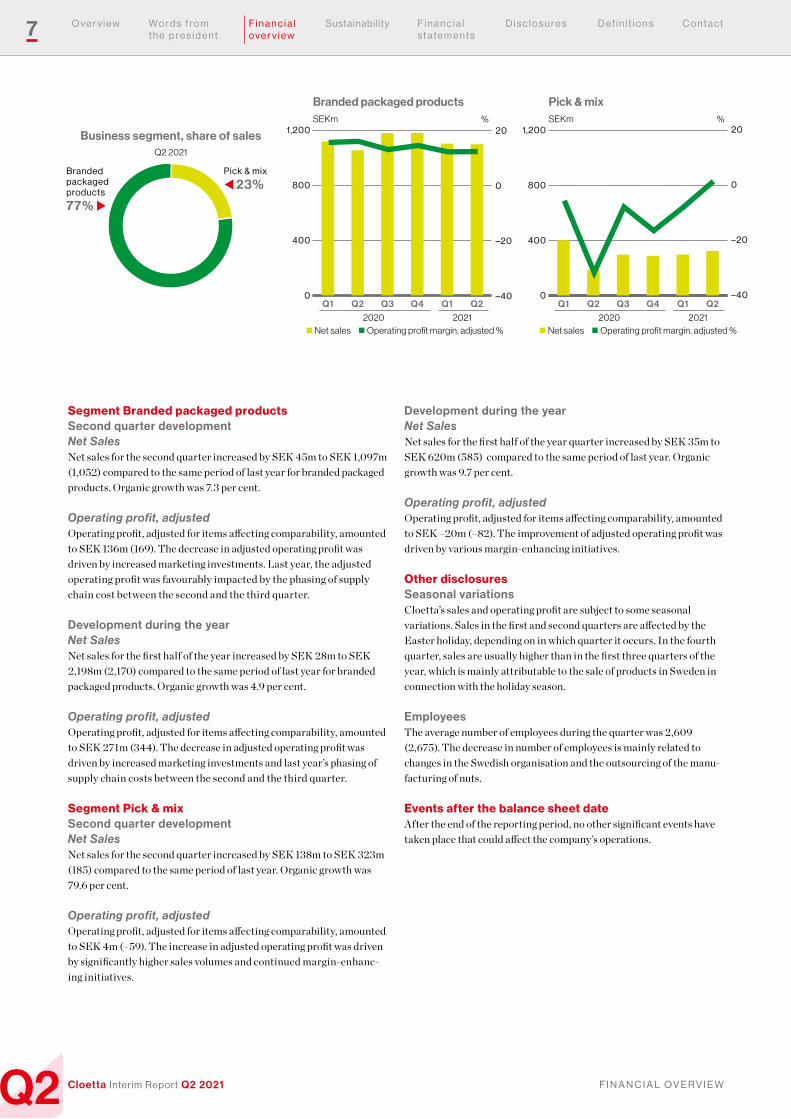
Segment Branded packaged productsSecond quarter development Net SalesNet sales for the second quarter increased by SEK 45m to SEK 1,097m (1,052) compared to the same period of last year for branded packaged products. Organic growth was 7.3 per cent.
Operating profit, adjustedOperating profit, adjusted for items affecting comparability, amounted to SEK 136m (169). The decrease in adjusted operating profit was driven by increased marketing investments. Last year, the adjusted operating profit was favourably impacted by the phasing of supply chain cost between the second and the third quarter.
Development during the year Net SalesNet sales for the first half of the year increased by SEK 28m to SEK 2,198m (2,170) compared to the same period of last year for branded packaged products. Organic growth was 4.9 per cent.
Operating profit, adjustedOperating profit, adjusted for items affecting comparability, amounted to SEK 271m (344). The decrease in adjusted operating profit was driven by increased marketing investments and last year’s phasing of supply chain costs between the second and the third quarter.
Segment Pick & mixSecond quarter development Net SalesNet sales for the second quarter increased by SEK 138m to SEK 323m (185) compared to the same period of last year. Organic growth was 79.6 per cent.
Operating profit, adjustedOperating profit, adjusted for items affecting comparability, amounted to SEK 4m (–59). The increase in adjusted operating profit was driven by significantly higher sales volumes and continued margin-enhanc-ing initiatives.
Development during the year Net SalesNet sales for the first half of the year quarter increased by SEK 35m to SEK 620m (585) compared to the same period of last year. Organic growth was 9.7 per cent.
Operating profit, adjustedOperating profit, adjusted for items affecting comparability, amounted to SEK –20m (–82). The improvement of adjusted operating profit was driven by various margin-enhancing initiatives.
Other disclosuresSeasonal variationsCloetta’s sales and operating profit are subject to some seasonal variations. Sales in the first and second quarters are affected by the Easter holiday, depending on in which quarter it occurs. In the fourth quarter, sales are usually higher than in the first three quarters of the year, which is mainly attributable to the sale of products in Sweden in connection with the holiday season.
EmployeesThe average number of employees during the quarter was 2,609 (2,675). The decrease in number of employees is mainly related to changes in the Swedish organisation and the outsourcing of the manu-facturing of nuts.
Events after the balance sheet dateAfter the end of the reporting period, no other significant events have taken place that could affect the company’s operations.
Business segment, share of salesQ2 2021
Pick & mix
t 23%Branded packaged products
77% u
Branded packaged productsSEKm
n Net sales n Operating profit margin, adjusted %2020 2021
%
0
400
800
1,200
Q2Q1Q4Q3Q2Q1–40
–20
0
20
Pick & mixSEKm
n Net sales n Operating profit margin, adjusted %
%
2020 2021
0
400
800
1,200
Q2Q1Q4Q3Q2Q1–40
–20
0
20
8 F i n a n c i a l o v e r v i e w
Q2 F i n a n C i a l O v e r v i e WCloetta Interim Report Q2 2021
W o r d s f r o m t h e p r e s i d e n t
O v e r v i e w Sustain ability F i n a n c i a l s t a t e m e n t s
D i s c l o s u r e s D e f i n i t i o n s C o n t a c t
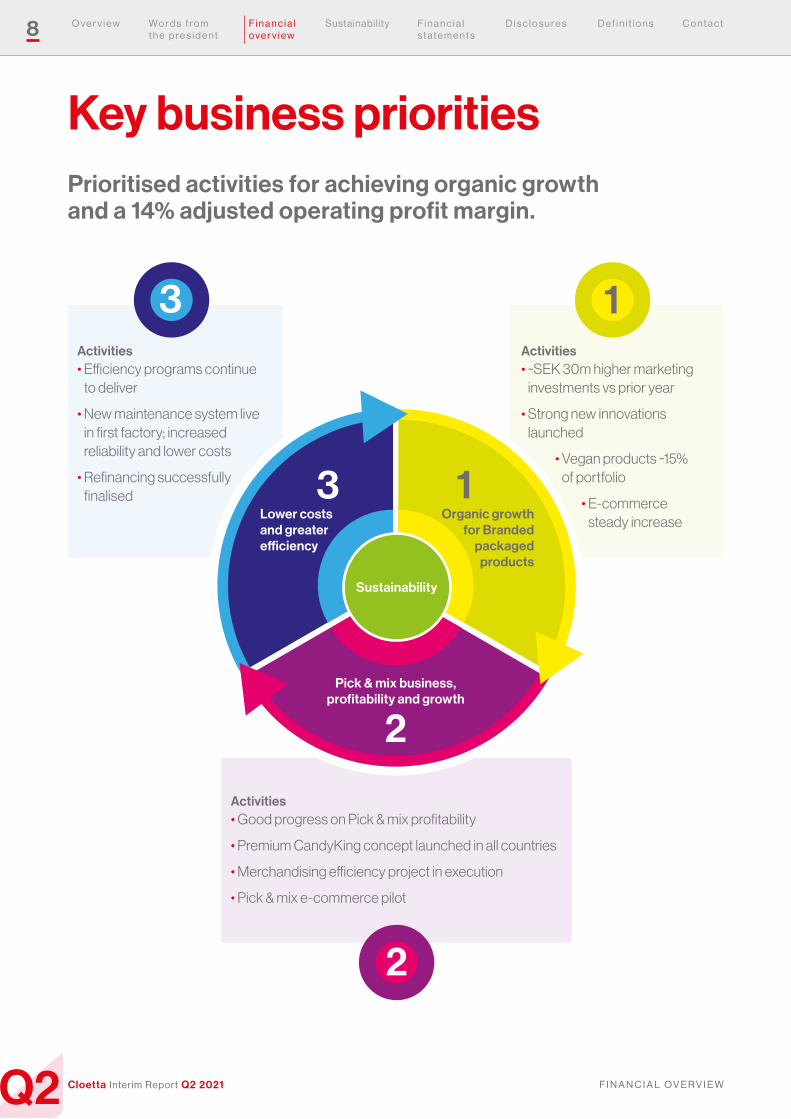
Activities• Good progress on Pick & mix profitability
• Premium CandyKing concept launched in all countries
• Merchandising efficiency project in execution
• Pick & mix e-commerce pilot
2
Activities• ~SEK 30m higher marketing
investments vs prior year
• Strong new innovations launched
• Vegan products ~15% of portfolio
• E-commerce steady increase
Activities• Efficiency programs continue
to deliver
• New maintenance system live in first factory; increased reliability and lower costs
• Refinancing successfully finalised
13
Key business prioritiesPrioritised activities for achieving organic growth and a 14% adjusted operating profit margin.
Pick & mix business, profitability and growth
Organic growth for Branded
packaged products
2
3 1
Sustainability
Lower costs and greater efficiency
Q2 S u S ta i n a b i l i t y
9
Cloetta Interim Report Q2 2021
W o r d s f r o m t h e p r e s i d e n t
O v e r v i e w F i n a n c i a l o v e r v i e w
F i n a n c i a l s t a t e m e n t s
D i s c l o s u r e s D e f i n i t i o n s C o n t a c tSustain ability
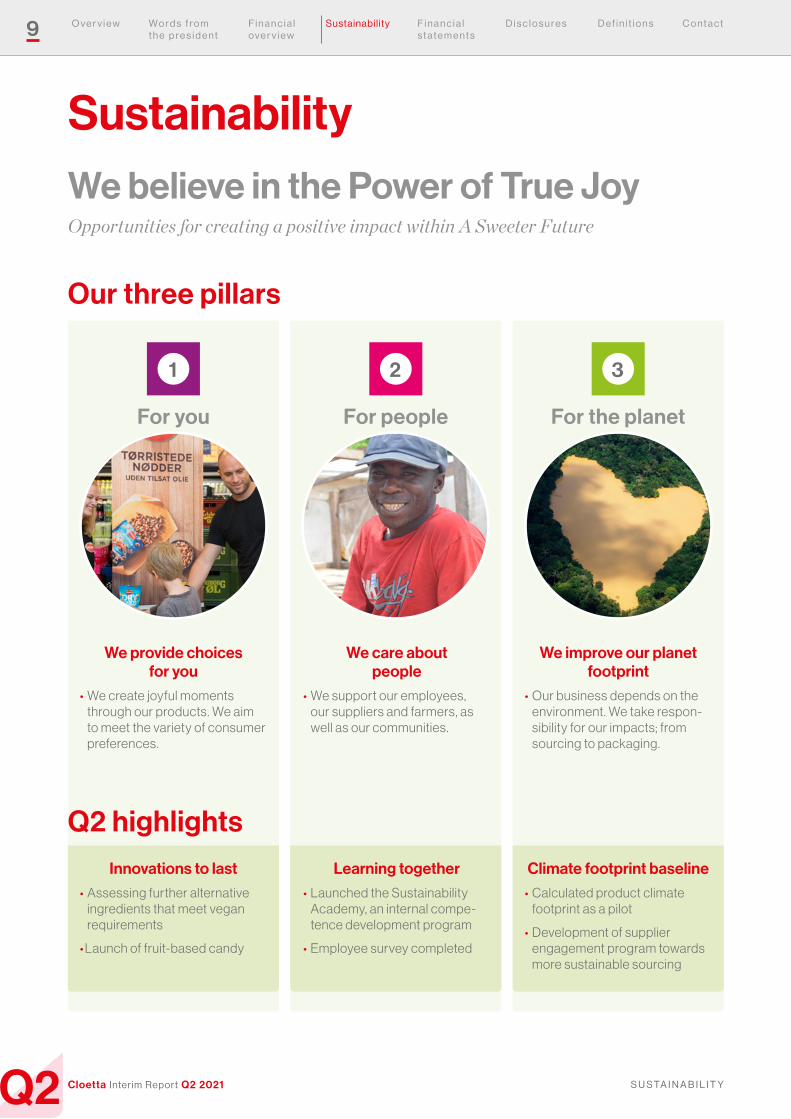
Sustainability
1
For you
2
For people
3
For the planet
We believe in the Power of True JoyOpportunities for creating a positive impact within A Sweeter Future
Q2 highlights
We provide choices for you
• We create joyful moments through our products. We aim to meet the variety of consumer preferences.
Innovations to last• Assessing further alternative
ingredients that meet vegan requirements
• Launch of fruit-based candy
We care about people
• We support our employees, our suppliers and farmers, as well as our communities.
Learning together• Launched the Sustainability
Academy, an internal compe-tence development program
• Employee survey completed
We improve our planet footprint
• Our business depends on the environment. We take respon-sibility for our impacts; from sourcing to packaging.
Climate footprint baseline• Calculated product climate
footprint as a pilot
• Development of supplier engagement program towards more sustainable sourcing
Our three pillars
Q2 a S S u r a n C e
10
Cloetta Interim Report Q2 2021
W o r d s f r o m t h e p r e s i d e n t
O v e r v i e w F i n a n c i a l o v e r v i e w
Sustain ability F i n a n c i a l s t a t e m e n t s
D i s c l o s u r e s D e f i n i t i o n s C o n t a c t
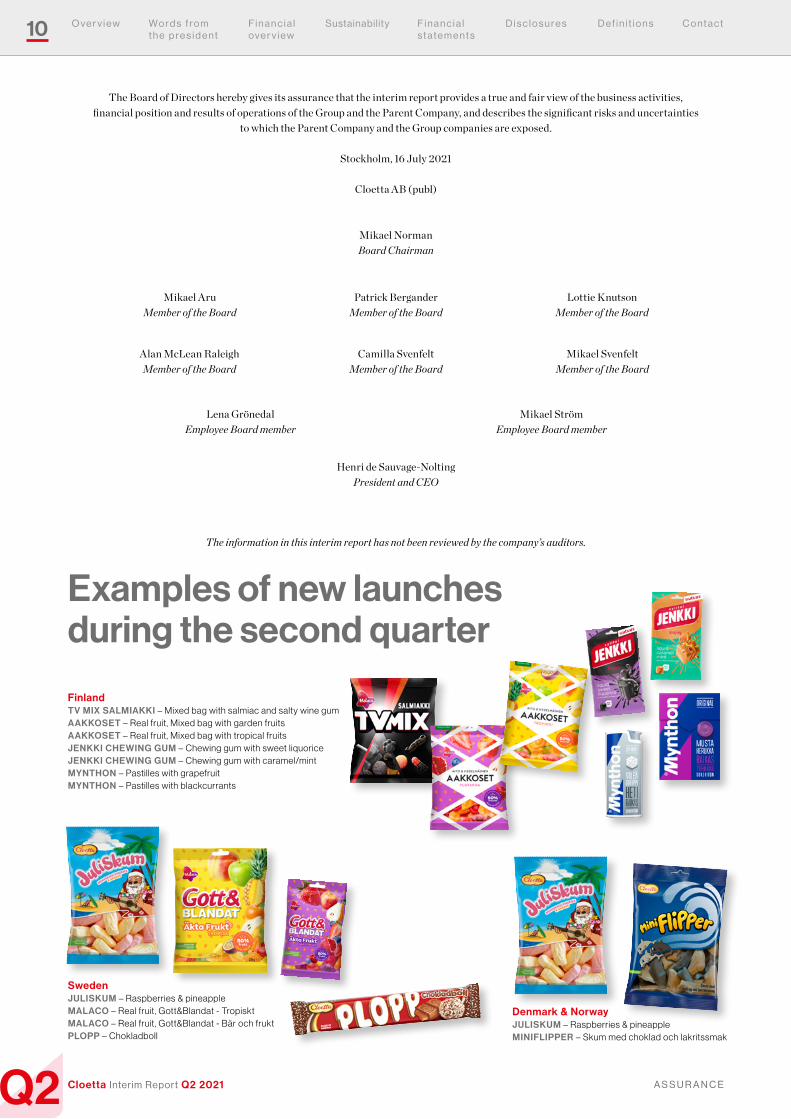
Examples of new launches during the second quarter
The Board of Directors hereby gives its assurance that the interim report provides a true and fair view of the business activities, financial position and results of operations of the Group and the Parent Company, and describes the significant risks and uncertainties
to which the Parent Company and the Group companies are exposed.
Stockholm, 16 July 2021
Cloetta AB (publ)
Mikael NormanBoard Chairman
The information in this interim report has not been reviewed by the company’s auditors.
Henri de Sauvage-NoltingPresident and CEO
Mikael AruMember of the Board
Patrick BerganderMember of the Board
Lottie KnutsonMember of the Board
Alan McLean RaleighMember of the Board
Camilla SvenfeltMember of the Board
Mikael SvenfeltMember of the Board
Lena GrönedalEmployee Board member
Mikael Ström Employee Board member
FinlandTV MIX SALMIAKKI – Mixed bag with salmiac and salty wine gumAAKKOSET – Real fruit, Mixed bag with garden fruitsAAKKOSET – Real fruit, Mixed bag with tropical fruitsJENKKI CHEWING GUM – Chewing gum with sweet liquoriceJENKKI CHEWING GUM – Chewing gum with caramel/mintMYNTHON – Pastilles with grapefruitMYNTHON – Pastilles with blackcurrants
SwedenJULISKUM – Raspberries & pineapple MALACO – Real fruit, Gott&Blandat - TropisktMALACO – Real fruit, Gott&Blandat - Bär och fruktPLOPP – Chokladboll
Denmark & NorwayJULISKUM – Raspberries & pineappleMINIFLIPPER – Skum med choklad och lakritssmak

11 F i n a n c i a l s t a t e m e n t s
Q2 F i n a n C i a l S tat e m e n t SCloetta Interim Report Q2 2021
W o r d s f r o m t h e p r e s i d e n t
O v e r v i e w F i n a n c i a l o v e r v i e w
Sustain ability D i s c l o s u r e s D e f i n i t i o n s C o n t a c t
Consolidated profit and loss account
Second quarter 6 months Rolling 12 Full year
SEKmApr–Jun
2021Apr–Jun
2020Jan–Jun
2021Jan–Jun
2020Jul 2020–
Jun 2021Jan–Dec
2020
Net sales 1,420 1,237 2,818 2,755 5,758 5,695
Cost of goods sold – 893 –777 –1,826 –1,755 –3,789 –3,718
Gross profit 527 460 992 1,000 1,969 1,977
Selling expenses –242 –213 – 453 – 450 –954 –951
General and administrative expenses –146 –142 –293 –296 – 561 – 564
Operating profit 139 105 246 254 454 462
Exchange differences on cash and cash equivalents in foreign currencies – 6 45 25 –33 48 –10
Other financial income 2 1 3 2 4 3
Other financial expenses –13 –14 –25 –26 – 51 – 52
Net financial items –17 32 3 –57 1 –59
Profit before tax 122 137 249 197 455 403
Income tax –26 –29 – 47 – 45 –124 –122
Profit for the period 96 108 202 152 331 281
Profit for the period attributable to:
Owners of the Parent Company 96 108 202 152 331 281
Earnings per share, SEK
Basic and diluted1 0.33 0.38 0.70 0.53 1.15 0.98
Number of shares at end of period 288,619,299 288,619,299 288,619,299 288,619,299 288,619,299 288,619,299
Average number of shares (basic)1 286,960,980 286,557,259 286,798,234 286,547,838 286,715,281 286,590,993
Average number of shares (diluted)1 287,136,929 286,792,494 287,006,996 286,801,891 286,888,226 286,805,203
1 Cloetta entered into forward contracts to repurchase own shares to fulfill its future obligation to deliver the shares to the participants of the long-term share-based incentive plan. The contract has been settled at the end of the reporting period.
Financial statements in summary
12 F i n a n c i a l s t a t e m e n t s
Q2 F i n a n C i a l S tat e m e n t SCloetta Interim Report Q2 2021
W o r d s f r o m t h e p r e s i d e n t
O v e r v i e w F i n a n c i a l o v e r v i e w
Sustain ability D i s c l o s u r e s D e f i n i t i o n s C o n t a c t
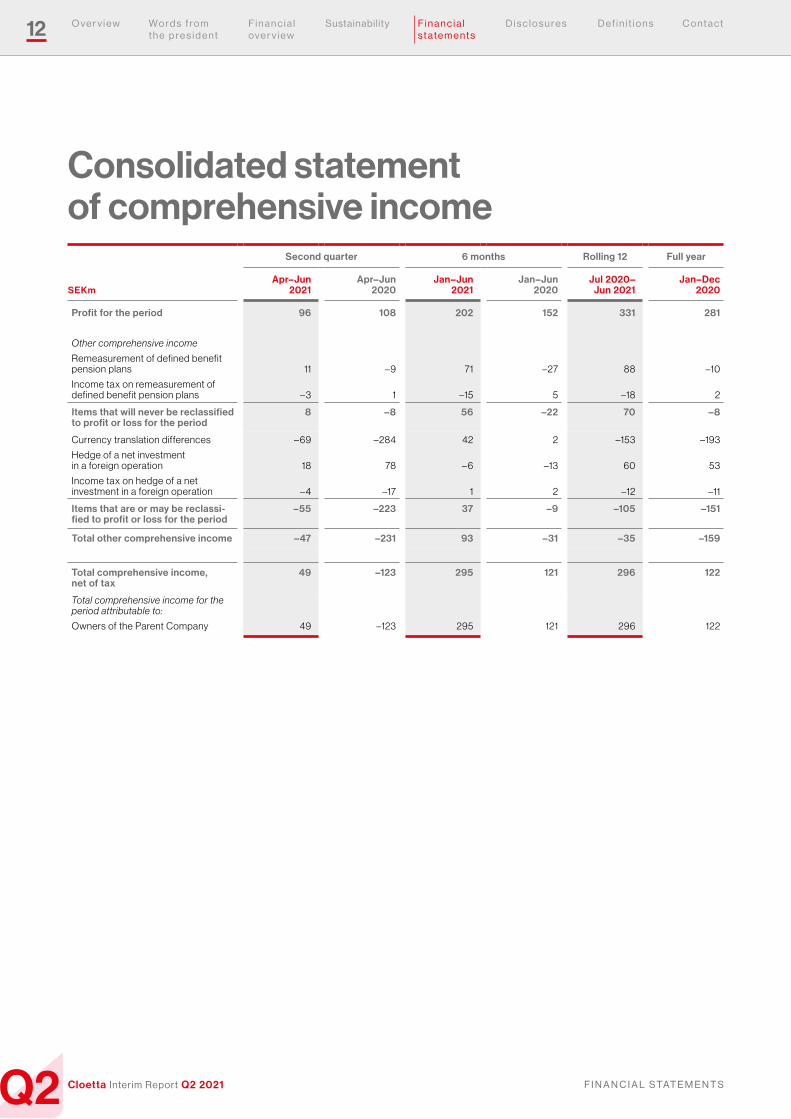
Consolidated statement of comprehensive income
Second quarter 6 months Rolling 12 Full year
SEKmApr–Jun
2021Apr–Jun
2020Jan–Jun
2021Jan–Jun
2020Jul 2020–
Jun 2021Jan–Dec
2020
Profit for the period 96 108 202 152 331 281
Other comprehensive income
Remeasurement of defined benefit pension plans 11 –9 71 –27 88 –10
Income tax on remeasurement of defined benefit pension plans –3 1 –15 5 –18 2
Items that will never be reclassified to profit or loss for the period
8 –8 56 –22 70 –8
Currency translation differences – 69 –284 42 2 –153 –193
Hedge of a net investment in a foreign operation 18 78 – 6 –13 60 53
Income tax on hedge of a net investment in a foreign operation – 4 –17 1 2 –12 –11
Items that are or may be reclassi-fied to profit or loss for the period
–55 –223 37 –9 –105 –151
Total other comprehensive income –47 –231 93 –31 –35 –159
Total comprehensive income, net of tax
49 –123 295 121 296 122
Total comprehensive income for the period attributable to:
Owners of the Parent Company 49 –123 295 121 296 122
13 F i n a n c i a l s t a t e m e n t s
Q2 F i n a n C i a l S tat e m e n t SCloetta Interim Report Q2 2021
W o r d s f r o m t h e p r e s i d e n t
O v e r v i e w F i n a n c i a l o v e r v i e w
Sustain ability D i s c l o s u r e s D e f i n i t i o n s C o n t a c t
Net financial items
Second quarter 6 months Rolling 12 Full year
SEKmApr–Jun
2021Apr–Jun
2020Jan–Jun
2021Jan–Jun
2020Jul 2020–
Jun 2021Jan–Dec
2020
Exchange differences on cash and cash equivalents in foreign currencies
–6 45 25 –33 48 –10
Other financial income, third parties 0 0 0 1 1 2
Unrealised gains on single currency interest rate swaps 2 1 3 1 3 1
Other financial income 2 1 3 2 4 3
Interest expenses third-party borrowings and realised losses on single currency interest rate swaps – 8 – 8 –16 –15 –33 –32
Amortisation of capitalised transaction costs –1 –1 –2 –1 –3 –2
Unrealised losses on single currency interest rate swaps – –1 – –1 1 –
Other financial expenses – 4 – 4 –7 –9 –16 –18
Other financial expenses –13 –14 –25 –26 –51 –52
Net financial items –17 32 3 –57 1 –59
14 F i n a n c i a l s t a t e m e n t s
Q2 F i n a n C i a l S tat e m e n t SCloetta Interim Report Q2 2021
W o r d s f r o m t h e p r e s i d e n t
O v e r v i e w F i n a n c i a l o v e r v i e w
Sustain ability D i s c l o s u r e s D e f i n i t i o n s C o n t a c t
Condensed consolidated balance sheetSEKm 30 Jun 2021 30 Jun 2020 31 Dec 2020
ASSETS
Non-current assets
Intangible assets 5,593 5,684 5,563
Property, plant and equipment 1,555 1,612 1,560
Deferred tax asset 26 10 20
Derivative financial instruments 0 – –
Other financial assets 5 2 3
Total non-current assets 7,179 7,308 7,146
Current assets
Inventories 925 1,141 952
Other current assets 893 820 763
Derivative financial instruments 0 – –
Cash and cash equivalents 272 115 396
Total current assets 2,090 2,076 2,111
TOTAL ASSETS 9,269 9,384 9,257
EQUITY AND LIABILITIES
Equity 4,297 4,323 4,179
Non-current liabilities
Long-term borrowings 2,151 2,236 111
Deferred tax liability 872 798 837
Derivative financial instruments – 3 0
Provisions for pensions and other long-term employee benefits 442 527 512
Provisions 1 – 5
Total non-current liabilities 3,466 3,564 1,465
Current liabilities
Short-term borrowings 304 314 2,368
Derivative financial instruments 3 53 54
Other current liabilities 1,188 1,124 1,167
Provisions 11 6 24
Total current liabilities 1,506 1,497 3,613
TOTAL EQUITY AND LIABILITIES 9,269 9,384 9,257
15 F i n a n c i a l s t a t e m e n t s
Q2 F i n a n C i a l S tat e m e n t SCloetta Interim Report Q2 2021
W o r d s f r o m t h e p r e s i d e n t
O v e r v i e w F i n a n c i a l o v e r v i e w
Sustain ability D i s c l o s u r e s D e f i n i t i o n s C o n t a c t
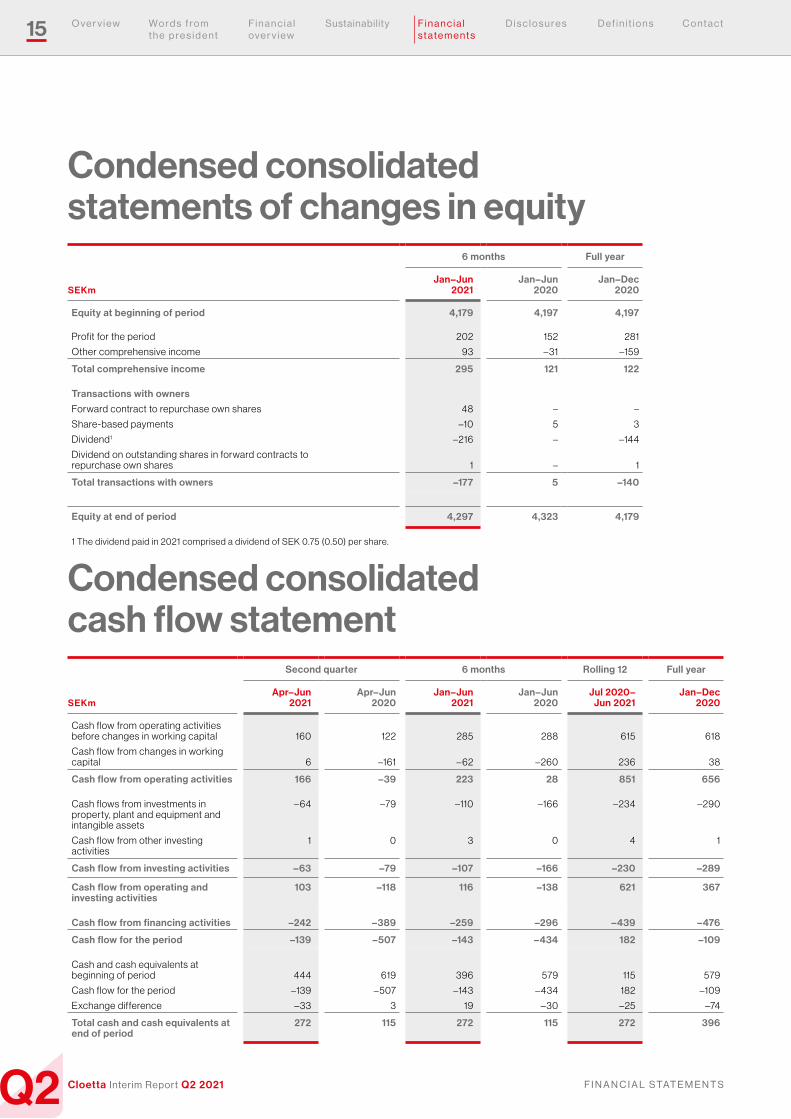
Condensed consolidated statements of changes in equity
6 months Full year
SEKmJan–Jun
2021Jan–Jun
2020Jan–Dec
2020
Equity at beginning of period 4,179 4,197 4,197
Profit for the period 202 152 281
Other comprehensive income 93 –31 –159
Total comprehensive income 295 121 122
Transactions with owners
Forward contract to repurchase own shares 48 – –
Share-based payments –10 5 3
Dividend1 –216 – –144
Dividend on outstanding shares in forward contracts to repurchase own shares 1 – 1
Total transactions with owners –177 5 –140
Equity at end of period 4,297 4,323 4,179
1 The dividend paid in 2021 comprised a dividend of SEK 0.75 (0.50) per share.
Condensed consolidated cash flow statement
Second quarter 6 months Rolling 12 Full year
SEKmApr–Jun
2021Apr–Jun
2020Jan–Jun
2021Jan–Jun
2020Jul 2020–
Jun 2021Jan–Dec
2020
Cash flow from operating activities before changes in working capital 160 122 285 288 615 618
Cash flow from changes in working capital 6 –161 – 62 –260 236 38
Cash flow from operating activities 166 –39 223 28 851 656
Cash flows from investments in property, plant and equipment and intangible assets
– 64 –79 –110 –166 –234 –290
Cash flow from other investing activities
1 0 3 0 4 1
Cash flow from investing activities –63 –79 –107 –166 –230 –289
Cash flow from operating and investing activities
103 –118 116 –138 621 367
Cash flow from financing activities –242 –389 –259 –296 –439 –476
Cash flow for the period –139 –507 –143 –434 182 –109
Cash and cash equivalents at beginning of period 444 619 396 579 115 579
Cash flow for the period –139 – 507 –143 – 434 182 –109
Exchange difference –33 3 19 –30 –25 –74
Total cash and cash equivalents at end of period
272 115 272 115 272 396
16 F i n a n c i a l s t a t e m e n t s
Q2 F i n a n C i a l S tat e m e n t SCloetta Interim Report Q2 2021
W o r d s f r o m t h e p r e s i d e n t
O v e r v i e w F i n a n c i a l o v e r v i e w
Sustain ability D i s c l o s u r e s D e f i n i t i o n s C o n t a c t
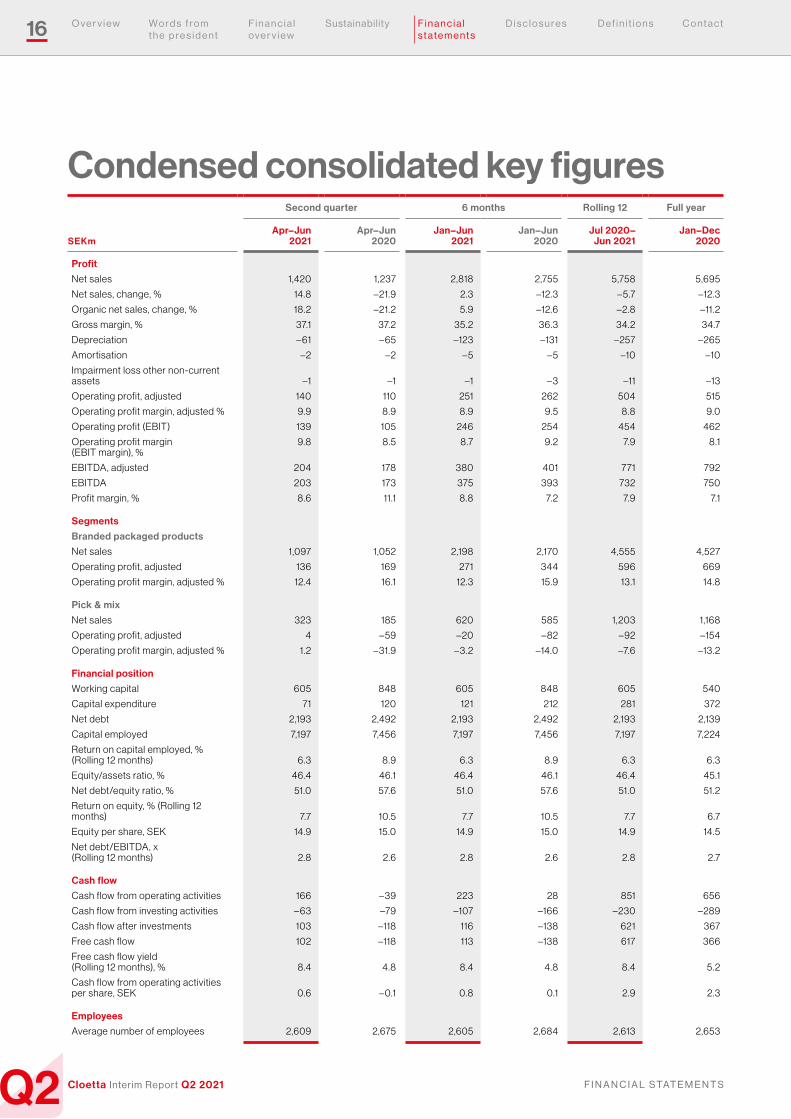
Condensed consolidated key figuresSecond quarter 6 months Rolling 12 Full year
SEKmApr–Jun
2021Apr–Jun
2020Jan–Jun
2021Jan–Jun
2020Jul 2020–
Jun 2021Jan–Dec
2020
Profit
Net sales 1,420 1,237 2,818 2,755 5,758 5,695
Net sales, change, % 14.8 –21.9 2.3 –12.3 – 5.7 –12.3
Organic net sales, change, % 18.2 –21.2 5.9 –12.6 –2.8 –11.2
Gross margin, % 37.1 37.2 35.2 36.3 34.2 34.7
Depreciation – 61 – 65 –123 –131 –257 –265
Amortisation –2 –2 – 5 – 5 –10 –10
Impairment loss other non-current assets –1 –1 –1 –3 –11 –13
Operating profit, adjusted 140 110 251 262 504 515
Operating profit margin, adjusted % 9.9 8.9 8.9 9.5 8.8 9.0
Operating profit (EBIT) 139 105 246 254 454 462
Operating profit margin (EBIT margin), %
9.8 8.5 8.7 9.2 7.9 8.1
EBITDA, adjusted 204 178 380 401 771 792
EBITDA 203 173 375 393 732 750
Profit margin, % 8.6 11.1 8.8 7.2 7.9 7.1
Segments
Branded packaged products
Net sales 1,097 1,052 2,198 2,170 4,555 4,527
Operating profit, adjusted 136 169 271 344 596 669
Operating profit margin, adjusted % 12.4 16.1 12.3 15.9 13.1 14.8
Pick & mix
Net sales 323 185 620 585 1,203 1,168
Operating profit, adjusted 4 – 59 –20 – 82 –92 –154
Operating profit margin, adjusted % 1.2 –31.9 –3.2 –14.0 –7.6 –13.2
Financial position
Working capital 605 848 605 848 605 540
Capital expenditure 71 120 121 212 281 372
Net debt 2,193 2,492 2,193 2,492 2,193 2,139
Capital employed 7,197 7,456 7,197 7,456 7,197 7,224
Return on capital employed, % (Rolling 12 months) 6.3 8.9 6.3 8.9 6.3 6.3
Equity/assets ratio, % 46.4 46.1 46.4 46.1 46.4 45.1
Net debt/equity ratio, % 51.0 57.6 51.0 57.6 51.0 51.2
Return on equity, % (Rolling 12 months) 7.7 10.5 7.7 10.5 7.7 6.7
Equity per share, SEK 14.9 15.0 14.9 15.0 14.9 14.5
Net debt/EBITDA, x (Rolling 12 months) 2.8 2.6 2.8 2.6 2.8 2.7
Cash flow
Cash flow from operating activities 166 –39 223 28 851 656
Cash flow from investing activities – 63 –79 –107 –166 –230 –289
Cash flow after investments 103 –118 116 –138 621 367
Free cash flow 102 –118 113 –138 617 366
Free cash flow yield (Rolling 12 months), % 8.4 4.8 8.4 4.8 8.4 5.2
Cash flow from operating activities per share, SEK 0.6 – 0.1 0.8 0.1 2.9 2.3
Employees
Average number of employees 2,609 2,675 2,605 2,684 2,613 2,653
17 F i n a n c i a l s t a t e m e n t s
Q2 F i n a n C i a l S tat e m e n t SCloetta Interim Report Q2 2021
W o r d s f r o m t h e p r e s i d e n t
O v e r v i e w F i n a n c i a l o v e r v i e w
Sustain ability D i s c l o s u r e s D e f i n i t i o n s C o n t a c t
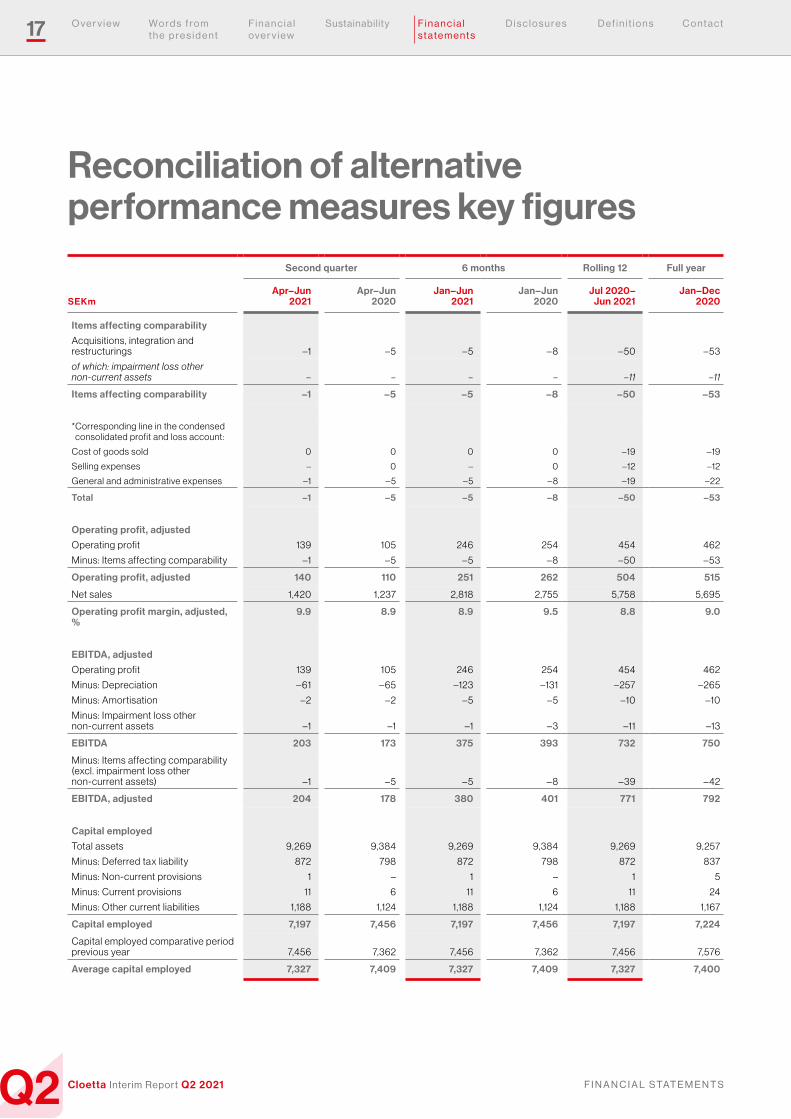
Reconciliation of alternative performance measures key figures
Second quarter 6 months Rolling 12 Full year
SEKmApr–Jun
2021Apr–Jun
2020Jan–Jun
2021Jan–Jun
2020Jul 2020–
Jun 2021Jan–Dec
2020
Items affecting comparability
Acquisitions, integration and restructurings –1 – 5 – 5 – 8 – 50 – 53
of which: impairment loss other non-current assets – – – – –11 –11
Items affecting comparability –1 –5 –5 –8 –50 –53
* Corresponding line in the condensed consolidated profit and loss account:
Cost of goods sold 0 0 0 0 –19 –19
Selling expenses – 0 – 0 –12 –12
General and administrative expenses –1 – 5 – 5 – 8 –19 –22
Total –1 –5 –5 –8 –50 –53
Operating profit, adjusted
Operating profit 139 105 246 254 454 462
Minus: Items affecting comparability –1 – 5 – 5 – 8 – 50 – 53
Operating profit, adjusted 140 110 251 262 504 515
Net sales 1,420 1,237 2,818 2,755 5,758 5,695
Operating profit margin, adjusted, %
9.9 8.9 8.9 9.5 8.8 9.0
EBITDA, adjusted
Operating profit 139 105 246 254 454 462
Minus: Depreciation – 61 – 65 –123 –131 –257 –265
Minus: Amortisation –2 –2 – 5 – 5 –10 –10
Minus: Impairment loss other non-current assets –1 –1 –1 –3 –11 –13
EBITDA 203 173 375 393 732 750
Minus: Items affecting comparability (excl. impairment loss other non-current assets) –1 – 5 – 5 – 8 –39 – 42
EBITDA, adjusted 204 178 380 401 771 792
Capital employed
Total assets 9,269 9,384 9,269 9,384 9,269 9,257
Minus: Deferred tax liability 872 798 872 798 872 837
Minus: Non-current provisions 1 – 1 – 1 5
Minus: Current provisions 11 6 11 6 11 24
Minus: Other current liabilities 1,188 1,124 1,188 1,124 1,188 1,167
Capital employed 7,197 7,456 7,197 7,456 7,197 7,224
Capital employed comparative period previous year 7,456 7,362 7,456 7,362 7,456 7,576
Average capital employed 7,327 7,409 7,327 7,409 7,327 7,400
18 F i n a n c i a l s t a t e m e n t s
Q2 F i n a n C i a l S tat e m e n t SCloetta Interim Report Q2 2021
W o r d s f r o m t h e p r e s i d e n t
O v e r v i e w F i n a n c i a l o v e r v i e w
Sustain ability D i s c l o s u r e s D e f i n i t i o n s C o n t a c t
Second quarter 6 months Rolling 12 Full year
SEKmApr–Jun
2021Apr–Jun
2020Jan–Jun
2021Jan–Jun
2020Jul 2020–
Jun 2021Jan–Dec
2020
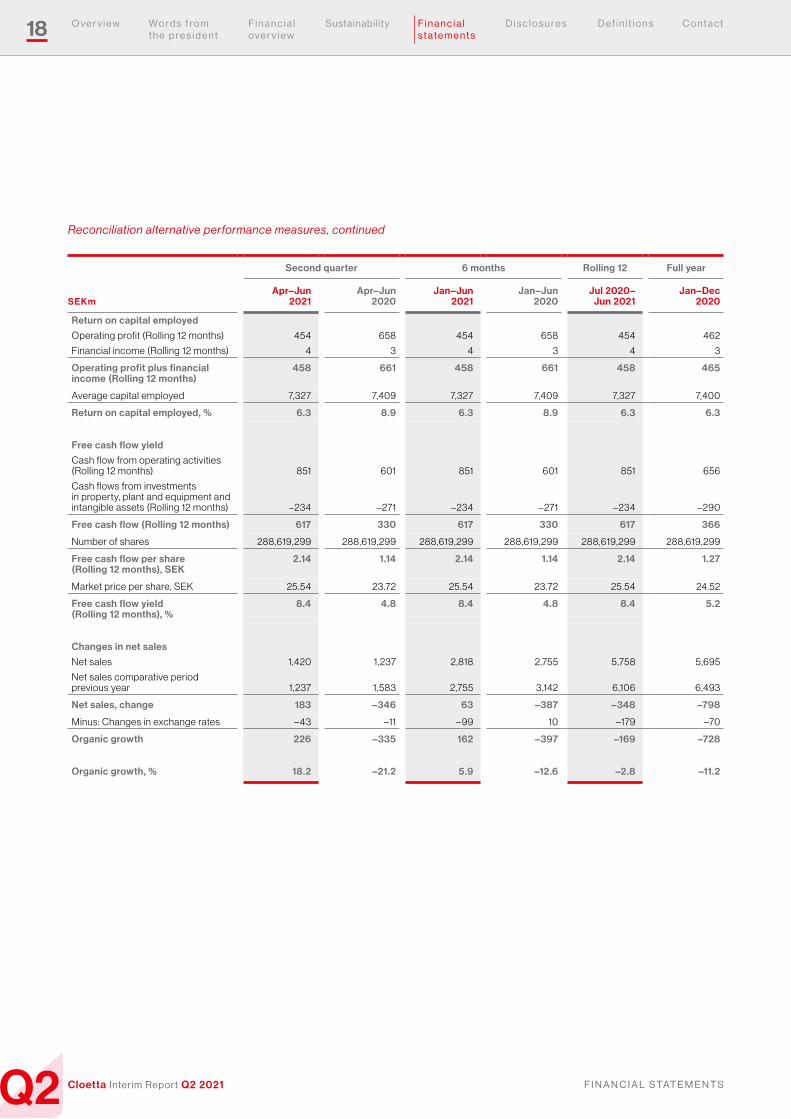
Return on capital employed
Operating profit (Rolling 12 months) 454 658 454 658 454 462
Financial income (Rolling 12 months) 4 3 4 3 4 3
Operating profit plus financial income (Rolling 12 months)
458 661 458 661 458 465
Average capital employed 7,327 7,409 7,327 7,409 7,327 7,400
Return on capital employed, % 6.3 8.9 6.3 8.9 6.3 6.3
Free cash flow yield
Cash flow from operating activities (Rolling 12 months) 851 601 851 601 851 656
Cash flows from investments in property, plant and equipment and intangible assets (Rolling 12 months) –234 –271 –234 –271 –234 –290
Free cash flow (Rolling 12 months) 617 330 617 330 617 366
Number of shares 288,619,299 288,619,299 288,619,299 288,619,299 288,619,299 288,619,299
Free cash flow per share (Rolling 12 months), SEK
2.14 1.14 2.14 1.14 2.14 1.27
Market price per share, SEK 25.54 23.72 25.54 23.72 25.54 24.52
Free cash flow yield (Rolling 12 months), %
8.4 4.8 8.4 4.8 8.4 5.2
Changes in net sales
Net sales 1,420 1,237 2,818 2,755 5,758 5,695
Net sales comparative period previous year 1,237 1,583 2,755 3,142 6,106 6,493
Net sales, change 183 –346 63 –387 –348 –798
Minus: Changes in exchange rates – 43 –11 –99 10 –179 –70
Organic growth 226 –335 162 –397 –169 –728
Organic growth, % 18.2 –21.2 5.9 –12.6 –2.8 –11.2
Reconciliation alternative performance measures, continued
19 F i n a n c i a l s t a t e m e n t s
Q2 F i n a n C i a l S tat e m e n t SCloetta Interim Report Q2 2021
W o r d s f r o m t h e p r e s i d e n t
O v e r v i e w F i n a n c i a l o v e r v i e w
Sustain ability D i s c l o s u r e s D e f i n i t i o n s C o n t a c t
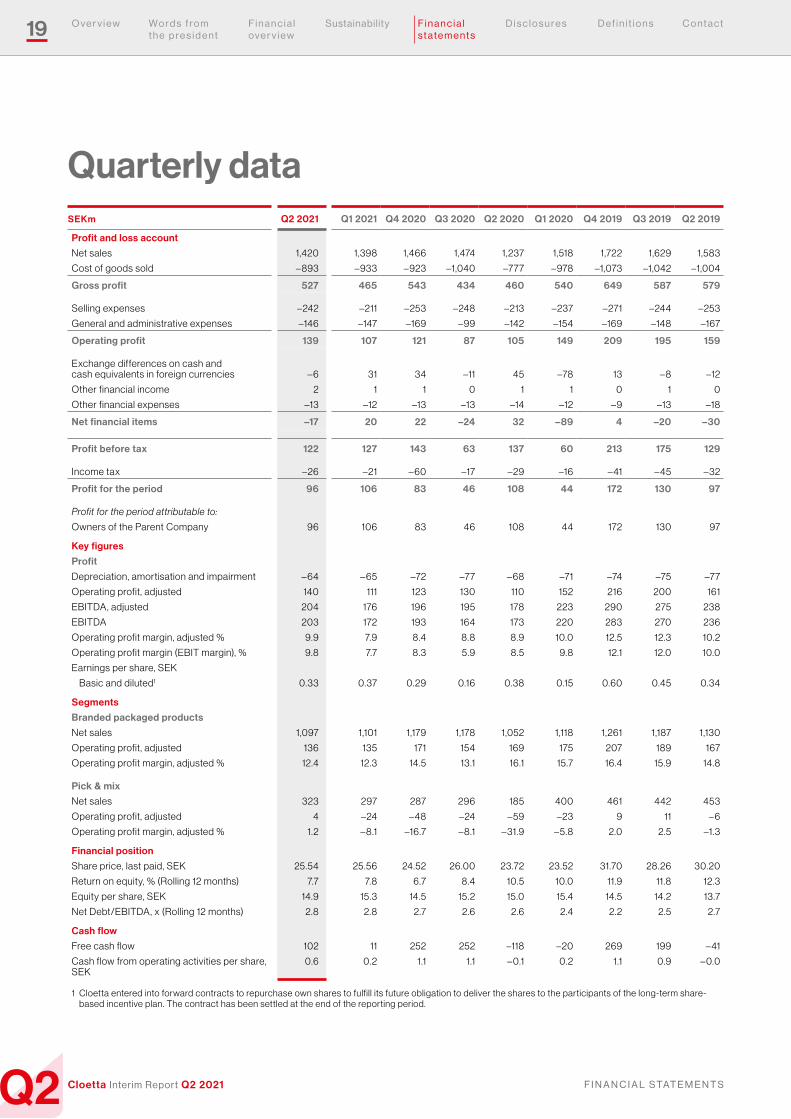
Quarterly dataSEKm Q2 2021 Q1 2021 Q4 2020 Q3 2020 Q2 2020 Q1 2020 Q4 2019 Q3 2019 Q2 2019
Profit and loss account
Net sales 1,420 1,398 1,466 1,474 1,237 1,518 1,722 1,629 1,583
Cost of goods sold – 893 –933 –923 –1,040 –777 –978 –1,073 –1,042 –1,004
Gross profit 527 465 543 434 460 540 649 587 579
Selling expenses –242 –211 –253 –248 –213 –237 –271 –244 –253
General and administrative expenses –146 –147 –169 –99 –142 –154 –169 –148 –167
Operating profit 139 107 121 87 105 149 209 195 159
Exchange differences on cash and cash equivalents in foreign currencies – 6 31 34 –11 45 –78 13 – 8 –12
Other financial income 2 1 1 0 1 1 0 1 0
Other financial expenses –13 –12 –13 –13 –14 –12 –9 –13 –18
Net financial items –17 20 22 –24 32 –89 4 –20 –30
Profit before tax 122 127 143 63 137 60 213 175 129
Income tax –26 –21 – 60 –17 –29 –16 – 41 – 45 –32
Profit for the period 96 106 83 46 108 44 172 130 97
Profit for the period attributable to:
Owners of the Parent Company 96 106 83 46 108 44 172 130 97
Key figures
Profit
Depreciation, amortisation and impairment – 64 – 65 –72 –77 – 68 –71 –74 –75 –77
Operating profit, adjusted 140 111 123 130 110 152 216 200 161
EBITDA, adjusted 204 176 196 195 178 223 290 275 238
EBITDA 203 172 193 164 173 220 283 270 236
Operating profit margin, adjusted % 9.9 7.9 8.4 8.8 8.9 10.0 12.5 12.3 10.2
Operating profit margin (EBIT margin), % 9.8 7.7 8.3 5.9 8.5 9.8 12.1 12.0 10.0
Earnings per share, SEK
Basic and diluted1 0.33 0.37 0.29 0.16 0.38 0.15 0.60 0.45 0.34
Segments
Branded packaged products
Net sales 1,097 1,101 1,179 1,178 1,052 1,118 1,261 1,187 1,130
Operating profit, adjusted 136 135 171 154 169 175 207 189 167
Operating profit margin, adjusted % 12.4 12.3 14.5 13.1 16.1 15.7 16.4 15.9 14.8
Pick & mix
Net sales 323 297 287 296 185 400 461 442 453
Operating profit, adjusted 4 –24 – 48 –24 – 59 –23 9 11 – 6
Operating profit margin, adjusted % 1.2 – 8.1 –16.7 – 8.1 –31.9 – 5.8 2.0 2.5 –1.3
Financial position
Share price, last paid, SEK 25.54 25.56 24.52 26.00 23.72 23.52 31.70 28.26 30.20
Return on equity, % (Rolling 12 months) 7.7 7.8 6.7 8.4 10.5 10.0 11.9 11.8 12.3
Equity per share, SEK 14.9 15.3 14.5 15.2 15.0 15.4 14.5 14.2 13.7
Net Debt/EBITDA, x (Rolling 12 months) 2.8 2.8 2.7 2.6 2.6 2.4 2.2 2.5 2.7
Cash flow
Free cash flow 102 11 252 252 –118 –20 269 199 – 41
Cash flow from operating activities per share, SEK
0.6 0.2 1.1 1.1 – 0.1 0.2 1.1 0.9 – 0.0
1 Cloetta entered into forward contracts to repurchase own shares to fulfill its future obligation to deliver the shares to the participants of the long-term share-based incentive plan. The contract has been settled at the end of the reporting period.
20 F i n a n c i a l s t a t e m e n t s
Q2 F i n a n C i a l S tat e m e n t SCloetta Interim Report Q2 2021
W o r d s f r o m t h e p r e s i d e n t
O v e r v i e w F i n a n c i a l o v e r v i e w
Sustain ability D i s c l o s u r e s D e f i n i t i o n s C o n t a c t
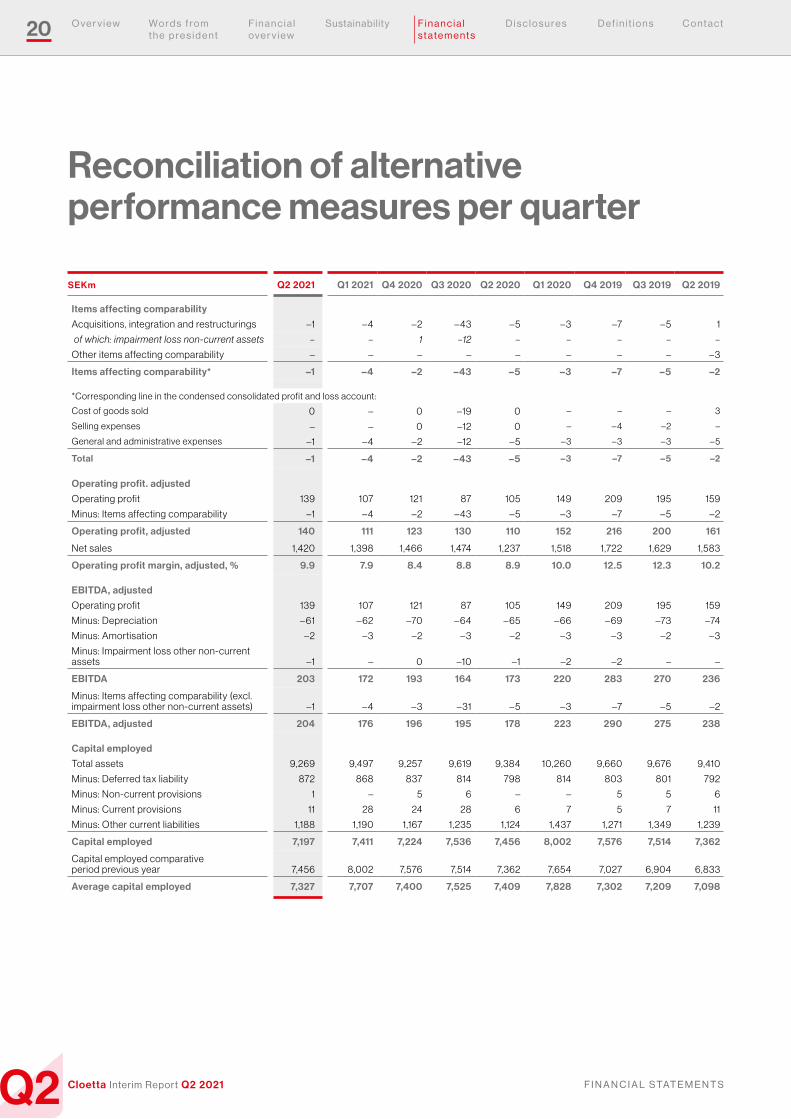
Reconciliation of alternative performance measures per quarter
SEKm Q2 2021 Q1 2021 Q4 2020 Q3 2020 Q2 2020 Q1 2020 Q4 2019 Q3 2019 Q2 2019
Items affecting comparability
Acquisitions, integration and restructurings –1 – 4 –2 – 43 – 5 –3 –7 – 5 1
of which: impairment loss non-current assets – – 1 –12 – – – – –
Other items affecting comparability – – – – – – – – –3
Items affecting comparability* –1 –4 –2 –43 –5 –3 –7 –5 –2
*Corresponding line in the condensed consolidated profit and loss account:
Cost of goods sold 0 – 0 –19 0 – – – 3
Selling expenses – – 0 –12 0 – – 4 –2 –
General and administrative expenses –1 – 4 –2 –12 – 5 –3 –3 –3 – 5
Total –1 –4 –2 –43 –5 –3 –7 –5 –2
Operating profit. adjusted
Operating profit 139 107 121 87 105 149 209 195 159
Minus: Items affecting comparability –1 – 4 –2 – 43 – 5 –3 –7 – 5 –2
Operating profit, adjusted 140 111 123 130 110 152 216 200 161
Net sales 1,420 1,398 1,466 1,474 1,237 1,518 1,722 1,629 1,583
Operating profit margin, adjusted, % 9.9 7.9 8.4 8.8 8.9 10.0 12.5 12.3 10.2
EBITDA, adjusted
Operating profit 139 107 121 87 105 149 209 195 159
Minus: Depreciation – 61 – 62 –70 – 64 – 65 – 66 – 69 –73 –74
Minus: Amortisation –2 –3 –2 –3 –2 –3 –3 –2 –3
Minus: Impairment loss other non-current assets –1 – 0 –10 –1 –2 –2 – –
EBITDA 203 172 193 164 173 220 283 270 236
Minus: Items affecting comparability (excl. impairment loss other non-current assets) –1 – 4 –3 –31 – 5 –3 –7 – 5 –2
EBITDA, adjusted 204 176 196 195 178 223 290 275 238
Capital employed
Total assets 9,269 9,497 9,257 9,619 9,384 10,260 9,660 9,676 9,410
Minus: Deferred tax liability 872 868 837 814 798 814 803 801 792
Minus: Non-current provisions 1 – 5 6 – – 5 5 6
Minus: Current provisions 11 28 24 28 6 7 5 7 11
Minus: Other current liabilities 1,188 1,190 1,167 1,235 1,124 1,437 1,271 1,349 1,239
Capital employed 7,197 7,411 7,224 7,536 7,456 8,002 7,576 7,514 7,362
Capital employed comparative period previous year 7,456 8,002 7,576 7,514 7,362 7,654 7,027 6,904 6,833
Average capital employed 7,327 7,707 7,400 7,525 7,409 7,828 7,302 7,209 7,098
21 F i n a n c i a l s t a t e m e n t s
Q2 F i n a n C i a l S tat e m e n t SCloetta Interim Report Q2 2021
W o r d s f r o m t h e p r e s i d e n t
O v e r v i e w F i n a n c i a l o v e r v i e w
Sustain ability D i s c l o s u r e s D e f i n i t i o n s C o n t a c t
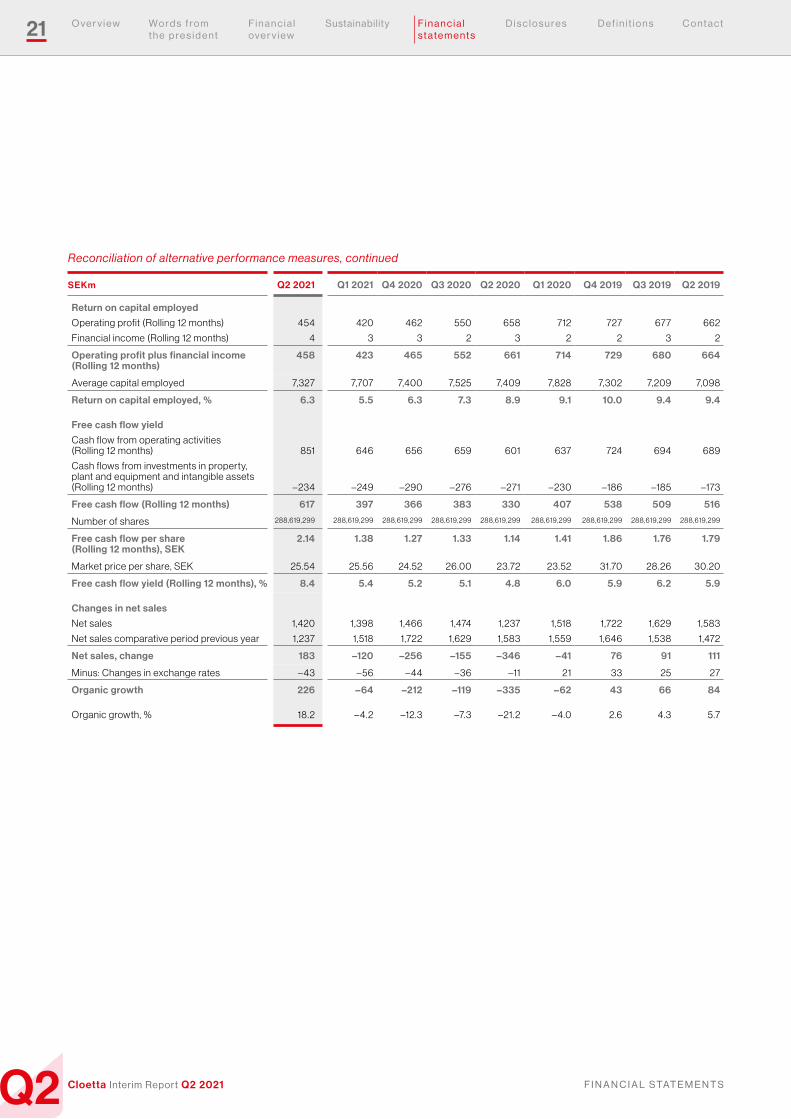
SEKm Q2 2021 Q1 2021 Q4 2020 Q3 2020 Q2 2020 Q1 2020 Q4 2019 Q3 2019 Q2 2019
Return on capital employed
Operating profit (Rolling 12 months) 454 420 462 550 658 712 727 677 662
Financial income (Rolling 12 months) 4 3 3 2 3 2 2 3 2
Operating profit plus financial income (Rolling 12 months)
458 423 465 552 661 714 729 680 664
Average capital employed 7,327 7,707 7,400 7,525 7,409 7,828 7,302 7,209 7,098
Return on capital employed, % 6.3 5.5 6.3 7.3 8.9 9.1 10.0 9.4 9.4
Free cash flow yield
Cash flow from operating activities (Rolling 12 months) 851 646 656 659 601 637 724 694 689
Cash flows from investments in property, plant and equipment and intangible assets (Rolling 12 months) –234 –249 –290 –276 –271 –230 –186 –185 –173
Free cash flow (Rolling 12 months) 617 397 366 383 330 407 538 509 516
Number of shares 288,619,299 288,619,299 288,619,299 288,619,299 288,619,299 288,619,299 288,619,299 288,619,299 288,619,299
Free cash flow per share (Rolling 12 months), SEK
2.14 1.38 1.27 1.33 1.14 1.41 1.86 1.76 1.79
Market price per share, SEK 25.54 25.56 24.52 26.00 23.72 23.52 31.70 28.26 30.20
Free cash flow yield (Rolling 12 months), % 8.4 5.4 5.2 5.1 4.8 6.0 5.9 6.2 5.9
Changes in net sales
Net sales 1,420 1,398 1,466 1,474 1,237 1,518 1,722 1,629 1,583
Net sales comparative period previous year 1,237 1,518 1,722 1,629 1,583 1,559 1,646 1,538 1,472
Net sales, change 183 –120 –256 –155 –346 –41 76 91 111
Minus: Changes in exchange rates – 43 – 56 – 44 –36 –11 21 33 25 27
Organic growth 226 –64 –212 –119 –335 –62 43 66 84
Organic growth, % 18.2 – 4.2 –12.3 –7.3 –21.2 – 4.0 2.6 4.3 5.7
Reconciliation of alternative performance measures, continued
22 F i n a n c i a l s t a t e m e n t s
Q2 F i n a n C i a l S tat e m e n t SCloetta Interim Report Q2 2021
W o r d s f r o m t h e p r e s i d e n t
O v e r v i e w F i n a n c i a l o v e r v i e w
Sustain ability D i s c l o s u r e s D e f i n i t i o n s C o n t a c t
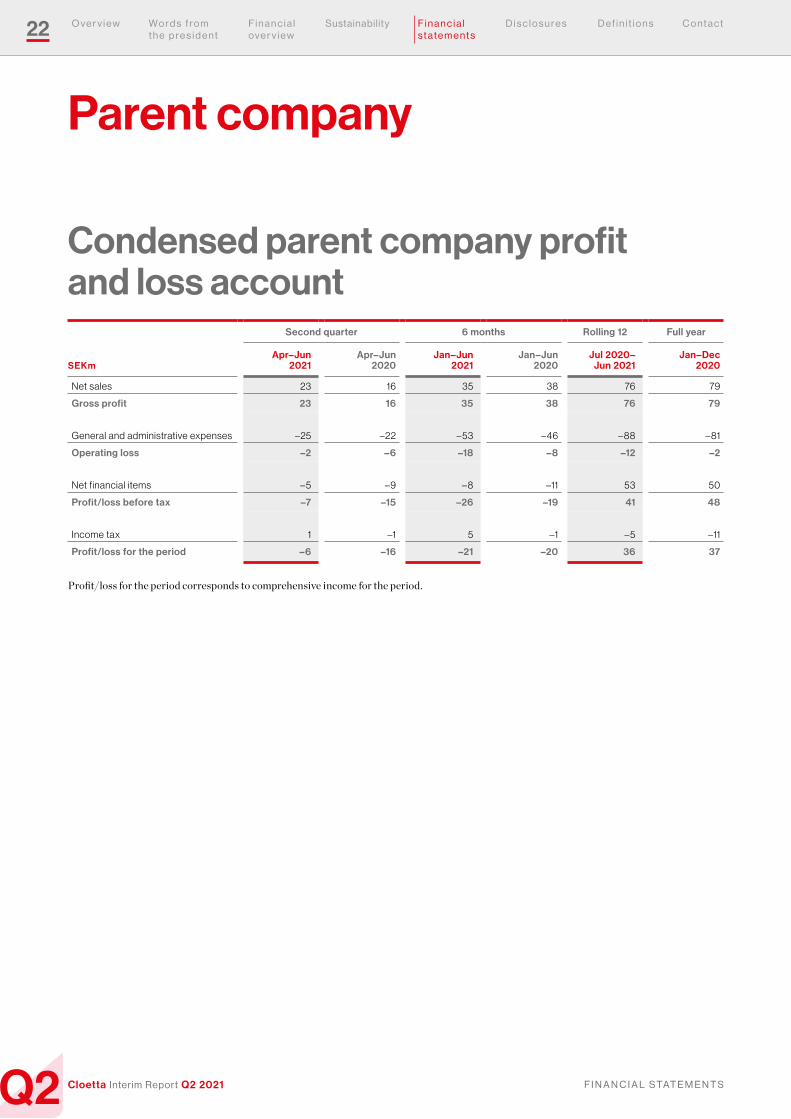
Condensed parent company profit and loss account
Second quarter 6 months Rolling 12 Full year
SEKmApr–Jun
2021Apr–Jun
2020Jan–Jun
2021Jan–Jun
2020Jul 2020–
Jun 2021Jan–Dec
2020
Net sales 23 16 35 38 76 79
Gross profit 23 16 35 38 76 79
General and administrative expenses –25 –22 – 53 – 46 – 88 – 81
Operating loss –2 –6 –18 –8 –12 –2
Net financial items – 5 –9 – 8 –11 53 50
Profit/loss before tax –7 –15 –26 –19 41 48
Income tax 1 –1 5 –1 – 5 –11
Profit/loss for the period –6 –16 –21 –20 36 37
Profit/loss for the period corresponds to comprehensive income for the period.
Parent company
23 F i n a n c i a l s t a t e m e n t s
Q2 F i n a n C i a l S tat e m e n t SCloetta Interim Report Q2 2021
W o r d s f r o m t h e p r e s i d e n t
O v e r v i e w F i n a n c i a l o v e r v i e w
Sustain ability D i s c l o s u r e s D e f i n i t i o n s C o n t a c t
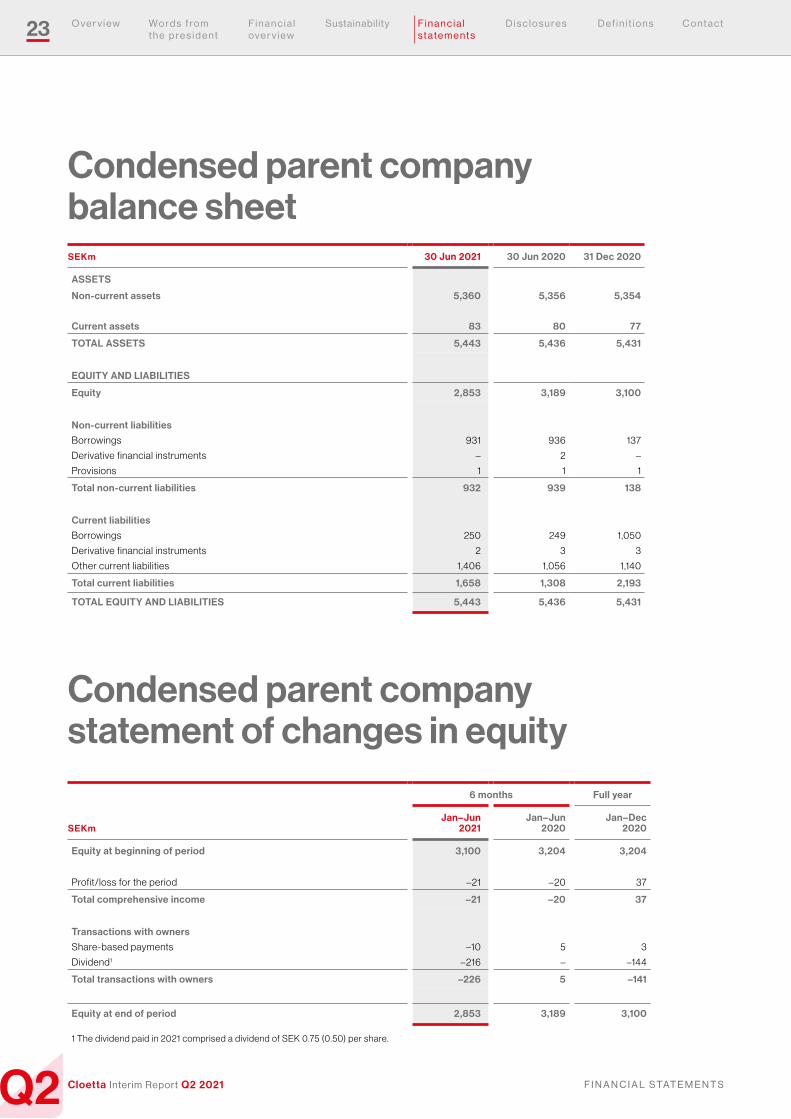
Condensed parent company balance sheetSEKm 30 Jun 2021 30 Jun 2020 31 Dec 2020
ASSETS
Non-current assets 5,360 5,356 5,354
Current assets 83 80 77
TOTAL ASSETS 5,443 5,436 5,431
EQUITY AND LIABILITIES
Equity 2,853 3,189 3,100
Non-current liabilities
Borrowings 931 936 137
Derivative financial instruments – 2 –
Provisions 1 1 1
Total non-current liabilities 932 939 138
Current liabilities
Borrowings 250 249 1,050
Derivative financial instruments 2 3 3
Other current liabilities 1,406 1,056 1,140
Total current liabilities 1,658 1,308 2,193
TOTAL EQUITY AND LIABILITIES 5,443 5,436 5,431
Condensed parent company statement of changes in equity
6 months Full year
SEKmJan–Jun
2021Jan–Jun
2020Jan–Dec
2020
Equity at beginning of period 3,100 3,204 3,204
Profit/loss for the period –21 –20 37
Total comprehensive income –21 –20 37
Transactions with owners
Share-based payments –10 5 3
Dividend1 –216 – –144
Total transactions with owners –226 5 –141
Equity at end of period 2,853 3,189 3,100
1 The dividend paid in 2021 comprised a dividend of SEK 0.75 (0.50) per share.
24 D i s c l o s u r e s
Q2 a C C O u n t i n g a n D v a l u at i O n P O l i C i e S , D i S C l O S u r e S a n D r i S k Fa C t O r SCloetta Interim Report Q2 2021
W o r d s f r o m t h e p r e s i d e n t
O v e r v i e w F i n a n c i a l o v e r v i e w
Sustain ability F i n a n c i a l s t a t e m e n t s
D e f i n i t i o n s C o n t a c t
Accounting and valuation policies, disclosures and risk factors
Accounting and valuation policies Compliance with legislation and accounting standardsThe consolidated financial statements are presented in accordance with the International Financial Reporting Standards (IFRS) estab-lished by the International Accounting Standards Board (IASB) and the interpretations issued by the IFRS Interpretations Committee (IFRIC) which have been endorsed by the European Commission for application in the EU. The applied standards and interpretations are those that were in force and had been endorsed by the EU at 1 January, 2021. The consolidated interim report is presented compliant with IAS 34, Interim Financial Reporting, and in compliance with the rel-evant provisions in the Swedish Annual Accounts Act and the Swedish Securities Market Act. The interim report for the Parent Company has been prepared in accordance with the Swedish Annual Accounts Act and the Swedish Securities Market Act, which are consistent with the provisions in recommendation RFR 2, Accounting for Legal Entities. For lease accounting the company makes use of the exemption under RFR2 to treat all leases as operating lease.
Basis of accountingThe same accounting policies and methods of computation are applied in the interim financial statements as in the most recent annual financial statements except for the changes in segment reporting as described below. Reference is made to Note 1 ‘General information and accounting and valuation policies of the Group’ and Note 31 ‘Changes in accounting policies’ in the annual and sustainability report 2020 at www.cloetta.com. No new standards are effective as from 1 January 2021 which have been endorsed by the EU.
DisclosuresSegment reportingIn the years after the acquisition of the Candyking Group in 2017, the Pick & mix business became a significant part of Cloetta’s total business with its own focus, operational organisation, management responsibilities and reporting flows. Following the changes in the business, also the management structure of the Group evolved with the introduction of a Chief Pick & mix Officer (CPMO) responsible for the
development of the Pick & mix business and a Chief Marketing Officer (CMO) being responsible for the marketing of the Branded packaged business. Both officers are members of the executive committee and are accountable within their own business lines and report directly to the President and CEO.
In Q1 2021, Cloetta has reassessed the operating segments with an increased focus on the impact of the changes in the organisation as indicated above. The reassessment has been performed with the intention to come to a sustainable structure taking into account the current organisation, operating model and initiated initiatives related to the direction of the company.
In the assessment it has been considered that both the Branded packaged business and the Pick & mix business have their own specific characteristics. Both business lines generate their own external revenues and incur expenses and for both business lines a different company wide business and investment strategy has been developed and is in place.
The character of the more profitable Branded packaged business requires investments in the brands (A&P) with consumer visibility (traditional- and social media) to generate long term strength of our own brands, leading to value creation for the company. Cloetta manu-factures nearly all products sold in this business in its own production facilities.
The much lower margin Pick & mix business is predominantly a wholesale business where Cloetta sells its own products and its competitors’ products to retailers under their own private brand or under the CandyKing concept. The Pick & mix business is driven by volumes and requires investments in the pick & mix concept including investments in the fixtures in which the products are offered to the consumer.
Operating segments have been identified in accordance with the guidance provided in IFRS 8 paragraph 5–10.
The overall focus on revenues, profitability, and strategy specif-ically for the Branded packaged products business versus the Pick & mix business is reflected as such in Cloetta’s external financial report-ing and this split is aligned with the interest of Cloetta’s investors.
25 D i s c l o s u r e s
Q2 a C C O u n t i n g a n D v a l u at i O n P O l i C i e S , D i S C l O S u r e S a n D r i S k Fa C t O r SCloetta Interim Report Q2 2021
W o r d s f r o m t h e p r e s i d e n t
O v e r v i e w F i n a n c i a l o v e r v i e w
Sustain ability F i n a n c i a l s t a t e m e n t s
D e f i n i t i o n s C o n t a c t
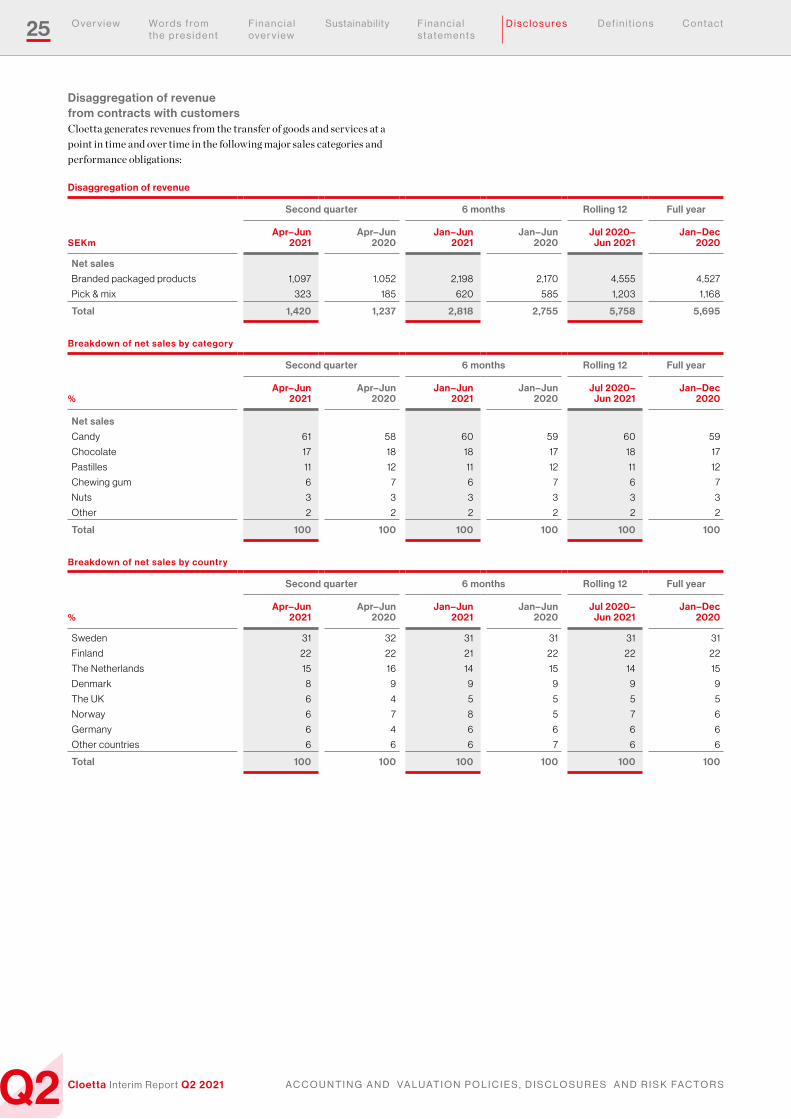
Disaggregation of revenue from contracts with customersCloetta generates revenues from the transfer of goods and services at a point in time and over time in the following major sales categories and performance obligations:
Disaggregation of revenue
Second quarter 6 months Rolling 12 Full year
SEKmApr–Jun
2021Apr–Jun
2020Jan–Jun
2021Jan–Jun
2020Jul 2020–
Jun 2021Jan–Dec
2020
Net sales
Branded packaged products 1,097 1,052 2,198 2,170 4,555 4,527
Pick & mix 323 185 620 585 1,203 1,168
Total 1,420 1,237 2,818 2,755 5,758 5,695
Breakdown of net sales by category
Second quarter 6 months Rolling 12 Full year
%Apr–Jun
2021Apr–Jun
2020Jan–Jun
2021Jan–Jun
2020Jul 2020–
Jun 2021Jan–Dec
2020
Net sales
Candy 61 58 60 59 60 59
Chocolate 17 18 18 17 18 17
Pastilles 11 12 11 12 11 12
Chewing gum 6 7 6 7 6 7
Nuts 3 3 3 3 3 3
Other 2 2 2 2 2 2
Total 100 100 100 100 100 100
Breakdown of net sales by country
Second quarter 6 months Rolling 12 Full year
%Apr–Jun
2021Apr–Jun
2020Jan–Jun
2021Jan–Jun
2020Jul 2020–
Jun 2021Jan–Dec
2020
Sweden 31 32 31 31 31 31
Finland 22 22 21 22 22 22
The Netherlands 15 16 14 15 14 15
Denmark 8 9 9 9 9 9
The UK 6 4 5 5 5 5
Norway 6 7 8 5 7 6
Germany 6 4 6 6 6 6
Other countries 6 6 6 7 6 6
Total 100 100 100 100 100 100
26 D i s c l o s u r e s
Q2 a C C O u n t i n g a n D v a l u at i O n P O l i C i e S , D i S C l O S u r e S a n D r i S k Fa C t O r SCloetta Interim Report Q2 2021
W o r d s f r o m t h e p r e s i d e n t
O v e r v i e w F i n a n c i a l o v e r v i e w
Sustain ability F i n a n c i a l s t a t e m e n t s
D e f i n i t i o n s C o n t a c t
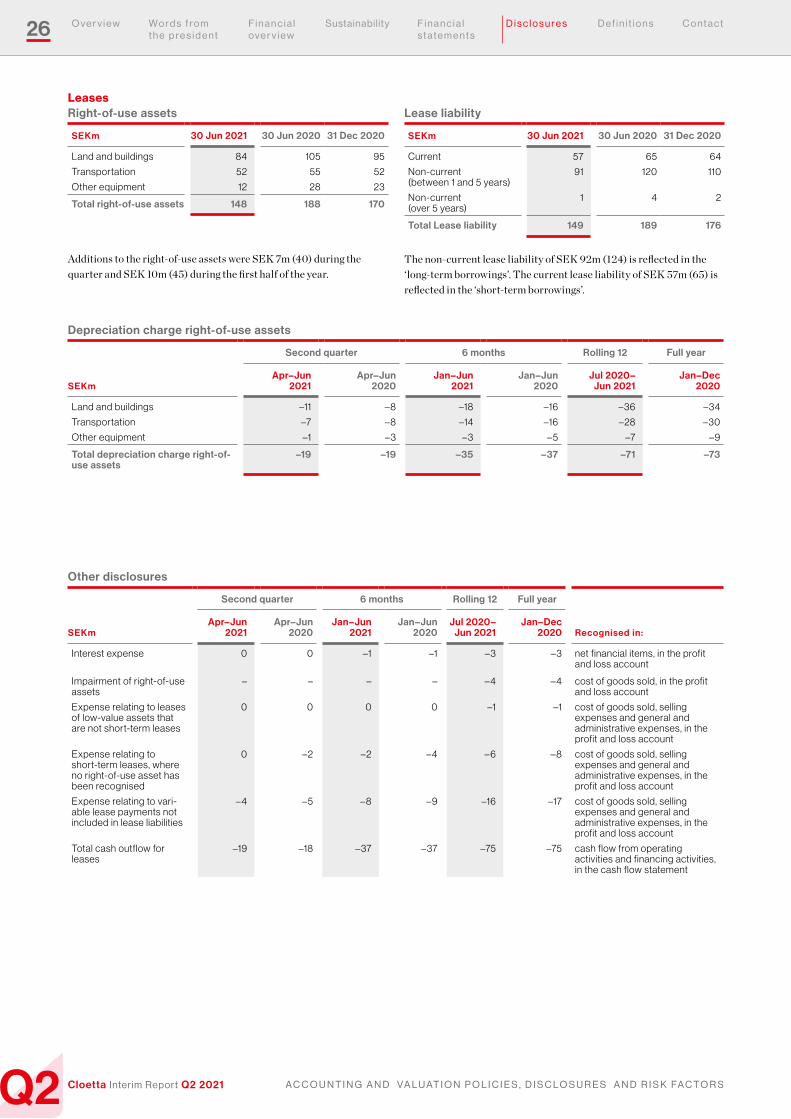
Depreciation charge right-of-use assets
Second quarter 6 months Rolling 12 Full year
SEKmApr–Jun
2021Apr–Jun
2020Jan–Jun
2021Jan–Jun
2020Jul 2020–
Jun 2021Jan–Dec
2020
Land and buildings –11 – 8 –18 –16 –36 –34
Transportation –7 – 8 –14 –16 –28 –30
Other equipment –1 –3 –3 – 5 –7 –9
Total depreciation charge right-of-use assets
–19 –19 –35 –37 –71 –73
Other disclosures
Second quarter 6 months Rolling 12 Full year
SEKmApr–Jun
2021Apr–Jun
2020Jan–Jun
2021Jan–Jun
2020Jul 2020–
Jun 2021Jan–Dec
2020 Recognised in:
Interest expense 0 0 –1 –1 –3 –3 net financial items, in the profit and loss account
Impairment of right-of-use assets
– – – – – 4 – 4 cost of goods sold, in the profit and loss account
Expense relating to leases of low-value assets that are not short-term leases
0 0 0 0 –1 –1 cost of goods sold, selling expenses and general and administrative expenses, in the profit and loss account
Expense relating to short-term leases, where no right-of-use asset has been recognised
0 –2 –2 – 4 – 6 – 8 cost of goods sold, selling expenses and general and administrative expenses, in the profit and loss account
Expense relating to vari-able lease payments not included in lease liabilities
– 4 – 5 – 8 –9 –16 –17 cost of goods sold, selling expenses and general and administrative expenses, in the profit and loss account
Total cash outflow for leases
–19 –18 –37 –37 –75 –75 cash flow from operating activities and financing activities, in the cash flow statement
LeasesRight-of-use assets
SEKm 30 Jun 2021 30 Jun 2020 31 Dec 2020
Land and buildings 84 105 95
Transportation 52 55 52
Other equipment 12 28 23
Total right-of-use assets 148 188 170
Additions to the right-of-use assets were SEK 7m (40) during the quarter and SEK 10m (45) during the first half of the year.
Lease liability
SEKm 30 Jun 2021 30 Jun 2020 31 Dec 2020
Current 57 65 64
Non-current (between 1 and 5 years)
91 120 110
Non-current (over 5 years)
1 4 2
Total Lease liability 149 189 176
The non-current lease liability of SEK 92m (124) is reflected in the ‘long-term borrowings’. The current lease liability of SEK 57m (65) is reflected in the ‘short-term borrowings’.
27 D i s c l o s u r e s
Q2 a C C O u n t i n g a n D v a l u at i O n P O l i C i e S , D i S C l O S u r e S a n D r i S k Fa C t O r SCloetta Interim Report Q2 2021
W o r d s f r o m t h e p r e s i d e n t
O v e r v i e w F i n a n c i a l o v e r v i e w
Sustain ability F i n a n c i a l s t a t e m e n t s
D e f i n i t i o n s C o n t a c t
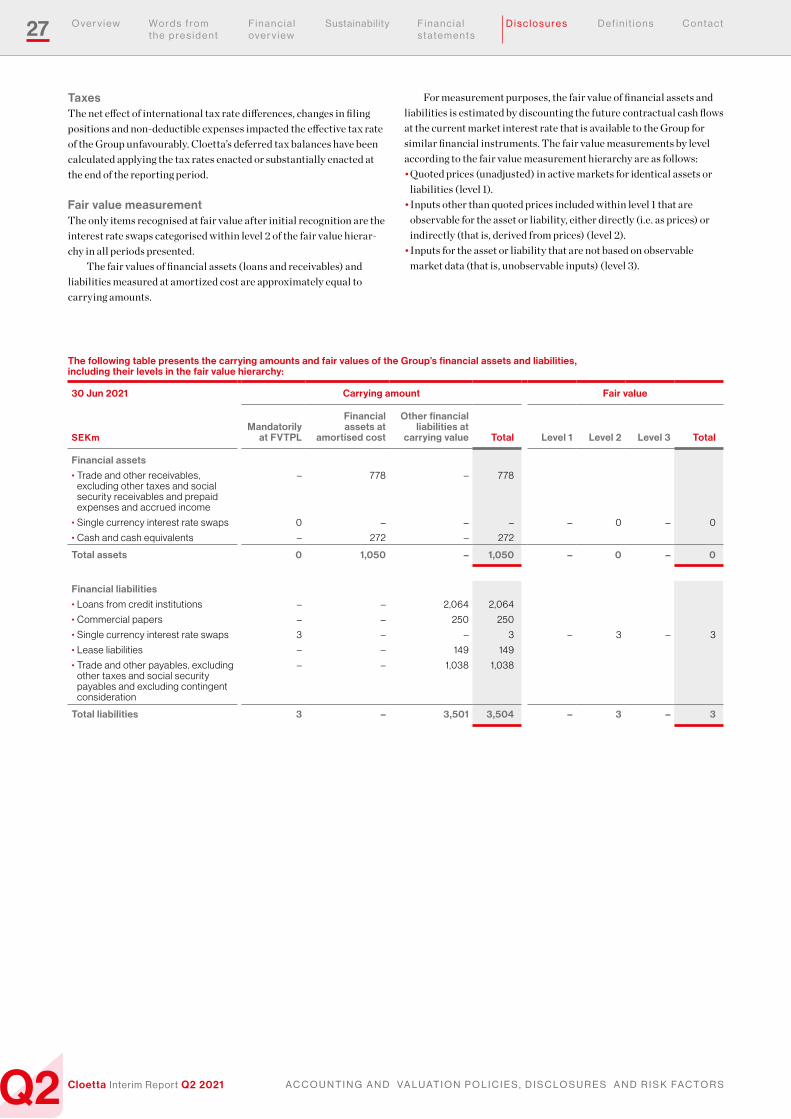
TaxesThe net effect of international tax rate differences, changes in filing positions and non-deductible expenses impacted the effective tax rate of the Group unfavourably. Cloetta’s deferred tax balances have been calculated applying the tax rates enacted or substantially enacted at the end of the reporting period.
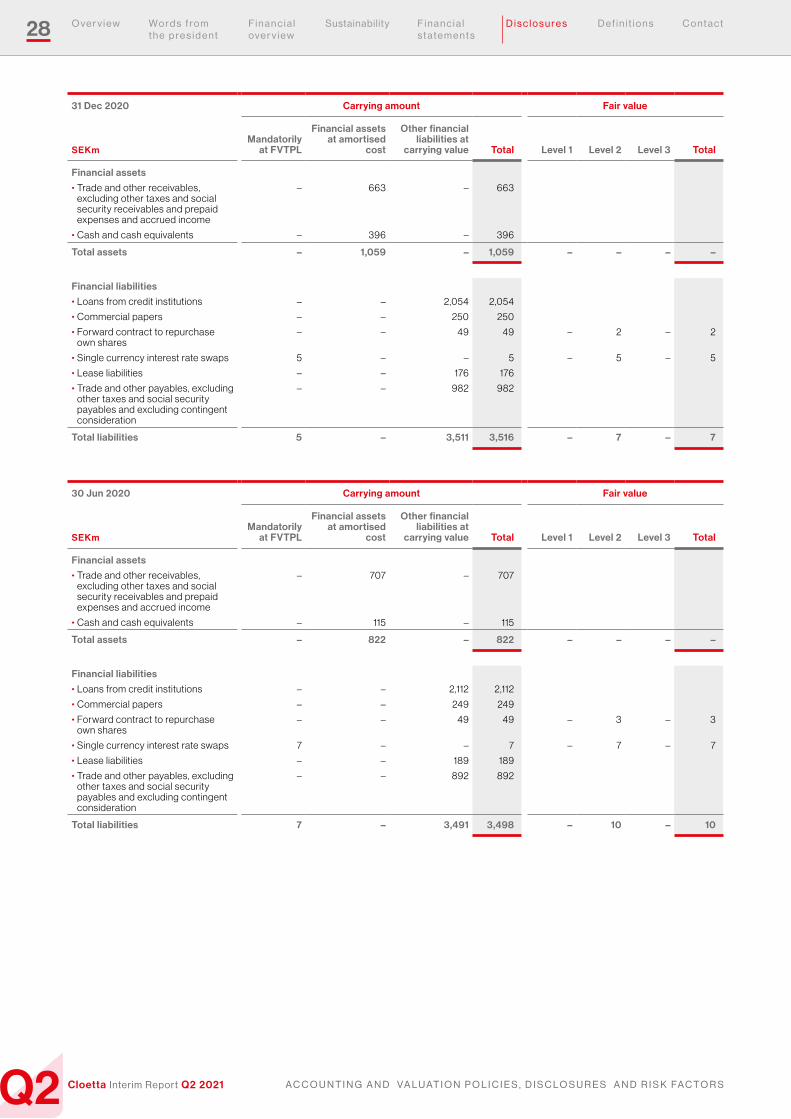
Fair value measurementThe only items recognised at fair value after initial recognition are the interest rate swaps categorised within level 2 of the fair value hierar-chy in all periods presented.
The fair values of financial assets (loans and receivables) and liabilities measured at amortized cost are approximately equal to carrying amounts.
For measurement purposes, the fair value of financial assets and liabilities is estimated by discounting the future contractual cash flows at the current market interest rate that is available to the Group for similar financial instruments. The fair value measurements by level according to the fair value measurement hierarchy are as follows:• Quoted prices (unadjusted) in active markets for identical assets or
liabilities (level 1).• Inputs other than quoted prices included within level 1 that are
observable for the asset or liability, either directly (i.e. as prices) or indirectly (that is, derived from prices) (level 2).
• Inputs for the asset or liability that are not based on observable market data (that is, unobservable inputs) (level 3).
The following table presents the carrying amounts and fair values of the Group’s financial assets and liabilities, including their levels in the fair value hierarchy:
30 Jun 2021 Carrying amount Fair value
SEKmMandatorily
at FVTPL
Financial assets at
amortised cost
Other financial liabilities at
carrying value Total Level 1 Level 2 Level 3 Total
Financial assets
• Trade and other receivables, excluding other taxes and social security receivables and prepaid expenses and accrued income
– 778 – 778
• Single currency interest rate swaps 0 – – – – 0 – 0
• Cash and cash equivalents – 272 – 272
Total assets 0 1,050 – 1,050 – 0 – 0
Financial liabilities
• Loans from credit institutions – – 2,064 2,064
• Commercial papers – – 250 250
• Single currency interest rate swaps 3 – – 3 – 3 – 3
• Lease liabilities – – 149 149
• Trade and other payables, excluding other taxes and social security payables and excluding contingent consideration
– – 1,038 1,038
Total liabilities 3 – 3,501 3,504 – 3 – 3
28 D i s c l o s u r e s
Q2 a C C O u n t i n g a n D v a l u at i O n P O l i C i e S , D i S C l O S u r e S a n D r i S k Fa C t O r SCloetta Interim Report Q2 2021
W o r d s f r o m t h e p r e s i d e n t
O v e r v i e w F i n a n c i a l o v e r v i e w
Sustain ability F i n a n c i a l s t a t e m e n t s
D e f i n i t i o n s C o n t a c t
31 Dec 2020 Carrying amount Fair value
SEKmMandatorily
at FVTPL
Financial assets at amortised
cost
Other financial liabilities at
carrying value Total Level 1 Level 2 Level 3 Total
Financial assets
• Trade and other receivables, excluding other taxes and social security receivables and prepaid expenses and accrued income
– 663 – 663
• Cash and cash equivalents – 396 – 396
Total assets – 1,059 – 1,059 – – – –
Financial liabilities
• Loans from credit institutions – – 2,054 2,054
• Commercial papers – – 250 250
• Forward contract to repurchase own shares
– – 49 49 – 2 – 2
• Single currency interest rate swaps 5 – – 5 – 5 – 5
• Lease liabilities – – 176 176
• Trade and other payables, excluding other taxes and social security payables and excluding contingent consideration
– – 982 982
Total liabilities 5 – 3,511 3,516 – 7 – 7
30 Jun 2020 Carrying amount Fair value
SEKmMandatorily
at FVTPL
Financial assets at amortised
cost
Other financial liabilities at
carrying value Total Level 1 Level 2 Level 3 Total
Financial assets
• Trade and other receivables, excluding other taxes and social security receivables and prepaid expenses and accrued income
– 707 – 707
• Cash and cash equivalents – 115 – 115
Total assets – 822 – 822 – – – –
Financial liabilities
• Loans from credit institutions – – 2,112 2,112
• Commercial papers – – 249 249
• Forward contract to repurchase own shares
– – 49 49 – 3 – 3
• Single currency interest rate swaps 7 – – 7 – 7 – 7
• Lease liabilities – – 189 189
• Trade and other payables, excluding other taxes and social security payables and excluding contingent consideration
– – 892 892
Total liabilities 7 – 3,491 3,498 – 10 – 10
29 D i s c l o s u r e s
Q2 a C C O u n t i n g a n D v a l u at i O n P O l i C i e S , D i S C l O S u r e S a n D r i S k Fa C t O r SCloetta Interim Report Q2 2021
W o r d s f r o m t h e p r e s i d e n t
O v e r v i e w F i n a n c i a l o v e r v i e w
Sustain ability F i n a n c i a l s t a t e m e n t s
D e f i n i t i o n s C o n t a c t
No transfers between fair value hierarchy levels has occurred during the financial year or the prior financial year. The fair value of financial instruments that are not traded in an active market (for example, over-the-counter derivatives) is determined by using valuation techniques. These valuation techniques maximise the use of observable market data where it is available and rely as little as possible on entity-specific estimates. If all significant inputs required to determine the fair value of an instrument are observable, the instrument is included within level 2.
The valuation of the instruments is based on quoted market prices, but the underlying swap amounts are based on the specific require-ments of the Group. These instruments are therefore included within level 2. The valuation techniques and inputs used to value financial instruments are:• Quoted market prices or dealer quotes for similar instruments.• The fair value of interest rate swaps is calculated as the present value
of the estimated future cash flows based on observable yield curves.• The fair value of forward foreign currency contracts is calculated
using the difference between the exchange rate on the spot date with the contractually agreed upon exchange rates.
• Other techniques, such as discounted cash flow analysis, are used to determine the fair value of the remaining financial instruments.
Parent CompanyCloetta AB’s primary activities include head office functions such as group-wide management and administration. The comments below refer to the period from 1 January to 30 June 2021. Net sales in the Parent Company amounted to SEK 35m (38) and relate mainly to intra-group services. Operating loss was SEK –18m (–8). Net financial items totaled SEK –8m (–11). Loss before tax was SEK –26m (–19) and loss for the period was SEK –21m (–20). Cash and cash equivalents and short-term investments amounted to SEK 0m (0).
The Cloetta shareCloetta’s class B share is listed on Nasdaq Stockholm, Mid Cap. Dur-ing the period from 1 January to 30 June 2021, a total of 116,034,632 shares were traded for a combined value of SEK 2,900m, equivalent to around 41 per cent of the total number of class B shares at the end of the period. The highest quoted bid price during the period from 1 January to 30 June 2021 was SEK 27.52 (21 May) and the lowest was SEK 22.02 (28 January). The share price on 30 June 2021 was SEK 25.54 (last price paid). During the period from 1 January to 30 June 2021, the Cloetta share increased by 4.2 per cent while the Nasdaq OMX Stockholm PI index increased by 19.3 per cent. Cloetta’s share capital at 30 June 2021 amounted to 1,443,096,495. The total number of shares is 288,619,299, consisting of 5,735,249 (5,735,249) class A shares and 282,884,050 (282,884,050) class B shares, equal to a quota value of SEK 5 per share.
ShareholdersOn 30 June 2021, Cloetta AB had 36,234 shareholders. The largest shareholder was AB Malfors Promotor with a holding corresponding to 39,8 per cent of the votes and 29,1 per cent of the share capital in the company. La Financière de l’Echiquier was the second largestshareholder with 2.8 per cent of the votes and 3.3 per cent of the share capital. The third largest shareholder was Dimensional Fund Advisors with 2.6 per cent of the votes and 3.0 per cent of the share capital.
Risk factorsCloetta is an internationally active company that is exposed to a number of market and financial risks. All identified risks are moni-tored continuously and, if needed, risk mitigating measures are taken to limit their impact. The most relevant risk factors are described in the annual and sustainability report 2020 and consist of industry and market-related risks, operational risks and financial risks.
Compared to the annual and sustainability report which was is-sued on 15 March 2021, the risk-profile of Cloetta has not significantly changed although the ongoing Covid-19-pandemic continues to affect the business performance of Cloetta.

Q2 D e F i n i t i O n S
30
Cloetta Interim Report Q2 2021
W o r d s f r o m t h e p r e s i d e n t
O v e r v i e w F i n a n c i a l o v e r v i e w
Sustain ability F i n a n c i a l s t a t e m e n t s
D i s c l o s u r e s D e f i n i t i o n s C o n t a c tD e f i n i t i o n s
Definitions
General All amounts in the tables are presented in SEK millions unless otherwise stated. All amounts in brackets () represent comparative figures for the same period of the prior year, unless otherwise stated.
Margins Definition/calculation Purpose
Gross margin Net sales less cost of goods sold as a percentage of net sales.
Gross margin measures production profitability.
Operating profit margin, adjusted
Operating profit, adjusted for items affecting comparability, as a percentage of net sales.
Adjusted operating profit margin excludes the impact of items affecting comparability, enabling a comparison of operational profitability.
Operating profit margin (EBIT margin)
Operating profit expressed as a percentage of net sales. Operating profit margin is used for measuring the operational profitability.
Profit margin Profit/loss before tax expressed as a percentage of net sales.
This metric enables the profitability to be compared across locations where corporate taxes differ.
Return Definition/calculation Purpose
Free cash flow Sum of the cash flow from operating activities and cash flow from investments in property, plant and equipment and intangible assets.
The free cash flow is the cash flow available to all investors consisting of shareholders and lenders.
Free cash flow yield Free cash flow of the last 12 months divided by the number of shares at the end of the period and consequently divided by the market price per share at the end of the period.
This metric is an indicator for the return on investment of investors in the company.
Return on capital employed Operating profit plus financial income as a percentage of average capital employed. The average capital employed is calculated by taking the capital employed per period end and the capital employed by period end of the comparative period in the previous year divided by two.
Return on capital employed is used to analyse profitabil-ity, based on the amount of capital used. The leverage of the company is the reason that this metric is used next to return on equity, because it includes equity, but takes into account borrowings and other liabilities as well.
Return on equity Profit from continuing operations for the period as a per-centage of total equity.
Return on equity is used to measure profit generation, given the resources attributable to the owners of the Parent Company.
Capital structure Definition/calculation Purpose
Capital employed Total assets less interest-free liabilities (including deferred tax).
Capital employed measures the amount of capital used and serves as input for the return on capital employed.
Equity/assets ratio Equity at the end of the period as a percentage of total assets. The equity/assets ratio represents the amount of assets on which shareholders have a residual claim.
This ratio is an indicator of the company’s leverage used to finance the firm.
Gross debt Gross current and non-current borrowings, credit overdraft facilities, lease liabilities, derivative financial instruments and interest payable.
Gross debt represents the total debt obligation of the company irrespective of its maturity.
Net debt Gross debt less cash and cash equivalents. The net debt is used as an indication of the ability to pay off all debts if these became due simultaneously on the day of calculation, using only available cash and cash equivalents.
Net debt/EBITDA Net debt at the end of the period divided by the EBITDA, adjusted, for the last 12 months, taking into consideration the annualisation of EBITDA for acquired or divested companies.
The net debt/EBITDA ratio approximates the company’s ability to decrease its debt. It represents the number of years it would take to pay back debt if net debt and EBITDA were held constant, ignoring the impact of cash flows from interest, tax and capital expenditure.
Net debt/equity ratio Net debt at the end of the period divided by equity at the end of the period.
The net debt/equity ratio measures the extent to which the company is funded by debt. Because cash and overdraft facilities can be used to pay-off debt at short notice, the leverage takes into account net debt instead of gross debt.
Working capital Total inventories and trade and other receivables adjusted for trade and other payables.
Working capital is used to measure the company's abil-ity, besides cash and cash equivalents, to meet current operational obligations.
Data per share Definition/calculation Purpose
Cash flow from operating activities per share
Cash flow from operating activities in the period divided by the average number of shares.
The cash flow from operating activities per share measures the amount of cash the company generates per share from the revenues it brings in, irrespective of the capital investments and cash flows related to the financing structure of the company.
Earnings per share Profit for the period divided by the average number of shares adjusted for the effect of forward contracts to repur-chase own shares.
The earnings per share measures the amount of net profit that is available for payment to shareholders per share.
Equity per share Equity at the end of the period divided by number of shares at the end of the period.
Equity per share measures the net-asset value backing up each share of the company's equity and determines if a company is increasing shareholder value over time.
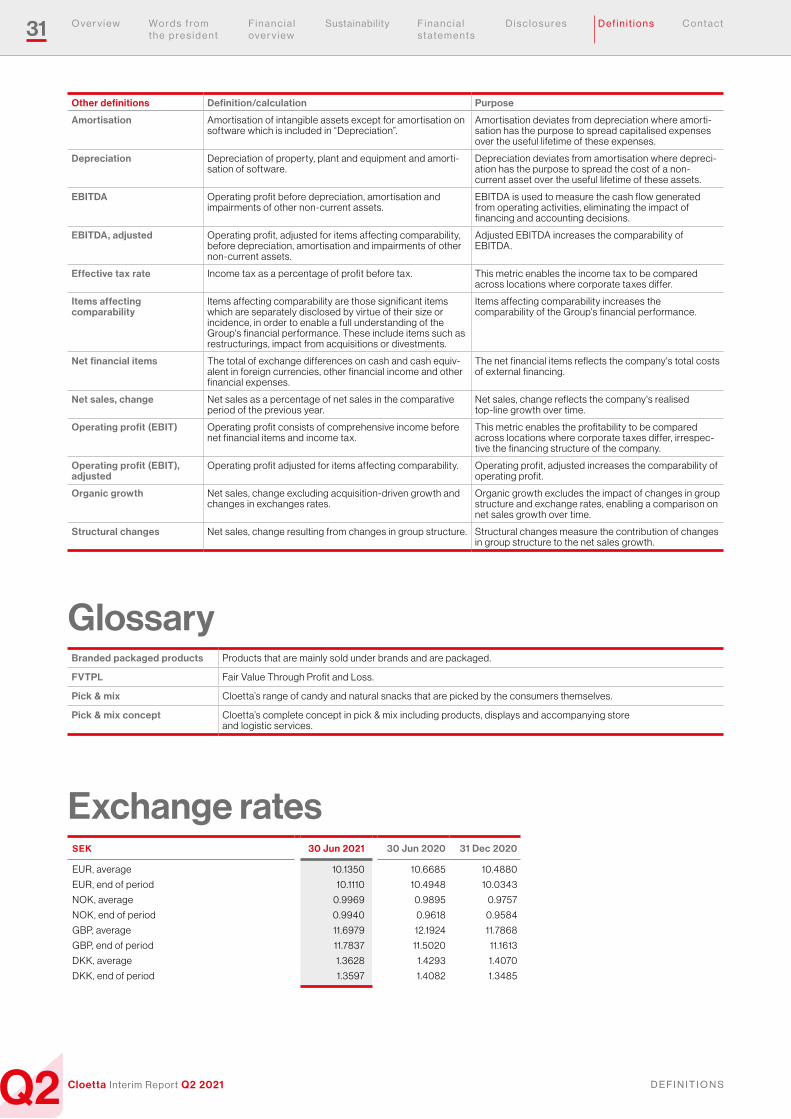
Q2 D e F i n i t i O n S
31
Cloetta Interim Report Q2 2021
W o r d s f r o m t h e p r e s i d e n t
O v e r v i e w F i n a n c i a l o v e r v i e w
Sustain ability F i n a n c i a l s t a t e m e n t s
D i s c l o s u r e s C o n t a c tD e f i n i t i o n s
Other definitions Definition/calculation Purpose
Amortisation Amortisation of intangible assets except for amortisation on software which is included in “Depreciation”.
Amortisation deviates from depreciation where amorti-sation has the purpose to spread capitalised expenses over the useful lifetime of these expenses.
Depreciation Depreciation of property, plant and equipment and amorti-sation of software.
Depreciation deviates from amortisation where depreci-ation has the purpose to spread the cost of a non- current asset over the useful lifetime of these assets.
EBITDA Operating profit before depreciation, amortisation and impairments of other non-current assets.
EBITDA is used to measure the cash flow generated from operating activities, eliminating the impact of financing and accounting decisions.
EBITDA, adjusted Operating profit, adjusted for items affecting comparability, before depreciation, amortisation and impairments of other non-current assets.
Adjusted EBITDA increases the comparability of EBITDA.
Effective tax rate Income tax as a percentage of profit before tax. This metric enables the income tax to be compared across locations where corporate taxes differ.
Items affecting comparability
Items affecting comparability are those significant items which are separately disclosed by virtue of their size or incidence, in order to enable a full understanding of the Group's financial performance. These include items such as restructurings, impact from acquisitions or divestments.
Items affecting comparability increases the comparability of the Group's financial performance.
Net financial items The total of exchange differences on cash and cash equiv-alent in foreign currencies, other financial income and other financial expenses.
The net financial items reflects the company's total costs of external financing.
Net sales, change Net sales as a percentage of net sales in the comparative period of the previous year.
Net sales, change reflects the company's realised top-line growth over time.
Operating profit (EBIT) Operating profit consists of comprehensive income before net financial items and income tax.
This metric enables the profitability to be compared across locations where corporate taxes differ, irrespec-tive the financing structure of the company.
Operating profit (EBIT), adjusted
Operating profit adjusted for items affecting comparability. Operating profit, adjusted increases the comparability of operating profit.
Organic growth Net sales, change excluding acquisition-driven growth and changes in exchanges rates.
Organic growth excludes the impact of changes in group structure and exchange rates, enabling a comparison on net sales growth over time.
Structural changes Net sales, change resulting from changes in group structure. Structural changes measure the contribution of changes in group structure to the net sales growth.
GlossaryBranded packaged products Products that are mainly sold under brands and are packaged.
FVTPL Fair Value Through Profit and Loss.
Pick & mix Cloetta’s range of candy and natural snacks that are picked by the consumers themselves.
Pick & mix concept Cloetta’s complete concept in pick & mix including products, displays and accompanying store and logistic services.
SEK 30 Jun 2021 30 Jun 2020 31 Dec 2020
EUR, average 10.1350 10.6685 10.4880
EUR, end of period 10.1110 10.4948 10.0343
NOK, average 0.9969 0.9895 0.9757
NOK, end of period 0.9940 0.9618 0.9584
GBP, average 11.6979 12.1924 11.7868
GBP, end of period 11.7837 11.5020 11.1613
DKK, average 1.3628 1.4293 1.4070
DKK, end of period 1.3597 1.4082 1.3485
Exchange rates

Q2 F i n a n C i a l C a l e n D a r
32
Cloetta Interim Report Q2 2021
W o r d s f r o m t h e p r e s i d e n t
O v e r v i e w F i n a n c i a l o v e r v i e w
Sustain ability F i n a n c i a l s t a t e m e n t s
D i s c l o s u r e s D e f i n i t i o n s C o n t a c t
Financial calendar 2021
ContactNathalie Redmo, Head of IR and Communication, + 46 76 696 59 40
This information is information that Cloetta AB is obliged to make public pursuant to the EU Market Abuse Regulation andthe Securities Markets Act. The information was submitted for publication, through the agency of the contact person detailed above, at 8:00 a.m. CET on 16 July 2021.
“We believe in the Power of True Joy”
• Cloetta’s target is to increase organic sales at least in line with market growth.
• Cloetta’s target is an EBIT margin, adjusted for items affecting compara-bility, of at least 14 per cent.
• Cloetta’s long-term target is a net debt/EBITDA ratio of 2.5x.
• Cloetta’s long-term intention is a dividend payout of 40–60 per cent of profit after tax.
Our purpose
Long-term financial targets
Strategies
• Strong brands and market positions in a non-cyclical market.
• Excellent availability in the retail trade with the help of a strong and effective sales and distribution organ-isation.
• Good consumer knowledge and loyalty.
• Innovative product and packaging development.
• Effective production with high and consistent quality.
Value drivers
Cloetta’s business model is to offer strong local brands in confectionery and nuts and provide effective sales and distribution to the retail trade. Together, this will ensure continued positive devel-opment of the company’s leading market positions.
Business model
Drive growth
Facilitate growth
Fund growth
We provide choices for youWe create joyful moments through the quality of our products. We aim to meet the variety of consumer preferences.
We care about people We support our employees, suppliers, and farmers, as well as our communities.
We improve our footprintOur business depends on the environment. We are responsible for the impact we have from sourcing to packaging.
Sustainablity
interim report Q2 16 July 2021
interim report Q3 29 October 2021
2021
interim report Q4 28 January 2022
2022aPr may Jun Jul aug SeP OCt nOv DeC Jan Feb mar aPr may
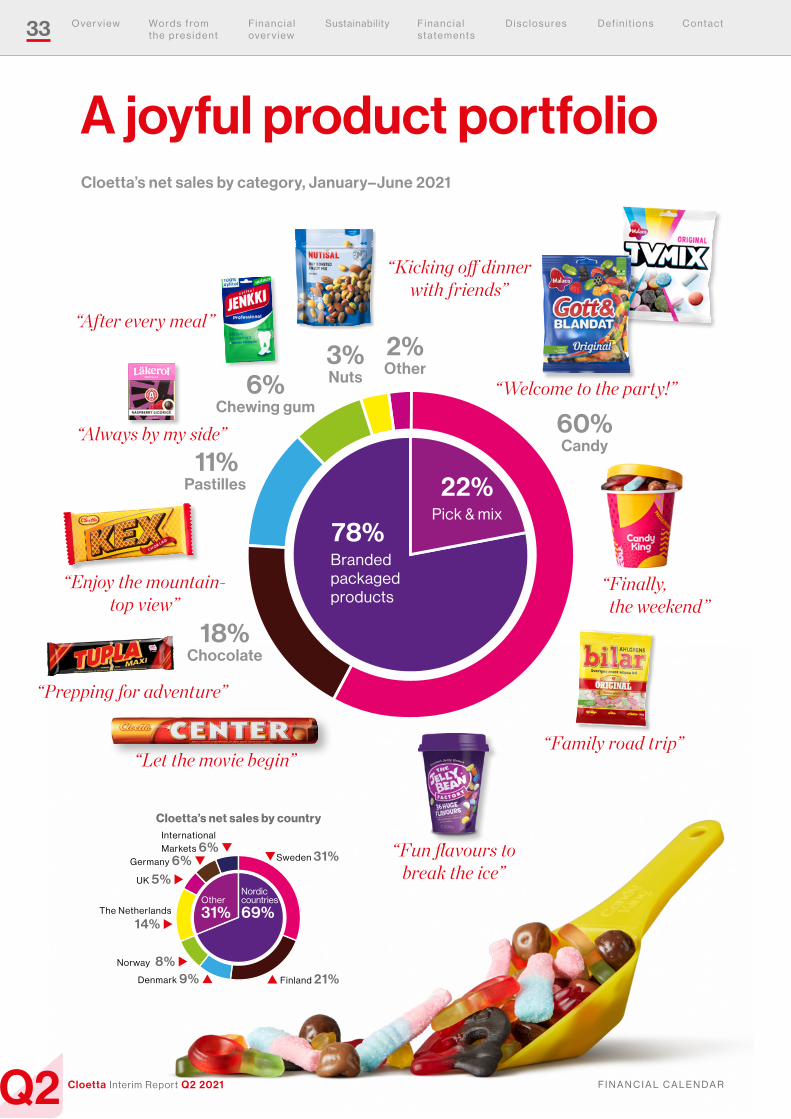
Q2 F i n a n C i a l C a l e n D a r
33
Cloetta Interim Report Q2 2021
W o r d s f r o m t h e p r e s i d e n t
O v e r v i e w F i n a n c i a l o v e r v i e w
Sustain ability F i n a n c i a l s t a t e m e n t s
D i s c l o s u r e s D e f i n i t i o n s C o n t a c t
A joyful product portfolio
Norway 8% u
Denmark 9% p p Finland 21%
The Netherlands
14% u
qSweden 31%
International Markets 6% q
Nordiccountries 69%
Other 31%
UK 5% u
Cloetta’s net sales by country
Germany 6% q
60% Candy
18% Chocolate
11% Pastilles
6% Chewing gum
3% Nuts
2% Other
Pick & mix
22%
branded packaged products
78%
“Kicking off dinner with friends”
“Welcome to the party!”
“Let the movie begin”“Family road trip”
“Fun flavours to break the ice”
“ Finally, the weekend”
“Prepping for adventure”
“Enjoy the mountain- top view”
“Always by my side”
“After every meal”
Cloetta’s net sales by category, January–June 2021

Cloetta AB (publ) • Corp. ID no. 556308-8144 • Landsvägen 50A, Box 2052, 174 02, Sundbyberg, Sweden • Tel +46 (0)8-52 72 88 00 • www.cloetta.com
Cloetta, founded in 1862, is a leading confectionery company in Northern Europe. In total, Cloetta products are sold in more than 50 countries worldwide. Cloetta owns some of
the strongest brands on the market, such as Läkerol, CandyKing, Jenkki, Kexchoklad, Malaco, Sportlife and Red Band.
Cloetta has seven production units in five countries. Cloetta’s class B shares are traded on Nasdaq Stockholm.
More information about Cloetta is available at www.cloetta.com
“We believe in the Power of True Joy”
O v e r v i e w W o r d s f r o m t h e p r e s i d e n t
F i n a n c i a l o v e r v i e w
Sustain ability F i n a n c i a l s t a t e m e n t s
D i s c l o s u r e s D e f i n i t i o n s C o n t a c t