Embed Size (px)
Citation preview

ANNOUNCEMENT NO. 22 – 9 NOVEMBER 2016
1/23 DAMPSKIBSSELSKABET NORDEN A/S · 52, STRANDVEJEN, DK-2900 HELLERUP, DENMARK · WWW.DS-NORDEN.COM · CVR NO. 67758919 1/23
INTERIM REPORT
Third quarter of 2016
Adjusted result for the period* Q3 2016: USD -12 million (Q3 2015: USD 18 million).
EBIT Q3 2016: USD -13 million (USD 21 million), of which vessel sales make up USD -6 million.
Dry Cargo: Increasing imports to China sustain a generally weak market. Adjusted result for the period Q3: USD -8 million (USD -14 million). Earnings 31% above market benchmark.
Tankers: Continued deterioration of the market. Adjusted result for the period Q3: USD -4 million (USD 32 million). Earnings 7% above benchmark.
Cash flows from operating activities Q3: USD -29 million (USD -3 million).
Cash and securities: USD 294 million (USD 359 million). Undrawn credit facilities of USD 285 million (USD 345 million).
Total net commitments decreased by USD 156 million to USD 752 million.
Ship values: Slightly upward trend in Dry Cargo over the quarter – drop in the Tanker segment. Total decrease of 2%.
In line with the strategy, operating activities will be increased significantly over the coming years.
Expectations for the Group’s adjusted results for the year are maintained at USD -60 to -20 million.
CEO Jan Rindbo in comment: ”Overall, the third quarter developed as expected and finishes, despite our efforts, with an unsatisfactory result as a consequence of market developments. Our early focus on increasing coverage in Tankers combined with the sale of tanker vessels have reduced our exposure to a severely hit tanker market, while in Dry Cargo we are preoccupied with getting the best out of the very poor market. In this connection, the ability to combine vessels with cargoes is a crucial element, and in line with the strategy Focus & Simplicity the Company will utilise its position in the market over the coming years to significantly increase its operating activities in Dry Cargo through increased use of short-term chartered vessels.”
A telephone conference will be held today at 3:30 p.m. (CET), where CEO Jan Rindbo and CFO Martin Badsted will comment on the report. It is requested that all participants have joined the meeting by latest 3:25 p.m. (CET) – Danish participants please dial in on +45 3848 7513, overseas participants please dial in on +44 (0) 20 3427 1911 or +1 212 444 0412. The telephone conference will be shown live at www.ds-norden.com, where the accompanying presentation will also be available. For further information: CEO Jan Rindbo, tel. +45 3315 0451.
USD million
-50-40-30-20-10
010203040
Q32015
Q42015
Q12016
Q22016
Q32016
Adjusted result for the period
Q4 2015: USD -337 million (incl. writedowns
and provisions)
* “Results for the period” adjusted for “Profits
from the sale of vessels etc.” and “Fair value
adjustment of certain hedging instruments”
INTERIM REPORT THIRD QUARTER OF 2016
2/23
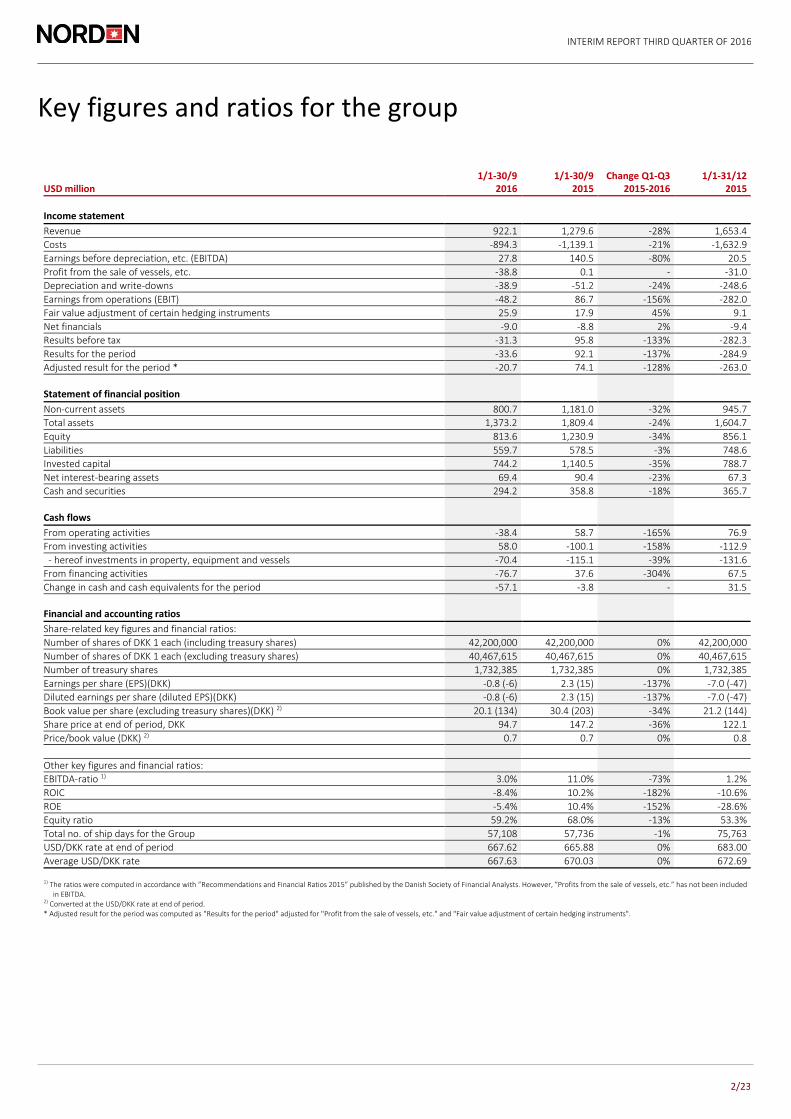
Key figures and ratios for the group
USD million 1/1-30/9
2016 1/1-30/9
2015 Change Q1-Q3
2015-2016 1/1-31/12
2015
Income statement
Revenue 922.1 1,279.6 -28% 1,653.4
Costs -894.3 -1,139.1 -21% -1,632.9
Earnings before depreciation, etc. (EBITDA) 27.8 140.5 -80% 20.5
Profit from the sale of vessels, etc. -38.8 0.1 - -31.0
Depreciation and write-downs -38.9 -51.2 -24% -248.6
Earnings from operations (EBIT) -48.2 86.7 -156% -282.0
Fair value adjustment of certain hedging instruments 25.9 17.9 45% 9.1
Net financials -9.0 -8.8 2% -9.4
Results before tax -31.3 95.8 -133% -282.3
Results for the period -33.6 92.1 -137% -284.9
Adjusted result for the period * -20.7 74.1 -128% -263.0
Statement of financial position
Non-current assets 800.7 1,181.0 -32% 945.7
Total assets 1,373.2 1,809.4 -24% 1,604.7
Equity 813.6 1,230.9 -34% 856.1
Liabilities 559.7 578.5 -3% 748.6
Invested capital 744.2 1,140.5 -35% 788.7
Net interest-bearing assets 69.4 90.4 -23% 67.3
Cash and securities 294.2 358.8 -18% 365.7
Cash flows
From operating activities -38.4 58.7 -165% 76.9
From investing activities 58.0 -100.1 -158% -112.9
- hereof investments in property, equipment and vessels -70.4 -115.1 -39% -131.6
From financing activities -76.7 37.6 -304% 67.5
Change in cash and cash equivalents for the period -57.1 -3.8 - 31.5
Financial and accounting ratios
Share-related key figures and financial ratios:
Number of shares of DKK 1 each (including treasury shares) 42,200,000 42,200,000 0% 42,200,000
Number of shares of DKK 1 each (excluding treasury shares) 40,467,615 40,467,615 0% 40,467,615
Number of treasury shares 1,732,385 1,732,385 0% 1,732,385
Earnings per share (EPS)(DKK) -0.8 (-6) 2.3 (15) -137% -7.0 (-47)
Diluted earnings per share (diluted EPS)(DKK) -0.8 (-6) 2.3 (15) -137% -7.0 (-47)
Book value per share (excluding treasury shares)(DKK) 2) 20.1 (134) 30.4 (203) -34% 21.2 (144)
Share price at end of period, DKK 94.7 147.2 -36% 122.1
Price/book value (DKK) 2) 0.7 0.7 0% 0.8
Other key figures and financial ratios:
EBITDA-ratio 1) 3.0% 11.0% -73% 1.2%
ROIC -8.4% 10.2% -182% -10.6%
ROE -5.4% 10.4% -152% -28.6%
Equity ratio 59.2% 68.0% -13% 53.3%
Total no. of ship days for the Group 57,108 57,736 -1% 75,763
USD/DKK rate at end of period 667.62 665.88 0% 683.00
Average USD/DKK rate 667.63 670.03 0% 672.69
1) The ratios were computed in accordance with ”Recommendations and Financial Ratios 2015” published by the Danish Society of Financial Analysts. However, ”Profits from the sale of vessels, etc.” has not been included in EBITDA.
2) Converted at the USD/DKK rate at end of period. * Adjusted result for the period was computed as "Results for the period" adjusted for "Profit from the sale of vessels, etc." and "Fair value adjustment of certain hedging instruments".

INTERIM REPORT THIRD QUARTER OF 2016
3/23
Comments on the development of the group for the period
Adjusted result for the period: USD -12 million (USD 18 million)
Cash and securities at 30 September: USD 294 million (USD 359 million)
Net commitments decreased by USD 156 million
Adjusted result for the period USD -12 million In the third quarter, NORDEN realised an adjusted result for the period of USD -12 million (third quarter 2015: USD 18 million). The result corresponds to an EBIT of USD -13 million (USD 21 million), of which losses from the sale of vessels with delivery in the third quarter of 2016 make up USD 6 million. NORDEN’s tanker activities generated an adjusted result for the period of USD -4 million (USD 32 million), corresponding to an EBIT of USD -8 million (USD 34 million). The tanker result reflects the significant deterioration of the market rates in the second half of 2016. In the dry cargo market, the slight increase in rates from the second quarter continued, however, rates are still at the level of operating expenses (OPEX), and the adjusted result for the period ended at USD -8 million (USD -14 million), corresponding to an EBIT of USD -5 million (USD -13 million).
Increase of operating activities NORDEN’s business model for Dry Cargo consists of 2 business units; Shipowner and Operator. The shipowner activities are handled by the Asset Management Department and the Technical Department and cover purchase and sale, technical operation as well as long-term chartering of tonnage. The function optimises the composition and capacity of the core fleet and thus has considerable exposure towards the market. The operating activities cover global transportation at sea, where earnings are made up of the difference between what the customer pays for the transport and what it costs NORDEN to charter a vessel for a shorter period of time or just a single trip. These activities are handled by the Dry Cargo Department, which has good access to both cargo and tonnage in the global market owing to its global network of offices. Because the operator business combines cargoes and vessels within a relatively short time frame, the exposure to the market is limited, and to a lesser extent earnings are affected by the market conditions. In line with the strategy Focus & Simplicity and based on the Company’s expertise, brand and position in the market, NORDEN will strengthen its operating activities significantly. Focus is on ”asset light” growth within the dry cargo business to utilise NORDEN’s strong global network and to make earnings less dependent on market conditions.
Financial position At the end of the quarter, NORDEN’s cash and securities amounted to USD 294 million. To this should be added NORDEN’s share of cash in joint ventures of USD 5 million and undrawn credit facilities which totalled USD 285 million at the end of the quarter. In comparison, outstanding net commitments (after income from the sale of vessels) concerning the Company’s newbuilding programme including joint ventures constitute USD 179 million and are due for payment in the period 2016-2020. NORDEN’s net commitments are calculated as total bank debt, TC commitments and outstanding payments on newbuildings deducted cash and future earnings from coverage. The net commitments went down by USD 156 million this quarter to USD 752 million. Among other things, the significant drop is a result of the signing of the 2 contracts for transportation of biomass that were concluded at the beginning of the third quarter as well as the sale of 2 tanker vessels. In total, the Company has lowered its net commitments by USD 505 million since the end of 2014.
-50-45-40-35-30-25-20-15-10
-50
Q32015
Q42015
Q12016
Q22016
Q32016
USD million
-10
-5
0
5
10
15
20
25
30
35
Q32015
Q42015
Q12016
Q22016
Q32016
USD million
Adjusted result for the period Dry Cargo
Adjusted result for the period Tankers
Q4 2015 -355 (incl. writedowns and
provisions)
0
150
300
450
600
750
Q32015
Q42015
Q12016
Q22016
Q32016
Financial resources
Undrawn credit facilities
Cash and securities
USD million

INTERIM REPORT THIRD QUARTER OF 2016
4/23
0
200
400
600
800
1,000
1,200
1,400
End2014
End2015
Q12016
Q22016
Q32016
Total net commitments
USD million
The sale of 2 tanker vessels In the third quarter, the Company sold 2 Handysize tanker vessels, of which one was delivered in August while the second was delivered in October. The vessel sales were carried out for the purpose of reducing the exposure to the tanker market over the coming period, and the realised sales prices are above what is achievable in the current market. Furthermore, the 4 Handysize dry cargo vessels as well as 2 of the 4 Post-Panamax vessels which were sold in the second quarter have been delivered to their new owners. The last 2 Post-Panamax vessels were delivered in October.
Development of vessel values The value of the vessels that NORDEN owned throughout the quarter dropped by 2%. In Dry Cargo, the vessel values increased by 4% during the third quarter, whereas tanker vessels on average dropped by 8%. Based on the valuations of 3 independent brokers, the market value of NORDEN’s owned vessels and newbuildings (including vessels in joint ventures) is estimated at USD 902 million at the end of the quarter. The theoretical value of NORDEN’s purchase and extension options is estimated at USD 56 million at the end of the third quarter. As usual, the Company has carried out an assessment of the most significant assumptions used when determining the value in use at 31 December 2015, including the long-term rate expectations. Based on this, it is the Company’s assessment of the dry cargo segment (CGU) that there are no changes in the assumptions which indicate a need for a write-down. As for the tanker segment, the continued negative development in vessel values and freight rates in the third quarter has entailed that Management has decided to carry out an impairment test. The test is performed by calculating the value in use of the fleet. For a more detailed description of the impairment test, please see note 12 in the Annual Report 2015. Based on this calculation, Management has assessed that the long-term values of the tanker fleet still support the carrying amounts.
*Core fleet is defined as owned vessels and vessels chartered for more than 13 months.
0
20
40
60
80
100
Q32015
Q42015
Q12016
Q22016
Q32016
Active core fleet* Dry Cargo
0
20
40
60
80
100
Q32015
Q42015
Q12016
Q22016
Q32016
Active fleet Tankers

INTERIM REPORT THIRD QUARTER OF 2016
5/23
Segment information
NORDEN has changed its accounting policies and does no longer have ”Unallocated items”. Please also see note 1 Significant accounting policies.
USD million Q3 2016 Q3 2015
Dry Cargo Tankers Total Dry Cargo Tankers
Total
Revenue – services rendered 240.3 73.8 314.1 298.8 101.3 400.1 Voyage costs -117.1 -26.5 -143.6 -147.6 -12.2 -159.8
Contribution margin 123.2 47.3 170.5 151.2 89.1 240.3 Other operating income, net 2.5 0.0 2.5 1.9 0.0 1.9 Vessel operating costs -118.5 -39.2 -157.7 -141.9 -43.1 -185.0 Costs -9.1 -2.1 -11.2 -11.6 -4.1 -15.7
Earnings before depreciation, etc. (EBITDA) -1.9 6.0 4.1 -0.4 41.9 41.5 Profits from the sale of vessels, etc. 0.0 -5.8 -5.8 -3.2 0.1 -3.1 Depreciation and write-downs -3.6 -8.0 -11.6 -8.7 -8.3 -17.0 Share of results of joint ventures 0.3 0.1 0.4 -1.1 0.6 -0.5 Earnings from operations (EBIT) -5.2 -7.7 -12.9 -13.4 34.3 20.9 Fair value adjustment of certain hedging instruments 3.4 0.0 3.4 -4.6 0.0 -4.6 Financial income 1.3 0.8 2.1 0.2 0.1 0.3 Financial expenses -3.6 -2.4 -6.0 -3.1 -2.1 -5.2 Tax for the period -0.6 -0.1 -0.7 -1.2 -0.1 -1.3 Results for the period -4.7 -9.4 -14.1 -22.1 32.2 10.1
Adjusted result for the period -8.1 -3.6 -11.7 -14.3 32.1 17.8
USD million Q1-Q3 2016 Q1-Q3 2015
Dry Cargo Tankers Total Dry Cargo Tankers Total
Revenue – services rendered 668.3 253.8 922.1 930.3 349.3 1,279.6 Voyage costs -345.5 -80.1 -425.6 -447.7 -92.1 -539.8
Contribution margin 322.8 173.7 496.5 482.6 257.2 739.8 Other operating income, net 9.2 0.1 9.3 4.7 0.0 4.7 Vessel operating costs -324.0 -121.0 -445.0 -426.1 -138.9 -565.0 Costs -26.8 -6.2 -33.0 -30.3 -8.7 -39.0 Profit before depreciation, etc. (EBITDA) -18.8 46.6 27.8 30.9 109.6 140.5 Profits from the sale of vessels, etc. -33.0 -5.8 -38.8 -7.0 7.1 0.1 Depreciation -13.6 -25.3 -38.9 -26.3 -24.9 -51.2 Share of results of joint ventures 0.8 0.9 1.7 -4.0 1.3 -2.7
Profit before operations (EBIT) -64.6 16.4 -48.2 -6.4 93.1 86.7 Fair value adjustment of certain hedging instruments 25.9 0.0 25.9 17.9 0.0 17.9 Financial income 2.8 1.6 4.4 2.4 1.6 4.0 Financial expenses -8.0 -5.4 -13.4 -7.6 -5.2 -12.8 Tax for the period -2.0 -0.3 -2.3 -3.5 -0.2 -3.7
Results for the period -45.9 12.3 -33.6 2.8 89.3 92.1 Adjusted result for the period -38.8 18.1 -20.7 -8.1 82.2 74.1
USD million Q1-Q3 2016 Q1-Q3 2015
Dry Cargo Tankers
Total Dry Cargo Tankers
Total
Vessels 227.1 490.4 717.5 522.7 553.7 1,076.4 Prepayments on vessels and newbuildings 14.7 0 14.7 24.2 0 24.2 Other tangible assets 30.8 20.6 51.4 33.3 22.2 55.5 Investments in joint ventures 15.9 1.2 17.1 20.7 4.2 24.9
Non-current assets 288.5 512.2 800.7 600.9 580.1 1,181.0 Current assets (operating) 201.7 76.6 278.3 219.6 50.0 269.6 Cash and securities 0 0 294.2 0 0 358.8 - Of which tangible assets held for sale 22.6 13.6 36.2 4.8 0 4.8
Total assets 490.2 588.8 1,373.2 820.5 630.1 1,809.4
INTERIM REPORT THIRD QUARTER OF 2016
6/23
0
1,000
2,000
3,000
4,000
5,000
Q12015
Q22015
Q32015
Q42015
Q12016
Q22016
Q32016
Panamax Supramax
Dry Cargo
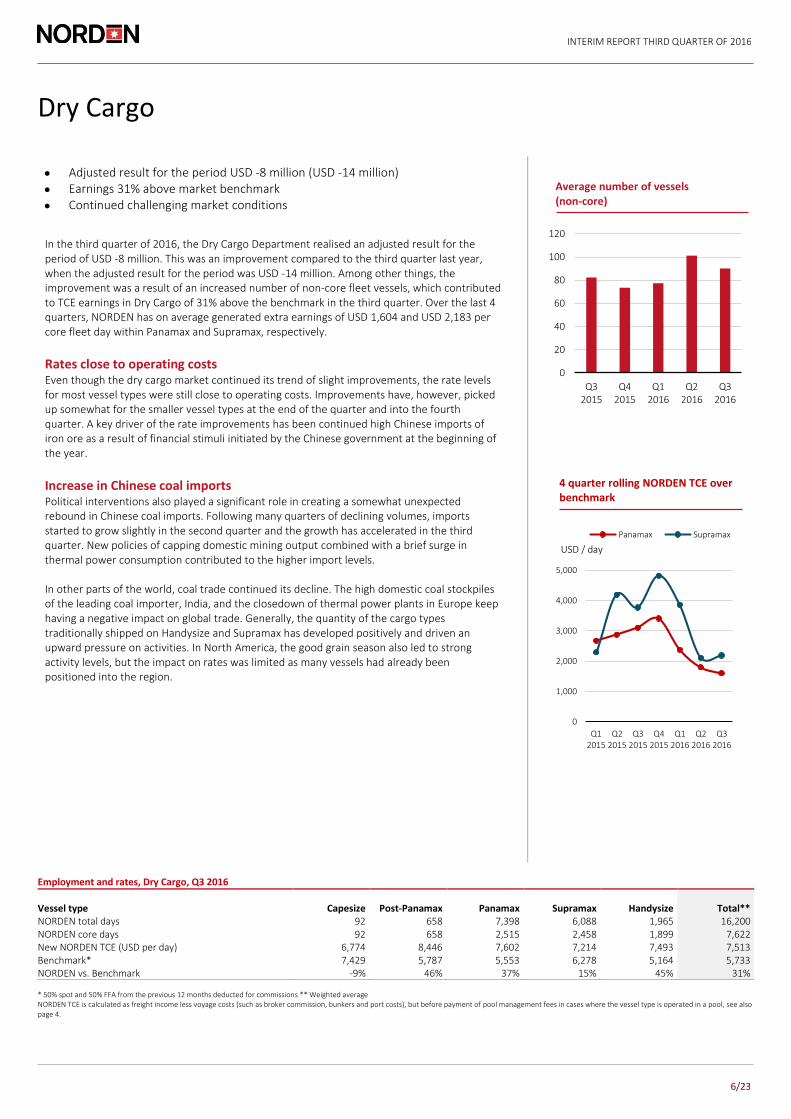
Adjusted result for the period USD -8 million (USD -14 million)
Earnings 31% above market benchmark
Continued challenging market conditions
In the third quarter of 2016, the Dry Cargo Department realised an adjusted result for the period of USD -8 million. This was an improvement compared to the third quarter last year, when the adjusted result for the period was USD -14 million. Among other things, the improvement was a result of an increased number of non-core fleet vessels, which contributed to TCE earnings in Dry Cargo of 31% above the benchmark in the third quarter. Over the last 4 quarters, NORDEN has on average generated extra earnings of USD 1,604 and USD 2,183 per core fleet day within Panamax and Supramax, respectively.
Rates close to operating costs Even though the dry cargo market continued its trend of slight improvements, the rate levels for most vessel types were still close to operating costs. Improvements have, however, picked up somewhat for the smaller vessel types at the end of the quarter and into the fourth quarter. A key driver of the rate improvements has been continued high Chinese imports of iron ore as a result of financial stimuli initiated by the Chinese government at the beginning of the year.
Increase in Chinese coal imports Political interventions also played a significant role in creating a somewhat unexpected rebound in Chinese coal imports. Following many quarters of declining volumes, imports started to grow slightly in the second quarter and the growth has accelerated in the third quarter. New policies of capping domestic mining output combined with a brief surge in thermal power consumption contributed to the higher import levels. In other parts of the world, coal trade continued its decline. The high domestic coal stockpiles of the leading coal importer, India, and the closedown of thermal power plants in Europe keep having a negative impact on global trade. Generally, the quantity of the cargo types traditionally shipped on Handysize and Supramax has developed positively and driven an upward pressure on activities. In North America, the good grain season also led to strong activity levels, but the impact on rates was limited as many vessels had already been positioned into the region.
Employment and rates, Dry Cargo, Q3 2016
Vessel type Capesize Post-Panamax Panamax Supramax Handysize Total** NORDEN total days 92 658 7,398 6,088 1,965 16,200 NORDEN core days 92 658 2,515 2,458 1,899 7,622 New NORDEN TCE (USD per day) 6,774 8,446 7,602 7,214 7,493 7,513 Benchmark* 7,429 5,787 5,553 6,278 5,164 5,733 NORDEN vs. Benchmark -9% 46% 37% 15% 45% 31% * 50% spot and 50% FFA from the previous 12 months deducted for commissions ** Weighted average NORDEN TCE is calculated as freight income less voyage costs (such as broker commission, bunkers and port costs), but before payment of pool management fees in cases where the vessel type is operated in a pool, see also page 4.
4 quarter rolling NORDEN TCE over benchmark
0
20
40
60
80
100
120
Q32015
Q42015
Q12016
Q22016
Q32016
Average number of vessels (non-core)
USD / day

INTERIM REPORT THIRD QUARTER OF 2016
7/23
Still no orders The improvement of especially Capesize rates during the third quarter led to a strong reduction in scrapping, since it was predominantly scrapping of Capesize vessels that drove the very high scrapping levels in the beginning of 2016. The full-year 2016 scrapping level is now expected to be around 4%, which will lead to fleet growth of 2-3%. Looking ahead, it is still noteworthy that almost no new orders have been placed this year besides the 30 vessels ordered by the Vale group earlier this year for transportation of own iron ore. The relatively poor market conditions are expected to continue for some time still. However, the overall growth in demand has surprised positively in 2016, and in 2017 fleet growth is expected to move closer to the zero level, which may form the basis of market improvements.
NORDEN’s Dry Cargo fleet and values at 30 September 2016
Vessel Type Capesize Post-Panamax Panamax Supramax Handysize Total Vessels in operation Owned vessels 0.0 2.0 4.0 5.5 8.0 19.5 Chartered vessels with a duration of more than 13 months 1.0 4.0 21.5 22.5 11.0 60.0
Total active core fleet 1.0 6.0 25.5 28.0 19.0 79.5 Vessels to be delivered Owned vessels 0.0 0.0 2.0 7.0 0.0 9.0 Chartered vessels with a duration of more than 13 months 0.0 0.0 2.0 7.0 1.0 10.0
Total delivery to core fleet 0.0 0.0 4.0 14.0 1.0 19.0 Dry Cargo fleet values at 30 September 2016 (USD million) Market value of owned vessels and newbuildings* 0 23 113 227 100 463 Theoretical value of purchase and extension options 1 1 22 32 0 56 * Active vessels and newbuildings including joint ventures, assets held for sale and charter parties, if any.
0
500
1,000
1,500
2,000
2,500
Jan
-14
Ap
r-14
Jul-
14O
ct-1
4Ja
n-1
5A
pr-
15Ju
l-15
Oct
-15
Jan
-16
Ap
r-16
Jul-
16O
ct-1
6
0
1
2
3
4
5
6
Ap
r-14
Jul-
14
Oct
-14
Jan
-15
Ap
r-15
Jul-
15
Oct
-15
Jan
-16
Ap
r-16
Jul-
16
Dry Cargo Demolition
Million dwt
Baltic Exchange Dry Index
INTERIM REPORT THIRD QUARTER OF 2016
8/23
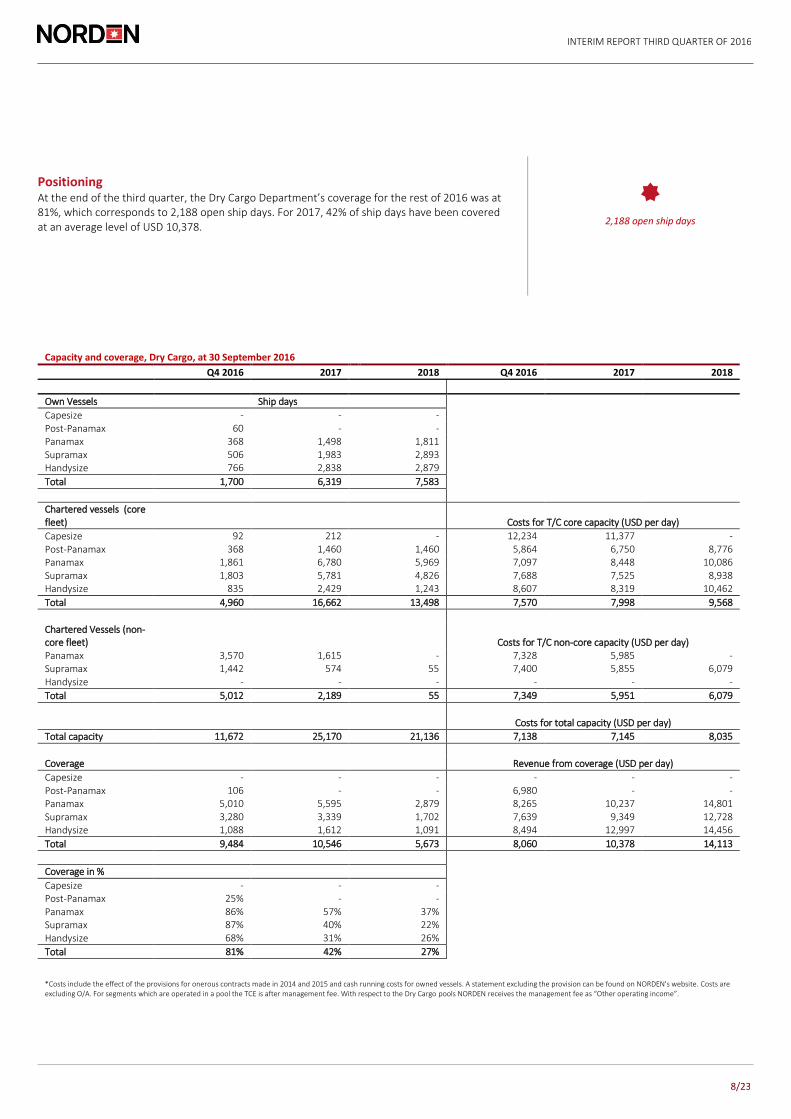
Positioning At the end of the third quarter, the Dry Cargo Department’s coverage for the rest of 2016 was at 81%, which corresponds to 2,188 open ship days. For 2017, 42% of ship days have been covered at an average level of USD 10,378.
2,188 open ship days
Capacity and coverage, Dry Cargo, at 30 September 2016
Q4 2016 2017 2018 Q4 2016 2017 2018
Own Vessels Ship days
Capesize - - - Post-Panamax 60 - -
Panamax 368 1,498 1,811 Supramax 506 1,983 2,893
Handysize 766 2,838 2,879
Total 1,700 6,319 7,583
Chartered vessels (core fleet) Costs for T/C core capacity (USD per day)
Capesize 92 212 - 12,234 11,377 -
Post-Panamax 368 1,460 1,460 5,864 6,750 8,776 Panamax 1,861 6,780 5,969 7,097 8,448 10,086
Supramax 1,803 5,781 4,826 7,688 7,525 8,938 Handysize 835 2,429 1,243 8,607 8,319 10,462
Total 4,960 16,662 13,498 7,570 7,998 9,568
Chartered Vessels (non-core fleet) Costs for T/C non-core capacity (USD per day) Panamax 3,570 1,615 - 7,328 5,985 - Supramax 1,442 574 55 7,400 5,855 6,079
Handysize - - - - - -
Total 5,012 2,189 55 7,349 5,951 6,079
Costs for total capacity (USD per day)
Total capacity 11,672 25,170 21,136 7,138 7,145 8,035
Coverage Revenue from coverage (USD per day)
Capesize - - - - - -
Post-Panamax 106 - - 6,980 - - Panamax 5,010 5,595 2,879 8,265 10,237 14,801
Supramax 3,280 3,339 1,702 7,639 9,349 12,728 Handysize 1,088 1,612 1,091 8,494 12,997 14,456
Total 9,484 10,546 5,673 8,060 10,378 14,113
Coverage in %
Capesize - - - Post-Panamax 25% - -
Panamax 86% 57% 37% Supramax 87% 40% 22%
Handysize 68% 31% 26%
Total 81% 42% 27%
*Costs include the effect of the provisions for onerous contracts made in 2014 and 2015 and cash running costs for owned vessels. A statement excluding the provision can be found on NORDEN's website. Costs are excluding O/A. For segments which are operated in a pool the TCE is after management fee. With respect to the Dry Cargo pools NORDEN receives the management fee as “Other operating income”.

INTERIM REPORT THIRD QUARTER OF 2016
9/23
Tankers
Adjusted result for the period USD -4 million (USD 32 million)
Disappointing oil demand and an increasing number of tankers meant continued declining tanker rates
24% of ship days in 2017 covered
Adjusted result for the period USD -4 million The market conditions in the third quarter meant renewed hardship for NORDEN’s fleet of product tankers. Decreasing growth in oil demand and continued increase in the global tanker fleet put additional pressure on the already depressed rates. These developments also marked the results of NORDEN’s tanker business, which in the third quarter realised an adjusted result for the period of USD -4 million (USD 32 million) corresponding to an EBIT of USD -8 million (USD 34 million). NORDEN’s TCE earnings for MR and Handysize in the third quarter were USD 13,897 per day and 11,158 per day, respectively. The Company’s average earnings for the past 4 quarters are thus above the market average by 9% for MR whereas earnings in Handysize have been marginally better than the market average by 1%. Expectations for a worsened tanker market made NORDEN secure coverage on an ongoing basis throughout the first half-year, and earnings from this coverage have helped limit the effect of the dropping spot rates. In addition, the Company has actively reduced market exposure during the third quarter by disposal of two Handysize vessels.
Third quarter oil demand disappointing Oil demand in the third quarter was disappointing. According to preliminary figures from the IEA, it is estimated that third quarter growth was just under 0.9% compared to the same quarter in 2015 – the lowest growth rate for a quarter in 2 years. The demand for vessels is driven by the overall oil consumption, but is assessed, however, to grow a little more. Low demand also affected trade in refined products with export volumes in the third quarter only growing less than half of that of the growth rates in the past 6 quarters (Wood Mackenzie). The missing cargoes therefore reduced average market earnings in product tankers by roughly 30% compared to the second quarter (Clarksons). The lower growth in oil demand is partly due to the fact that demand in Europe has been lower than expected – where the outcome of the Brexit vote created increased uncertainty about the future. China, which has been a central driving force behind growth in oil consumption for the past year, also reduced its demand in the third quarter and is increasingly using its own refined products instead of importing. In addition to disappointing demand figures, product inventories have remained high. This also applies to crude oil inventories, which have, however, dropped somewhat compared to those at the end of the second quarter. This may have lowered the demand for import which has then been covered by drawing from inventories. In addition, the oil price has been stable over the past months, and demand stimuli from past price decreases is not as distinct today as it was last year.
Source: IEA
Source: Clarksons research
Employment and rates, Tankers, Q3 2016
Vessel type MR Handysize Total * NORDEN’s ship days 2,516 1,251 3,767 NORDEN spot TCE (USD per day, net) 12,971 10,193 11,978 NORDEN TCE (USD per day, net) 13,897 11,158 12,987 NORDEN TCE 12 months average (USD per day, net) 17,849 15,129 16,908 Benchmark 12 months average (USD per day, net) 16,340 14,961 15,863 NORDEN vs. Benchmark (12 months average) 9% 1% 7% * Weighted average. NORDEN TCE is calculated as freight income less voyage costs (such as broker commission, bunkers and port costs), but before payment of pool management fee.
0%
1%
2%
3%
Q1
20
14
Q2
20
14
Q3
20
14
Q4
20
14
Q1
20
15
Q2
20
15
Q3
20
15
Q4
20
15
Q1
20
16
Q2
20
16
Q3
20
16
0
5,000
10,000
15,000
20,000
25,000
30,000
Q1
201
5
Q2
201
5
Q3
201
5
Q4
201
5
Q1
201
6
Q2
201
6
Q3
201
6
0
1,000
2,000
3,000
4,000
5,000
6,000
Q12015
Q22015
Q32015
Q42015
Q12016
Q22016
Q32016
Handy MRUSD / day
4 quarter rolling NORDEN TCE over benchmark
IEA – YoY growth in global oil demand (%)
Average CPP earnings (>10.000 dwt CPP) (USD/day)

INTERIM REPORT THIRD QUARTER OF 2016
10/23
Fleet growth expected to remain high throughout the year
While growth in oil demand disappointed, the global fleet of product tankers continued growing. Fleet development in the third quarter was much alike the development in the first half-year with many additions of newbuildings and only little scrapping. With the current fleet development, net growth for 2016 of 6-7% in product tankers is therefore expected. Deliveries to the crude oil fleet have accelerated during the year, and fleet growth in these vessel types is also expected to approach 6-7% for 2016, which too has a negative impact on the market outlook in product tankers. In spite of low scrapping activities, lower fleet growth can be expected from next year. Orders for new tanker vessels in 2016 are substantially below the level of the past 3 years, and given the recent development in rates, only few new orders are expected for the remainder of 2016. Net growth for 2017 can therefore drop to 2-3% in the product tanker fleet and around 5% in the crude oil tanker fleet – which is considerably lower than this year. A cold winter market may contribute to an improvement in rates, but the market is also challenged by the high inventory levels, reduced refinery activities and an order book indicating considerable newbuilding additions for the rest of the year.
Source: Clarksons Research
NORDEN’s Tanker fleet and values at 30 June 2016
Vessel type LR1 MR Handysize Total Vessels in operation Owned vessels 0 9 12 21 Chartered vessels with a duration of more than 13 months 0 15 0 15
Total active core fleet 0 24 12 36 Chartered vessels with a duration of less than 13 months 0 2 4 6
Total active fleet 0 26 16 42 Vessels to be delivered Owned vessels 0 0 0 0 Chartered vessels with a duration of more than 13 months 2 4 0 6 Total delivery to core fleet 2 4 0 6 Tanker fleet values at 30 June 2016 (USD million) Market value of owned vessels and newbuildings* 0 239 200 439 Theoretical value of purchase and extension options 0 1 0 1 * Active vessels and newbuildings including joint ventures, assets held for sale and charter parties, if any.
0
10
20
30
40
50
60
Jan
Feb
Mar
Ap
r
May Jun
Jul
Au
g
Sep
Oct
No
v
Dec
2013 2014
2015 2016
Accumulated tanker contracting (million dwt.)

INTERIM REPORT THIRD QUARTER OF 2016
11/23
Positioning
At the end of the third quarter, 34% of ship days for the rest of 2016 had been covered corresponding to 2,363 open ship days. For 2017, 24% of ship days have already been covered at an average level of USD 17,633.
2,363 open ship days
Capacity and coverage, Tank, at 30 September 2016
Q4 2016 2017 2018 Q4 2016 2017 2018
Ship days Own vessels
LR1
- - - MR
828 3,237 3,229
Handysize 1,014 3,950 3,947
Total 1,842 7,187 7,176
Chartered vessels Costs for T/C capacity (USD per day)
LR1
- 489 730 - 18,600 18,600 MR
1,353 2,541 2,167 15,423 15,918 16,565
Handysize 361 - - 7,362 - -
Total 1,714 3,030 2,897 13,726 16,351 17,078
Total capacity 3,556 10,217 10,073 10,094 9,539 9,517
Coverage
Revenue from coverage (USD per day)
LR1
- - - - - - MR
875 1,755 655 15,538 18,130 16,166
Handysize 318 729 219 13,457 16,436 15,636
Total 1,193 2,484 874 14,983 17,633 16,033
Coverage in %
LR1
- - - MR
40% 30% 12%
Handysize 23% 18% 6%
Total 34% 24% 9%
* Including cash running costs of owned vessels. Costs are excluding administrative expenses. For vessel types which are operated in a pool, the T/C equivalent is after management fee.

INTERIM REPORT THIRD QUARTER OF 2016
12/23
Outlook for 2016
NORDEN maintains expectations NORDEN maintains its expectations for the adjusted results for the year at USD -60 to -20 million. In Dry Cargo, the slight increase in rates has continued, and expectations for NORDEN’s Dry Cargo segment are increased marginally to USD -60 to -40 million. In the tanker market, spot rates have been a little weaker than previously expected, and expectations for the Tanker segment are lowered to USD 0 to 20 million. Expectations for 2016
USD million Dry Cargo Tankers Group Adjusted results for the year -60 to -40 0 to 20 -60 to -20
Risks and uncertainties At the beginning of November, Dry Cargo has about 1,000 open ship days, which gives rise to a change in earnings of about USD 1 million at a change of USD 1,000 per day in expected T/C equivalents. Dry Cargo earnings are furthermore sensitive to any counterparty risks and changes in the rate level between regions and vessel types. Earnings expectations in Tankers primarily depend on the development in the spot market. Based on about 1,500 open ship days in Tankers at the beginning of November, a change of USD 1,000 per day in expected T/C equivalents would mean a change in earnings of approximately USD 1.5 million.
Forward-looking statements This report includes forward-looking statements reflecting management’s current perception of future trends and financial performance. The statements for the rest of 2016 and the years to come naturally carry some uncertainty, and NORDEN’s actual results may therefore differ from expectations. Factors that may cause the results achieved to differ from the expectations are, among other things, but not exclusively, changes in the macroeconomic and political conditions – especially in the Company’s key markets – changes in NORDEN’s assumptions of rate development and operating costs, volatility in rates and vessel prices, changes in legislation, possible interruptions in traffic and operations as a result of external events, etc.

INTERIM REPORT THIRD QUARTER OF 2016
13/23
Management’s statement
The Board of Directors and the Executive Management today reviewed and approved the interim report for the third quarter of 2016 of Dampskibsselskabet NORDEN A/S. The interim report is prepared in accordance with the International Financial Reporting Standard IAS 34 on interim reports and the general Danish financial disclosure requirements for listed companies. In line with previous policies, the interim report is not audited or reviewed by the auditors. We consider the accounting policies applied to be appropriate and the accounting estimates made to be adequate. Furthermore, we find the overall presentation of the interim report to present a true and fair view. Besides what has been disclosed in the interim report, no other significant changes in the Company’s risks and uncertainties have occurred relative to what was disclosed in the consolidated annual report for 2015 In our opinion, the interim report gives a true and fair view of the Group’s assets, equity and liabilities, the financial position as well as the result of the Group’s activities and cash flows for the interim period. Furthermore, the management commentary gives a fair representation of the Group’s activities and financial position as well as a description of the material risks and uncertainties which the Group is facing. Hellerup, 9 November 2016
Executive Management
Jan Rindbo
Martin Badsted
Chief Executive Officer Executive Vice President & CFO
Board of Directors
Klaus Nyborg
Erling Højsgaard
Johanne Riegels Østergård
Chairman Vice Chairman
Karsten Knudsen
Arvid Grundekjøn
Lars Enkegaard Biilmann
Thorbjørn Joensen Jonas Visbech Berg Nissen

INTERIM REPORT THIRD QUARTER OF 2016
14/23
Income statement
Statement of comprehensive income
Note USD ’000
2016 2015 2015
Q1-Q3 Q1-Q3 Q1-Q4
Revenue
922,147 1,279,590
1,653,432
Costs -894,331 -1,139,107 -1,632,937
Earnings before depreciation, etc. (EBITDA) 27,816 140,483 20,495 Profits from the sale of vessels, etc. -38,818 65 -31,013 Depreciation and write-downs -38,850 -51,186 -248,553 Share of results of joint ventures 1,667 -2,704 -22,883
Earnings from operations (EBIT) -48,185 86,658 -281,954 2 Fair value adjustment of certain hedging instruments 25,948 17,877 9,108 Net financials -9,021 -8,776 -9,431
Results before tax -31,258 95,759 -282,277 Tax for the period -2,361 -3,705 -2,641
Results for the period -33,619 92,054 -284,918
Attributable to:
Shareholders of NORDEN -33,619 92,054 -284,918
Adjusted result for the period -20,749 74,112 -263,013
Earnings per share (EPS), USD
-0.8 2.3 -7.0
Diluted earnings per share, USD -0.8 2.3 -7.0
Note USD ’000
2016 2015 2015
Q1-Q3 Q1-Q3 Q1-Q4
Results for the period, after tax -33,619 92,054 -284,918
Items which will be reclassified to the income statement: Value adjustment of hedging instruments 173 -1,055 713 Fair value adjustment of securities -9,492 -456 -1,031 Tax on fair value adjustment of securities 0 0 150
Other comprehensive income, total -9,319 -1,511 -168
Total comprehensive income for the period, after tax
-42,938 90,543
-285,086
Attributable to:
Shareholders of NORDEN -42,938 90,543 -285,086

INTERIM REPORT THIRD QUARTER OF 2016
15/23
Income statement by quarter
Statement of comprehensive income by quarter
Note USD ’000 2016 2016 2016 2015 2015
Q3 Q2 Q1 Q4 Q3
Revenue 314,122
311,805
296,220
373,842
400,115
Costs -309,976 -299,571 -284,784 -493,830 -358,585
Earnings before depreciation, etc. (EBITDA) 4,146 12,234 11,436 -119,988 41,530 Profits from the sale of vessels, etc. -5,780 -33,828 790 -31,078 -3,182 Depreciation and write-downs -11,689 -13,846 -13,315 -197,367 -16,968 Share of results of joint ventures 388 1,475 -196 -20,179 -568
Earnings from operations (EBIT) -12,935 -33,965 -1,285 -368,612 20,812 2 Fair value adjustment of certain hedging instruments 3,407 13,395 9,146 -8,769 -4,691 Net financials -3,907 -2,622 -2,492 -655 -4,860
Results before tax -13,435 -23,192 5,369 -378,036 11,261 Tax for the period -784 -798 -779 1,064 -1,203
Results for the period -14,219 -23,990 4,590 -376,972 10,058
Attributable to:
Shareholders of NORDEN -14,219 -23,990 4,590 -376,972 10,058
Adjusted result for the period -11,846 -3,557 -5,346 -337,125 17,931
Earnings per share (EPS), USD -0.4 -0.6 0,1 -9,3 0,2
Diluted earnings per share, USD -0.4 -0.6 0,1 -9,3 0,2
Note USD ’000 2016 2016 2016 2015 2015
Q3 Q2 Q1 Q4 Q3
Results for the period, after tax -14,219 -23,990 4,590 -376,972 10,058
Items which will be reclassified to the income statement: Value adjustment of hedging instruments 1,035 -211 -651 1,768 -1,246 Fair value adjustment of securitities -7,922 -1,643 73 -575 -139 Tax on fair value adjustment of securities 0 0 0 150 0
Other comprehensive income, total -6,887 -1,854 -578 1,343 -1,385
Total comprehensive income for the period, after tax
-21,106
-25,844
4,012
-375,629
8,673
Attributable to:
Shareholders of NORDEN -21,106 -25,844 4,012 -375,629 8,673

INTERIM REPORT THIRD QUARTER OF 2016
16/23
Statement of financial position
Note USD ’000 2016 2015 2015
30/9 30/9 31/12
ASSETS 3 Vessels 717,416 1,076,366 864,251 Property and equipment 51,441 55,465 51,910 4 Prepayments on vessels and newbuildings 14,682 24,180 12,075 Investments in joint ventures 17,118 24,949 17,469
Non-current assets 800,657 1,180,960 945,705
Inventories 44,477 55,017 43,607 Receivables from joint ventures 16,671 3,592 3,111 Receivables and accruals 180,993 206,177 212,919 Securities 25,674 37,786 36,778 Cash and cash equivalents 268,510 321,025 328,919
536,325 623,597 625,334 5 Tangible assets held for sale 36,191 4,835 33,644
Current assets 572,516 628,432 658,978
Total assets 1,373,173 1,809,392 1,604,683
EQUITY AND LIABILITIES Share capital 6,706 6,706 6,706 Reserves -1,976 6,000 7,343 Retained earnings 808,785 1,218,184 842,014
Equity 813,515 1,230,890 856,063
Bank debt 197,783 236,474 262,036 Provisions 122,604 89,457 191,745 Prepayments received on vessels for resale 0 5,100 5,100
Non-current liabilities 320,387 331,031 458,881
Bank debt 27,011 31,909 36,319 Provisions 102,709 69,309 116,867 Trade payables 39,868 59,992 48,780 Liabilities in joint ventures 0 0 509 Other payables, deferred income and company tax 57,683 71,261 72,208
227,271 232,471 274,683
Liabilities relating to tangible assets held for sale 12,000 15,000 15,056
Current liabilities 239,271 247,471 289,739
Liabilities 559,658 578,502 748,620
Total equity and liabilities
1,373,173 1,809,392
1,604,683

INTERIM REPORT THIRD QUARTER OF 2016
17/23
Statement of cash flows
Note USD ’000 2016 2015 2016 2015 2015
Q1-Q3 Q1-Q3 Q3 Q3 Q1-Q4
Results for the period -33,619 92,054 -14,219 10,058 -284,918 Change in provisions -77,724 -60,078 -26,531 -19,923 64,499 Reversal of items without effect on cash flow 54,411 30,540 14,705 26,097 287,378
Cash flows before change in working capital -56,932 62,516 -26,045 16,232 66,959
Change in working capital 18,521 -3,863 -2,999 -19,663 9,931
Cash flows from operating activities -38,411 58,653 -29,044 -3,431 76,890
Investments in vessels, etc. -67,787 -41,869 -3,452 -7,251 -87,505 Additions in prepayments on newbuildings -2,607 -63,370 -225 -21,240 -72,011 Additions in prepayments received on sold vessels -8,156 20,100 -10,750 5,100 20,156 Investments in joint ventures -5,247 -9,842 -3,000 -5,500 -9,909 Net proceeds from the sale of vessels, etc. 134,884 111,697 60,977 -2 136,495 Sale of securities 3,594 0 -18 0 0 Change in cash and cash equivalents with rate agreements of more than 3
months etc. 3,317 -116,774 19,772 -19,613 -100,130
Cash flows from investing activities 57,998 -100,058 63,304 -48,506 -112,904
Raising of non-current debt 0 56,366 0 56,366 99,764 Instalments on/payment of debt -76,722 -18,733 -57,694 -4,374 -32,287
Cash flows from financing activities -76,722 37,633 -57,694 51,992 67,477
Change in cash and cash equivalents for the period -57,135 -3,772 -23,434 55 31,463
Cash and cash equivalents at beginning of period 167,774 137,379 134,338 144,284 137,379 Exchange rate adjustments 43 9,629 -222 -1,103 -1,068 Change in cash and cash equivalents for the period -57,135 -3,772 -23,434 55 31,463
Cash and cash equivalents at the end of the period 110,682 143,236 110,682 143,236 167,774 Cash and cash equivalents with rate agreements of more than 3 months
etc.
157,827 177,789 157,827 177,789 161,145
Cash and cash equivalents according to the statement of financial position
268,509 321,025
268,509 321,025
328,919
INTERIM REPORT THIRD QUARTER OF 2016
18/23
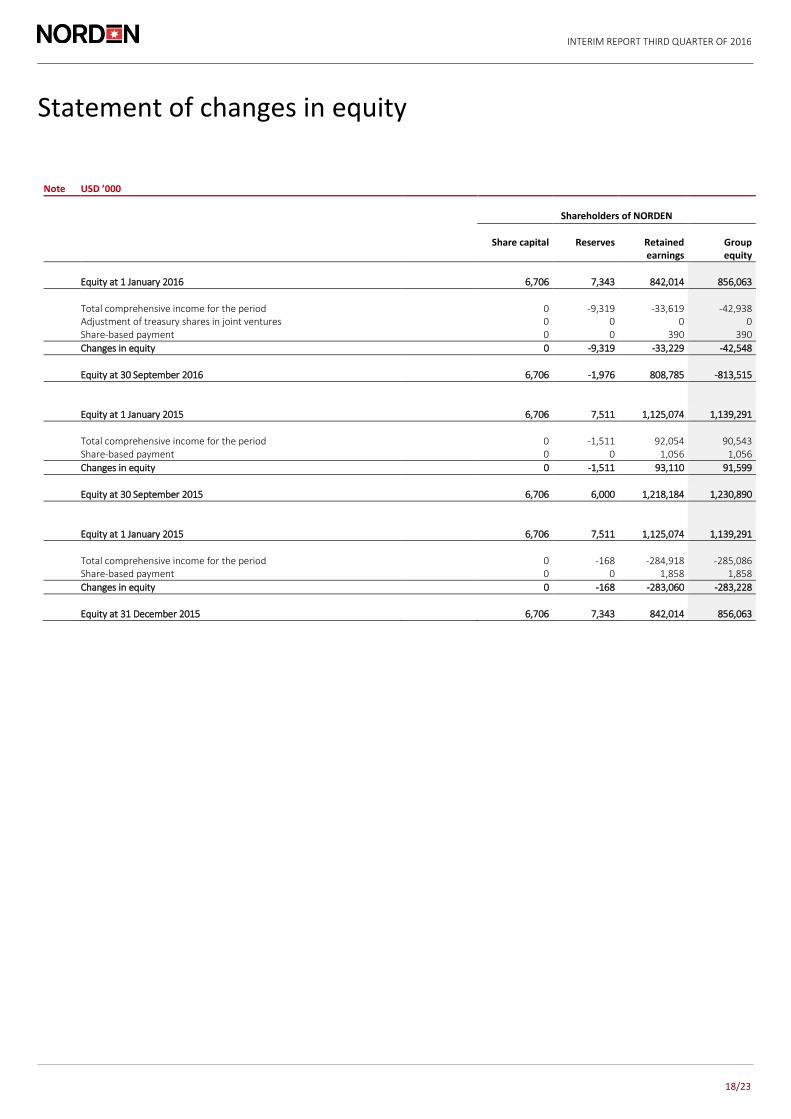
Statement of changes in equity
Note USD ’000
Shareholders of NORDEN
Share capital Reserves Retained
earnings Group equity
Equity at 1 January 2016 6,706 7,343 842,014 856,063
Total comprehensive income for the period 0 -9,319 -33,619 -42,938 Adjustment of treasury shares in joint ventures 0 0 0 0 Share-based payment 0 0 390 390
Changes in equity 0 -9,319 -33,229 -42,548
Equity at 30 September 2016 6,706 -1,976 808,785 -813,515
Equity at 1 January 2015 6,706 7,511 1,125,074 1,139,291
Total comprehensive income for the period 0 -1,511 92,054 90,543 Share-based payment 0 0 1,056 1,056
Changes in equity 0 -1,511 93,110 91,599
Equity at 30 September 2015 6,706 6,000 1,218,184 1,230,890
Equity at 1 January 2015 6,706 7,511 1,125,074 1,139,291
Total comprehensive income for the period 0 -168 -284,918 -285,086 Share-based payment 0 0 1,858 1,858
Changes in equity 0 -168 -283,060 -283,228
Equity at 31 December 2015 6,706 7,343 842,014 856,063

INTERIM REPORT THIRD QUARTER OF 2016
19/23
Notes
1. Significant accounting policies Basis of accounting The interim report comprises the summarised consolidated financial statements of Dampskibsselskabet NORDEN A/S. Accounting policies The interim report has been prepared in accordance with the international financial reporting standard IAS 34 on interim reports and additional Danish disclosure requirements for the financial statements of listed companies. The consolidated annual report for 2015 has been prepared in accordance with the International Financial Reporting Standards (IFRS). Accounting policies have not changed in relation to this except that NORDEN from 1 January 2016 has changed the presentation of the income statement under segment information, and now distributes all revenue and costs to one of the 2 segments Dry Cargo and Tankers. It concerns certain administration costs and depreciation, financials and tax. The distribution is based on an estimate of the resource consumption within the 2 segments. The change is of no significance to the Group’s results and equity. The comparative figures have been adjusted accordingly. The distribution of items in the balance sheet remains unchanged. For a complete description of accounting policies, see also pages 50-51 in the consolidated annual report for 2015. New financial reporting standards (IFRS) and interpretations (IFRIC) NORDEN has implemented the new standards and interpretations which are in force for financial years starting on 1 January 2016 or later. The changes relevant to NORDEN comprise IASB’s yearly minor improvements drawn up 2012-2014 and changes to IAS 1 comprising minor changes to the presentation of the financial statements. The changes are of no importance to NORDEN's results or equity in the interim report and disclosure in the notes. At the end of April 2016, IASB has issued the following new financial reporting standards and interpretations, which have not been adopted by the EU, but which are estimated to be of relevance to NORDEN:
• IFRS 15 regarding revenue recognition – New common standard regarding revenue recognition. Revenue is recognised as control is transferred to the buyer.
• IFRS 16 Leasing – For the lessee, the distinction between financial and operating leases is raised. In the future, operating leases must be recognised in the balance sheet with an asset and a corresponding lease commitment. The standard takes effect in 2019.
• IFRS 9 regarding financial instruments – The number of categories of financial assets is reduced to three; amortised cost category, fair value through other comprehensive income category or fair value through income statement category. Simplified rules on hedge accounting will be introduced, and writing down of receivables must be based on expected loss.
It is expected that IFRS 16 in particular can have an effect on NORDEN’s financial reporting. NORDEN is currently assessing the potential effect of these standards. NORDEN expects to implement IFRS 9 from 2017 and the remaining new standards as well as interpretations, when they become compulsory. Significant choices and assessments in the accounting policies and significant accounting estimates Management's choices and assessments in the accounting policies in respect of vessel leases, recognition of revenue and voyage costs, impairment test and onerous contracts are significant. Management's accounting estimates of receivables, contingent assets and liabilities and useful lives and residual values of tangible assets are also significant. For a description of these, see page 50 of the consolidated annual report for 2015. Risks For a description of NORDEN’s risks, see note 2 "Risk management" in the consolidated annual report for 2015 pages 51-53.

INTERIM REPORT THIRD QUARTER OF 2016
20/23
Notes
2. Fair value adjustment of certain hedging instruments
* As the hedging instruments are realised, the accumulated fair value adjustments are reclassified to operations in the same item as the hedged transaction. For further information, see the section “Significant accounting policies” in the consolidated annual report for 2015.
USD ’000 2016 2015 2016 2015 2015
Q1-Q3 Q1-Q3 Q3 Q3 Q1-Q4
Bunker hedging Fair value adjustment for: 2015 0 -1,884 0 -8,414 -2,313 2016 8,349 -4,016 1,084 -4,709 -11,306 2017 1,813 -1,294 150 -1,388 -2,338 2018 317 -918 -150 -910 -1,940 2019 27 -195 -42 -216 0 2020-2024 -1,322 0 -1,322 0 0
9,184 -8,307 -280 -15,637 -17,897 Realised fair value adjustment reclassified to ”Vessel operating costs”*
8,216 25,631
-132 7,814
29,611
Total 17,400 17,324 -412 -7,823 11,714
Forward Freight Agreements: Fair value adjustment for: 2015 0 -3,180 0 1,738 -4,343 2016 -541 -3,381 -379 598 -8,677
-541 -6,561 -379 2,336 -13,020 Realised fair value adjustment reclassified to ”Revenue” 10,395 7,114 5,503 796 10,414
Total 9,854 553 5,124 3,132 -2,606
Total 27,254 17,877 4,712 -4,691 9,108

INTERIM REPORT THIRD QUARTER OF 2016
21/23
Notes
3. Vessels
4. Prepayments on vessels and newbuildings
USD ’000 2016 2015 2015
30/9 30/9 31/12
Cost at 1 January 1,618,772 1,618,544 1,618,544 Additions for the period 27,504 35,614 59,354 Disposals for the period -30,875 -21,086 -21,086 Transferred during the period from prepayments on vessels and newbuildings 0 127,888 128,237 Transferred during the period to tangible assets held for sale -375,887 -76,634 -166,277
Cost 1,239,514 1,684,326 1,618,772
Depreciation at 1 January -377,642 -344,870 -344,870 Depreciation for the period -70,735 -49,544 -66,415 Reversed depreciation of disposed vessels 14,918 0 0 Transferred during the year to tangible assets held for sale 124,890 5,924 33,643
Depreciation -308,569 -388,490 -377,642
Write-downs at 1 January -376,879 -223,610 -223,610 Write-downs for the period 0 0 -168,683 Transferred during the year to tangible assets held for sale 163,350 4,140 15,414
Write-downs -213,529 -219,470 -376,879
Carrying amount 717,416 1,076,366 864,251
USD ’000 2016 2015 2015
30/9 30/9 31/12
Cost at 1 January 23,392 97,845 97,845 Additions for the period 2,607 63,370 72,011 Transferred during the period to vessels 0 -127,888 -128,237 Transferred during the period to tangible assets held for sale 0 -5,707 -17,967 Transferred during the period to other items 0 -260 -260
Cost 25,999 27,360 23,392
Write-downs at 1 January -11,317 0 0 Write-downs for the period 0 -3,180 -11,317
Write-downs -11,317 -3,180 -11,317
Carrying amount 14,682 24,180 12,075

INTERIM REPORT THIRD QUARTER OF 2016
22/23
Notes
5. Tangible assets held for sale
6. Related party transactions No significant changes have occurred to closely related parties or types and scale of transactions with these parties other than what is disclosed in the consolidated annual report for 2015.
7. Contingent assets and liabilities Since the end of 2015, no significant changes have occurred to contingent assets and liabilities other than those referred to in this interim report.
USD ’000 2016 2015 2015
30/9 30/9 31/12
Carrying amount at 1 January 33,644 16,954 16,954 Additions for the period to tangible assets held for sale 83,703 2,969 27,914 Additions for the period from prepayments on vessels and newbuildings 0 5,707 17,967 Additions for the period from vessels 39,373 66,570 117,220 Disposals for the period -120,529 -83,525 -111,397 Write-downs for the period 0 -3,840 -35,014
Carrying amount
36,191 4,835
33,644

INTERIM REPORT THIRD QUARTER OF 2016
23/23
Notes
8. Overview of deliveries of owned vessels and fleet values
Expected delivery of NORDEN’s newbuildings at 30 September 2016
Note: The figures are adjusted for ownership share. The overview includes 1 Supramax sold with delivery from yard in 2017.
Payments related to own vessels at 30 September 2016
Future payments to NORDEN from assets held for sale: USD 48 million, of which USD 29 million will be received during the fourth quarter 2016.
Fleet values at 30 September 2016
* Including joint ventures and assets held for sale but excluding charter party, if any.
9. Significant events after the reporting date Between the end of the quarter and the publication of this interim report, other than the developments disclosed in the interim review, no significant events have occurred which have not been recognised and adequately disclosed and which materially affect the results for the period or the statement of financial position.
2016 2017 2018 2019
Q4 Q1 Q2 Q3 Q4 Total
Dry Cargo Capesize Panamax 1 1 2 Supramax 1 4 2 7 Tank LR1 MR Handysize I alt 1 1 5 2 9
USD mill. 2016 2017 2018 2019 Total
Newbuilding payments
5
61
138
22
226
USD mill.
Number Average dwt. Carrying
amount/cost
Broker estimated
value of owned
vessels*
Broker estimated
value of charter party
Added value
Dry Cargo Post-Panamax 2.0 114,000 23 23 0 0 Panamax 6.0 79,000 127 90 24 -14 Supramax 12.5 60,000 256 227 0 -29 Handysize 8.0 37,000 116 81 19 -16
Tankers MR 9.0 50,000 284 238 1 -45 Handysize 12.0 39,000 251 199 1 -51
Total 49.5 1,057 858 45 -155


![THIRD QUARTER REPORT - Honda Pakistan · THIRD QUARTER REPORT DECEMBER 2017 "Makes all the difference" ((\\]fll ... 5.5t.%against USD and closod at 11 0.5. Agriculture Agricutture](https://img.pdfslide.net/doc/110x75/5f06dc5a7e708231d41a1987/third-quarter-report-honda-pakistan-third-quarter-report-december-2017-makes.jpg)