Embed Size (px)
Citation preview

Interim Results 2016/17Pedro Ros, Chief Executive Officer Tony Foye, Chief Financial Officer
London, 23 February 2017

Agenda
Overview Pedro Ros
Financial highlights Tony Foye
Operational review Tony Foye
Q&A Pedro RosTony Foye
Update on strategy Pedro Ros
2

33
OverviewPedro Ros
Revenue up +11%, +6% constant currency (-2% organic)Adj EBITA margin down at 18.3%, Adj PBT +2%, Dividends +3% 1
5
2
34
Acquisitions accelerating growth: performing strongly
Continued growth in R&C (+11%), driven by Compliance (+13% organic),Finance (+7%) and Insight (+26%). UK Healthcare drives growth within Insight (+15% organic)
Growing international ambition Revenue outside UK now 43% (2015: 42%)
Consistent high levels of subscription and repeatable revenue 78% (2015: 76%)
Highlights
6 Sixth Gear announced to accelerate integration and drive next stage of strategy
4

5
Financial progress overview
Overall margins
19.7%Wilmington plc (adjusted EBITA margin)
18.3%
29%
16%
11%
22%
32%
21%
8%
22%
ContributionMargin2016
ContributionMargin2015
29%
13%
22%
36%
Revenue up(% of Group Revenue)
Risk &Compliance
Finance
Legal
Insight
ReportedGrowth
+11%
+7%
-7%
+26%
Revenue
£54.8m +11%
Profits up(% of Group Contribution)
29%
7%
16%
48%Risk &Compliance
Finance
Legal
Insight
ReportedGrowth
+1%
-21%
+24%
+22%
Contribution
EBITA £10.0m +3%

6
Financial highlightsTony Foye

Deferred revenue
£24.2m (2015:£21.3m)
Adjusted EBITA margin
18.3% (2015:19.7%)
Adjusted EPS
8.10p (2015:7.93p)
Adjusted PBT
£9.1m (2015:£8.9m)
Positive momentum
2%
Adjusted EBITA
£10.0m (2015:£9.7m)
140bps
2%
13%
Dividend per share
3.9p (2015:3.8p) 3%
Compared to interim results six months to 31 December 2015
3%
7

Income statement
6 months2016
£m
6 months2015
£m
12 months2015/16
£m%£m
Variance
18.3
10.0EBITA Margin % 21.4
Adjusted EBITA 22.60.3 +39.719.7
54.8Revenue 105.75.4 +1149.4
(0.9)Interest/facility fees (1.7)(0.1) -(0.8)Adjusted profit before tax 9.1 20.90.2 +28.9
8.10pAdjusted basic EPS 18.69p7.93p +23.90pDividend per share 8.10p3.80p +3
8
(0.9)Adjusting items (2.6)(1.1) 0.2(0.3)Share based payments (0.6)(0.3) -(2.9)Amortisation (5.5)(3.0) 0.1
- (15.7)-ImpairmentProfit before tax & impairment 5.0 12.24.5
(1.1) (2.8)(1.0)Taxation
0.5-
(0.1)Profit/(loss) after tax 3.9 (6.3)
22.6%3.5
Underlying tax rate 22.4%23.0%0.4

Cash Flow
Cash conversion % 79% 85% 106%
6 months2016
£m
6 months2015
£m
12 months2015/16
£m
Variance
£m
Adjusted EBITDA 11.0 10.7 24.60.3Movement in working capital (3.0) (2.5) (0.7)(0.5)Cash inflow from operations 8.0 8.2 23.9(0.2)Interest paid (0.9) (0.7) (1.5)(0.2)Tax paid (2.0) (1.4) (3.2)(0.6)Net capital expenditure (1.4) (0.8) (1.5)(0.7)Free cash flow before dividends 3.7 5.3 17.7(1.7)Equity dividends (3.9) (3.5) (6.8)(0.4)Acquisition spend (2.1) (8.5) (13.9)6.4Deferred consideration/non-controlling interests (1.3) (0.3) (0.7)(1.0)Disposal of business/fixed assets - 0.3 0.3 (0.3)
Brought forward net debt (34.7) (28.6) (28.6)(6.1)FX (1.0) (0.3) (1.1)(0.7)Carried forward net debt (40.6) (36.6) (34.7)(4.0)
Change in net debt during the year (4.9) (7.7) (5.0)2.8
Adjusting items (including refinance fees) (1.2) (0.8) (1.4)(0.4)Share based payments (0.1) (0.2) (0.2)0.1
9

Summary balance sheet
2016£m
2015£m
Goodwill/Intangibles 103.6 108.1Property, plant & equipment 4.9 4.7Net debt (40.6) (36.6)Working capital 9.1 5.1Tax liabilities (0.8) (0.7)
Deferred revenue (24.2) (21.3)Deferred tax (3.5) (2.8)
Net assets 44.2 55.4
Debt profile
62%
Provisions for future purchaseof non-controlling interests (0.1) (0.1)
Capitalised bank fees 0.4 0.5
Deferred consideration (2.4) (0.8)Financial instruments (2.2) (0.7)
62% 56%
38% 44%
2016 2015Net debt Remaining facilities
£65m
10

Operational reviewTony Foye
11

12
Profile of the Business
29%
36%
13%
22%INSIGHT
RISK & COMPLIANCE
FINANCE
LEGAL
(24)
(15)
(25)
(36)
UK
57%17%
17%
9%
(18)
(15)
(58)EUROPE
NORTH AMERICA
REST OF WORLD
44%47%
10%
(46)
(9)
(49)
INFORMATION
EDUCATION
NETWORKING
REVENUE BY REGIONS
REVENUE BY AREAS OF KNOWLEDGE
REVENUE BY TYPE
Turning knowledge to advantage
( ) 2015 figures
(9)
UK
RevenueContributionMargin %
2016£m
6 months to 2015£m
Change£m
Change%
Revenue by region
2016 2015
13
CC%
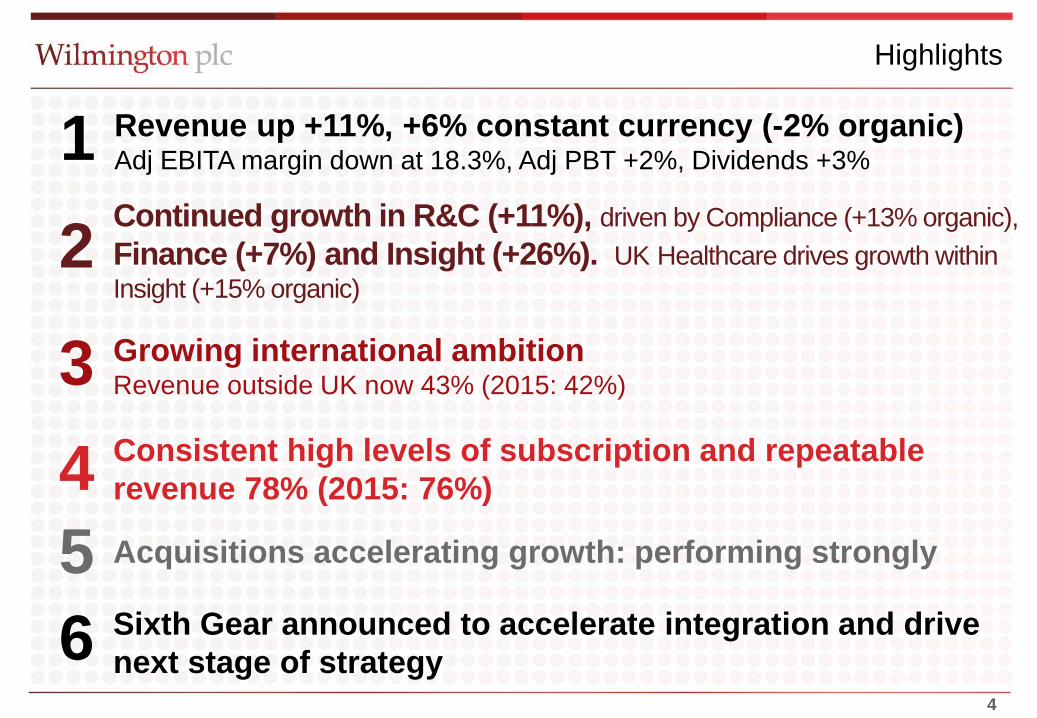
-19.55.6
29%
17.65.6
32%
1.9 +11%-
Risk & Compliance
• Revenue driven by demand from compliance training (+13% organic)• Margin drop reflects planned US compliance investment• Solid growth from Axco (+6%) (+4% organic)• Weak performance from Compliance Week (flagship annual conference on plan)
UK Europe (excl UK) North America Asia Rest of World`
+6%

RevenueContributionMargin %
2016£m
6 months to 2015£m
Change£m
Change%
Revenue by region
2016 2015
14
CC%
-0.512.41.9
16%
11.62.4
21%
0.8 +7%-21%
Finance
• AMT down reflecting 2015/16 issues and Asia Pacific (£1.1m)• Technical accountancy training in 2015 had extra UK fiscal budget• Good maiden revenue contribution from SWAT (£2.2m) integration going well
+2%
UK Europe (excl UK) North America Asia Rest of World`

RevenueContributionMargin %
2016£m
6 months to 2015£m
Change£m
Change%
Revenue by region
2016 2015
15
CC%
0.27.10.8
11%
7.60.68%
-0.5 -7%+24%
Legal
• Law for lawyers structural market challenges; contribution up after reorganisation• Exit from legal practice support markets and repositioning CLT training model • Law for non-lawyers: revenue down compared to strong 2015 comparator period
-9%
UK Europe (excl UK) North America`

RevenueContributionMargin %
2016£m
6 months to 2015£m
Change£m
Change%
Revenue by region
2016 2015
16
CC%
0.615.83.4
22%
12.52.8
22%
3.2 +26%+22%
Insight
• Healthcare now 73% of revenue; UK organic +15%• Acquisitions contributed £1.7m, performing strongly• FRA deferred income up 15%
19%
UK Europe (excl UK) North America`

Acquisition of HSJ
• Acquisition of Health Service Journal, the UK’s leading Healthcare information and networking business
• Highly complementary to Wilmington Healthcare business, significantly enhancing presence across the UK healthcare market
• HSJ is a highly trusted brand, providing unparalleled penetration into NHS and healthcare industry customer segments
• Growing digital subscription information products and networking events & awards (around 70%repeatable revenue)
• Cash consideration of £19m (gross)*
• Multiple of 6.8x 2016 EBITDA
• EPS enhancing in first full financial year
• Funded from extended bank facility (£85m)
*£2m cash with business
17

Update on StrategyPedro Ros
18

Strategy update
Since 2014 we have been focused on implementing our new strategy
New model based on Information, Education and Networking
New talent in key positions
Five targeted acquisitions in key areas to maximise the model
Strategic systems implementation (Salesforce and eLearning)
Organic investment on strategic projects
19

Today, we announce 6th Gear, an acceleration project and a key part of our vision for the next three years
6th Gear will drive Wilmington’s transition to the next phase of strategy by:
1) More focused structure
2) Maximising client relationships
3) Accelerating integration
Strategy update
20

More Focused Structure
• Migration to a structure comprising three divisions:
• Exit from legal practice support markets
• Rebrand Insight into Healthcare
Risk & Compliance
Professional
Healthcare34%
34%
32%
Healthcare
Professional
Risk & Compliance
Better balance business *
* Pro forma revenue split based on result to 30 June 2016 adjusted to include HSJ revenue
21

Enhancing client focus
• Wilmington enjoys exceptional relationships with blue-chip clients across different parts of the company.
Opportunity• We recognise the strategic potential of cross-divisional collaboration; exploiting these
opportunities requires exceptional client focus and a consistent approach from all our businesses
Key account programme (KAP)• All Wilmington companies are reinforcing account-management capabilities,
prioritising the development of strategic corporate partnerships and implementing a common CRM to highlight cross-market potential
• A KAP has been launched across Wilmington involving our top 20 clients
• Initial successes in integrated Healthcare assignments
22

Accelerating Integration
• Exploit opportunities arising from the new structure and the increased commonality in shared services
Identify projects delivering efficiency benefits
• Improved workplace effectiveness by consolidating office space and introducing enterprise-wide It systems
• Establish joint procurement team
• Integrate central functions
• Expand best-practice marketing initiatives
• Continue Salesforce implementation
• Develop more outsource partnerships
23

Risk & Compliance
Provider of accredited education, information and market intelligence on regulatory and compliance matters to compliance officers and risk managers globally
Revenue
Our Focus:
• ICA (International Compliance Association)
• Launch compliance services in the US market and global insurance data services
• Growing regulatory and compliance needs
• New topics, new territories and new industries
• Proprietary knowledge in compliance and insurance
• Fragmented market
Driven by:
34%
23%
22%
13%
8%ROW
UK
NorthAmerica
Europe
Asia
6 months ended 31 Dec 2016
24

Risk & Compliance
Leading learning services for the growing compliance sector
Global insights for the international insurance industry
25

Professional
• Changing financial standards and regulation
• Increasing demand for digital education solutions
Our Focus:
• Strong brands, leading content, exceptional delivery and long term client relationships
• Transforming customer experience
Provider of in-depth education, information and networking in financial and related professional services
Driven by:Revenue
• Expanding access to international markets
• Common technology and platform
6 months ended 31 Dec 2016
26

Professional
Established brands launching new digital learning channels
27

Healthcare
Provider of information, insight, education and networking for pharmaceutical and wider healthcare sectors
Driven by:
• The rising cost of healthcare, driven by changes in demographics, lifestyle and increased regulation
• Demand for analytics to plan and deliver smarter, more cost-effective care and better patient outcomes
Our Focus:
• Applying superior insight for clients business intelligence needs
• Access to bigger, global budgets
• Strategic acquisitions - HSJ
2016 Revenue by type
Revenue by Geography• Expanding global healthcare market
6 months ended 31 Dec 2016
28

UK is a model for our international expansion
WHC delivers superior Insight, Education and Networking solutions to Healthcare industry professionals
Superior local intelligence model is replicable in different markets and drives strategic development activities
29
Healthcare

Healthcare
Connecting healthcare and pharma industries through insight, networking and digital learning
30

Summary
1) Strong organic performance from key growth areas (Compliance/Insurance/HC)
2) Mixed start although second half expected to be more profitable
3) Positive performance from recent acquisitions
4) Focus on project 6th Gear to drive long term growth and scale
5) Dividend increase reflecting confidence in the future
31

Q&A
Pedro Ros and Tony Foye
32

33
Thank you.