Embed Size (px)
Citation preview
Interim Results 2010
For the 6 months ended 30 June

2
Company Profile
3
Central Rand Gold
Central Rand Gold Limited (“CRG” or the “Company”) is the holding company for a group of companies (“the Group”) engaged in gold mining and exploration that aims to bring profitable and sustainable gold mining back to the City of Johannesburg.
CRG was admitted to the Official List of the UK Listing Authority and main boards of the London Stock Exchange plc (“LSE”) and the Johannesburg Stock Exchange Limited (“JSE”) on 8 November 2007, after consolidating contiguous exploration permits covering some 138 square kilometres in the most prolific gold producing area of the world – the Central Rand Goldfields on the southern outskirts of Johannesburg. The Company’s primary listing is on the LSE and the JSE is a secondary listing.
CRG plans to extract all profitable gold from its resource base using modern, mechanised mining, processing and the most environmentally friendly technologies. Once the mineralised areas are worked out, stabilised and rehabilitated, the Company intends to make the land available for urban development.
Mining Rights and Prospecting Rights
The Group has acquired seven New Order Prospecting Rights which constitute from west to east, Western Areas A, B and E, the three Cs (one prospect-ing right for Consolidated Main Reef (“CMR”), Crown Mines and City Deep), Anglo Deeps, Village Main and Robinson Deep (one Prospecting Right), and Simmer & Jack. The Prospecting Rights extend over an area from west to east of about 40 kilometres and north to south of about seven kilometres (the “Central Rand Project”). In addition, the Southern Deeps New Order Prospecting Right application (the “Prospecting Application”), if granted, would extend the Central Rand Project by a further 13 kilometres to the south. Currently, certain of the Prospecting Rights are in the process of being transferred from Rand Quest Syndicate Limited (“RQS”) to Central Rand Gold South Africa (Pty) Limited (“CRGSA”) via section 11 applications lodged with the South African Department of Mineral Resources (“DMR”) in respect of Western Areas A, B and E, Simmer & Jack and the Southern Deeps prospecting application.
The Company received its first New Order Mining Right from the South African Department of Mineral Resources on 17 September 2008. This Mining Right, which was awarded 14 months after the initial application, enables CRG to mine gold at its Consolidated Main Reef, Langlaagte and Crown Mines tenements.
Central Rand Gold’s Current Resource Estimates
The Company’s total JORC Compliant Resources are presented in the table below:
Indicated Inferred
Reef Tonnes (Mt) Au (g/t) Au (Moz) Tonnes (Mt) Au (g/t) Au (Moz)
Main Reef 42.2 6.6 9.0 15.8 7.5 3.8
Main Reef Leader 35.6 11.7 13.4 9.9 12.6 4.0
Pyritic Quartzite - - - 0.9 45.0 1.3
South Reef - - - 5.3 6.0 1.0
Bird Reef 4.5 4.1 0.6 14.7 4.2 2.0
Kimberley Reef 5.1 2.4 0.4 11.9 3.1 1.2
Total 87.4 8.3 23.4 58.5 7.1 13.3
The JORC Compliant Ore Reserve over CMR is presented in the table below:
Area Classification Tonnes(Mt)
Au(g/t)
Au(koz)
Central Probable 1.94 4.1 253
West Probable 1.79 4.0 229
Total Probable 3.73 4.0 482
Company Profile

4
5
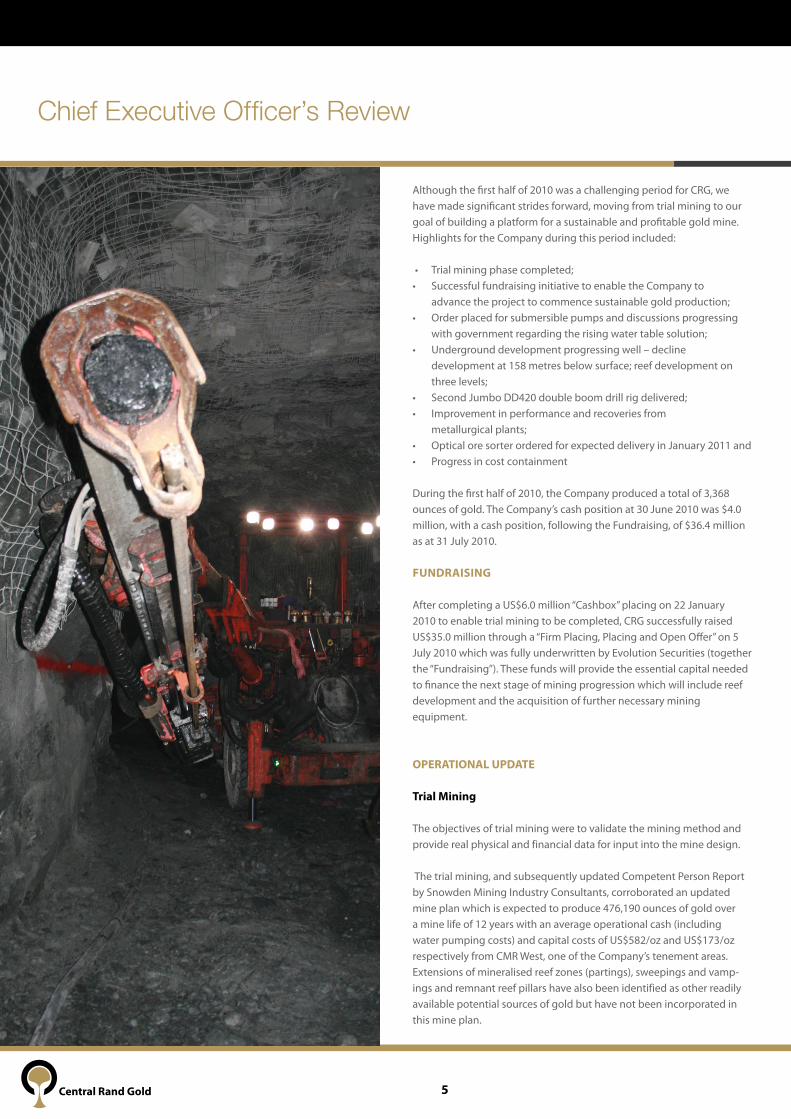
Although the first half of 2010 was a challenging period for CRG, we have made significant strides forward, moving from trial mining to our goal of building a platform for a sustainable and profitable gold mine. Highlights for the Company during this period included:
• Trial mining phase completed;• Successful fundraising initiative to enable the Company to advance the project to commence sustainable gold production;• Order placed for submersible pumps and discussions progressing with government regarding the rising water table solution;• Underground development progressing well – decline development at 158 metres below surface; reef development on three levels;• Second Jumbo DD420 double boom drill rig delivered;• Improvement in performance and recoveries from metallurgical plants;• Optical ore sorter ordered for expected delivery in January 2011 and• Progress in cost containment
During the first half of 2010, the Company produced a total of 3,368 ounces of gold. The Company’s cash position at 30 June 2010 was $4.0 million, with a cash position, following the Fundraising, of $36.4 million as at 31 July 2010.
FundRAIsInG
After completing a US$6.0 million “Cashbox” placing on 22 January 2010 to enable trial mining to be completed, CRG successfully raised US$35.0 million through a “Firm Placing, Placing and Open Offer” on 5 July 2010 which was fully underwritten by Evolution Securities (together the “Fundraising”). These funds will provide the essential capital needed to finance the next stage of mining progression which will include reef development and the acquisition of further necessary mining equipment.
OPERATIOnAL uPdATE
Trial Mining
The objectives of trial mining were to validate the mining method and provide real physical and financial data for input into the mine design.
The trial mining, and subsequently updated Competent Person Report by Snowden Mining Industry Consultants, corroborated an updated mine plan which is expected to produce 476,190 ounces of gold over a mine life of 12 years with an average operational cash (including water pumping costs) and capital costs of US$582/oz and US$173/oz respectively from CMR West, one of the Company’s tenement areas. Extensions of mineralised reef zones (partings), sweepings and vamp-ings and remnant reef pillars have also been identified as other readily available potential sources of gold but have not been incorporated in this mine plan.
Chief Executive Officer’s Review
6
Mining
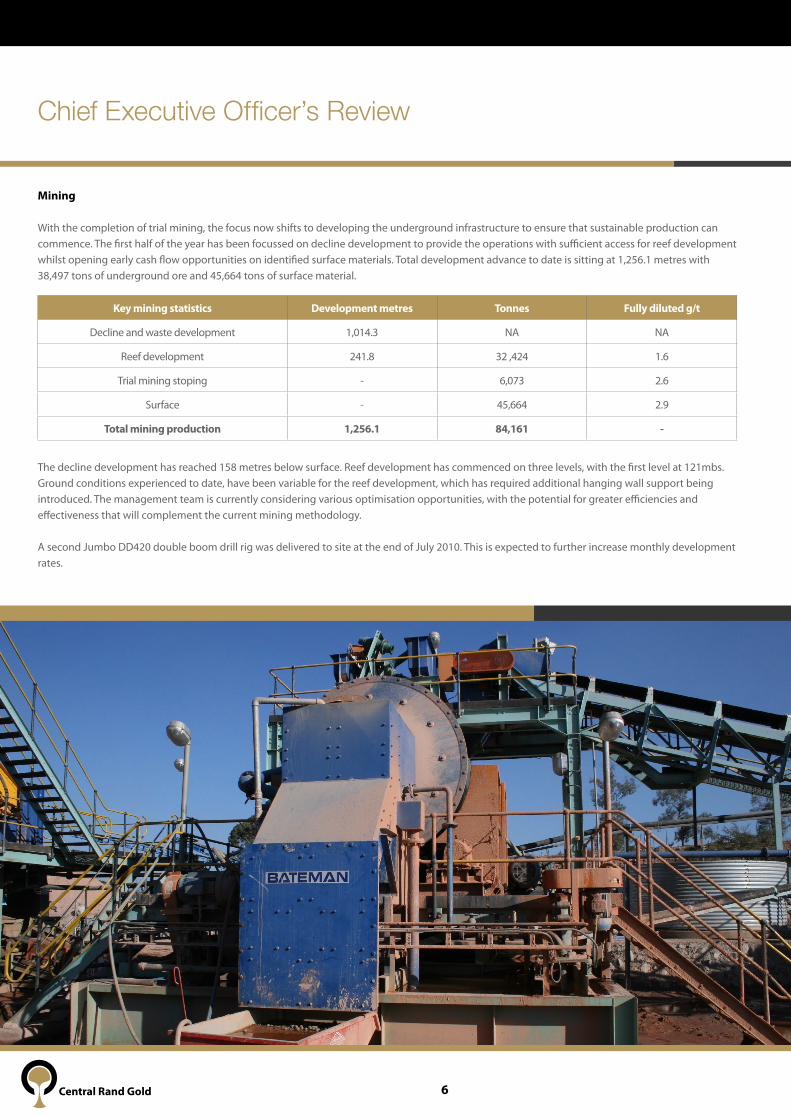
With the completion of trial mining, the focus now shifts to developing the underground infrastructure to ensure that sustainable production can commence. The first half of the year has been focussed on decline development to provide the operations with sufficient access for reef development whilst opening early cash flow opportunities on identified surface materials. Total development advance to date is sitting at 1,256.1 metres with 38,497 tons of underground ore and 45,664 tons of surface material.
The decline development has reached 158 metres below surface. Reef development has commenced on three levels, with the first level at 121mbs. Ground conditions experienced to date, have been variable for the reef development, which has required additional hanging wall support being introduced. The management team is currently considering various optimisation opportunities, with the potential for greater efficiencies and effectiveness that will complement the current mining methodology.
A second Jumbo DD420 double boom drill rig was delivered to site at the end of July 2010. This is expected to further increase monthly development rates.
Chief Executive Officer’s Review
Key mining statistics development metres Tonnes Fully diluted g/t
Decline and waste development 1,014.3 NA NA
Reef development 241.8 32 ,424 1.6
Trial mining stoping - 6,073 2.6
Surface - 45,664 2.9
Total mining production 1,256.1 84,161 -
7
Geology
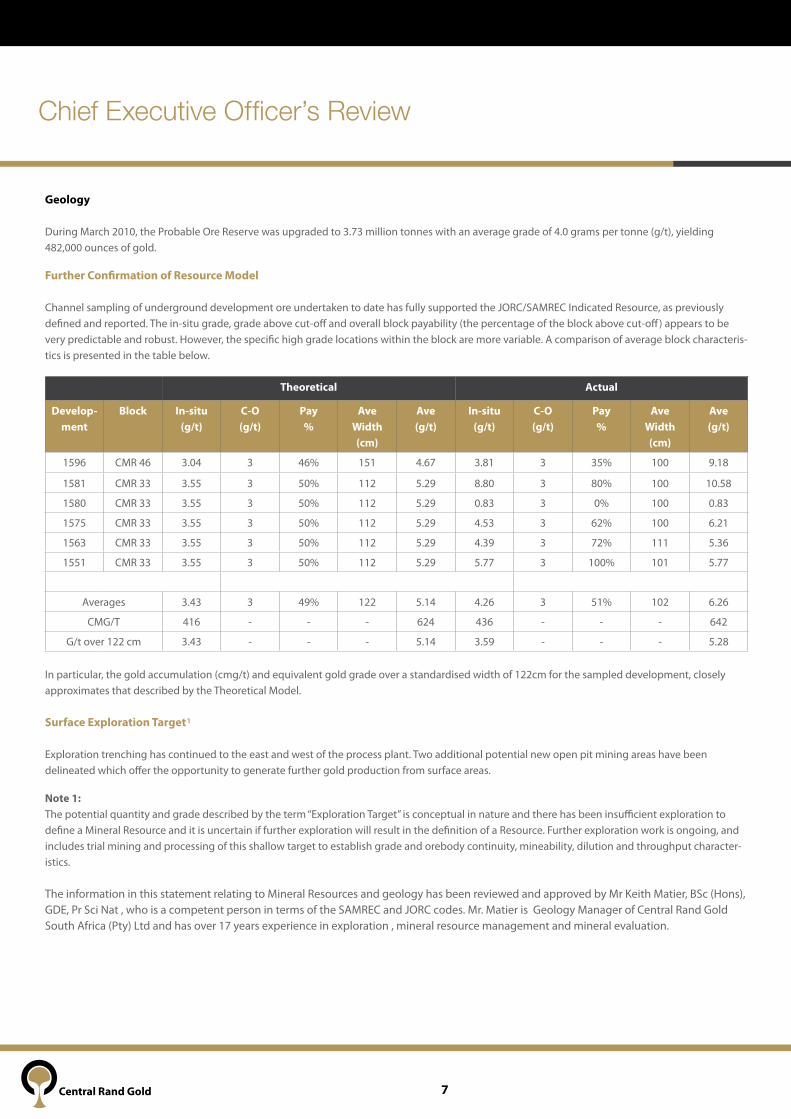
During March 2010, the Probable Ore Reserve was upgraded to 3.73 million tonnes with an average grade of 4.0 grams per tonne (g/t), yielding 482,000 ounces of gold.
Further Confirmation of Resource Model
Channel sampling of underground development ore undertaken to date has fully supported the JORC/SAMREC Indicated Resource, as previously defined and reported. The in-situ grade, grade above cut-off and overall block payability (the percentage of the block above cut-off) appears to be very predictable and robust. However, the specific high grade locations within the block are more variable. A comparison of average block characteris-tics is presented in the table below.
In particular, the gold accumulation (cmg/t) and equivalent gold grade over a standardised width of 122cm for the sampled development, closely approximates that described by the Theoretical Model.
surface Exploration Target
Exploration trenching has continued to the east and west of the process plant. Two additional potential new open pit mining areas have been delineated which offer the opportunity to generate further gold production from surface areas.
note 1: The potential quantity and grade described by the term “Exploration Target” is conceptual in nature and there has been insufficient exploration to define a Mineral Resource and it is uncertain if further exploration will result in the definition of a Resource. Further exploration work is ongoing, and includes trial mining and processing of this shallow target to establish grade and orebody continuity, mineability, dilution and throughput character-istics.
The information in this statement relating to Mineral Resources and geology has been reviewed and approved by Mr Keith Matier, BSc (Hons), GDE, Pr Sci Nat , who is a competent person in terms of the SAMREC and JORC codes. Mr. Matier is Geology Manager of Central Rand Gold South Africa (Pty) Ltd and has over 17 years experience in exploration , mineral resource management and mineral evaluation.
Theoretical Actual
develop-ment
Block In-situ (g/t)
C-O (g/t)
Pay%
Ave Width(cm)
Ave (g/t)
In-situ (g/t)
C-O (g/t)
Pay %
Ave Width(cm)
Ave (g/t)
1596 CMR 46 3.04 3 46% 151 4.67 3.81 3 35% 100 9.18
1581 CMR 33 3.55 3 50% 112 5.29 8.80 3 80% 100 10.58
1580 CMR 33 3.55 3 50% 112 5.29 0.83 3 0% 100 0.83
1575 CMR 33 3.55 3 50% 112 5.29 4.53 3 62% 100 6.21
1563 CMR 33 3.55 3 50% 112 5.29 4.39 3 72% 111 5.36
1551 CMR 33 3.55 3 50% 112 5.29 5.77 3 100% 101 5.77
Averages 3.43 3 49% 122 5.14 4.26 3 51% 102 6.26
CMG/T 416 - - - 624 436 - - - 642
G/t over 122 cm 3.43 - - - 5.14 3.59 - - - 5.28
Chief Executive Officer’s Review
1
8
ds Open Pit Block
To the east of the plant, trenching has exposed approximately 80m of in-situ Main Reef Leader, Main Reef and Mineralised Middling. Material exposed can be extracted through free digging and is open at depth. Combined assay results for material exposed thus far are as follows:
• Main Reef Leader : 6.4 g/t over 58cm;• Middling : 2.2g/t over 47cm;• Main Reef : 3.6g/t over 70cm; and• Total Package : 4.2g/t over 175cm.
An estimated exploration target of between 22,000 tonnes and 28,000 tonnes has been discovered in these areas with composite grades of between 3.3g/t and 3.8g/t.
KF Open Pit Block
To the west of the process plant, exploration trenching has exposed approximately 160m of Main Reef package. The material exposed is amenable to free digging, although between 3m and 5m of overburden and backfill is present. The Main Reef averages approximately 7.1g/t over a diluted 102cm width with occasional Main Reef Leader remnant pillars present, grading up to 290g/t.
An estimated exploration target of between 27,000 tonnes and 55,000 tonnes has been discovered in this area with composite grades of between 7.1g/t and 7.5g/t.
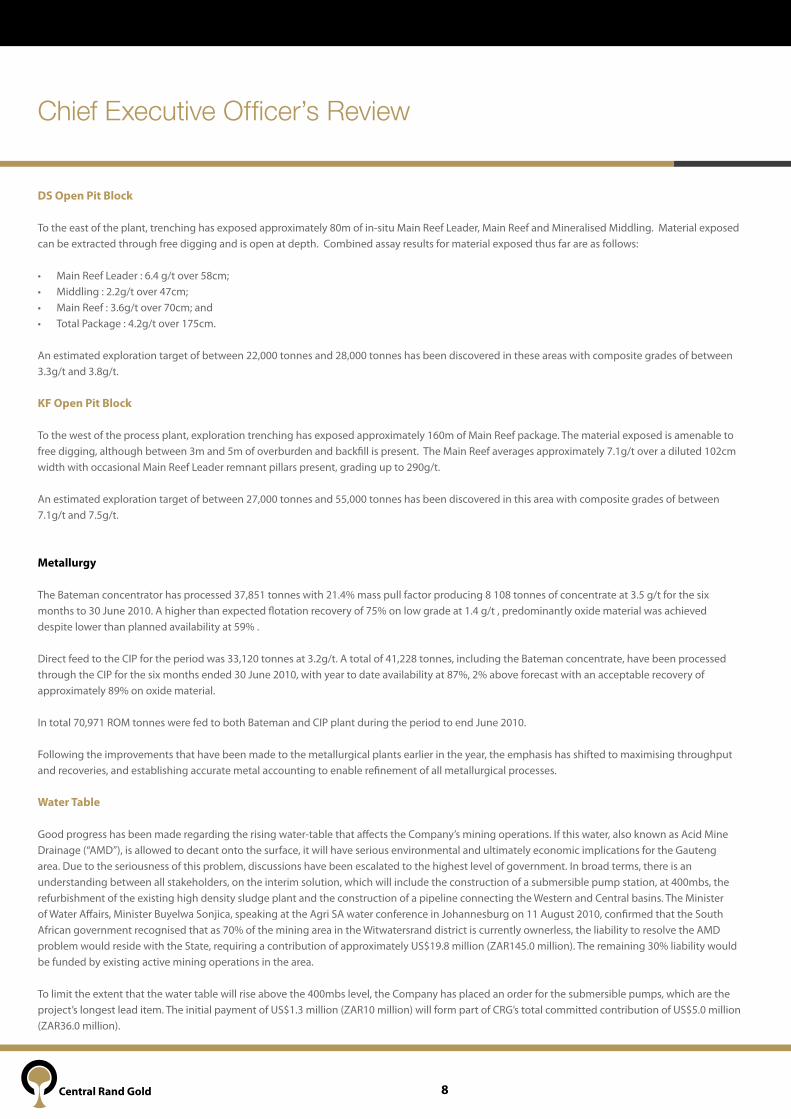
Metallurgy
The Bateman concentrator has processed 37,851 tonnes with 21.4% mass pull factor producing 8 108 tonnes of concentrate at 3.5 g/t for the six months to 30 June 2010. A higher than expected flotation recovery of 75% on low grade at 1.4 g/t , predominantly oxide material was achieved despite lower than planned availability at 59% .
Direct feed to the CIP for the period was 33,120 tonnes at 3.2g/t. A total of 41,228 tonnes, including the Bateman concentrate, have been processed through the CIP for the six months ended 30 June 2010, with year to date availability at 87%, 2% above forecast with an acceptable recovery of approximately 89% on oxide material.
In total 70,971 ROM tonnes were fed to both Bateman and CIP plant during the period to end June 2010.
Following the improvements that have been made to the metallurgical plants earlier in the year, the emphasis has shifted to maximising throughput and recoveries, and establishing accurate metal accounting to enable refinement of all metallurgical processes.
Water Table
Good progress has been made regarding the rising water-table that affects the Company’s mining operations. If this water, also known as Acid Mine Drainage (“AMD”), is allowed to decant onto the surface, it will have serious environmental and ultimately economic implications for the Gauteng area. Due to the seriousness of this problem, discussions have been escalated to the highest level of government. In broad terms, there is an understanding between all stakeholders, on the interim solution, which will include the construction of a submersible pump station, at 400mbs, the refurbishment of the existing high density sludge plant and the construction of a pipeline connecting the Western and Central basins. The Minister of Water Affairs, Minister Buyelwa Sonjica, speaking at the Agri SA water conference in Johannesburg on 11 August 2010, confirmed that the South African government recognised that as 70% of the mining area in the Witwatersrand district is currently ownerless, the liability to resolve the AMD problem would reside with the State, requiring a contribution of approximately US$19.8 million (ZAR145.0 million). The remaining 30% liability would be funded by existing active mining operations in the area.
To limit the extent that the water table will rise above the 400mbs level, the Company has placed an order for the submersible pumps, which are the project’s longest lead item. The initial payment of US$1.3 million (ZAR10 million) will form part of CRG’s total committed contribution of US$5.0 million (ZAR36.0 million).
Chief Executive Officer’s Review

9
Corporate Overhead
Cost containment continues to be a key focus for the Company. As part of this process, a total of 46 support staff accepted redundancy packages, reducing the support payroll costs by 28%. With effect from the beginning of July, the head office building in Killarney was vacated, with all functions moving to the existing operational offices at Rand Leases, Roodepoort, which will result in significant savings going forward.
Management and directorate
Don Harper resigned as our Head of Mining at the end of June 2010, due to family reasons, but will still be available to us in a consultancy capacity until the end of September 2010. Our thanks go to him for his valuable contribution towards reconfiguring and refocusing CRG’s mining operations. A recruitment process is at an advanced stage to find a replacement. In the interim, John Ramabaleha is acting as the Head of Mining, with the continuing support of the mining contractors, Australian Contract Mining (ACM).
In February 2010, Patrick Malaza and Jerome Brauns were appointed to the Board of Directors (the “Board”) as Finance Director and Non-Executive Director, respectively.
In April 2010 the following changes were made to the Board:
• Michael McMahon succeeded Alastair Walton as the CRG Chairman; and• Robert Kirby resigned as a Non-Executive Director.
BLACK ECOnOMIC EMPOWERMEnT
Funding Call and Call Option: Arbitration
Puno Gold Investments (Proprietary) Limited (“Puno”), the 26% shareholder in Central Rand Gold SA, has failed to institute the arbitration proceedings envisaged by Order of the South Gauteng High Court in May 2009, in order to resolve the dispute surrounding the minority shareholder’s funding obligations and the validity of the Company’s call option in respect of their shares in consequence. Attempts to resolve the disputes amicably have been explored to no avail. In the circumstances, the Company is now taking steps to ensure that the arbitration proceedings be heard as soon as possible and has itself taken steps in order to have an arbitrator appointed.
damages Claim
Puno has issued a summons on the Company, claiming damages to the value of US$17 million. This action, instituted by Puno against the Company out of the South Gauteng High Court, Johannesburg, traverses issues similar to those covered by Puno’s previous application. In particular, Puno’s damages claim is premised on a similar interpretation of the Shareholders’ Agreement as it contended for in the previous application.
The previous application was dismissed by Acting Judge, Alan Horwitz SC, on Thursday, 5 November 2009, with costs, including the costs of two counsel on the grounds that Puno had failed to make out a case for the relief sought on each and every ground which formed the subject of the ap-plication hearing. Puno’s application for leave to appeal against the judgment was also dismissed with a similar order as to costs. In relation to Puno’s interpretation of the Shareholders’ Agreement, the Acting Judge expressly rejected the very interpretation on which the present action seeks to rely.
It is the Company’s considered view that the present action is thus equally ill-founded, and possibly vexatious, and while Puno has in any event failed to take proper and appropriate steps in the institution of these proceedings on which basis alone the present action must be stayed, Puno’s conten-tions for the relief sought are considered to be flawed and devoid of merit.
In consequence, the Directors are of the opinion that in as much as the action has no prospects of success, this will not have any material conse-quences in respect of the consolidated accounts of the Group.
Chief Executive Officer’s Review
10
Chief Executive Officer’s Review
FInAnCIAL REvIEW
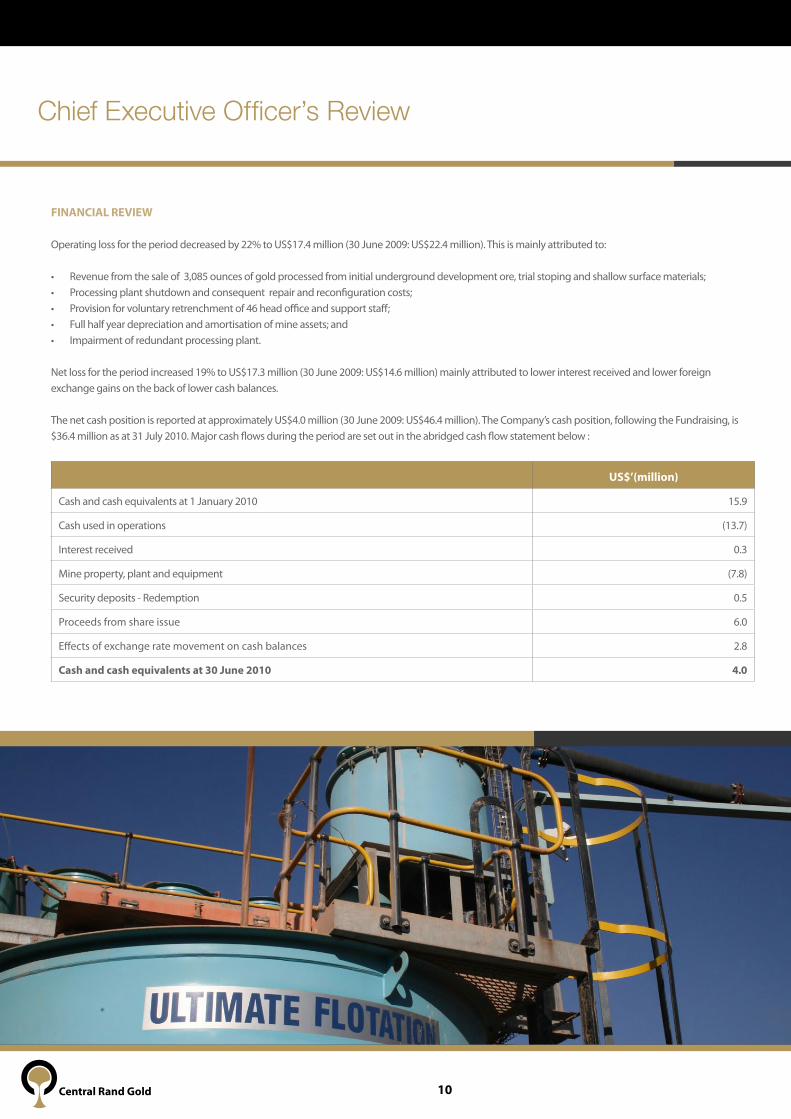
Operating loss for the period decreased by 22% to US$17.4 million (30 June 2009: US$22.4 million). This is mainly attributed to:
• Revenue from the sale of 3,085 ounces of gold processed from initial underground development ore, trial stoping and shallow surface materials;• Processing plant shutdown and consequent repair and reconfiguration costs;• Provision for voluntary retrenchment of 46 head office and support staff;• Full half year depreciation and amortisation of mine assets; and• Impairment of redundant processing plant.
Net loss for the period increased 19% to US$17.3 million (30 June 2009: US$14.6 million) mainly attributed to lower interest received and lower foreign exchange gains on the back of lower cash balances.
The net cash position is reported at approximately US$4.0 million (30 June 2009: US$46.4 million). The Company’s cash position, following the Fundraising, is $36.4 million as at 31 July 2010. Major cash flows during the period are set out in the abridged cash flow statement below :
us$’(million)
Cash and cash equivalents at 1 January 2010 15.9
Cash used in operations (13.7)
Interest received 0.3
Mine property, plant and equipment (7.8)
Security deposits - Redemption 0.5
Proceeds from share issue 6.0
Effects of exchange rate movement on cash balances 2.8
Cash and cash equivalents at 30 June 2010 4.0

11
OuTLOOK
With trial mining now completed, the Group is committed to achieving the implementation of sustainable and profitable gold mining operations.
The second half of 2010 will focus mainly on establishing CRG’s underground mining operations, having made good progress in the first half, with 1,256 metres of development completed. The Company will continue to seek to optimise its mining methodology; improving the speed that it can access mineable reef when poor ground conditions are encountered.
As outlined at the time of the fundraising in June 2010, the Company will also focus on securing its mining fleet. The global increase in the demand for mining equipment has resulted in delivery lead times increasing substantially over the last six months. The successful fundraising has enabled the Company to have meaningful discussions with various equipment suppliers in an attempt to secure essential underground mining equipment. Until the Fundraising was completed it was not possible to contract for the additional equipment. The most significant being a Long Hole Rig, which is required to commence underground stoping, and any delay in delivery could have short term production implications as the 2010 production forecast predominantly relies on the processing of higher grade underground ore. In order to mitigate these effects, extended surface exploration and surface mining have been undertaken to ensure the optimal utilisation of metallurgical plants. The Company will continue with its underground mine development programme, establishing stoping blocks, while it awaits confirmation of delivery of the Long Hole Rig.
From a metallurgy point of view, the emphasis will be on successfully implementing the optical ore sorter, which is expected to be delivered in January 2011. We have retained the option to rent an ore sorter in the interim, should underground production ramp up prior to delivery of the new unit. The ore sorter will provide an effective mechanism to remove waste from underground ore linked to the mining method being utilised. It will also deal with dilution and provide an efficient way of “high grading” material so that recoveries can be maximised.
Another important emphasis will be the completion of the feasibility study by early 2011 relating to CMR East, which is the Company’s next development target.
During the first half of 2010, the Company produced a total of 3,368 refined ounces of gold, in line with management expectations. The second half of 2010 promises to be an exciting period for Central Rand Gold, as it will build on the trial mining experience and create the platform for strong development and production progress to be made in the years that lie ahead.
Johan du Toit
Chief Executive Officer’s Review
12
Interim Results 2010
13
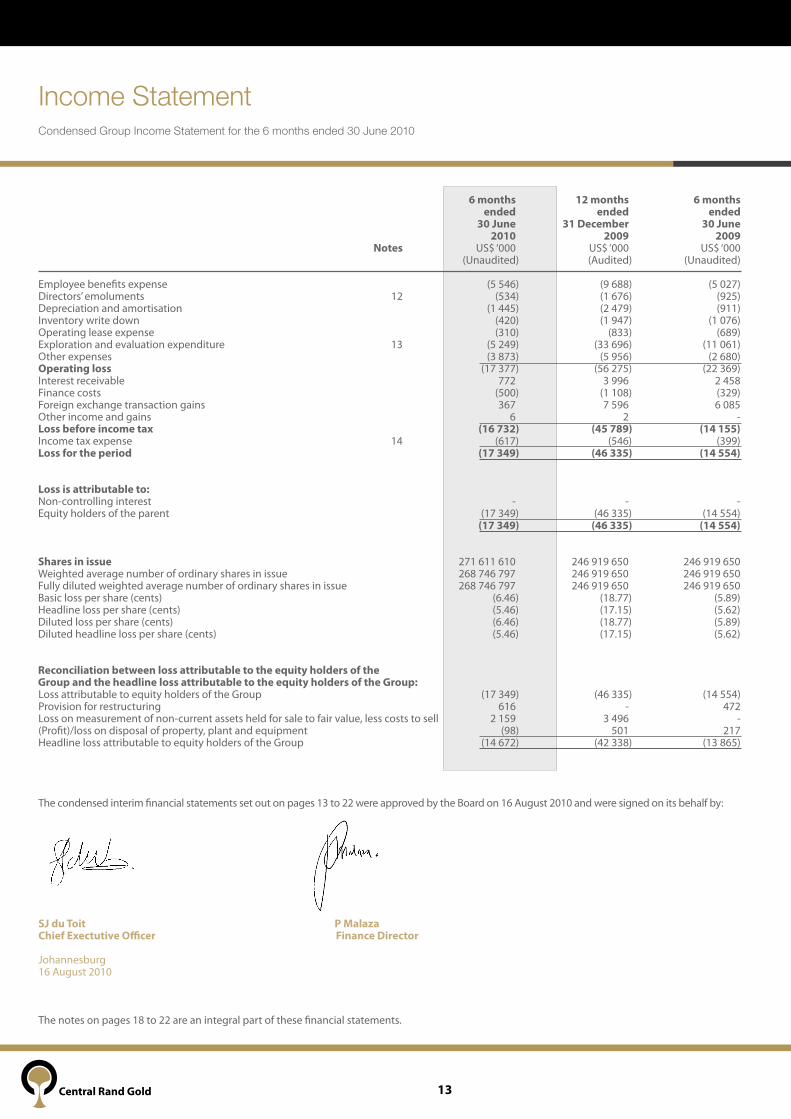
Income StatementCondensed Group Income Statement for the 6 months ended 30 June 2010
6 months 12 months 6 months ended ended ended 30 June 31 december 30 June 2010 2009 2009 notes US$ ‘000 US$ ‘000 US$ ‘000 (Unaudited) (Audited) (Unaudited) Employee benefits expense (5 546) (9 688) (5 027)Directors’ emoluments 12 (534) (1 676) (925)Depreciation and amortisation (1 445) (2 479) (911)Inventory write down (420) (1 947) (1 076) Operating lease expense (310) (833) (689)Exploration and evaluation expenditure 13 (5 249) (33 696) (11 061)Other expenses (3 873) (5 956) (2 680)Operating loss (17 377) (56 275) (22 369)Interest receivable 772 3 996 2 458 Finance costs (500) (1 108) (329)Foreign exchange transaction gains 367 7 596 6 085Other income and gains 6 2 -Loss before income tax (16 732) (45 789) (14 155)Income tax expense 14 (617) (546) (399)Loss for the period (17 349) (46 335) (14 554) Loss is attributable to: Non-controlling interest - - - Equity holders of the parent (17 349) (46 335) (14 554) (17 349) (46 335) (14 554) shares in issue 271 611 610 246 919 650 246 919 650 Weighted average number of ordinary shares in issue 268 746 797 246 919 650 246 919 650 Fully diluted weighted average number of ordinary shares in issue 268 746 797 246 919 650 246 919 650 Basic loss per share (cents) (6.46) (18.77) (5.89)Headline loss per share (cents) (5.46) (17.15) (5.62)Diluted loss per share (cents) (6.46) (18.77) (5.89)Diluted headline loss per share (cents) (5.46) (17.15) (5.62) Reconciliation between loss attributable to the equity holders of the Group and the headline loss attributable to the equity holders of the Group: Loss attributable to equity holders of the Group (17 349) (46 335) (14 554)Provision for restructuring 616 - 472 Loss on measurement of non-current assets held for sale to fair value, less costs to sell 2 159 3 496 - (Profit)/loss on disposal of property, plant and equipment (98) 501 217 Headline loss attributable to equity holders of the Group (14 672) (42 338) (13 865)
The condensed interim financial statements set out on pages 13 to 22 were approved by the Board on 16 August 2010 and were signed on its behalf by:
sJ du Toit P Malaza Chief Exectutive Officer Finance director
Johannesburg 16 August 2010
The notes on pages 18 to 22 are an integral part of these financial statements.
14
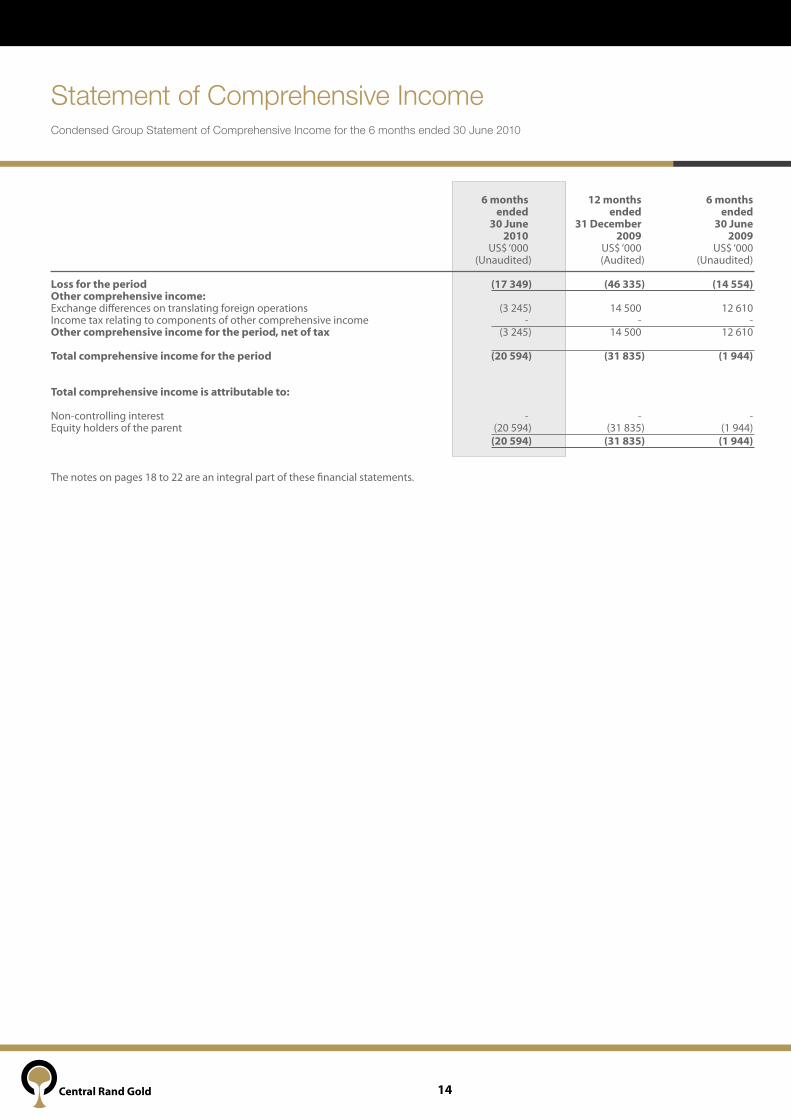
Statement of Comprehensive IncomeCondensed Group Statement of Comprehensive Income for the 6 months ended 30 June 2010
6 months 12 months 6 months ended ended ended 30 June 31 december 30 June 2010 2009 2009 US$ ‘000 US$ ‘000 US$ ‘000 (Unaudited) (Audited) (Unaudited) Loss for the period (17 349) (46 335) (14 554)Other comprehensive income: Exchange differences on translating foreign operations (3 245) 14 500 12 610 Income tax relating to components of other comprehensive income - - - Other comprehensive income for the period, net of tax (3 245) 14 500 12 610
Total comprehensive income for the period (20 594) (31 835) (1 944) Total comprehensive income is attributable to: Non-controlling interest - - - Equity holders of the parent (20 594) (31 835) (1 944) (20 594) (31 835) (1 944)
The notes on pages 18 to 22 are an integral part of these financial statements.
15
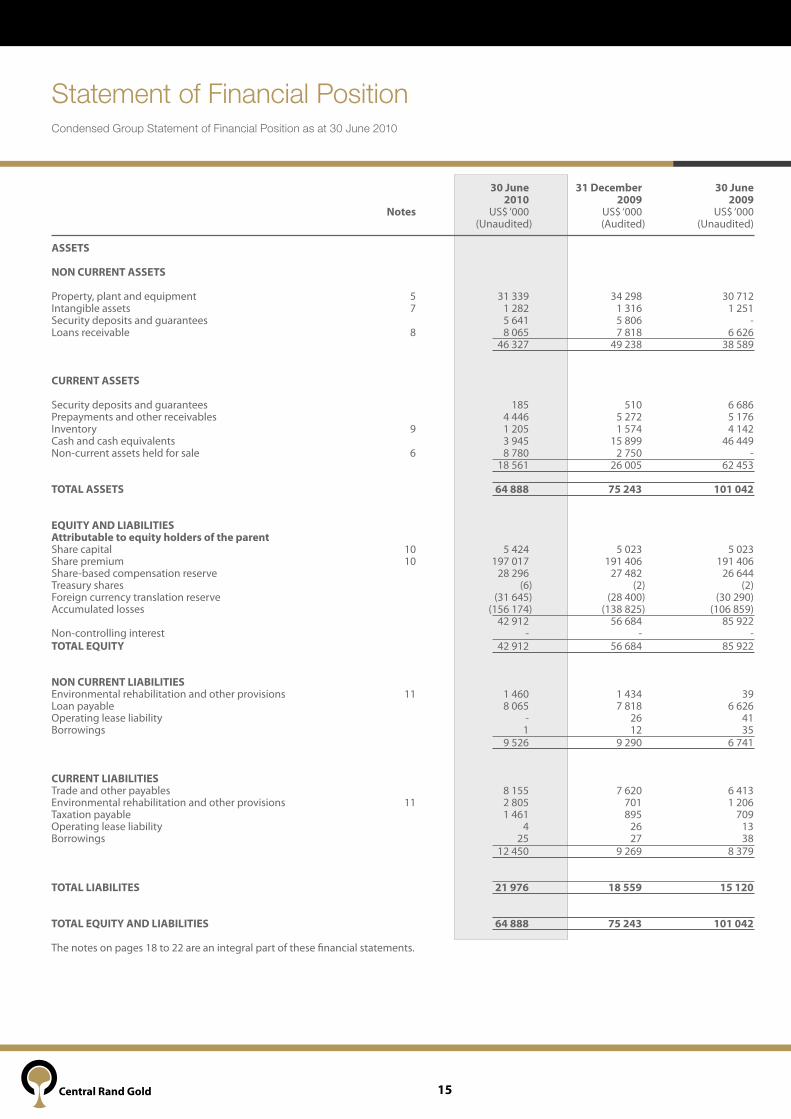
Statement of Financial PositionCondensed Group Statement of Financial Position as at 30 June 2010
30 June 31 december 30 June 2010 2009 2009 notes US$ ‘000 US$ ‘000 US$ ‘000 (Unaudited) (Audited) (Unaudited) AssETs nOn CuRREnT AssETs Property, plant and equipment 5 31 339 34 298 30 712 Intangible assets 7 1 282 1 316 1 251 Security deposits and guarantees 5 641 5 806 -Loans receivable 8 8 065 7 818 6 626 46 327 49 238 38 589 CuRREnT AssETs Security deposits and guarantees 185 510 6 686 Prepayments and other receivables 4 446 5 272 5 176 Inventory 9 1 205 1 574 4 142 Cash and cash equivalents 3 945 15 899 46 449 Non-current assets held for sale 6 8 780 2 750 - 18 561 26 005 62 453 TOTAL AssETs 64 888 75 243 101 042 EQuITY And LIABILITIEs Attributable to equity holders of the parent Share capital 10 5 424 5 023 5 023 Share premium 10 197 017 191 406 191 406 Share-based compensation reserve 28 296 27 482 26 644 Treasury shares (6) (2) (2)Foreign currency translation reserve (31 645) (28 400) (30 290)Accumulated losses (156 174) (138 825) (106 859) 42 912 56 684 85 922 Non-controlling interest - - - TOTAL EQuITY 42 912 56 684 85 922 nOn CuRREnT LIABILITIEs Environmental rehabilitation and other provisions 11 1 460 1 434 39 Loan payable 8 065 7 818 6 626 Operating lease liability - 26 41 Borrowings 1 12 35 9 526 9 290 6 741 CuRREnT LIABILITIEs Trade and other payables 8 155 7 620 6 413 Environmental rehabilitation and other provisions 11 2 805 701 1 206 Taxation payable 1 461 895 709 Operating lease liability 4 26 13 Borrowings 25 27 38 12 450 9 269 8 379 TOTAL LIABILITEs 21 976 18 559 15 120 TOTAL EQuITY And LIABILITIEs 64 888 75 243 101 042
The notes on pages 18 to 22 are an integral part of these financial statements.
16
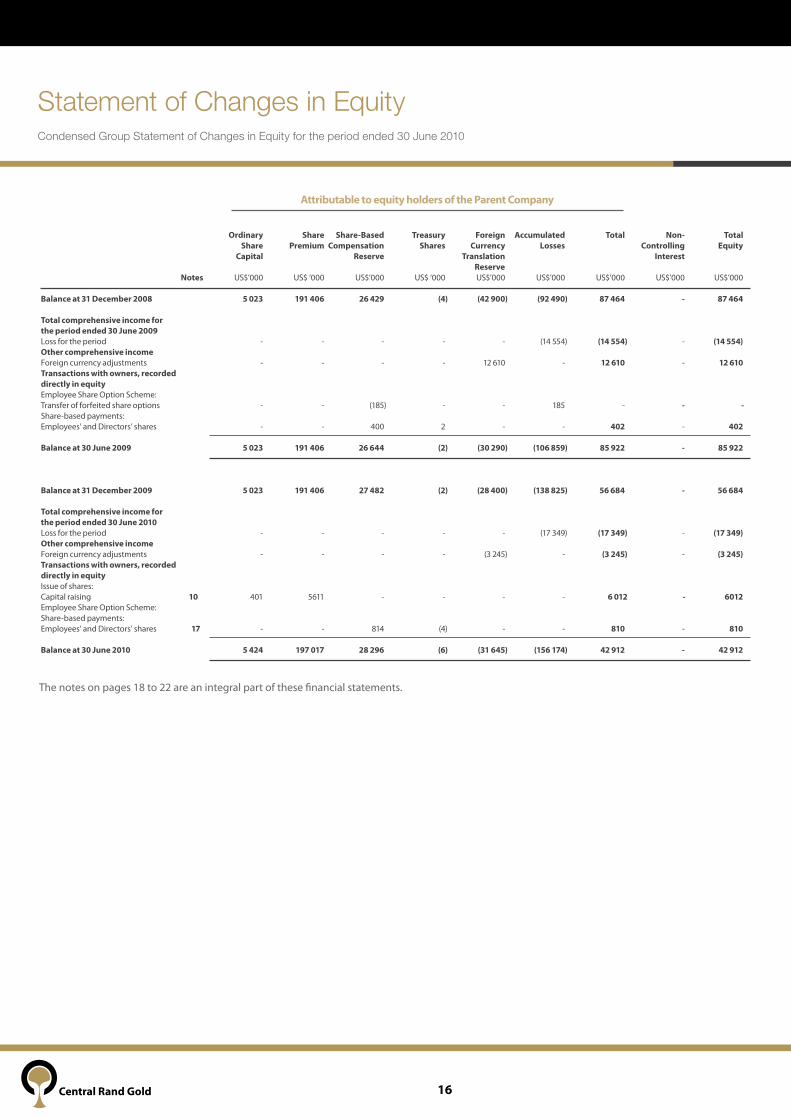
Statement of Changes in EquityCondensed Group Statement of Changes in Equity for the period ended 30 June 2010
The notes on pages 18 to 22 are an integral part of these financial statements.
Attributable to equity holders of the Parent Company
Ordinary share share-Based Treasury Foreign Accumulated Total non- Total share Premium Compensation shares Currency Losses Controlling Equity Capital Reserve Translation Interest Reserve notes US$’000 US$ ‘000 US$’000 US$ ‘000 US$’000 US$’000 US$’000 US$’000 US$’000
Balance at 31 december 2008 5 023 191 406 26 429 (4) (42 900) (92 490) 87 464 - 87 464 Total comprehensive income for the period ended 30 June 2009 Loss for the period - - - - - (14 554) (14 554) - (14 554)Other comprehensive incomeForeign currency adjustments - - - - 12 610 - 12 610 - 12 610Transactions with owners, recorded directly in equity Employee Share Option Scheme: Transfer of forfeited share options - - (185) - - 185 - - -Share-based payments: Employees’ and Directors’ shares - - 400 2 - - 402 - 402
Balance at 30 June 2009 5 023 191 406 26 644 (2) (30 290) (106 859) 85 922 - 85 922
Balance at 31 december 2009 5 023 191 406 27 482 (2) (28 400) (138 825) 56 684 - 56 684 Total comprehensive income for the period ended 30 June 2010 Loss for the period - - - - - (17 349) (17 349) - (17 349)Other comprehensive incomeForeign currency adjustments - - - - (3 245) - (3 245) - (3 245)Transactions with owners, recorded directly in equity Issue of shares: Capital raising 10 401 5611 - - - - 6 012 - 6012Employee Share Option Scheme: Share-based payments: Employees’ and Directors’ shares 17 - - 814 (4) - - 810 - 810
Balance at 30 June 2010 5 424 197 017 28 296 (6) (31 645) (156 174) 42 912 - 42 912

17
Cash Flow StatementCondensed Group Cash Flow Statement for the 6 months ended 30 June 2010
6 months 12 months 6 months ended ended ended 30 June 31 december 30 June 2010 2009 2009 notes US$ ‘000 US$ ‘000 US$ ‘000 (Unaudited) (Audited) (Unaudited) CAsH FLOWs FROM OPERATInG ACTIvITIEs Loss before tax (16 732) (45 789) (14 155)Adjusted for : Depreciation and amortisation 1 445 2 479 911 Employment benefit expenditure (share-based payments) 265 1 053 638 (Profit)/loss on disposal and scrapping of assets (98) 501 217 Inventory write down 420 1 947 - Impairment of assets 2 202 4 476 - Net gain on foreign exchange (367) (7 596) (6 085)(Decrease)/increase in operating lease liability (48) 9 3 Sundry income (6) (2) - Interest received (772) (3 996) (2 458)Finance costs 500 1 108 329 Changes in working capital (Increase)/decrease in prepayments and other receivables (826) 60 2 266 Increase in inventory (2 185) (842) (2 813)Increase in trade and other payables 535 3 862 1 303 Increase in provisions 1 963 13 485 Cash flows used in operations (13 704) (42 717) (19 359)Interest received 283 2 899 2 458 Finance costs (12) (83) (329)Sundry income 6 2 - net cash used in operating activities (13 427) (39 899) (17 230) CAsH FLOWs FROM InvEsTInG ACTIvITIEs Purchases of property, plant and equipment 5 (8 263) (26 915) (18 193)Proceeds from disposal of property, plant and equipment 445 104 - Purchases of intangible assets 7 - (1 185) - Purchases of subsidiaries - - (917)net cash used in investing activities (7 818) (27 996) (19 110) CAsH FLOWs FROM FInAnCInG ACTIvITIEs Repayments of borrowings (13) (36) (15)Decrease/(increase) in security deposits and guarantees 490 (221) 516 Proceeds from issuance of shares 10 5 985 - - net cash (used in)/from financing activities 6 462 (257) 501 Net decrease in cash and cash equivalents (14 783) (68 152) (35 839)Cash and cash equivalents at beginning of period 15 899 69 601 69 601 Effects of exchange rate movement on cash balances 2 829 14 450 12 687 Cash and cash equivalents at end of period 3 945 15 899 46 449
The notes on pages 18 to 22 are an integral part of these financial statements.
18
Notes to the Financial StatementsNotes to the Condensed Interim Group Financial Statements
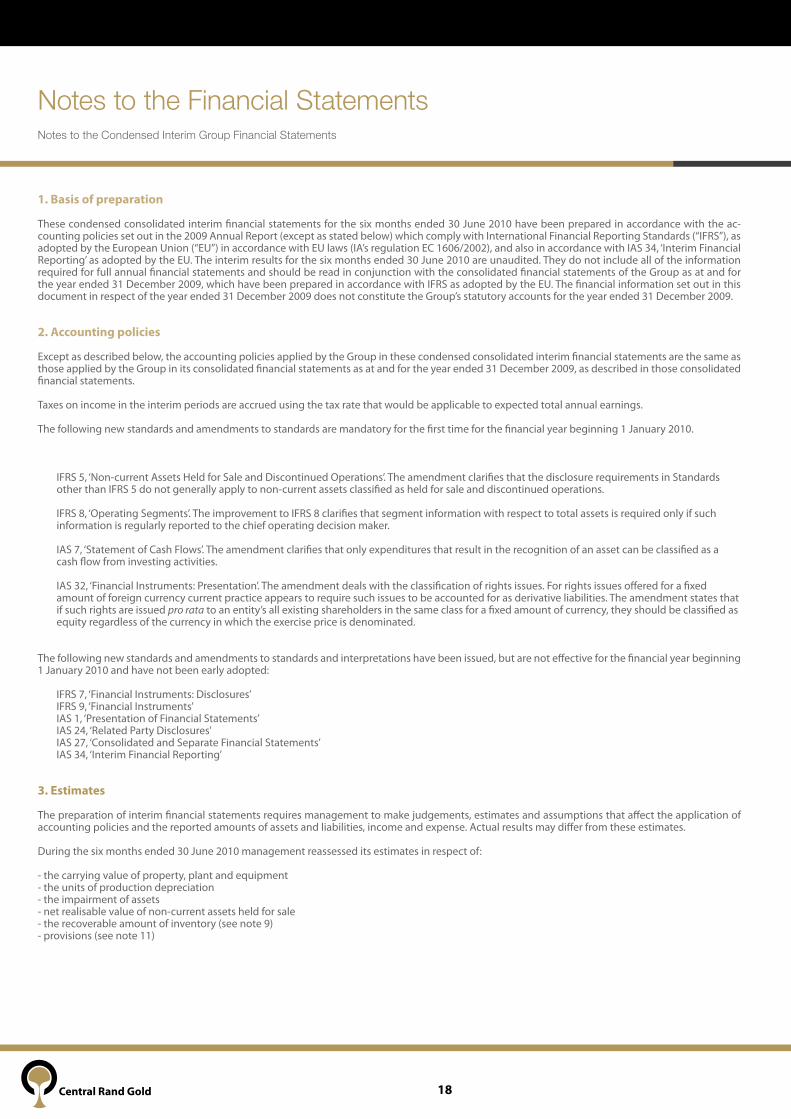
1. Basis of preparation These condensed consolidated interim financial statements for the six months ended 30 June 2010 have been prepared in accordance with the ac-counting policies set out in the 2009 Annual Report (except as stated below) which comply with International Financial Reporting Standards (“IFRS”), as adopted by the European Union (“EU”) in accordance with EU laws (IA’s regulation EC 1606/2002), and also in accordance with IAS 34, ‘Interim Financial Reporting’ as adopted by the EU. The interim results for the six months ended 30 June 2010 are unaudited. They do not include all of the information required for full annual financial statements and should be read in conjunction with the consolidated financial statements of the Group as at and for the year ended 31 December 2009, which have been prepared in accordance with IFRS as adopted by the EU. The financial information set out in this document in respect of the year ended 31 December 2009 does not constitute the Group’s statutory accounts for the year ended 31 December 2009. 2. Accounting policies
Except as described below, the accounting policies applied by the Group in these condensed consolidated interim financial statements are the same as those applied by the Group in its consolidated financial statements as at and for the year ended 31 December 2009, as described in those consolidated financial statements. Taxes on income in the interim periods are accrued using the tax rate that would be applicable to expected total annual earnings. The following new standards and amendments to standards are mandatory for the first time for the financial year beginning 1 January 2010. IFRS 5, ‘Non-current Assets Held for Sale and Discontinued Operations’. The amendment clarifies that the disclosure requirements in Standards other than IFRS 5 do not generally apply to non-current assets classified as held for sale and discontinued operations. IFRS 8, ‘Operating Segments’. The improvement to IFRS 8 clarifies that segment information with respect to total assets is required only if such information is regularly reported to the chief operating decision maker. IAS 7, ‘Statement of Cash Flows’. The amendment clarifies that only expenditures that result in the recognition of an asset can be classified as a cash flow from investing activities. IAS 32, ‘Financial Instruments: Presentation’. The amendment deals with the classification of rights issues. For rights issues offered for a fixed amount of foreign currency current practice appears to require such issues to be accounted for as derivative liabilities. The amendment states that if such rights are issued pro rata to an entity’s all existing shareholders in the same class for a fixed amount of currency, they should be classified as equity regardless of the currency in which the exercise price is denominated.
The following new standards and amendments to standards and interpretations have been issued, but are not effective for the financial year beginning 1 January 2010 and have not been early adopted: IFRS 7, ‘Financial Instruments: Disclosures’ IFRS 9, ‘Financial Instruments’ IAS 1, ‘Presentation of Financial Statements’ IAS 24, ‘Related Party Disclosures’ IAS 27, ‘Consolidated and Separate Financial Statements’ IAS 34, ‘Interim Financial Reporting’
3. Estimates The preparation of interim financial statements requires management to make judgements, estimates and assumptions that affect the application of accounting policies and the reported amounts of assets and liabilities, income and expense. Actual results may differ from these estimates. During the six months ended 30 June 2010 management reassessed its estimates in respect of: - the carrying value of property, plant and equipment - the units of production depreciation - the impairment of assets - net realisable value of non-current assets held for sale - the recoverable amount of inventory (see note 9) - provisions (see note 11)

19
4. Financial risk management The Group’s financial risk management objectives and policies are consistent with those disclosed in the consolidated annual financial statements as at and for the year ended 31 December 2009. Foreign currency rates
The US Dollar rates of exchange applicable to the year are as follows: 6 months to 12 months ended 6 months to 30 June 31 december 30 June 2010 2009 2009 Closing Average Closing Average Closing Average
South African Rand 0.13 0.13 0.13 0.12 0.13 0.11 British Pound 1.51 1.53 1.59 1.57 1.65 1.49
5. Property, plant and equipment During the six months ended 30 June 2010 the Group spent US$215,820 (six months ended 30 June 2009: US$0) to upgrade processing plants and US$7,151,601 (six months ended 30 June 2009: US$0) was spent on mine development. US$895,255 was spent on other items of property, plant and equipment.
A Gekko 50 ton per hour processing plant was transferred to non-current assets classified as held for sale at 30 June 2010. Refer to note 6 for further details. 6. non-current assets held for sale At 31 December 2009, the Group classified land situated at holding 59, Tedderfield Agricultural Holdings (net realisable value: US$442,125) and the Gekko 20 ton per hour gold processing plant and head gears (net realisable value: US$2,245,450) as non-current assets held for sale. During the period, the Group disposed of the land for US$445,137, resulting in a loss of US$9,881.
An item of plant and machinery, a Gekko 50 ton per hour processing plant, has been classified as held for sale during the six months ended 30 June 2010. The value of the asset is now expected to be realised from the sale of the asset rather than the continuing use. The value of assets transferred to non-current assets held for sale is US$8,868,702 at 30 June 2010. Based on management’s estimate of the fair value to be obtained from the sale, the asset held for sale has been impaired by US$2,158,964 to its fair value less costs to sell.
7. Intangible assets
During the prior year, the Group purchased the issued share capital of Ferreira Estate and Investment Company (“FEIC”), the registered holder of the Prospecting and Mining rights over the Consolidated Main Reef, Crown Mines, City Deep and Langlaagte mining areas. The amount of US$1,282,417 included the purchase of these Prospecting and Mining rights. No further additions were made in the current year.
8. Loans receivable Puno Gold Investments (Proprietary) Limited (“Puno”) Since the last report for the year ended 31 December 2009 there has been no resolution to the dispute relating to alleged procedural breaches of the Shareholders Agreement between CRGSA and its current Black Economic Empowerment (“BEE”) shareholder, Puno. The dispute surrounds the alloca-tion of intercompany loans which fund the budget and work programme and the incurring of, and level of, certain costs. In order to suspend protracted litigation, the parties have agreed to refer the matter to arbitration pursuant to the dispute resolution mechanism under the Shareholders’ Agreement. The Group still believes that ultimately their position will prevail. The Directors are still of the opinion that this will not have any material consequences in respect of the consolidated accounts of the Group. Notwithstanding this position, the Group have, pending the outcome of any dispute, allocated 100% of the intercompany balances directly from the Company to CRGSA. This additional 26% of intercompany debt, excluding interest, amounts to US$2,982,708 (ZAR22,375,901) between 1 January and 30 June 2010 (US$18,315,012 (ZAR151,903,560) between 1 January and 31 December 2009). The loan payable to Puno contains the same allocations referred to above.
Notes to the Financial StatementsNotes to the Condensed Interim Group Financial Statements
20
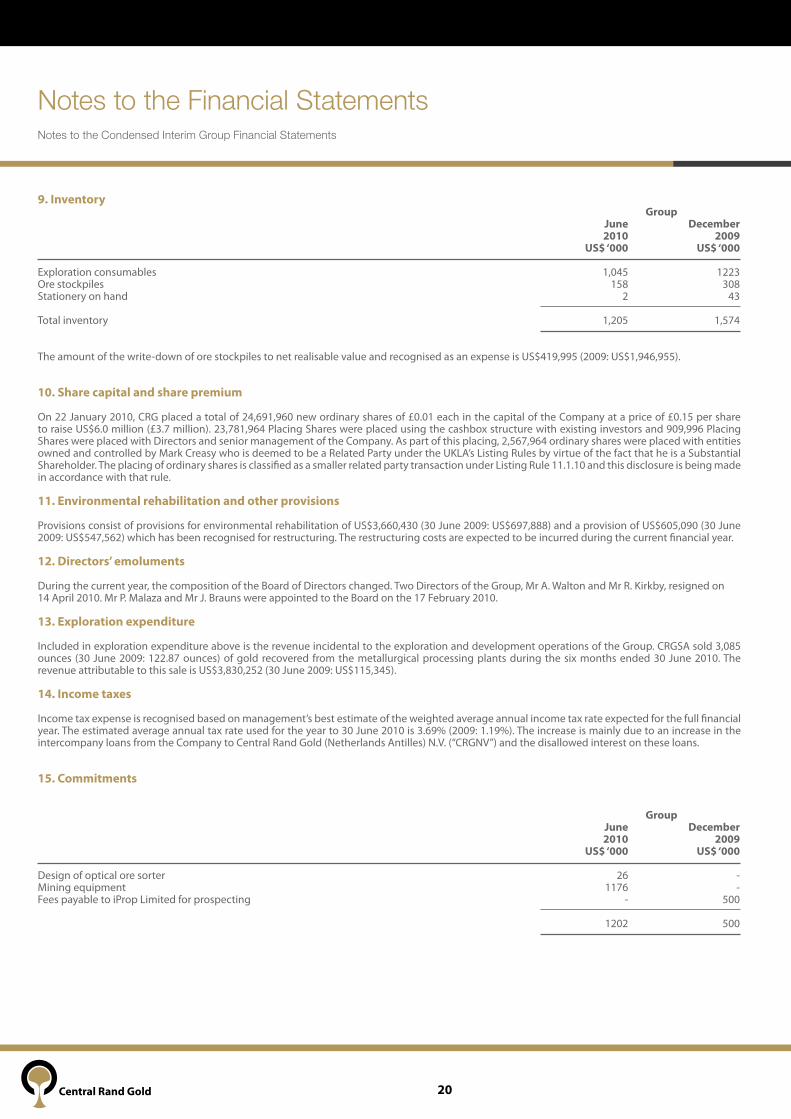
9. Inventory Group June december 2010 2009 us$ ‘000 us$ ‘000
Exploration consumables 1,045 1223 Ore stockpiles 158 308Stationery on hand 2 43
Total inventory 1,205 1,574
The amount of the write-down of ore stockpiles to net realisable value and recognised as an expense is US$419,995 (2009: US$1,946,955). 10. share capital and share premium On 22 January 2010, CRG placed a total of 24,691,960 new ordinary shares of £0.01 each in the capital of the Company at a price of £0.15 per share to raise US$6.0 million (£3.7 million). 23,781,964 Placing Shares were placed using the cashbox structure with existing investors and 909,996 Placing Shares were placed with Directors and senior management of the Company. As part of this placing, 2,567,964 ordinary shares were placed with entities owned and controlled by Mark Creasy who is deemed to be a Related Party under the UKLA’s Listing Rules by virtue of the fact that he is a Substantial Shareholder. The placing of ordinary shares is classified as a smaller related party transaction under Listing Rule 11.1.10 and this disclosure is being made in accordance with that rule. 11. Environmental rehabilitation and other provisions Provisions consist of provisions for environmental rehabilitation of US$3,660,430 (30 June 2009: US$697,888) and a provision of US$605,090 (30 June 2009: US$547,562) which has been recognised for restructuring. The restructuring costs are expected to be incurred during the current financial year. 12. directors’ emoluments During the current year, the composition of the Board of Directors changed. Two Directors of the Group, Mr A. Walton and Mr R. Kirkby, resigned on14 April 2010. Mr P. Malaza and Mr J. Brauns were appointed to the Board on the 17 February 2010. 13. Exploration expenditure Included in exploration expenditure above is the revenue incidental to the exploration and development operations of the Group. CRGSA sold 3,085 ounces (30 June 2009: 122.87 ounces) of gold recovered from the metallurgical processing plants during the six months ended 30 June 2010. The revenue attributable to this sale is US$3,830,252 (30 June 2009: US$115,345).
14. Income taxes
Income tax expense is recognised based on management’s best estimate of the weighted average annual income tax rate expected for the full financial year. The estimated average annual tax rate used for the year to 30 June 2010 is 3.69% (2009: 1.19%). The increase is mainly due to an increase in the intercompany loans from the Company to Central Rand Gold (Netherlands Antilles) N.V. (“CRGNV”) and the disallowed interest on these loans.
15. Commitments Group June december 2010 2009 us$ ‘000 us$ ‘000
Design of optical ore sorter 26 -Mining equipment 1176 -Fees payable to iProp Limited for prospecting - 500
1202 500
Notes to the Financial StatementsNotes to the Condensed Interim Group Financial Statements
21
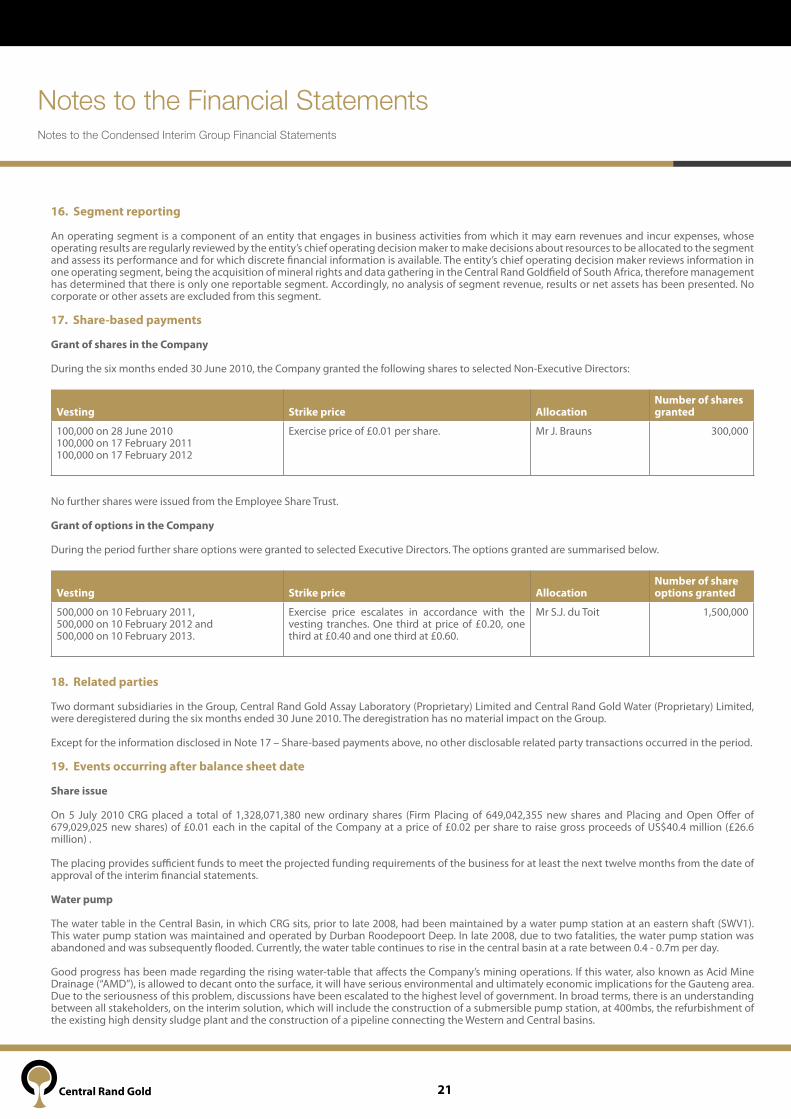
16. segment reporting An operating segment is a component of an entity that engages in business activities from which it may earn revenues and incur expenses, whose operating results are regularly reviewed by the entity’s chief operating decision maker to make decisions about resources to be allocated to the segment and assess its performance and for which discrete financial information is available. The entity’s chief operating decision maker reviews information in one operating segment, being the acquisition of mineral rights and data gathering in the Central Rand Goldfield of South Africa, therefore management has determined that there is only one reportable segment. Accordingly, no analysis of segment revenue, results or net assets has been presented. No corporate or other assets are excluded from this segment. 17. share-based payments Grant of shares in the Company During the six months ended 30 June 2010, the Company granted the following shares to selected Non-Executive Directors:
vesting strike price Allocationnumber of shares granted
100,000 on 28 June 2010100,000 on 17 February 2011100,000 on 17 February 2012
Exercise price of £0.01 per share. Mr J. Brauns 300,000
No further shares were issued from the Employee Share Trust.
Grant of options in the Company During the period further share options were granted to selected Executive Directors. The options granted are summarised below.
vesting strike price Allocationnumber of share options granted
500,000 on 10 February 2011, 500,000 on 10 February 2012 and 500,000 on 10 February 2013.
Exercise price escalates in accordance with the vesting tranches. One third at price of £0.20, one third at £0.40 and one third at £0.60.
Mr S.J. du Toit 1,500,000
18. Related parties Two dormant subsidiaries in the Group, Central Rand Gold Assay Laboratory (Proprietary) Limited and Central Rand Gold Water (Proprietary) Limited, were deregistered during the six months ended 30 June 2010. The deregistration has no material impact on the Group.
Except for the information disclosed in Note 17 – Share-based payments above, no other disclosable related party transactions occurred in the period.
19. Events occurring after balance sheet date
share issue
On 5 July 2010 CRG placed a total of 1,328,071,380 new ordinary shares (Firm Placing of 649,042,355 new shares and Placing and Open Offer of 679,029,025 new shares) of £0.01 each in the capital of the Company at a price of £0.02 per share to raise gross proceeds of US$40.4 million (£26.6 million) .
The placing provides sufficient funds to meet the projected funding requirements of the business for at least the next twelve months from the date of approval of the interim financial statements.
Water pump
The water table in the Central Basin, in which CRG sits, prior to late 2008, had been maintained by a water pump station at an eastern shaft (SWV1). This water pump station was maintained and operated by Durban Roodepoort Deep. In late 2008, due to two fatalities, the water pump station was abandoned and was subsequently flooded. Currently, the water table continues to rise in the central basin at a rate between 0.4 - 0.7m per day.
Good progress has been made regarding the rising water-table that affects the Company’s mining operations. If this water, also known as Acid Mine Drainage (“AMD”), is allowed to decant onto the surface, it will have serious environmental and ultimately economic implications for the Gauteng area. Due to the seriousness of this problem, discussions have been escalated to the highest level of government. In broad terms, there is an understanding between all stakeholders, on the interim solution, which will include the construction of a submersible pump station, at 400mbs, the refurbishment of the existing high density sludge plant and the construction of a pipeline connecting the Western and Central basins.
Notes to the Financial StatementsNotes to the Condensed Interim Group Financial Statements
22
The Minister of Water Affairs, Minister Buyelwa Sonjica, speaking at the Agri SA water conference in Johannesburg on the 11 August 2010, confirmed that the South African government recognised that as 70% of the mining area in the Witwatersrand district were currently ownerless, that the liability to resolve the AMD problem would reside with the State, requiring a contribution on approximately US$19.0 million (ZAR145 million). The remaining 30% liability would be funded by existing active mining operations in the area.
To limit the extent that the water-table will rise above the 400mbs level, the Company has placed an order for the submersible pumps, which is the project’s longest lead item. The initial payment of US$1.3 million (ZAR10 million) will form part of CRG’s total committed contribution of US$4.7 million (ZAR36.0 million).
20. Contingent liability
damages claim
Puno has issued a summons on the Company, claiming damages to the value of US$17 million. This action, instituted by Puno against the Company out of the South Gauteng High Court, Johannesburg, traverses issues similar to those covered by Puno’s previous application. In particular, Puno’s damages claim is premised on a similar interpretation of the Shareholders’ Agreement as it contended for in the previous application.
The previous application was dismissed by Acting Judge, Alan Horwitz SC, on Thursday, 5 November 2009, with costs, including the costs of two counsel on the grounds that Puno had failed to make out a case for the relief sought on each and every ground which formed the subject of the application hear-ing. Puno’s application for leave to appeal against the judgment was also dismissed with a similar order as to costs. In relation to Puno’s interpretation of the Shareholders’ Agreement, the Acting Judge expressly rejected the very interpretation on which the present action seeks to rely.
It is the Company’s considered view that the present action is thus equally ill-founded, and possibly vexatious, and while Puno has in any event failed to take proper and appropriate steps in the institution of these proceedings on which basis alone the present action must be stayed, Puno’s contentions for the relief sought are considered to be flawed and devoid of merit.
In consequence, the Directors are of the opinion that in as much as the action has no prospects of success, this will not have any material consequences in respect of the consolidated accounts of the Group.
Notes to the Financial StatementsNotes to the Condensed Interim Group Financial Statements

www.centralrandgold.com