Embed Size (px)
Citation preview
1. Refer to section "Non-GAAP measures" for definition and reconciliation to the most comparable US GAAP measure.
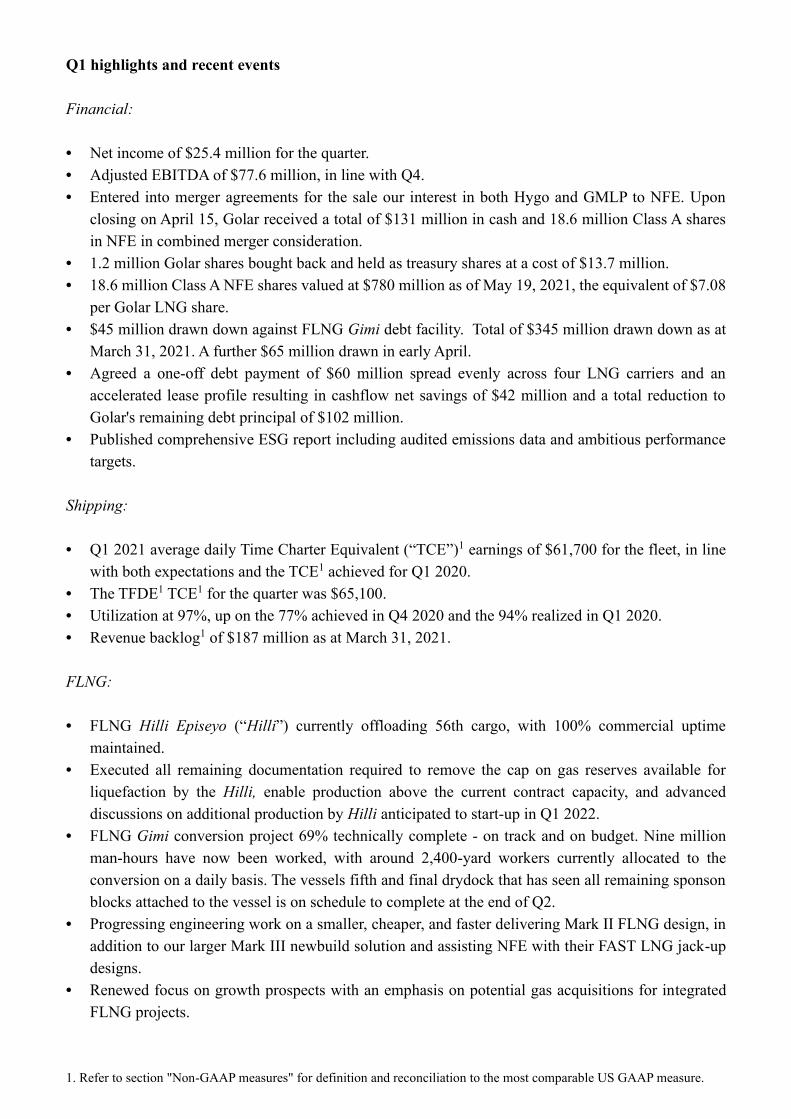
INTERIM RESULTS FOR THE PERIOD ENDED MARCH 31, 2021
NFE transactions closed, strong shipping rates despite seasonality, and gas prices supportive of upstream activities
The first quarter and subsequent months have been positive and eventful for Golar. With the
announcement of the sale of Golar LNG Partners LP (“GMLP”) and Hygo Energy Transition Ltd.
(“Hygo”) to New Fortress Energy (“NFE”) on January 13, and closing of the transactions on April 15,
Golar has made significant progress simplifying its business, crystalizing the value of its asset portfolio,
and strengthening its balance sheet.
We are encouraged by the strength of shipping rates during what is normally a seasonally weak period,
with TFDE1 spot rates currently around $70,000 per day. The negative impact of potential EEXI
regulations on the viability of up to 254 steam turbine carriers relative to a global on-the-water fleet of
597 vessels and a 130 vessel orderbook means that Golar’s longer term view of the shipping business
has also materially improved. The few shipyards capable of building LNG carriers are filling with
container newbuild orders and we do not see potential for significant new LNG carrier orders before
2024. Over the same timeframe LNG trade is expected to continue to grow by a 4% CAGR. This should
allow for improved earnings from our carrier portfolio and create a supportive backdrop for this as a
stand-alone business.
Current and forward energy prices are also strengthening, increasing the attractiveness of LNG upstream
investments and our FLNG technology. We continue to pursue FLNG growth projects including both
tolling arrangements and opportunities to develop hydrocarbon exposure through ownership of gas
molecules suitable for production by our FLNG technology.
Finally, we are pleased to have appointed Mr. Karl Fredrik Staubo as CEO and Mr. Eduardo Maranhao
as CFO. With their GMLP and Hygo backgrounds both have been intimately involved with the business
for some time and will be familiar faces to Golar stakeholders, allowing for a seamless transition.
Financial Summary
(in thousands of $) Q1 2021 Q1 2020 % Change Q4 2020 % Change Total operating revenues 125,827 122,559 3% 118,684 6%
Adjusted EBITDA 77,612 76,208 2% 78,031 (1)%
Net income/(loss) attributable to Golar LNG Ltd 25,364 (104,247) 124% 8,126 212%
Golar's share of contractual net debt1 2,062,580 2,202,108 (6)% 2,065,826 —%
1. Refer to section "Non-GAAP measures" for definition and reconciliation to the most comparable US GAAP measure.
Q1 highlights and recent events
Financial:
• Net income of $25.4 million for the quarter.
• Adjusted EBITDA of $77.6 million, in line with Q4.
• Entered into merger agreements for the sale our interest in both Hygo and GMLP to NFE. Upon
closing on April 15, Golar received a total of $131 million in cash and 18.6 million Class A shares
in NFE in combined merger consideration.
• 1.2 million Golar shares bought back and held as treasury shares at a cost of $13.7 million.
• 18.6 million Class A NFE shares valued at $780 million as of May 19, 2021, the equivalent of $7.08
per Golar LNG share.
• $45 million drawn down against FLNG Gimi debt facility. Total of $345 million drawn down as at
March 31, 2021. A further $65 million drawn in early April.
• Agreed a one-off debt payment of $60 million spread evenly across four LNG carriers and an
accelerated lease profile resulting in cashflow net savings of $42 million and a total reduction to
Golar's remaining debt principal of $102 million.
• Published comprehensive ESG report including audited emissions data and ambitious performance
targets.
Shipping:
• Q1 2021 average daily Time Charter Equivalent (“TCE”)1 earnings of $61,700 for the fleet, in line
with both expectations and the TCE1 achieved for Q1 2020.
• The TFDE1 TCE1 for the quarter was $65,100.
• Utilization at 97%, up on the 77% achieved in Q4 2020 and the 94% realized in Q1 2020.
• Revenue backlog1 of $187 million as at March 31, 2021.
FLNG:
• FLNG Hilli Episeyo (“Hilli”) currently offloading 56th cargo, with 100% commercial uptime
maintained.
• Executed all remaining documentation required to remove the cap on gas reserves available for
liquefaction by the Hilli, enable production above the current contract capacity, and advanced
discussions on additional production by Hilli anticipated to start-up in Q1 2022.
• FLNG Gimi conversion project 69% technically complete - on track and on budget. Nine million
man-hours have now been worked, with around 2,400-yard workers currently allocated to the
conversion on a daily basis. The vessels fifth and final drydock that has seen all remaining sponson
blocks attached to the vessel is on schedule to complete at the end of Q2.
• Progressing engineering work on a smaller, cheaper, and faster delivering Mark II FLNG design, in
addition to our larger Mark III newbuild solution and assisting NFE with their FAST LNG jack-up
designs.
• Renewed focus on growth prospects with an emphasis on potential gas acquisitions for integrated
FLNG projects.

1. Refer to section "Non-GAAP measures" for definition and reconciliation to the most comparable US GAAP measure.
Outlook
LNG Shipping:
Based on fixtures to date and inclusive of an upward adjustment for loss of hire revenue expected in
respect of an ongoing claim for one of the vessels, Golar currently expects a Q2 TFDE1 TCE1 of around
$50,500 per day. The market outlook for shipping is improving on firming underlying LNG demand and
higher prices. Ton miles are increasing, the likelihood of any summer 2021 cargo cancellations has been
reduced, charterers seeking spot tonnage are facing competition from those looking for term charters, all
of which are improving the rate outlook. Tighter emissions regulations expected from 2023 may also
require slower steaming for a substantial portion of the existing fleet. The market strength can be
illustrated by our recent fixture of a 1-year time charter at a level of return not seen in the LNG market
since 2010/2011.
FLNG:
Golar will pursue opportunities to use its FLNG technology and unrivalled operational experience to
increase its upstream exposure. Focus will be on investments into stranded gas assets or partnering with
companies that have associated gas that can be liquefied using existing FLNG assets or a quick
delivering, smaller and lower cost alternative. The target will be to enter into LNG off-take agreements
sufficient to support financing requirements and retain remaining production for merchant sales. We will
continue to pursue pure tolling projects with oil majors where the return is attractive. Our FLNG
solutions out-compete almost all onshore facilities in terms of cost per ton, schedule, and carbon
footprint.
On Hilli, dialogue with Perenco and SNH to increase throughput continues. Although drilling has not
yet commenced, current plans to bring on incremental production from Q1 2022 remain likely. Golar
has an economic interest in around 87% of any incremental earnings from increased throughput of train
3. In addition to the train 3 discussions, Hilli is expected to generate Brent Oil linked cash flows, in
which Golar has an 89% economic interest, from Q2 2021. The contractual Brent Oil linked component
of Hilli's currently contracted production generates incremental cashflows equivalent to approximately
$3.0 million per annum for every dollar the Brent Oil price is above $60/barrel, up to an agreed but
undisclosed ceiling.
Our FLNG segment has a contract earnings backlog1 of $3.4 billion (Golar's share), an unparalleled
operational record and attractive growth prospects. In order to capture hidden value in this segment and
to potentially accelerate FLNG growth projects we will consider partnerships at either a project, asset or
business level.
Corporate:
Closing the sales of Hygo and GMLP to NFE represent significant steps toward simplifying the group
structure, crystallizing value, and strengthening the balance sheet. With $149.9 million of unrestricted
cash on hand as at March 31, 2021 and $130.8 million of cash proceeds subsequently received from the
sales of Hygo and GMLP on April 15, Golar's balance sheet has been materially strengthened. Golar is
1. Refer to section "Non-GAAP measures" for definition and reconciliation to the most comparable US GAAP measure.
now well positioned to meet its existing capital expenditure commitments and to fund attractive
investment propositions, including continuation of its share buyback program.
The 18.6 million NFE shares valued at $780 million based on the closing price on May 19 create
additional optionality. We see significant potential for the NFE business case driven by their strong
growth, track record, and the solid platform NFE has built and acquired through the Hygo and GMLP
acquisitions. Subject to the relative share prices of NFE and Golar, near-term growth initiatives, and the
absolute share price of Golar, we intend to use the NFE shares for a combination of:
i. Debt optimization, including refinancing of the convertible bond;
ii. Fund growth projects;
iii. Return to Golar shareholders either by way of direct distribution or by way of a tendered
exchange for Golar shares.
In terms of financial reporting, a gain on disposal1 of our equity investments in GMLP and Hygo will be
recognized on April 15, 2021. The estimated book profit on the disposals is expected to be in excess of
$650 million as of this date. Earnings from these two affiliates, previously impacted by BRL/USD FX
changes, will cease to be recognized in the statement of operations from April 15, and our investments
in them, classified as ‘held for sale’ on March 31, 2021, will be removed from the balance sheet.
Thereafter, while NFE shares continue to be held and dividends declared, dividend income will be
recorded in the statement of operations, as will mark-to-market changes in the value of the NFE shares
held.
Financial Review
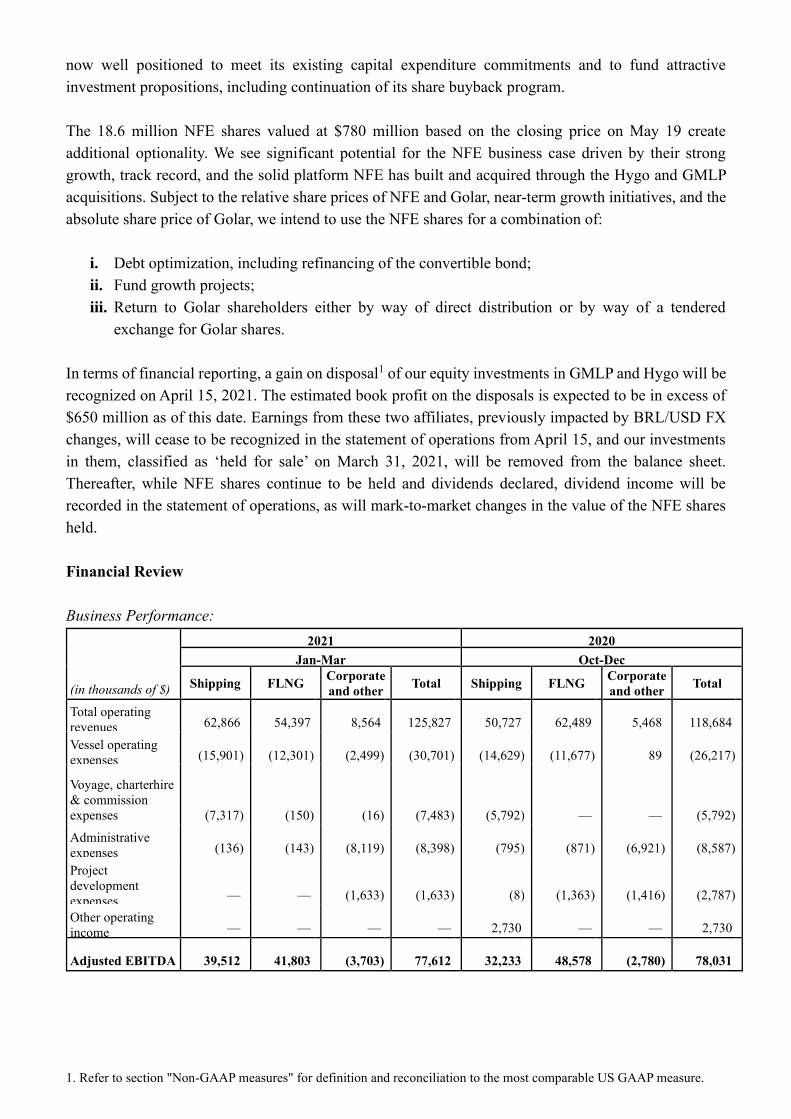
Business Performance:
2021 2020 Jan-Mar Oct-Dec
(in thousands of $) Shipping FLNG Corporate
and other Total Shipping FLNG
Corporate
and other Total
Total operating
revenues 62,866 54,397 8,564 125,827 50,727 62,489 5,468 118,684
Vessel operating
expenses (15,901) (12,301) (2,499) (30,701) (14,629) (11,677) 89 (26,217)
Voyage, charterhire
& commission
expenses (7,317) (150) (16) (7,483) (5,792) — — (5,792)
Administrative
expenses (136) (143) (8,119) (8,398) (795) (871) (6,921) (8,587)
Project
development
expenses — — (1,633) (1,633) (8) (1,363) (1,416) (2,787)
Other operating
income — — — — 2,730 — — 2,730
Adjusted EBITDA 39,512 41,803 (3,703) 77,612 32,233 48,578 (2,780) 78,031

1. Refer to section "Non-GAAP measures" for definition and reconciliation to the most comparable US GAAP measure.
2020 Jan-Mar
(in thousands of $) Shipping FLNG
Corporate
and other Total
Total operating revenues 62,985 54,524 5,050 122,559 Vessel operating expenses (16,503) (13,892) 162 (30,233) Voyage, charterhire & commission expenses (4,827) — — (4,827) Administrative expenses (460) (310) (9,371) (10,141) Project development expenses (13) (1,132) (2,544) (3,689) Realized gains on oil derivative instrument(1) — 2,539 — 2,539 Adjusted EBITDA 41,182 41,729 (6,703) 76,208
(1) The line item "Realized and unrealized gain /(loss) on oil derivative instrument" in the Condensed Consolidated Statements of Income/(Loss) relating to
income from the Hilli Liquefaction Tolling Agreement is split into, "Realized gains on oil derivative instrument" and "Unrealized gain/(loss) on oil derivative
instrument". The unrealized component represents a mark-to-market gain of $10.6 million (December 31, 2020: $5.7 million loss and March 31, 2020: $27.8
million loss) on the oil embedded derivative, which represents the estimate of expected receipts under the remainder of the Brent oil linked clause of the
Hilli Liquefaction Tolling Agreement. The realized component amounts to $nil (December 31, 2020: $nil and March 31, 2020: $2.5 million gain) and
represents the income in relation to the Hilli Liquefaction Tolling Agreement receivable in cash.
Golar reports today Q1 Adjusted EBITDA of $77.6 million compared to $78.0 million in Q4.
Total operating revenues increased from $118.7 million in Q4 to $125.8 million in Q1, partially mitigated
by an increase in voyage, charter hire and commission expenses, from $5.8 million in Q4 to $7.5 million
in Q1. Of the $7.1 million increase in total operating revenues, $12.1 million was attributable to an
improved shipping performance. Partially offsetting this is reduced revenue from FLNG. Revenue from
Hilli reverted to normalized levels in Q1 following the billing of 2019-2020 overproduction in Q4.
Revenue from shipping, net of voyage, charterhire and commission expenses was $55.5 million and
increased by $10.6 million from $44.9 million in Q4. The quarter began with quoted TFDE1 carrier
headline spot rates at around $160,000 per day and ended with rates at around $33,000 per day, in line
with seasonal patterns. Full fleet TCE1 earnings increased from $48,800 in Q4 2020 to $61,700 in Q1
2021, in line with both prior guidance and Q1 2020.
Operating revenues from the Hilli, including base tolling fees and amortization of pre-acceptance
amounts recognized, decreased from $62.5 million in Q4 to $54.4 million in Q1 as expected given the
billing of 2019 and 2020 overproduction of $8.0 million in Q4. Any potential overproduction for 2021
will be billed in January 2022 and recognized in Q4, 2021.
A full quarter's costs in respect of the FSRU LNG Croatia, for which Golar receives management fee
compensation, together with unscheduled repairs of the FSRU Golar Tundra contributed to a $4.5
million increase in vessel operating expenses from $26.2 million in Q4 to $30.7 million in Q1.
Administrative and project development expenses decreased $0.2 million and $1.2 million to $8.4
million and $1.6 million respectively.
The mark-to-market fair value of the Hilli Brent oil link derivative asset increased by $10.6 million
during the quarter, with a corresponding unrealized gain of the same amount recognized in the income
statement. The fair value increase was driven by an upward movement in the expected future market
price for Brent Oil. The spot price for Brent Oil increased from $51.80 per barrel on December 31, 2020
to $63.54 on March 31, 2021.
1. Refer to section "Non-GAAP measures" for definition and reconciliation to the most comparable US GAAP measure.
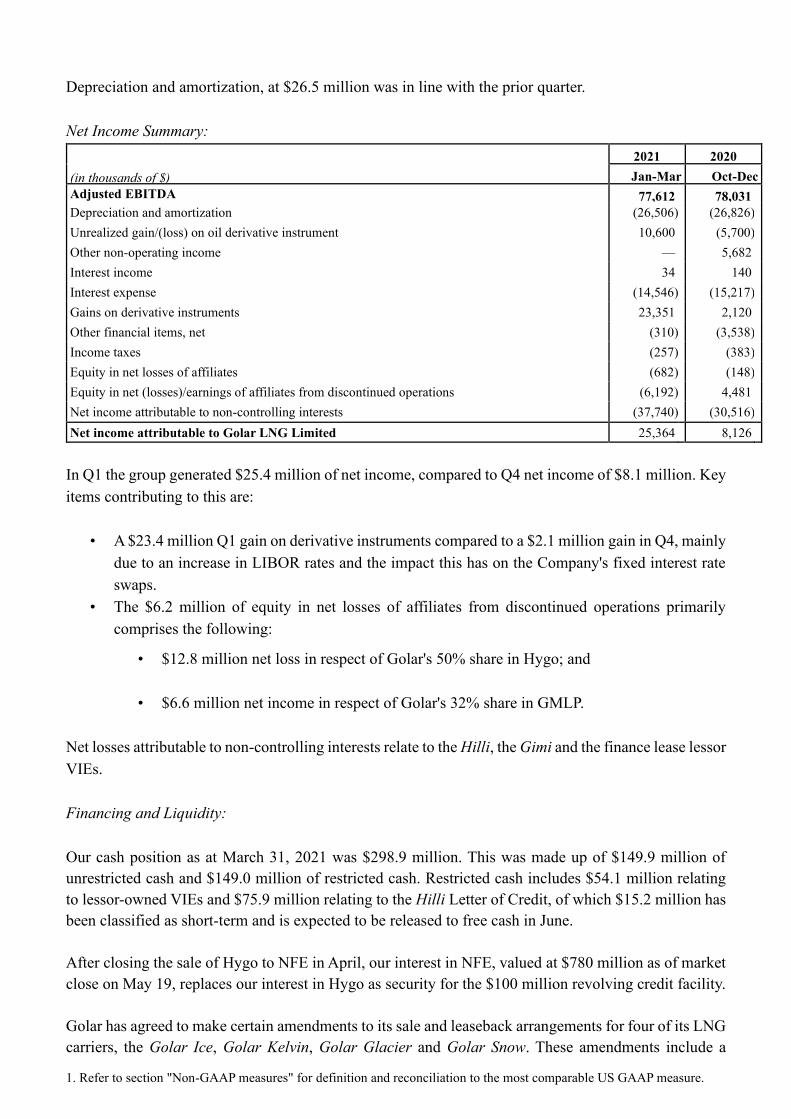
Depreciation and amortization, at $26.5 million was in line with the prior quarter.
Net Income Summary:
2021 2020
(in thousands of $) Jan-Mar Oct-Dec Adjusted EBITDA 77,612 78,031 Depreciation and amortization (26,506) (26,826)
Unrealized gain/(loss) on oil derivative instrument 10,600 (5,700)
Other non-operating income — 5,682
Interest income 34 140
Interest expense (14,546) (15,217)
Gains on derivative instruments 23,351 2,120
Other financial items, net (310) (3,538)
Income taxes (257) (383)
Equity in net losses of affiliates (682) (148)
Equity in net (losses)/earnings of affiliates from discontinued operations (6,192) 4,481
Net income attributable to non-controlling interests (37,740) (30,516)
Net income attributable to Golar LNG Limited 25,364 8,126
In Q1 the group generated $25.4 million of net income, compared to Q4 net income of $8.1 million. Key
items contributing to this are:
• A $23.4 million Q1 gain on derivative instruments compared to a $2.1 million gain in Q4, mainly
due to an increase in LIBOR rates and the impact this has on the Company's fixed interest rate
swaps.
• The $6.2 million of equity in net losses of affiliates from discontinued operations primarily
comprises the following:
• $12.8 million net loss in respect of Golar's 50% share in Hygo; and
• $6.6 million net income in respect of Golar's 32% share in GMLP.
Net losses attributable to non-controlling interests relate to the Hilli, the Gimi and the finance lease lessor
VIEs.
Financing and Liquidity:
Our cash position as at March 31, 2021 was $298.9 million. This was made up of $149.9 million of
unrestricted cash and $149.0 million of restricted cash. Restricted cash includes $54.1 million relating
to lessor-owned VIEs and $75.9 million relating to the Hilli Letter of Credit, of which $15.2 million has
been classified as short-term and is expected to be released to free cash in June.
After closing the sale of Hygo to NFE in April, our interest in NFE, valued at $780 million as of market
close on May 19, replaces our interest in Hygo as security for the $100 million revolving credit facility.
Golar has agreed to make certain amendments to its sale and leaseback arrangements for four of its LNG
carriers, the Golar Ice, Golar Kelvin, Golar Glacier and Golar Snow. These amendments include a
1. Refer to section "Non-GAAP measures" for definition and reconciliation to the most comparable US GAAP measure.
prepayment of $60.0 million in July 2021, evenly split, across the four sale and leaseback facilities,
increased daily debt service and a resulting accelerated lease profile on the Golar Ice and Golar Kelvin,
and an obligation to repurchase the Golar Glacier and Golar Snow in April 2023. As a result of these
changes we have agreed with the lease counterpart a net saving to Golar of a total of $42 million in
combination of reduced remaining debt principal and remaining charter hire due under the remaining
sale leaseback period.
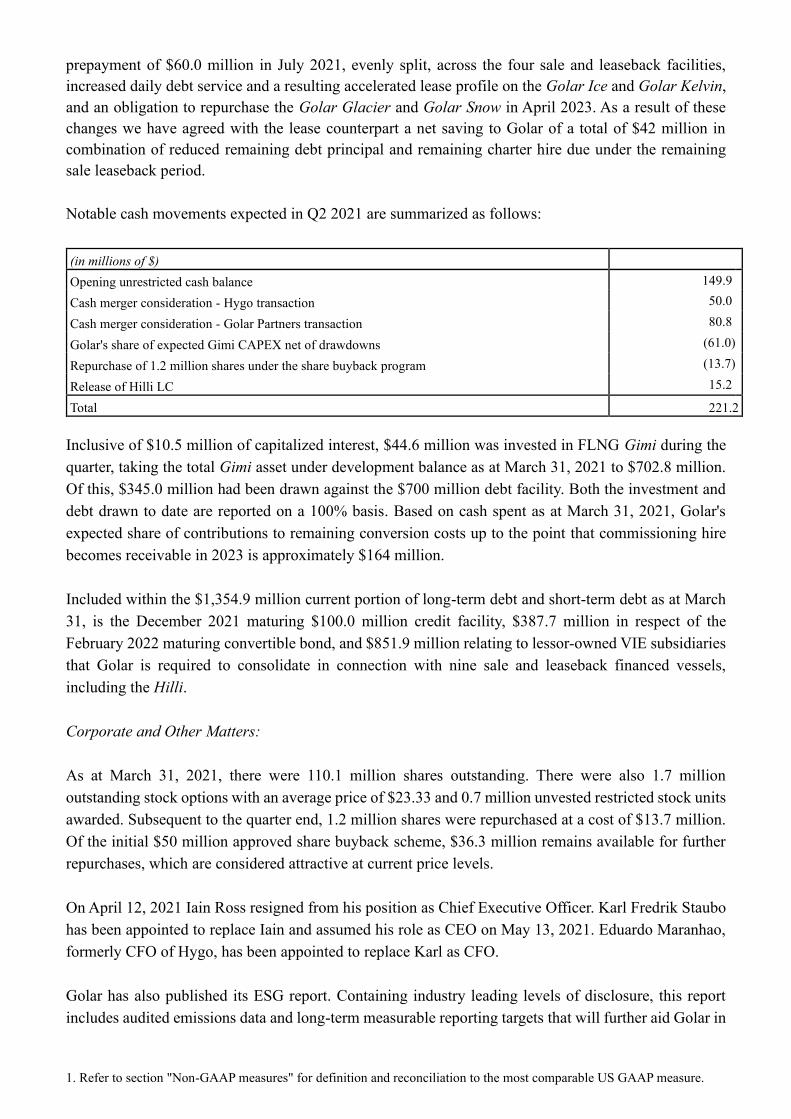
Notable cash movements expected in Q2 2021 are summarized as follows:
(in millions of $)
Opening unrestricted cash balance 149.9
Cash merger consideration - Hygo transaction 50.0
Cash merger consideration - Golar Partners transaction 80.8
Golar's share of expected Gimi CAPEX net of drawdowns (61.0)
Repurchase of 1.2 million shares under the share buyback program (13.7)
Release of Hilli LC 15.2
Total 221.2
Inclusive of $10.5 million of capitalized interest, $44.6 million was invested in FLNG Gimi during the
quarter, taking the total Gimi asset under development balance as at March 31, 2021 to $702.8 million.
Of this, $345.0 million had been drawn against the $700 million debt facility. Both the investment and
debt drawn to date are reported on a 100% basis. Based on cash spent as at March 31, 2021, Golar's
expected share of contributions to remaining conversion costs up to the point that commissioning hire
becomes receivable in 2023 is approximately $164 million.
Included within the $1,354.9 million current portion of long-term debt and short-term debt as at March
31, is the December 2021 maturing $100.0 million credit facility, $387.7 million in respect of the
February 2022 maturing convertible bond, and $851.9 million relating to lessor-owned VIE subsidiaries
that Golar is required to consolidate in connection with nine sale and leaseback financed vessels,
including the Hilli.
Corporate and Other Matters:
As at March 31, 2021, there were 110.1 million shares outstanding. There were also 1.7 million
outstanding stock options with an average price of $23.33 and 0.7 million unvested restricted stock units
awarded. Subsequent to the quarter end, 1.2 million shares were repurchased at a cost of $13.7 million.
Of the initial $50 million approved share buyback scheme, $36.3 million remains available for further
repurchases, which are considered attractive at current price levels.
On April 12, 2021 Iain Ross resigned from his position as Chief Executive Officer. Karl Fredrik Staubo
has been appointed to replace Iain and assumed his role as CEO on May 13, 2021. Eduardo Maranhao,
formerly CFO of Hygo, has been appointed to replace Karl as CFO.
Golar has also published its ESG report. Containing industry leading levels of disclosure, this report
includes audited emissions data and long-term measurable reporting targets that will further aid Golar in

1. Refer to section "Non-GAAP measures" for definition and reconciliation to the most comparable US GAAP measure.
fulfilling its commitment to be at the forefront of delivering LNG as an alternative to more emission-
intensive fossil fuels.
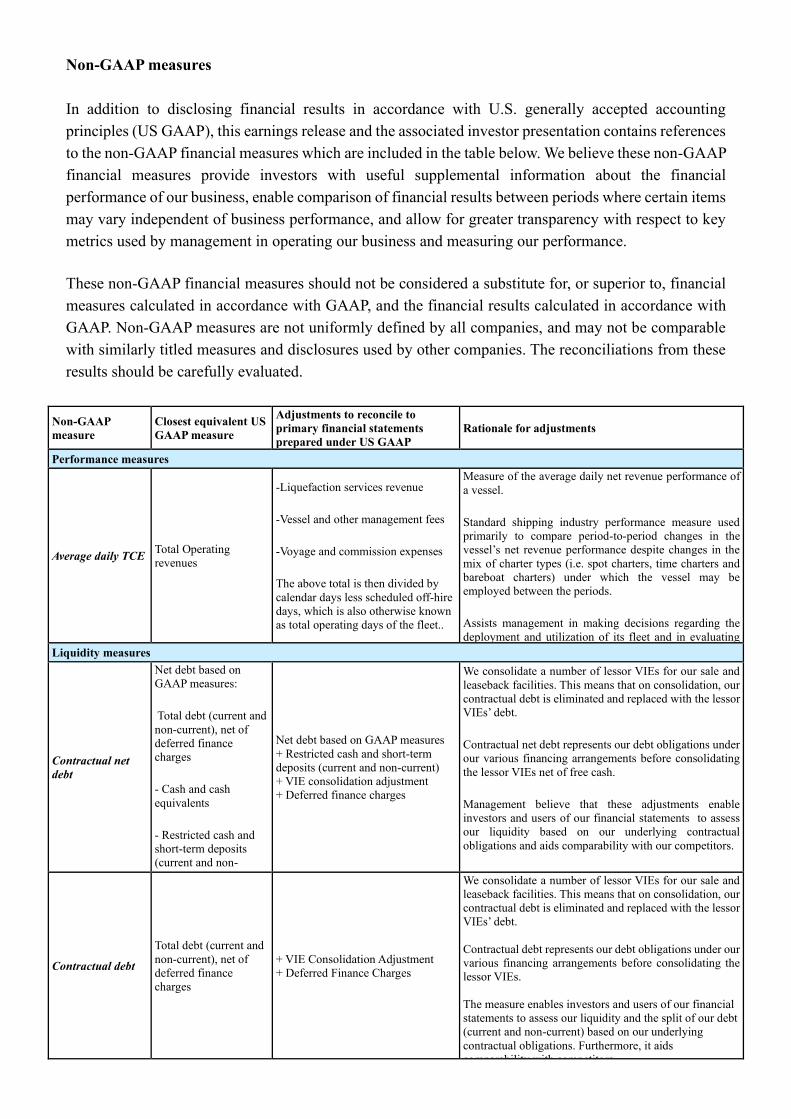
Non-GAAP measures
In addition to disclosing financial results in accordance with U.S. generally accepted accounting
principles (US GAAP), this earnings release and the associated investor presentation contains references
to the non-GAAP financial measures which are included in the table below. We believe these non-GAAP
financial measures provide investors with useful supplemental information about the financial
performance of our business, enable comparison of financial results between periods where certain items
may vary independent of business performance, and allow for greater transparency with respect to key
metrics used by management in operating our business and measuring our performance.
These non-GAAP financial measures should not be considered a substitute for, or superior to, financial
measures calculated in accordance with GAAP, and the financial results calculated in accordance with
GAAP. Non-GAAP measures are not uniformly defined by all companies, and may not be comparable
with similarly titled measures and disclosures used by other companies. The reconciliations from these
results should be carefully evaluated.
Non-GAAP
measure Closest equivalent US
GAAP measure
Adjustments to reconcile to
primary financial statements
prepared under US GAAP Rationale for adjustments
Performance measures
Average daily TCE Total Operating
revenues
-Liquefaction services revenue -Vessel and other management fees -Voyage and commission expenses The above total is then divided by
calendar days less scheduled off-hire
days, which is also otherwise known
as total operating days of the fleet..
Measure of the average daily net revenue performance of
a vessel. Standard shipping industry performance measure used
primarily to compare period-to-period changes in the
vessel’s net revenue performance despite changes in the
mix of charter types (i.e. spot charters, time charters and
bareboat charters) under which the vessel may be
employed between the periods. Assists management in making decisions regarding the
deployment and utilization of its fleet and in evaluating
financial performance.
Liquidity measures
Contractual net
debt
Net debt based on
GAAP measures: Total debt (current and
non-current), net of
deferred finance
charges - Cash and cash
equivalents - Restricted cash and
short-term deposits
(current and non-
current)
Net debt based on GAAP measures + Restricted cash and short-term
deposits (current and non-current) + VIE consolidation adjustment + Deferred finance charges
We consolidate a number of lessor VIEs for our sale and
leaseback facilities. This means that on consolidation, our
contractual debt is eliminated and replaced with the lessor
VIEs’ debt. Contractual net debt represents our debt obligations under
our various financing arrangements before consolidating
the lessor VIEs net of free cash. Management believe that these adjustments enable
investors and users of our financial statements to assess
our liquidity based on our underlying contractual
obligations and aids comparability with our competitors.
Contractual debt
Total debt (current and
non-current), net of
deferred finance
charges
+ VIE Consolidation Adjustment + Deferred Finance Charges
We consolidate a number of lessor VIEs for our sale and
leaseback facilities. This means that on consolidation, our
contractual debt is eliminated and replaced with the lessor
VIEs’ debt.
Contractual debt represents our debt obligations under our
various financing arrangements before consolidating the
lessor VIEs.
The measure enables investors and users of our financial
statements to assess our liquidity and the split of our debt
(current and non-current) based on our underlying
contractual obligations. Furthermore, it aids
comparability with competitors.

Reconciliations - Performance Measures (Average Daily TCE Rate)
2021 2020 2020
(in thousands of $) Jan-Mar Oct-Dec(1) Jan-Mar
Total operating revenues 125,827 118,684 122,559 Less: Liquefaction services revenue (54,397) (62,489) (54,524) Less: Vessel and other management fees (8,564) (5,468) (5,050) Time and voyage charter revenues 62,866 50,727 62,985 Less: Voyage and commission expenses (7,358) (5,792) (4,827) 55,508 44,935 58,158 Calendar days less scheduled off-hire days 900 920 940 Average daily TCE rate (to the closest $100) 61,700 48,800 61,900
Less: Steam LNG carrier time and voyage charter revenues (2,841) (2,851) (5,124) Add: Steam LNG carrier voyage and commission expenses 56 — 1,531 52,723 42,084 54,565 Less: Steam LNG carrier calendar days less scheduled off-hire days (90) (92) (112)
Net calendar days less scheduled off-hire 810 828 828 Average daily TCE rate for TFDE fleet (to the closest $100) 65,100 50,800 65,900
(1) The adjusted average daily TCE and adjusted fleet utilization for the period from October 1 to December 31, 2020, had we included the $2.7 million loss
of hire insurance claim from Golar Ice, which is presented within Other operating income in the condensed consolidated statements of income/(loss), would
have been $51,800 and 82% respectively.
Reconciliations - Liquidity Measures (Contractual Net Debt)
(in thousands of $) March 31,
2021 December 31,
2020 March 31,
2020 Net debt as calculated by GAAP
Total debt (current and non-current) net of deferred finance charges 2,373,882 2,350,782 2,557,316 Less
Cash and cash equivalents (149,936) (127,691) (130,976) Restricted cash and short-term deposits - current and non-current portion (148,959) (163,181) (172,380) Net debt as calculated by GAAP 2,074,987 2,059,910 2,253,960 VIE consolidation adjustment 295,466 293,236 206,584 Restricted cash and short-term deposits - current and non-current portion 148,959 163,181 172,380 Deferred finance charges 27,668 28,749 32,034 Total Contractual Net Debt 2,547,080 2,545,076 2,664,958 Less: Golar Partners' share of the Hilli contractual debt (381,000) (389,250) (395,350) Less: Keppel's share of the Gimi debt (103,500) (90,000) (67,500) GLNG's share of Contractual Net Debt 2,062,580 2,065,826 2,202,108
Reconciliations - Liquidity Measures (Contractual Debt)
(in thousands of $) March 31,
2021 December 31,
2020 March 31,
2020 Total debt (current and non-current) net of deferred finance charges 2,373,882 2,350,782 2,557,316 VIE consolidation adjustments 295,466 293,236 206,584 Deferred finance charges 27,668 28,749 32,034 Total Contractual Debt 2,697,016 2,672,767 2,795,934 Less: Golar Partners' share of the Hilli contractual debt (381,000) (389,250) (414,000) Less: Keppel's share of the Gimi debt (103,500) (90,000) (67,500) GLNG's share of Contractual Debt 2,212,516 2,193,517 2,314,434

Please see Appendix A for a capital repayment profile for Golar’s contractual debt.
Segment Information
In our 2020 Annual Report, we changed the way in which we report and measure our reportable segments. The main driver
of the change is the alignment of presentation and contents of financial information provided to our chief operating decision
maker (our Board of Directors), required to allocate resources, evaluate and manage both our standalone operating segments
and our overall business performance. The key impacts are our segments' profit measure is based on Adjusted EBITDA and
across our four reportable segments; Shipping, FLNG, Power and Corporate and others. Refer to note 6 to our consolidated
financial statements filed with our 2020 Annual Report, for additional details.
In January 2021, following the board of directors' approvals of the GMLP and Hygo mergers with NFE, we determined that
our share of the net earnings/(losses) in Golar Partners and Hygo and the respective carrying values of our investments have
to be presented as profit/(loss) from discontinued operations and assets held for sale, respectively. Consequently, for the three
months ended March 31, 2021, we ceased to consider Power as a reportable segment. Management has therefore concluded
that we provide and operate three distinct reportable segments as follows:
• Shipping – This segment is based on the business activities of the transportation of LNG carriers. We operate and
subsequently charter out LNG carriers on fixed terms to customers.
• FLNG – This segment is based on the business activities of FLNG vessels or projects. We convert LNG carriers into
FLNG vessels and subsequently charter them out to customers. We currently have one operational FLNG, the Hilli,
one undergoing conversion into a FLNG, the Gimi and one LNG carrier earmarked for conversion, the Gandria.
• Corporate and other – This segment is based on the business activities of vessel management and administrative
services and our corporate overhead costs.
Q1 2021
(in thousands of $) Shipping FLNG Corporate
and other Total
Total operating revenues 62,866 54,397 8,564 125,827 Vessel operating expenses (15,901) (12,301) (2,499) (30,701) Voyage, charterhire & commission expenses (7,317) (150) (16) (7,483) Administrative expenses (136) (143) (8,119) (8,398) Project development expenses — — (1,633) (1,633) Adjusted EBITDA 39,512 41,803 (3,703) 77,612
Q4 2020
(in thousands of $) Shipping FLNG Corporate
and other Total
Total operating revenues 50,727 62,489 5,468 118,684 Vessel operating expenses (14,629) (11,677) 89 (26,217) Voyage, charterhire & commission expenses (5,792) — — (5,792) Administrative expenses (795) (871) (6,921) (8,587) Project development expenses (8) (1,363) (1,416) (2,787) Other operating income 2,730 — — 2,730 Adjusted EBITDA 32,233 48,578 (2,780) 78,031
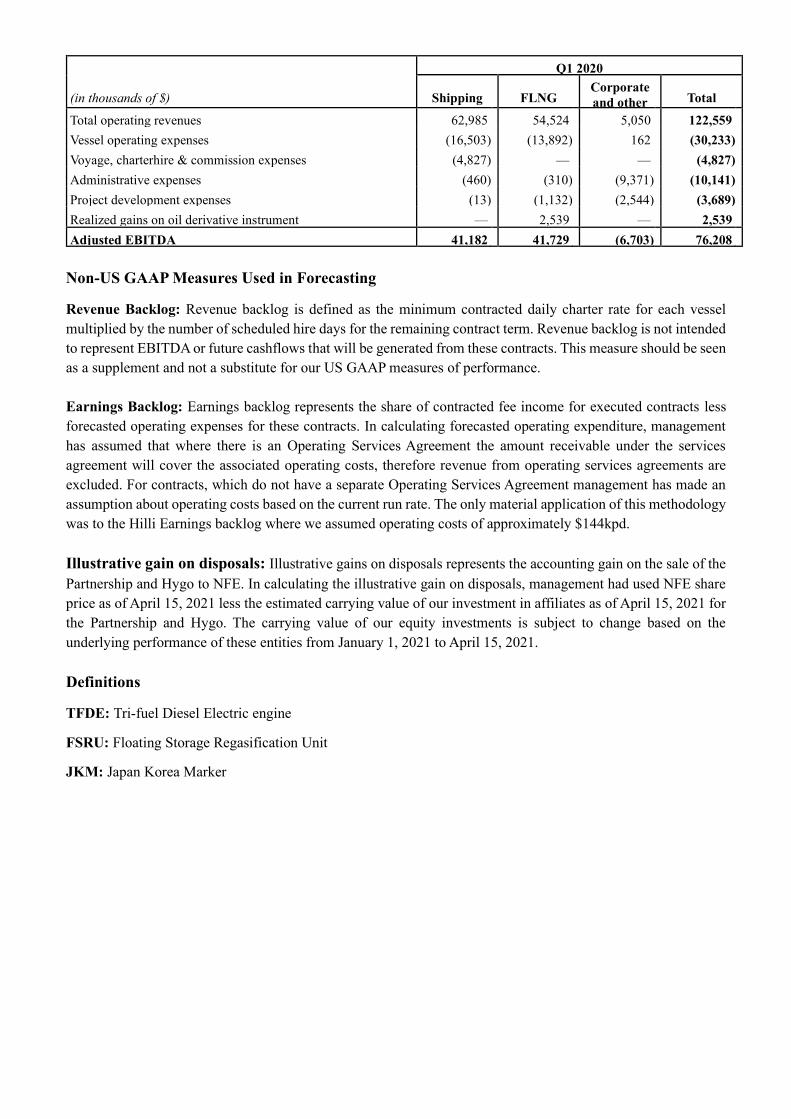
Q1 2020
(in thousands of $) Shipping FLNG Corporate
and other Total
Total operating revenues 62,985 54,524 5,050 122,559 Vessel operating expenses (16,503) (13,892) 162 (30,233) Voyage, charterhire & commission expenses (4,827) — — (4,827) Administrative expenses (460) (310) (9,371) (10,141) Project development expenses (13) (1,132) (2,544) (3,689) Realized gains on oil derivative instrument — 2,539 — 2,539 Adjusted EBITDA 41,182 41,729 (6,703) 76,208
Non-US GAAP Measures Used in Forecasting
Revenue Backlog: Revenue backlog is defined as the minimum contracted daily charter rate for each vessel
multiplied by the number of scheduled hire days for the remaining contract term. Revenue backlog is not intended
to represent EBITDA or future cashflows that will be generated from these contracts. This measure should be seen
as a supplement and not a substitute for our US GAAP measures of performance.
Earnings Backlog: Earnings backlog represents the share of contracted fee income for executed contracts less
forecasted operating expenses for these contracts. In calculating forecasted operating expenditure, management
has assumed that where there is an Operating Services Agreement the amount receivable under the services
agreement will cover the associated operating costs, therefore revenue from operating services agreements are
excluded. For contracts, which do not have a separate Operating Services Agreement management has made an
assumption about operating costs based on the current run rate. The only material application of this methodology
was to the Hilli Earnings backlog where we assumed operating costs of approximately $144kpd.
Illustrative gain on disposals: Illustrative gains on disposals represents the accounting gain on the sale of the
Partnership and Hygo to NFE. In calculating the illustrative gain on disposals, management had used NFE share
price as of April 15, 2021 less the estimated carrying value of our investment in affiliates as of April 15, 2021 for
the Partnership and Hygo. The carrying value of our equity investments is subject to change based on the
underlying performance of these entities from January 1, 2021 to April 15, 2021.
Definitions
TFDE: Tri-fuel Diesel Electric engine
FSRU: Floating Storage Regasification Unit
JKM: Japan Korea Marker

Forward Looking Statements
This press release contains forward-looking statements (as defined in Section 21E of the Securities
Exchange Act of 1934, as amended) which reflects management’s current expectations, estimates and
projections about its operations. All statements, other than statements of historical facts, that address
activities and events that will, should, could or may occur in the future are forward-looking statements.
Words such as “believe,” “anticipate,” “intend,” “estimate,” “forecast,” “project,” “plan,” “potential,”
“will,” “may,” “should,” “expect,” “may,” “could,” “would,” “predict,” “propose,” “continue,” or the
negative of these terms and similar expressions are intended to identify such forward-looking statements.
These statements are not guarantees of future performance and are subject to certain risks, uncertainties
and other factors, some of which are beyond our control and are difficult to predict. Therefore, actual
outcomes and results may differ materially from what is expressed or forecasted in such forward-looking
statements. You should not place undue reliance on these forward-looking statements, which speak only
as of the date of this press release. Unless legally required, Golar undertakes no obligation to update
publicly any forward-looking statements whether as a result of new information, future events or
otherwise. Among the important factors that could cause actual results to differ materially from those in
the forward-looking statements are:
• our inability and that of our counterparty to meet our respective obligations under the Lease and
Operate Agreement entered into in connection with the BP Greater Tortue / Ahmeyim Project (“Gimi
GTA Project”);
• continuing uncertainty resulting from potential future claims from our counterparties of purported
force majeure under contractual arrangements, including but not limited to our construction projects
(including the Gimi GTA Project) and other contracts to which we are a party;
• claims made or losses incurred in connection with our continuing obligations with regard to Hygo
Energy Transition Ltd (“Hygo”) and Golar LNG Partners LP (“Golar Partners”);
• the ability of Hygo, Golar Partners and New Fortress Energy, Inc. (“NFE”) to meet their respective
obligations to us, including indemnification obligations;
• challenges by authorities to the tax benefits we previously obtained under certain of our leasing
agreements;
• changes in our ability to retrofit vessels as floating storage and regasification units (“FSRUs”) or
floating liquefaction natural gas vessels (“FLNGs”) and in our ability to obtain financing for such
conversions on acceptable terms or at all;
• changes in our ability to obtain additional financing on acceptable terms or at all;
• the length and severity of outbreaks of pandemics, including the recent worldwide outbreak of the
novel coronavirus (“COVID-19”) and its impact on demand for liquefied natural gas (“LNG”) and
natural gas, the timing of completion of our conversion projects, the operations of our charterers, our
global operations and our business in general;
• failure of our contract counterparties to comply with their agreements with us or other key project
stakeholders;
• changes in LNG carrier, FSRU, or FLNG including charter rates, vessel values or technological
advancements;
• our vessel values and any future impairment charges we may incur;
• our ability to close potential future sales of additional equity interests in our vessels, including the
Hilli (“Hilli”) and FLNG Gimi on a timely basis or at all;

• our ability to contract the full utilization of the Hilli or other vessels;
• changes in the supply of or demand for LNG carriers, FSRUs or FLNGs;
• a material decline or prolonged weakness in rates for LNG carriers, FSRUs or FLNGs;
• changes in the performance of the pool in which certain of our vessels operate;
• changes in trading patterns that affect the opportunities for the profitable operation of LNG carriers,
FSRUs or FLNGs;
• changes in the supply of or demand for LNG or LNG carried by sea;
• continuing volatility of commodity prices;
• changes in the supply of or demand for natural gas generally or in particular regions;
• changes in our relationships with our counterparties, including our major chartering parties;
• changes in our relationship with our affiliates and the sustainability of any distributions they pay to
us;
• a decline or continuing weakness in the global financial markets;
• changes in general domestic and international political conditions, particularly where we operate;
• changes in the availability of vessels to purchase and in the time it takes to construct new vessels;
• failure of shipyards to comply with delivery schedules or performance specifications on a timely
basis or at all;
• changes to rules and regulations applicable to LNG carriers, FSRUs, FLNGs or other parts of the
LNG supply chain;
• our inability to achieve successful utilization of our fleet or inability to expand beyond the carriage
of LNG and provision of FSRU and FLNGs, particularly through our innovative FLNG strategy;
• actions taken by regulatory authorities that may prohibit the access of LNG carriers, FSRUs and
FLNGs to various ports;
• increases in costs, including, among other things, wages, insurance, provisions, repairs and
maintenance; and
• other factors listed from time to time in registration statements, reports or other materials that we
have filed with or furnished to the Securities and Exchange Commission, or the Commission,
including our most recent annual report on Form 20-F.
As a result, you are cautioned not to rely on any forward-looking statements. Actual results may differ
materially from those expressed or implied by such forward-looking statements. The Company
undertakes no obligation to publicly update or revise any forward-looking statements, whether as a result
of new information, future events or otherwise unless required by law.
May 20, 2021
The Board of Directors
Golar LNG Limited
Hamilton, Bermuda
Investor Questions: +44 207 063 7900
Karl Fredrik Staubo - CEO
Eduardo Maranhao - CFO
Stuart Buchanan - Head of Investor Relations

Golar LNG Limited
CONDENSED CONSOLIDATED STATEMENTS OF OPERATIONS
2021 2020 2020 2020
Jan-Mar Oct-Dec Jan-Mar Jan-Dec
(in thousands of $) Unaudited Unaudited Unaudited Audited
Time and voyage charter revenues 62,866 50,727 62,985 191,881
Liquefaction services revenue 54,397 62,489 54,524 226,061
Vessel and other management fees 8,564 5,468 5,050 20,695
Total operating revenues 125,827 118,684 122,559 438,637
Vessel operating expenses (30,701) (26,217) (30,233) (108,926)
Voyage, charterhire and commission expenses (7,483) (5,792) (4,827) (12,634)
Administrative expenses (8,398) (8,587) (10,141) (35,311)
Project development expenses (1,633) (2,787) (3,689) (8,891)
Depreciation and amortization (26,506) (26,826) (27,240) (107,923)
Total operating expenses (74,721) (70,209) (76,130) (273,685)
Other operating income/(loss)
Realized and unrealized gain/(loss) on oil derivative instrument 10,600 (5,700) (25,271) (42,561)
Other operating gains — 2,730 — 3,262 Operating income 61,706 45,505 21,158 125,653
Other non-operating income — 5,682 — 5,682
Total other non-operating income — 5,682 — 5,682
Financial income/(expense)
Interest income 34 140 1,160 1,572 Interest expense (14,546) (15,217) (21,041) (69,354)
Gains/(losses) on derivative instruments 23,351 2,120 (54,721) (52,423)
Other financial items, net (310) (3,538) 326 (1,552)
Net financial income/(expense) 8,529 (16,495) (74,276) (121,757)
Income/(loss) before income taxes, equity in net income of affiliates
and non-controlling interests 70,235 34,692 (53,118) 9,578
Income taxes (257) (383) (197) (981)
Equity in net losses of affiliates (682) (148) (71) (538)
Net income/(loss) from continuing operations 69,296 34,161 (53,386) 8,059
Profit/(loss) from discontinued operations (6,192) 4,481 (37,865) (175,989)
Net income/(loss) 63,104 38,642 (91,251) (167,930)
Net income attributable to non-controlling interests (37,740) (30,516) (12,996) (105,627)
Net income/(loss) attributable to Golar LNG Limited 25,364 8,126 (104,247) (273,557)

Golar LNG Limited
CONDENSED CONSOLIDATED STATEMENTS OF COMPREHENSIVE INCOME/(LOSS)
2021 2020 2020 2020
Jan-Mar Oct-Dec Jan-Mar Jan-Dec
(in thousands of $) Unaudited Unaudited Unaudited Unaudited
Net income/(loss) 63,104 38,642 (91,251) (167,930)
Other comprehensive income/(loss):
Gain/(loss) associated with pensions, net of tax 56 (3,683) 52 (3,527)
Share of affiliate's comprehensive (losses)/earnings from discontinued
operations (2,798) 4,609 (18,067) (17,680)
Other comprehensive (loss)/income (2,742) 926 (18,015) (21,207)
Comprehensive income/(loss) 60,362 39,568 (109,266) (189,137)
Comprehensive income/(loss) attributable to:
Stockholders of Golar LNG Limited 22,622 9,052 (122,262) (294,764)
Non-controlling interests 37,740 30,516 12,996 105,627 Comprehensive income/(loss) 60,362 39,568 (109,266) (189,137)
Golar LNG Limited
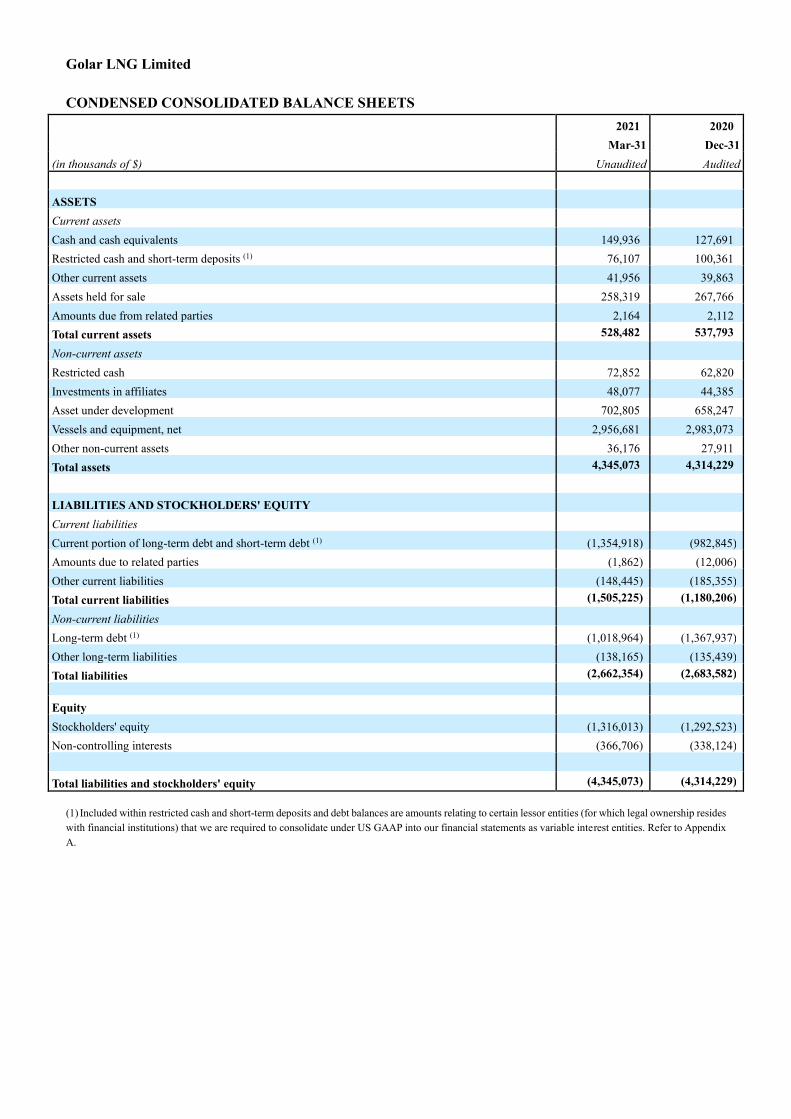
CONDENSED CONSOLIDATED BALANCE SHEETS
2021 2020 Mar-31 Dec-31
(in thousands of $) Unaudited Audited
ASSETS
Current assets
Cash and cash equivalents 149,936 127,691 Restricted cash and short-term deposits (1) 76,107 100,361 Other current assets 41,956 39,863 Assets held for sale 258,319 267,766 Amounts due from related parties 2,164 2,112 Total current assets 528,482 537,793
Non-current assets
Restricted cash 72,852 62,820 Investments in affiliates 48,077 44,385 Asset under development 702,805 658,247 Vessels and equipment, net 2,956,681 2,983,073 Other non-current assets 36,176 27,911 Total assets 4,345,073 4,314,229
LIABILITIES AND STOCKHOLDERS' EQUITY
Current liabilities
Current portion of long-term debt and short-term debt (1) (1,354,918) (982,845) Amounts due to related parties (1,862) (12,006) Other current liabilities (148,445) (185,355) Total current liabilities (1,505,225) (1,180,206)
Non-current liabilities
Long-term debt (1) (1,018,964) (1,367,937) Other long-term liabilities (138,165) (135,439) Total liabilities (2,662,354) (2,683,582)
Equity
Stockholders' equity (1,316,013) (1,292,523) Non-controlling interests (366,706) (338,124)
Total liabilities and stockholders' equity (4,345,073) (4,314,229)
(1) Included within restricted cash and short-term deposits and debt balances are amounts relating to certain lessor entities (for which legal ownership resides
with financial institutions) that we are required to consolidate under US GAAP into our financial statements as variable interest entities. Refer to Appendix
A.
Golar LNG Limited
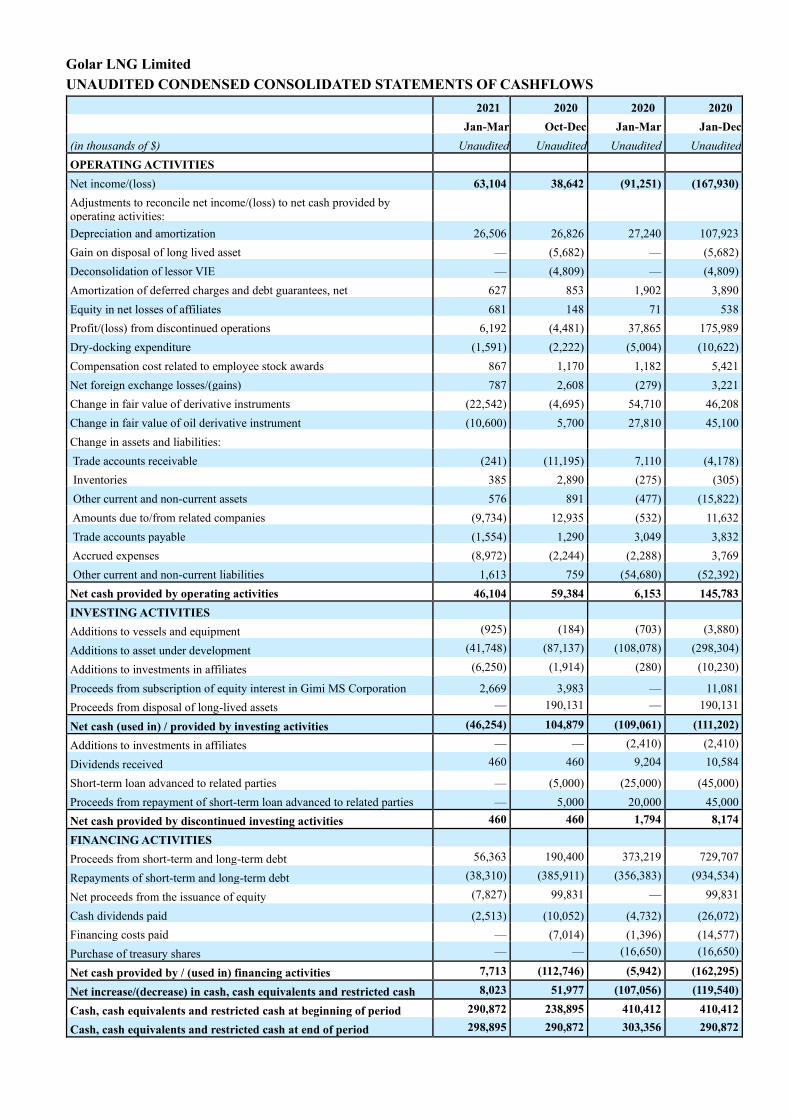
UNAUDITED CONDENSED CONSOLIDATED STATEMENTS OF CASHFLOWS
2021 2020 2020 2020 Jan-Mar Oct-Dec Jan-Mar Jan-Dec
(in thousands of $) Unaudited Unaudited Unaudited Unaudited
OPERATING ACTIVITIES
Net income/(loss) 63,104 38,642 (91,251) (167,930)
Adjustments to reconcile net income/(loss) to net cash provided by
operating activities:
Depreciation and amortization 26,506 26,826 27,240 107,923
Gain on disposal of long lived asset — (5,682) — (5,682)
Deconsolidation of lessor VIE — (4,809) — (4,809)
Amortization of deferred charges and debt guarantees, net 627 853 1,902 3,890
Equity in net losses of affiliates 681 148 71 538
Profit/(loss) from discontinued operations 6,192 (4,481) 37,865 175,989
Dry-docking expenditure (1,591) (2,222) (5,004) (10,622)
Compensation cost related to employee stock awards 867 1,170 1,182 5,421
Net foreign exchange losses/(gains) 787 2,608 (279) 3,221
Change in fair value of derivative instruments (22,542) (4,695) 54,710 46,208
Change in fair value of oil derivative instrument (10,600) 5,700 27,810 45,100
Change in assets and liabilities: Trade accounts receivable (241) (11,195) 7,110 (4,178)
Inventories 385 2,890 (275) (305)
Other current and non-current assets 576 891 (477) (15,822)
Amounts due to/from related companies (9,734) 12,935 (532) 11,632
Trade accounts payable (1,554) 1,290 3,049 3,832
Accrued expenses (8,972) (2,244) (2,288) 3,769
Other current and non-current liabilities 1,613 759 (54,680) (52,392)
Net cash provided by operating activities 46,104 59,384 6,153 145,783
INVESTING ACTIVITIES Additions to vessels and equipment (925) (184) (703) (3,880)
Additions to asset under development (41,748) (87,137) (108,078) (298,304)
Additions to investments in affiliates (6,250) (1,914) (280) (10,230)
Proceeds from subscription of equity interest in Gimi MS Corporation 2,669 3,983 — 11,081
Proceeds from disposal of long-lived assets — 190,131 — 190,131
Net cash (used in) / provided by investing activities (46,254) 104,879 (109,061) (111,202)
Additions to investments in affiliates — — (2,410) (2,410)
Dividends received 460 460 9,204 10,584
Short-term loan advanced to related parties — (5,000) (25,000) (45,000)
Proceeds from repayment of short-term loan advanced to related parties — 5,000 20,000 45,000
Net cash provided by discontinued investing activities 460 460 1,794 8,174
FINANCING ACTIVITIES
Proceeds from short-term and long-term debt 56,363 190,400 373,219 729,707
Repayments of short-term and long-term debt (38,310) (385,911) (356,383) (934,534)
Net proceeds from the issuance of equity (7,827) 99,831 — 99,831
Cash dividends paid (2,513) (10,052) (4,732) (26,072)
Financing costs paid — (7,014) (1,396) (14,577)
Purchase of treasury shares — — (16,650) (16,650)
Net cash provided by / (used in) financing activities 7,713 (112,746) (5,942) (162,295)
Net increase/(decrease) in cash, cash equivalents and restricted cash 8,023 51,977 (107,056) (119,540)
Cash, cash equivalents and restricted cash at beginning of period 290,872 238,895 410,412 410,412
Cash, cash equivalents and restricted cash at end of period 298,895 290,872 303,356 290,872

Golar LNG Limited
UNAUDITED CONDENSED CONSOLIDATED STATEMENTS OF CHANGES IN EQUITY
(in thousands of $) Share
Capital Treasury
Shares
Additional
Paid-in
Capital Contributed
Surplus (1)
Accumulated
Other
Comprehensive
Loss
Accumulated
Retained
Losses
Total before
Non-
Controlling
Interests
Non-
Controlling
Interests Total
Equity
Balance at December 31,
2019 101,303 (39,098) 1,876,067 200,000 (34,866) (605,145) 1,498,261 252,565 1,750,826
Net (loss)/income — — — — — (104,247) (104,247) 12,996 (91,251) Dividends — — — — — — — (10,030) (10,030) Employee stock
compensation — — 1,272 — — — 1,272 — 1,272
Forfeiture of employee
stock compensation — — (90) — — — (90) — (90)
Repurchase and
cancellation of treasury
shares — 39,098 — — — (55,748) (16,650) — (16,650)
Other comprehensive loss — — — — (18,015) — (18,015) — (18,015) Balance at March 31,
2020 101,303 — 1,877,249 200,000 (52,881) (765,140) 1,360,531 255,531 1,616,062
(in thousands of $) Share
Capital Treasury
Shares
Additional
Paid-in
Capital Contributed
Surplus (1)
Accumulated
Other
Comprehensive
Loss
Accumulated
Retained
Losses
Total before
Non-
Controlling
Interests
Non-
Controlling
Interests Total
Equity
Balance at December 31,
2020 109,944 — 1,969,602 200,000 (56,073) (930,950) 1,292,523 338,124 1,630,647
Net income — — — — — 25,364 25,364 37,740 63,104 Dividends — — — — — — — (11,827) (11,827) Employee stock compensation
— — 1,003 — — — 1,003 — 1,003
Forfeiture of employee stock compensation
— — (135) — — — (135) — (135)
Restricted stock units 196 — (196) — — — — — —
Proceeds from subscription
if equity interest in Gimi MS Corporation
— — — — — — — 2,669 2,669
Other comprehensive loss — — — — (2,742) — (2,742) — (2,742) Balance at March 31,
2021 110,140 — 1,970,274 200,000 (58,815) (905,586) 1,316,013 366,706 1,682,719
(1) Contributed Surplus is 'capital' that can be returned to shareholders without the need to reduce share capital, thereby giving us greater flexibility when it
comes to declaring dividends.
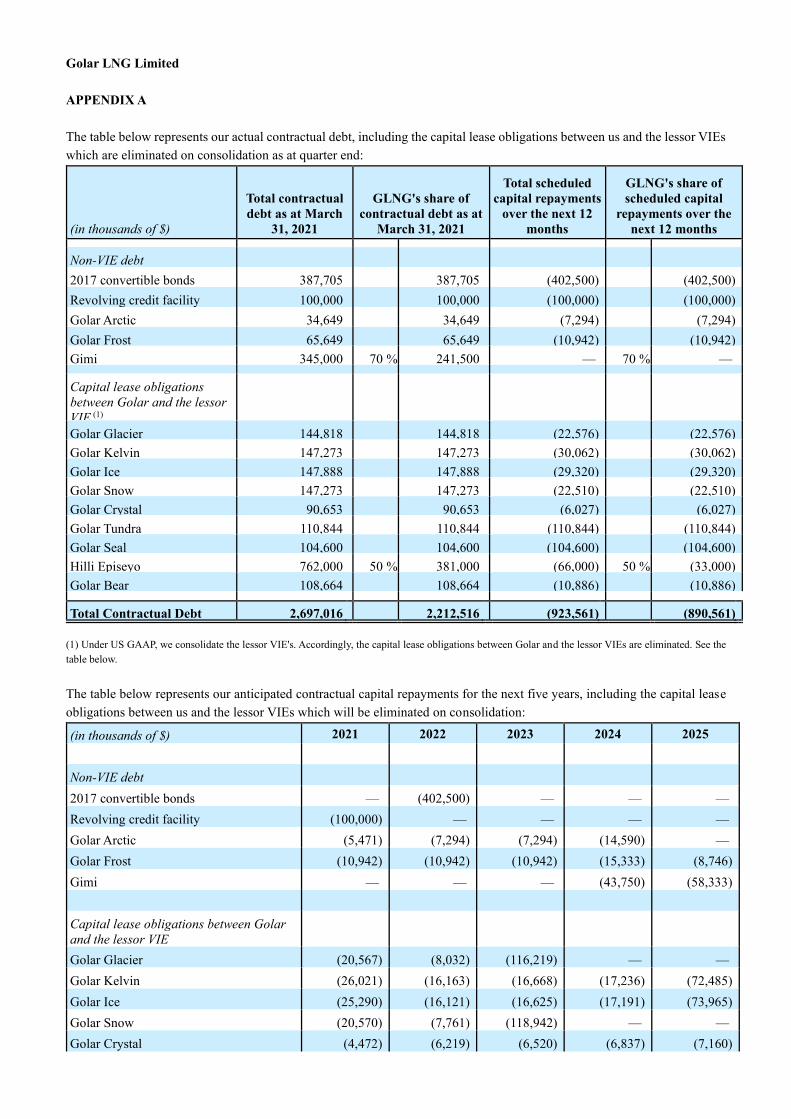
Golar LNG Limited
APPENDIX A
The table below represents our actual contractual debt, including the capital lease obligations between us and the lessor VIEs
which are eliminated on consolidation as at quarter end:
(in thousands of $)
Total contractual
debt as at March
31, 2021
GLNG's share of
contractual debt as at
March 31, 2021
Total scheduled
capital repayments
over the next 12
months
GLNG's share of
scheduled capital
repayments over the
next 12 months
Non-VIE debt
2017 convertible bonds 387,705 387,705 (402,500) (402,500) Revolving credit facility 100,000 100,000 (100,000) (100,000) Golar Arctic 34,649 34,649 (7,294) (7,294) Golar Frost 65,649 65,649 (10,942) (10,942) Gimi 345,000 70 % 241,500 — 70 % — Capital lease obligations
between Golar and the lessor
VIE (1)
Golar Glacier 144,818 144,818 (22,576) (22,576) Golar Kelvin 147,273 147,273 (30,062) (30,062) Golar Ice 147,888 147,888 (29,320) (29,320) Golar Snow 147,273 147,273 (22,510) (22,510) Golar Crystal 90,653 90,653 (6,027) (6,027) Golar Tundra 110,844 110,844 (110,844) (110,844) Golar Seal 104,600 104,600 (104,600) (104,600) Hilli Episeyo 762,000 50 % 381,000 (66,000) 50 % (33,000) Golar Bear 108,664 108,664 (10,886) (10,886) Total Contractual Debt 2,697,016 2,212,516 (923,561) (890,561)
(1) Under US GAAP, we consolidate the lessor VIE's. Accordingly, the capital lease obligations between Golar and the lessor VIEs are eliminated. See the
table below.
The table below represents our anticipated contractual capital repayments for the next five years, including the capital lease
obligations between us and the lessor VIEs which will be eliminated on consolidation:
(in thousands of $) 2021 2022 2023 2024 2025
Non-VIE debt
2017 convertible bonds — (402,500) — — —
Revolving credit facility (100,000) — — — —
Golar Arctic (5,471) (7,294) (7,294) (14,590) —
Golar Frost (10,942) (10,942) (10,942) (15,333) (8,746)
Gimi — — — (43,750) (58,333)
Capital lease obligations between Golar
and the lessor VIE
Golar Glacier (20,567) (8,032) (116,219) — —
Golar Kelvin (26,021) (16,163) (16,668) (17,236) (72,485)
Golar Ice (25,290) (16,121) (16,625) (17,191) (73,965)
Golar Snow (20,570) (7,761) (118,942) — —
Golar Crystal (4,472) (6,219) (6,520) (6,837) (7,160)
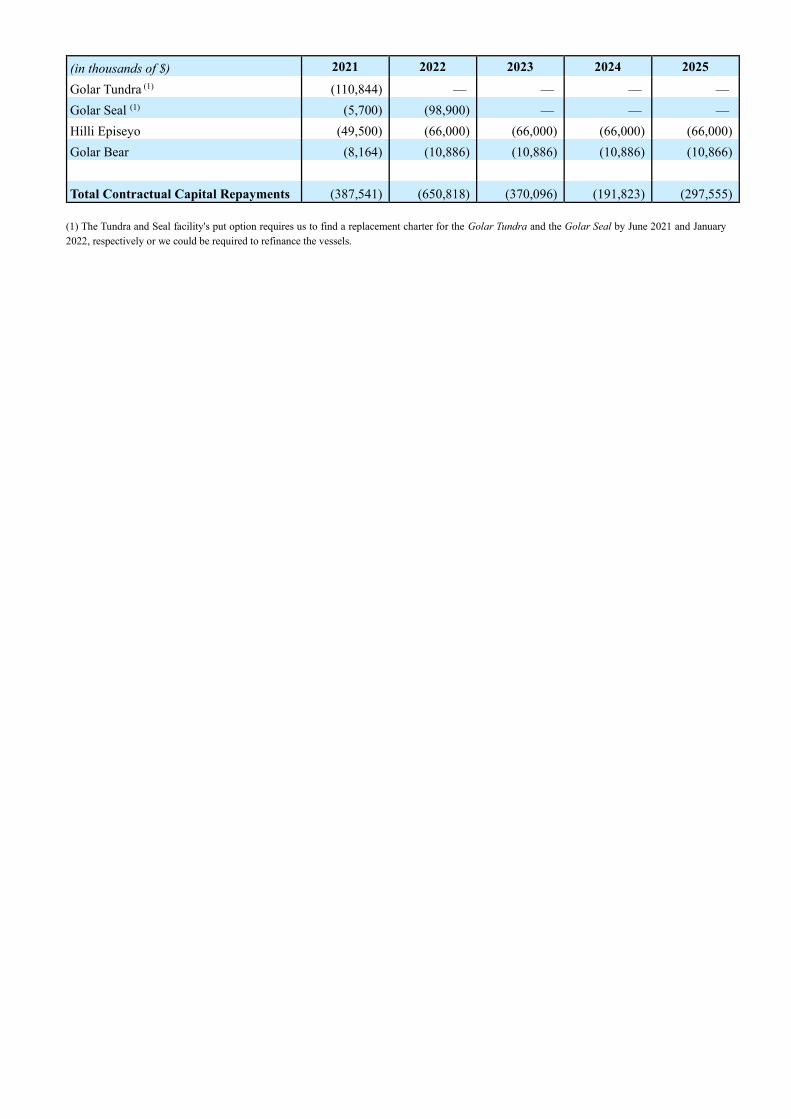
(in thousands of $) 2021 2022 2023 2024 2025
Golar Tundra (1) (110,844) — — — —
Golar Seal (1) (5,700) (98,900) — — —
Hilli Episeyo (49,500) (66,000) (66,000) (66,000) (66,000)
Golar Bear (8,164) (10,886) (10,886) (10,886) (10,866)
Total Contractual Capital Repayments (387,541) (650,818) (370,096) (191,823) (297,555)
(1) The Tundra and Seal facility's put option requires us to find a replacement charter for the Golar Tundra and the Golar Seal by June 2021 and January
2022, respectively or we could be required to refinance the vessels.
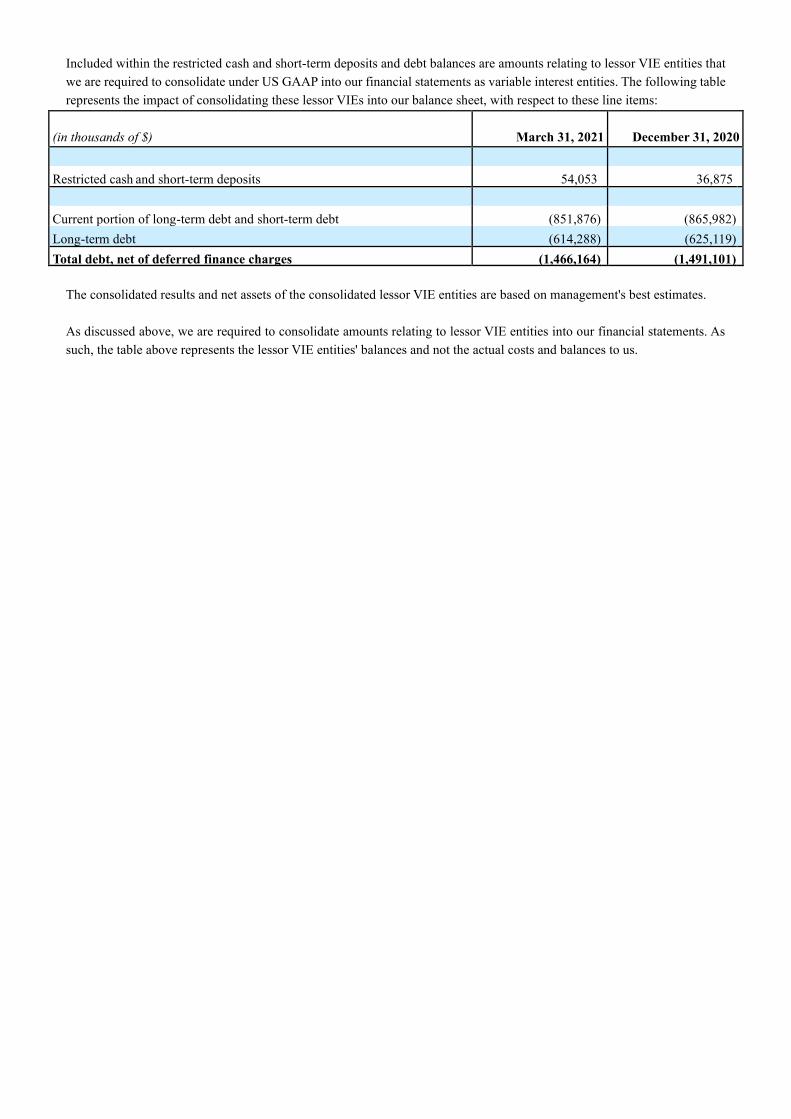
Included within the restricted cash and short-term deposits and debt balances are amounts relating to lessor VIE entities that
we are required to consolidate under US GAAP into our financial statements as variable interest entities. The following table
represents the impact of consolidating these lessor VIEs into our balance sheet, with respect to these line items:
(in thousands of $) March 31, 2021 December 31, 2020
Restricted cash and short-term deposits 54,053 36,875
Current portion of long-term debt and short-term debt (851,876) (865,982) Long-term debt (614,288) (625,119) Total debt, net of deferred finance charges (1,466,164) (1,491,101)
The consolidated results and net assets of the consolidated lessor VIE entities are based on management's best estimates.
As discussed above, we are required to consolidate amounts relating to lessor VIE entities into our financial statements. As
such, the table above represents the lessor VIE entities' balances and not the actual costs and balances to us.