Embed Size (px)
Citation preview

1
INTERLAMINAR TOUGHNESS CHARACTERISATION OF 3D WOVEN CARBON FIBRE COMPOSITES
D. T. Fishpool1*
, A. Rezai1, D. Baker
1, S. L. Ogin
2, P. A. Smith
2
1BAE Systems, Advanced Technology Centre, Sowerby Building – 20R, Filton, Bristol, UK, BS34 7QW
2University of Surrey, Faculty of Engineering and Physical Sciences, Guildford, Surrey, UK, GU2 7XH
ABSTRACT
The addition of reinforcement in the through thickness direction using 3D weaving techniques has been
shown to improve the delamination toughness of composite materials, mitigating the reduced out of
plane performance of traditional composite materials. At present the optimum architecture for
improving delamination resistance is uncertain. To address this, three geometries of 3D woven carbon
fibre reinforced epoxy composites were evaluated in mode I using the double cantilever beam (DCB) test
method. Mode II testing was also carried out using the end loaded split (ELS) and four point end notch
flexure (4ENF) test methods. For large delaminations (i.e. when the R-curve reaches its plateau value) an
orthogonal weave is found to be most effective in resisting delamination propagation in mode I, and is
comparable to the layer-to-layer architecture in mode II. In all cases an angle interlock weave appears to
be less effective than either the orthogonal or layer-to-layer weaves.
1 INTRODUCTION
The high in-plane properties of polymer matrix composites combined with their low density have
resulted in wide-spread usage in the aerospace and motorsport industries. A major life-limiting factor
which restricts their applications is their susceptibility to delamination. The addition of reinforcement in
the through thickness direction has been shown to increase the ability of a composite to tolerate
delamination. Methods of through thickness reinforcement include z-pinning, stitching and 3D weaving.
Each of these methods can result in improved interlaminar fracture toughness and damage resistance.
For example, the delamination resistance of Z-pinned composites is found to be significantly higher in

2
mode I, mode II and mixed mode (I and II) conditions than 2D equivalents [1]. Stitching involves the
insertion of through thickness yarns into 2D preforms which makes it a very cost effective method of
through thickness reinforcement [2]. Stitching results in improved interlaminar fracture toughness and
damage resistance, however in most cases there is also substantial degradation of the in-plane
mechanical performance due to damage incurred during processing [2].
An alternative and attractive method of improving delamination is by using 3D weaving. 3D weaving
involves the creation of a dry preform which is subsequently infused with resin. The preforms can be
quite complex in shape potentially making some components cheaper to manufacture with this method.
Additionally 3D woven composites tend to have both increased interlaminar fracture toughness and
damage resistance [3]. A disadvantage of 3D woven composites is damage or distortion introduced to
in-plane fibres through abrasion and bending of the yarns as they are fed through the loom during
weaving [4]. In carbon composites this can result in a tensile strength reduction of the yarns by as much
as 12% [5], although reductions of up to 25% have also been observed [6]. In situations where tensile
strength reduction occurs, this can be attributed to geometrical defects such as crimp and increased tow
waviness [7, 8], with fibre breakage during processing as a possible contributing factor[4, 5, 9]. On the
other hand, some authors have reported unchanged [10] or increased tensile strength [11, 12] in 3D
woven composites which they attributed to the compaction of the 3D woven preform due to the
tension in the through-thickness yarns during processing. However, there appears to be general
agreement that the fatigue performance of 3D woven composites is consistently lower than that of their
2D equivalents [13, 14], with the fatigue performance becoming poorer with increasing z-binder
content. The precise reasons for the poorer fatigue performance have yet to be determined.
The potential reductions to in-plane and fatigue performance of composites based on 3D woven fabrics
is offset by improved delamination toughness, impact resistance and joint strength although it has been
shown that 3D woven composites are ineffective at resisting the initiation and growth of cracks shorter
than about 2 to 5mm [15]. Reported values for mode I delamination toughness vary widely depending
on the stitch density and architecture. A typical 2D-woven carbon-fibre epoxy composite would be

3
expected to have a propagation GIC of approximately 600-800 J/m2 [16, 17] whilst 3D woven composites
have reported to have propagation GIC from approximately 1400-6400 J/m2 [16, 18, 19].
The mode I delamination toughness of 3D woven composites toughness is affected significantly by the
details of the through-thickness stitch distribution, with the R-curve behaviour of composites with
similar stitch densities, but differing stitch spacing, being highly dissimilar [20]. However, measurement
of interlaminar fracture toughness for 3D reinforced composites is complicated by a number of issues.
First, the complicated geometry of 3D reinforced composites promotes crack branching and deviation
from the central plane, which invalidates the test according to some test standards [21, 22]. It is known
that the crack path in 2D woven laminates without 3D reinforcement tested in mode I tends to oscillate
between adjacent warp tows leading to steeper R-curves than are seen in equivalent uni-directional
laminates; as a consequence, the increase in apparent delamination resistance is greater than might be
expected purely through the increased crack area [23]. It is to be expected that this effect will also be a
contributing factor to increase delamination resistance in 3D woven composites.
Second, measurement of the delamination resistance can be more difficult. Mode I delamination
toughness is usually determined using the double cantilever beam (DCB) test which uses a split
cantilever beam specimen. In very thin specimens, or specimens that are particularly tough (e.g. due to
some form of through-thickness reinforcement), failure can occur at the root of the cantilever arms,
rather than through the progression of the crack, which means that a propagation value for GIC cannot
be measured. The use of adhesively bonded reinforcing tabs to the faces of the specimen to increase the
stiffness has been shown to prevent failure through bending [16, 18, 19] and some authors have termed
this type of specimen a “tabbed double cantilever beam” test (TDCB). However, due to the potential for
confusion of this test with the tapered double cantilever beam test, it is referred to in this work as the
reinforced double cantilever beam test (RDCB).
With regard to mode II delamination resistance, a number of methods are used to determine the mode
II delamination toughness of composite materials and there is currently no universally accepted

4
standard for mode II testing. Commonly used methods include (i) the end loaded split (ELS), (ii) 3-point
and 4-point end-notch flexure (3ENF; 4ENF). Of these methods only ELS and 4ENF can be used to
measure propagation values of GIIC; in addition, the 4ENF test is reported to give significantly higher GIIC
values than the 3ENF test [23, 25]. GIIC values measured using 4ENF have also been shown to vary
significantly with the inner and outer roller spans [15].
In light of the uncertainty with regard to the optimum 3D architecture for improved delamination
resistance, the aim of this work is to evaluate the impact of different through thickness weave
architectures on the mode I and mode II interlaminar fracture toughness of composite materials. The
mode II interlaminar fracture toughness of two architectures (orthogonal and a hybridisation of layer-to-
layer and orthogonal) were compared by Pankow et al. [26]. This investigation showed a slight increase
in GIIC at longer crack lengths for the hybrid weave over the orthogonal weave, however no attempt to
examine the mode I behaviour of these weaves was made [26].
In this paper three weave architectures were investigated. The first was an orthogonal weave which
spanned the thickness of the preform weaving together all layers. The second was a layer-to-layer
weave which connected adjacent layers of the preform. Finally, the third was an angled through
thickness interlock weave which, similar to the first, spanned the thickness of the preform connecting all
layers of the preform. The effect of changing the through thickness tow size was also investigated for
the orthogonal weave architecture. Mode I testing was carried out using a combination of DCB and
RDCB testing. In order to verify that the results obtained using the RDCB method were comparable to
those measured by DCB testing; tests were carried out initially; using both methods, on UD carbon fibre
reinforced epoxy, subsequently the layer-to-layer weave was tested using both methods. Additionally,
specimens were tested in mode II using both the ELS and 4ENF methods.
2 EXPERIMENTAL METHODS
2.1 Materials

5
All 3D woven materials examined in this investigation were produced using a vacuum resin infusion
process. With one exception, all of the 3D woven materials had a 6% loading of binder tows, the
exception being an orthogonal weave with a 3% loading. This percentage signifies the dry weight of the
binder tows (i.e. both the through-thickness and warp direction content) as a proportion of the rest of
the dry pre-form. In the case of the 3% orthogonal weave, the number of binder tows used was kept
constant relative to its 6% counterpart, i.e. the size of binder tows was reduced in the 3% material. In all
cases the weave structure was designed to give a nominal fibre volume fraction content of 55% for the
infused panels. A summary of the materials investigated is given in Table 1. Both the 6% and 3%
orthogonal materials were produced by Sigmatex Ltd. All other weave architectures were manufactured
by the University of Ulster.
Table 1. Descriptions of the materials used in this investigation
Name Description Variations
Orthogonal Connects all layers of the preform together passing
through the thickness of the material parallel to the
thickness direction
6% binder tow content with
MVR444 epoxy matrix
3% binder tow content with
MVR444 epoxy matrix
Layer-to-layer Connects adjacent layers of the preform together 6% binder tow content with
MVR444 epoxy matrix
6% binder tow content with
toughened epoxy matrix
Angle Interlock Connects all layers of the preform together passing
through the thickness of the material at an angle to
the thickness direction
6% binder tow content with
MVR444 epoxy matrix
The orthogonal weave used in this investigation had binder tows which ran through the thickness
direction of the specimen, over one weft tow, then back through the specimen and under the next four
weft tows. This pattern was repeated along the length of the specimen. Across the width of the
specimen, there was one orthogonal tow spaced approximately every 5 mm. The orthogonal tows were

6
also staggered across the width of the specimen, as shown in Figure 1. All the orthogonal woven
specimens had an un-modified MVR444 epoxy resin matrix produced by ACG ltd (A section of Umeco
plc).
Figure 1. a) Schematic side elevation of orthogonal weave, where filled grey indicates a binder tow and
black rectangles represent weft tows; b) schematic plan view of the orthogonal weave where filled grey,
solid black and dashed black lines indicate binder, weft and warp tows, respectively; c) reflected light
photomicrograph of a cross-section of an orthogonal specimen. © BAE Systems, 2012
Unlike the orthogonal and angle interlock weaves, “layer-to-layer” reinforcement does not run through
the entire thickness of the specimen. The binder tows are woven between adjacent plies so that each
ply is connected to the plies immediately above and below it. This weave is illustrated in Figure 2. The
binder tows run over one weft tow, then into the ply below, and then under the next weft tow along the
length of the specimen in that ply.
Two resin types were used for the matrix of the layer-to-layer specimens. The standard resin, used for
all reinforcements, was an un-modified MVR444 epoxy produced by ACG ltd. A proprietary toughened
resin system supplied for evaluation purposes was also investigated for the layer-to-layer 3D woven
material.
Figure 2. a) schematic side elevation of layer-to-layer weave, with filled grey indicating a binder tow,
solid black representing weft tows; b) schematic plan view of the layer-to-layer weave, with filled grey,

7
solid black and dashed black indicating binder, weft and warp tows, respectively; c) reflected light
photomicrograph of cross-section of a layer-to-layer specimen. © BAE Systems, 2012
The angle interlock weave runs at an angle through the thickness of a specimen and Figure 3 shows the
weave schematically. The interlaminar tow runs through the specimen around the weft tows in a series
of steps. The spacing of the binder tows across the top face of a specimen is shown in Figure 3, together
with a photomicrograph of a specimen.
Figure 3. a) schematic side elevation of angle interlock weave, with filled grey indicating a binder tow,
solid black representing weft tows; b) schematic plan view of the angle interlock weave, with filled grey,
solid black and dashed black indicating binder, weft and warp tows, respectively; c) reflected light
photomicrograph of cross-section of an angle interlock specimen. © BAE Systems, 2012
2.2 Test Methods
For all DCB test specimens, coupons were manufactured with a thin, non-adhesive film insert at least 50
mm in length along the midplane at one end that served as a crack initiator. One edge of the specimen
was painted with typewriter correction fluid to enable crack growth to be measured more easily.

8
DCB tests were carried out on an Instron 4507 mechanical testing machine with the specimens loaded
at a constant displacement rate (in the range of 0.5 to 2 mm/min) and the load, cross-head
displacement and crack length recorded at regular intervals. The load and crack length values taken
immediately before a period of crack propagation were used to calculate interlaminar fracture
toughness. Four types of tests were performed: mode I DCB and RDCB tests, mode II end-loaded split
and mode II four-point end notch flexure.
All DCB tests for this investigation were carried out according to ASTM standard D5528 - 01e3 [21] using
the modified beam theory (MBT) approach for analysing the data. The specimens were tested at a
constant displacement rate using T-shaped load blocks that were adhesively bonded to the upper and
lower surface of each specimen. At regular intervals, the delamination crack length, applied load and
crosshead displacement values were recorded. The values of GIC calculated from the DCB tests were
plotted against crack length to give a resistance curve (R-curve) where the crack initiation and crack
propagation (steady-state value) were of particular interest. DCB specimens for the orthogonal weave
architecture failed at the root at the root of the cantilever arms rather than through the progression of a
crack. Hence RDCB tests were carried out, using reinforcing tabs made of woven carbon fibre with an
LTM26 epoxy resin matrix (approximately 4 mm thick, 25 mm wide and 180 mm in length) that were
bonded adhesively to the faces of the specimen to increase the stiffness and prevent failure through
bending.
The mode II end-loaded split specimens (ELS) requires that specimens are first pre-cracked in mode I,
then loaded in compression at one end by means of a T-shaped loading block while clamped at the
other end such that movement is limited to just the horizontal plane in the direction of crack
progression (Figure 4). The free length L, the distance from the point of loading to the point where the
specimen is clamped, is set such that a/L = 0.55. All ELS tests were carried out according to the 2002 ESIS
protocol [27] with the experimental compliance method (ECM) being used for the data reduction.

9
Figure 4: Diagram of the test configuration for the ELS tests
For the four point ENF test (4ENF) tests, all tests were carried out with an inner roller dimension, d, of
75 mm, and outer roller spacing, L, of 130 mm. To determine dC/da, the specimen compliance was
determined by loading the specimen to a point before the crack propagated, recording load-
displacement data, then un-loading. The position of the specimen was then adjusted so that the crack
length was changed and then the specimen was re-loaded. This process is repeated four or five times so
that a plot of compliance versus crack length could be generated [28].
2.3 Data Normalisation
It should be noted that all mode I and II interlaminar fracture toughness values for the 3D-woven
materials presented in this paper have been normalised for reasons of commercial confidentiality so
that they are shown as a percentage of the average mode I initiation values of the standard layer-to-
layer and both the 3% and 6% orthogonal weaves to represent a percentage of the ‘control’. The angle
interlock values were excluded from the average because it was found that the first through-thickness
tow was encountered by the crack extremely close to the film insert causing the recorded initiation to
be artificially high. The toughened layer-to-layer was also excluded to highlight the effect of the
toughened resin system relative to the standard resin.

10
3 RESULTS AND DISCUSSION
3.1 Validation of the RDCB test method
To evaluate the effects of reinforcing tabs on the R-curve of a DCB specimen, an initial investigation was
carried out using unidirectional carbon fibre 8552/IM7 specimens. This material was selected due to the
small transition region from initiation value to plateau value observed in previous work [13]. The faces
of the specimens were reinforced with 2D woven carbon fibre which was fabricated with a thickness of
approximately 4 mm. The R-curves of un-tabbed and tabbed specimens are shown in Figure 5 and good
agreement can be seen between the DCB and RDCB results.
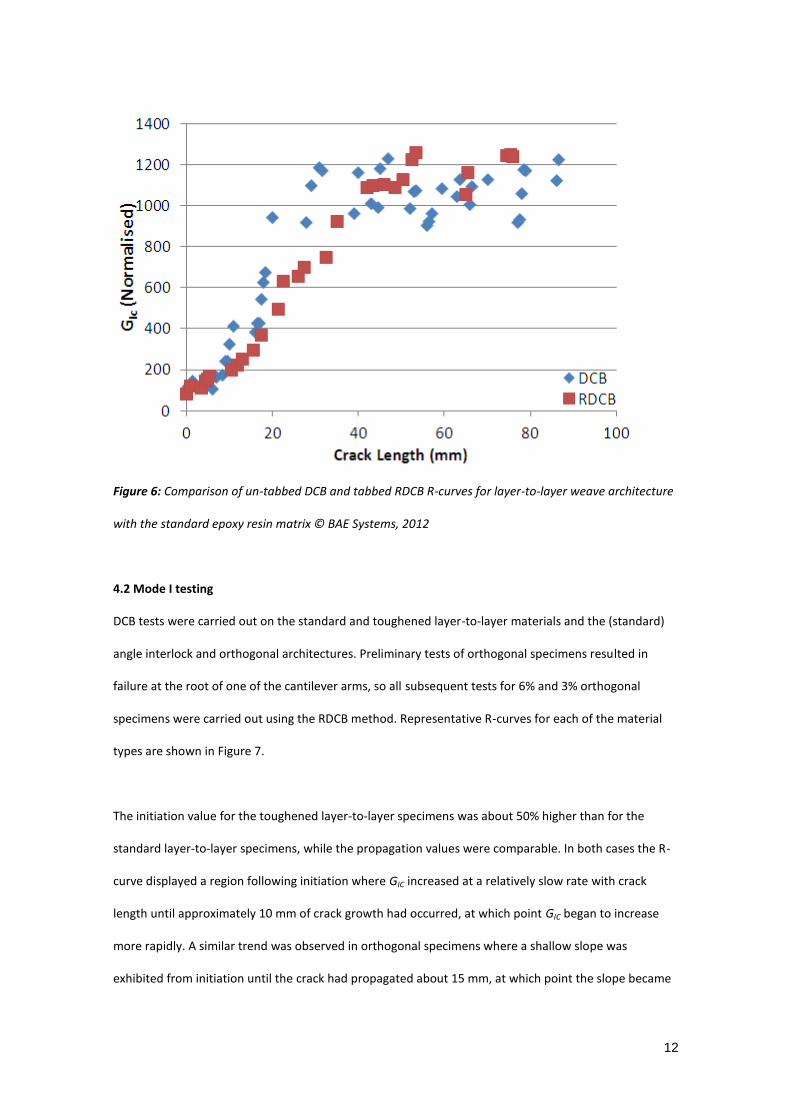
To verify that the RDCB results were also in agreement for 3D woven materials, the layer-to-layer
specimens were also tested using both techniques (Figure 6). Again, the initiation values are in good
agreement (Table 2) whilst the propagation values appear to be higher this is likely due to the small
sample size since both RDCB data points fell within the range of the DCB test results. It was also
observed for the 3D specimens that the length of crack growth required for the transition from initiation
to steady-state was larger for the RDCB specimens than the DCB specimens (see Figure 6). Steady-state
propagation was achieved after about 22 mm for the DCB specimens, but only after about 35 mm of
crack growth for the RDCB specimens. The increase in the distance for the transition from initiation to
steady-state propagation for RDCB specimens was a result of the increase in stiffness of the specimen
caused by the reinforcing tabs. The crack opening was reduced because of the increase in stiffness
which means that pull-out effects occur over a longer period of crack propagation, and a greater
number of through-thickness tows were able to bridge the crack behind the crack front. The steady-
state was reached when progression of the crack resulted in the same number of binder tows added to
the bridging behind the crack front as were broken through crack progression.

11
Table 2: Initiation and Propagation values for both 2D and 3D DCB and RDCB specimens normalised by
the mean of the initiation value for standard layer-to-layer, 3% and 6% orthogonal lay-ups
Material Initiation GIC (J/m2) Propagation GIC (J/m
2)
Layer-to-Layer with MVR444 matrix
(DCB)
98 ± 4 (Normalised) 1032 ± 55 (Normalised)
Layer-to-Layer with MVR444 matrix
(RDCB)
100 ± 19 (Normalised) 1178 ± 31 (Normalised)
Figure 5: Comparison of un-tabbed DCB and tabbed RDCB R-curves for UD carbon fibre 8552-IM7 © BAE
Systems, 2012
12
Figure 6: Comparison of un-tabbed DCB and tabbed RDCB R-curves for layer-to-layer weave architecture
with the standard epoxy resin matrix © BAE Systems, 2012
4.2 Mode I testing
DCB tests were carried out on the standard and toughened layer-to-layer materials and the (standard)
angle interlock and orthogonal architectures. Preliminary tests of orthogonal specimens resulted in
failure at the root of one of the cantilever arms, so all subsequent tests for 6% and 3% orthogonal
specimens were carried out using the RDCB method. Representative R-curves for each of the material
types are shown in Figure 7.
The initiation value for the toughened layer-to-layer specimens was about 50% higher than for the
standard layer-to-layer specimens, while the propagation values were comparable. In both cases the R-
curve displayed a region following initiation where GIC increased at a relatively slow rate with crack
length until approximately 10 mm of crack growth had occurred, at which point GIC began to increase
more rapidly. A similar trend was observed in orthogonal specimens where a shallow slope was
exhibited from initiation until the crack had propagated about 15 mm, at which point the slope became

13
much greater leading up to a steady-state plateau at approximately 25 mm. The portion of the R-curve
immediately following crack initiation, where the rate of increase of toughness is relatively low
corresponded to the distance from the insert to the first through thickness tow. Typically occurs over a
crack length of about 5mm.
Figure 7: Comparison of the mode I R-curves for the different weave architectures tested in DCB and
RDCB: a) standard layer-to-layer (DCB); b) toughened layer-to-layer (DCB); c) 6% orthogonal (RDCB); d)
3% orthogonal (RDCB); e) angle interlock (DCB) © BAE Systems, 2012
Crack bridging was observed behind the crack front of orthogonal specimens. Broken tows, roughly
conical in shape, were visible behind the crack front, suggesting that fibre tow pullout had occurred and
that some of the resin had been pulled out with the binder tows. From observations of the fracture
surfaces, and consideration of the locations where through-thickness tows were broken, it was
concluded that the first through-thickness tow in the fracture plane was encountered a distance from
the film that corresponded with the beginning of a rapid increase in GIC. The rapid increase in GIC
observed as the crack first encountered the through-thickness reinforcement was also seen in the layer-
to-layer and angle interlock specimens.

14
For the angle interlock specimens, the initiation values were significantly higher than for the other
specimen types. Examination of the fracture surface showed that the first through-thickness tow was
encountered immediately after the film insert; consequently, the initiation value of the toughness was
higher and there was an immediate rapid increase in GIC as opposed to the more gradual increase
observed in other specimens. During testing of the angle interlock specimens it was observed that the
cantilever arms twisted as the faces of the specimen were pulled apart. The architecture of the angle
interlock specimens would account for this due to stagger of the binder tows across the width of the
specimen.
A summary of the mode I test initiation and propagation toughness values is presented in Table 3. As
discussed above, the higher initiation value for the angle interlock specimens was attributed to the close
proximity of the first through-thickness tow to the film insert. The toughened resin was shown to
increase the GIC at initiation of layer-to-layer specimens by about 50%, although, not unexpectedly, this
increase was not observed in the propagation values, which are associated with the extent of fibre
bridging. The propagation GIC for 6% orthogonal showed an increase of about 100% in the propagation
GIC over the 3% specimens, consistent with the increased fraction of through-thickness reinforcement,
although the initiation values were similar. Propagation GIC values for all three architectures were
broadly in line with those found elsewhere in the literature for 3D woven carbon fibre reinforced epoxy
composites [16, 18, 19].
Table 3: Summary of the normalised average mode I strain energy release rates for the different weave
architectures. All errors are given as standard error.
Specimen Initiation GIC (Normalised) Propagation GIC (Normalised)
Standard L2L 6% 99 ± 5 1061 ± 45
Toughened L2L 6% 146 ± 14 1202 ± 151
Orthogonal 3% 91 ± 9 840 ± 51

15
Orthogonal 6% 111 ± 8 1569 ± 89
Angle Interlock 6% 159 ± 14 704 ± 26
4.3 Mode II testing
Specimens for all architectures were tested using ELS and supplementary tests were carried out using
the 4ENF method for 6% orthogonal specimens; the results are shown in Figure 8 and 9 in the form of
plots of toughness as a function of crack length. It cannot be stated with confidence that any of the
specimens reached a steady-state propagation condition during the test so the mode II propagation
values cannot be compared directly with the mode I results; however, some consideration of the results
in relation to the architectures is possible. In order to draw some comparisons, GIIC values taken after 20
mm of crack growth were defined as propagation values, and these are the values in Table 4. The value
of 20 mm was selected based on the mode I results, where the R-curves of most specimens were shown
to be approaching, or to have reached, steady-state after approximately 20 mm of crack growth. It is
suggested that GIIC may continue to increase without a plateau in ELS because there is a build-up of
bridging binder fibres and debris between the crack faces, which leads to increasing friction between
the crack faces.
Table 4: Summary of the normalised average mode II strain energy release rates for the different weave
architectures. All errors are given as standard error.
Specimen
Initiation (ELS), GIIC
(Normalised)
Propagation (ELS), GIIC
(Normalised)
Standard L2L 6% 276 ± 46 602 ± 24
Toughened L2L 6% 249 ± 50 1036 ± 189
Orthogonal 3% 210 ± 45 416 ± 26
Orthogonal 6% 246 ± 19* 562 ± 55
Angle Interlock 6% 266 ± 28 511 ± 8
* 4ENF initiation value recorded as 226 ± 28 (Normalised GIIC)

16
R-curves from ELS tests for the 6% orthogonal specimens are plotted alongside those recorded for 4ENF
in Figure 8. Initiation values for 4ENF compared reasonably well with the ELS and the subsequent
increase in toughness with crack length show similar trends for the two types of specimen.
From Figure 9 and Table 2, it appears that there are no significant differences between the initiation
values for any of the architectures. This is in contrast to the mode I testing, where there was an increase
in fracture toughness at initiation for the toughened layer-to-layer over the standard resin. However,
propagation GIIC values for toughened layer-to-layer were significantly greater than the standard layer-
to-layer. The 6% orthogonal results were comparable to the standard layer-to-layer. The 3% orthogonal
material showed a moderate reduction in propagation GIIC compared to the 6% material, although this
difference was much less than was observed in mode I. Taken together these results suggest perhaps
that there is a relatively greater role for the matrix in the Mode II propagation values than for the Mode
I propagation values.
Figure 8: Comparison of the R-curves of 6% orthogonal specimens tested in ELS and 4ENF © BAE
Systems, 2012

17
Figure 9: Comparison of the mode II R-curves of the different weave architectures tested in ELS: a)
standard layer-to- layer; b) toughened layer-to-layer; c) 6% orthogonal; d) 3% orthogonal; e) angle
interlock © BAE Systems, 2012
5 Concluding Remarks
The interlaminar fracture behaviour of three geometries of woven carbon fibre composites (orthogonal,
layer-to-layer and angle interlock weaves) have been investigated using mainly DCB and ELS specimens,
complemented for some materials by RDCB and 4ENF geometries. Additionally the effects of matrix
toughening and through-thickness tow volume fraction have been investigated, in each case with
reference to one of the geometries.
When the weight percentage of binder fibres is kept constant, it is clear that the weave architecture of
through-thickness reinforced composites has a significant impact on the propagation toughness value
once a crack has been initiated. However, where the crack is initiated away from the through-thickness
reinforcement, the weave architecture appears to have no significant effect on the delamination
toughness at initiation. For longer delaminations, the orthogonal weave is most effective in mode I, and
is comparable to layer-to-layer in mode II. In all cases the angle interlock weave appears to have lower
propagation values than either of its counterparts, but this result must be viewed with caution; the
binder tows caused the specimens to twist during mode I testing, and these measurements could be the

18
result of either the architecture or the twist. Toughened resin is shown to increase GIC at initiation but
provides no significant improvement for propagation resistance. Conversely toughened resin appears to
have no effect on mode II layer-to-layer delamination initiation but is more effective at resisting longer
delaminations than the standard layer-to-layer specimens.
With respect to the use of the RDCB method for specimens where crack bridging is present, the RDCB
method is shown to produce similar initiation and propagation values to DCB tests. However, the
reduction in crack opening due to the increased beam stiffness means that the transition from crack
initiation to propagation occurs over a more extended period of crack growth.
Acknowledgements
The authors would like to thank Rolls-Royce plc, Advanced Composites Group ltd, Deepsea Engineering,
Messier-Dowty, Sigmatex (UK) ltd, and the Universities of Bristol, Ulster and Nottingham for their
support and contributions to this research, which was funded in part through the 3DSimComs DTI
programme. DF would like to acknowledge EPSRC funding through the Engineering Doctorate Program
at the University of Surrey.
REFERENCES
[1] A.P. Mouritz: Review of z-pinned composite laminates: Composites Part A: Applied Science and
Manufacturing, 2007, 38, 2383-2397.
[2] A.P. Mouritz, K.H. Leong and I. Herszberg: A review of the effect of stitching on the in-plane
mechanical properties of fibre-reinforced polymer composites: Compos.Pt.A-Appl.Sci.Manuf., 1997,
28, 979-991.
[3] A.P. Mouritz, M.K. Bannister, P.J. Falzon and K.H. Leong: Review of applications for advanced three-
dimensional fibre textile composites: Compos.Pt.A-Appl.Sci.Manuf., 1999, 30, 1445-1461.
[4] B. Lee, K.H. Leong and I. Herszberg: Effect of weaving on the tensile properties of carbon fibre tows
and woven composites: J Reinf Plast Compos, 2001, 20, 652-670.
[5] L. Lee, S. Rudov-Clark, A.P. Mouritz, M.K. Bannister and I. Herszberg: Effect of weaving damage on
the tensile properties of three-dimensional woven composites: Compos.Struct., 2002, 57, 405-413.

19
[6] F. Larsson: Damage tolerance of a stitched carbon/epoxy laminate: Compos.Pt.A-Appl.Sci.Manuf.,
1997, 28, 923-934.
[7] B.N. Cox, M.S. Dadkhah, W.L. Morris and J.G. Flintoff: Failure Mechanisms of 3d Woven Composites
in Tension, Compression, and Bending: Acta Metall.Mater., 1994, 42, 3967-3984.
[8] M.S. Dadkhah, B.N. Cox and W.L. Morris: Compression-Compression Fatigue of 3d Woven
Composites: Acta Metall.Mater., 1995, 43, 4235-4245.
[9] S. Rudov-Clark, A.P. Mourtiz, L. Lee and M.K. Bannister: Fibre damage in the manufacture of
advanced three-dimensional woven composites: Compos.Pt.A-Appl.Sci.Manuf., 2003, 34, 963-970.
[10] M.Z.S. Khan and A.P. Mouritz: Fatigue behaviour of stitched GRP laminates: Composites
Sci.Technol., 1996, 56, 695-701.
[11] F.Y. Pang, C.H. Wang and R.G. Bathgate: Creep response of woven-fibre composites and the effect
of stitching RID B-6925-2009: Composites Sci.Technol., 1997, 57, 91-98.
[12] F. Aymerich, P. Priolo and C.T. Sun: Static and fatigue behaviour of stitched graphite/epoxy
composite laminates: Composites Sci.Technol., 2003, 63, 907-917.
[13] S. Rudov-Clark and A.P. Mouritz: Tensile fatigue properties of a 3D orthogonal woven composite:
Compos.Pt.A-Appl.Sci.Manuf., 2008, 39, 1018-1024.
[14] A.P. Mouritz: Tensile fatigue properties of 3D composites with through-thickness reinforcement:
Composites Sci.Technol., 2008, 68, 2503-2510.
[15] A. Rezai, D. Cartie, I. Partridge, P. Irving, T. Aston, P. Negre and J. and Langer: 13th International
Conference on Composite Materials, Beijing, 2001, Interlaminar damage resistance of Z-fibreTM
reinforced structural CFRP.
[16] Y. Tanzawa, N. Watanabe and T. Ishikawa: Interlaminar fracture toughness of 3-D orthogonal
interlocked fabric composites: Composites Sci.Technol., 1999, 59, 1261-1270.
[17] P.R. Thakre, D.C. Lagoudas, J.C. Riddick, T.S. Gates, S-J.V. Frankland, J.G. Ratcliffe, J. Zhu and E.V.
Barrera: Investigation of the effect of single wall carbon nanotubes in interlaminar fracture
toughness of woven carbon fibre-epoxy composites: J.Composite Mater., 2011, 45, 1091-1107.
[18] K.A. Dransfield, L.K. Jain and Y.W. Mai: On the effects of stitching in CFRPs - I. Mode I delamination
toughness: Composites Sci.Technol., 1998, 58, 815-827.
[19] V. Tamuzs, S. Tarasovs and U. Vilks: Delamination properties of translaminar-reinforced composites
RID B-2121-2008: Composites Sci.Technol., 2003, 63, 1423-1431.
[20] X.N. Sun, L.Y. Tong, M.D.K. Wood and Y.W. Mai: Effect of stitch distribution on mode I delamination
toughness of laminated DCB specimens: Composites Sci.Technol., 2004, 64, 967-981.
[21] ISO 15024.: Fibre-reinforced plastic composites - determination of mode I Interlaminar fracture
toughness, GIC, for unidirectionally reinforced materials, 2001.
[22] ASTM D5528 - 01e3: Standard Test Method for Mode I interlaminar Fracture Toughness of
Unidirectional Fiber-Reinforced Polymer Matrix Composites, 2007.

20
[23] A.J. Brunner, B.R.K. Blackman and P. Davies: A status report on delamination resistance testing of
polymer-matrix composites RID C-6524-2011: Eng.Fract.Mech., 2008, 75, 2779-2794.
[24] J.R. Reeder, K. Demarco and K.S. Whitley: The use of doubler reinforcement in delamination
toughness testing: Compos.Pt.A-Appl.Sci.Manuf., 2004, 35, 1337-1344.
[25] B.D. Davidson, X. Sun and A.J. Vinciquerra: Influences of friction, geometric nonlinearities, and
fixture compliance on experimentally observed toughnesses from three and four-point bend end-
notched flexure tests: J.Composite Mater., 2007, 41, 1177-1196.
[26] M. Pankow, A.M. Waas, C.F. Yen and S. Ghiorse: Resistance to delamination of 3D woven textile
composites evaluated using End Notch Flexure (ENF) tests: Cohesive zone based computational
results: Composites Part A-Applied Science and Manufacturing, 2011, 42, 1863-1872.
[27] ESIS Version 01-04-02: Fibre-reinforced plastic composites - Determination of apparent Mode II
interlaminar fracture toughness, GIIC, for unidirectional reinforced materials, 2002.
[28] B.D. Davidson and X.K. Sun: Effects of friction, geometry, and fixture compliance on the perceived
toughness from three- and four-point bend end-notched flexure tests: J Reinf Plast Compos, 2005,
24, 1611-1628.