Embed Size (px)
Citation preview

United StatesDepartment ofAgriculture
Forest Service
IntermountainResearch Station
Research PaperINT-448
July 1991
Regeneration ofAspen by Suckeringon Burned Sites inWestern WyomingDale L. BartosWalter F. MuegglerRobert B. Campbell, Jr.
This file was created by scanning the printed publication.Errors identified by the software have been corrected;
however, some errors may remain.

THE AUTHORS
DALE L. BARTOS is an operations research analyst with the Mountain Pine Beetle Population Dynamics research work unit, Intermountain Research Station, Ogden, UT. He joined the unit in 1984 and is currently located in Logan, UT. Prior to assuming his current position, he was with the Intermountain Station as a member of the aspen ecosystem project for 12 years. He holds B.S. and M.S. degrees from Fort Hays Kansas State University and a Ph.D. degree in range science from Colorado State University. His principal research interests are in systems modeling and ecological processes.
WALTER F. MUEGGLER, now retired, was prinCipal plant ecologist and project leader of the Intermountain Research Station's Aspen Ecology and Management research work unit at Logan, UT. He has conducted research on aspen woodlands for over 10 years. He holds degrees in forestry from the University of Idaho and ecology from the University of Wisconsin, and a Ph.D. degree in plant ecology from Duke University.
ROBERT B. CAMPBELL, JR., works with the Intermountain Research Station's Wildlife Habitats in the Northern Rockies research work unit at the Forestry Sciences Laboratory, Missoula, MT. Prior to that, he served as botanist with the Aspen Ecology and Management research work unit for 10 years at the Forestry Sciences Laboratory in Logan, UT. He earned B.S. degrees in botany from Brigham Young University and agronomy from Utah State University and an M.S. degree in forest ecology from the University of Montana.
RESEARCH SUMMARY
The suckering response of aspen was monitored on four burned areas in western Wyoming over a 6-year period. Although the number of suckers produced varied greatly between areas, the trends in numbers were similar over the 6 years: a relative abundance the first year after burning, followed by an abrupt decline by the third year and a gradual decline in numbers thereafter. First-year sucker numbers ranged from 34,000 to 147,0001ha. By the sixth year, the number of suckers at least 1 year old was reduced to between 2,100 and 49,300/ha for overall sucker mortality ranging between 54 and 93 percent. Only between 100 and 1,000/ha new suckers continued to be produced the sixth year. On the average, suckers grew between 0.23 and 0.53 m the first year, and then generally increased between 0.02 and 0.22 m per year thereafter.
Sites burned in the spring produced more than twice as many suckers as those burned in the fall. Only 40 percent of the variability between sites in number of suckers the second postburn year and only 44 percent of the variability the sixth year could be accounted for by season of burn and preburn site and stand characteristics. However, 96 percent of the variability between sites in sixth-year sucker numbers is accounted for by the season of burn and number of old suckers present the second year following burning.
Sucker production on burned areas is compared with similar production on two clearcut areas.
Cover photos: Russold Hill burn in 1975 and the same site 13 years after treatment.
Intermountain Research Station 324 25th Street
Ogden, UT 84401
Regeneration of Aspen by Suckering on Burned Sites in Western Wyoming
INTRODUCTION
Dale L. Bartos Walter F. Mueggler Robert B. Campbell, Jr.
Approximately 2.8 million ha of woodlands dominated by quaking aspen (Populus tremuloides Michx.) are scattered throughout the Western United States (Green and Van Hooser 1983). These woodlands are important habitat for a wide variety of wildlife, as well as provide summer range for domestic livestock and protective cover essential to mountain watersheds. Perhaps of greatest value is their contribution to the variety of vegetation types in areas that otherwise would lack diversity. Because of aspen's environmental adaptability, this broadleaf tree can occur as isolated groves in sagebrush steppes, as a fringe type along shrubconiferous forest margins, and as a successional tree within the subalpine spruce-fir forests. Wherever it occurs, aspen contributes to the scenic beauty of the landscape, especially in the fall when its leaves turn various shades of yellow, often in stark contrast to the dull greys or dark greens of the surrounding vegetation.
The majority of aspen stands in the West are aging (Mueggler 1989). Resource managers frequently are concerned about regenerating these stands to maintain aspen as part of the wildland mosaic. Schier (1975) found that aspen in Utah matures in 60 to 80 years, followed by a rapid decline in vigor and increased susceptibility to disease. In like manner Hinds and Wengert (1977) observed that aspen growth peaked in Colorado in 60 to 80 years, and that by age 100 about 20 percent of the tree volume can be expected to be cull. In the Intermountain Region, approximately two-thirds of the aspen stands exceed 95 years of age (Mueggler 1989).
Aspen in the West is almost completely dependent upon vegetative methods of regeneration, primarily from suckers that arise on lateral roots near the surface of the soil (Schier and others 1985). This applies whether the stands are considered stable communities at the lower elevation shrub steppeforest margins or seral communities in the
subalpine coniferous forests. Where seral aspen are being replaced by conifers in the subalpine forest communities, maintenance of aspen stands requires such drastic measures as burning, clearcutting, or selective cutting of the conifers to eliminate the competing conifers and to stimulate aspen suckering. Even in the lower elevation groves of potentially stable aspen, the aging trees often undergo replacement by shrubby or herbaceous communities. This occurs when the overmature aspen trees are not replaced by sucker regeneration, either because of severe and repeated browsing of suckers by livestock or wild ungulates (Krebill 1972; Smith and others 1972; Kay 1990) or because of an interacting combination of apical dominance control over suckering, gradual dieback of both overs tory and roots, and subsequent attack of the weakened clone by pathogens (Schier 1975). The typical treatment in the latter case is to stimulate the production of suckers by altering the effects of apical dominance through clearcutting or burning and then protecting the resulting suckers from browsing.
Although abundant aspen suckers often arise following burning or clearcutting of aspen stands, up to 120,000/ha in some cases (Bartos 1979; Smith and others 1972), sucker mortality and deformity from various causes in succeeding years is usually high. In addition, sucker production may be initially poor; numbers less than 3,000/ha have been reported (Brown and DeByle 1989). Bartos and others (1983) suggest that 10,000 to 20,000 robust suckerslha may be needed initialJy to firmly reestablish aspen on a burned site. Knowledge of the reasons for this difference in initial suckering response, and information on the expected trends in sucker numbers following stand treatment, would assist resource managers to effectively plan the regeneration of stands that require management intervention. We therefore began to observe aspen suckering response on disturbed areas under different vegetational and environmental situations and to monitor changes in the numbers of these suckers in succeeding years.
METHODS The intent of this study was to evaluate the re
sponse of aspen suckers to burning under different environmental conditions and with initially different stand characteristics. The study was opportunistic in that site selection was confined to areas that were burned in the course of standard management activities. Thus, neither environmental nor stand conditions were predetermined in the selection of sites, resulting in an unbalanced set of conditions to evaluate.
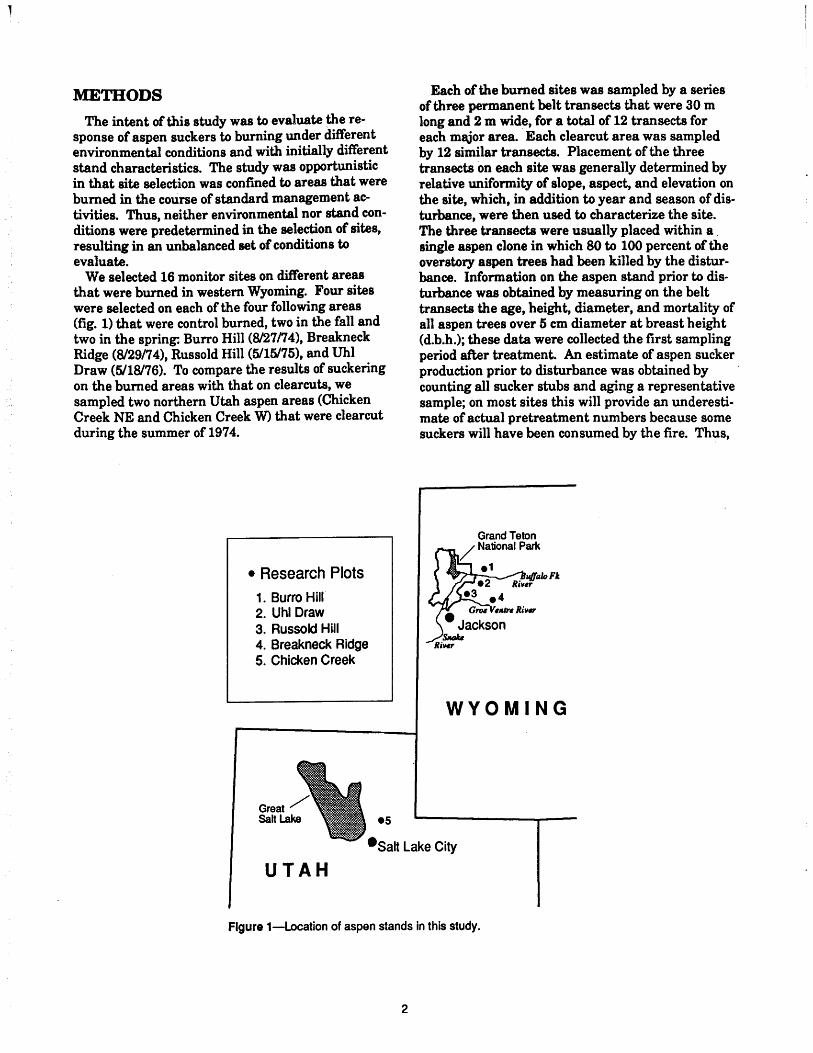
We selected 16 monitor sites on different areas that were burned in western Wyoming. Four sites were selected on each of the four following areas (fig. 1) that were control burned, two in the fall and two in the spring: Burro Hill (8127n4), Breakneck Ridge (8129/74), Russold Hill (5115175), and UbI Draw (5118176). To compare the results of suckering on the burned areas with that on clearcuts, we sampled two northern Utah aspen areas (Chicken Creek NE and Chicken Creek W) that were clearcut during the summer of 1974.
e Research Plots 1. Burro Hill 2. Uhl Draw 3. Russold Hill 4. Breakneck Ridge 5. Chicken Creek
Great /' Salt Lake e5
Each of the burned sites was sampled by a series of three permanent belt transects that were 30 m long and 2 m wide, for a total of 12 transects for each major area. Each clearcut area was sampled by 12 similar transects. Placement of the three transects on each site was generally determined by relative uniformity of slope, aspect, and elevation on the site, which, in addition to year and season of disturbance, were then used to characterize the site. The three transects were usually placed within a. single aspen clone in which 80 to 100 percent of the overstory aspen trees had been killed by the disturbance. Information on the aspen stand prior to disturbance was obtained by measuring on the belt transects the age, height, diameter, and mortality of all aspen trees over 5 cm diameter at breast height (d.b.h.); these da~ were collected the first sampling period after treatment. An estimate of aspen sucker production prior to disturbance was obtained by counting all sucker stubs and aging a representative sample; on most sites this will provide an underestimate of actual pretreatment numbers because some suckers will have been consumed by the fire. Thus,
WYOMING
.SaH Lake City
UTAH
Flgure1-Location of aspen stands in this study.
2
pretreatment stand data consist of tree basal area, tree numbers, tree average age, tree average height, sucker numbers, sucker heights, and .sucker ages.
Monitoring the effects of burning or cutting on sucker production began the first fall following treatment and continued each year for 6 years. Sucker numbers were counted on the transects, and the height and diameter were determined for representative suckers. An aspen sucker was defined as a single reproductive unit less than 2 m tall and less than 5 em d.b.h. arising from root material. Stump sprouts were identified separately.
The resulting data were used to plot sucker number and height growth changes on the different areas for 6 years following burning or clearcutting and to develop predictive models. Season of burning and preburn and postburn parameters were used as independent variables and postburn number of suckers as the dependent variable. The preburn independent variables consisted of the number, age, height, and diameter of suckers before burning; elevation, incident solar radiation (Frank and Lee 1966), and mean diameter (d.b.h) of old trees. The postburn independent variables were the number of new suckers the first fall following burning and the number of year-old suckers the second growing season after burning. Dependent variables were the number of year-old suckers present the second fall following burning and the number of old suckers present the sixth year following burning. Regression analyses were performed to determine the best fitting relationships that were also judged to be biologically reasonable.
AREA AND STAND CHARACTERISTICS
The Breakneck Ridge burned aspen area consists of four sites on a ridge north of the Gros Ventre River, approximately 42 k east-northeast of Jackson, WY. The Burro Hill area is north of the Buffalo Fork River approximately 13 k east of Moran Junction near Teton National Park. Russold Hill is approximately 24 k northeast of Jackson, just north of the Gros Ventre River. The four sites at UbI Draw are south of the Buffalo Fork River and approximately 8 k southeast of Moran Junction in western Wyoming. The aspen clearcuts (Chicken Creek) consist of two areas in an aspen forest 24 k northeast of Salt Lake City, UT.
The burned aspen sites ranged in elevation from 2,131 to 2,504 m on slopes ranging between 6 and 42 percent, and on many different slope exposures (table 1). The two clearcut aspen sites were at generally 2,347 m elevation, on a northeast and a westerly exposure, and on 20 and 25 percent slopes.
Aspen stand characteristics on the burned sites differed considerably (table 1). The maximum age of the aspen trees on the different sites ranged from 41 to 127 years, and heights of the dominant trees ranged from 7.3 to 21.9 m. The average d.b.h. of the aspen trees on these sites ranged from 8 to 32 cm; the basal area of these trees was between 3 and 45 m2/ha. Aspen site index at 80 years, utilizing curves prepared by Edminster and others (1985), ranged from 35 to 65. The number of aspen suckers prior to burning ranged from 3,499 to 15,100/ha.
Table 1-Environmental and pretreatment stand characteristics for the aspen areas studied1
Breakneck Burro Russold Uhl Chicken Stand characteristics Ridge Hili Hili Draw Creek
Elevation (m) 2,393 to 2,504 2,134 to 2,173 2,131 to 2,206 2,249 to 2,271 2,347 and 2,347 Slope exposure NWto NE NtoS StoW NW NE and W Slope (percent) 14 to 42 9 to 16 12 to 26 6 to 11 20 and 25 Aspen site index (80 yr)2 40 to 65 35 to 55 40 to 55 40 to 55 Maximum age (yrs) 85 to 127 57 to 95 41 to 81 64 to 137 90 and 90 Maximum height (m) 12.8 to 21.9 7.3 to 12.3 9.8 to 13.4 12.2 to 15.2 17.7 and 11.0 Aspen average d.b.h. (cm) 24 to 30 8t032 18 to 22 14 to 28 9 and 12 Aspen basal area (m2/ha) 33 to 45 5t039 3 to 16 13 to 36 28 and 20 Aspen suckers (No.lha) 8,055 to 10,388 4,611 to 8,720 8,167 to 14,888 3,499 to 15,100 7,400 and 5,200
1Ranges given over four sample sites (two for Chicken Creek) within each study area. 2Utilizing site index curves prepared by Edminster and others (1985).
3
Stand characteristics on the two clearcut sites (table 1) also differed considerably, even though the maximum ages of the aspen trees were essentially the same-90 years. Height of the dominant trees was 17.7 m on the northeast exposure and only 11 m on the westerly exposure. Although the average diameters of these trees was greatest on the westerly exposure, 12 cm compared to 9 cm, total aspen basal area was greatest on the northeast exposure, 28 m2/ha compared to 20 m2/ha. The number of aspen suckers per hectare prior to clearcutting was 7,400 on the northeast site and only 5,200 on the westerly site.
RESULTS AND DISCUSSION
Results were recorded in terms of trends in sucker numbers and heights. We also determined the best combination of factors for predicting sucker numbers on burned sites.
Breakneck Ridge 35
30
(i) 25
ns-g 20 ..e ns """; UJ o :::l 15 Z 0 ..e
t:. 10
5
0
2 3 4 5 6 Year Since Burning
Russold Hill 70
60
50 ... (i) .. .. ',.. ••• _.e .. _. ___ ••. _.
ns-g 40 ..e ns ----.......... """; UJ o :::l 30 ZO ..e
t:. 20 ,-.::-:::-:=-==:---
10
0 2 3 4 5 6
Year Since Burning
Trends in Sucker Numbers
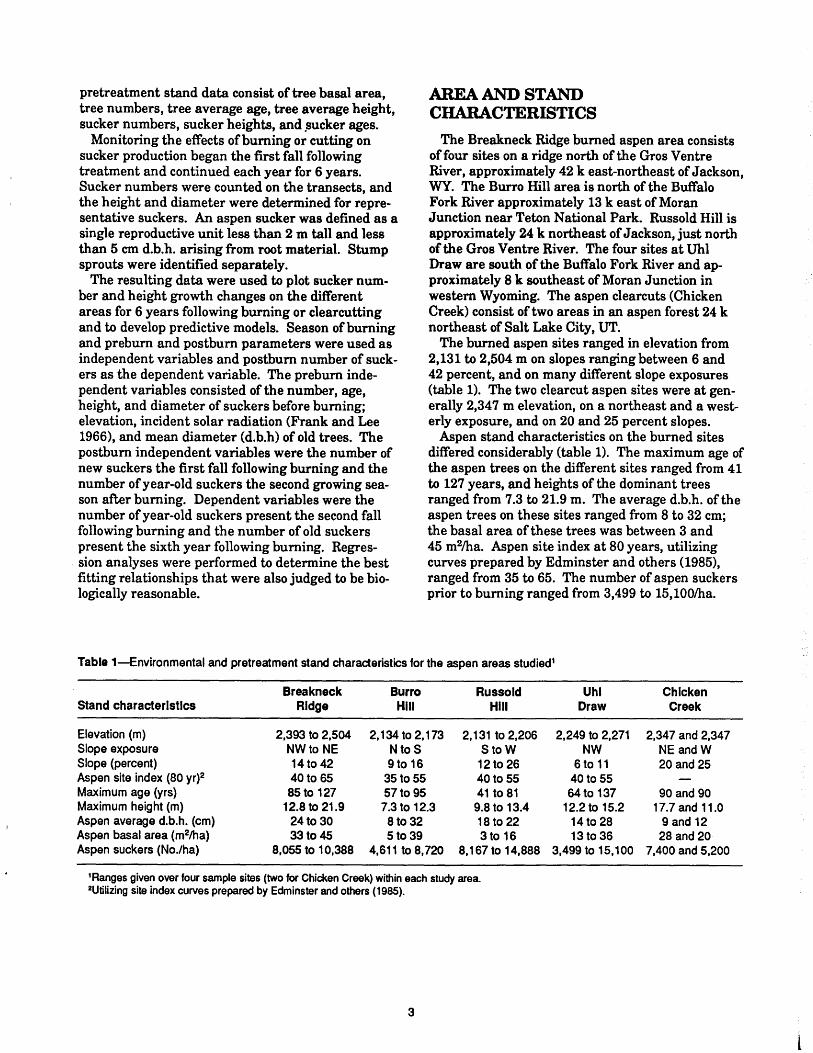
The number of aspen suckers produced in the years following burning on the four study areas followed trends typical of western aspen's response to fire: a relative abundance the first year, followed by a somewhat abrupt decline by the third year, and a gradual decline thereafter (fig. 2). To better understand the progression of sucker numbers, we separated the number of new suckers produced in any 1 year (new suckers) from suckers that carried over from preceding years (old suckers). Mortality of new suckers is characteristically high. A sucker that has persisted for at least 1 year is more likely to contribute to the development of a new aspen stand than a succulent new sucker that is not only sensitive to disturbances but is more easily suppressed by competing vegetation.
The number of suckers produced the first year following burning ranged widely between 34,OOO/ha
50 45
40 (i) 35
ns-g 30 ..ens """;UJ 25 o :::l
z~ 20 t:.
15 10 5 0
160
140
120 (i)
",-g 100 ..ens """;UJ 80 o :::l ZO 60 ..e
t:. 40
20
0
2
Burro Hill
3 4 Year Since Burning
Uhl Draw
5 6
.-\-----------------
2 3 4 5 6 Year Since Burning
-- Old Suckers .. _ ...... Confidence limits New Suckers
Figure 2-Number of new and old aspen suckers for 6 years following planned burning of four areas; note the scaling differences on the Y-axis for the different areas. (Confidence intervals shown for old suckers only.)
4

(Breakneck Ridge) and 147 ,000lha (UbI Draw). All of these were new suckers stimulated primarily by the fire. By the second year, only between 15,000 and 62,000lha of these survived, for first-year sucker mortality of between 24 and 58 percent on the four areas. Between 2,800 and 17,500 new suckerslha were added this second year. Over twice as many new suckers occurred on Breakneck Ridge this second year than on any of the other burned areas; this area produced conspicuously fewer suckers the first growing season following burning than the other areas. The third year following burning, old suckers were between 9,500 and 72,300lha, with Breakneck Ridge containing the fewest and UbI Draw the most. To this was added between 450 and 2,700 new suckerslha. By the third year, the addition of new suckers was less than 3 percent of those produced the first year on all areas except Breakneck Ridge, which was 6 percent.
By the sixth year, old sucker numbers were reduced to between 2,100 and 49,300lha, with Breakneck Ridge continuing to have the fewest and UbI Draw the most (table 2). Between about 100 and 1,000 new suckerslha were still being produced, but this number continued to decrease as well. Thus, by the sixth year following the fire, total suckers (old plus new) on Russold Hill were 46 percent of
the number of suckers produced the first year, UbI Draw 34 percent, Burro Hill 27 percent, and Breakneck Ridge only 7 percent. This corresponds to mortality rates of 54, 66, 73, and 93 percent, respectively.
Interestingly, the percentage sucker mortality noted was generally inversely related to the number of suckers produced the first year. This is contrary to our expectations that greatest mortality would occur on areas with the largest amount of initial suckering and that sucker numbers on the different areas would tend to become more equal with the passage of time. We believe this anomaly probably results from differences in ungulate use of the areas. The exceptionally high mortality of suckers on Breakneck Ridge is attributed to severe browsing. This area not only is used in the summer by cattle but also is on a natural travel route used by elk to access a nearby (1.6 k) elk winter-feeding station on the Gros Ventre River. Sucker reproduction was repeatedly and severely browsed during the fallwinter-spring period over the 6 years of measurements. Burro Hill was also subject to noticeably heavy ungulate use. The impact of intensive browsing on aspen by concentrations of elk is discussed by Gruell and Loope (1974) and Kay (1990).
Table 2-Number of old aspen suckers during the second through sixth years following burning (Breakneck Ridge, Burro Hill, Russold Hill, Uhl Draw) or clearcutting (Chicken Creek NE, Chicken Creek W). Column values containing the same uppercase letters do not differ significantly; all other column values differ at probabilities >0.951
Year following treatment
Area Second Third Fourth Fifth Sixth
- - - - - - - - - - - - - - - - - - - - - - No. of old aspen suckers/ha - - - - - - - - - - - - - - - - - - - - - - -
Breakneck Ridge 14,558 9,516 6,335 3,167 2,153 A A A A A
Burro Hill 34,049 20,921 18,934 15,170 13,044 AB AB AB BC BC
Russold Hill 46,565 31,868 32,312 29,186 27,130 BCD BC BC CDE CDE
Uhl Draw 62,262 72,348 57,498 54,761 49,343 BD 0 C E E
Chicken Creek NE 78,613 42,161 25,116 18,976 16,642 0 BD BD BD BD
Chicken Creek W 20,574 14,628 11,572 9,710 9,363 AC AC AD AB AB
1Statistical procedures run on square root transformation of data.
5
I
1
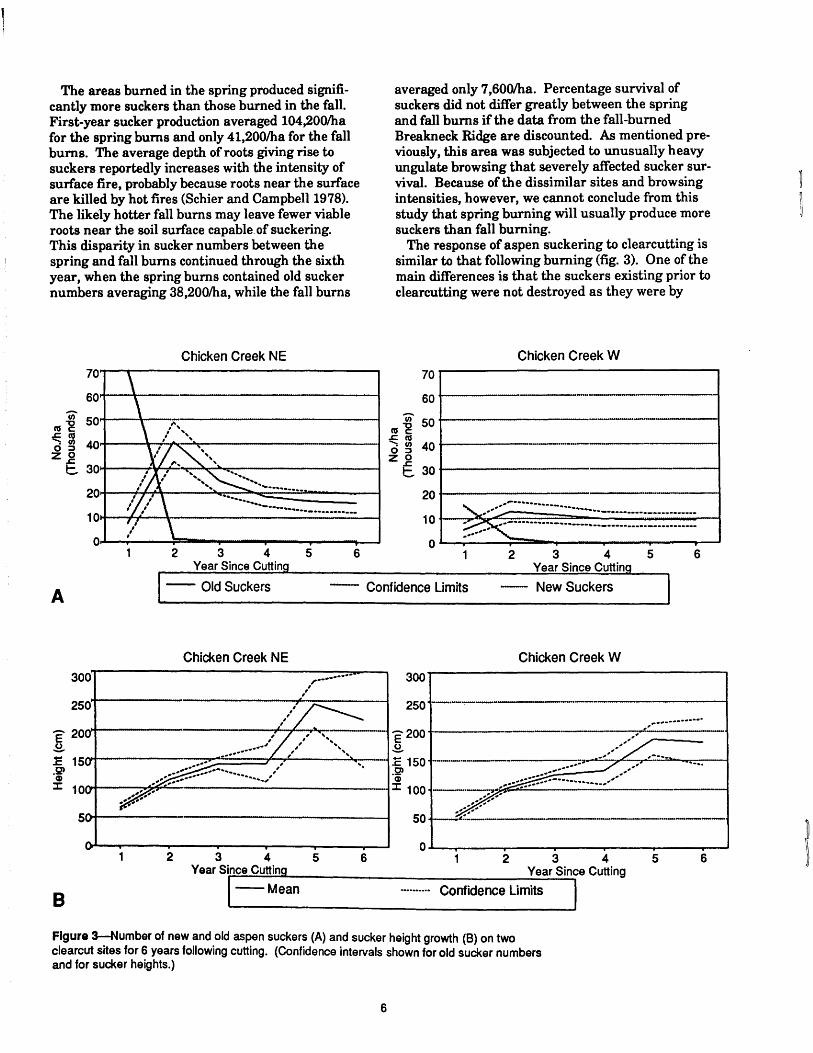
The areas burned in the spring produced significantly more suckers than those burned in the fall. First-year sucker production averaged 104,200/ha for the spring bums and only 41,200/ha for the fall bums. The average depth of roots giving rise to suckers reportedly increases with the intensity of surface fire, probably because roots near the surface are killed by hot fires (Schier and Campbell 1978). The likely hotter fall bums may leave fewer viable roots near the soil surface capable of suckering. This disparity in sucker numbers between the spring and fall bums continued through the sixth year, when the spring bums contained old sucker numbers averaging 38,200/ha, while the fall burns
averaged only 7,600lha. Percentage survival of suckers did not differ greatly between the spring and fall bums if the data from the fall-burned Breakneck Ridge are discounted. As mentioned previously, this area was subjected to unusually heavy ungulate browsing that severely affected sucker survival. Because of the dissimilar sites and browsing intensities, however, we cannot conclude from this study that spring burning will usually produce more suckers than fall burning.
The response of aspen suckering to clearcutting is similar to that following burning (fig. 3). One of the main differences is that the suckers existing prior to clearcutting were not destroyed as they were by
70
60
Chicken Creek W
(i) 5o4-------- --------,----1 ","2 ..c:;",
d ~ 40 ZO
+---~f~~:~~~~---------------------------~ ~ 30~----------------------------------------·-----·---
20~---------------------------------------4
'-. ...... .::::--.... __ .... _--.... -........... _ .. _----------------------1: ~== ~: .. : ...... ~ .... : .. ~ .. -~ .. --~---~ .. -:---: .. -= .. --=--... :-.. :--:---:--_: __ : ___ : __ = .. __ : __ : ___ =~
6 2 3 4 5 6 Year Since Cuttin
-- Confidence Limits -- New Suckers
Chicken Creek NE Chicken Creek W 300 ,---_ .. ---- 300
" , 250+-----·-------,,-/-,,~--- 250 -_.-.,.---
, ~ 20~~-~~~-----~~'~' ~~~~~-~~200 --~~--~-----~-.----~~--~- .. --.. --.--.& 5 ", ..
:::::-- ."" ,---. 1: 15 ~===::::J~,7,.--------~ ... --I..c:; 150 ----------------:;1-,,-- --,----~-. -_. • ~ .52» ...... -......... - .... , .... ' -••
:I: :! 1 00 --~: ........ :: .. ---.... -----....... -.-' .. ' ------
50 ':;.:::: ...... ---- ------------5or------~-------------------------------~
O~~--------~-------~-----~-----~----__ ~ 2
B
345 Year Since Cutting
I--Mean
6 2 3 4 Year Since Cutting
Confidence Limits I Figure 3-Number of new and old aspen suckers (A) and sucker height growth (8) on two clearcut sites for 6 years following cutting. (Confidence intervals shown for old sucker numbers and for sucker heights.)
6
5 6
~
burning but were released when the overstory was removed and the stand opened up. Approximately 7,500 suckerslha were carried over in this way on the northeast exposure and 5,300lha on the west exposure. First-year production of new suckers was over 71,000lha on the northeast exposure and over 15,000lha on the west exposure. By the sixth year, old sucker numbers were reduced to 16,000lha on the northeast exposure and 9,300lha on the west exposure (table 2). Although only 21 percent as many total suckers occurred on the northeast exposure and 46 percent as many on the west exposure as in the first year, sufficient old suckers remained to ensure successful regeneration of the aspen stand. As expected, the greatest mortality occurred on the area with the largest initial number of suckers. Neither of these clearcut areas received more than incidental ungulate use. The much greater sucker mortality on the northeast exposure reduced its first-year, fourfold superiority in total sucker
140 Breakneck Ridge
numbers to less than a twofold superiority by the sixth year.
Generally, more new suckers were produced initially by burning than by clearcutting, and this difference usually persisted through the sixth year. The great difference in sucker abundance on the two clearcut areas suggests that site or clonal differences or both have a profound effect on suckering success. Because clearcutting and burning were not compared on the same sites and same clones, it was not possible to determine the specific advantage of burning over clearcutting in stimulating suckering response.
Trends in Sucker Heights
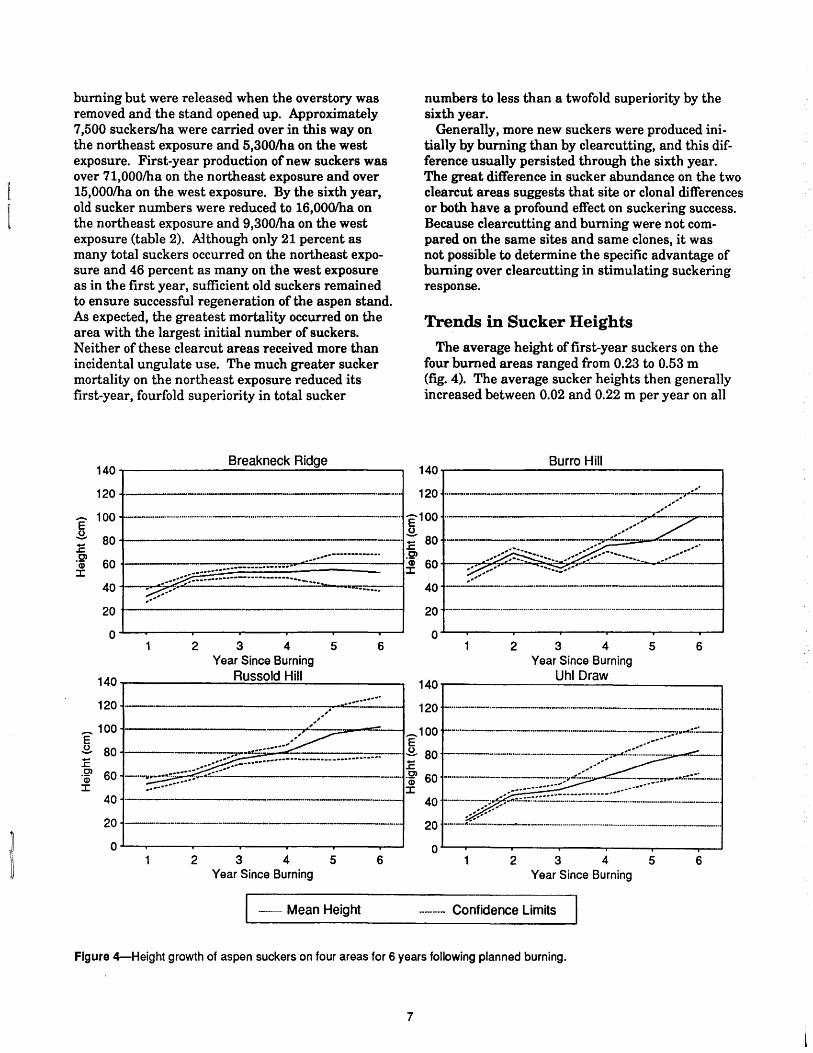
The average height of first-year suckers on the four burned areas ranged from 0.23 to 0.53 m (fig. 4). The average sucker heights then generally increased between 0.02 and 0.22 m per year on all
Burro Hill 140~---------------------------------~
120 -------- -- 120 ---------.-------------.-------;;-,.::::--
E 100
.& 80 ~ C)
60 .(j)
:J:
40
20
0
140
120
_ 100 E .& 80 ~ .2l 60 Q)
:c 40
20
0
, .. "
-------... --.. - ..... -.-.---.. ------.-.--.------.-_ .. :[100 .. ------- ,,,,, .... 7~'" -- -
--- 80 ----------------,,-- w ------
._ ....... -_ ••••• -.... ~ 6 .. '~· ••• _ 6 .... ~-.... , ...... , ... '.
• __ ... _ ..... # '(1) 60 ~~ __ ~r"~-.. __ eo. .' ---
~::::::::..-......... -... -_.. ____ -= :I: 40'- ::./ __ ~~::.. ______ _
+------------------_._------
2 3 4 Year Since Burning
Russold Hill
5 6
.---_.", .....
----------_._._-------_ ... __ . __ ._-----_._-
2 3 4 5 6 Year Since Burning
I - Mean Height
20 .. ----..... - ..... -.-........................................... -.-...... -.-.-...... -...... _ ...... -_.-........ _-.-
o 2 3 4 5 6
Year Since Burning Uhl Draw
140r-----------------------------------~
120 --... ---.-.---.-----.----.----.-.-.----------
2 3 4 5 6 Year Since Burning
---- Confidence Limits
Figure 4-Height growth of aspen suckers on four areas for 6 years following planned burning.
7
bumed areas except Breakneck Ridge. The greatest average height reached by the sixth growing season following burning was 0.72 m on Russold Hill. At this time the average height on Breakneck Ridge was only 0.52 m. The low average height on Breakneck Ridge probably results from the constant browsing of these suckers, which had not grown appreciably taller since the second growing season following the fire.
Height growth of aspen suckers on the clearcut areas was generally greater than on the burned areas (fig. 3). These clearcut areas were not subject to livestock grazing, nor were they used by wintering elk. Average sucker heights the first year following clearcutting were 0.67 and 0.55 m on the ~ortheast and west exposures, respectively. By the six~ year, average sucker heights on these sites had increased to 2.18 and 1.81 m. By the sixth year, therefore, the average height growth on the clearcut areas was almost twice as great as that on the most productive bumed site (Russold Hill). (The slight decreases in sucker height between the fifth and sixth years on the elearcut areas [fig. 3] are attributed primarily to the subjective method of selecting representative samples.)
Aspen suckers usually grow rapidly the first few years, especially in contrast to associated conifers that must start from seed. Crouch (1981) found that in northwestern Colorado the average height of dominant suckers 3 years after elearcutting was 1.34 m. In southwestern Colorado, dominant suckers averaged 2.47 m tall by the seventh year following elearcutting (Crouch 1983). Sucker growth was
even more rapid in northern Arizona. Jones (1975) reported the tallest suckers the first year following clearcutting were 1.5 m, and the average height of dominant suckers by the fourth year was 3.2 m.
The height growth data we obtained are based on average heights of all suckers and not on the average height of the dominant suckers as reported above. These height growth data, therefore, are not directly comparable.
Predicting Sucker Numbers on Burned Sites
Site characteristics of elevation, aspect of slope, and slope steepness bore little relationship to the success of aspen regeneration following burning. However, season of burning and certain characteristics of the aspen stand prior to burning were related to the amount of suckers produced following burning. Combinations of these factors appear to have some value in predicting regeneration success.
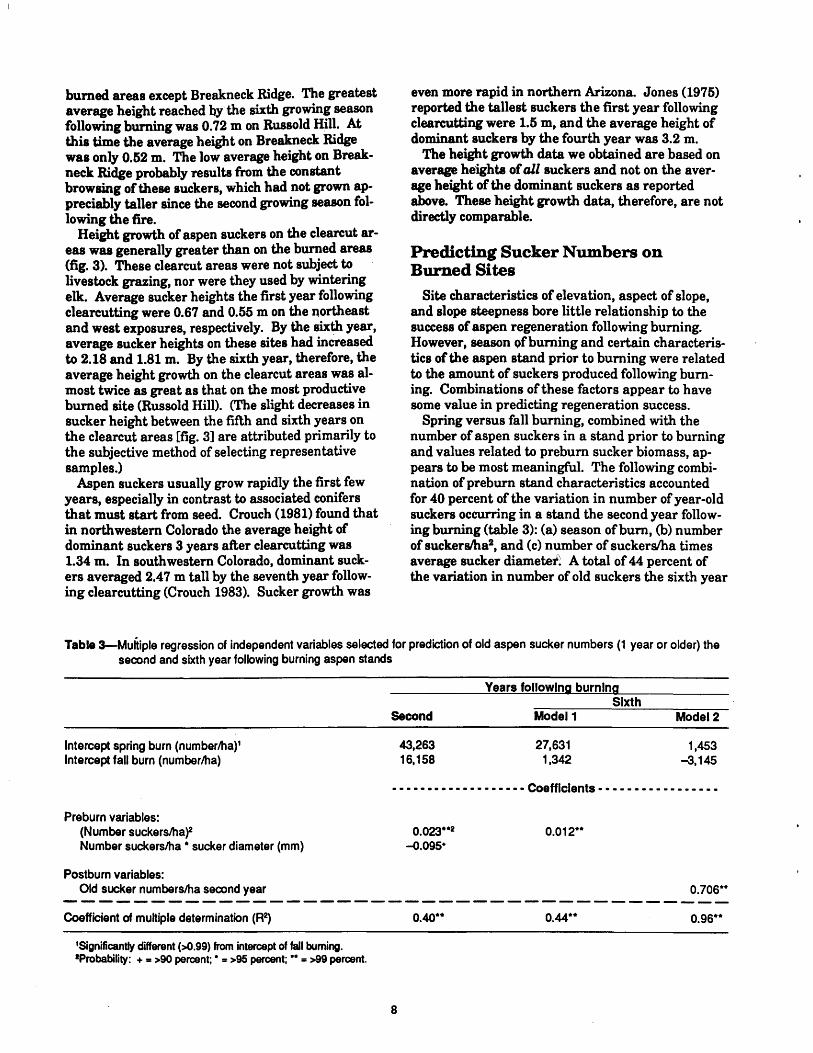
Spring versus fall burning, combined with the number of aspen suckers in a stand prior to burning and values related to prebum sucker biomass, appears to be most meaningful. The following combination of preburn stand characteristics accounted for 40 percent of the variation in number of year-old suckers occurring in a stand the second year following burning (table 3): (a) season of bum, (b) number of suckerslha2, and (c) number of suckerslha times average sucker diameW~ A total of 44 percent of the variation in number of old suckers the sixth year
Table 3-Multiple regression of independent variables selected for prediction of old aspen sucker numbers (1 year or older) the second and sixth year following burning aspen stands
Intercept spring burn (numberlha)1 Intercept fall burn (numberlha)
Preburn variables: (Number suckerslha)2 Number suckerslha * sucker diameter (mm)
Postburn variables: Old sucker numberslha second year
Coefficient of multiple determination (R2)
1Significantly different (>0.99) from intercept of fall buming. 'Probability: + = >90 percent; * = >95 percent; ** = >99 percent.
Second
43,263 16,158
Years following burning
Model 1
27,631 1,342
Sixth Model 2
1,453 -3,145
- - - - - - - - - - - - - - - - - - - Coefficients - - - - - - - - - - - - - - - - -
8
0.023**2 -0.095+
0.40**
0.012**
0.706**
0.44** 0.9S**
Table 4-lndividual regressions of old sucker numberslha the second year after burning on the number of old suckers occurring the sixth year after burning on each of four burned areas
Breakneck Burro Russold Uhl Ridge
Regression constant (numberlha) 541
Old second-year suckers 0.17
Coefficient of determination (R2) 0.2()+1
1 Probability: + = >85 percent;·· = >99 pe~cenl
after burning was accounted for by (a) and (b) (table 3, model 1).
A good estimate of the number of old suckers that can be expected the sixth year following burning can be obtained from the season of bum and the number of year-old suckers that occur the second year following burning. These two variables accounted for 96 percent of the variation in sixth-year sucker numbers in the general model based on all four burned areas (table 3, model 2). On models developed for the individual areas, however, predictability ranged from a low of 20 percent for Breakneck Ridge, which was influenced by intense ungulate browsing, to a high 9f97 percent for UbI Draw (table 4).
Caution should be exercised when applying these models to determine initial response of particular sites to burning. Less than half of the variation in second-year sucker numbers was attributable to the variables measured; therefore, other factors not addressed by this study are probably involved. The most useful of the models is the one that predicts sucker numbers 6 years after burning. This strong relationship should be beneficial for evaluating the number of suckers that can be expected over the long term.
REFERENCES Bartos, D. L. 1979. Effects of burning on the aspen
ecosystem. In: Proceedings of the eighth Wyoming shrub ecology workshop; 1979 May 30-31; Jackson, WY. Laramie, WY: University of Wyoming: 47-58.
Bartos, D. L.; Ward, F. R.; Innis, G. S. 1983. Aspen succession in the Intermountain West: a deterministic model. Gen. Tech. Rep. INT -153. Ogden, UT: U.S. Department of Agriculture, Forest Service, Intermountain Forest and Range . Experiment Station. 60 p.
Brown, J. K.; DeByle, N. V. 1989. Effects of prescribed fire on biomass and plant succession in
9
Hili Hili Draw
4,097 2,n9 -5,364
0.43 0.76 0.76
0.63** 0.89** 0.97**
western aspen. Res. Pap. INT-412. Ogden, UT: U.S. Department of Agriculture, Forest Service, Intermountain Research Station. 16 p.
Crouch, G. L. 1981. Regeneration of aspen clearcuts in northwestern Colorado. Res. Note RM-407. Fort Collins, CO: U.S. Department of ~mculture, Forest Service, Rocky Mountain Forest and Range Experiment Station. 5 p.
Crouch, G. L. 1983. Aspen regeneration after commercial clearcutting in southwestern Colorado. Journal of Forestry. 83(5): 316-319.
Edminster, C. B.; Mowrer, H. T.; Shepperd, W. D. 1985. Site index curves for aspen in the central Rocky Mountains. Res. Note RM-453. Fort Collins, CO: U.S. Department of Agriculture, Forest Service, Rocky Mountain Forest and Range Experiment Station. 4 p.
Frank, E. C.; Lee, R. 1966. Potential solar beam irradiation on slopes: tables for 300 to 500 latitude. Res. Pap. RM-18. Fort Collins, CO: U.S. Department of Agriculture, Forest Service, Rocky Mountain Forest and Range Experiment Station. 116 p.
Green, A W.; Van Hooser, D. D. 1983. Forest resource of the Rocky Mountain States. Resour. Bull. INT-33. Ogden, UT: U.S. Department of Agriculture, Forest Service, Intermountain Forest and Range Experiment Station. 127 p.
Gruell, G. E.; Loope, L. 1974. Relationships among aspen, fire; and ungulate browsing in Jackson Hole, Wyoming. Ogden, UT: U.S. Department of Agriculture, Forest Service, Intermountain Region. 33 p.
Hinds, T. E.; Wengert, E. M. 1977. Growth and decay losses in Colorado aspen. Res. Pap. RM-193. Fort Collins, CO: U.S. Department of Agriculture, Forest Service, Rocky Mountain Forest and Range Experiment Station. 10 p.
Jones, J. R. 1975. Regeneration on an aspen clearcut in Arizona. Res. Note RM-285. Fort Collins, CO: U.S. Department of Agriculture, Forest Service, Rocky Mountain Forest and Range Experiment Station. 8 p.
Kay, C. E. 1990. Yellowstone's northern elk herd: a critical evaluation of the "natural regulation" paradigm. Logan, UT: Utah State University. 490 p. Dissertation.
Krebill, R. G. 1972. Mortality of aspen on the Gros Ventre elk winter range. Res. Pap. INT-129. Ogden, UT: U.S. Department of Agriculture, Forest Service, Intermountain Forest and Range Experiment Station. 16 p.
Mueggler, W. F. 1989. Age distribution and reproduction of Intermountain aspen stands. Western Journal of Applied Forestry. 4(2): 41-45.
Schier, G. A 1975. Deterioration of aspen clones in the middle Rocky Mountains. Res. Pap. INT-170.
Ogden, UT: U.S. Department of Agriculture, Forest Service, Intermountain Forest and Range Experiment Station. 14 p.
Schier, G. A; Campbell, R. B. 1978. Aspen sucker regeneration following burning and clearcutting on two sites in the Rocky Mountains. Forest Science. 24(2): 303-308.
Schier, G. A; Jones, J. R.; Winokur, R. P. 1985. Vegetative regeneration. In: DeByle, N. V.; Winokur, R. P., eds. Aspen: ecology and management in the Western United States. Gen. Tech. Rep. RM-119. Foit Collins, CO: U.S. Department of Agriculture,. Forest Service, Rocky Mountain Forest and Range Experiment Station: 29-33.
Smith, A D.; Lucas, P. A; Baker, C. 0.; Scotter, G. W. 1972. The effects of deer and domestic livestock on aspen regeneration in Utah. Publ. 72-1. Logan, UT: Utah Division of Wildlife Resources. 32 p.
~u.s. GOVERNMENT PRINT1NG omCE: 1991 .573 .0 It 1/+ 1 0 0 7
10
Bartos, Dale L.; Mueggler, Walter F.; Campbell, Robert B., Jr. 1991. Regeneration of aspen by suckering on burned sites in western Wyoming. Res. Pap. INT -448. Ogden, UT: U.S. Department of Agriculture, Forest Service, Intermountain Research Station. 10 p.
Numbers of suckers produced following burning of aspen stands varied greatly between areas but followed similar trends over a 6-year period: a relative abundance the first year, followed by an abrupt decline by the third year and a gradual decline thereafter. First-year sucker numbers that ranged from 34,000 to 147,OOO/ha suffered mortality between 54 and 93 percent by the sixth year. Only 40 percent of the variability between sites in number of suckers the second postburn year, and only 44 percent of the variability the sixth year, could be accounted for by season of burn and preburn site and stand charaderistics. Of the variability between sites in the sixth-year sucker numbers, 96 percent is accounted for by season of burn and number of year-old suckers present the second year following burning.
KEYWORDS: Populus tremuloides, spring burn, fall burn, suckers, reproduction, clearcutting
Printed on recycled paper

J
i -:
INTERMOUNTAIN RESEARCH STATION
The Intermountain Research Station provides scientific knowledge and technology to improve management, protection, and use of the forests and rangelands of the Intermountain West. Research is designed to meet the needs of National Forest managers, Federal and State agencies, industry, academic institutions, public and private organizations, and individuals. Results of research are made available through publications, symposia, workshops, training sessions, and personal contacts:
The Intermountain Research Station territory includes Montana, Idaho, Utah, Nevada, and western Wyoming. Eighty-five percent of the lands in the Station area, about 231 million acres, are classified as forest or rangeland. They include grasslands, deserts, shrublands, alpine areas, and forests. They provide fiber for forest industries, minerals and fossil fuels for energy and industrial development, water for domestic and industrial consumption, forage for livestock and wildlife, and recreation opportunities for millions of visitors.
Several Station units conduct research in additional western States, or have missions that are national or international in scope.
Station laboratories are located in:
Boise, Idaho
Bozeman, Montana (in cooperation with Montana State University)
Logan, Utah (in cooperation with Utah State University)
Missoula, Montana (in cooperation with the University of Montana)
Moscow, Idaho (in cooperation with the University of Idaho)
Ogden, Utah
Provo, Utah (in cooperation with Brigham Young University)
Reno, Nevada (in cooperation with the University of Nevada)
USDA policy prohibits diSCrimination because of race, color, national origin, sex, age, religion, or handicapping condition. Any person who believes he or she has been discriminated against in any USDA-related activity should immediately contact the Secretary of Agriculture, Washington, DC 20250.


![Welcome! [intermountainphysician.org]€¦ · Ritesh Dhar, MD, MS Intermountain Heart Institute . Intermountain Medical Center, Murray, UT . Question • 72 yo woman with palpitations](https://img.pdfslide.net/doc/110x75/5fd4bd086f25ad181b7921d8/welcome-in-ritesh-dhar-md-ms-intermountain-heart-institute-intermountain.jpg)